Article

Numerical Simulation of Temperature and Pressure Changes due to Partial Discharges in Spherical Cavities Within Solid Dielectrics at Different Ageing Conditions

by
Johnatan M. Rodríguez-Serna
* and
Ricardo Albarracín-Sánchez
*
Department of Electrical and Electronic Engineering, Automatic Control, and Applied Physics, School of Industrial Design and Engineering (ETSIDI), Universidad Politécnica de Madrid (UPM), Ronda de Valencia 3, 28012 Madrid, Spain
*
Authors to whom correspondence should be addressed.
Energies 2019, 12(24), 4771; https://doi.org/10.3390/en12244771
Submission received: 19 November 2019 / Revised: 11 December 2019 / Accepted: 12 December 2019 / Published: 13 December 2019

Abstract

:
Partial Discharges (PD) behavior during ageing of the insulation systems exhibits variations that depend on changes in gas filling characteristics and surface condition. In this article, numerical simulations of temperature and pressure behavior in an air-filled spherical cavity within a homogenous solid dielectric material due to PD activity are presented. An Analytical-Finite Element Analysis simulation approach was implemented in MATLAB and results exhibit reasonable agreement with experimental measurements reported by other authors. Simulation results allow concluding that pressure changes are directly related to variations in the PD behavior. In addition, affectations to cavity surface due to temperature increments can be discarded.

Graphical Abstract

1. Introduction

Partial Discharges (PD) are one of the main causes of dielectric breakdown in solid insulators and are also a symptom of ageing in high-voltage (HV) equipment [1,2]. Its simulation allows analyzing different conditions such as, waveform, ambient temperature and initial pressure, and geometrical configuration, among others. In addition, it allows to characterize the PD phenomena and determine the main parameters that affect the PD behavior under some specific conditions [3,4].
PD in cavities within solid dielectrics are modelled as streamers because they are self-sustained discharges and have greater magnitudes than other kinds of internal discharges [5]. There are different models for simulating the PD activity inside cavities within solid dielectrics and they differentiate in the way the electric field produced by the electric charge on the void surface, left by previous PD, is calculated [6]. PD models can be classified into [7]: analytical [8,9,10], three-capacitance [11] and finite-element analysis (FEA) [12,13] models.
In the three-capacitance models, the cavity is represented by an equivalent capacitance and PD are simulated reducing the magnitude of a resistance in parallel with that [14]. Analytical models use analytical expressions, that were theoretically determined using an electrostatic field approach [8], for calculating the electric field strength and the real and induced PD charge magnitude. On the other hand, FEA models use numerical methods for solving the partial differential equations (PDE) that describe the PD phenomena, and the real and induced charges are dynamically calculated integrating field expressions on HV electrodes boundaries [6].
Analytical models, in spite of their simplicity, are electrostatic field-based approaches and when homogeneous and symmetrical conditions are considered, such as cylinders or spheroids, the solutions obtained through analytical and FEA models are similar [15], and have the advantage that less computational time is required when simulations for a great number of periods of the AC-voltage signal are required such as in ageing analysis.
PD are inherently multi-physical phenomena where electrical, thermal and mechanical physics are involved in each PD event [16]. Processes such as electron generation rate and surface charge decay through surface conduction are temperature and pressure dependent [17,18,19]. On the other hand, temperature affects the ageing process in solid dielectrics mainly due to the acceleration of chemical ageing dynamics [1].
In this paper, the analytical and thermal models are presented in Section 2. In Section 3, PD in a spherical cavity are simulated using the analytical model at different ageing phases and results are compared with measured values reported by other authors. In addition, temperature and pressure variations due to PD events are calculated using a heat transfer FEA model, and the effect of temperature and pressure along ageing on the electron generation rate and in inception and extinction field magnitudes is analyzed and correlated with measured variables. A discussion on the simulation results is presented in Section 4. Finally, a conclusion is presented in Section 5.

2. PD Analytical and Temperature Models

In this study, an analytical-FEA approach is used for implementing simulations. With the analytical model, the electric phenomena related to PD events are simulated, and variables such as real and induced charge magnitudes are calculated [8]. On the other hand, temperature and pressure in gas and solid dielectrics due to PD activity are determined solving the heat transfer equation using a FEA model [20].

2.1. PD Stochastic Model

Through experimentation and analytical studies, it has been found that PD phenomena are stochastic processes where their properties are describable by time-dependent random variables [21]. The streamer development process depends on the achievement of the two following necessary conditions:
  • The electric field strength magnitude inside the cavity is greater than the inception value;
  • There is at least an electron for starting the avalanche.
The achievement of necessary conditions for PD occurrence outcome into the stochastic behavior of PD phenomena, determining characteristics such as inception delay, phase occurrence and the number of PD per cycle. The electric field strength inception magnitude is calculated using Equation (1) [9]:
E i n c = ( E / p ) c r p [ 1 + B ( 2 p a ) n ] ,
where p is the pressure of gas within the cavity in Pa, a is the cavity radius in m, ( E / p ) c r = 24.2   V·Pa−1·m−1, B = 8.6 Pa1/2·m1/2 and n = 0.5 . The magnitude calculated using Equation (1) is the critical electric field strength magnitude for starting an avalanche.
Volume and surface emissions are the main mechanisms for the first electron generation rate [22]. Volume generation is related to radiative gas ionization and field detachment of electrons from negative ions and can be calculated as [23]:
N e t ( t ) = C r a d Φ r a d ( ρ m / p ) 0 p ( 4 3 π a 3 ) ( 1 ν 1 / n ) ,
where C r a d Φ r a d = 2 × 10 6 kg−1·s−1, is the reduced radiative cosmic and radioactive quantum flux density and ( ρ m / p ) 0 = 1 × 10 5 kg·m−3·Pa−1, is the pressure reduced gas density. ν = U c a v ( t ) / U i n c , U c a v ( t ) is the voltage across the cavity center at instant t and U i n c is the inception voltage calculated with Equation (1).
The electron generation rate due to surface detrapping obeys the Richardson–Schottky [6] law and can be calculated using the following expression:
N d t ( t ) = N d t 0 exp ( t t P D τ ) ν 0 exp ( Φ d t e E c a v ( t ) / ( 4 π ε 0 ) k b T ) ,
where e is the elementary charge, Φ d t is the effective detrapping work function, k b is the Boltzmann constant, t t P D is the time elapsed since the latest PD, ν 0 = 1 × 10 14 Hz is the fundamental frequency of phonon, ε 0 is the permittivity of vacuum and T the temperature in K. N d t 0 = ξ ( q / e ) and ξ is a proportional factor, which describes the fraction of charge carriers that result in the creation of detrappable electrons. It depends on the relative polarity of electric field strength produced by charges on the surface related with the polarity of resultant electric field strength.
An electron is generated at the time interval [ t , t + Δ t ] with the probability ( N e t ( t ) + N d t ( t ) ) Δ t .

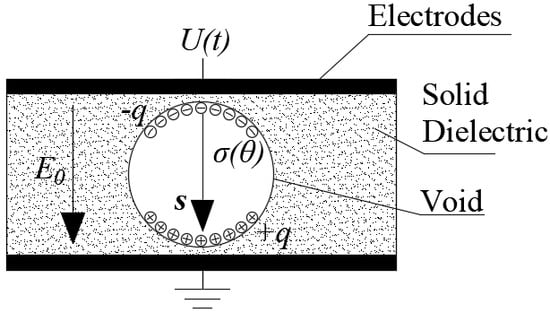
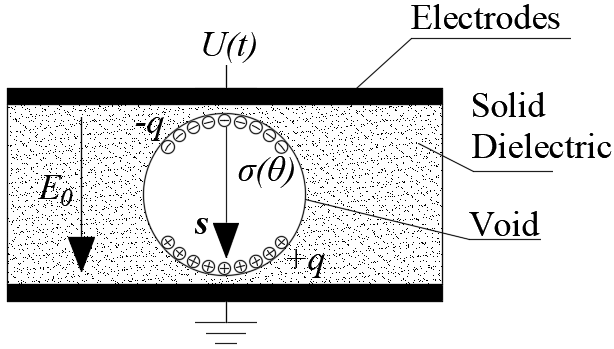
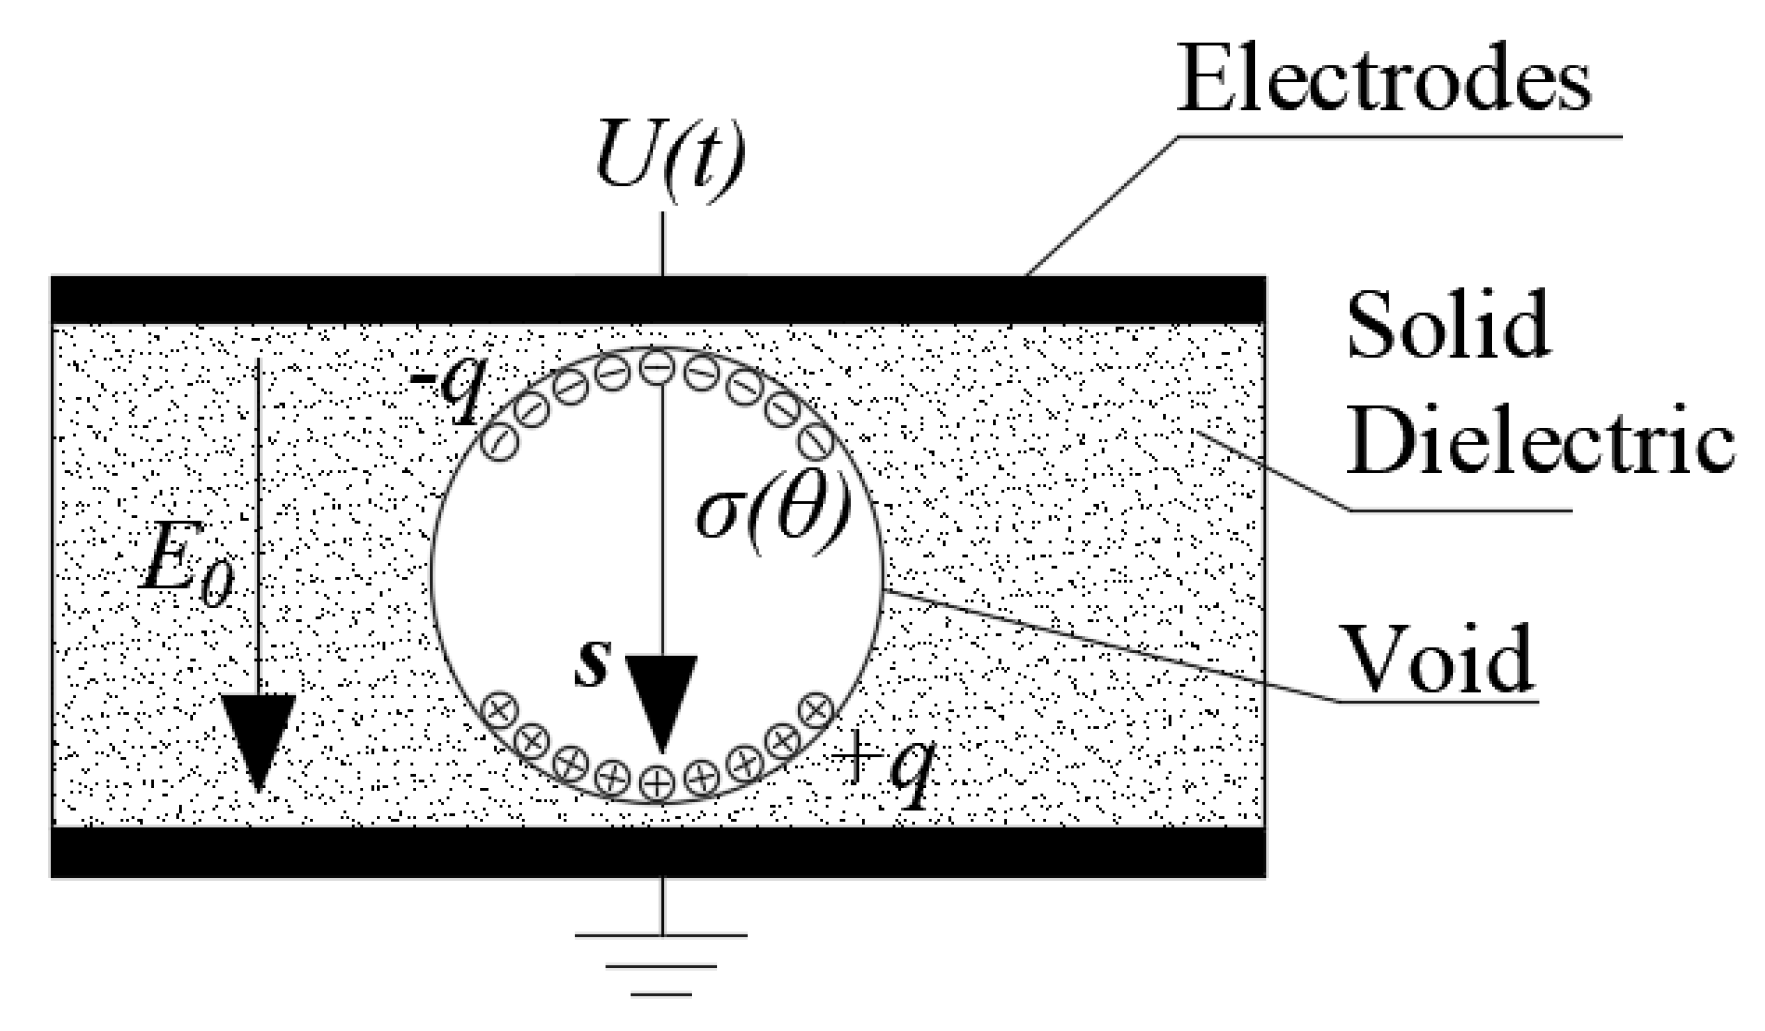
2.2. PD Analytical Model

In this model, it is considered that all the cavity volume is affected by a PD event and the electric field strength inside the cavity is uniform; for that reason, all calculations are referred to the cavity center. During a PD event, charges of different polarity are deployed on the void surface, which produces a dipole moment as shown in Figure 1.
In Figure 1, s is the direction vector of dipole, pointing from negative to positive charges, σ ( θ ) is the surface charge density and E 0 is the electric field strength established by the HV electrodes inside the homogeneous dielectric material.
For ellipsoidal voids, the induced charge on the HV electrodes by the dipole in the cavity can be calculated as Equation (4) [9]:
q = K Ω ε ( E c a v P D E e x t ) λ 0 ,
where K is a dimensionless factor dependent on the geometry of the cavity and for spherical cavities is K = 3 [24], Ω is the cavity volume, ε is the permittivity of media, λ 0 is the electric field strength by unit of applied voltage in the homogeneous material without cavity and charges, and at the cavity center location. E c a v P D is the electric field strength at the cavity center just before a PD event occurs. E e x t is the electric field strength below there is no ionization and the streamer extinguishes, this can be calculated using Equation (5).
E e x t = γ ( E / p ) c r p ,
where γ is a dimensionless factor depending on the polarity of the streamer. As average for positive and negative streamers, it is assumed as γ = 0.35 [22].
The real charge on the void surface is proportional to the electric field change due to a PD event and can be calculated as Equation (6) [9,22]:
q = ε 0 π a 2 [ 1 + ε r ( K 1 ) ) ] ( E c a v P D E e x t ) ,
where ε r is the relative permittivity of the solid dielectric.
The charge magnitude on the cavity surface left by previous PD decay due to recombination, conduction and diffusion phenomena [25]. However, recombination due to surface currents is the dominant process [26]. The decay of charge as a function of time can be approximately described by the Ohm’s Law as in Equation (7) [23]:
d q d t = ( π 2 ) k s E c a v 2 a ,
where k s is the cavity surface conductivity.

2.3. Temperature and Pressure Model for PD

During a PD event, the energy stored in the electric field changes abruptly, and using the Poynting’s theorem [27], it is concluded that the change in the accumulated energy is due to an energy conversion into heat which is transferred to cavity and solid material through heat conduction. The heat transfer can be simulated solving the following PDE in Equation (8) [20]:
ρ m C p ( T t ) ( k T T ) = Q ,
where ρ m is the density of media, C p is the heat capacity of media and k T is the thermal conductivity of media. Q is the heat source density and can be calculated as Equation (9):
Q = 1 2 ε ( | E c a v P D | 2 | E e x t | 2 Δ t P D ) ,
where Δ t P D is the time elapsed during the PD event. In this study, the PDE toolbox of MATLAB [28] is used for solving Equation (8), considering there is not a heat source density within the homogenous material and exterior boundaries as thermally insulated.
The pressure in the cavity after a PD event can be calculated using the ideal gas law:
p t P D + Δ t P D = ( T t P D + Δ t P D T t P D ) p t P D ,
where p t P D and p t P D + Δ t P D are, respectively, the pressure in the cavity before and after the PD event. Similarly, T t P D and T t P D + Δ t P D are, respectively, the temperature in the cavity before and after the PD event.

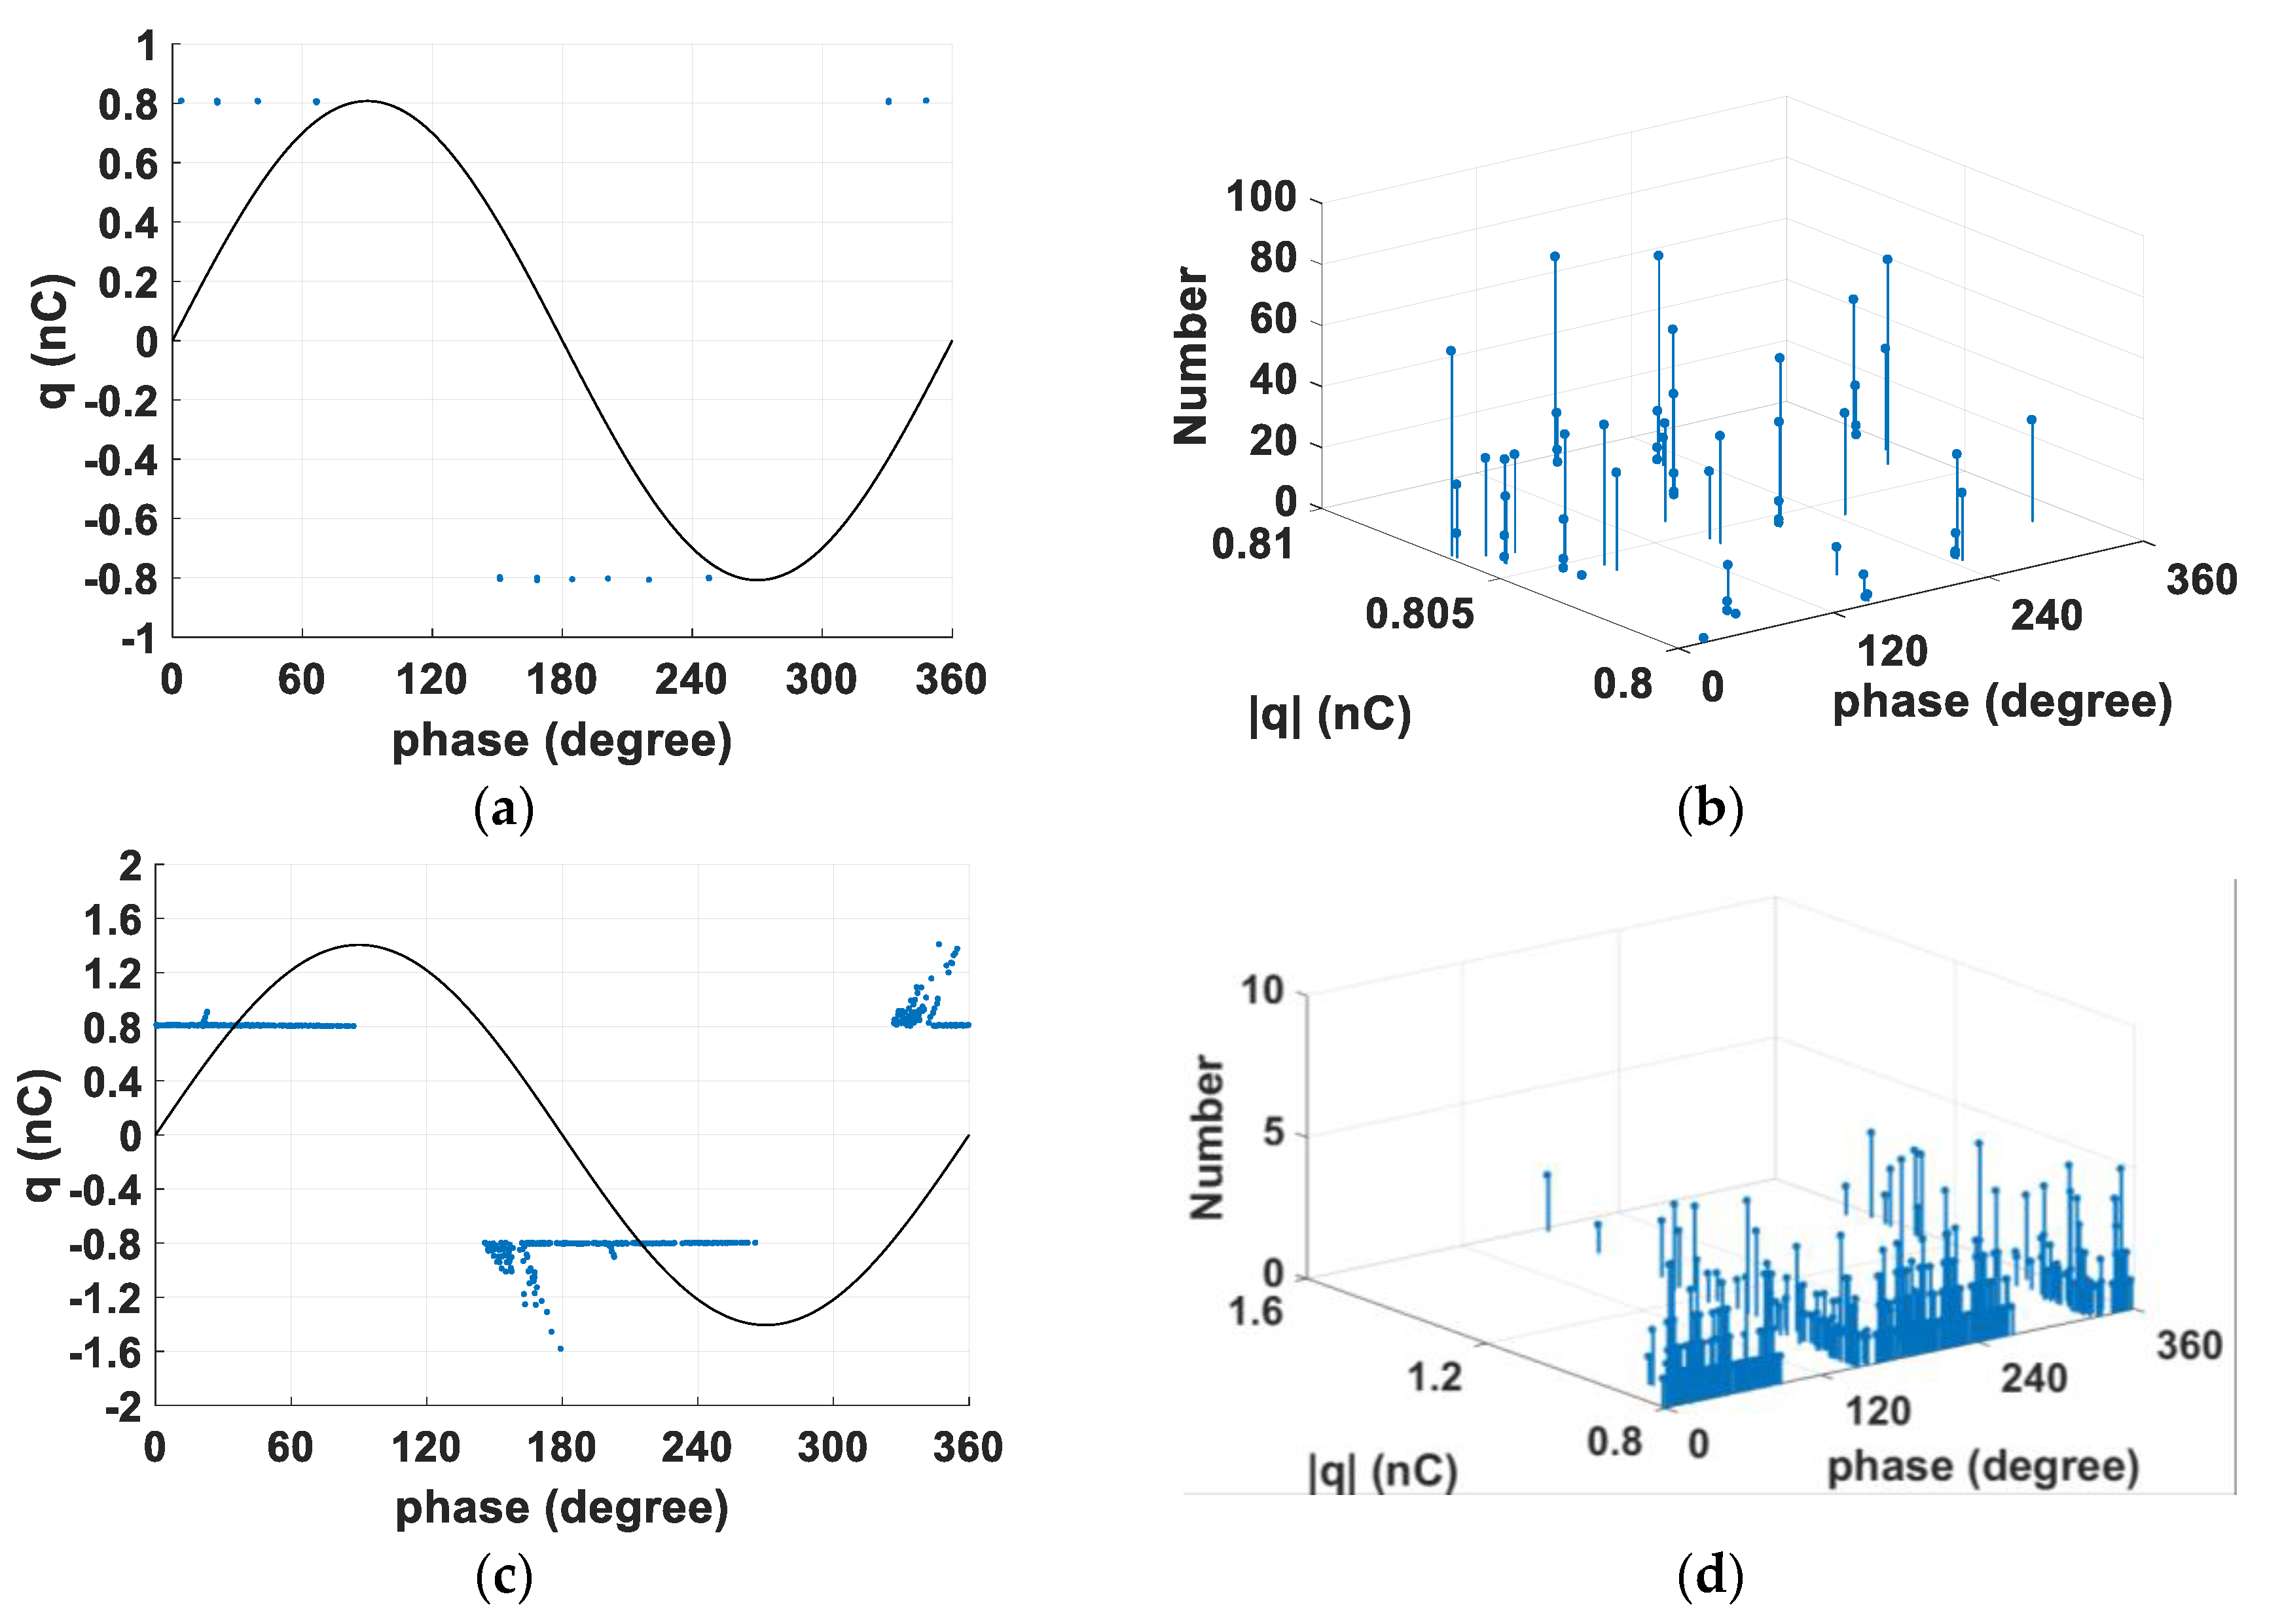
3. Case of Study and Simulation Results

The simulation model was implemented as follows: the analytical model, Expressions (1)–(7) were implemented using a code in MATLAB. On the other hand, the temperature model in Equation (8), was solved using the PDE toolbox of MATLAB which implements a finite element analysis method and uses, in turn, an internal solver based on the variable order method [28]. The absolute and relative tolerances of the solver are, respectively, 1 × 10 6 and 1 × 10 3 . Finally, the pressure was calculated for each time step using Equation (10).
Simulations were implemented for a considerable number of cycles (100 at phases A through C, 200 at phase E and 300 at phase C) in order to consider the stochastic variations in the model. A time step of 1 × 10 5 s was used for executing simulations when there are not PD acting (inception and electron generation rate criteria are not satisfied) and 1 × 10 9 s during PD events.
The same case used in [23] is considered in this study. However, in order to analyze the temperature and pressure behavior after PD activity and its effects on PD behavior, Equations (1)–(3) and (5), are dynamically calculated along the simulation time. The geometry consists of a linear, homogenous and isotropic dielectric bulk of epoxy resin of 3.5 mm thickness between two parallel plates, and a spherical void, filled with air, of 2.5 mm diameter is included in the middle of the dielectric bulk. A 19.25 kV, 50 Hz sinusoidal voltage source is applied to the upper electrode while the lower is grounded. Table 1 summarizes the parameters of media related to the case of study.
In order to make comparisons with measurements presented in [23], it is considered that cavity surface conductivity is 0 S·m−1.
Five different consecutive ageing phases were considered, namely: phase A, with a duration up to 10 min; phase B, lasts about 20 to 50 h; phase C, lasts about 100 to 200 h; phase D, lasts about 1200 h and phase E, lasts 50 h. Measurements and simulations using the analytical model were reported in [23] for each of the above ageing phases. Figure 2 shows the phase-resolved partial discharge (PRPD) pattern and q-φ-n diagrams obtained for the case of study at the five considered ageing phases.
Table 2 exhibits the parameters of the stochastic model and initial conditions used for simulating each ageing phase, as well as a summary of the main results for the PD electric charge magnitude.
In Table 2, E i n c m and E e x t m , respectively, are the average inception and extinction-field strength magnitudes along the simulation time, NHW is the number of PD per half cycle, and p 0 and T 0 are, respectively, the initial pressure and temperature of gas inside the cavity.
Simulation results show reasonable agreement with measured values reported in [23]. When compared with measured values, the simulated number of PD per cycle (NHW) present a maximal difference of 26.667% at phase E (NHW measured ~3 and simulated 2.2). However, at this phase it must be considered that the pressure behavior with time has a complex dependence on temperature and applied voltage that the ideal gas law cannot represent completely [29].
Figure 3 shows the temperature and pressure simulation results for the case of study during the first five periods of the AC-applied voltage at ageing phases A, B and E.
In Figure 3, Tmcav is the average temperature in the cavity volume and Tscav is the average temperature at the void surface. Taking into account that maximal changes in pressure and temperature at phases C and D are below 1 K and 0.01 kPa, they were not plotted. Table 3 shows the summary of simulation results for the five ageing phases considered and simulation periods in Table 2.

4. Discussion

At phase A, the PRPD pattern exhibits a “bar-like” structure in which the PD charge magnitude is almost constant with an average magnitude very close to the minimum value. The measured minimum magnitude and number of PD per half cycle were, respectively, 0.9 nC and about 5 to 7 [23]. Simulated values in the second column of Table 2 are in good agreement with measured values. On the other hand, in Figure 3a, it can be seen that after each PD event, the temperature in both the gas in cavity and the void surface, increases. However, the average increase in temperature along the simulated periods is just 1.0 K. A similar behavior is found for pressure, shown in Figure 3b, where the increase in average pressure is 0.2 kPa.
At phase B, Figure 2c, the PRPD pattern exhibits a “bar-like” plus a “rabbit ear-like” structure. The “bar-like” structure is close to around the minimum PD charge magnitude, while the tip of the “rabbit ear-like” structure tends to increase. For the number of simulated cycles, the maximum PD charge magnitude calculated was 1.6 nC. In order to reproduce the experimental measurements at this phase, the detrapping work function is increased to 1.1 eV. This produces an increase in the time lag, and this in turn, a reduction in the number of PD per half cycle and an increase in the PD charge magnitude. The increased time lag also means that more energy stored is converted into heat at each PD event, which can be seen at Table 3. However, the average temperature in cavity gas and cavity surface is reduced in comparison to phase A, because the time for cooling after a PD event is increased if the number of PD per half cycle is reduced. A similar behavior is found in pressure; the increment of maximum pressure magnitude is negligible.
In order to reproduce experimental measurements at ageing phases C to E, the initial pressure has to be decreased for considering the changes in the gas consumption and gaseous by-products generation rates [30]. After about 30 min, in ageing phase B, the pressure in the cavity starts to decrease continuously [18] with a decreasing rate that is voltage and temperature dependent [29].
At phase C, Figure 2e, the PRPD pattern exhibits a “bar-like” structure similar to phase A. However, the magnitude of the PD charge decreases in comparison to phase A by 20.2%, and the number of PD per half cycle increases up to 550.4% compared with phase A. On the other hand, the q-φ-n diagram exhibits an almost continuous distribution, which means an almost constant PD condition in the cavity. The latter can be seen also in Figure 3e,f where the average temperature is continuously changing. The initial cavity gas pressure is reduced to 6 kPa, which involves a decreasing in the inception and extinction field magnitudes; this produces a decrement in the time lag and a reduction in the PD charge magnitude. In spite of almost continuous PD activity inside the cavity, the temperature and pressure in the cavity remains almost constant, and the average increment in temperature and pressure is just 0.1% when it is compared with room and initial conditions.
At phase D, Figure 2g, the PRPD pattern exhibits an irregular behavior with marked intermittency in the PD time lag. The PD charge magnitude exhibits a great increase with regard to phase A of 581.7% while the number of PD per half cycle is just 0.03. The measured number of PD per cycle is in the range 0.02 to 0.06, which means that simulation results are in reasonable agreement with values measured in [23]. In order to reproduce experimental measurements, the detrapping work function and the effective detrapping time constant are increased while the initial pressure is set to 2 kPa. With these changes, the time lag is hardly increased. Despite the reduction of inception magnitude, the reduction of the electron generation rate dominates the stochastic PD behavior. The average temperature and pressure exhibit a light increase of 0.03%. Despite the increase of energy transformed into heat, the maximum temperature increases in 47.4 K compared with room temperature, and the larger time between consecutive PD eases a rapid cooling.
At phase E, Figure 2i, the PD behavior is continuous and the PD charge magnitude seems to be uniformly distributed between two sinusoidal envelopes in the PRPD pattern. The magnitude of the PD charge is reduced in comparison to phase D by 32%. However, the number of PD per half cycle is increased up to 2.2, which is in reasonable agreement with the experimental value of about 3 [23]. Pressure and temperature exhibit similar behavior and magnitudes as for phase D, Figure 3i,j, with slight differences in average temperature and pressure, as shown in Table 3.
Despite the agreement with experimental measurements, the PD behavior at advanced ageing conditions, such as phase E, cannot be explained only considering the changes of the gas filling the cavity. The physical and chemical interactions at the solid—gas interface must be considered.
In this study, the effect of cavity conductivity on PD behavior and its variation along the ageing process is neglected in order to analyze the effects of temperature and pressure variation on the stochastic behavior; however, cavity conductivity plays a fundamental role at PD activity and is related to surface conditions, and for that reason, in future works it will be considered.
Simulations were carried out using a MATLAB application implemented by authors named PDSym1S developed for these purposes.

5. Conclusions

Temperature and pressure changes inside an air-filled cavity within a homogeneous dielectric material after PD events were calculated using an analytical-FEA model. Simulation results exhibit reasonable agreement with experimental measurements. Pressure in the gas filling the cavity is one of the main parameters affecting the PD behavior at ageing phases. Taking into account that the highest temperature increase along the simulated phases was only about 15%, temperature effect on surface degradation can be neglected in comparison to chemical reactions and particle impact, which is in line with other experimental studies. Future work will include the consideration of different electrodes geometries and unevenness of electrodes surfaces.

Author Contributions

The authors have contributed in different parts of the paper preparation, as follows, Conceptualization, methodology and analysis, J.M.R.-S. and R.A.-S; software and simulations, J.M.R.-S.; writing—original draft preparation, J.M.R.-S.; writing—review and editing, R.A.-S.

Funding

This research received no external funding.

Acknowledgments

The authors gratefully acknowledge Fundación Carolina, Universidad de Antioquia-Departamento de Ingeniería Eléctrica, Universidad Politécnica de Madrid and Fondo Sapiencia-Alcaldía de Medellín. The authors thankfully acknowledge the computer resources, technical expertise and assistance provided by the Supercomputing and Visualization Center of Madrid (CeSViMa).

Conflicts of Interest

The authors declare no conflicts of interest.

References

  1. Morshuis, P.H.F. Degradation of solid dielectrics due to internal partial discharge: some thoughts on progress made and where to go now. IEEE Trans. Dielectr. Electr. Insul. 2005, 12, 905–913. [Google Scholar] [CrossRef]
  2. Stone, G.C. Partial discharge diagnostics and electrical equipment insulation condition assessment. IEEE Trans. Dielectr. Electr. Insul. 2005, 12, 891–904. [Google Scholar] [CrossRef]
  3. Okamoto, T.; Kato, T.; Yokomizu, Y.; Suzuoki, Y.; Tanaka, T. PD characteristics as a stochastic process and its integral equation under sinusoidal voltage. IEEE Trans. Dielectr. Electr. Insul. 2001, 8, 82–90. [Google Scholar] [CrossRef]
  4. Candela, R.; Scimemi, G.F.; Romano, P.; Sanseverino, E.R. Analysis of partial discharge activity at different temperatures through an heuristic algorithm. In Proceedings of the 1999 Annual Report Conference on Electrical Insulation and Dielectric Phenomena (Cat. No.99CH36319), Austin, TX, USA, 17–20 October 1999; Volume 1, pp. 202–205. [Google Scholar]
  5. Bartnikas, R. Partial discharges. Their mechanism, detection and measurement. IEEE Trans. Dielectr. Electr. Insul. 2002, 9, 763–808. [Google Scholar] [CrossRef]
  6. Forssen, C.; Edin, H. Partial discharges in a cavity at variable applied frequency part 2: measurements and modeling. IEEE Trans. Dielectr. Electr. Insul. 2008, 15, 1610–1616. [Google Scholar] [CrossRef]
  7. Pan, C.; Chen, G.; Tang, J.; Wu, K. Numerical modeling of partial discharges in a solid dielectric-bounded cavity: A review. IEEE Trans. Dielectr. Electr. Insul. 2019, 26, 981–1000. [Google Scholar] [CrossRef] [Green Version]
  8. Pedersen, A. Partial discharges in voids in solid dielectrics. An alternative approach. In Proceedings of the Conference on Electrical Insulation Dielectric Phenomena—Annual Report 1987, Gaithersburg, MD, USA, 18–22 October 1987; pp. 58–64. [Google Scholar]
  9. Crichton, G.C.; Karlsson, P.W.; Pedersen, A. Partial discharges in ellipsoidal and spheroidal voids. IEEE Trans. Electr. Insul. 1989, 24, 335–342. [Google Scholar] [CrossRef] [Green Version]
  10. Hauschild, W.; Lemke, E. High-Voltage Test and Measuring Techniques; Springer: Berlin/Heidelberg, Germany, 2014; ISBN 978-3-662-52015-4. [Google Scholar]
  11. Achillides, Z.; Georghiou, G.E.; Kyriakides, E. Partial discharges and associated transients: the induced charge concept versus capacitive modeling. IEEE Trans. Dielectr. Electr. Insul. 2008, 15, 1507–1516. [Google Scholar] [CrossRef]
  12. Forssén, C. Modelling of Cavity Partial Discharges at Variable Applied Frequency; Electromagnetic Engineering, Elektroteknisk teori & konstruktion: Stockholm, Sweden, 2008. [Google Scholar]
  13. Illias, H.A.; Chen, G.; Lewin, P.L. Partial discharge within a spherical cavity in a dielectric material as a function of cavity size and material temperature. IET Sci. Meas. Technol. 2012, 6, 52–62. [Google Scholar] [CrossRef]
  14. Imburgia, A.; Romano, P.; Viola, F.; Hozumi, N.; Morita, S. Partial discharges behavior under different rectified waveforms. In Proceedings of the 2017 International Symposium on Electrical Insulating Materials (ISEIM), Toyohashi, Japan, 11–15 September 2017; Volume 1, pp. 114–117. [Google Scholar]
  15. Illias, H.A.; Chen, G.; Lewin, P.L. Comparison between three-capacitance, analytical-based and finite element analysis partial discharge models in condition monitoring. IEEE Trans. Dielectr. Electr. Insul. 2017, 24, 99–109. [Google Scholar] [CrossRef]
  16. Schifani, R.; Candela, R.; Romano, P. On PD mechanisms at high temperature in voids included in an epoxy resin. IEEE Trans. Dielectr. Electr. Insul. 2001, 8, 589–597. [Google Scholar] [CrossRef]
  17. Kim, C.-S.; Kondo, T.; Mizutani, T. Change in PD pattern with aging. IEEE Trans. Dielectr. Electr. Insul. 2004, 11, 13–18. [Google Scholar]
  18. Wang, L.; Cavallini, A.; Montanari, G.C.; Testa, L. Evolution of pd patterns in polyethylene insulation cavities under AC voltage. IEEE Trans. Dielectr. Electr. Insul. 2012, 19, 533–542. [Google Scholar] [CrossRef]
  19. Boggs, S.; Damon, D.H.; Hjerrild, J.; Holboll, J.T.; Henriksen, M. Effect of insulation properties on the field grading of solid dielectric DC cable. IEEE Trans. Power Deliv. 2001, 16, 456–461. [Google Scholar] [CrossRef]
  20. Illias, H.A.; Chen, G.; Lewin, P.L. Measurement and modelling of partial discharge behaviour in a spherical cavity within a solid dielectric material as a function of cavity diameter. In Proceedings of the 2010 10th IEEE International Conference on Solid Dielectrics, Potsdam, Germany, 4–9 July 2010; pp. 1–4. [Google Scholar]
  21. Van Brunt, R.J. Stochastic properties of partial-discharge phenomena. IEEE Trans. Electr. Insul. 1991, 26, 902–948. [Google Scholar] [CrossRef]
  22. Niemeyer, L. A generalized approach to partial discharge modeling. IEEE Trans. Dielectr. Electr. Insul. 1995, 2, 510–528. [Google Scholar] [CrossRef] [Green Version]
  23. Gutfleisch, F.; Niemeyer, L. Measurement and simulation of PD in epoxy voids. IEEE Trans. Dielectr. Electr. Insul. 1995, 2, 729–743. [Google Scholar] [CrossRef]
  24. Takuma, T.; Techaumnat, B. Electric Fields in Composite Dielectrics and Their Applications; Power Systems; Springer: Dordrecht, The Netherland, 2010; ISBN 978-90-481-9391-2. [Google Scholar]
  25. Illias, H.; Chen, G.; Lewin, P.L. Partial discharge behavior within a spherical cavity in a solid dielectric material as a function of frequency and amplitude of the applied voltage. IEEE Trans. Dielectr. Electr. Insul. 2011, 18, 432–443. [Google Scholar] [CrossRef]
  26. He, M.; Hao, M.; Chen, G.; Chen, X.; Li, W.; Zhang, C.; Wang, H.; Zhou, M.; Lei, X. Numerical modelling on partial discharge in HVDC XLPE cable. COMPEL—Int. J. Comput. Math. Electr. Electron. Eng. 2018, 37, 986–999. [Google Scholar] [CrossRef]
  27. Magid, L.M. Electromagnetic Fields, Energy, and Waves; Wiley: New York, NY, USA, 1972; ISBN 978-0-471-56334-1. [Google Scholar]
  28. Partial Differential Equation Toolbox—MATLAB. Available online: https://la.mathworks.com/products/pde.html (accessed on 7 September 2019).
  29. Gjaerde, A.C. Measurements of void gas pressure during combined thermal and partial discharge ageing of epoxy. IEE Proc.-Sci. Meas. Technol. 1995, 142, 17–21. [Google Scholar] [CrossRef]
  30. Shahsavarian, T.; Shahrtash, S.M. Modelling of aged cavities for partial discharge in power cable insulation. IET Sci. Meas. Technol. 2015, 9, 661–670. [Google Scholar] [CrossRef]
Figure 1. Dipole moment, s , within the cavity due to surface charge distribution, σ ( θ ) , after a Partial Discharge (PD) event.
Energies 12 04771 g001
Figure 2. Phase-resolved partial discharge (PRPD) patterns and q-φ-n diagrams for the five different ageing phases considered: (a,b), phase A; (c,d), phase B; (e,f), phase C; (g,h), phase D; (i,j), phase E.
Energies 12 04771 g002aEnergies 12 04771 g002b
Figure 3. Temperature and pressure simulation results during the first 0.1 s for three different ageing phases considered: (a,b), phase A; (c,d), phase B; (e,f), phase E.
Energies 12 04771 g003
Table 1. Parameters of case of study. Thermal parameters taken from [20].
ParameterDescriptionValue
a Cavity radius1.25 mm
h m Homogeneous material thickness3.5 mm
ε r _ m a t Relative Permittivity of dielectric material4
ε r _ c a v   Relative Permittivity of cavity1
C p _ m a t   Material heat capacity1179 J·kg1·K1
C p _ a i r   Air heat capacity1005 J·kg1·K1
k T _ m a t   Material thermal conductivity0.35 W·m1·K1
k T _ a i r   Air thermal conductivity0.0257 W·m1·K1
ρ m _ m a t   Material volume density561 kg·m3
ρ m _ a i r   Air volume density1.205 kg·m3
Table 2. Parameters for the PD model simulation at each ageing phase, taken from [23], and simulation results summary for PD charge magnitude.
ParameterPhase APhase BPhase CPhase DPhase E
Φ d t (eV)11.10.981.451.33
τ (s)0.0020.0020.00210001000
p 0 (kPa)6565622
T 0 (K)300300300300300
ξ + / ξ 505050501
| q max | (nC)0.8091.5850.1715.5193.753
| q min | (nC)0.8000.8000.1620.0920.085
| q m e a n | (nC)0.8050.8240.1663.4381.300
NHW simulated65.6330.032.2
NHW measured [23]5–7~5.8~300.03–0.06~3
NHW error (%)14.2863.44810026.667
Number of simulated cycles100100100300200
E i n c m (kV·mm1)2.6422.6410.4680.2350.235
E e x t m (kV·mm-1)0.5920.5920.0550.0180.018
Table 3. Temperature and pressure, summary of simulation results at each ageing phase.
VariablePhase APhase BPhase CPhase DPhase E
Max T m c a v (K)302.7305.0300.3347.4321.9
Min T m c a v (K)300.0300.0300.0300.0300.0
Mean T m c a v (K)301.0301.0300.2300.1300.9
Max T s c a v (K)301.5302.9300.2327.2312.6
Min T s c a v (K)300.0300.0300.0300.0300.0
Mean T s c a v (K)300.6300.6300.1300.0300.5
Max p (kPa)65.666.16.02.32.2
Min p (kPa)65.065.06.02.02.0
Mean p (kPa)65.265.26.02.02.0

