Effective Mechanisms to Relate Initial Rock Permeability to Outcome of Relative Permeability Modification


1
Department of Petroleum, College of Engineering, Kirkuk University, Kirkuk 36001, Iraq
2
Department of Petroleum, Curtin University, Kent Street, Perth 6102, Australia
3
Energy Business Unit, Commonwealth Scientific Industrial Research Organisation (CSIRO), Kensington WA 6151, Australia
*
Authors to whom correspondence should be addressed.
Energies 2019, 12(24), 4688; https://doi.org/10.3390/en12244688
Submission received: 22 November 2019
/
Revised: 27 November 2019
/
Accepted: 6 December 2019
/
Published: 9 December 2019
Abstract
:Excessive water production is becoming common in many gas reservoirs. Polymers have been used as relative permeability modifiers (RPM) to selectively reduce water production with minimum effect on the hydrocarbon phase. This manuscript reports the results of an experimental study where we examined the effect of initial rock permeability on the outcome of an RPM treatment for a gas/water system. The results show that in high-permeability rocks, the treatment may have no significant effect on either the water and gas relative permeabilities. In a moderate-permeability case, the treatment was found to reduce water relative permeability significantly but improve gas relative permeability, while in low-permeability rocks, it resulted in greater reduction in gas relative permeability than that of water. This research reveals that, in an RPM treatment, more important than thickness of the adsorbed polymer layer () is the ratio of this thickness on rock pore radius ().
1. Introduction
According to the Paris Agreement, the global 2030 agenda for promoting sustainable and clean energy development, 195 countries have pledged to formulate an energy structure that focuses on the utilization of non-fossil resources and natural gas. Although natural gas is a fossil fuel, it has been given consideration in the Agreement because its combustion can result in less than half the carbon emissions produced by its coal and oil counterparts. The above is, in general, indicative of the fact that natural gas is entering a significant development, producing, and consuming phase [1,2,3,4,5,6,7,8]. However, with many reservoirs reaching their maturity, excessive water production has turned into a major challenge to field operators. It is widely known that water production can lead to a considerable reduction in the productivity of gas wells in particular [9]. Furthermore, the operating costs associated with the handling the water can be as much as $4 per every barrel of the water produced costing the oil and gas industry billions of dollars every year [10]. It is worth noting that these costs are associated with only treating the water and not associated effects such as corrosion, loss of hydrocarbon production, etc. [11,12,13,14,15,16]. Therefore, it is highly desirable to develop viable techniques that can help to reduce the amounts of water produced so the environmental profile of natural gas, as a low-carbon transition fuel, can be further improved.
Chemical treatments have been utilized to reduce water production. One class of material that has received widespread attention, due to their outstanding performance, are relative permeability modifiers (RPM) that can selectively reduce the permeability to water while having minimal effect on oil/gas. To date, most studies have focused on the use of RPMs to reduce water production from oil reservoirs, therefore there is a need for studies focusing on gas reservoirs, as mentioned earlier, since natural gas is deemed as a transition fuel as we move towards renewable sources.
Gas wells have distinct characteristics compared to the oil wells such as special fluid properties (e.g., low viscosity and density of gas) and high production flowrates. Therefore, the selective behavior of the RPMs to reduce water permeability rather than that of the gas phase may not be as straightforward as that expected for oil wells. That is because factors such as viscosity, capillary pressure, and density play important roles in the selective placement of the RPM in the water-producing zones and their subsequent behavior. Furthermore, water control in gas wells is not practiced commonly because of the risk of face plugging with high molecular weight polymer solutions [11,17]. Thus, there are only few works in the literatures on the use of polymer treatment in gas reservoirs [10,17,18,19,20,21,22,23,24,25,26,27,28,29,30,31,32].
The existing literature have reported different physical mechanisms around the mode of action of RPMs. These include wall effect, swelling/shrinking effects, and change in the fluid distribution, with the wall effect considered as the primary mechanism [17,18,19,21,26,28,33,34,35]. In general, the adsorbed polymer layer affects the internal grain surfaces of a rock by causing a wettability change, steric effect, and lubrication effect. Solely from steric considerations, the adsorption of the polymer onto pore surfaces may reduce the cross-sectional area at the pore throats (or regulate the effective pore throat diameter) for all fluids, thus decreasing both water and oil relative permeabilities [10,33]. In addition, the polymer layer may induce a lubricating effect to the non-wetting phase and/or modification of its velocity distribution in the pore channels. Consequently, the non-wetting (gas) phase relative permeability may even experience an increase [28,33]. Moreover, the thickness of the polymer layer may vary with time due to the effects of other parameter such as the fluid phase in the pore space, flowrate (shear rate), and the rheological properties of the polymer [27,31,33,36,37,38,39,40,41].
Furthermore, Grattoni et al. and Zhang et al. indicate that during multiphase flow in porous rocks, the end-point relative permeabilities are controlled by the fluid distribution [42,43]. Zaitoun and Kohler and Grattoni et al. also report that fluid distribution in turn depends on pore size distribution of the rock [33,42,43]. Grattoni et al. propose that after a polymer treatment, the induced changes in the pore sizes and the subsequent redistribution of the wetting and non-wetting fluids caused by the polymer are the main cause of the disproportionate permeability reduction (DPR) [42]. Therefore, analyzing and reporting experimental results with special attention to the role of the adsorbed polymer layer or induced changes in rock pore radii may be insightful and meaningful.
Kalfayan and Dawson and Qi et al. claim that the original rock permeability plays an important role in controlling the success of an RPM treatment [10,44]. With the use of different moderate-permeability rocks (100–1000 mD), various brines (salinity ≥1% TDS), different types of polymers, and different polymer concentrations (1000–8000 ppm), experimental results have shown slight decrease in RPM’s performance when the initial rock permeability increases. At the same time, the change in the relative permeability of non-wetting phases (gas and oil) is reported to be much smaller than the reduction to the wetting phase (water) [18,21,23,28,30,31,44,45]. However, Mennella et al. and Qi et al. report dramatic decrease in RPM’s performance when the initial rock permeability increases from medium (100–1000 mD) to high (>1000 mD) [31,44]. There are far fewer studies on low-permeability rocks. However, Chiappa et al. and Tielong et al. report the same trend as above, similar to the medium- and high-permeability rocks; in rocks that may be classified as having low permeability (k < 100 mD), an RPM treatment may affect the permeability to the non-wetting hydrocarbon phase (gas) to a lesser extent [19,30]. It is worth mentioning that Tielong et al. used a brine with about 0.2% TDs in their study [19]. Sharifpour et al. and Zaltoun et al. show that brine salinity would play an important role in water shutoff treatment especially in low-permeability rocks [22,32]. Zaltoun et al. report that the polymer layer thickness depends on the brine salinty [22]. Sharifpour et al. conclude that increasing the brine salinity decreases the gas phase accessibility to pores in low-permeability media [32].
In principle, the critical question in RPM treatment is how to reduce the relative permeability to water but minimize any effect on the non-wetting hydrocarbon phase. This study experimentally examines the performance of a cationic polymer as an RPM agent for a gas/water system in a number of sandstone rocks with different permeabilities. Using the data generated, the underlying mechanisms behind the DPR effect of the RPM agent are discussed. The discussions reveal that the significance of such mechanisms may depend on the permeability of the rock sample being tested. The data generated and the discussions presented are expected to be of broad interest to the technical community and, in particular, those concerned with the gas/water system where relevant data are very limited.
2. Experimental Work
2.1. Materials
Eight sandstone core samples (from six different sandstone rock types) with a nominal length and diameter of 7.6 cm and 3.8 cm, respectively, were used in this study (Table 1). As can be seen from the contact angle values reported, the samples are strongly water-wet in the presence of nitrogen that forms our non-wetting phase. The IFT700 instrument (Vinci Technologies, France) was used to do contact angle measurements using the Sessile Drop approach under the experimental conditions used during our core-flooding experiments, as will be defined later. We classified the samples based on their permeabilities into the three categories of low (<100 mD), moderate (100–1000 mD), and high (>1000 mD) permeability. The mineralogies of the rocks were typical of a sandstone rock (Table 2) as confirmed by X-ray diffraction (XRD). The brine (2 wt% KCl) used in these experiments was prepared by adding 20 g/L of analytical grade KCl (Sigma-Aldrich) into distilled water. KCl aqueous ionic solution was selected to examine the effect of rock permeability on the performance of RPM. This is because KCl would work as a temporary clay stabilizer, which would enable us to solely focus on the effect of rock permeability on the performance of RPM. High-purity nitrogen (99.99 wt%, BOC Gas) was used as the gas phase to flood the samples. The RPM solution (Table 3) was made by dissolving cationic Poly(acrylamide-co-diallyldimethylammonium chloride) at 1000 ppm concentration in the abovementioned synthetic brine. It is worth noting that some of our rock samples, in addition to quartz, contained high proportions of other minerals such as albite, illite/muscovite, etc. However, the presence of these minerals may not greatly interfere with the interactions of the RPM solution with the pore surfaces of these rock samples under our experimental conditions. That is because the above minerals would be predominantly negatively charged [46,47,48] and, therefore, are expected to behave similar to quartz in their interactions with the cationic polymer solution used in this work.
2.2. Rheological Properties
A HAAKE RheoWin rheometer (Thermo Fisher Scientific, Karlsruhe, Germany) was used to determine the effect of shear stress on shear rate for our 1000 ppm RPM solution. As depicted in Figure 1, the viscosity of the solution changed depending on the shear stress applied, so it exhibited a non-Newtonian shear thickening behavior. This behavior would be desirable for effective delivery of the solution to a porous formation at any scale (i.e., from core/laboratory scale to the wellbore scale).
2.3. Core-Flooding Procedure and Formulations
Figure 2 shows a schematic diagram of the instrument used in this work during the core flooding experiments. The rock samples were subjected to a specially designed core-flooding procedure after their initial petrophysical characterization in accordance with the three main stages described below. This flooding procedure not only enabled us to determine the critically required end-point relative permeabilities to every phase before and after the RPM treatment, but also made it possible to examine the effect of injection flow rate on the performance of the RPM solution used. It is worth noting that a brief version of the flooding procedure is included in this manuscript, as the detailed procedure has been presented elsewhere in our previously published work [28].
Before undergoing the flooding procedure, the samples were initially dried in an oven at 65 °C for a period of 24 h or until reaching weight stability. Subsequently, nitrogen gas was used to measure their porosity and permeability with the relevant data reported in Table 1. The AP-680 Automated Permeameter Porosimeter (Coretest Systems Inc., Reno, Nevada, US) has been used for porosity and permeability measurements. This equipment uses a technique based on the Boyle’s Law to measure porosity and a pulse decay technique to measure the permeability.
- Pre-RPM Treatment Stage:In this stage, after being vacuumed and brine saturated, the brine permeability of a sample would be measured using a multi-rate brine injection procedure. Subsequently, the samples would be subjected to a sequence of first multi-rate nitrogen and then multi-rate brine (1–160 cc/min) injection, within the Darcy flow regime (Equation (8)) [49]. Such constant rate injection steps would be required to determine the necessary irreducible water (Swirr) and residual gas (Sgr) saturations as well as the end-point relative permeability of gas at irreducible water saturation (krg1(Swirr)) and that of brine at residual gas saturation (krw1(Sgr)).
- RPM Treatment:For effective treatment, three pore volumes of the RPM solution were then pumped through the rock sample and the rock/RPM system was left to age under experimental conditions for 48 h. The injection flow rate used to deliver the RPM agent was chosen according to the permeability of the sample being tested. It was set at 0.1 cc/min in low-permeability samples and 1 cc/min for the moderate- and high-permeability ones.
- Post-RPM Treatment Stage:As part of stage 3 of the flooding procedure, initially a constant flow rate of brine was used to remove any unreacted RPM solution from the pore space of the sample. Subsequently, the sequence of multi-rate gas and brine injections referred to in the description of the first flooding stage were repeated. This was necessary to determine the required post treatment values of Swirr and Sgr as well as the relative permeabilities to both brine (krw2(Sgr+polymer)) and gas (krg2(Swirr+ polymer)) phases, which may have been altered due to the presence of the RPM solution.
It is worth noting that the gas relative permeability was measured by injecting gas under constant flow rate until no more brine was produced and achieving constant differential pressure across the sample (i.e., establishing irreducible water saturation (Swirr). A similar procedure was followed to measure the water relative permeability by establishing residual gas saturation (Srg).
In order to proceed with evaluating the outcome of the RPM treatments performed, the above measured data were subsequently used to obtain a number of critical parametric values using the equations outlined below. Some of these equations were included and discussed in our previous publication [28], however we are presenting them in this manuscript again for the ease of referencing and also to make the explanations and discussions presented here complete on their own.
We calculated the water and gas residual resistance factors ( and ) using the equations proposed in the literature [50] as a conventional way of determining the outcome of the RPM treatment.
where Kbefore and Kafter are the experimentally measured end-point relative permeability of water/gas before and after the polymer treatment, respectively. The Darcy equation was used to calculate the above permeability values upon reaching steady state conditions. If and (resulting in ), the RPM treatment may be considered successful. Subsequently, as proposed in the literature, the effective value of the hydrodynamic polymer layer thickness (in μm) adsorbed onto the sample’s pore surfaces may be calculated using the equation below [33].
where is the residual resistance factor as defined by Equations (1) or (2) and is the overall average pore radius (μm) of the rock as calculated using Equation (4).
where is the absolute brine permeability (calculated using the Darcy equation) and ϕ is the porosity of a rock sample.
Of note is that, depending on the value used ( or ), two potentially different values of ( or ) may be calculated. Subsequently, or the effective average pore radius (in μm) after the RPM treatment may be calculated using the following equation [28].
The Young–Laplace equation to calculate capillary pressure for a given pore size is presented below.
where is the capillary pressure, is the interfacial tension, is the contact angle, and is the pore radius. As demonstrated by our contact angle data, in the presence of the strongly non-wetting nitrogen phase, the sandstone rock samples are strongly water-wet or , which may further simplify the above equation by reducing the term to 1.
The following equation may be used to calculate the average interstitial velocity ( in cm/sec for fluid flow in porous rocks [51].
where, is the fluid flow rate (cm3/sec), is the core cross sectional area (cm2), and is the porosity (fraction) of the rock sample. Lastly, the following equation is used to calculate the interstitial Reynold’s number (, which corresponds to the ratio of inertial forces to the viscous ones [49]. This equation is used to determine the fluid flow regimes in porous rocks.
where ρ and μ are the density (g/cm3) and the dynamic viscosity (Pa-s) of the fluid, respectively, d is the pore equivalent diameter (cm), and parameters , , and have the same meaning and units as that in Equation (7).
3. Results and Discussions
Presented in Table 4 are the and values and their ratios for all core plugs examined as calculated using the results of the core-flooding experiments. Every value included in the table is the calculated average value over the 1–4 cm3/min flow rate range for every fluid phase. It is worth noting that, depending on their initial permeability, some rock samples were tested using flow rates beyond this range. However, the abovementioned range was common across all the rock samples making a comparison between their responses to the RPM treatment meaningful.
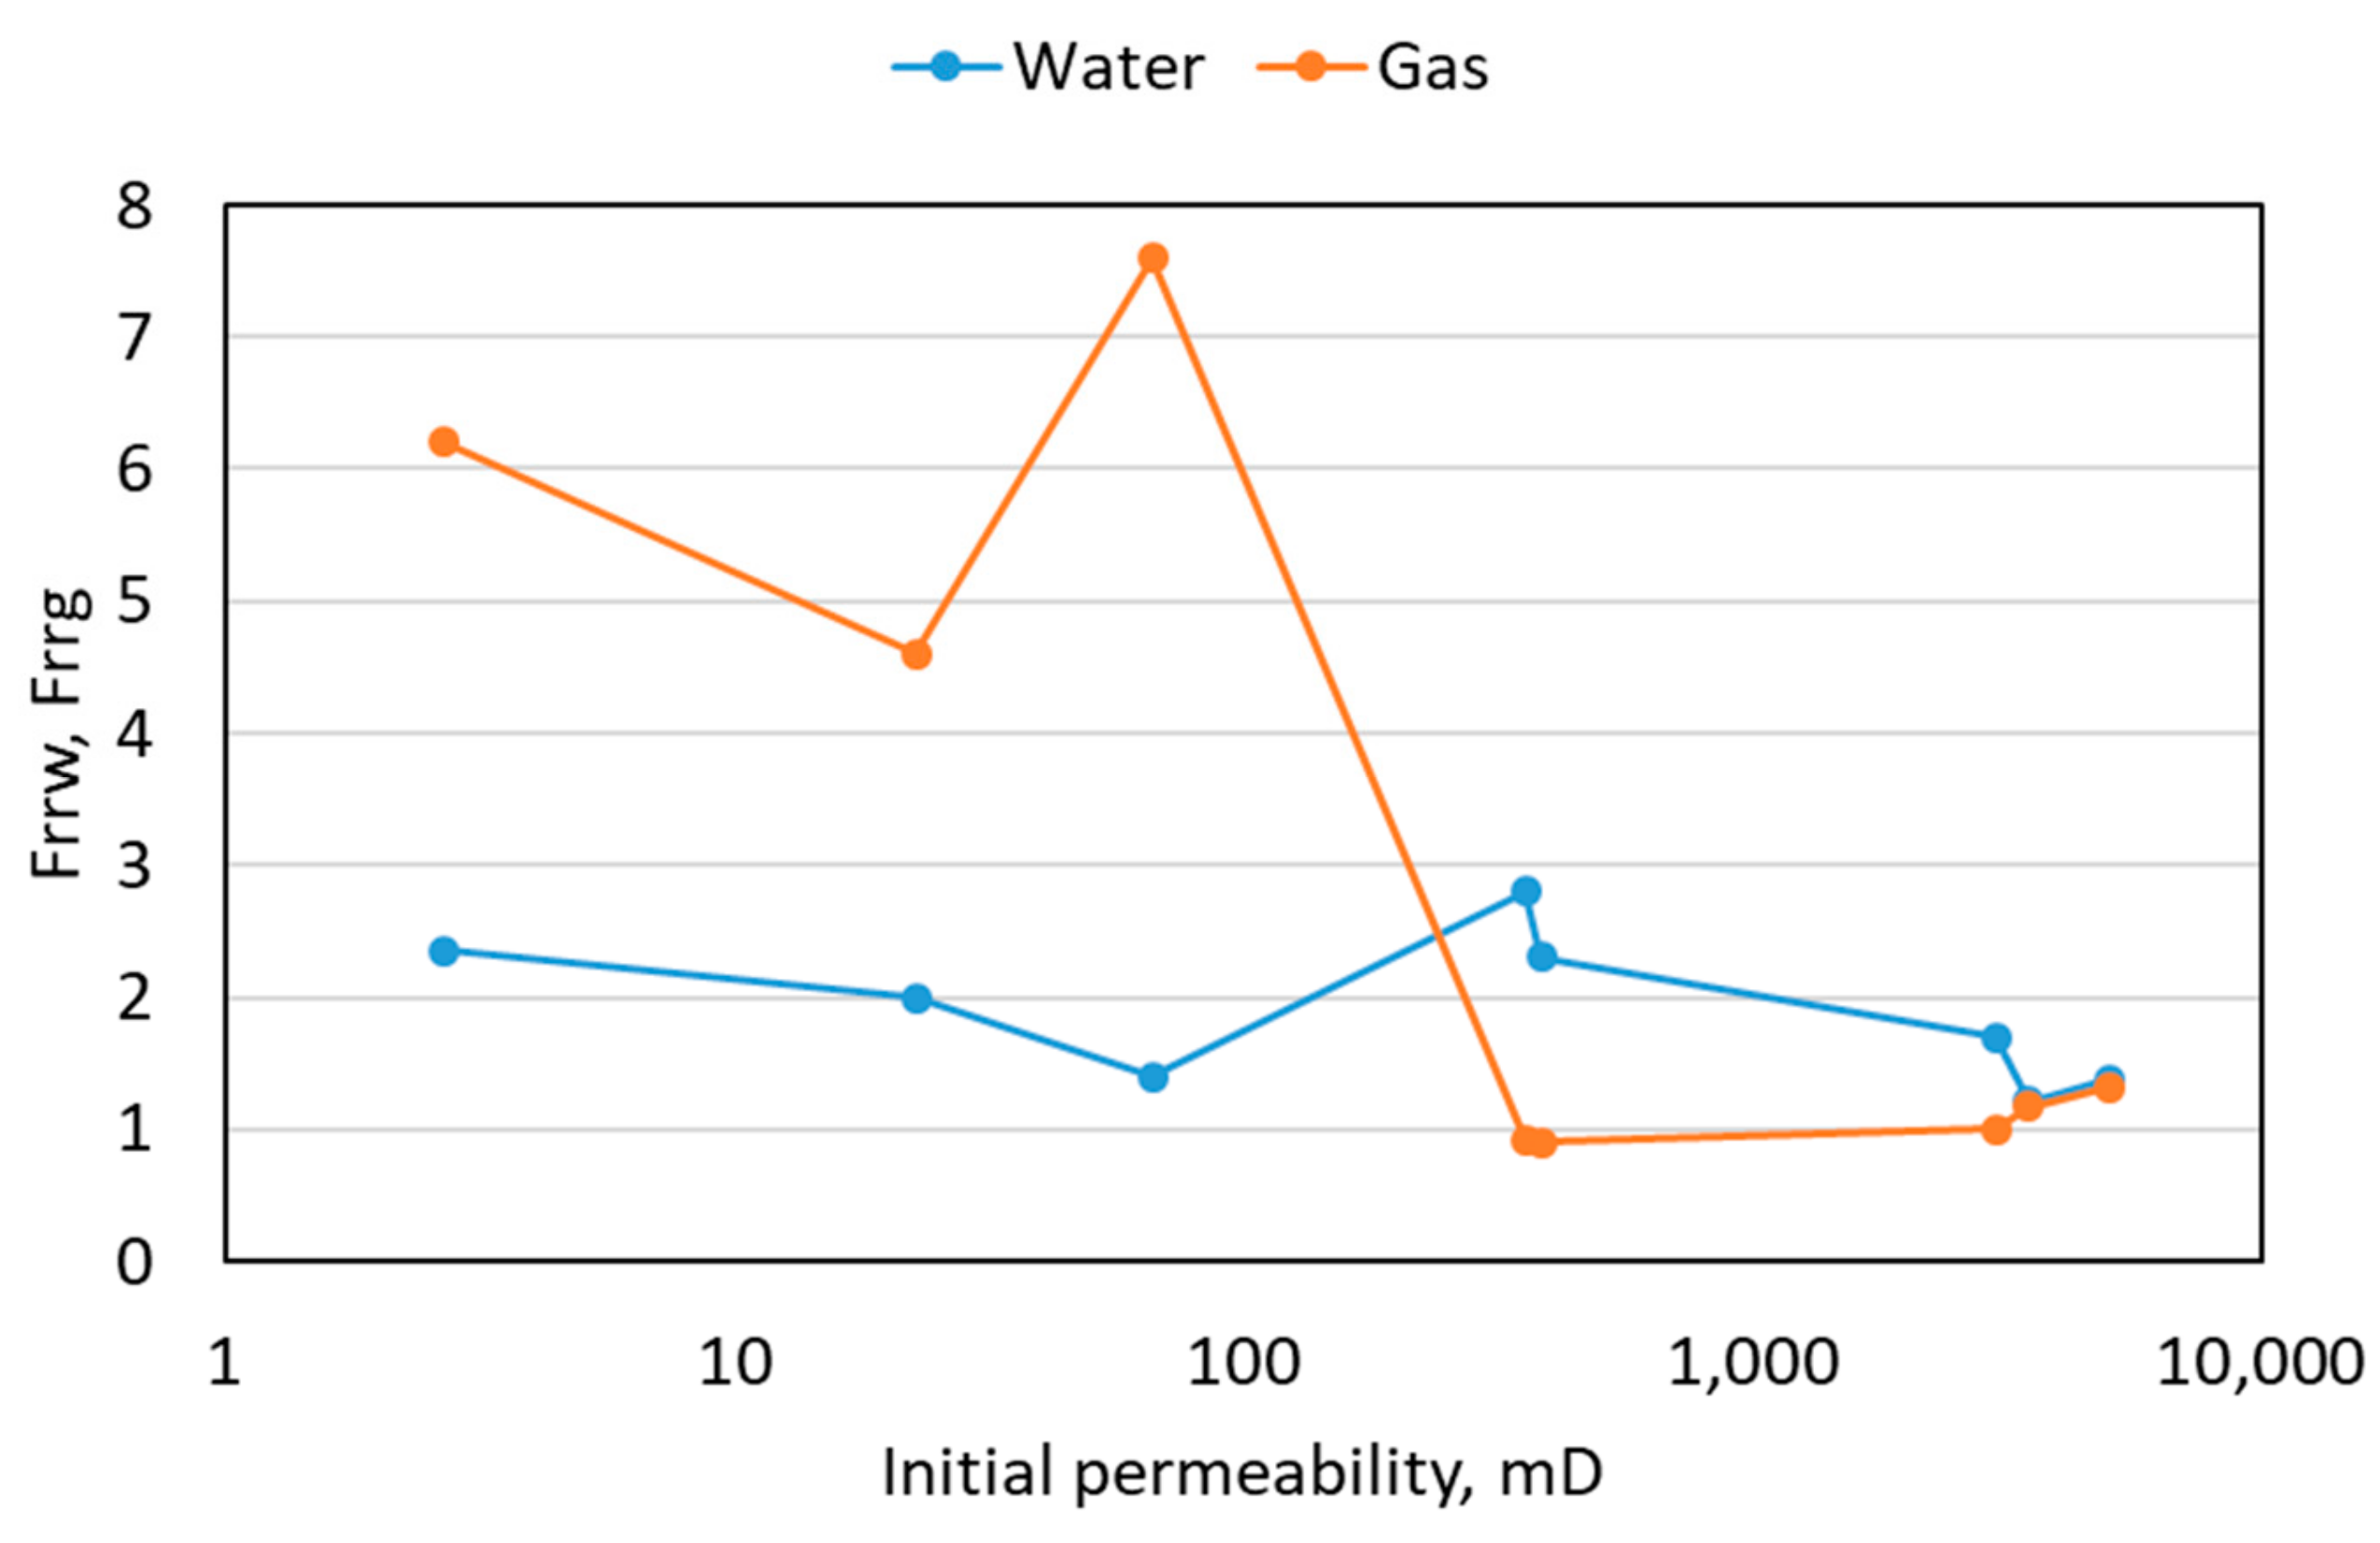
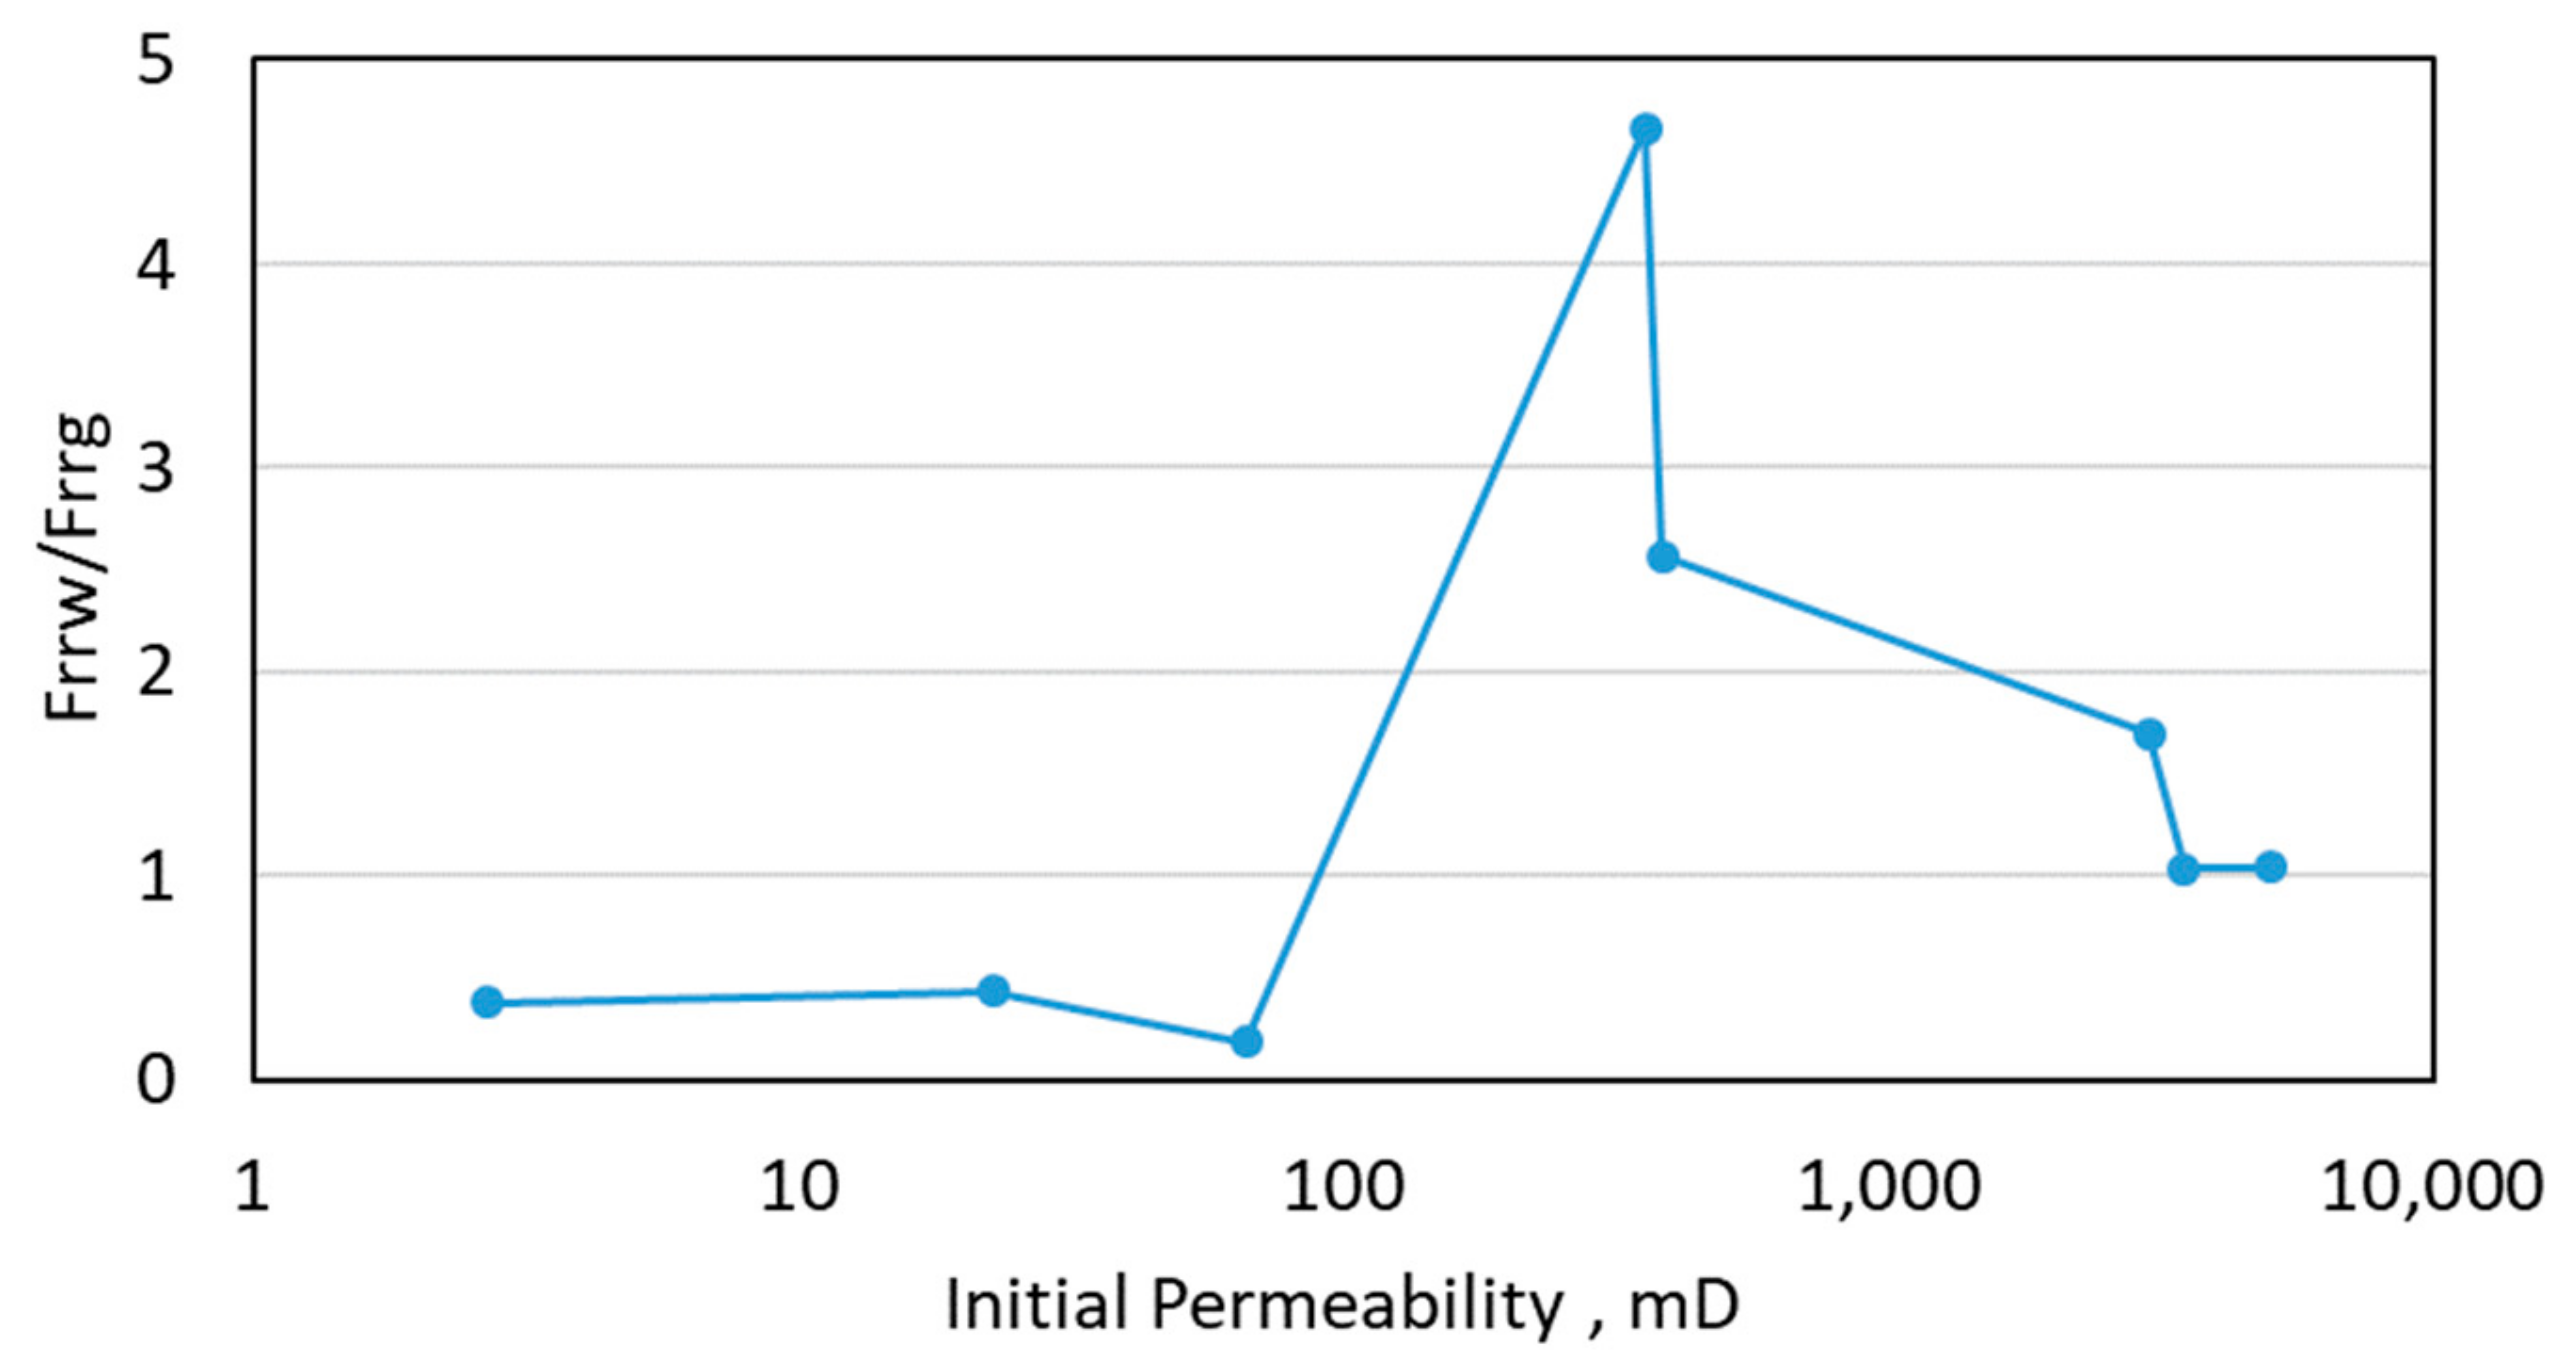
For visual elaboration, the , , and then their ratio are plotted in Figure 3 and Figure 4, respectively, against rock permeability.
The effect of rock permeability on the RPM treatment examined in this work was explored by evaluating the data presented in Figure 3 and Figure 4 in the context of the three permeability categories defined for our rock samples in Table 4. As can be seen, for moderate-permeability rocks, the water relative permeability decreases after the polymer treatment. However, the gas relative permeability either does not change significantly or improves slightly. Therefore, for all rock samples in this permeability range, and (Table 4 and Figure 3), with the same treatment sequence, which means the treatment may be considered successful. According to this criteria, various literature have reported a similar trend with the use of different moderate-permeability rocks (100–1000 mD), various brines (salinity ≥ 1% TDS), different types of polymers, and different polymer concentrations (1000–8000 ppm) [18,21,23,28,30,31,44,45]. A summary of such findings is included in Table 5.
However, in the high-permeability rocks, the water and gas relative permeability reductions are almost the same, resulting in and . Similarly, experimental results by Mennella et al. and Qi et al. show dramatic decrease in RPM’s performance when the initial rock permeability increases from medium (100–1000 mD) to high (>1000 mD) [31,44] especially for the gas–water system (Table 6). Therefore, using higher polymer concentration may help to increase permeability reduction [29,30,31,36,37,44,52,53]. However, beyond a certain concentration, no further adsorption takes place due to saturation of the adsorption capacity of the active adsorption sites [30,44,53,54,55]. Therefore, as indicated in the literature, using gels to treat high (and even moderate) permeability rocks may be more effective than using polymers [10,23,25,29]
In the low-permeability category (Table 4), consistently across all samples, 1, resulting in (Figure 3) meaning that the RPM treatment reduced the relative permeability to both fluid phases. However, for all samples (Figure 4), such reductions would be much more pronounced for the gas phase than the water phase. In other words, the treatment is considered unsuccessful in this category of rocks. However, Chiappa et al. and Tielong et al. reported a different trend using rocks that may be classified as having low permeability (k < 100 mD) where they indicate that an RPM treatment may affect the permeability to the non-wetting hydrocarbon phase (gas) to a lesser extent [19,30]. It is worth mentioning that Tielong et al. used a brine with about 0.2% TDs in their study [19]. Sharifpour et al. and Zaltoun et al. showed that brine salinity would play an important role in water shutoff treatment especially in low-permeability rocks [22,32]. Zaltoun et al. reported that the polymer layer thickness depends on brine salinty [22]. Increasing the brine salinity may increase the polymer layer thickness and, eventually, this may decrease the gas phase accessibility to small pores in low-permeability media [32]. Therefore, the low-permeability candidates may require special RPM technology since the treatment of such formations may be associated with several problems such as plugging, loss of injectivity, and limited depth of pentration [20,56].
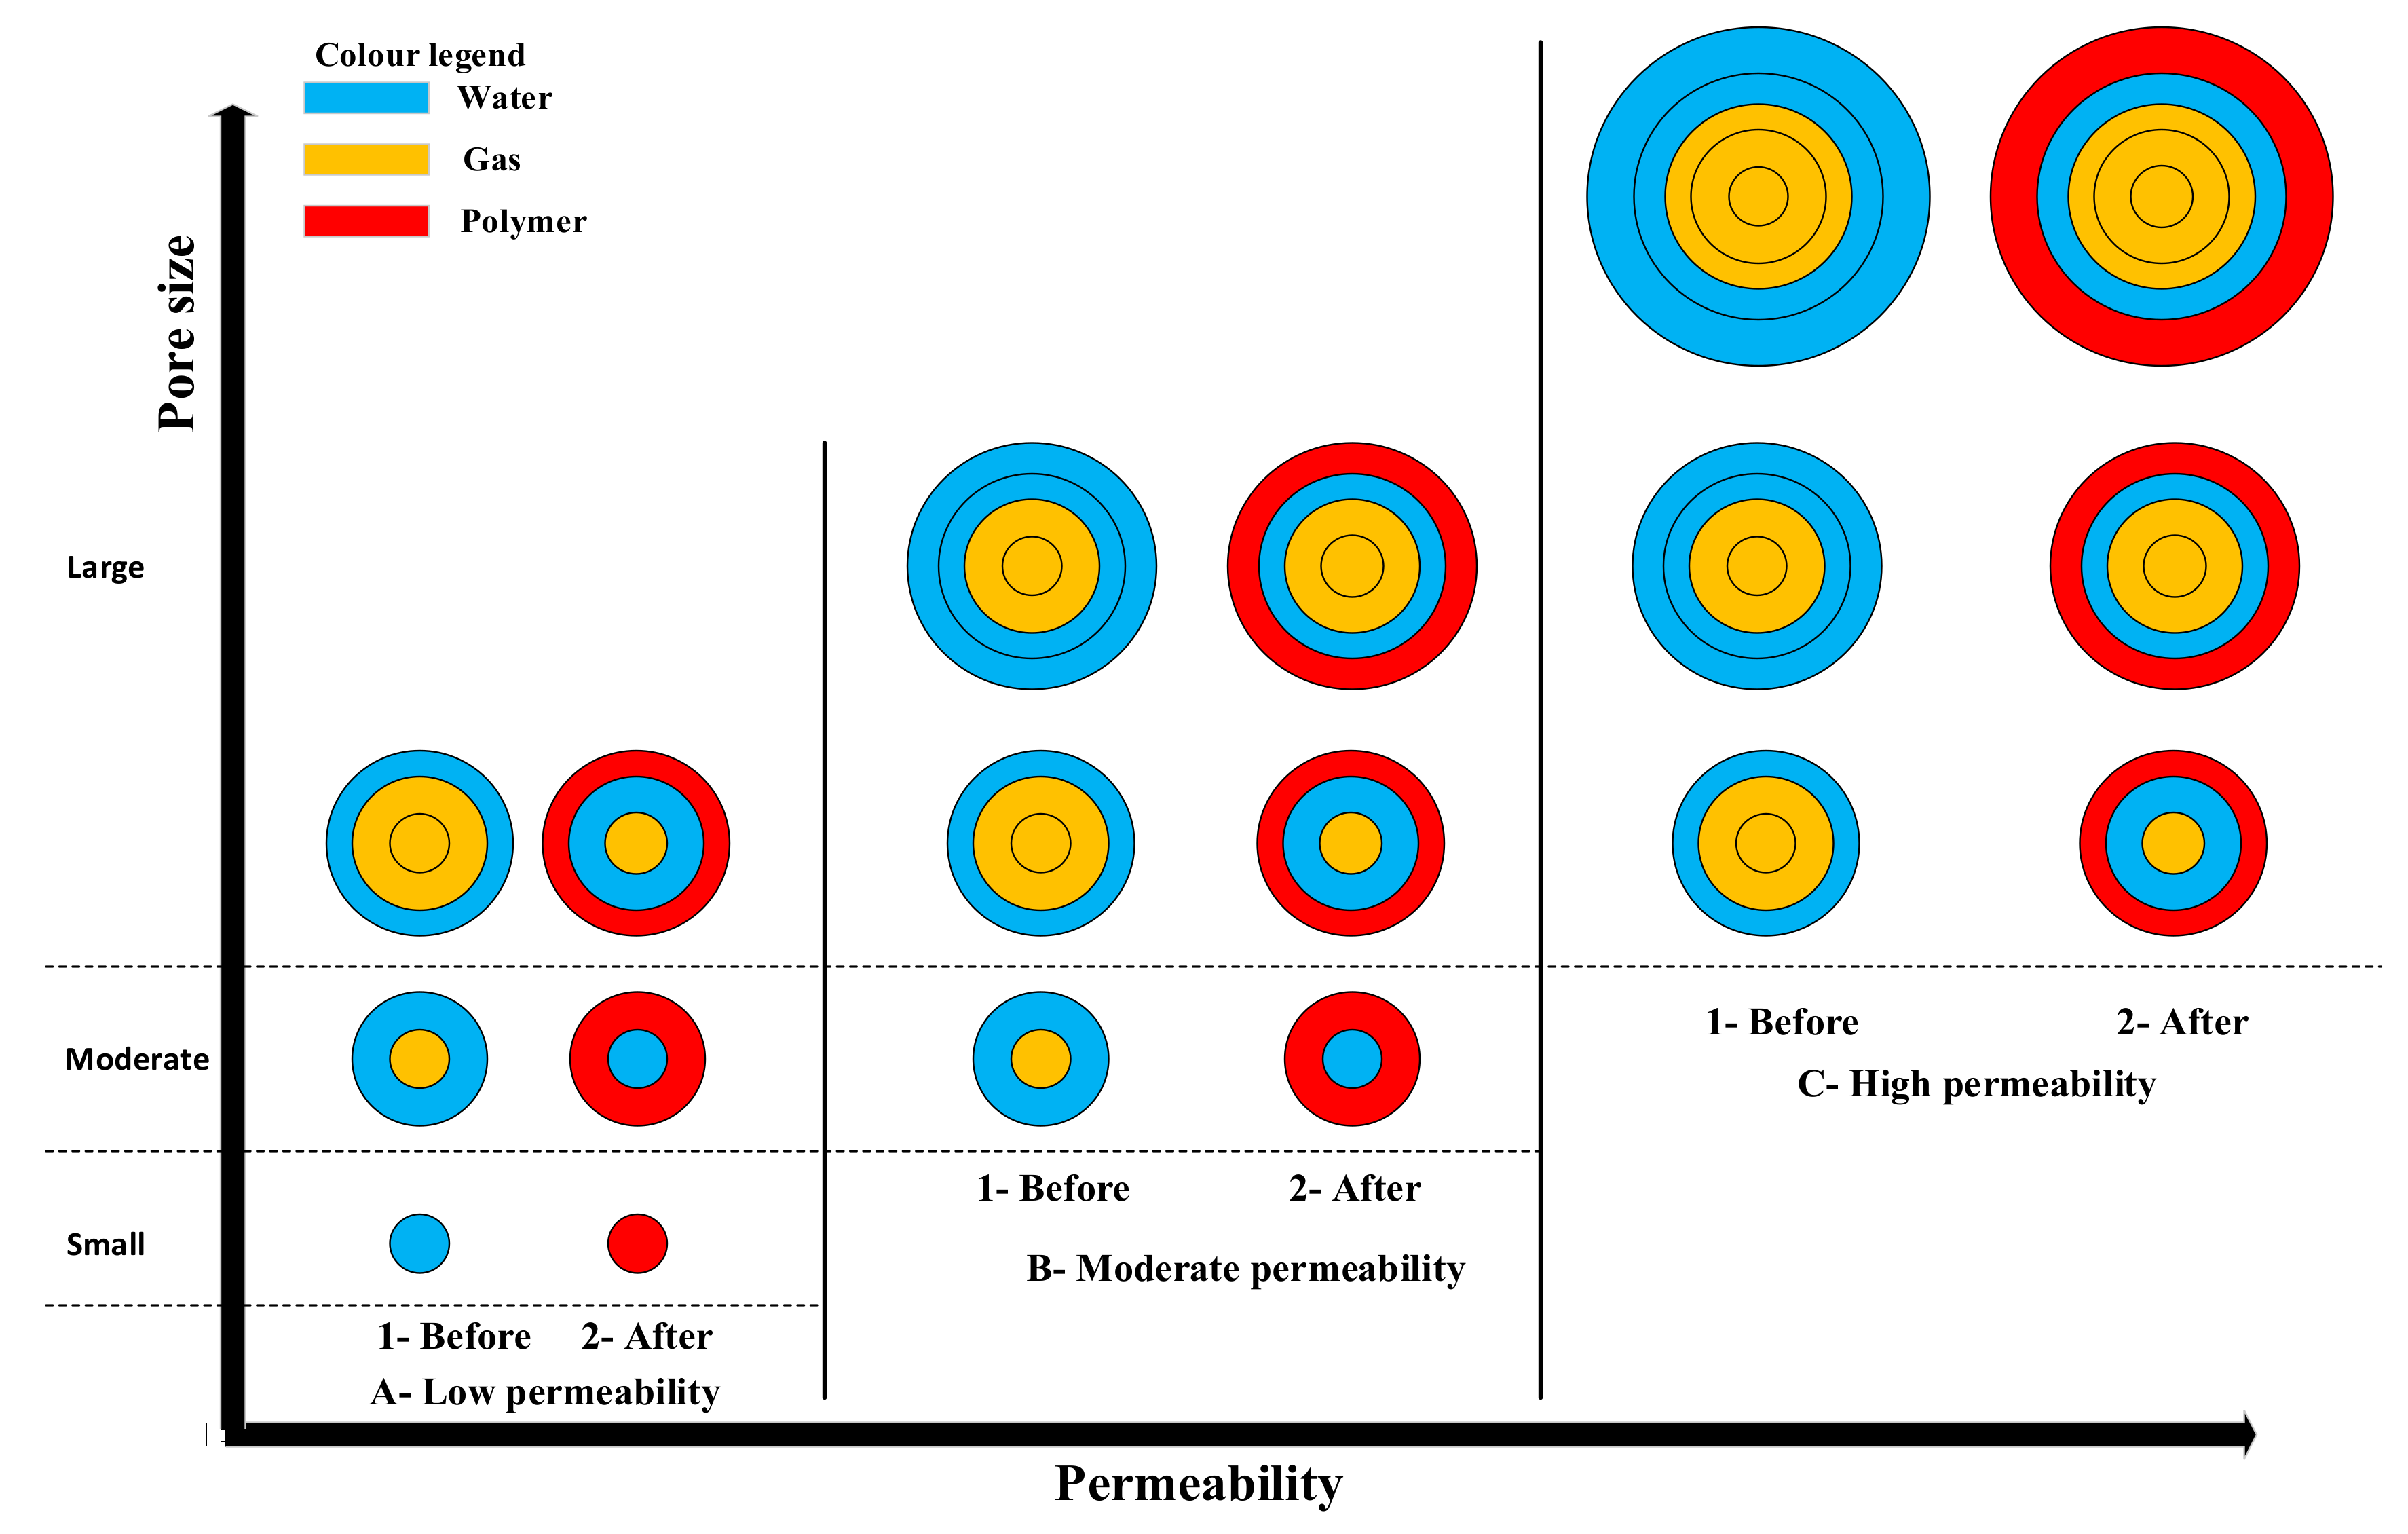
The results presented above may find support in the pre- and post-treatment pore-size and fluid distributions of the different rock samples. As naturally expected and revealed by the calculated values in Table 4, as the permeability of a rock increases, its overall pore sizes become larger. This is also visually demonstrated in Figure 5, noting that our rock samples appear to be water-wet in the presence of nitrogen gas. Before the treatment, small pores (Figure 5(A1)) would be fully saturated with the wetting phase (water) and inaccessible to the non-wetting gas phase for reasons of capillarity (Equation (6)). On the other hand, in the moderate and large pores (Figure 5(B1),(C1)), the non-wetting phase flows in the center, and the wetting water phase is present in the form of a film covering the pore walls [33,42]. In summary, the pore size distribution of a porous medium and hence capillarity in conjunction with wettability control the way fluids are distributed in the pore space of a porous medium.
As pointed out earlier, Grattoni et al. have shown that after a polymer treatment, the induced changes in the pore sizes of a porous medium by the RPM and the subsequent redistribution of the wetting and non-wetting fluids are the main cause of DPR [42]. As a common phenomenon across all rock samples, the adsorbed polymer on the surface of the water-wet grains (Figure 5(A2),(B2),(C2)) alters the effective pore size distribution by reducing their actual sizes. However, the relative pore size change (i.e.,) would be a function of rock’s initial pore sizes and, therefore, would be different in different rock samples.
As can be seen in Figure 5, after treatment, the very small pores that were previously filled with water (Figure 5(A1)) may become plugged by immobile polymer (Figure 5(A2). The moderate pores that were previously occupied by water and non-wetting phase simultaneously (Figure 5(A1),(B1)), now have a smaller size (i.e., higher capillary pressure (Equation (6)) and, therefore, becomes filled only by water (Figure 5(A2),(B2)). The largest pores, however, may still remain relatively large so that they would be filled by both of water and gas phases simultaneously (Figure 5(A2),(B2),(C2)).
The immediate conclusion from the above is that the amount of pore space available for each fluid to flow through reduces during the post-treatment stage. However, the nature of this reduction is different in samples with different permeabilities. In other words, generally after treatment, the relative permeabilities to both of the wetting and non-wetting phases may be reduced. However, in the high-permeability rocks, given its relatively larger pores, such a relative reduction is the lowest. This would mean that, as also revealed by our results presented earlier, with such a permeability range, the effect of an RPM treatment would be of similar order on the wetting and non-wetting fluids relative permeabilities. Unlike high-permeability media, the relative permeability reduction effect would be highly pronounced in low-permeability rocks where the relative pore size reduction (i.e.,) would be the greatest. In such media, gas (i.e., the non-wetting phase) cannot access a range of pore sizes at all initially, due to their very small sizes, and this range extends to even more pores after treatment. This means the gas relative permeability reduction may be the highest in a low-permeability situation. This conclusion is supported by the experimental results as presented and discussed earlier. Judged based on the discussion presented so far, the best outcome from an RPM treatment may be expected in moderate-permeability media. As seen from some of the results for moderate-permeability rocks, the gas relative permeability may even improve as attributed to influencing factors such as the lubrication effect induced by the adsorbed polymer [28,33].
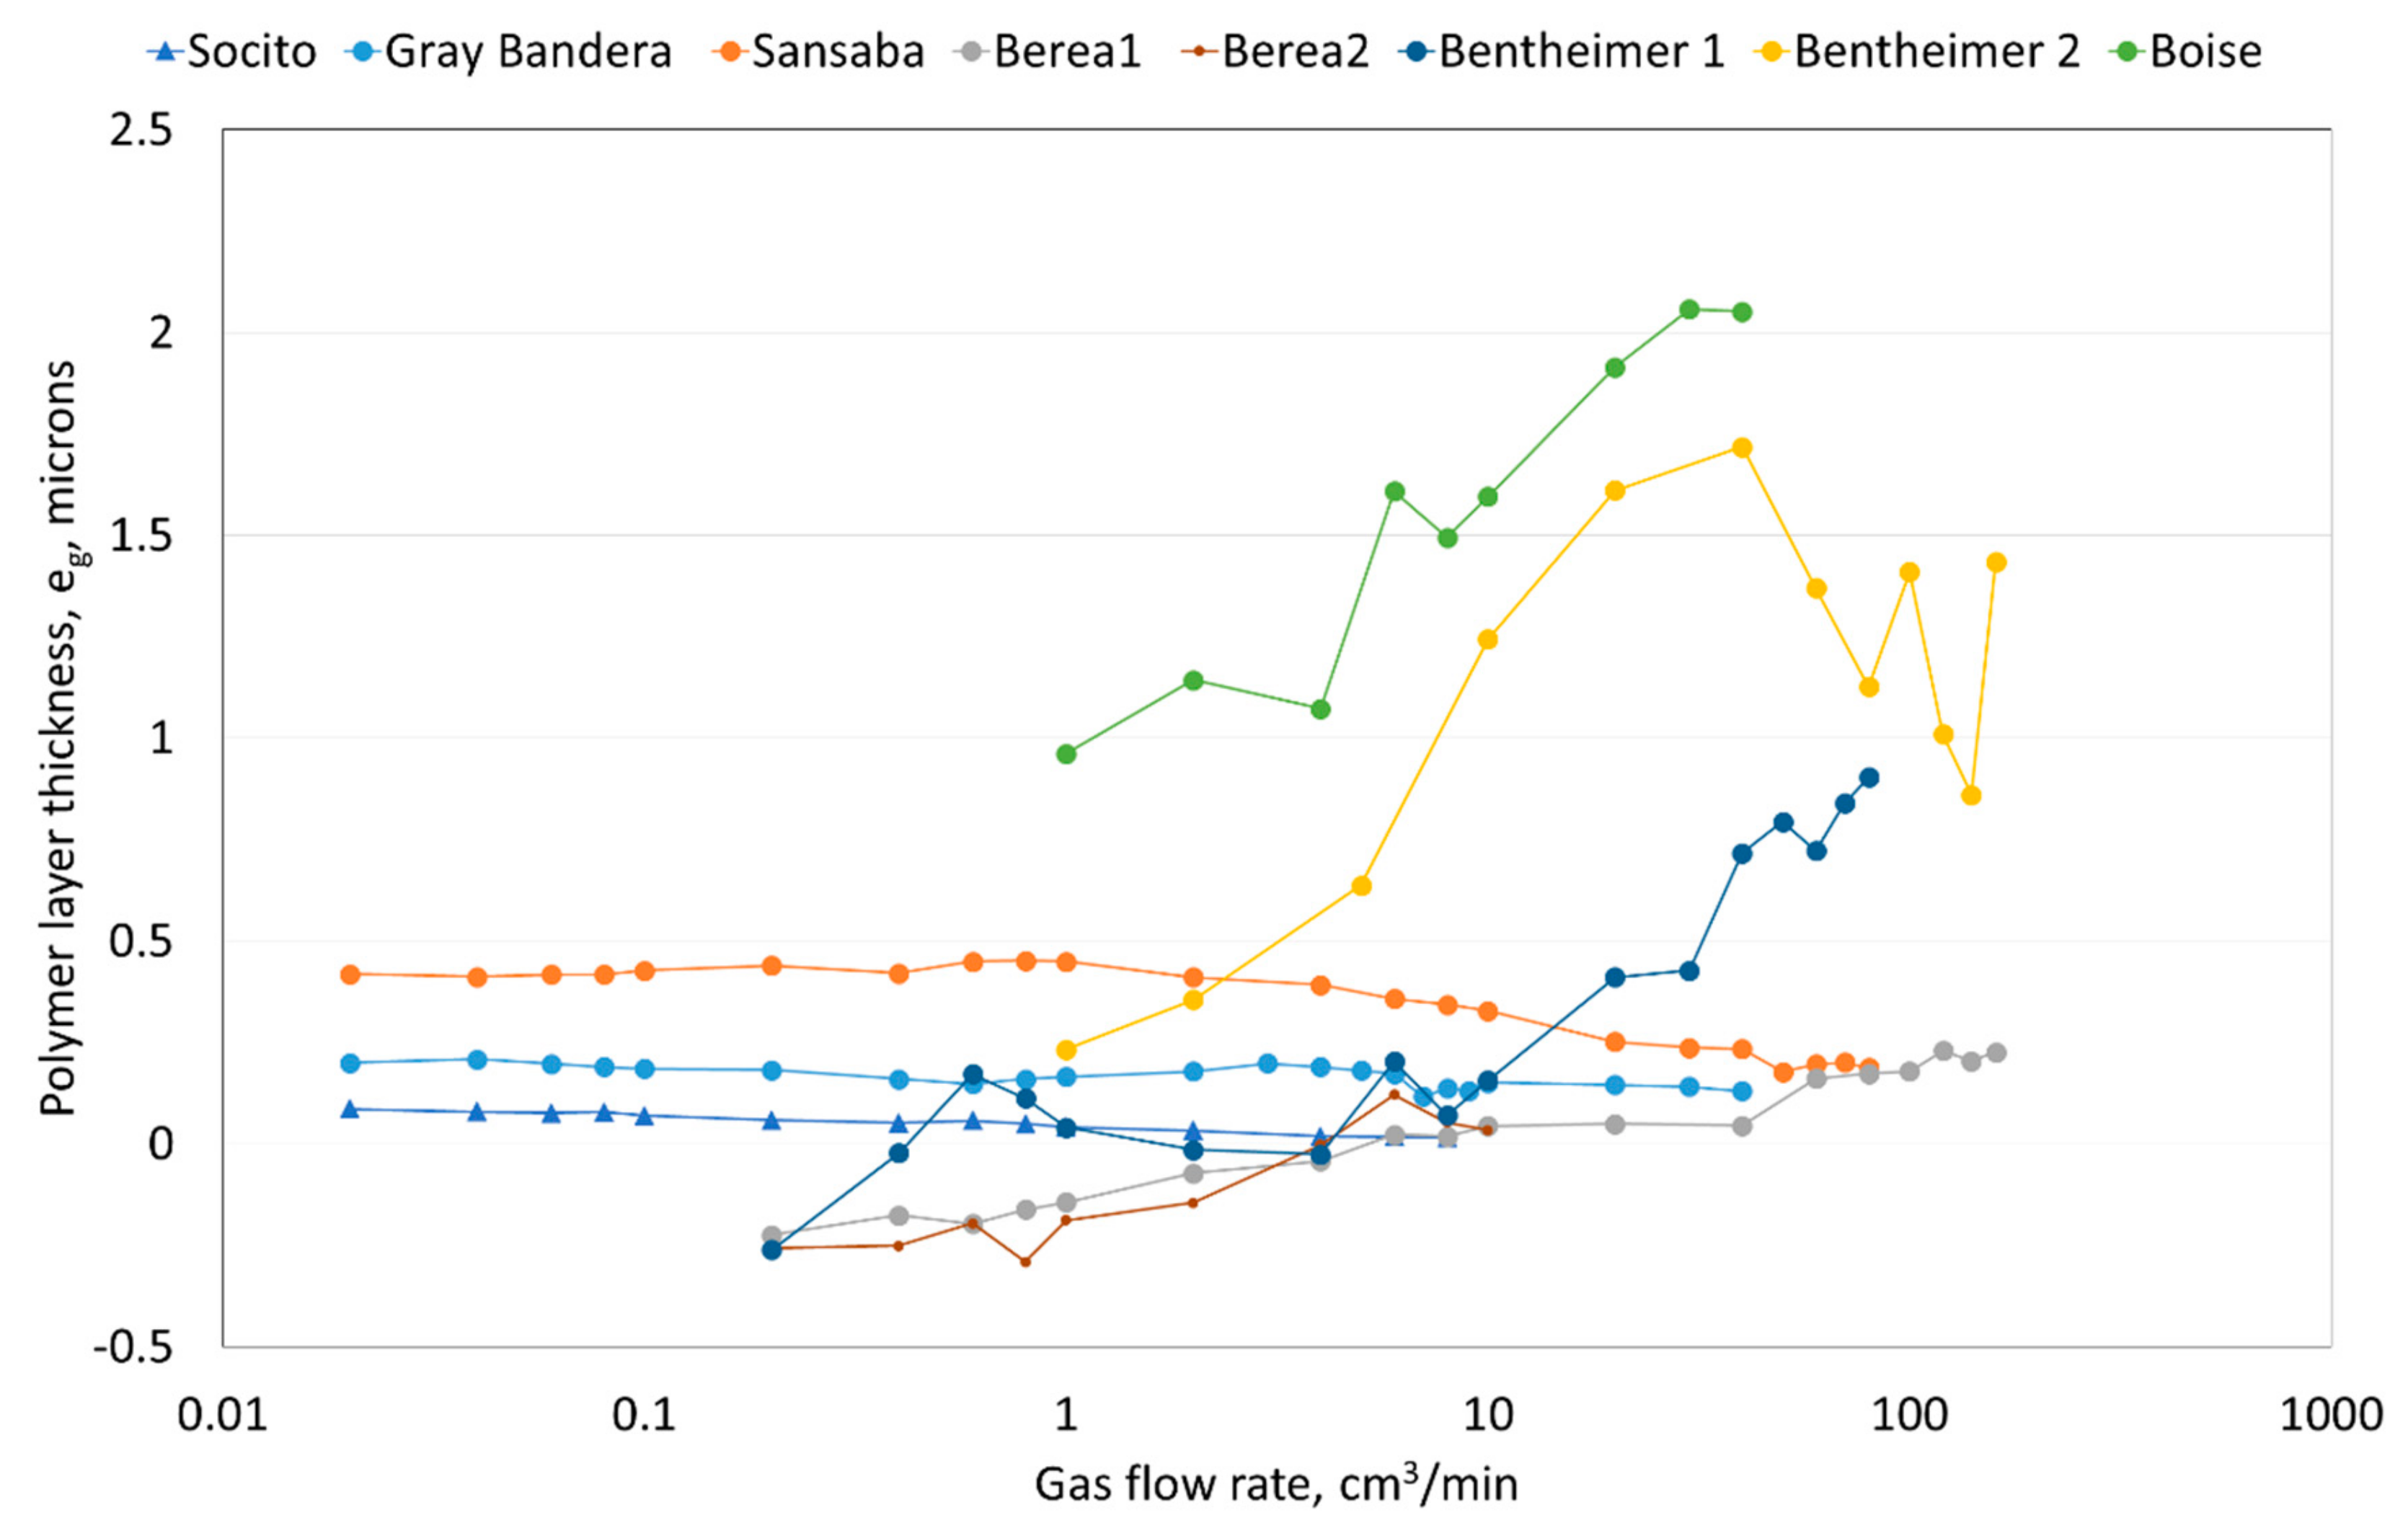
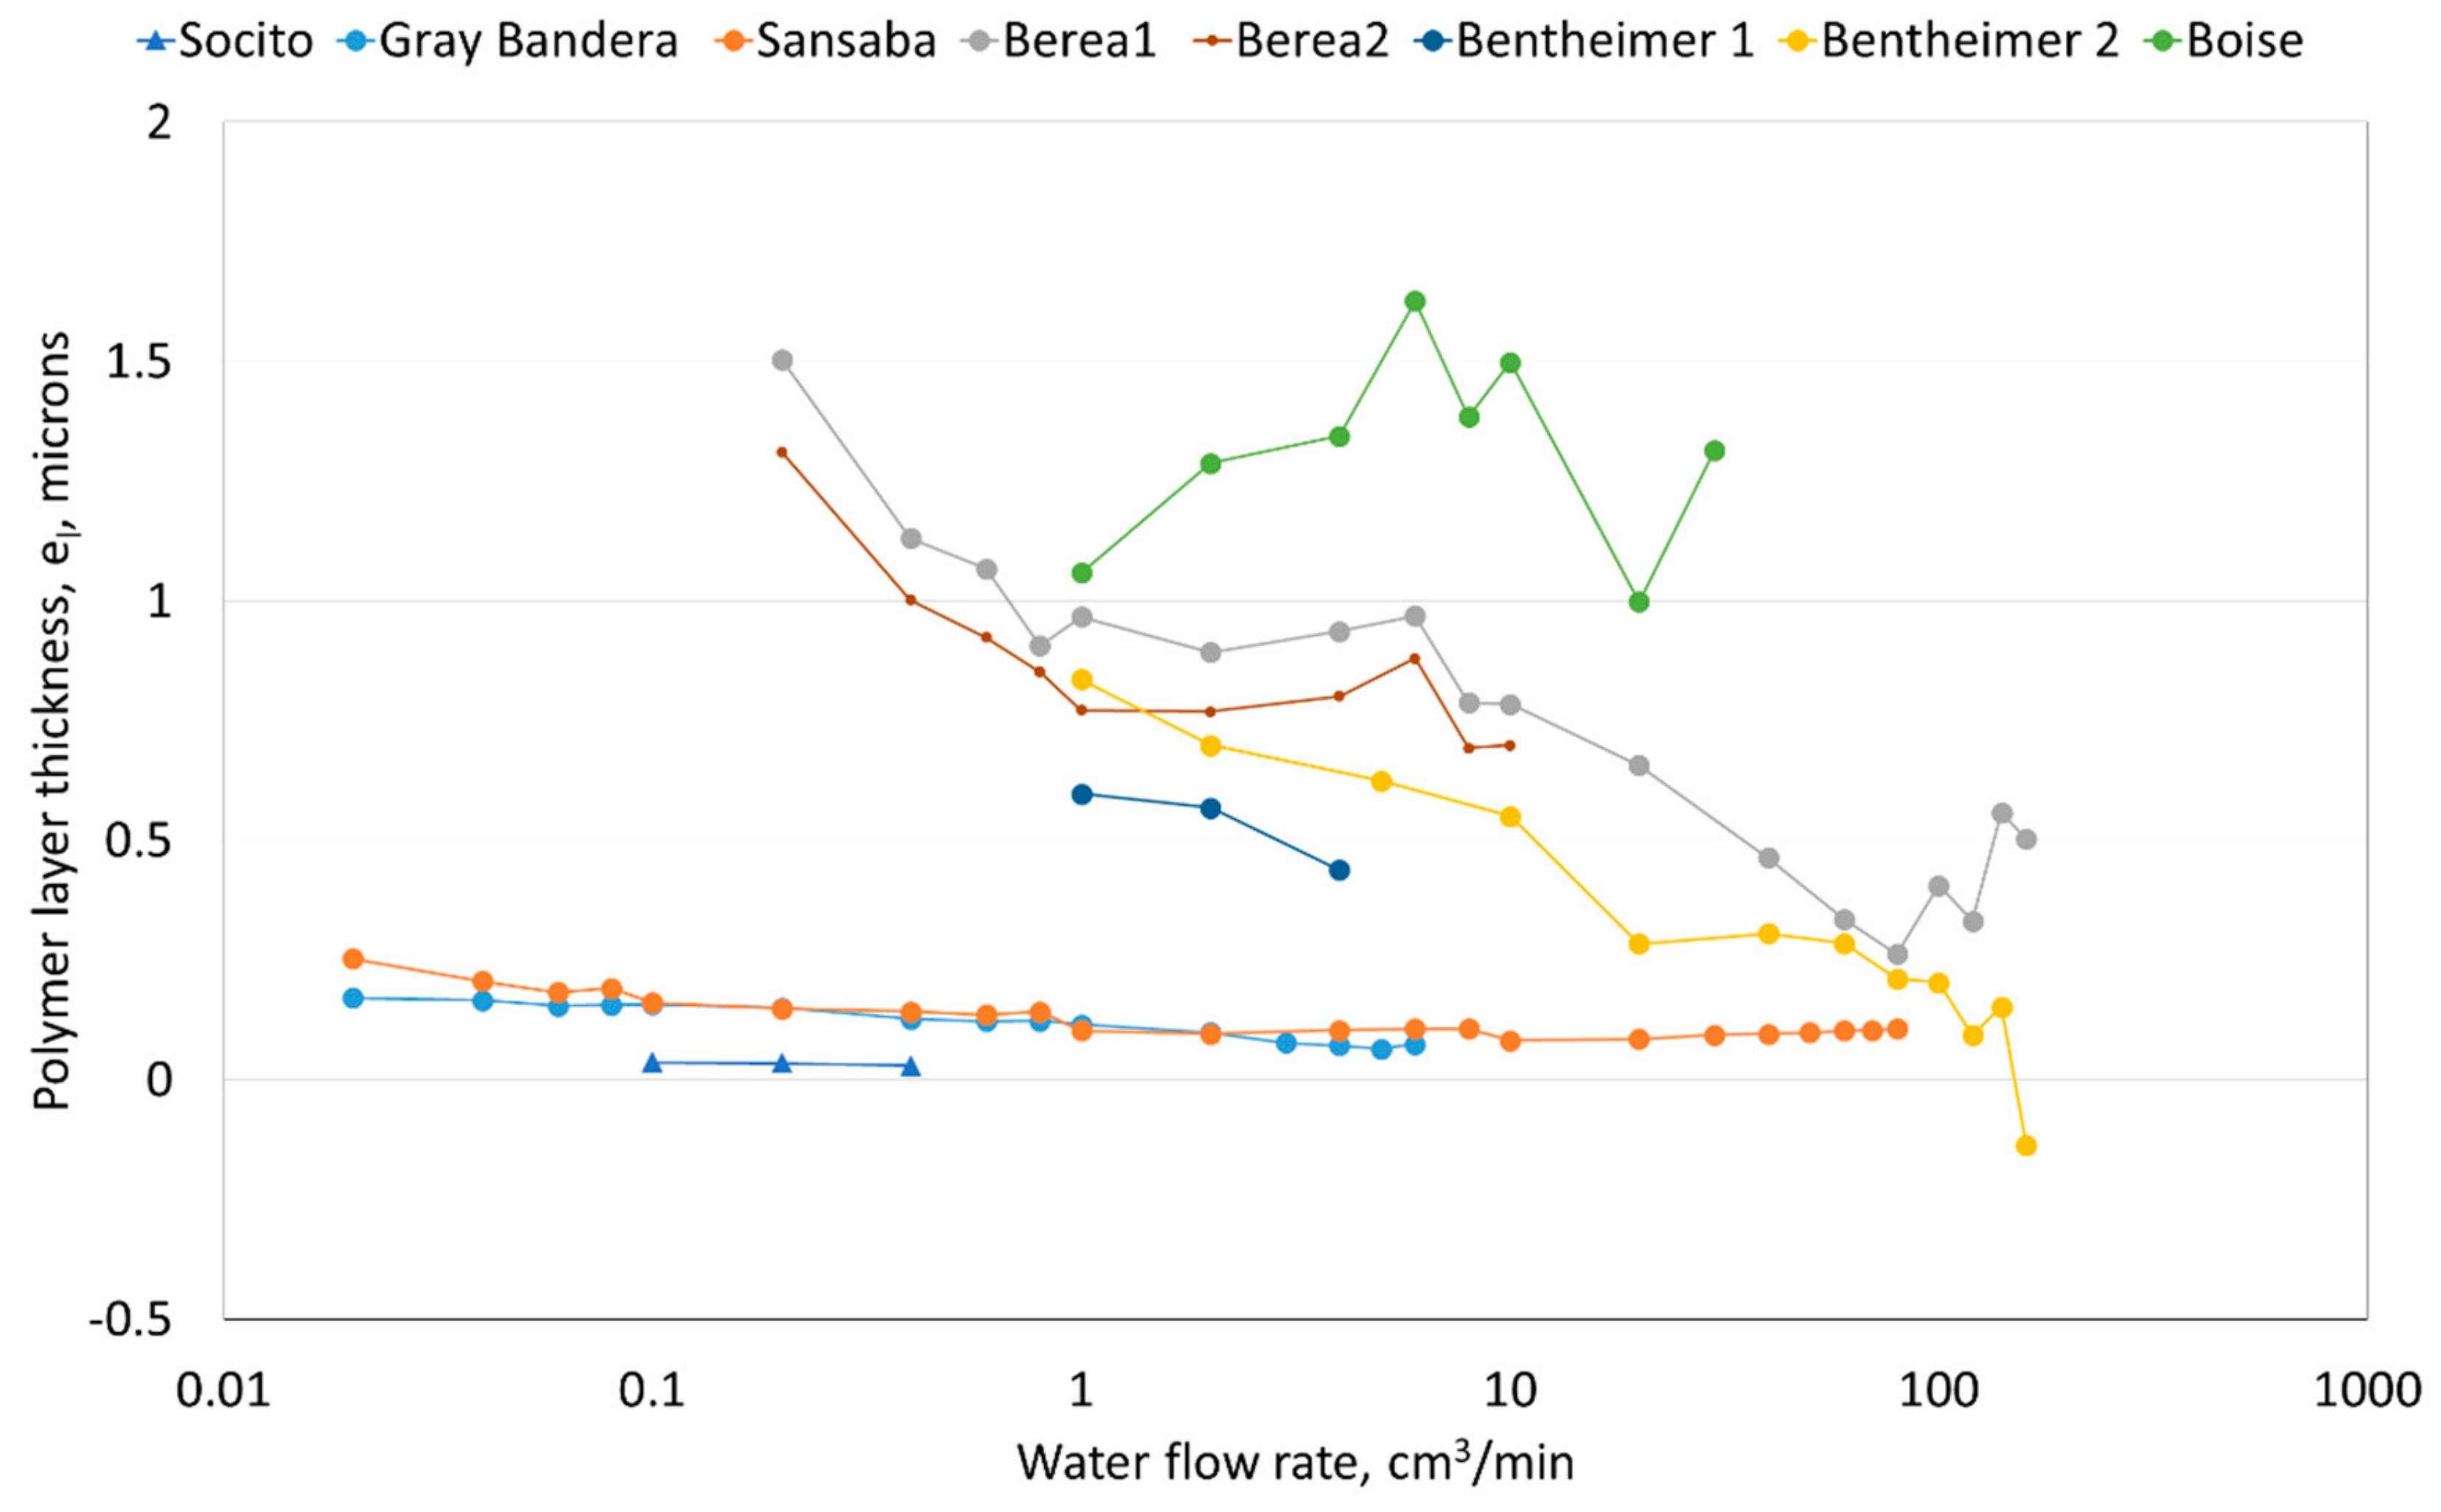
In general, the polymer layer thickness (), as calculated using Equation (3), may increase with increasing rock permeability (i.e., increasing pore sizes). As can be seen from Figure 6 and Figure 7, the highest polymer layer thickness is observed in the highest permeability sample (i.e., Boise). As discussed earlier, the samples with moderate permeability (i.e., Berea Sandstone) exhibit an exceptionally favorable response to the RPM treatment. As seen from Figure 6 and Figure 8, these rocks reveal negative polymer thickness at low gas flowrate, meaning improvements in gas relative permeability during post RPM treatment. In addition, as revealed by Figure 3, these rocks show high water relative permeability reduction that would not follow the way the curves for all other rocks are arranged with respect to their permeability.
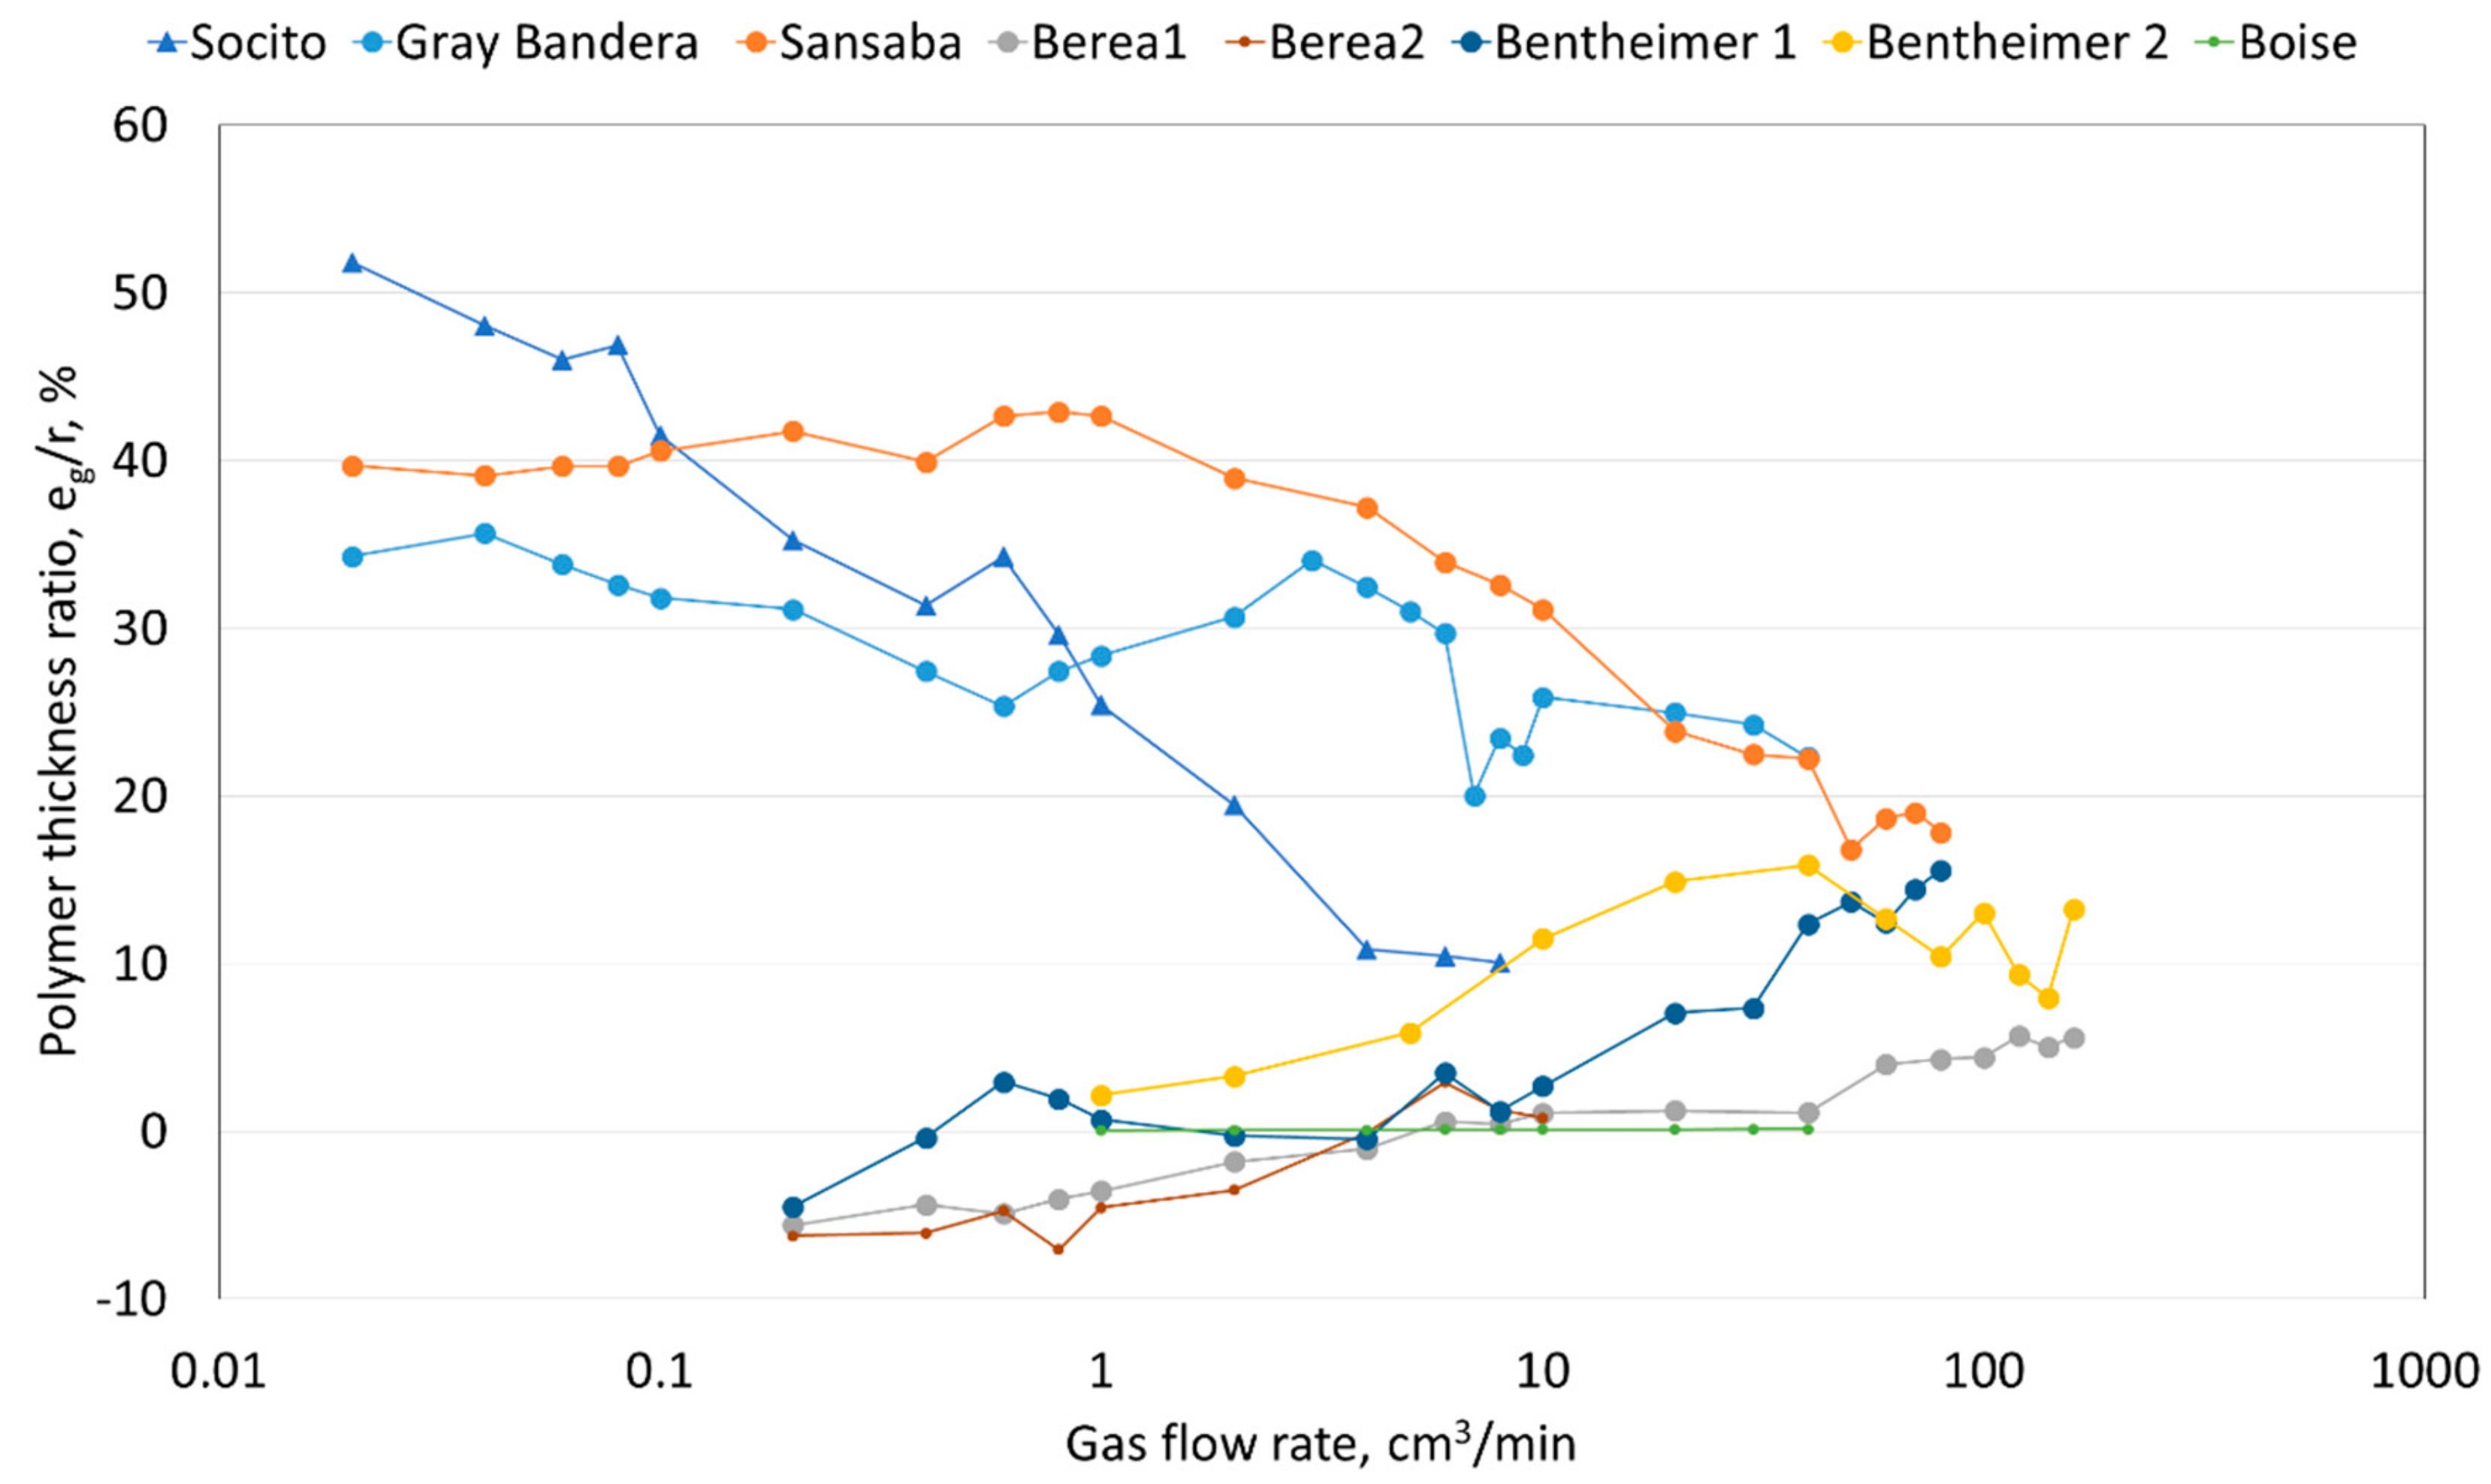
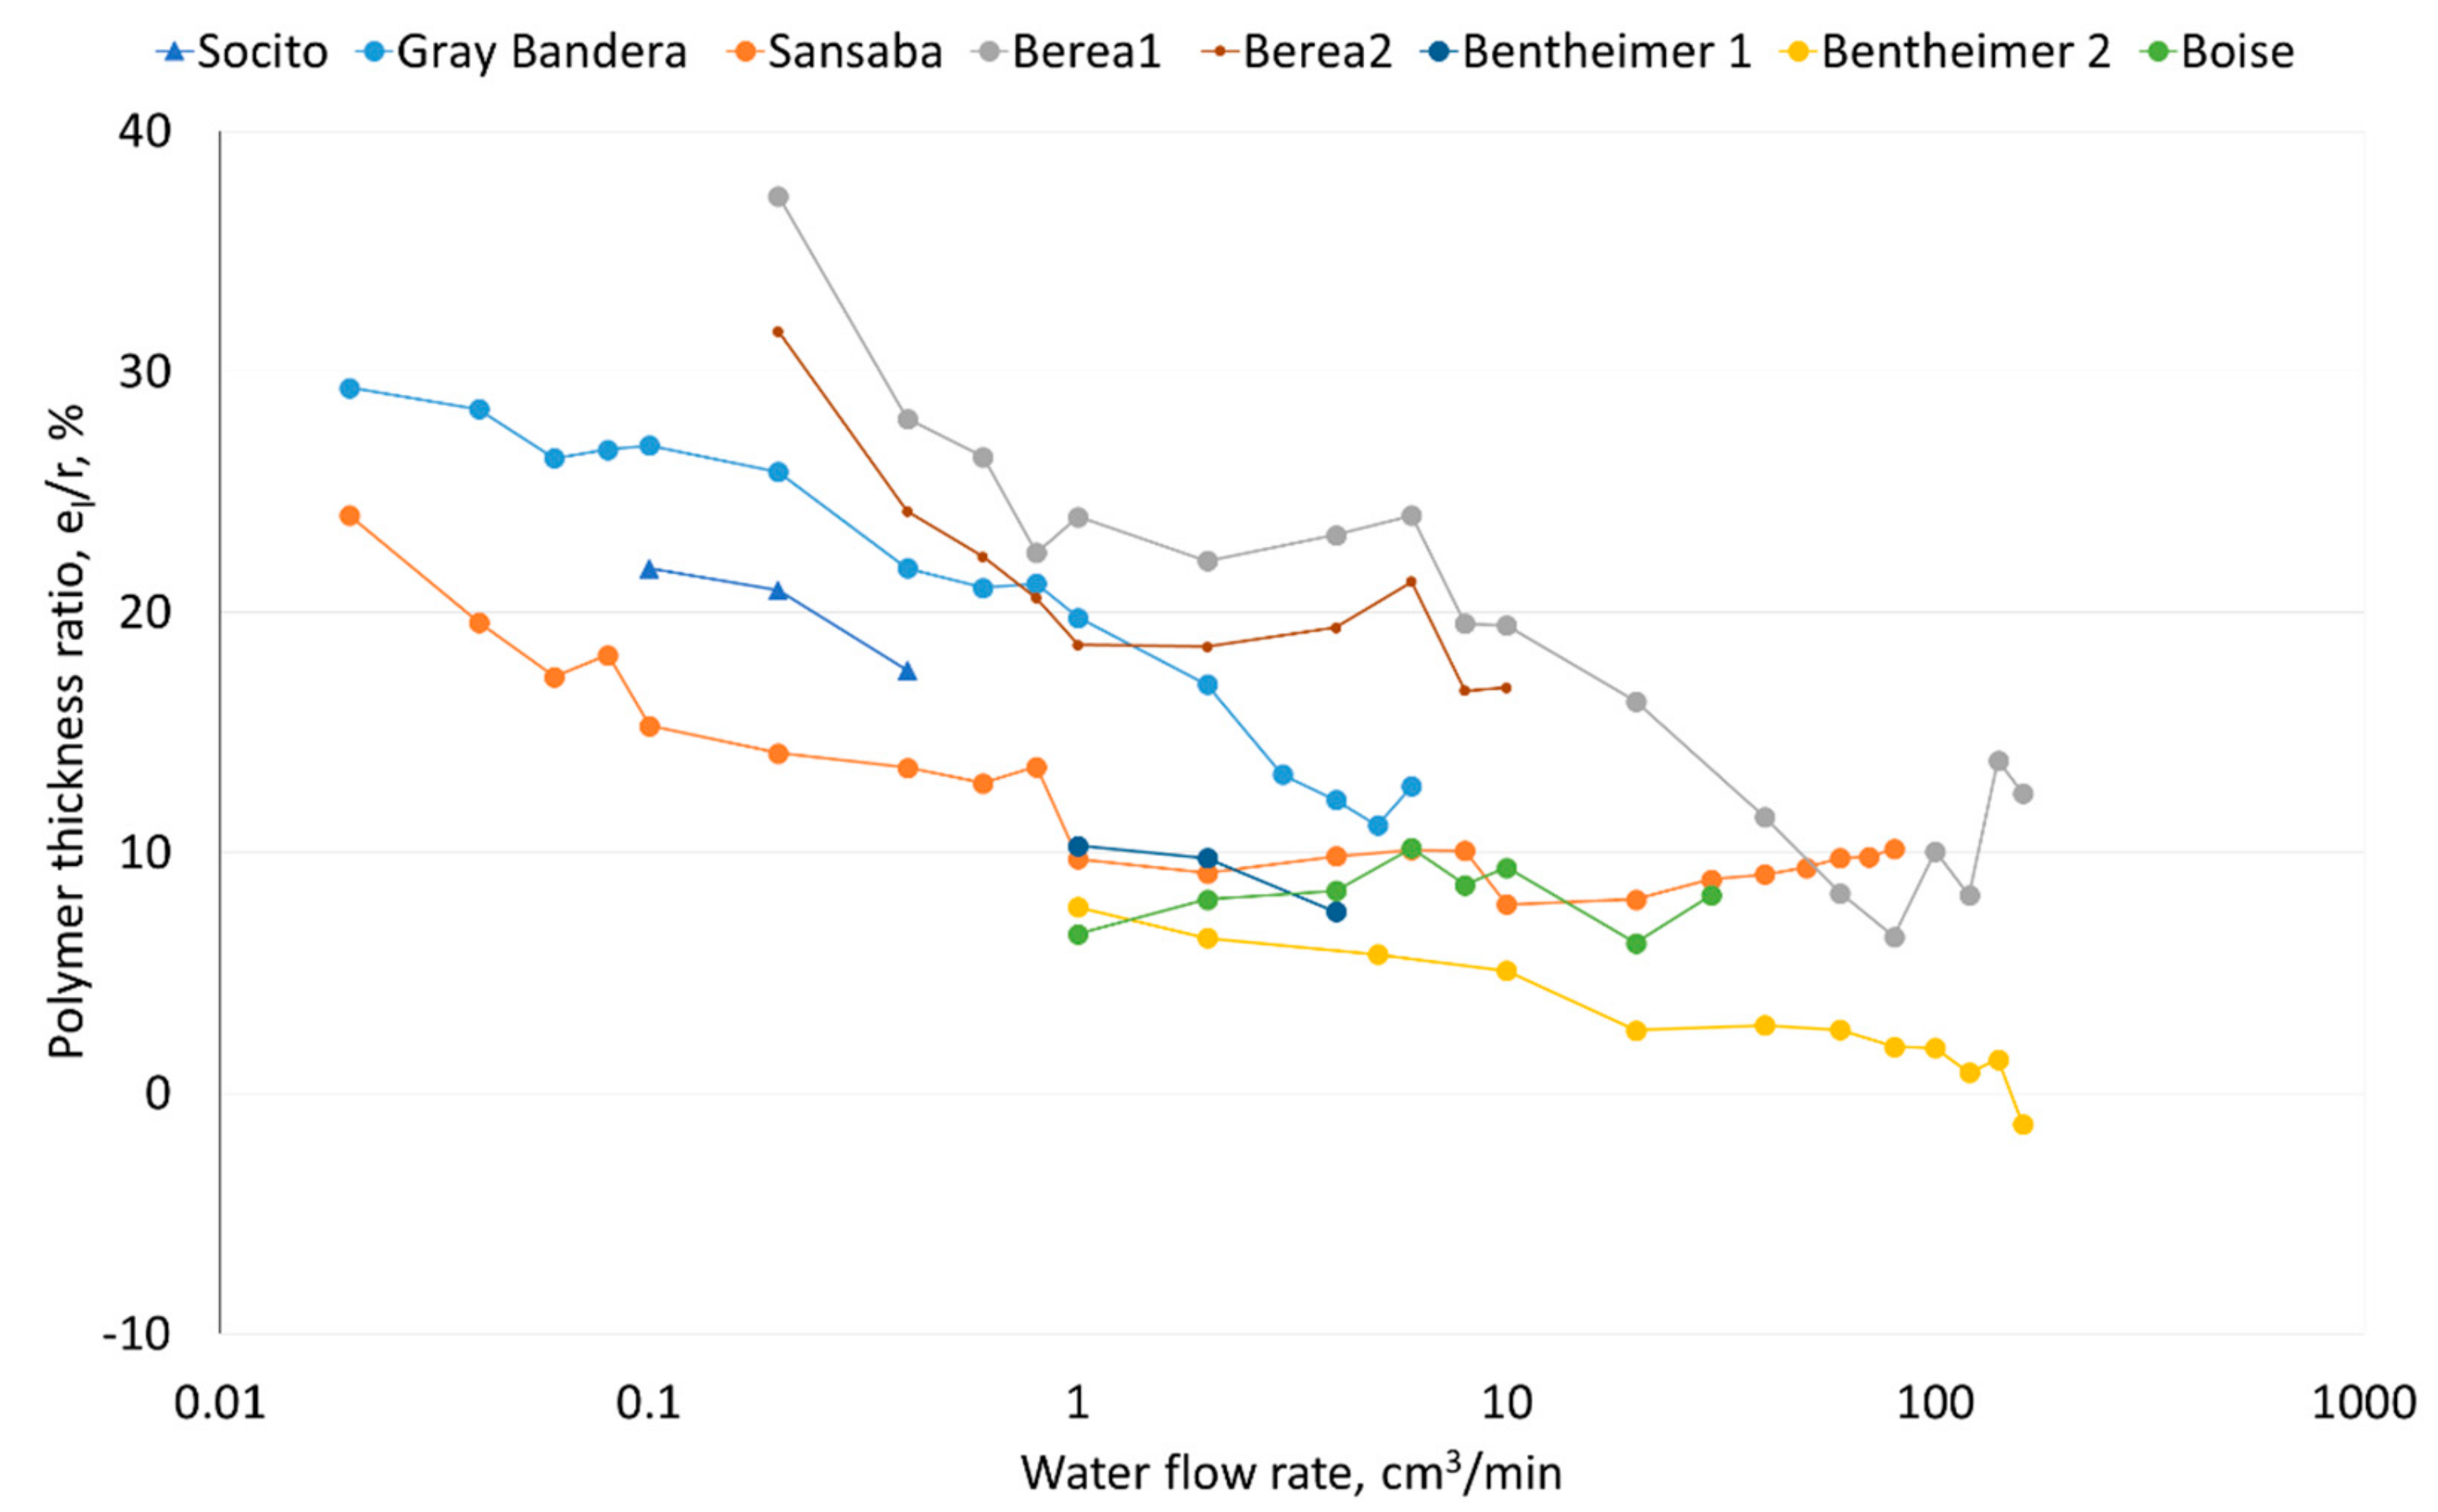
The low-permeability rocks witness the highest effect of polymer layer since, as also indicated in our earlier discussions, the ratio between the polymer thickness and the original pore radius () decreases with increasing the rock permeability. Such a general trend can be seen in the data plotted in Figure 8 and Figure 9. In Figure 8, for low-permeability rocks and at the lowest gas flow rate, the average ratio is about 42%, while it is in the negative region for the lowest flow rate tested in the moderate-permeability samples. Similar results about low-permeability rocks have also been reported by other researchers [57]. Park et al. treated low-permeability sandstone samples (41–56 mD) with 1500 ppm of a polymer. This treatment resulted in 3.34 of polymer layer thickness, where approximately 59.8% of the pre-treatment pore radius was blocked. As discussed earlier, these researchers also indicate that such an effect would result in a large permeability reduction to the non-wetting phase in particular. One overall conclusion from these results is that the the efficiency of an RPM treatment may strongly depend on the ratio of the adsorbed polymer layer thickness to original effective pore radius of the treated rock, which on its own is one of the major parameters controlling the rock permeability. Eventually, this may affect the relative permeability of water and gas differently in each permeability range.
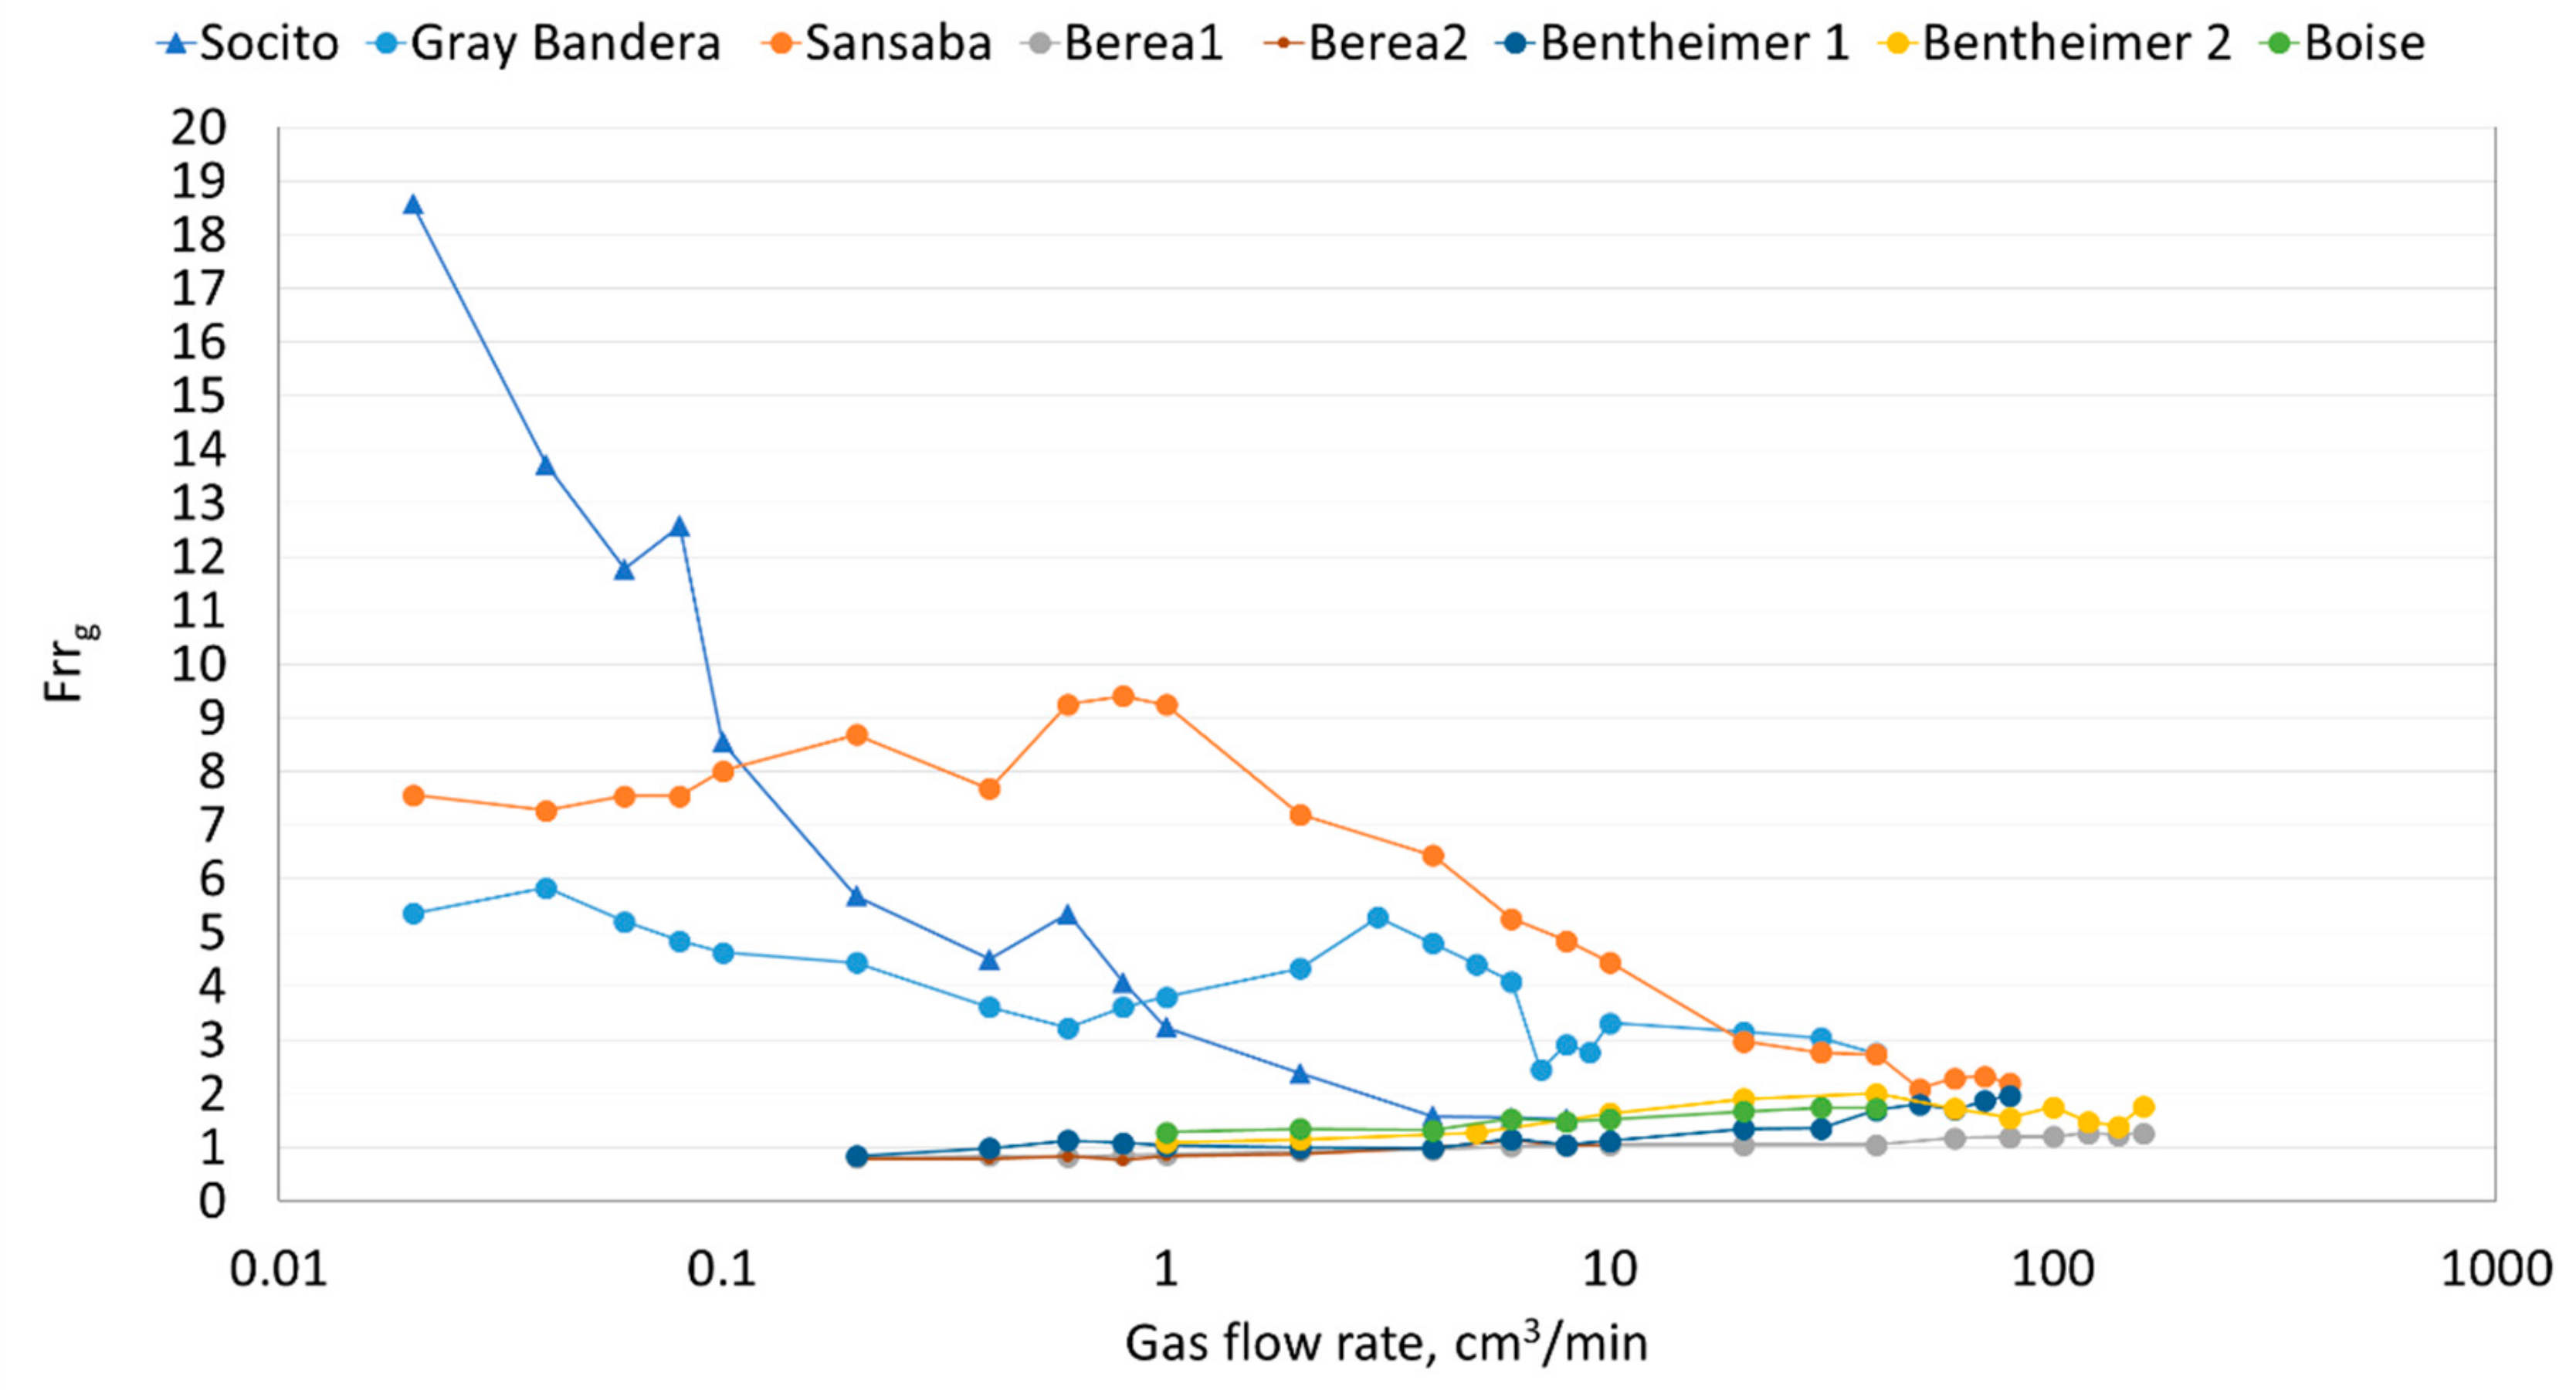
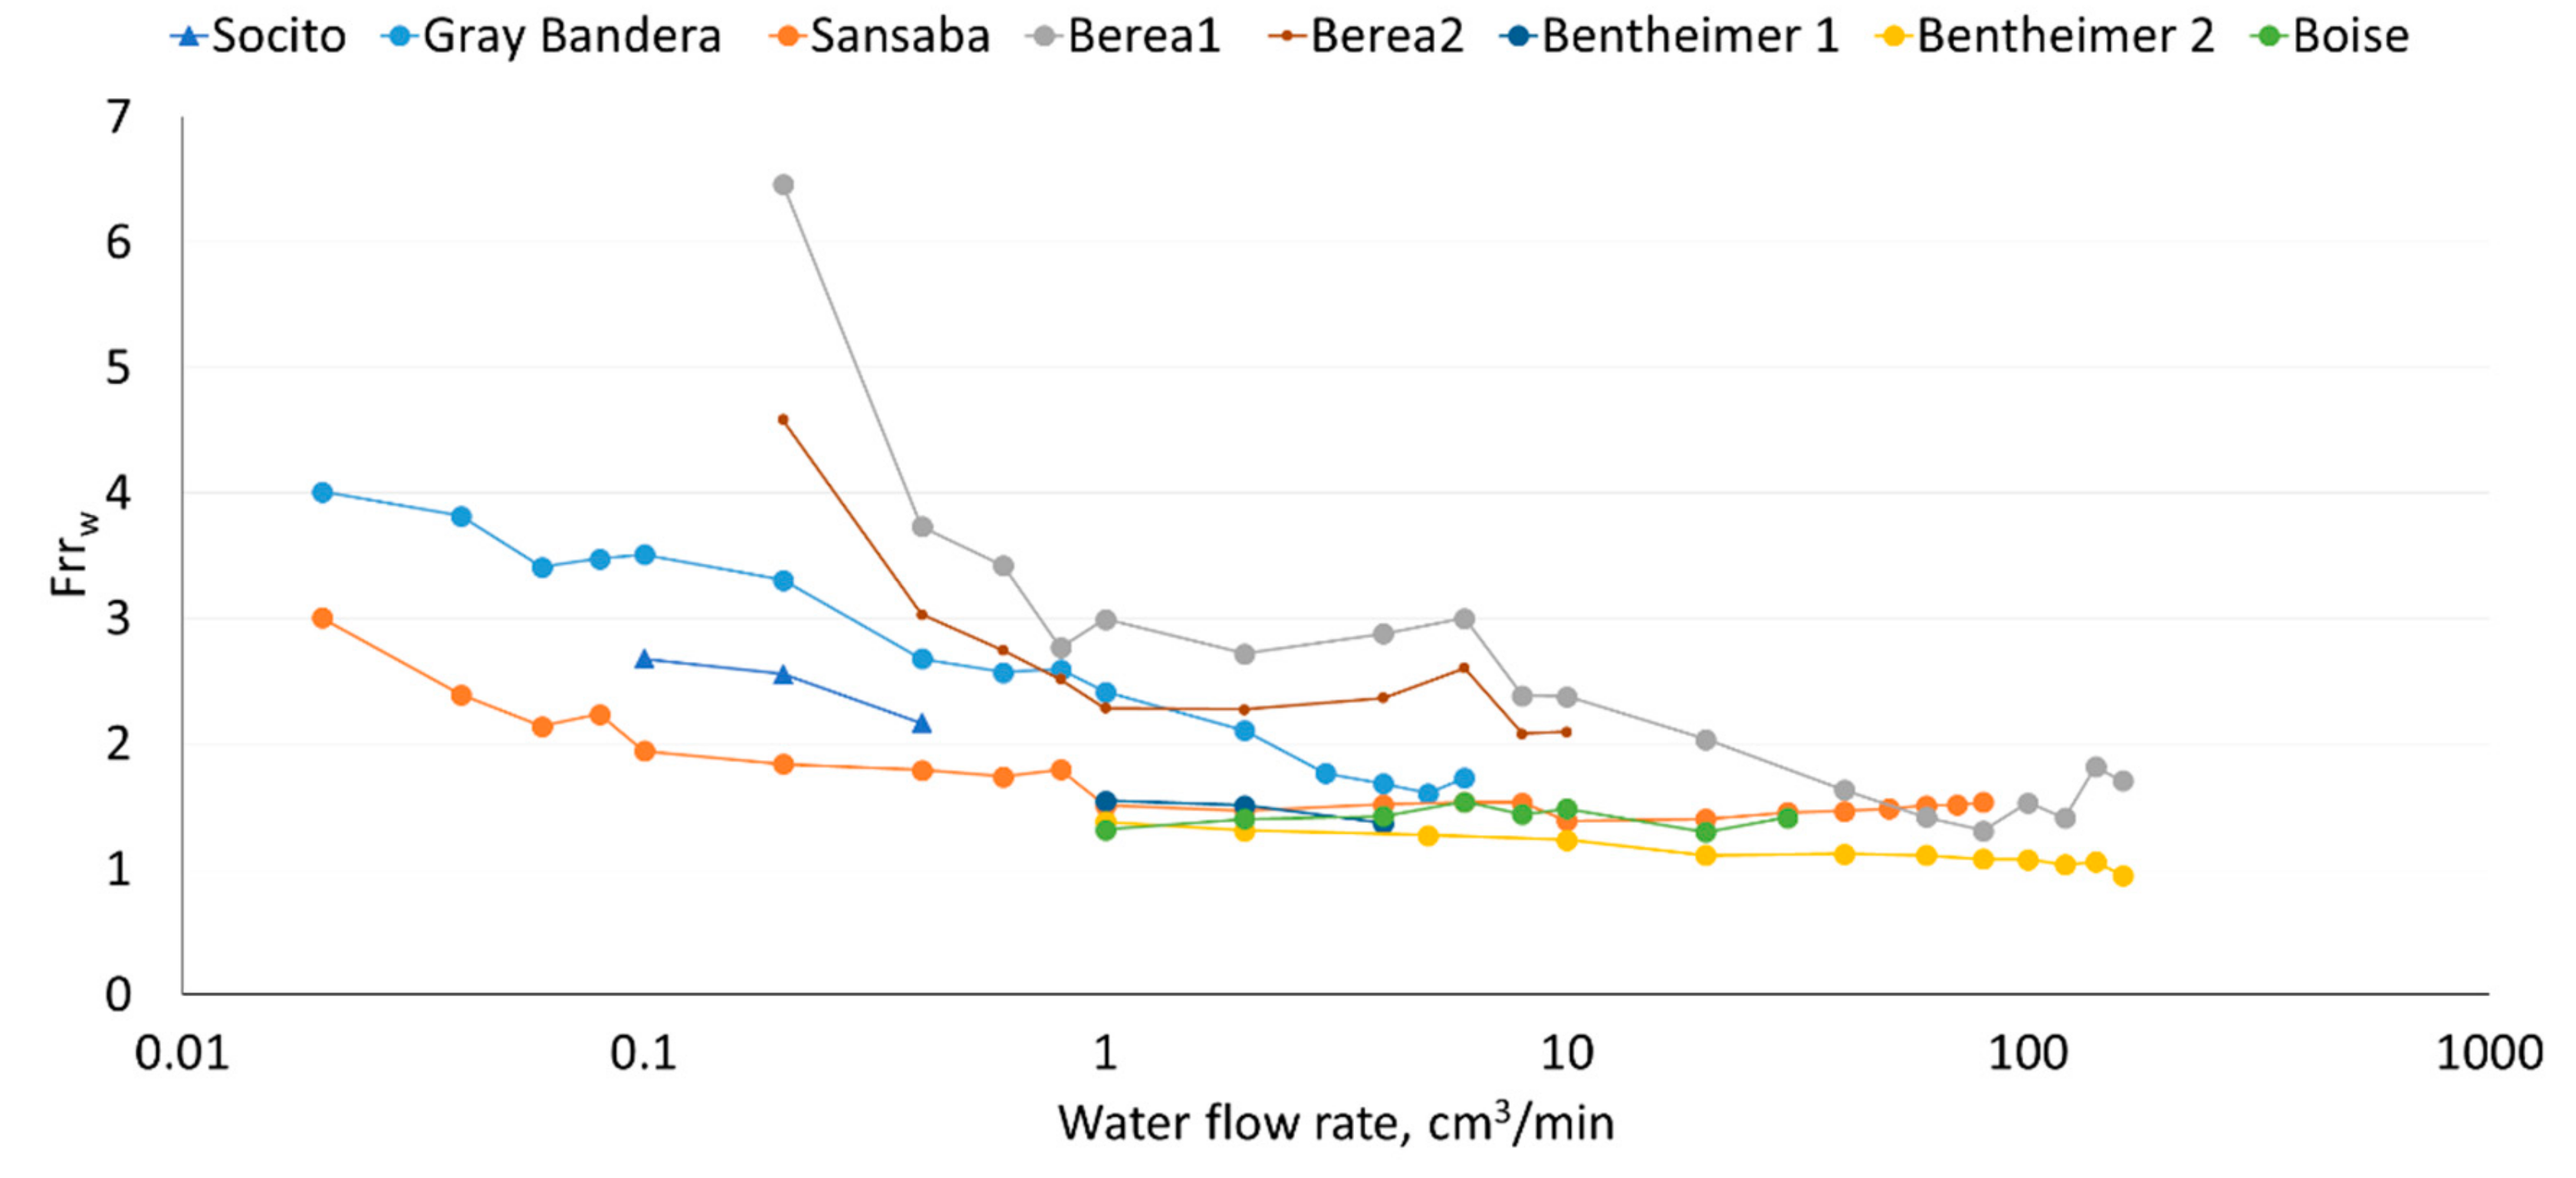
One more observation can be made from the data plotted in Figure 8 and Figure 9. As the gas flow rate increases, the polymer thickness ratio () changes sharply in low-permeability rocks. However, in moderate- and high-permeability rocks, this trend is much less steep. This behavior may be attributed, in general, to the fact that, at a fixed flow rate, the interstitial fluid velocity is higher in lower-permeability rock, which also has lower porosity. The higher velocity would tend to induce a higher force and cause the polymer layer to compress and therefore decrease in thickness. A similar behavior to that observed from the plots of polymer layer thickness ratio versus flow rate can be transcribed for the more commonly used treatment parameter of and , which are plotted in Figure 10 and Figure 11, respectively.
4. Summary and Conclusions
The major objective of this study is to add to the limited existing data and knowledge around the application of RPMs for the gas/water system in sandstone media. In this work, the effects of initial rock permeability on potential changes to the gas and water relative permeabilities due to an RPM treatment have been studied experimentally. In doing so, the traditional parameters of , , and have been used to evaluate the performance of the treatment. What is more, an attempt has been made to explain and interpret the observed trends between the above parameters and rock permeability using possible pore-scale events/mechanisms (e.g., relative pore size changes, redistribution of fluids, steric effect, lubrication effect, etc.) that may come to existence due to the RPM treatment.
According to our results and under the experimental conditions explored in this work, in the hig-permeability rocks (3001, 3488, and 5035 mD), the treatment may have no significant effect on either of the water and gas relative permeabilities. In low-permeability rocks (2.7, 22.7, and 66.4 mD), the treatment results in high gas relative permeability reductions, which are even greater than that induced to the water phase. This may imply that an RPM treatment using our particular polymer solution may be considered strongly unsuccessful in such rocks. In the moderate-permeability rocks (350 and 385 mD), however, the polymer treatment reduces water relative permeability significantly but either does not have much of effect on the gas phase or results in an improvement to the gas relative permeability at low gas flow rates.
The above trends may be attributed to the way an RPM treatment may alter the pore size distribution of a rock, which then impacts on how the wetting (water) and non-wetting (gas) phases may redistribute and flow in the newly modified pore system. The polymer layer thickness (), in general, may increase with increase in the rock permeability but the more important ratio of () is expected to decrease as it is a relative parameter whose value depends on the initial rock permeability. The results obtained in this work may be insightful in pointing out that the initial rock permeability may be used as an important screening parameter in planning an RPM treatment for gas producing wells.
Author Contributions
Conceptualization, F.A.-s. and A.S; investigation, F.A.-s.; methodology, F.A.-s. and A.S; writing—original draft preparation, F.A.-s.; writing—review and editing, A.S. and C.W.; supervision, A.S. and C.W.; formal analysis, F.A.-s., A.S., and Q.X.
Funding
This research received no external funding
Conflicts of Interest
The authors declare no conflict of interest.
Nomenclature
| the average hydrodynamic polymer layer thickness (μm) | |
| the average pore radius (μm) | |
| the residual resistance factor at the steady stage | |
| The effective porous radius (μm) | |
| Porosity | |
| Sgr | residual gas saturations |
| Swirr | irreducible water saturation |
| A | core surface (m2) |
| K | absolute permeability (μm2) |
| krg1 | the end-point relative permeability of gas before the treatment |
| krg2 | the end-point relative permeability of gas after the treatment |
| krw1 | the end-point relative permeability of water before the treatment |
| krw2 | the end-point relative permeability of water after the treatment |
| Q | inlet flow rate (m3.sec−1) |
| interstitial velocity, (cm/sec) | |
| Rei | Reynold’s number |
| Pc | capillary pressure |
| σ | interfacial tension |
Subscripts
w,g: water, gas.
References
- Wood, D.A. The natural gas sector is changing rapidly: Research and technology development remain the keys to overcoming challenges and unlocking opportunities. J. Nat. Gas Sci. Eng. 2016, 100, A1–A3. [Google Scholar] [CrossRef]
- Wood, D.A. Natural gas needs to compete more innovatively and cooperatively with coal and renewable energies to sustain growth. J. Nat. Gas Sci. Eng. 2016, 35, A1–A5. [Google Scholar] [CrossRef]
- Xu, B.; Yuan, B.; Wang, Y.; Zeng, S.; Yang, Y. Nanosilica-latex reduction carbonation-induced degradation in cement of CO2 geological storage wells. J. Nat. Gas Sci. Eng. 2019, 65, 237–247. [Google Scholar] [CrossRef]
- Li, W.; Lu, C. The multiple effectiveness of state natural gas consumption constraint policies for achieving sustainable development targets in China. Appl. Energy 2019, 235, 685–698. [Google Scholar] [CrossRef]
- Cascio, L.E.; de Schutter, B.; Schenone, C. Flexible energy harvesting from natural gas distribution networks through line-bagging. Appl. Energy 2018, 229, 253–263. [Google Scholar] [CrossRef]
- Khan, M.I.; Shahrestani, M.; Hayat, T.; Shakoor, A.; Vahdati, M. Life cycle (well-to-wheel) energy and environmental assessment of natural gas as transportation fuel in Pakistan. Appl. Energy 2019, 242, 1738–1752. [Google Scholar] [CrossRef]
- Qyyum, M.A.; Qadeer, K.; Haider, J.; Lee, M. Nitrogen self-recuperation expansion-based process for offshore coproduction of liquefied natural gas, liquefied petroleum gas, and pentane plus. Appl. Energy 2019, 235, 247–257. [Google Scholar] [CrossRef]
- Yang, L.-P.; Song, E.-Z.; Ding, S.-L.; Brown, R.J.; Marwan, N.; Ma, X.-Z. Analysis of the dynamic characteristics of combustion instabilities in a pre-mixed lean-burn natural gas engine. Appl. Energy 2016, 183, 746–759. [Google Scholar] [CrossRef]
- Chen, B.; Yang, M.; Sun, H.; Wang, P.; Wang, D. Visualization study on the promotion of natural gas hydrate production by water flow erosion. Fuel 2019, 235, 63–71. [Google Scholar] [CrossRef]
- Kalfayan, L.J.; Dawson, J.C. Successful implementation of resurgent Relative Permeability Modifier (RPM) technology in well treatments requires realistic expectations. In Proceedings of the SPE Annual Technical Conference and Exhibition, Houston, TX, USA, 26–29 September 2004. [Google Scholar]
- Pusch, G.; Kohler, N.; Kretzschmar, H. Practical Experience with Water Control in Gas Wells by Polymer Treatments. In Proceedings of the IOR 1995-8th European Symposium on Improved Oil Recovery, Vienna, Austria, 16–17 May 1995. [Google Scholar]
- Evans, R. Produced water management strategy with the aid of decision analysis. Paper SPE 66543 Presented at the SPE/EPA/DOE Exploration and Production Environmental Conference, San Antonio, TX, USA, 26–28 February 2001. [Google Scholar]
- Inikori, S.O. Numerical Study of Water Coning Control with Downhole Water Sink (DWS) Well Completions in Vertical and Horizontal Well. Master’s Thesis, Louisiana State University, Baton Rouge Benin City, Nigeria, 2002. [Google Scholar]
- Reynolds, D.B. Scarcity and Growth Considering Oil and Energy: an Alternative Neo-classical View; Edwin Mellen Press: New York, NY, USA, 2002. [Google Scholar]
- Mohanty, K.K. The near-term energy challenge. AIChE J. 2003, 49, 2454–2460. [Google Scholar] [CrossRef]
- Hajilary, N.; Sefti, M.V.; Koohi, A.D. Experimental study of water shutoff gel system field parameters in multi-zone unfractured gas-condensate reservoirs. J. Nat. Gas Sci. Eng. 2015. [Google Scholar] [CrossRef]
- Dovan, H.; Hutchins, R. New polymer technology for water control in gas wells. Spe Prod. Facil. 1994, 9, 280–286. [Google Scholar] [CrossRef]
- Elmkies, P.; Lasseux, D.; Bertin, H.; Pichery, T.; Zaitoun, A. Polymer effect on gas/water flow in porous media. In Proceedings of the SPE/DOE Improved Oil Recovery Symposium, Tulsa, OK, USA, 13–17 April 2002. [Google Scholar]
- Tielong, C.; Yong, Z.; Kezong, P.; Wanfeng, P. A relative permeability modifier for water control of gas wells in a low-permeability reservoir. Spe Reserv. Eng. 1996, 11, 168–173. [Google Scholar] [CrossRef]
- Ranjbar, M.; Schaffie, M. Improved treatment of acrylamide co-and terpolymers for water control in gas-producing and storage wells. J. Pet. Sci. Eng. 2000, 26, 133–141. [Google Scholar] [CrossRef]
- Zaitoun, A.; Pichery, T. A successful polymer treatment for water coning abatement in gas storage reservoir. In Proceedings of the SPE annual technical conference and exhibition, New Orleans, LA, USA, 30 September–3 October 2001. [Google Scholar]
- Zaltoun, A.; Kohler, N.; Guerrinl, Y. Improved polyacrylamide treatments for water control in producing wells. J. Pet. Technol. 1991, 43, 862–867. [Google Scholar] [CrossRef]
- Burrafato, G.; Pitoni, E.; Vietina, G.; Mauri, L.; Chiappa, L. Rigless WSO Treatments in Gas Fields. Bullheading Gels and Polymers in Shaly Sand: Italian Case Histories. In Proceedings of the SPE European Formation Damage Conference, The Hague, The Netherlands, 31 May–1 June 1999. [Google Scholar]
- Karimi, S.; Esmaeilzadeh, F.; Mowla, D. Identification and selection of a stable gel polymer to control or reduce water production in gas condensate fields. J. Nat. Gas Sci. Eng. 2014, 21, 940–950. [Google Scholar] [CrossRef]
- Lockhart, T.; Burrafato, G. Water production control with relative permeability modifiers. In Proceedings of the 16th World Petroleum Congress, Calgary, AB, Canada, 11–15 June 2000. [Google Scholar]
- Nieves, G.; Fernandez, J.; Dalrymple, E.D.; Sierra, L.; Eoff, L.; Reddy, B. Field application of relative permeability modifier in Venezuela. In Proceedings of the SPE/DOE Improved Oil Recovery Symposium, Tulsa, OK, USA, 13–17 April 2002. [Google Scholar]
- Song, Z.; Liu, L.; Wei, M.; Bai, B.; Hou, J.; Li, Z.; Hu, Y. Effect of polymer on disproportionate permeability reduction to gas and water for fractured shales. Fuel 2015, 143, 28–37. [Google Scholar] [CrossRef]
- Al-Shajalee, F.; Saeedi, A.; Wood, C. A New Dimensionless Approach to Assess Relative Permeability Modifiers. Energy Fuels 2019, 33, 3448–3455. [Google Scholar] [CrossRef]
- Chiappa, L.; Mennella, A.; Lockhart, T.P.; Burrafato, G. Polymer adsorption at the brine/rock interface: the role of electrostatic interactions and wettability. J. Pet. Sci. Eng. 1999, 24, 113–122. [Google Scholar] [CrossRef]
- Chiappa, L.; Mennalla, A.; Ortolani, M. Role of Polymer Adsorption and of Petrophysical Properties in Water-Cut Control Treatments by Polymer Injection in Gas Wells. In Proceedings of the IOR 1997-9th European Symposium on Improved Oil Recovery, Hague, The Netherlands, 20–22 October 1997. [Google Scholar]
- Mennella, A.; Chiappa, L.; Bryant, S.L.; Burrafato, G. Pore-scale mechanism for selective permeability reduction by polymer injection. In Proceedings of the SPE/DOE Improved Oil Recovery Symposium, Tulsa, OK, USA, 19–22 April 1998. [Google Scholar]
- Sharifpour, E.; Escrochi, M.; Riazi, M.; Ayatollahi, S. On the importance of gel rigidity and coverage in a smart water shutoff treatment in gas wells. J. Nat. Gas Sci. Eng. 2016, 31, 808–818. [Google Scholar] [CrossRef]
- Zaitoun, A.; Kohler, N. Two-phase flow through porous media: effect of an adsorbed polymer layer. In Proceedings of the SPE Annual Technical Conference and Exhibition, Houston, TX, USA, 2–5 October 1988. [Google Scholar]
- Zaitoun, A.; Bertin, H.; Lasseux, D. Two-phase flow property modifications by polymer adsorption. In Proceedings of the SPE/DOE improved oil recovery symposium, Tulsa, OK, USA, 19–22 April 1998. [Google Scholar]
- Dawe, R.A.; Zhang, Y. Mechanistic study of the selective action of oil and water penetrating into a gel emplaced in a porous medium. J. Pet. Sci. Eng. 1994, 12, 113–125. [Google Scholar] [CrossRef]
- Grattoni, C.A.; Al-Sharji, H.H.; Yan, C.; Muggeridge, A.H.; Zimmerman, R.W. Rheology and Permeability of Crosslinked Polyacrylamide Gel. J. Colloid Interface Sci. 2001, 240, 601–607. [Google Scholar] [CrossRef] [PubMed]
- Mishra, S.; Bera, A.; Mandal, A. Effect of polymer adsorption on permeability reduction in enhanced oil recovery. J. Pet. Eng. 2014. [Google Scholar] [CrossRef] [Green Version]
- Al-Sharji, H.H.; Grattoni, C.A.; Dawe, R.A.; Zimmerman, R.W. Flow of oil and water through elastic polymer gels. Oil Gas Sci. Technol. Rev. D Ifp Energ. Nouv. 2001, 56, 145–152. [Google Scholar] [CrossRef] [Green Version]
- Al-Sharji, H.H.; Grattoni, C.A.; Dawe, R.A.; Zimmerman, R.W. Pore-Scale Study of the Flow of Oil and Water through Polymer Gels; Society of Petroleum Engineers: Houston, TX, USA, 1999. [Google Scholar]
- Cohen, Y.; Christ, F. Polymer retention and adsorption in the flow of polymer solutions through porous media. Spe Reserv. Eng. 1986, 1, 113–118. [Google Scholar] [CrossRef]
- Saphiannikova, M.G.; Pryamitsyn, V.A.; Cosgrove, T. Self-Consistent Brownian Dyn. Simul. Polym. Brushes Under Shear. Macromol. 1998, 31, 6662–6668. [Google Scholar]
- Grattoni, C.A.; Jing, X.D.; Zimmerman, R.W. Disproportionate Permeability Reduction When a Silicate Gel is Formed In-Situ to Control Water Production; Society of Petroleum Engineers: Houston, TX, USA, 2001. [Google Scholar]
- Zhang, T.; Li, X.; Sun, Z.; Feng, D.; Miao, Y.; Li, P.; Zhang, Z. An analytical model for relative permeability in water-wet nanoporous media. Chem. Eng. Sci. 2017, 174, 1–12. [Google Scholar] [CrossRef]
- Qi, Z.; Wang, Y.; Liu, C.; Yu, W.; Wang, S.; Li, K. A Laboratory Evaluation of a Relative Permeability Modifier for Water Production Control. Pet. Sci. Technol. 2013, 31, 2357–2363. [Google Scholar] [CrossRef]
- Jinxiang, L.; Xiangguo, L.; Jingfa, L.; Shuqiong, H.; Baoqing, X. Mechanism and gelling effects of linked polymer solution in the core. Pet. Explor. Dev. 2013, 40, 507–513. [Google Scholar]
- Nasralla, R.A.; Nasr-El-Din, H.A. Impact of cation type and concentration in injected brine on oil recovery in sandstone reservoirs. J. Pet. Sci. Eng. 2014, 122, 384–395. [Google Scholar] [CrossRef]
- Blum, A.E.; Lasaga, A.C. The Role of Surface Speciation in the Dissolution of Albite. Geochim. Et Cosmochim. Acta 1991, 55, 2193–2201. [Google Scholar] [CrossRef]
- Shehata, A.M.; Nasr-El-Din, H.A. Zeta potential measurements: Impact of salinity on sandstone minerals. In Proceedings of the SPE International Symposium on Oilfield Chemistry, The Woodlands, TX, USA, 13–15 April 2015. [Google Scholar]
- Montillet, A.; Comiti, J.; Legrand, J. Determination of structural parameters of metallic foams from permeametry measurements. J. Mater. Sci. 1992, 27, 4460–4464. [Google Scholar] [CrossRef]
- White, J.; Goddard, J.; Phillips, H. Use of polymers to control water production in oil wells. J. Pet. Technol. 1973, 25, 143–150. [Google Scholar] [CrossRef]
- Kuo, J. Practical design calculations for groundwater and soil remediation; CRC Press: Boca Raton, FL, USA, 2014. [Google Scholar]
- Ogunberu, A.L.; Asghari, K. Water permeability reduction under flow-induced polymer adsorption. J. Can. Pet. Technol. 2004, 44. [Google Scholar] [CrossRef]
- Zheng, C.; Gall, B.; Gao, H.; Miller, A.; Bryant, R. Effects of polymer adsorption and flow behavior on two-phase flow in porous. In Proceedings of the SPE/DOE Improved Oil Recovery Symposium, Tulsa, OK, USA, 19–22 April 1998. [Google Scholar]
- Tekin, N.; Demirbaş, Ö.; Alkan, M. Adsorption of cationic polyacrylamide onto kaolinite. Microporous Mesoporous Mater. 2005, 85, 340–350. [Google Scholar] [CrossRef]
- Tekin, N.; Dinçer, A.; Demirbaş, Ö.; Alkan, M. Adsorption of cationic polyacrylamide (C-PAM) on expanded perlite. Appl. Clay Sci. 2010, 50, 125–129. [Google Scholar] [CrossRef]
- Noik, C.; Audibert, A. New polymers for high salinity and high temperature. In Proceedings of the 7th IOR European Symposium, Moscow, Russia, 27–29 October 1993. [Google Scholar]
- Park, H.; Han, J.; Sung, W. Effect of polymer concentration on the polymer adsorption-induced permeability reduction in low permeability reservoirs. Energy 2015, 84, 666–671. [Google Scholar] [CrossRef]
Figure 1.
The relative permeability modifier (RPM) solution exhibits a Newtonian shear thickening behavior.
Figure 1.
The relative permeability modifier (RPM) solution exhibits a Newtonian shear thickening behavior.

Figure 2.
Schematic diagram of the core flooding setup.

Figure 3.
Behavior of water and gas residual resistance factors ( and ) versus initial rock permeability (Socito (2.7 mD); Gray Bandera (22.7 mD); SanSaba (66.4 mD); Berea1 (350 mD); Berea2 (385 mD); Bentheimer1 (3001); Bentheimer2 (3488); and Boise (5035 mD).
Figure 3.
Behavior of water and gas residual resistance factors ( and ) versus initial rock permeability (Socito (2.7 mD); Gray Bandera (22.7 mD); SanSaba (66.4 mD); Berea1 (350 mD); Berea2 (385 mD); Bentheimer1 (3001); Bentheimer2 (3488); and Boise (5035 mD).

Figure 4.
Behavior of residual resistance factor ratio (/) against initial rock permeability (Socito (2.7 mD); Gray Bandera (22.7 mD); SanSaba (66.4 mD); Berea1 (350 mD); Berea2 (385 mD); Bentheimer1 (3001); Bentheimer2 (3488); and Boise (5035 mD).
Figure 4.
Behavior of residual resistance factor ratio (/) against initial rock permeability (Socito (2.7 mD); Gray Bandera (22.7 mD); SanSaba (66.4 mD); Berea1 (350 mD); Berea2 (385 mD); Bentheimer1 (3001); Bentheimer2 (3488); and Boise (5035 mD).

Figure 5.
The effect of pore sizes distribution on fluid phases distribution before (b) and after (a) the RPM treatment.
Figure 5.
The effect of pore sizes distribution on fluid phases distribution before (b) and after (a) the RPM treatment.

Figure 6.
Change in polymer layer thickness versus gas flow rate in different rock samples (eg: The adsorbed polymer layer thickness calculated for the gas injection stage).
Figure 6.
Change in polymer layer thickness versus gas flow rate in different rock samples (eg: The adsorbed polymer layer thickness calculated for the gas injection stage).

Figure 7.
Change in polymer layer thickness versus water flow rate in different rock samples (el: The adsorbed polymer layer thickness calculated for the water injection stage).
Figure 7.
Change in polymer layer thickness versus water flow rate in different rock samples (el: The adsorbed polymer layer thickness calculated for the water injection stage).

Figure 8.
Change in the polymer thickness ratio versus gas flow rate.

Figure 9.
Change in the polymer thickness ratio versus water flow rate.

Figure 10.
Variation in the gas residual resistance factor () versus gas flow rate.

Figure 11.
Variation in the water residual resistance factor () versus water flow rate.


Table 1.
Basic petrophysical characteristics of core samples as categorized based on their permeability. The error of the permeability measurements is about mD, 0.1 mD, and 5 mD for the low-, moderate-, and high-permeability ranges, respectively.
Table 1.
Basic petrophysical characteristics of core samples as categorized based on their permeability. The error of the permeability measurements is about mD, 0.1 mD, and 5 mD for the low-, moderate-, and high-permeability ranges, respectively.
| Sample No. | Sample Name | Contact Angle (±2°) | Porosity, % (±0.1%) | Nitrogen Permeability, mD | Permeability Category |
|---|---|---|---|---|---|
| 1 | Socito | 2.9 | 17.7 | 2.7 | Low |
| 2 | Gray Bandera | 0.7 | 20.0 | 22.7 | |
| 3 | San Saba | 1.3 | 19.5 | 66.4 | |
| 4 | Berea1 | 2.4 | 21.9 | 350.0 | Moderate |
| 5 | Berea2 | 2.4 | 21.0 | 385.0 | |
| 6 | Bentheimer1 | 2.4 | 23.0 | 3001 | High |
| 7 | Bentheimer2 | 2.4 | 24.0 | 3488 | |
| 8 | Boise | 1.0 | 29.0 | 5035 |
Table 2.
Mineralogy of rock samples determined using XRD analysis.
| Rock Name | Socito | Gray Bandera | San Saba | Berea | Bentheimer | Boise |
|---|---|---|---|---|---|---|
| Phase | Weight% | |||||
| Quartz | 88.2 | 57.7 | 91.5 | 81.2 | 91.1 | 37.3 |
| Microcline | 1.8 | 1.3 | 2.3 | 4.8 | 6 | 21.1 |
| Kaolin | 5.2 | 5.4 | 3.3 | 5.7 | 2.9 | - |
| Illite/Muscovite | 1.2 | 10.2 | 0.9 | 4.5 | - | 10.7 |
| Albite | 2.7 | 18.8 | 1.9 | 3.0 | - | 29 |
| Dolomite | 0.8 | 3.9 | - | 0.5 | - | - |
| Calcite | - | 0.2 | - | 0.3 | - | - |
| Chlorite | 0.8 | 2.5 | - | - | - | - |
| Stilbite | - | - | - | - | - | 2 |
Table 3.
The relative permeability modifiers (RPM) agent used in this study.
| Name | Poly(acrylamide-co-diallyldimethylammonium chloride) |
|---|---|
| Molecular Structure |  |
| Formula | (C8H16ClN)n.(C3H5NO)m |
| Molecular Weight | 25,000 g/mole |
| Density | 1.02 g/cm3 at 25 °C |
| Manufacturer | Sigma-Aldrich |
Table 4.
The average , , and / calculated over the 1–4 cc/min flow rate range.
| Rock Name | Porosity, % | Initial Permeability, mD | r, μm (Equation (4)) | Permeability Category | Frrg | Frrw | Frrw/Frrg |
|---|---|---|---|---|---|---|---|
| Socito | 17.66 | 2.7 | 0.17 | Low | 6.20 | 2.35 | 0.40 |
| Gray Bandera | 20.0 | 22.7 | 0.58 | 4.60 | 2.00 | 0.45 | |
| San Saba | 19.5 | 66.4 | 1.10 | 7.60 | 1.44 | 0.20 | |
| Berea1 | 21.0 | 350.0 | 4.20 | Moderate | 0.928 | 2.86 | 4.20 |
| Berea2 | 21.0 | 385.0 | 4.10 | 0.90 | 2.3 | 2.6 | |
| Bentheimer1 | 23.0 | 3001 | 5.80 | High | 1.00 | 1.75 | 1.75 |
| Bentheimer2 | 24.0 | 3488 | 11.40 | 1.17 | 1.21 | 1.04 | |
| Boise | 29.0 | 5035 | 16.00 | 1.32 | 1.38 | 1.05 |
Table 5.
Literature review on the outcome of RPM treatment in moderate-permeability rocks (100–1000 mD).
Table 5.
Literature review on the outcome of RPM treatment in moderate-permeability rocks (100–1000 mD).
| Literature | Non-Wetting Phase | Wetting Phase | Rock Type | Permeability, mD | RPM Agent and Concentration | Frrw | Frrg |
|---|---|---|---|---|---|---|---|
| [18,23] | Gas | Brine | Sandstone | 318 | Polyacrylamide, nonionic, 2500 ppm | 21 | 1.7 |
| [23] | Gas | Brine | Sandpack | 203 | Polyacrylamide, Cationic, 2000 ppm | 5.1 | 1.3 |
| 380 | 7.1 | 1.1 | |||||
| [30] | Gas | Brine | Sandstone | 120 | Polyacrylamide, Cationic, 2000 ppm | 5.6 | 2.1 |
| 330 | Polyacrylamide, Non-ionic, 2000 ppm | 3.8 | 1.5 | ||||
| 690 | Polyacrylamide, Cationic, 2000 ppm | 4.5 | 1.3 |
Table 6.
Outcome of literature review on treating moderate (100–1000 mD) to high (>1000 mD) permeability rocks.
Table 6.
Outcome of literature review on treating moderate (100–1000 mD) to high (>1000 mD) permeability rocks.
| Literature | Non-Wetting Phase | Wetting Phase | Rock Type | Permeability, mD | RPM Agent and Concentration | Frrw | Frro/Frrg |
|---|---|---|---|---|---|---|---|
| [31] | Gas | Brine | Sandstone | 900 | Plyacrylarnide, cationic, 2000 ppm | 10 | 1.2 |
| 2000 | 1.9 | 1.1 | |||||
| Oil | 600 | 2.6 | 1.1 | ||||
| 2000 | 1.8 | 1 | |||||
| [44] | Oil | Brine | Sandstone | 263 | Plyacrylarnide, cationic, 2000 ppm | 7.7 | 1.84 |
| 578 | 6.8 | 1.49 | |||||
| 1139 | 5.3 | 1.41 | |||||
| 2300 | 5 | 1.35 |
© 2019 by the authors. Licensee MDPI, Basel, Switzerland. This article is an open access article distributed under the terms and conditions of the Creative Commons Attribution (CC BY) license (http://creativecommons.org/licenses/by/4.0/).
Share and Cite
MDPI and ACS Style
Al-shajalee, F.; Wood, C.; Xie, Q.; Saeedi, A. Effective Mechanisms to Relate Initial Rock Permeability to Outcome of Relative Permeability Modification. Energies 2019, 12, 4688. https://doi.org/10.3390/en12244688
AMA Style
Al-shajalee F, Wood C, Xie Q, Saeedi A. Effective Mechanisms to Relate Initial Rock Permeability to Outcome of Relative Permeability Modification. Energies. 2019; 12(24):4688. https://doi.org/10.3390/en12244688
Chicago/Turabian StyleAl-shajalee, Faaiz, Colin Wood, Quan Xie, and Ali Saeedi. 2019. "Effective Mechanisms to Relate Initial Rock Permeability to Outcome of Relative Permeability Modification" Energies 12, no. 24: 4688. https://doi.org/10.3390/en12244688
Note that from the first issue of 2016, this journal uses article numbers instead of page numbers. See further details here.