Article

Collection Characteristic of Nanoparticles Emitted from a Diesel Engine with Residual Fuel Oil and Light Fuel Oil in an Electrostatic Precipitator

Department of Electrical and Electronic Engineering, Kanagawa Institute of Technology, Kanagawa 243-0292, Japan
*
Author to whom correspondence should be addressed.
Energies 2019, 12(17), 3321; https://doi.org/10.3390/en12173321
Submission received: 29 June 2019 / Revised: 24 August 2019 / Accepted: 24 August 2019 / Published: 28 August 2019
(This article belongs to the Special Issue Plasma Processes for Renewable Energy Technologies)

Abstract

:
The purpose of this study was to investigate the collection characteristics of nanoparticles emitted from a diesel engine in an electrostatic precipitator (ESP). The experimental system consisted of a diesel engine (400 cc) and an ESP; residual fuel oil and light fuel oil were used for the engine. Although, the peak value of distribution decreased as the applied voltage increased due to the electrostatic precipitation effect, the particle concentration, at a size of approximately 20 nm, increased compared with that at 0 kV, in the exhaust gas, from the diesel engine with residual fuel oil. However, the efficiency increased by optimizing the applied voltage, and the total collection efficiency in the exhaust gas, using the residual fuel oil, was 91%. On the other hand, the particle concentration, for particle diameters smaller than 20 nm, did not increase in the exhaust gas from the engine with light fuel oil.

1. Introduction

Although a renewable energy sources, such as biodiesel are effective in preventing global warming, it is necessary to remove particle emission. Nanoparticles are included in various diesel exhaust gases from diesel automobiles [1], power generation engines, marine diesel engines, and construction machines. These particles can penetrate into alveoli and are harmful to human health. Thus, electrostatic precipitators (ESPs) have been used or developed to negate these effects.
ESPs have been used to clean gas emissions from diesel automobiles in road tunnels [2]. The collection efficiency estimated by dust weight reached 90% at a gas speed of 9 m/s. Ehara et al. [3] investigated the collection of nanoparticles emitted from a diesel engine, with light fuel oil, in order to improve an ESP for road tunnels, and the efficiency for nanoparticles, with a size between 20 and 800 nm, was greater than 90% at a gas speed of 10 m/s.
ESPs have also been developed for power generators, farm engines, construction machines, and marine diesel engines. An ESP combined with an after-cyclone dust collector [4], a system with a mechanical filter located after an ESP [5], and an electrostatic cyclone diesel particulate filter (DPF) for marine engines [6], were proposed. However, the nanoparticle collection efficiency was not investigated. Kuroki et al. [7] reported the removal performance of nanoparticles (polystyrene latex) in a wet-type discharge plasma reactor, and showed a high collection efficiency greater than 99%. Mizuno et al. [8,9] investigated the effects of gas temperature and the addition of a DPF on collecting diesel nanoparticles in an ESP. Kim et al. [10,11,12] investigated the submicron particulate matter (PM) removal of an ESP, combined with a metallic filter for diesel engines and the nanoparticle collection of a novel two-stage type ESP, using KCl particles. Yamamoto and Ehara [13,14] suggested an electrohydrodynamic (EHD) assisted ESP, and a hole-type ESP, respectively. They measured the collection efficiency for nanoparticles emitted from diesel engines with light fuel oil. Authors have investigated nanoparticle collection efficiency for exhaust gas from a diesel engine with residual fuel oil [15]. As described so far, there are some studies on nanoparticle collection efficiency. However, the influence of the kind of fuel oil, applied voltage on nanoparticle collection efficiency, and efficiency for particles smaller than 20 nm, were not fully investigated.
In this study, we carried out an experiment using exhaust gases from a diesel engine, with residual and light fuel oils, to clarify the collection characteristics of nanoparticles in an ESP.

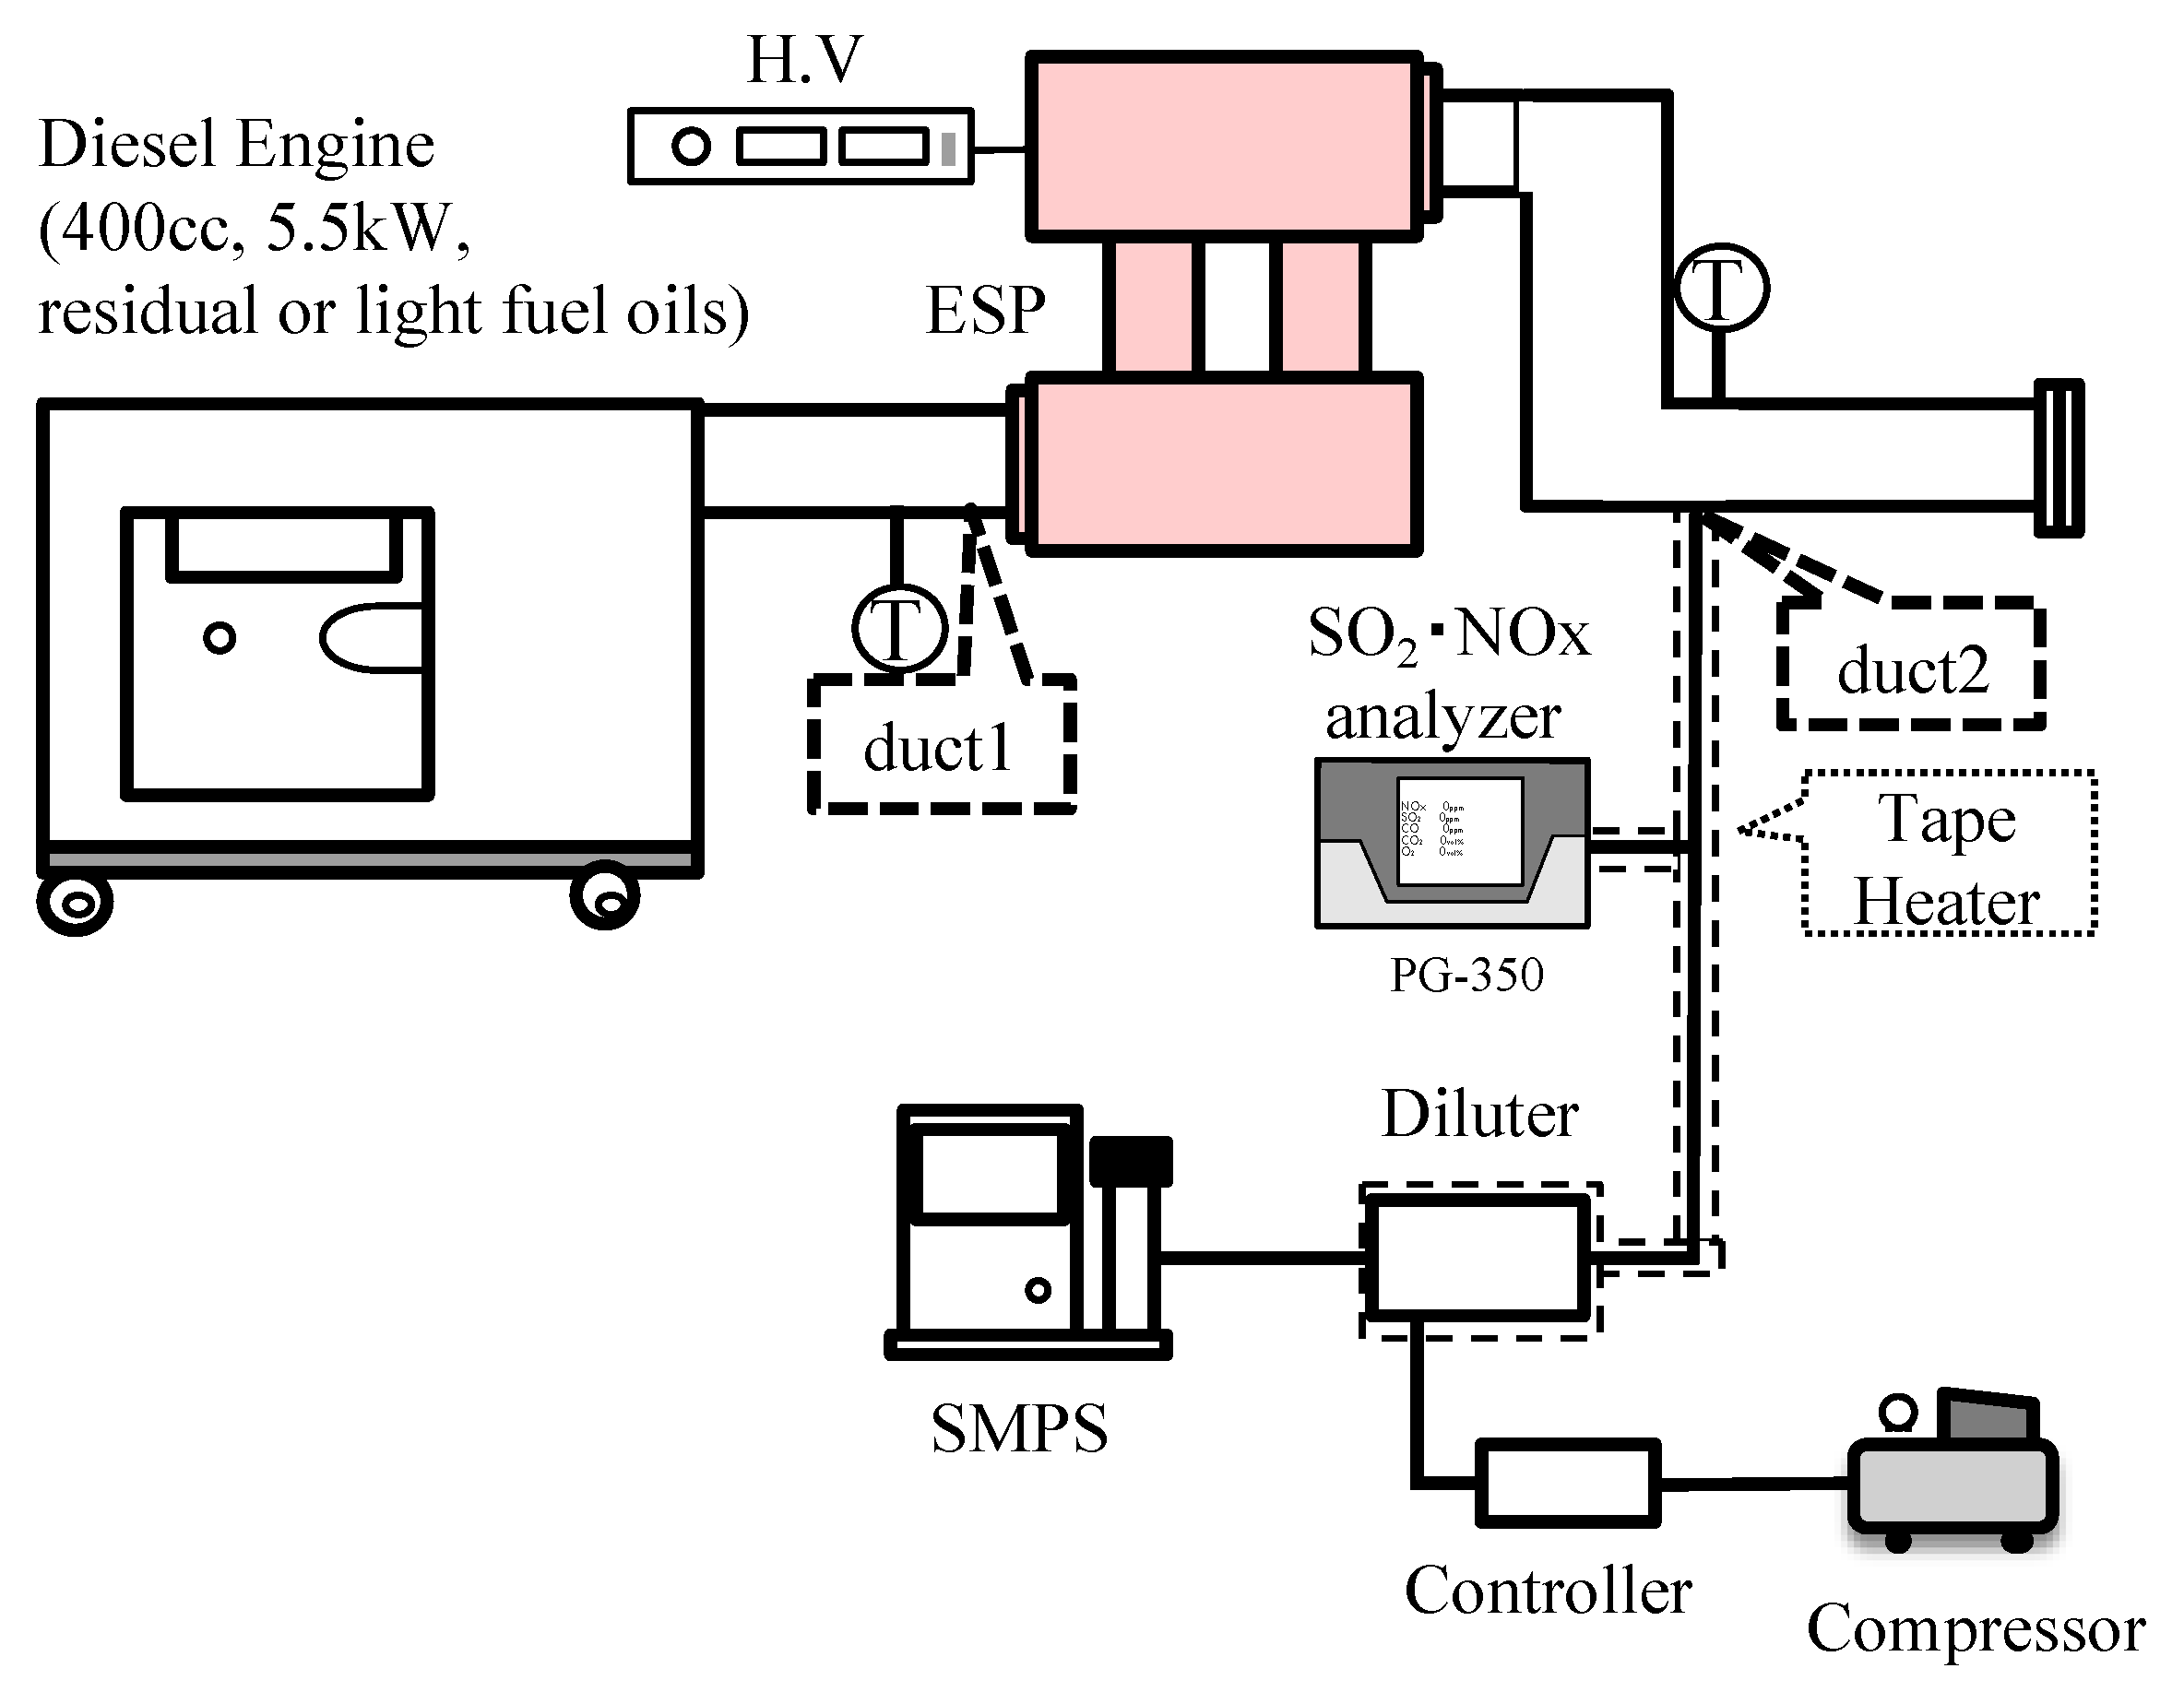
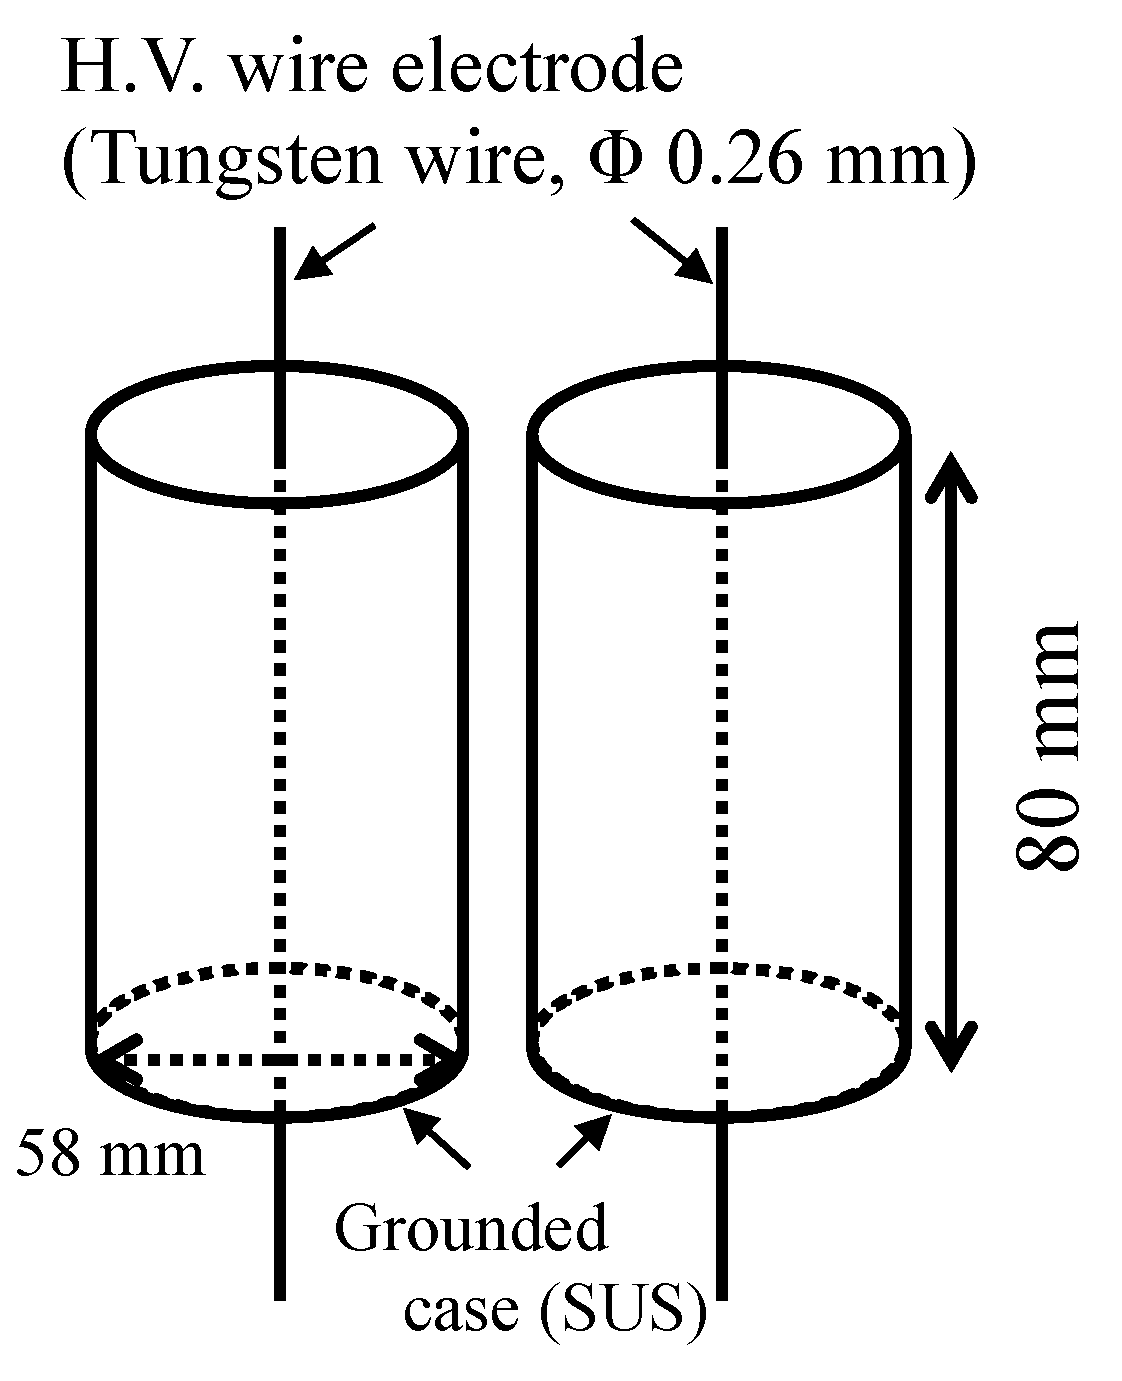
2. Experimental Setup

The schematic of the experimental system is shown in Figure 1. The system consists of a diesel engine (DA-3100SS-IV, 400 cc, 5.5 kW output, 0% load; Denyo Co., Ltd., Tokyo, Japan) and an ESP. Residual fuel oil (ENEOS LSA; sulfur content: 0.61%) and light fuel oil (ENEOS; sulfur content: 0.0009%) were used. The temperature of the exhaust gas was between 130 °C and 150 °C, and the gas temperature inside the ESP was between 70 and 80 °C. The wind velocity inside the ESP was 2.4 m/s.
Figure 2 shows the structure of the ESP. It has a coaxial cylinder structure consisting of the grounded case (stainless; length: 80 mm; inner diameter: 58 mm) and high-voltage application wire electrode (tungsten; diameter: 0.26 mm). Negative or positive DC high voltage is applied to the wire electrode.
A portion of the gas in the duct (2.7 L/min) was drawn to measure the particle size distribution. The temperature of the sampling tube was controlled using the heater so that it would be equal to the temperature of the gas in the duct, in order to prevent cooling of the sampling tube, which could cause condensation inside the tube and change the rate of the components. The sampled gas was cooled to room temperature, after 10-fold dilution by the diluter (Palas KHG-2010 heatable dilution system), at the same temperature as the exhaust gas. It is considered that the vapor content in a gas is diluted to less than the saturated vapor content after the gas is cooled, whereby condensation hardly occurs. Although the diluter and dilution ratio were different from this equipment, Kim et al. [16,17] used a similar sampling and measurement system. The particle size distribution was measured using a scanning mobility particle sizer (SMPS) (Model 3936, TSI, Shoreview, MN, USA). The SMPS can measure the particle concentration for diameters between 6 nm and 200 nm. The collection efficiency η was calculated by Equation (1),
η = { 1 ( N N 0 ) } × 100 %
where N is the particle number concentration (parts/m3) after applying the voltage, and N0 is the particle number concentration (parts/m3) before applying the voltage.
To measure the SO2 and NOx concentrations using an analyzer (PG-350, Horiba, Kyoto, Japan), a portion of the exhaust gas was drawn from the duct and diluted by the diluter at the same temperature as the exhaust gas. The SO2 concentration was measured by the infrared absorbing method, with a measurement limit of 2 ppm. The NOx concentration was measured by the chemiluminescence detector, with a measurement limit of 2.5 ppm.

3. Results and Discussion

3.1. Influence of Fuel Oil on Distribution

The relationship between the applied voltage and the discharge current in the exhaust gas, when residual and light fuel oil were used, is shown in Figure 3. The polarity of the voltage was negative. The corona onset voltage was approximately 5 kV, and the spark voltage was 15 kV or 16 kV at the residual fuel oil. Although the corona onset voltage and spark voltage at the light fuel oil were almost the same, the discharge current was slightly greater than that at the residual fuel oil. The cause of this requires future study.
The size distribution of various applied voltages in negative polarity when residual fuel oil is used is shown in Figure 4. The distribution at a voltage of 0 kV had a peak value of 7.0 × 10¹² parts/m3 at a size of 76 nm. The peak value decreased as the applied voltage increased, and that was 2.6 × 10¹¹ parts/m3 at 10 kV, due to the electrostatic precipitation effect. The collection efficiency was approximately 96%. However, the concentration at a size of 16 nm at 8 kV increased to 7.0 × 10¹¹ parts/m3, and at a size of 20 nm at 10 kV increased to 3.4 × 10¹² parts/m3.
Thus, the experiment was carried out using the light fuel oil to investigate the reason for this. The particle size distribution for various applied voltages when light fuel oil was used is shown in Figure 5. The distribution at a voltage of 0 kV had a peak of 2.3 × 10¹² parts/m3 at a size of 79 nm. The particle concentration at 79 nm decreased to 4.2 × 10¹¹ parts/m3, due to the electrostatic precipitation effect at a voltage of 10 kV. Furthermore, the particle concentration of approximately 20 nm did not increase, compared with Figure 4.
It is known whether nanoparticles are generated through a binary homogeneous nucleation and ion-induced nucleation in corona discharge [18,19]. Kim et al. [20,21] showed that particle concentration increased due to the ion-induced nucleation, caused by H2O and the binary homogeneous nucleation from the effects of SO2. H2SO4/H2O particles were generated due to the interaction between SO2 and OH radicals generated by the ionization of H2O. This influence increased with increasing SO2 and H2O concentrations [19,22], as well as the addition of NO2 [22]. On the other hand, Yohaness et al. [23] showed that the particle concentration, generated by corona discharge, decreased when NO2 was added to SO2/H2O/air mixed gas. Thus, the SO2 and NOx concentrations were measured in this study. The analysis of the components in the exhaust gas revealed that the SO2 concentration in the exhaust gas, using residual fuel oil, was 37 ppm, whereas it was less than 2 ppm in the case of light fuel oil. However, the measurement limit of the SO2 analyzer was 2 ppm. The NOx concentration in the exhaust gas, using residual fuel oil, was 149 ppm, and the concentration using light fuel oil was 120 ppm. Therefore, the increased concentration for a particle size of approximately 20 nm in the exhaust gas, using residual fuel oil, may be due to the generation of H2O particles and H2SO4/H2O particles. H2SO4 molecules are generated from H2O and OH in corona discharge. H2SO4 molecules easily convert to H2SO4/H2O particles, due to binary homogeneous nucleation when H2O particles, which are generated by ion-induced nucleation, are present in the gas.

3.2. Influence of Polarity on Distribution

It has been shown in Figure 4 that the particle concentration, at a size of approximately 20 nm, increased due to corona discharge. Thus, the influence of the polarity of the applied voltage in the exhaust gas, when residual fuel oil is used, was investigated.
The relationship between the applied voltage and the discharge current, when negative and positive voltages were individually applied, is shown in Figure 6. The corona onset voltage at the negative corona discharge was approximately 5 kV, and the spark voltage was between 15 kV and 16 kV. The onset voltage at the positive corona discharge was approximately 6 kV, and the spark was generated at 13 kV or 14 kV. Compared with the result of the negative corona discharge, the corona onset voltage was greater, and the spark voltage was smaller, at the positive corona discharge.
Although the peak value of the size distribution in negative polarity, at a voltage of 0 kV, decreased as the applied voltage increased, and the concentration at 20 nm size increased, as shown in Figure 4. The size distribution for various applied voltages in positive polarity is shown in Figure 7. The overall tendency was similar to the result in negative polarity, as shown in Figure 4. However, nanoparticle generation occurred from 8 kV at negative polarity, but it did not occur at 8 kV at the positive polarity. This is considered to be caused by the corona discharge current at the positive polarity, less than that at the negative polarity, as shown in Figure 6.
A comparison between the results of negative and positive polarities, at a voltage of 10 kV, is shown in Figure 8. Figure 8a shows a comparison of the size distributions. In this Figure, the size distributions of both polarities, at 0 kV were not the same, so it is difficult to investigate the influence of polarity on the increased particle concentration of approximately 20 nm. Therefore, the enhancement rate α is defined as Equation (2):
α = N/N0
where N is the particle number concentration (parts/m3) after applying the voltage, and N0 is the particle number concentration (parts/m3) before applying the voltage.
Figure 8b shows a comparison of the enhancement rates between negative and positive polarities. The enhancement rate was calculated from the average concentrations, as shown in Figure 8a, thus the error bar is not indicated in Figure 8b. The maximum enhancement rate at negative polarity was 30 at a size of 16 nm, and that at positive polarity was 22 at a size of 13 nm. This result indicates that the increased nanoparticles, due to the corona discharge in negative polarity, is greater than that in positive polarity. Nagato et al. [19] reported that the increase of particles in positive polarity was greater than that in negative polarity, which was different from our result. Although, their experiment was carried out with the same discharge current, the experiment in this study was at the same voltage. This is most likely option, because the discharge current in the negative corona is greater than that in the positive corona at the same voltage, as shown in Figure 6. The reason why sharp peaks occurred at different size ranges needs to be investigated in the future.

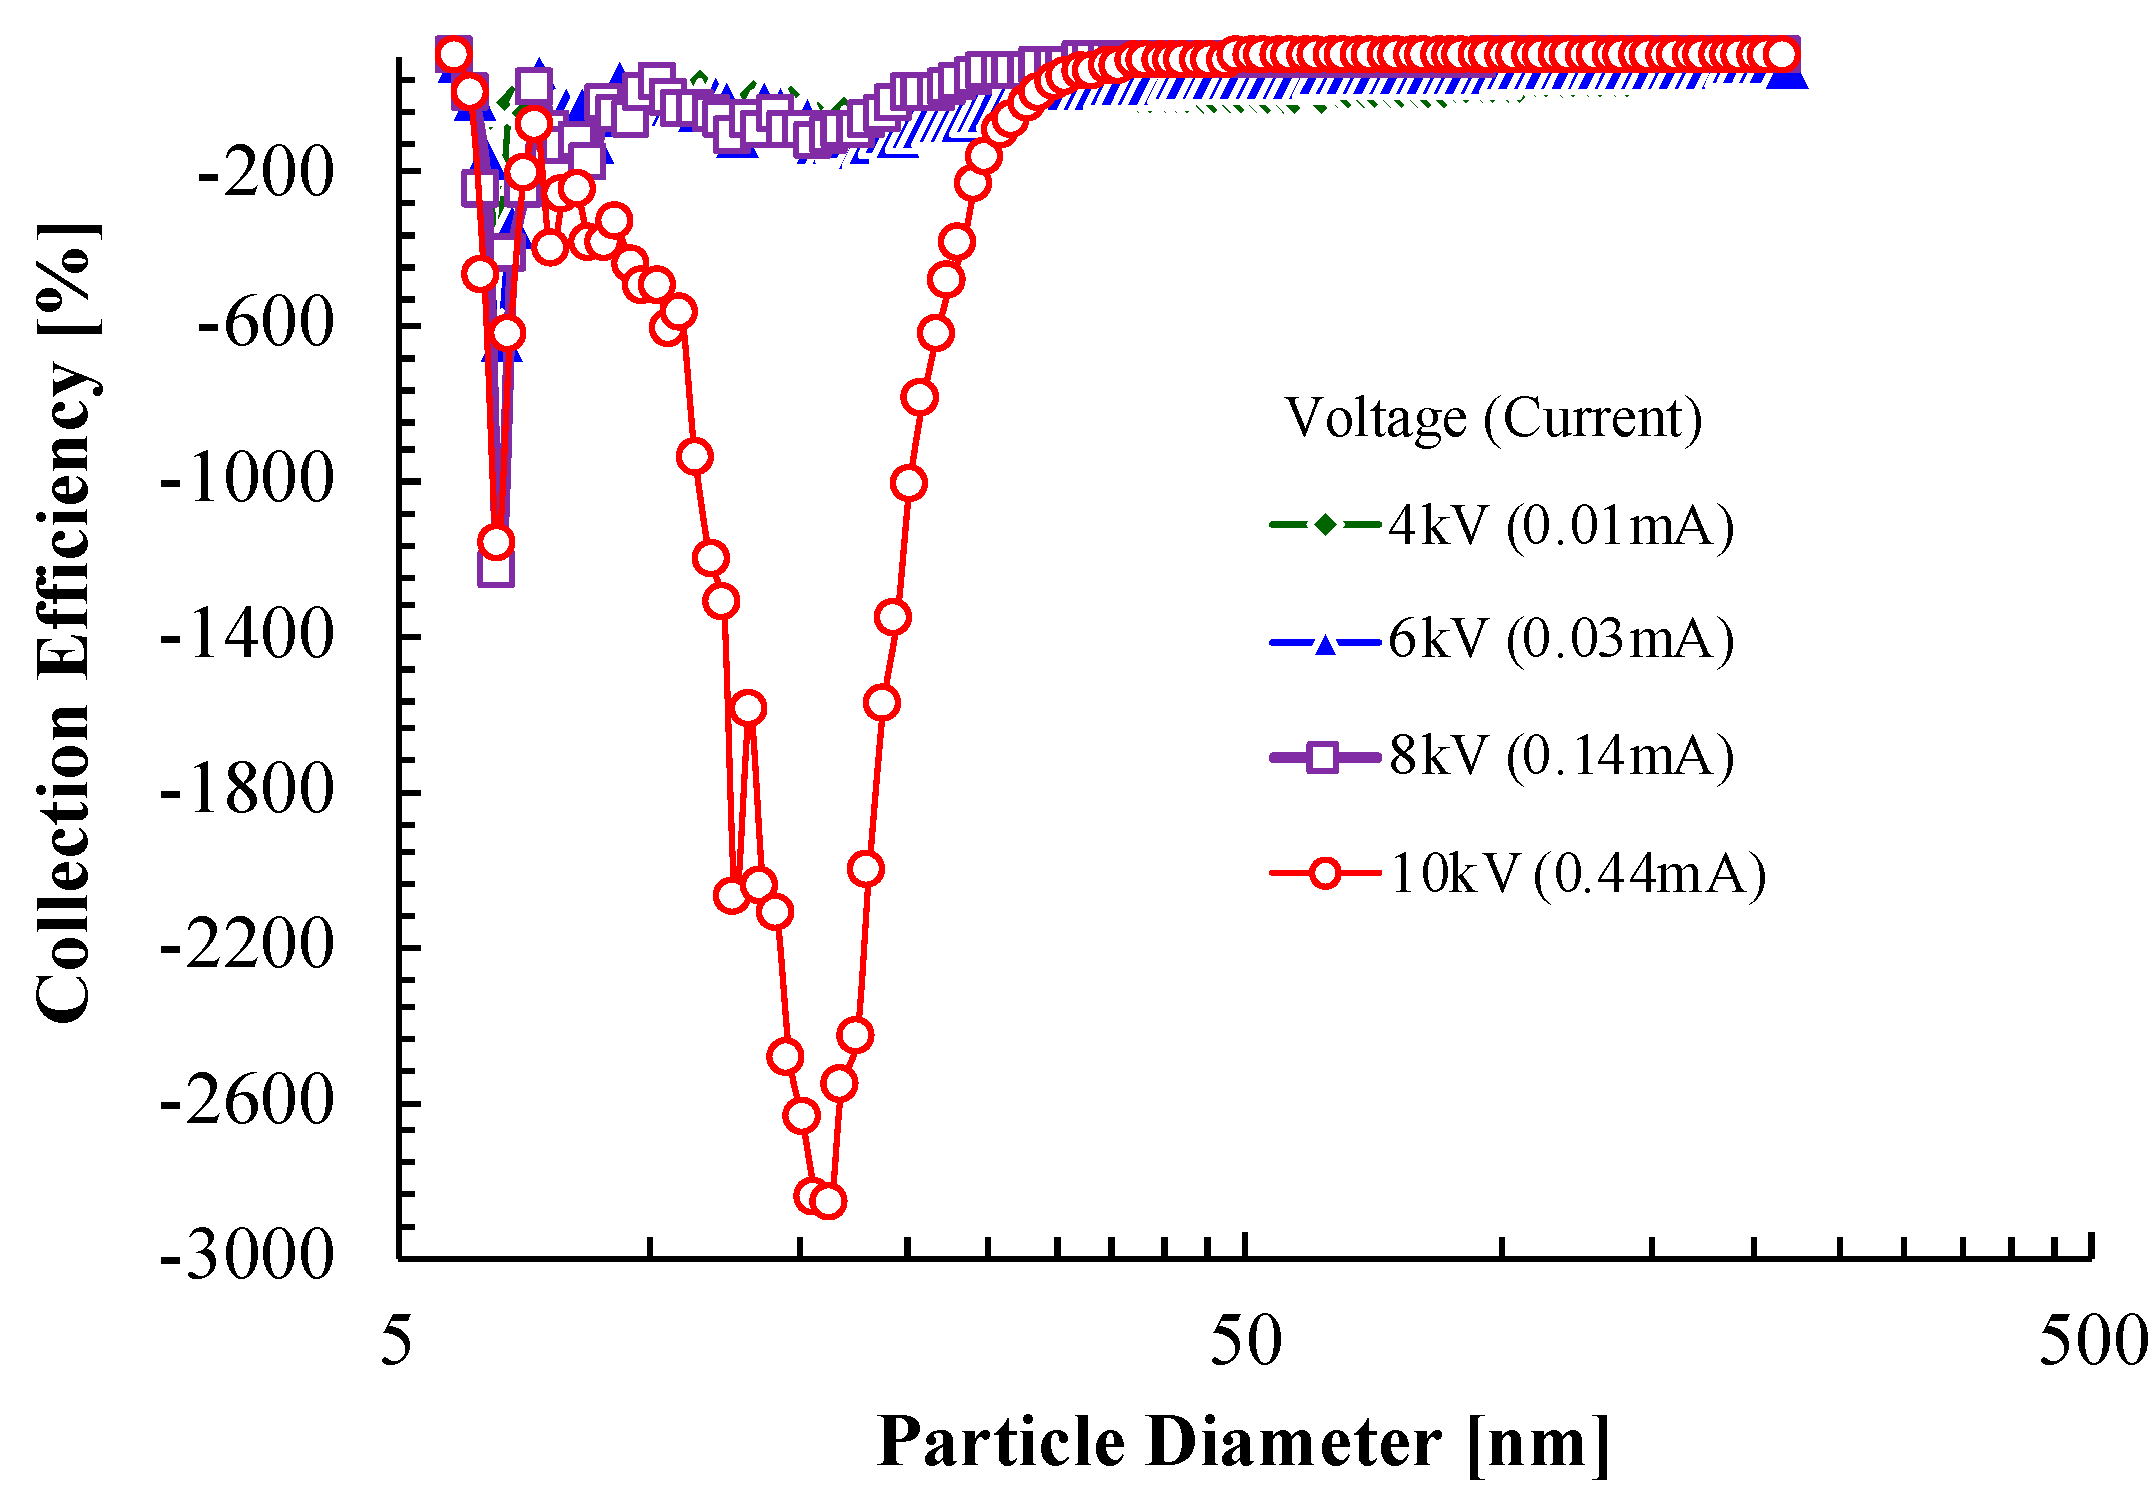
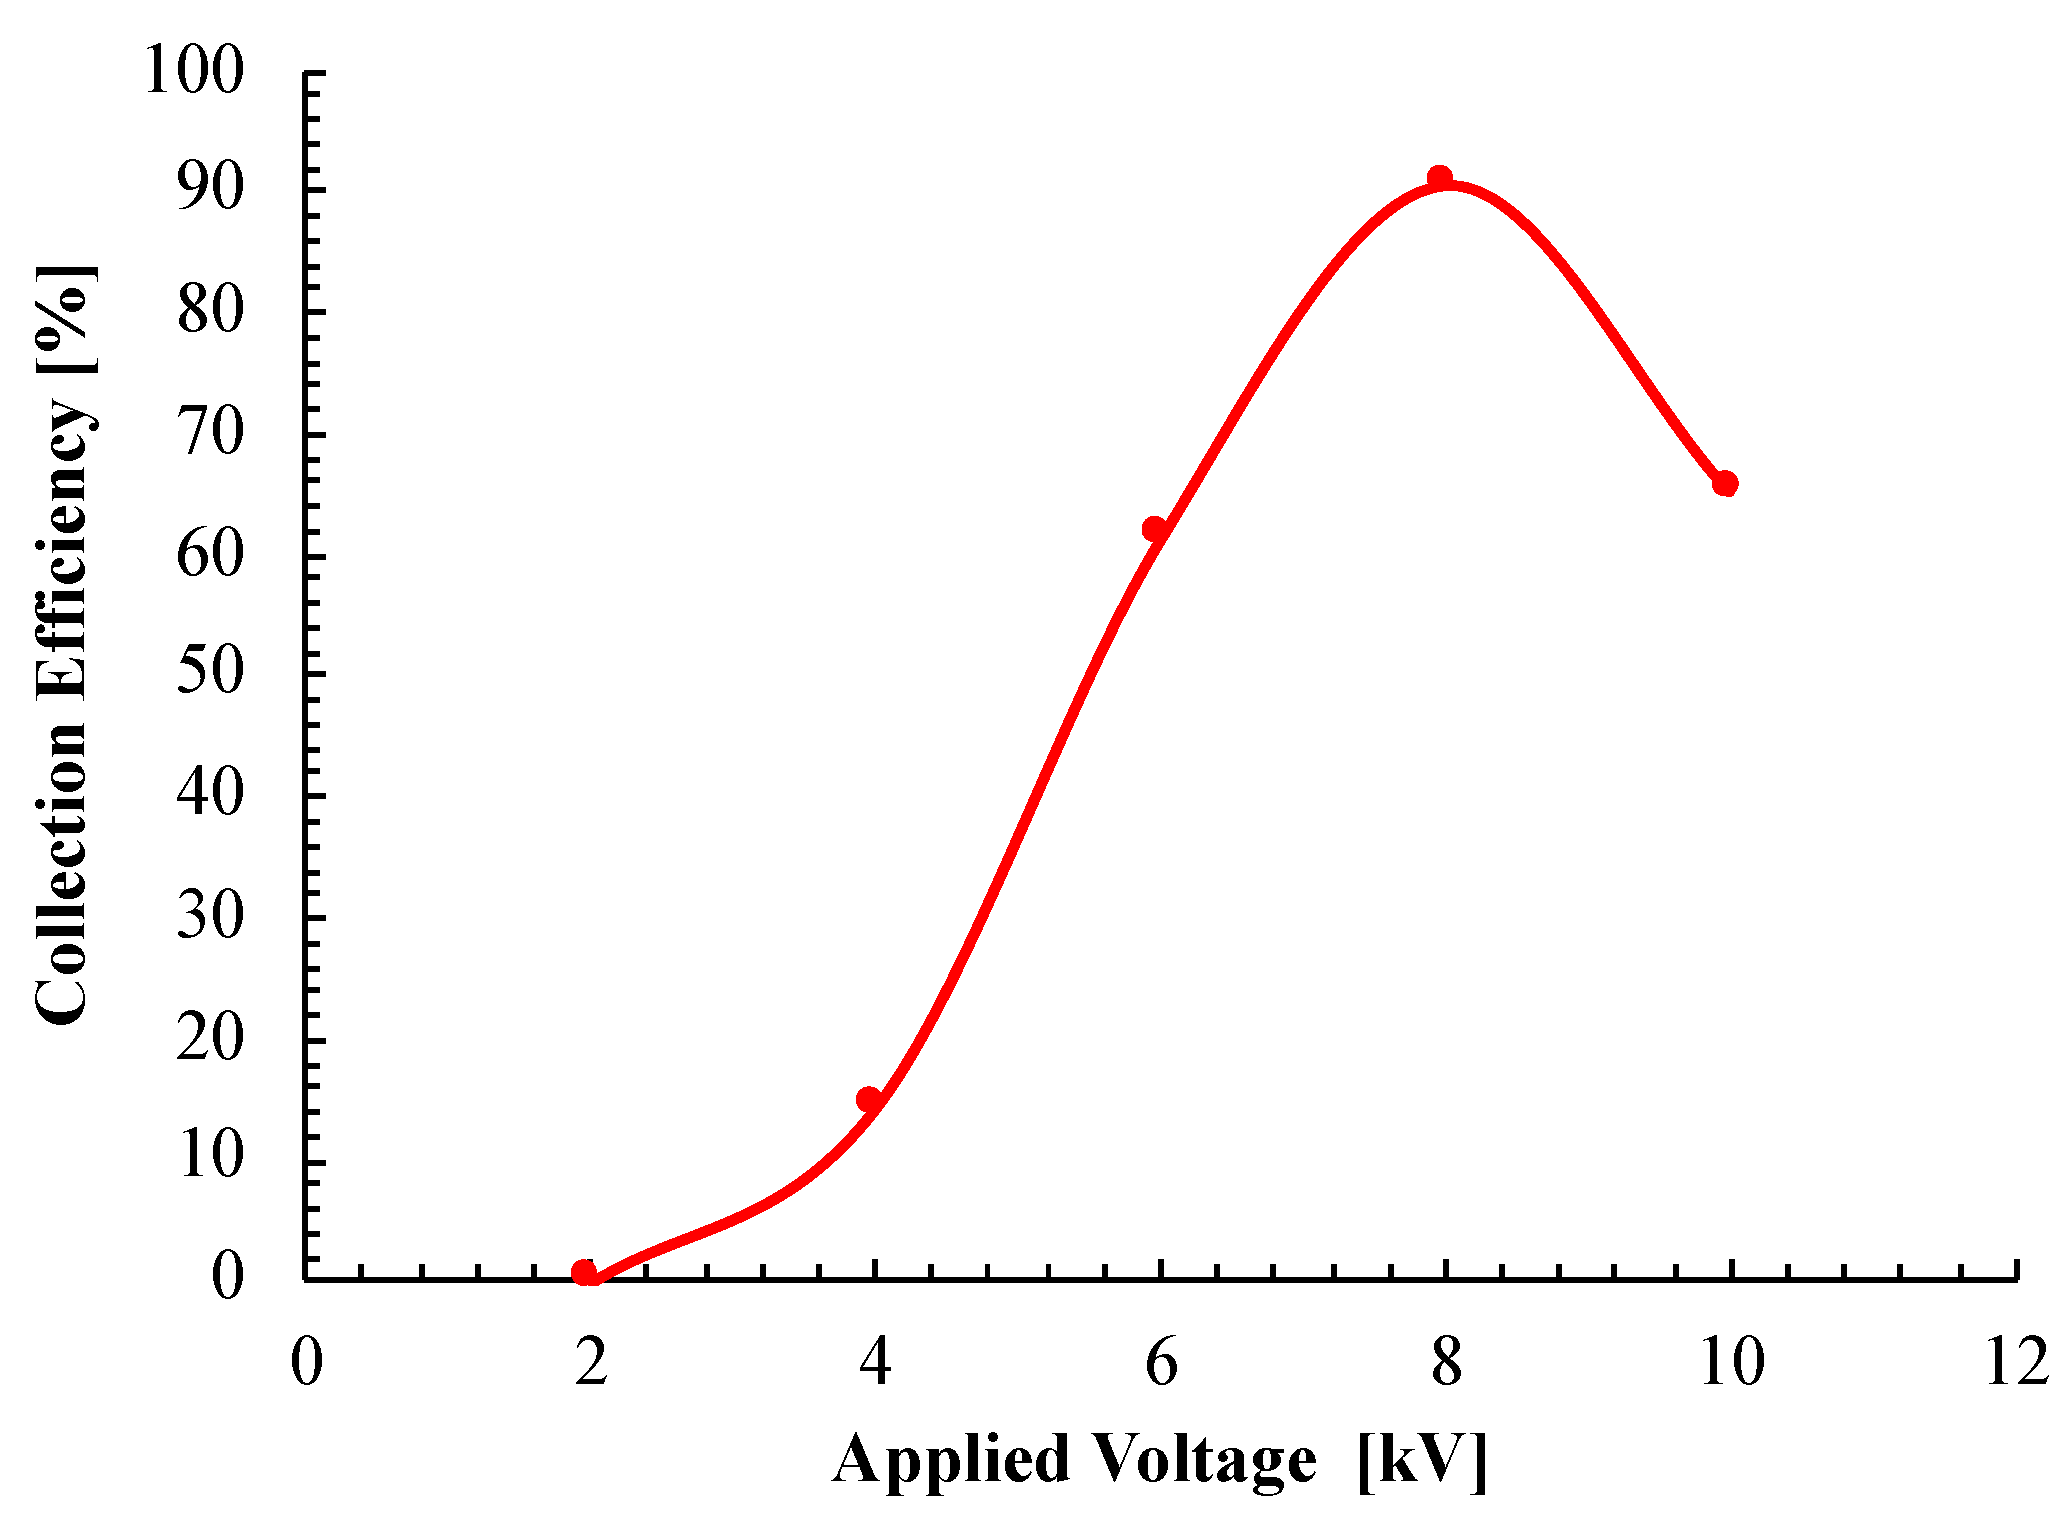
3.3. Collection Efficiency

An increase of fine particles is undesirable for an ESP. Thus, the effects of the applied voltage were investigated. The polarity of the voltage was negative, where the residual fuel oil was used.
The collection efficiency, as a function of particle diameter for various applied voltages, is shown in Figure 9. The collection efficiency, at a voltage of 10 kV, decreased with decreased particle diameter, and had a minimum value of approximately −2900% at a particle size of 16 nm. A negative collection efficiency means that the particle number concentration after the application of voltage is greater than before. Thus, the concentration at 16 nm increased by 30 times after the application of 10 kV. However, the efficiency at a size of approximately 16 nm increased as the applied voltage decreased. Kim et al. [16,17] reported that a nanoparticle collection efficiency of greater than 90% was achieved in an electrostatic filtration system, combined with a metallic flow-through filter for diesel exhaust gas, which was different from the result in this study. This is the most likely option, as their electrostatic filtration system, combined with a metallic flow-through filter, may have been suitable for preventing an increase of nanoparticles.
The total collection efficiency value, as a function of applied voltage, is shown in Figure 10. The efficiency increased as the applied voltage increased, and reached 91% at 8 kV, while the efficiency at 10 kV was 65%. This result shows that an optimum voltage exists for collection efficiency. This is probably due to ion-induced and binary homogeneous nucleation, as already described.

4. Conclusions

The experiments were conducted to investigate the collection characteristics of nanoparticles, emitted from a diesel engine, with a residual fuel oil and light fuel oil in the ESP. The results are follows:
(1)
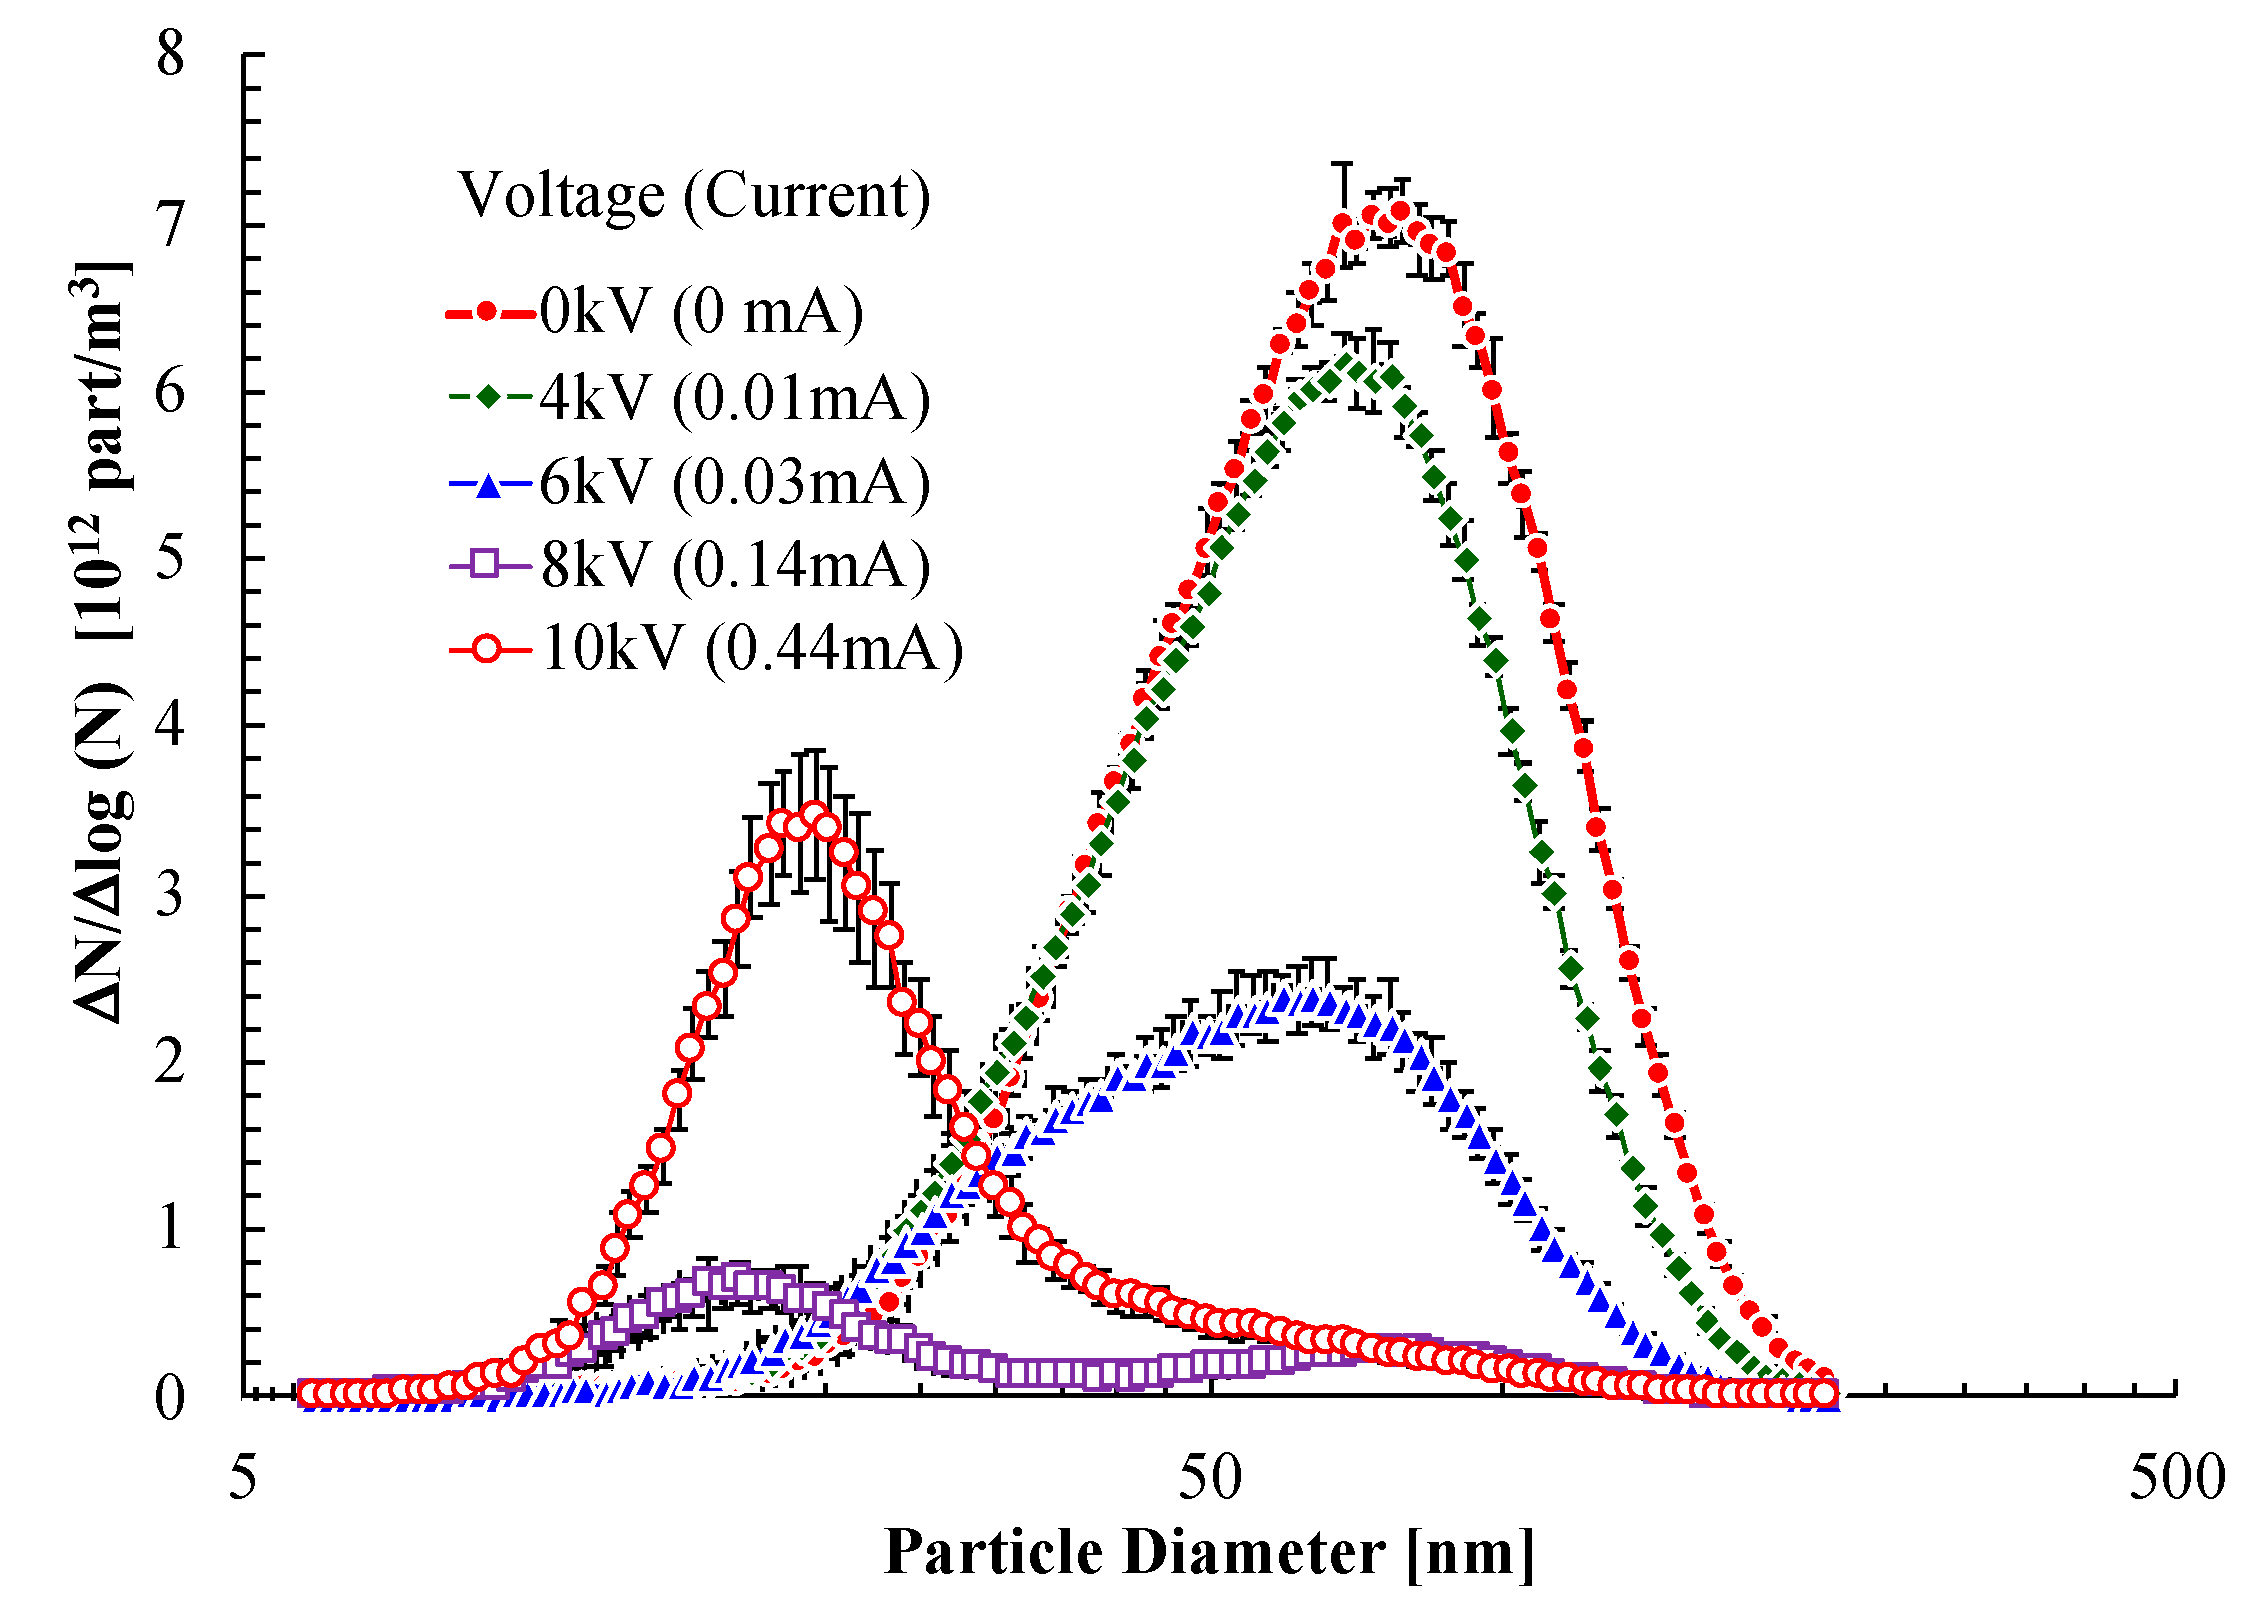
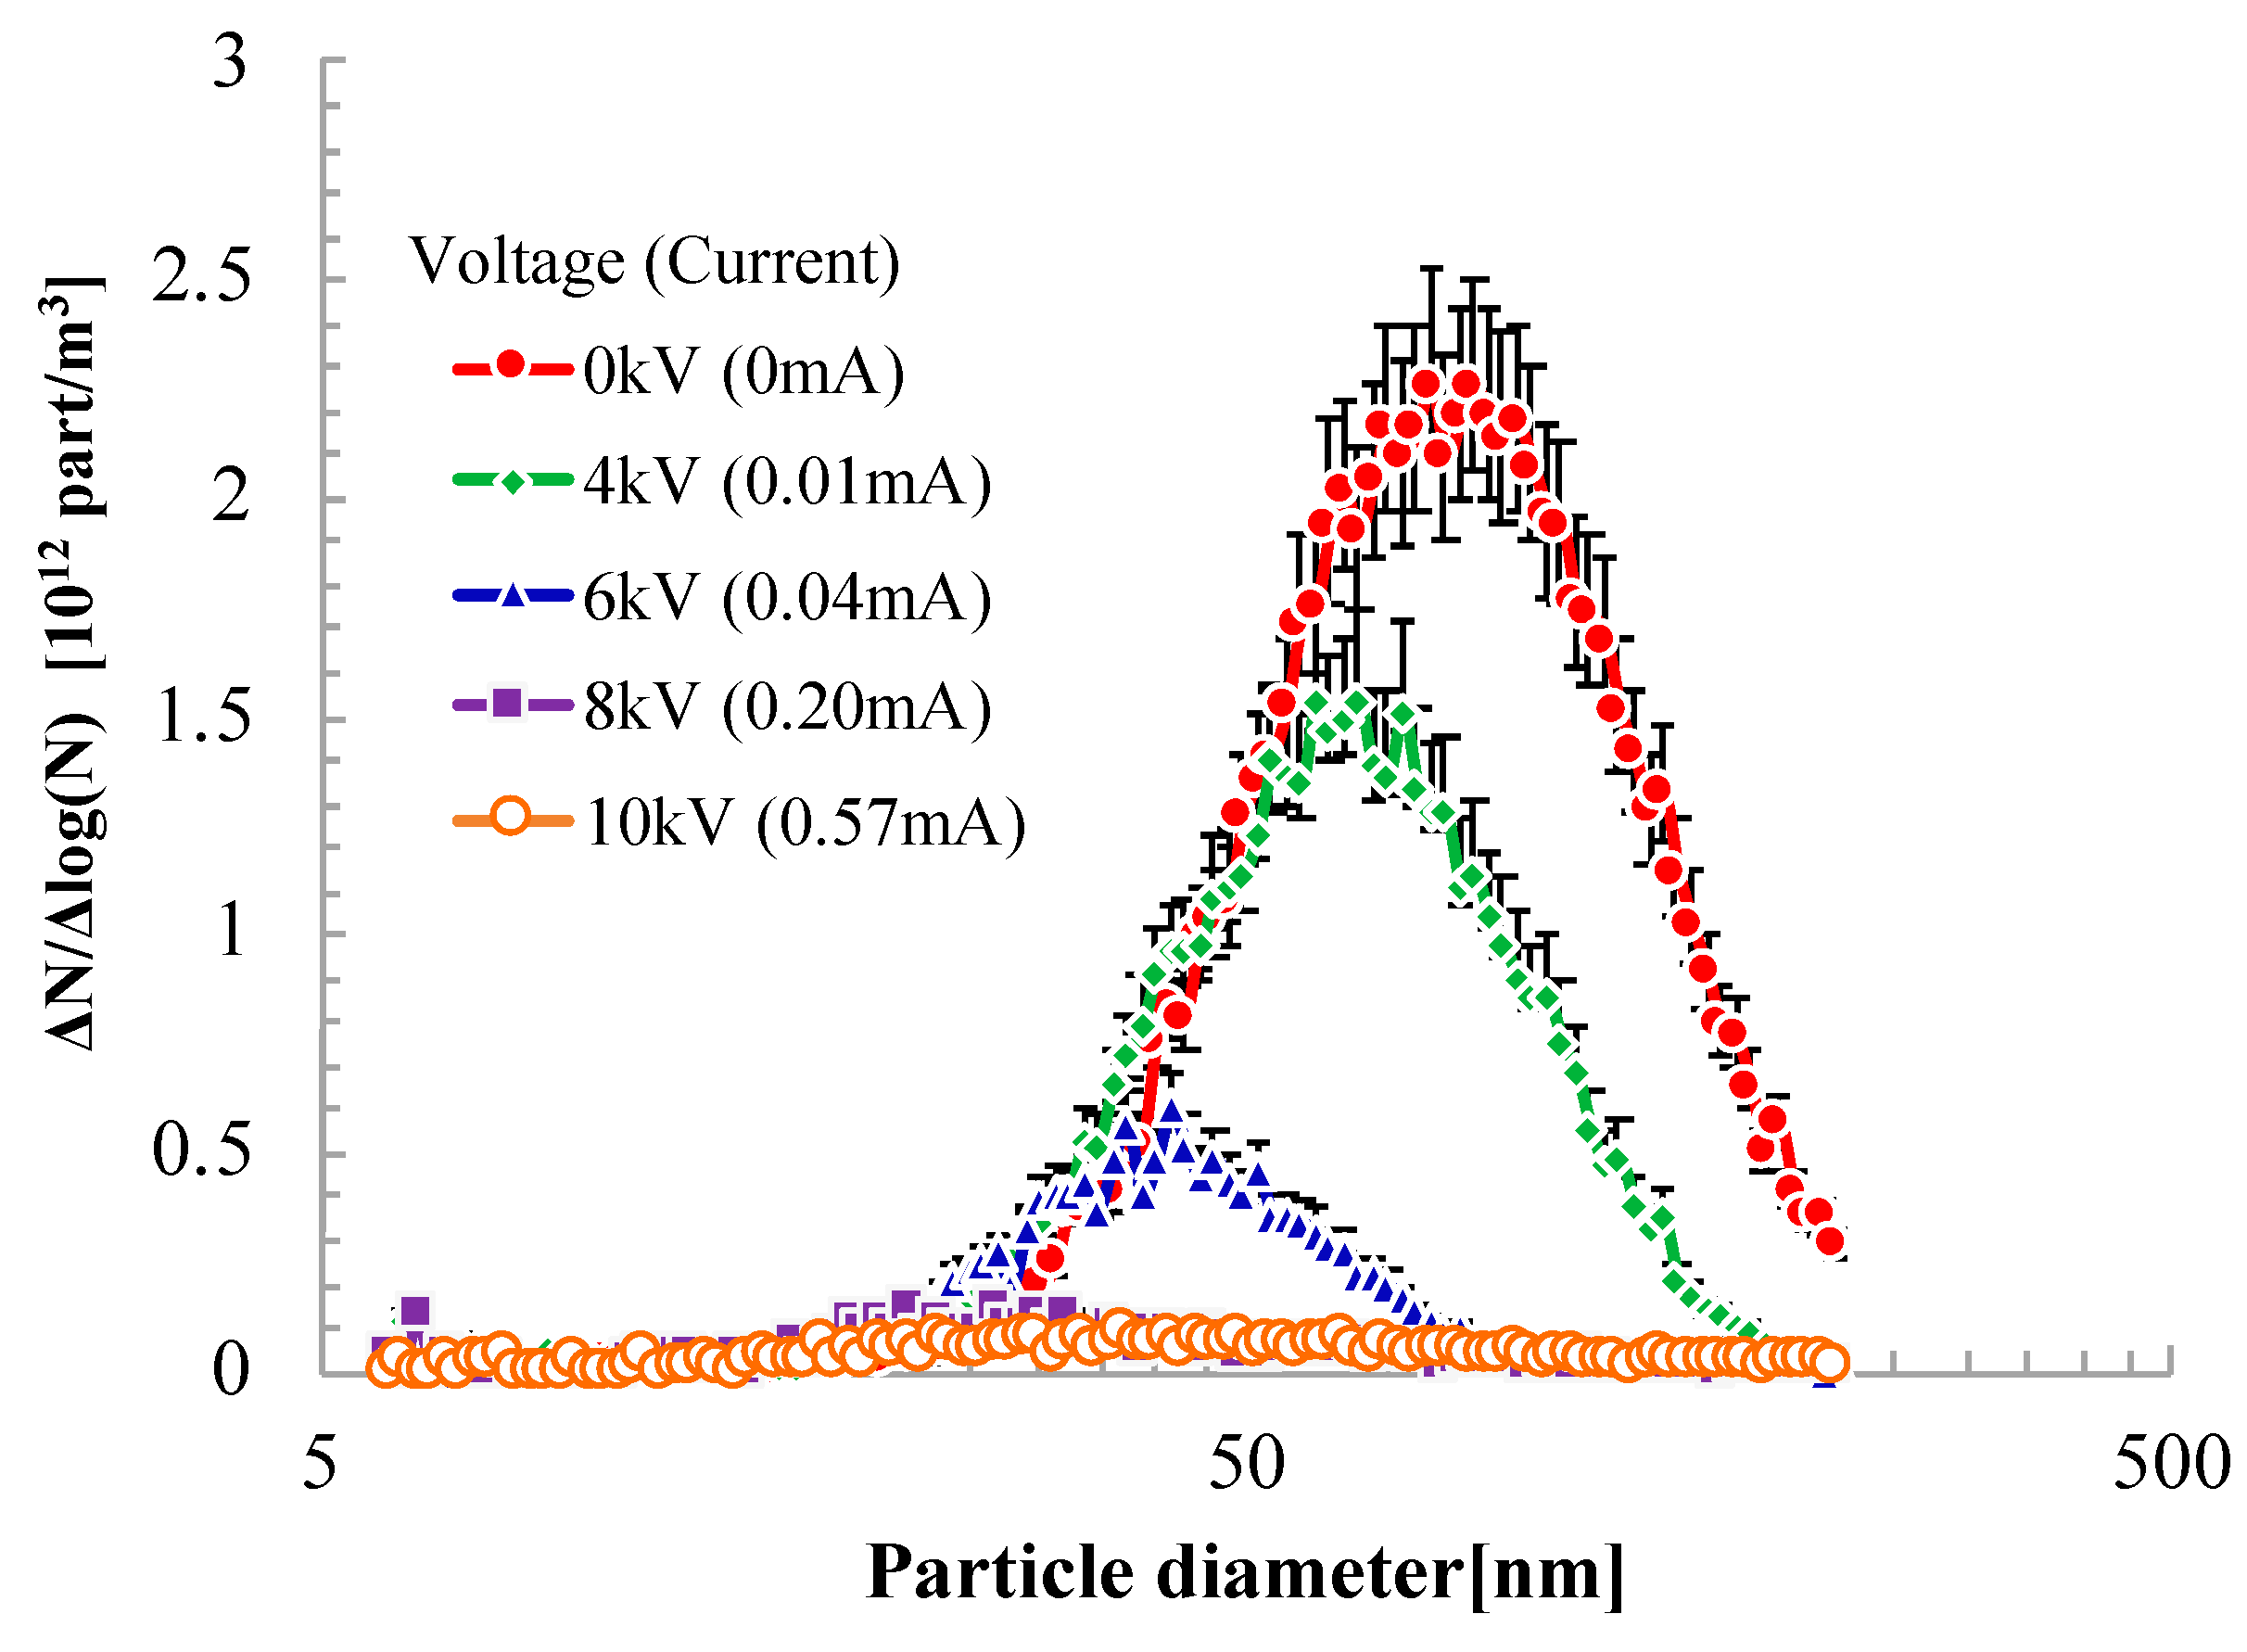
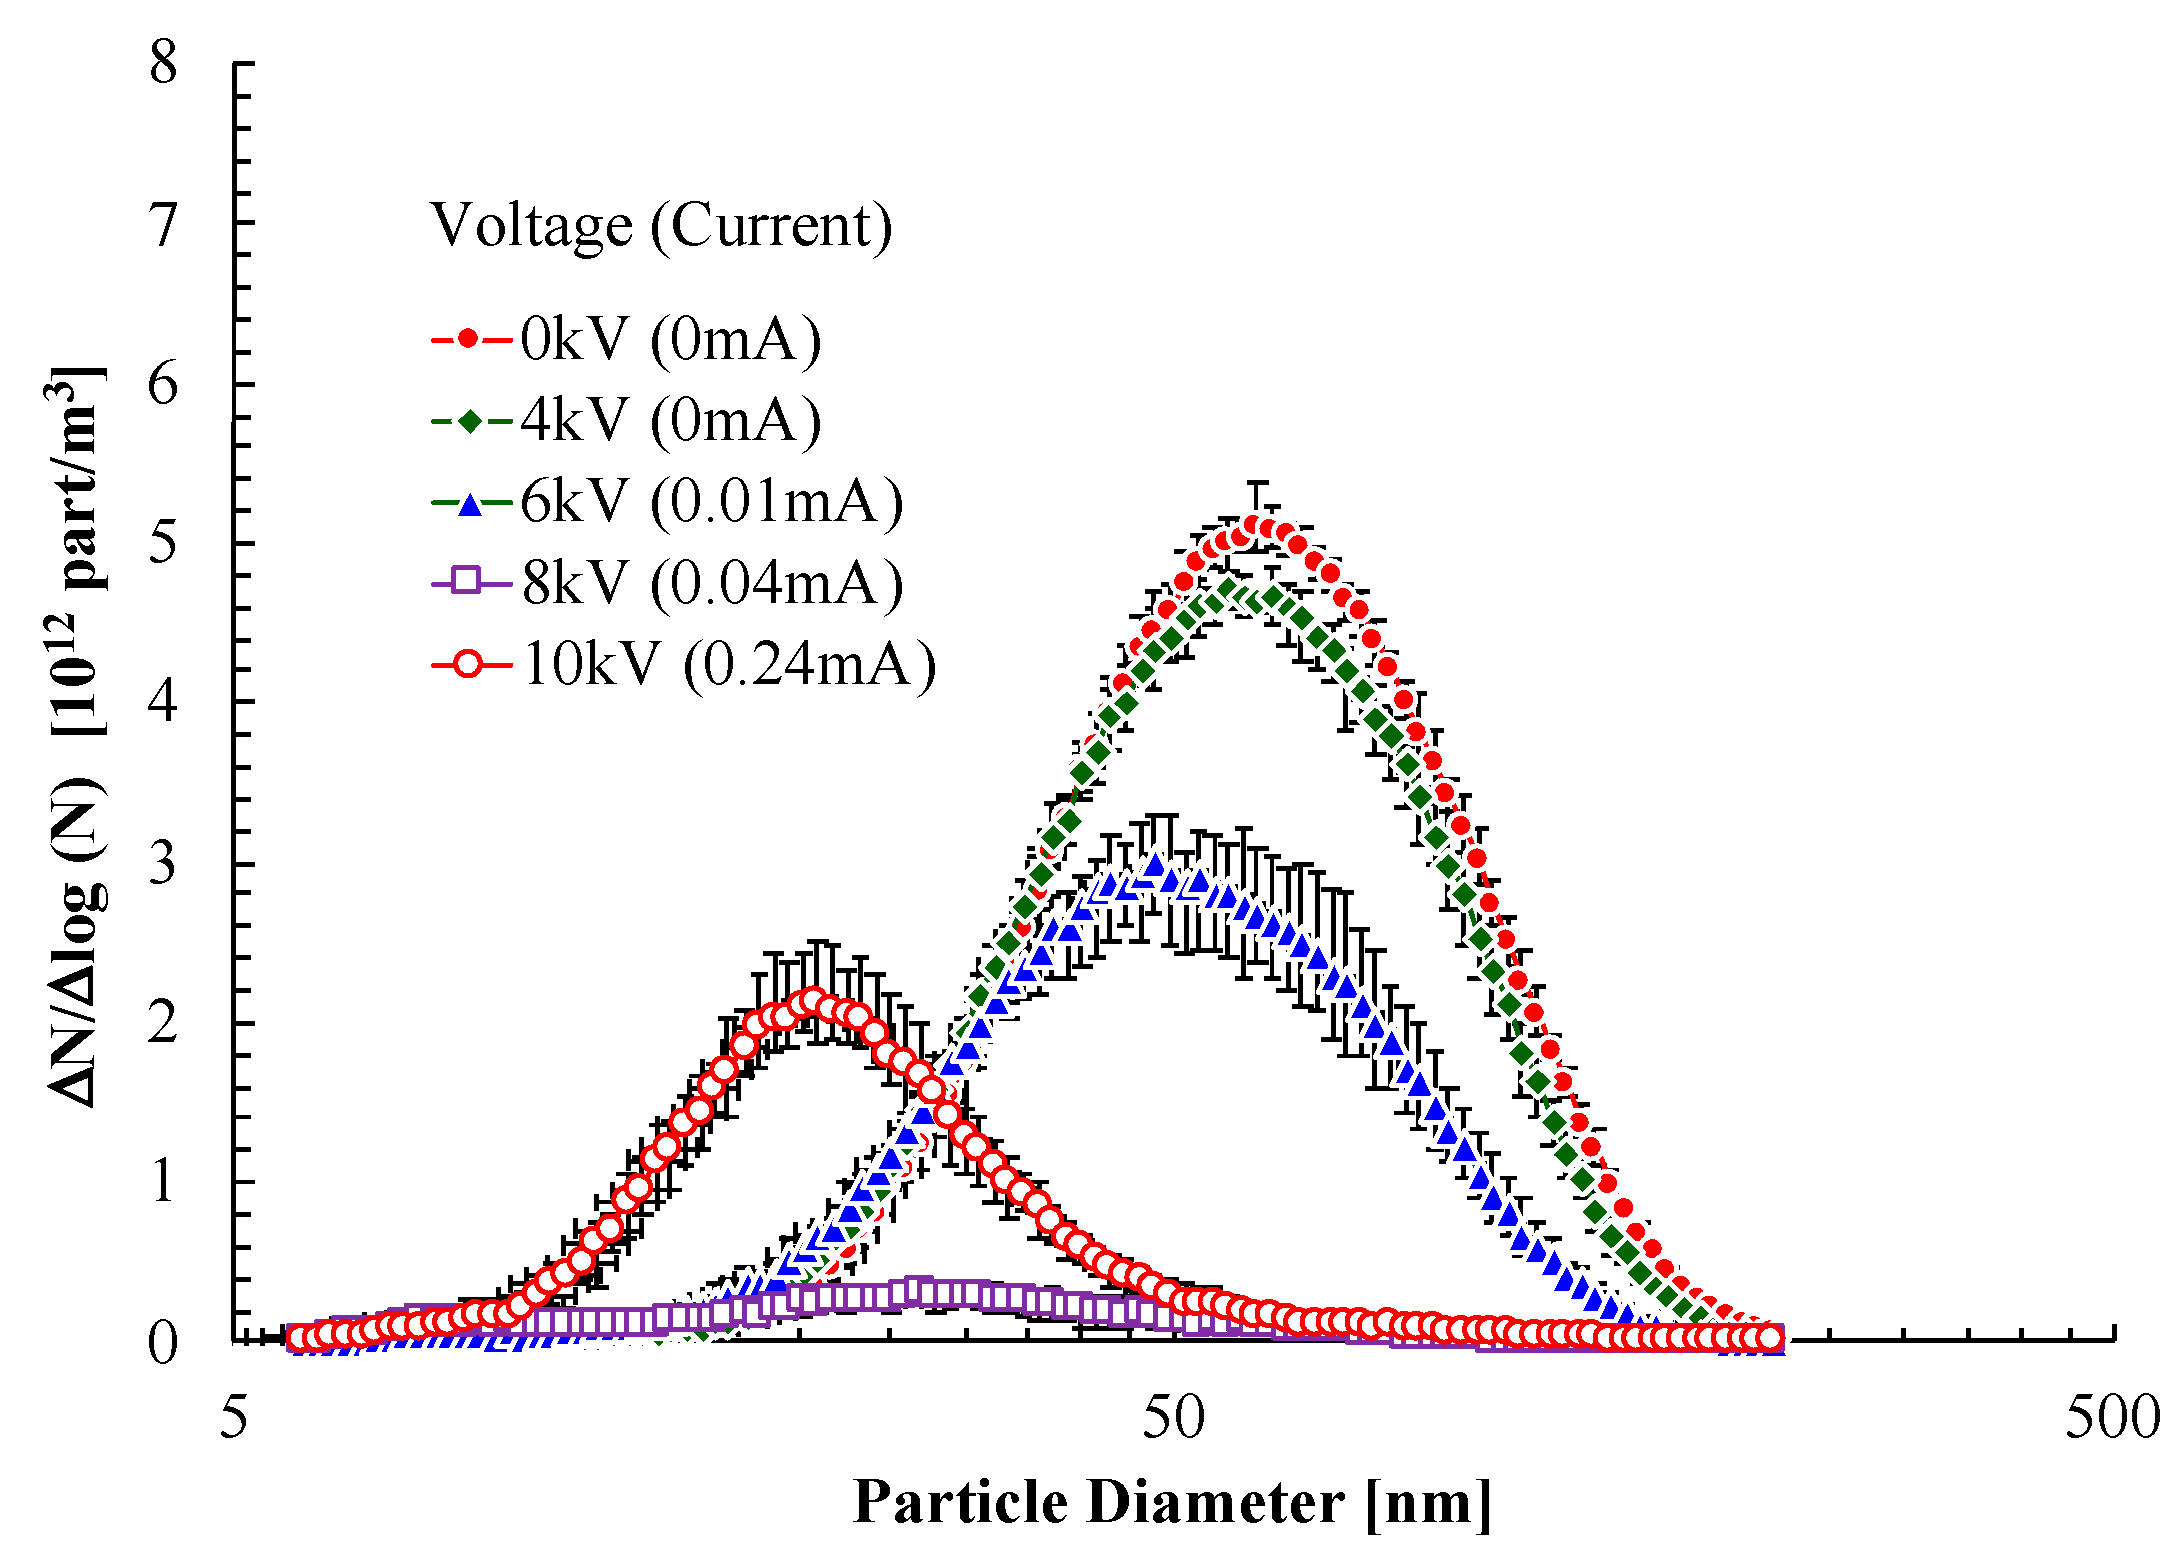
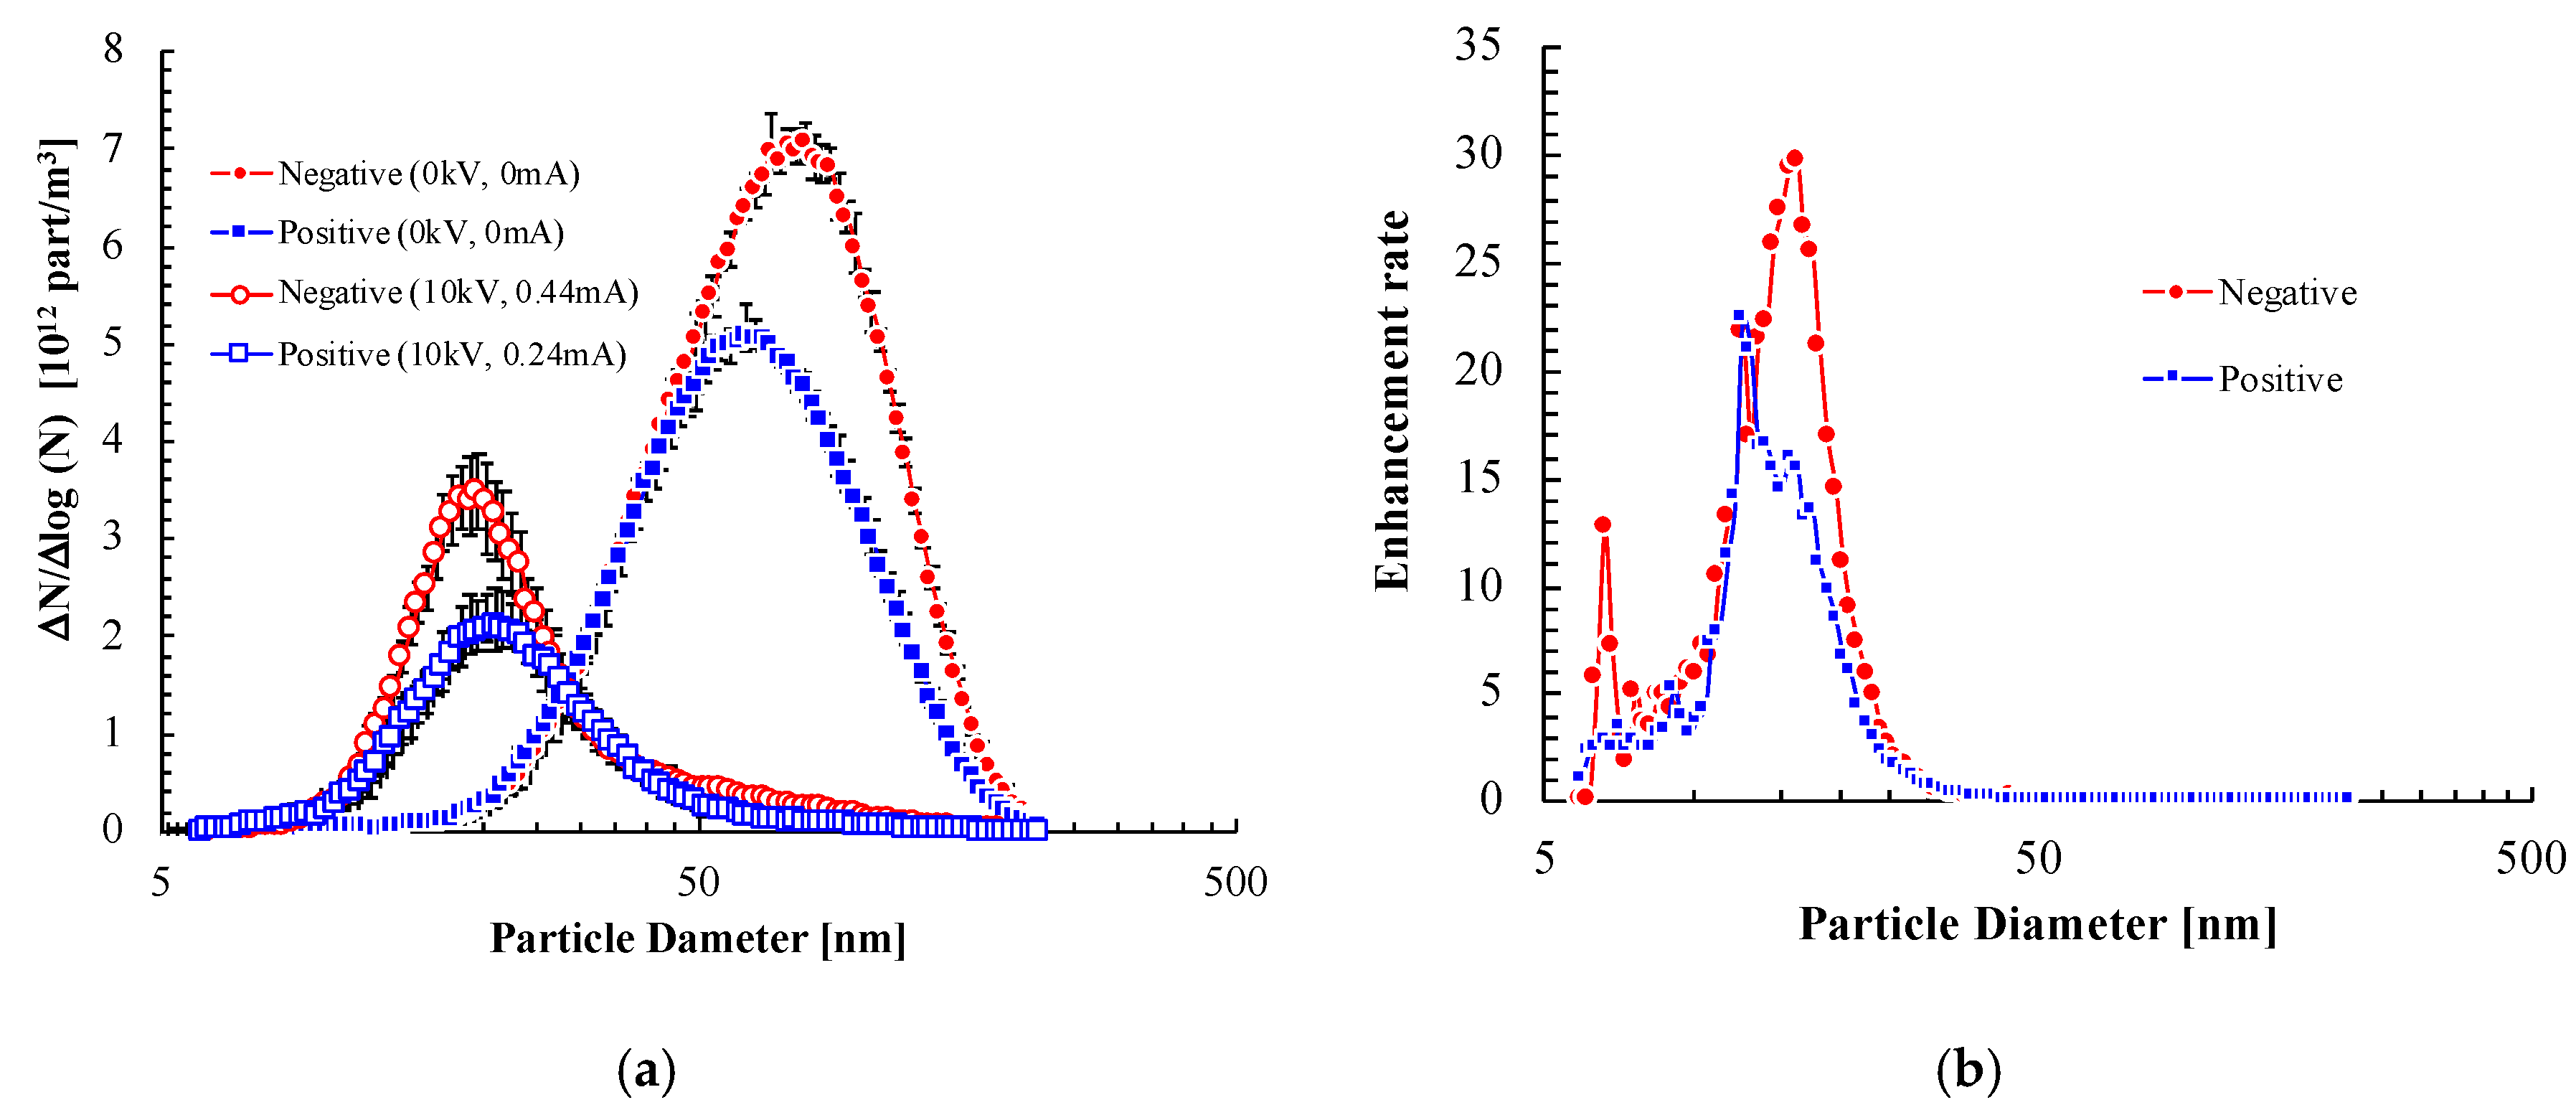
The peak concentration, at 76 nm of size distribution in the exhaust gas from residual fuel oil, decreased with an in increase in the applied voltage. However, the nanoparticle concentration at a size of 20 nm increased. On the other hand, the nanoparticle concentration did not increase in the exhaust gas when light fuel oil was used. These results indicate that the increased nanoparticle concentration in the exhaust gas, using residual fuel oil, may be due to ion-induced and binary homogeneous nucleation.
(2)
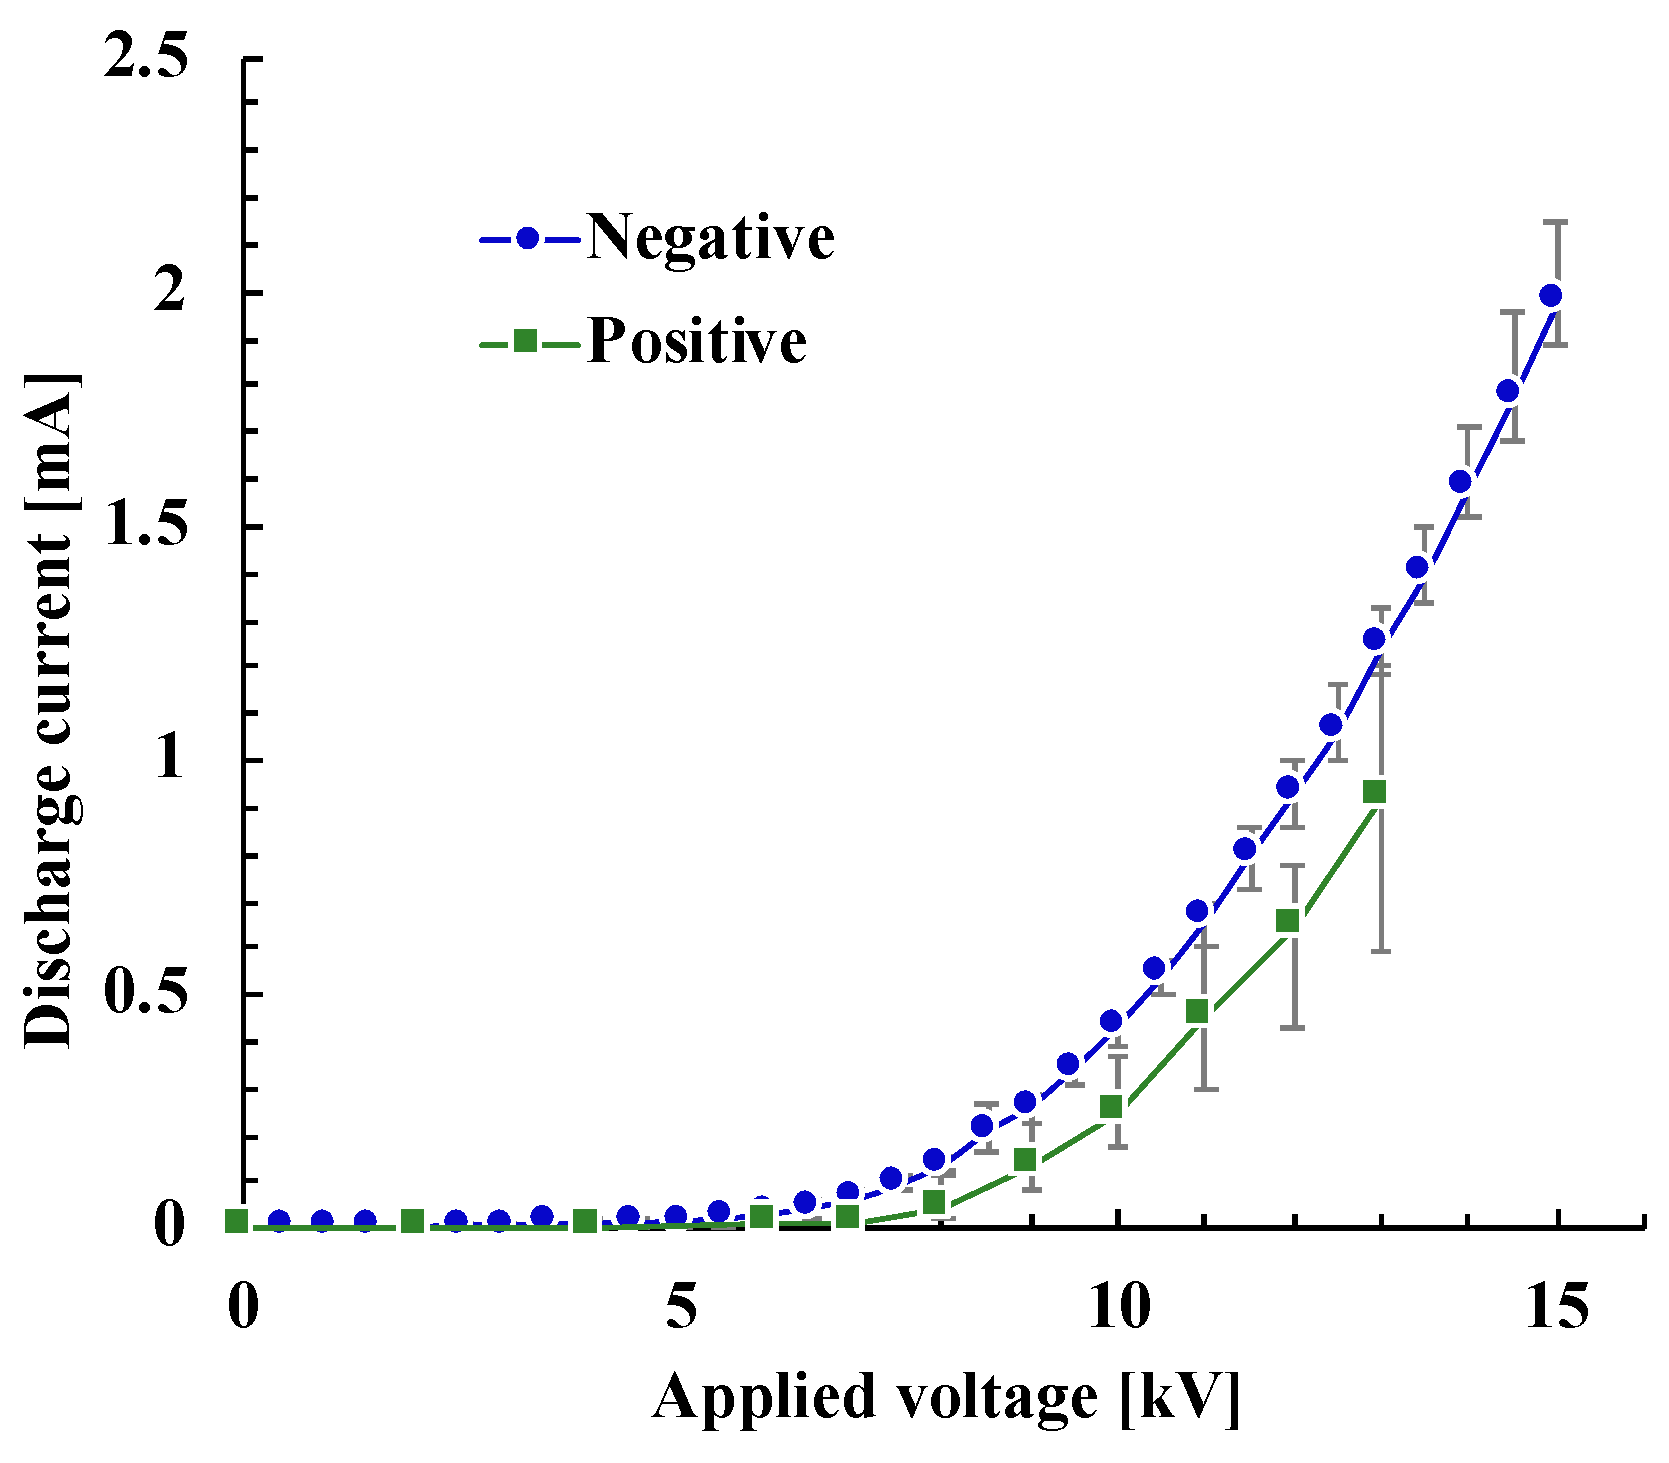
The amount of nanoparticle increase due to corona discharge in negative polarity was greater than that in positive polarity at the same voltage.
(3)
An optimum voltage, used to suppress nanoparticle concentration, exists for the collection efficiency.

Author Contributions

Conceptualization, A.Z.; Formal analysis, A.Z. and H.S.; Funding acquisition, A.Z.; Investigation, A.Z., H.S. and K.Y.; Methodology, A.Z., H.S. and K.Y.; Project administration, A.Z.; Writing – original draft, A.Z.; Writing – review & editing, A.Z., H.S. and K.Y.

Funding

This work was supported by a Grant-in-Aid for Scientific Research (B), Nos. 15H04216 and 18H01647, from the Japan Society for the Promotion of Science.

Conflicts of Interest

The authors declare no conflict of interest.

References

  1. Zukeran, A.; Ikeda, Y.; Ehara, Y.; Matsuyama, M.; Ito, T.; Takahashi, T.; Kawakami, H.; Takamatsu, T. Two-Stage Type Electrostatic Precipitator Re-entrainment Phenomena under Diesel Flue Gases. IEEE Trans. Ind. Appl. 1999, 35, 346–351. [Google Scholar] [CrossRef]
  2. Katatani, A.; Dix, A. Ventilation and Exhaust Purification of Motor Vehicle Tunnels in Japan; BHR Group 2011 ISAVT14: Bedford, UK, 2011; pp. 577–588. [Google Scholar]
  3. Ehara, Y.; Nakano, R.; Yamamoto, T.; Zukeran, A.; Inui, T.; Kawakami, H. Performance of High Velocity Electrostatic Precipitaor for Road Tunnel. Int. J. Plasma Environ. Sci. Technol. 2011, 5, 157–160. [Google Scholar]
  4. Isahaya, F. Development on electrostatic pre-coagulator combined with after-cyclone dust collector. Hitachi Hyoron 1967, 49, 77–80. [Google Scholar]
  5. Masuda, S.; Moon, J.D.; Aoi, K. AUT—AINER Precipitator System—An Effective Control Means for Diesel Engine Particulates. Actas 5. Congreso Int aire Pure 1980 1982, 2, 1149–1153. [Google Scholar]
  6. Sasaki, H.; Tsuamoto, T.; Furugen, M.; Makino, T. Reduction of PM emission from 4-stroke marine diesel engine by electrostatic cyclone DPF. J. JIME 2010, 45, 139–145. [Google Scholar]
  7. Kuroki, T.; Nishii, S.; Okubo, M. Fundamental Study on the Simultaneous Removal of Nanoparticles and Harmful Gas Components Using a Wet-Type Discharge Plasma Reactor. Earozoru Kenkyu 2015, 30, 108–113. (In Japanese) [Google Scholar]
  8. Takasaki, M.; Kubota, T.; Hayashi, M.; Kurita, H.; Takashima, K.; Mizuno, A. Electrostatic Precipitation of diesel PM at reduced gas temperature. In Proceedings of the 2015 IEEE Industry Applications Society Annual Meeting, Addison, TX, USA, 18–22 October 2015; pp. 1–4. [Google Scholar]
  9. Hayashi, H.; Takasaki, Y.; Kawahara, K.; Takenaka, T.; Takashima, K.; Mizuno, A.; Chang, M.B. Electrostatic charging and precipitation of diesel soot. In Proceedings of the 2009 IEEE Industry Applications Society Annual Meeting, Houston, TX, USA, 4–8 Octobeer 2009; pp. 1–8. [Google Scholar]
  10. Kim, H.J.; Han, B.; Woo, C.G.; Kim, Y.J. Submicron PM Removal of an ESP Combined with a Metallic Foam Filter for Large Volumetric Diesel Engines. IEEE Trans. Ind. Appl. 2015, 51, 4173–4179. [Google Scholar] [CrossRef]
  11. Kim, H.J.; Han, B.; Woo, C.G.; Kim, Y.J. Performance of Ultrafine Particle Collection of a Two-Stage ESP Using a Novel Mixing Type Carbon Brush Charger and Parallel Collection Plates. IEEE Trans. Ind. Appl. 2017, 53, 466–473. [Google Scholar] [CrossRef]
  12. Kim, H.J.; Han, B.; Woo, C.G.; Kim, Y.J. Ultrafine Particle Collection Performance of a Two-Stage ESP with a Novel Geometries and Electrical Conditions. IEEE Trans. Ind. Appl. 2017, 53, 5859–5866. [Google Scholar] [CrossRef]
  13. Kawakami, H.; Sakurai, T.; Ehara, Y.; Yamamoto, T.; Zukeran, A. Performance characteristics between horizontally and vertically oriented electrodes EHD ESP for collection of low-resistive diesel particulates. J. Electrost. 2013, 71, 1117–1123. [Google Scholar] [CrossRef]
  14. Ehara, Y.; Ohashi, M.; Zukeran, A.; Kawakami, K.; Inui, T.; Aoki, Y. Development of Hole-Type Electrostatic Precipitator. Int. J. Plasma Environ. Sci. Technol. 1017, 11, 9–12. [Google Scholar]
  15. Kawakami, H.; Zukeran, A.; Yasumoto, K.; Inui, T.; Ehara, Y.; Yamamoto, T. Diesel PM Collection for Marine Emissions Using Double Cylinder Type Electrostatic Precipitator. Int. J. Plasma Environ. Sci. Technol. 2011, 5, 174–178. [Google Scholar]
  16. Kim, H.J.; Han, B.; Hong, W.S.; Shin, W.H.; Cho, G.B.; Lee, Y.K.; Kim, Y.J. Development of Electrostatic Diesel Particulate Matter Filtration Systems Combined with a Metallic Flow-Through Filter and Electrostatic Method. Int. J. Automot. Technol. 2010, 11, 447–453. [Google Scholar] [CrossRef]
  17. Kim, H.J.; Han, B.; Cho, G.B.; Kim, Y.J.; Yoo, J.S.; Oda, T. Collection Performance of an Electrostatic Filtration System Combined with a Metallic Flow-Through Filter for Ultrafine Diesel Particulate Matters. Int. J. Automot. Technol. 2013, 14, 489–497. [Google Scholar] [CrossRef]
  18. Adachi, M.; Kusumi, M.; Tsukui, S. Generation of Nanodroplets and Nanoparticles by Ion-Induced Nucleation. J. Soc. Powder Technol. Jpn. 2004, 41, 424–430. (In Japanese) [Google Scholar] [CrossRef] [Green Version]
  19. Nagato, K.; Yoshizumi, H.; Nonaka, Y.; Fukagawa, K. Effect of discharge polarity on the fine particle formation from SO2 by DC corona discharge. Earozoru Kenkyu 2008, 23, 101–107. (In Japanese) [Google Scholar]
  20. Kim, T.O.; Adachi, M.; Okuyama, K.; Seinfeld, J.H. Experimental Measurement of Competitive Ion-Induced and Binary Homogeneous Nucleation in SO2/H2O/N2 Mixtures. Aerosol Sci. Technol. 1997, 26, 527–543. [Google Scholar] [CrossRef]
  21. Kim, T.O.; Adachi, M.; Okuyama, K.; Seinfeld, J.H. Nanometer Sized Particle Formation from NH3/SO2/H2O/Air Mixtures by Ionizing Irradiation. Aerosol Sci. Technol. 1998, 29, 111–125. [Google Scholar] [CrossRef]
  22. Adachi, M.; Kim, C.S.; Kim, T.O.; Okuyama, K. Effects of NO2 Gas on Gas-to-Particle Conversion of SO2 by a-Ray Radiolysis. Kagaku Kougaku Ronbunshu 1999, 25, 868–872. (In Japanese) [Google Scholar] [CrossRef]
  23. Yohannes, P.; Xiaoping, B.; Stelson, A.W. Competition of NO and SO2 for OH Generated within Electrical Aerosol Analyzers. Aerosol Sci. Technol. 1995, 22, 190–193. [Google Scholar] [CrossRef]
Figure 1. Schematic diagram of experimental system.
Energies 12 03321 g001
Figure 2. Structure of the electrostatic precipitator (ESP).
Energies 12 03321 g002
Figure 3. Relationship between applied voltage and discharge current when residual oil and light oil are used.
Energies 12 03321 g003
Figure 4. Size distribution of various applied voltages when residual oil is used.
Energies 12 03321 g004
Figure 5. Size distribution for various applied voltages when light oil is used.
Energies 12 03321 g005
Figure 6. Relationship between applied voltage and discharge current (residual oil).
Energies 12 03321 g006
Figure 7. Size distribution for various applied voltages in positive polarity (residual oil).
Energies 12 03321 g007
Figure 8. Comparison between results of negative and positive polarities: (a) size distribution; (b) enhancement rate.
Energies 12 03321 g008
Figure 9. Collection efficiency as a function of particle diameter for various applied voltages in negative polarity (residual oil).
Energies 12 03321 g009
Figure 10. Collection efficiency as a function of applied voltage in negative polarity (residual oil).
Energies 12 03321 g010

