Article

A Novel Detection Algorithm to Identify False Data Injection Attacks on Power System State Estimation

by
Mehdi Ganjkhani
1,
Seyedeh Narjes Fallah
2,
Sobhan Badakhshan
1,
Shahaboddin Shamshirband
3,4,* and
Kwok-wing Chau
5
1
Department of Electrical Engineering, Sharif University of Technology, Tehran P.O. Box 11365-11155, Iran
2
Independent Researcher, Sari 4816783787, Iran
3
Department for Management of Science and Technology Development, Ton Duc Thang University, Ho Chi Minh City, Vietnam
4
Faculty of Information Technology, Ton Duc Thang University, Ho Chi Minh City, Vietnam
5
Department of Civil and Environmental Engineering, Hong Kong Polytechnic University, Hong Kong, China
*
Author to whom correspondence should be addressed.
Energies 2019, 12(11), 2209; https://doi.org/10.3390/en12112209
Submission received: 21 February 2019 / Revised: 27 March 2019 / Accepted: 4 April 2019 / Published: 10 June 2019

Abstract

:
This paper provides a novel bad data detection processor to identify false data injection attacks (FDIAs) on the power system state estimation. The attackers are able to alter the result of the state estimation virtually intending to change the result of the state estimation without being detected by the bad data processors. However, using a specific configuration of an artificial neural network (ANN), named nonlinear autoregressive exogenous (NARX), can help to identify the injected bad data in state estimation. Considering the high correlation between power system measurements as well as state variables, the proposed neural network-based approach is feasible to detect any potential FDIAs. Two different strategies of FDIAs have been simulated in power system state estimation using IEEE standard 14-bus test system for evaluating the performance of the proposed method. The results indicate that the proposed bad data detection processor is able to detect the false injected data launched into the system accurately.

1. Introduction

Integration of renewable energy resources into the power grid causes major deregulation in the electricity market. Keeping the generation cost down in the deregulated power system as well as providing a reliable load to customers necessitates the use of remote measurements and smart metering in the power system, which leads to smart grid development. A smart grid is able to establish a two-way communication by means of advanced sensors to improve the reliability and performance of a system. While these cyber resources enable market operators to enhance the performance of a system, they bring new challenges to the infrastructure. Cyber-physical systems (CPSs) render smart grids more vulnerable to cutting-edge undetectable cyber-physical attacks. Therefore, the impact assessment of cyber-attacks on smart grids is considered as one of the most serious issues in recent years [1].
Several types of cyber-attacks have been investigated, which are divided into three different categories, namely, data availability, confidentiality, and integrity. Cyber-attacks on availability or named denial-of-service (DoS) attacks effort to delay, deny, or alter transferring information at different layers of a communication network. Attacks on confidentiality aim to obtain unauthorized information from networks in smart grids. Attacks on integrity intend to deliberately and illegally modify or disrupt data exchange in a smart grid. Such attacks attempt to stealthily manipulate data to corrupt critical information exchange in smart grids [2]. Recently, the method of false data injection attack (FDIA) has been attracting the attention of researchers. The false data injection attack was designed to impact the state estimation [3] and real-time electricity market [4] by manipulating the data in the SCADA system. Another type of cyber-attack on a smart grid’s integrity, namely, alter-and-hide (AaH) is used to change the true values of digital variables such as substation switches and breakers. This kind of attack affects the topology processor and brings catastrophic consequences [5]. However, owing to the basic difference in the modeling of the various cyber-attacks, and the vast literature on this type of attack, the FDIA is modeled and formulated in this study to be investigated.
FDIAs aim to modify data at the control center or measurement units to reach a predetermined end. FDIAs target analog measured data from the power system, i.e., the nodal voltage magnitudes and angles, nodal power injections, line power flows, and digital data such as the status of breakers and switches [6]. Such data are essential to the power system operator (PSO) to perform state estimation (SE) in order to monitor and control the power grid operation. The result of SE is also exploited in the security constraint economic dispatch (SCED) to settle in the real-time power electricity market. Thus, the data integrity guarantees an accurate SE as well as effective monitoring and control of the power system operation.
The concept of FDIAs on SE in smart grids was first raised in [7]. The authors in [7] illustrated that by having adequate knowledge of the power system configuration, an adversary can launch FDIA without being detected. That investigation was an inspiration for other researchers to work on impacts of this type of attack on the power system and appropriate techniques to defend it. The authors in [8] presented analytical approaches to analyze the influence of FDIAs on AC state estimation. The authors in [9,10,11,12,13] discussed various methods of FDIA on SE in smart grids considering complete and incomplete knowledge about the topology of the considered power system.
As mentioned earlier, the estimated variables are utilized in SCED and real-time electricity market settlement. This issue can be considered as a motivation for the adversary to stealthily attack the SE by altering locational marginal price (LMP) values in the real-time electricity market. Wide areas of research have been carried out to investigate this matter. The economic consequences of FDIA on the real-time ex-ante market were discussed in [6]. FDIA on analog and digital measurements were studied in [14], and an optimized attack problem was presented. Given the Australian real-time electricity market mechanism, the authors in [15] proposed a compact FDIA-based approach to cyber topology. The researchers in [16,17] provided a thorough review of FDIAs on power system state estimation and their influence on the electricity market up to the year 2017.
Several methods in the literature have been developed to mitigate and detect FDIAs on SE in smart grids [18,19,20,21,22]. The authors in [18] developed a heuristic algorithm to find an undetectable vector of FDIA and correspondingly, an infinite norm bad data detection (BDD) processor is defined to detect the attack vector efficiently. Liu et al. [19] presented an approach utilizing the correlation and history of measurements as well as the sparse attribute of malicious attacks to detect FDIAs in smart grids. By applying the Kullback–Leibler distance (KLD) and assuming a probability distribution function for historical data, a statistical method for FDIA was introduced in [20]. Another statistical outlier idea was proposed in [21] to estimate the density ratio by using machine learning. By utilizing load forecasting, generation schedules and Phasor Measurement Units (PMUs), the author in [22] proposed an online bad data detection algorithm.
Recently, machine learning techniques have been widely applied for bad data detection and identification in smart grids. The authors in [23] proposed a hybrid machine learning method to detect stealthy attacks in smart grids. Data was labeled in the preprocessing stage by a supervised algorithm followed by training the labeled data with a support vector machine (SVM). Similarly, a deep-learning-based approach for detection of FDIA on smart meters’ data was investigated in [24]. The model used a state vector estimator (SVE) and a deep-learning-based identification algorithm to prevent electricity theft. Multiple hidden layers were considered in this method to enhance the detection accuracy. A sparse principal component analysis and approximation approach were developed in [25] to identify a stealthy FDIA on a smart grid. The accuracy of the method depended on the sparsity of data and it was less efficient for sparse vectors. Wang et al. [26] investigated a data-centric paradigm to identify FDIAs in smart grids and the developed model employed a margin setting algorithm to categorize a huge amount of data. It was illustrated in [26] that, by increasing the false data rate, the detection accuracy is decreased. In order to detect sparse cyber-attacks in smart grids, the authors in [26,27] developed a deep-learning-based interval state estimation algorithm. A multi-layer stacked autoencoder was used in that method, in which the last layer detected anomalies in electric load forecasting.
To the best knowledge of the authors, nonlinear autoregressive exogenous (NARX) (a special configuration of ANN) has not been utilized to detect stealthy optimized FDIA on contingency analysis. In spite of the distribution system, a transmission system is facilitated with adequate measurement devices; hence, analytical methods reveal accurate results of the state of the system. Still, measurements at the transmission level are exposed to FDIAs. There are BDD processors in the state estimator procedure even though, under specific conditions, FDIAs can pass through them. This paper aims to develop a novel BDD procedure based on a recurrent architecture of ANN, namely, nonlinear autoregressive exogenous (NARX) model, to identify FDIAs that could not be observed by conventional BDD processors.
The NARX neural network (NARXNN) is a robust engine for times series prediction by using historical data. Thus, it is practical to apply this learning engine to predict step-ahead values of the state by considering measurement values and historical data as input variables. However, owing to the nonlinear characterization of the forecast, the output would contain subtle errors in comparison to real values and SE results by analytical methods. Meanwhile, the results of analytical methods can be utilized without any restriction to validate and evaluate the estimated state.
This paper represents potential FDIAs that can be launched on smart grids without being detected by conventional BDDs. Moreover, by introducing NARXNN and its prominent features, which renders it an attractive predictor engine for estimation of the states, a novel FDIA detector is introduced and evaluated. The rest of this paper is organized as follows. Section 2 briefly presents the main concept of state estimation in power systems as well as bad data identification tests. Section 3 provides a review and formulation of undetectable FDIAs by conventional methods. A novel ANN-based bad data detection method is introduced and formulated in Section 4. Finally, numerical analyses are provided in Section 5, followed by conclusions in Section 6.

2. Preliminaries

In this section, the state estimation process in power systems and real-time power market operation are briefly introduced.

2.1. DC State Estimation

A state estimator receives measurements and other necessary information from supervisory control and data acquisitions (SCADA) system in order to estimate the power system state. Based on the nonlinear SE, the relation between measurements z m and state variables x n is as follows [28]:
z = h ( x ) + e
where h ( x ) is the nonlinear measurement function of x and e N ( 0 , R ) (   e N ( 0 , R ) indicates the normal distribution with zero mean and variance R ). Even though developing an estimation model based on AC nonlinear measurements, i.e., h ( x ) , is accurate, in many cases, it is a time consuming, costly procedure and might not result in an optimal solution for large scale power systems. On the other hand, using linearized DC state estimation may be less accurate, but simpler and more feasible, and practical for real-time LMP calculation [16]. In addition, the undetectable yet impressive FDIA constraints are too complicated to be formulated in AC state estimation. Hence, in order to formulate the optimization problem for the most consequential FDIA the DC load flow model is utilized in this paper. With an acceptable accuracy, a nonlinear measurement is linearized around an operation point. Hence, the linearized state estimation is formulated as follows:
z = H x + e
where   H is a Jacobian matrix that depends on the impedance of the network topology.
Assuming that the control center employs the standard weighted least squares (WLS) state estimator, the estimated state of the system x ^ is computed by minimizing an objective function.
j ( x ^ ) = ( z H x ^ ) T R 1 ( z H x ^ )
Hence, the estimated state is as follows:
x ^ = ( H T R 1 H ) 1 H T R 1 z
where G = ( H T R 1 H )   is defined as the gain matrix. Thereby, the estimated value of measurements is as follows:
z ^ = H x ^ = K z
and correspondingly, the measurement residual vector is defined as follows:
r = z H x ^ = ( I K ) z
The state variable obtained from (4) is used for computing the power flow vector of transmission lines f via the following relationship:
f ^ = Y x ^
where Y is the admittance matrix. The estimated state of power flow is employed for contingency analysis. The congested lines are defined as a set of = { l : f ^ l > f l m a x } , where f l m a x indicates the maximum constraint of power flow line l. The result will be used for SCED and LMP computation in the real-time market [15,16].

2.2. Bad Data Detection

Bad data detection is one of the most important processes of a state estimator, by which unacceptable measurement errors are identified.
In this paper, the 2 norm-based residual test and the largest normalized residual (LNR) are utilized for BDD mechanism [28].
The 2 norm-based residual test is a common test to detect possible erroneous or abnormal data in the measurement set. The following inequality is applied for this test:
r 2 2 τ 2
Provided that r 2 2 > τ 2 the measurement vector contains bad data and if r 2 2 < τ 2 the result can pass the BDD processor without any problem. Random measurement errors follow the normal distribution with zero mean. Therefore, r 2 2 follows Chi-Square distribution with m n degree of freedom and probability of success p   ( χ ( m n ) , p 2 ) . Correspondingly, τ is predetermined according to the false alarm probability, namely, q = 1 p .
Therefore, the following inequality should be true in order for the BDD processor to confirm the result of SE:
r 2 τ
Another test to detect bad data in measurements is the largest normalized residual (LNR), which can be more accurate in some cases and is formulated as follows [28]:
r i N = r i i i ε
where ε is a determined identification threshold and is the same for all measurements and is defined as the residues covariance matrix, which is defined as follows:
= R H G T H T
Provided that Equation (10) is not satisfied for each measurement, it is suspected as bad data. Passing both aforementioned tests can assure the state estimator that the measurement vector and the estimated state vector are dependable and the result can be utilized for the next procedure. The first test checks that the sum of all residual values for estimated variables is less than the predetermined value; consequently, the second test checks the residual value for each measurement individually.

3. Undetected False Data Injection Attack on State Estimation

In order to attack the state estimation, the adversary would inject an attack vector a ( a m ) to the measurement vector z . Thus, the residual vector would be altered as follows:
r a = z a z ^ a = ( z + a ) K ( z + a ) = r + ( I K ) a
Correspondingly, the power flow vector is manipulated according to the following equation:
f ^ a = Y ( x ^ + c ) = f ^ + Y c
where c indicates the deviation of estimated state vector as a result of the attacked vector a . It is indicated in [14] that the congested line has a direct impact on dual variables in the LMP equation. Consequently, each congested line set is associated with a unique LMP vector. Considering this theorem, most publications focused on FDIAs that target congested line sets without being detected by the conventional BDD. Similar to [11,14,15,16,17], this paper assumes that FDIAs are launched without being detected by changing congested lines from their original situations. According to 2 norm-based residual test, in order to launch an unidentified attack, the following constraint should be satisfied:
r a 2 τ
In practice, r a 2 r a ; therefore, provided that r a τ , it can be guaranteed that the BDD process cannot detect the injected data. Equation (14) is extended by using the previous equations as follows:
r a = z a H x ^ a = z + a H ( x ^ + c ) = z H ( x ^ ) + a H c r + a H c τ
where c n is an arbitrary non-zero vector. It is shown in [19] that, in cases a = H c , a perfect and unidentifiable attack is launched to the state estimation. However, it is not feasible to assume that the system topology is completely known to an attacker. The attacker has to ensure a H c δ to launch an imperfect attack to avoid detection with high probability.
On the other hand, according to the LNR test, the following condition should be satisfied for each array of the residual vector to pass a BDD process:
r i ε i i
hence
| r | ξ
where | r | is the vector of absolute values of residual vector and ξ is the threshold vector. Equation (17), at the presence of an attack, is rewritten as follows:
| r a | = | r + a H c | ξ
| r i + a i H i c | | r i | + | a i H i c | ξ
therefore, in order to have a hidden attack, the attacker should consider the following constraint:
| a i H i c | ϑ i
where ϑ is the threshold vector for the residual vector to have an undetected attack.
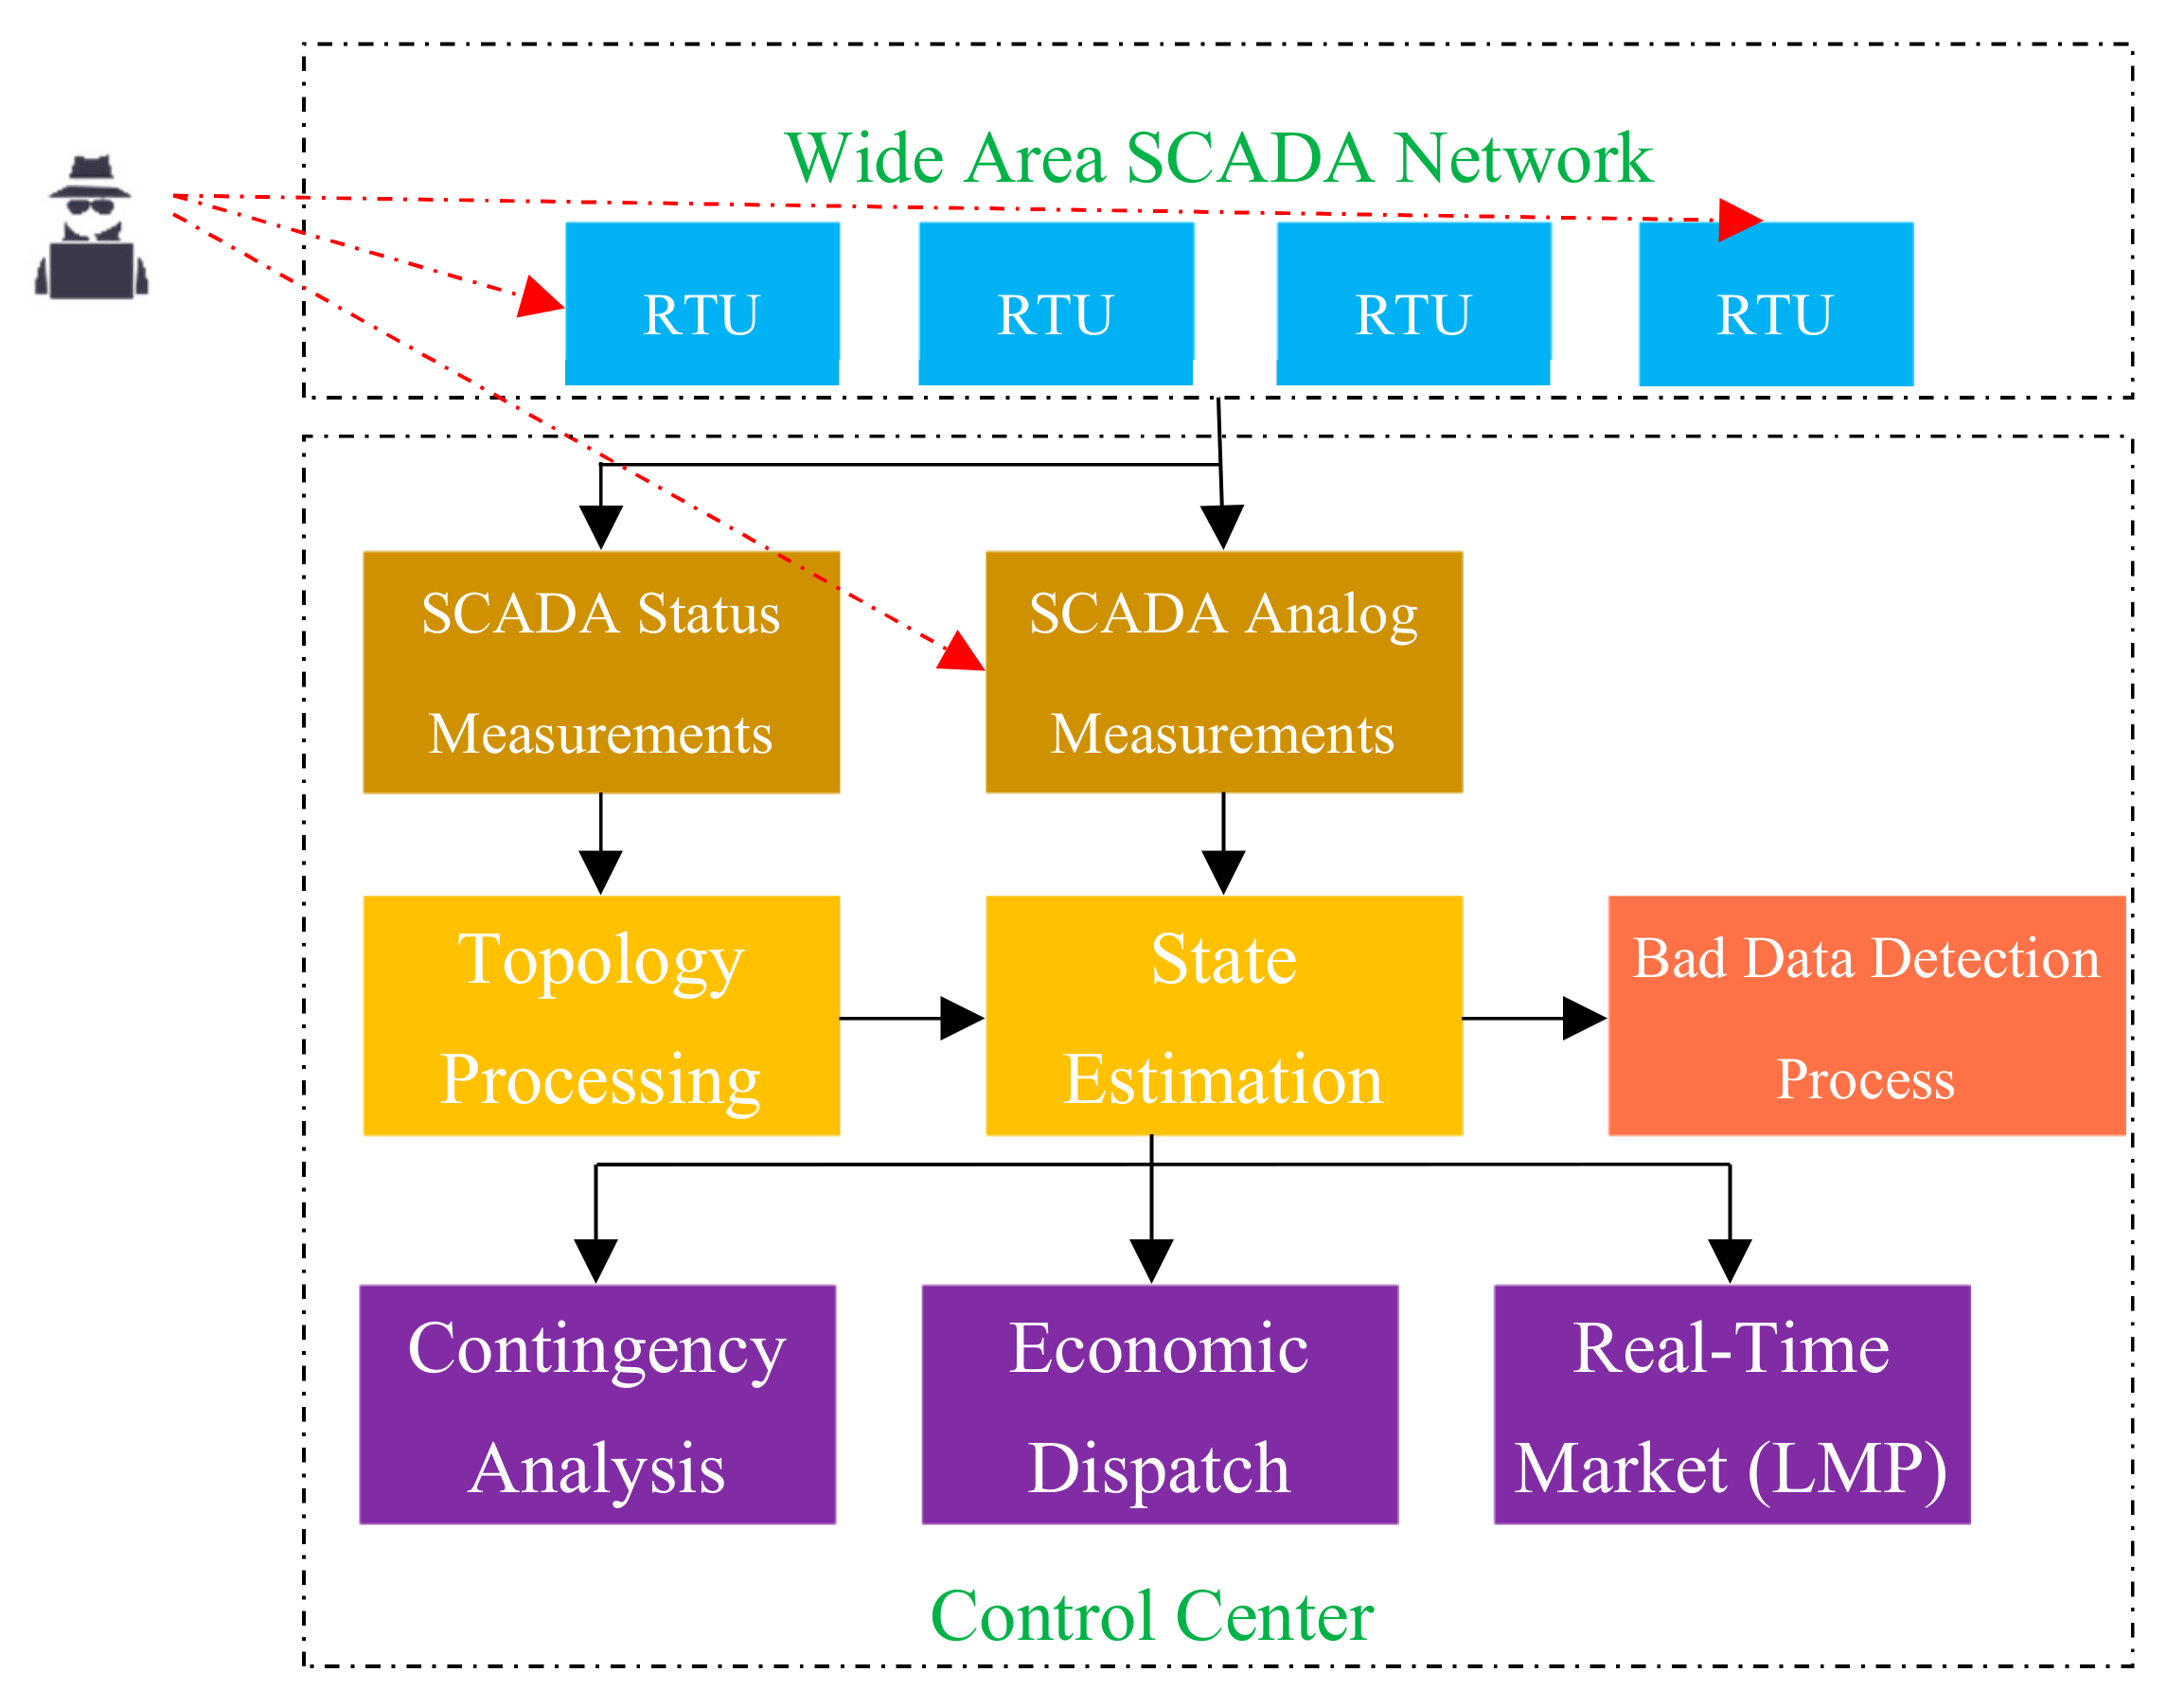
As shown in Figure 1, the attacker may either attack an individual measurement throughout the power system or gathered measurement vectors in the control center. Therefore, two different attack strategies can be considered. The attacker may try to attack the control center directly and alter the aggregated measurement vector in the first scenario. In this case, the number of available measurements that can be changed by the attacker is not restricted. However, in order to keep the attack unidentified, the size of the attack vector must be as small as possible. On the other hand, the attacker can launch an unidentified attack by changing the measurements values directly. In this case, limited measurements should be altered locally and simultaneously. Therefore, the lowest number of measurements that should be attacked to have an undetected and effective attack would be determined in this scenario. Both scenarios are introduced and explained in the following sections:

3.1. Attack Strategy I

In order to attack a SCADA system in a control center, before sending the gathered measurements to the state estimator, there is no limitation for the adversary to attack the number of measurements; whereas, limiting the 2 norm of the attack vector can effectively impact on finding a feasible attack vector. In this case, the optimization problem is as follows:
m i n   a 2 2 = a T I a
s.t.
Y l c + β < f l m a x f ^ l   l c
Y l c + β f l m a x f ^ l   l c
a H c δ
| a i H i c | ϑ i
β > 0
where a 2 2 is the sum of squared arrays of a , a T is the transposed vector of a , and I is the identity symmetric matrix representing the quadratic function. Y l is lth row of the admittance matrix, β is the uncertainty relaxation constant (because of the random distribution of measurements errors and the uncertainty of the real-time power generation and demand, in order to assure the effectiveness of the attack this parameter is needed to be adjusted), f ^ l is the lth estimated power flow line in the original state, c is the attacker’s desired congested line, and δ is the imperfect attack threshold. Equation (21) is the objective function of the optimization problem that the attacker uses to manipulate the gathered measurements in the SCADA system. Equations (22) and (23) lead the state estimation to a situation that the attacker can change the congestion pattern. Equations (24) and (25) restrict the residual vector for each measurement to have an unidentified attack vector in the 2 norm-based residual test and the LNR test, respectively. Equation (24) restricts and controls the sum of residual values for all measurements. Hence, the attacker cannot alter the value of measurements freely and there is a limitation in the aggregated value of the residual vector. Consequently, based on Equation (25) the attacker cannot alter the value of an individual measurement. In this case, there is an upper limit for each array in the attack vector. This constraint leads to change a large number of measurements to launch an undetectable attack. Finally, (26) guarantees that the uncertainty relaxation constant acquires a positive value.

3.2. Attack Strategy II

As illustrated in Figure 1, the attacker may want to attack individual measurements before being gathered by the SCADA system. In this case, the minimum sparsity objective function is considered by the attacker as the following optimization problem:
m i n   a 0 ,
s.t. Equations (22)–(26).
Where a 0 indicates the number of non-zero arrays or sparsity of a . Equation (27) is the objective function of an optimization problem, by which the minimum number of manipulated measurements are found to achieve a successful attack. The constraints are the same as the constraints of the first attack strategy.
Finding the minimum sparsity of the attack vector is a nonlinear and nonconvex problem. Hence, in order to make the optimization problem solvable, the 0 norm optimization problem can be estimated with 1 norm or 2 norm problems [27,29]. Here, in order to have a convex problem with a positive infinite symmetric matrix, a weighted 2 norm optimization problem is substituted with the original problem. In addition, an iterative algorithm similar to the method in [30] is utilized.
The equivalent 2 norm optimization problem is formulated as follows:
m i n   a T ω a ,
s.t. Equations (22)–(26).
Where ω is a weight matrix representing a quadratic function.
An iterative algorithm is performed to compute the optimum solution. The details are illustrated in Algorithm 1. The problem is solved several times to reach the stop criterion constraint.
Algorithm 1. Iteratively reweighted 2 norm minimum sparsity.
Input: congestion pattern, imperfect attack relaxation, residual vector relaxation constraints
Output: attack vector a i , c i
i = 0 , initial weights ω 0 = I
while stop criterion false do
    a i , c i   m i n   a T ω a s.t. ( 22 )   ( 26 )
    ω i + 1 ( | a i + ζ | ) 1 where ζ is a small positive value
               i i + 1
end while

4. Methodology

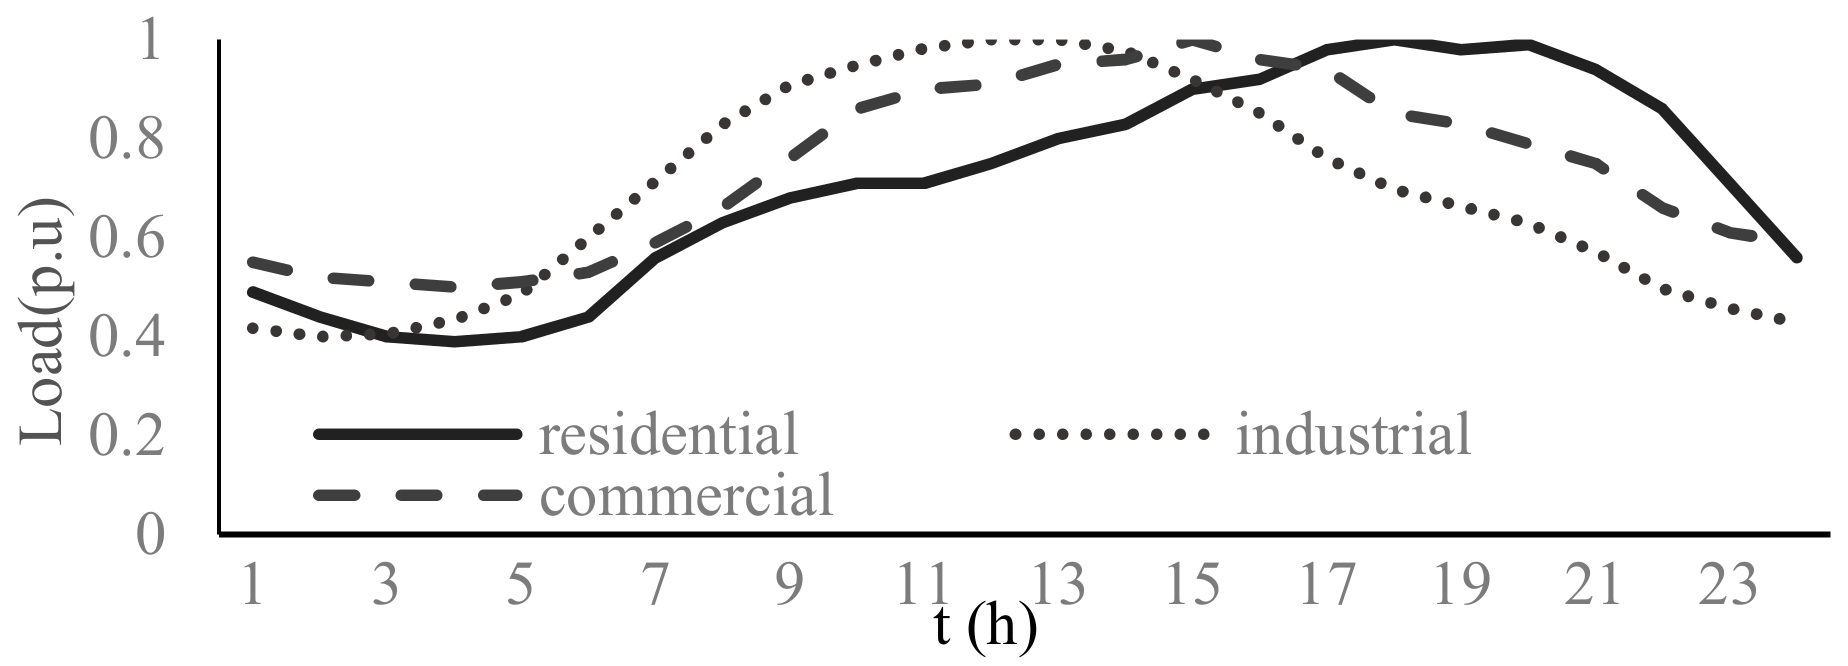
State variables of a power system have repetitive daily behavior in a midterm viewpoint. This periodic behavior is a remarkable indicator with valuable information in historical data. Moreover, an integrated structure of a power network creates identifiable dependencies between state variables and measurements across the grid.
NARX is an important class of discrete-time nonlinear system that employs historical values of output variable and exogenous input variables into the model. The equation for NARX is expressed as follows:
y ( t + 1 ) = f [ y ( t ) ,   ,   y ( t n y ) ,   u ( t ) ,   ,   u ( t n u ) ]
where u ( t ) and y ( t ) indicate input and output variables for nonlinear time series modeling, respectively; n u and n y represent the input and output delay, respectively; and f is a nonlinear function. The output variable is a function of the previous values of the output signal and past values of independent input variables. The function f can be approximated by a neural network.
ANN has been widely employed in electrical engineering for forecasting undetermined parameters. ANN is a robust engine for prediction, classification, clustering, pattern recognition, and process modeling. It provides nonlinear mapping solutions between input features and output, due to its learning, generalization, error tolerance, and parallel processing abilities. The advantage of not requiring a clear relationship between inputs and outputs renders a neural network an attractive choice for forecasting [31].
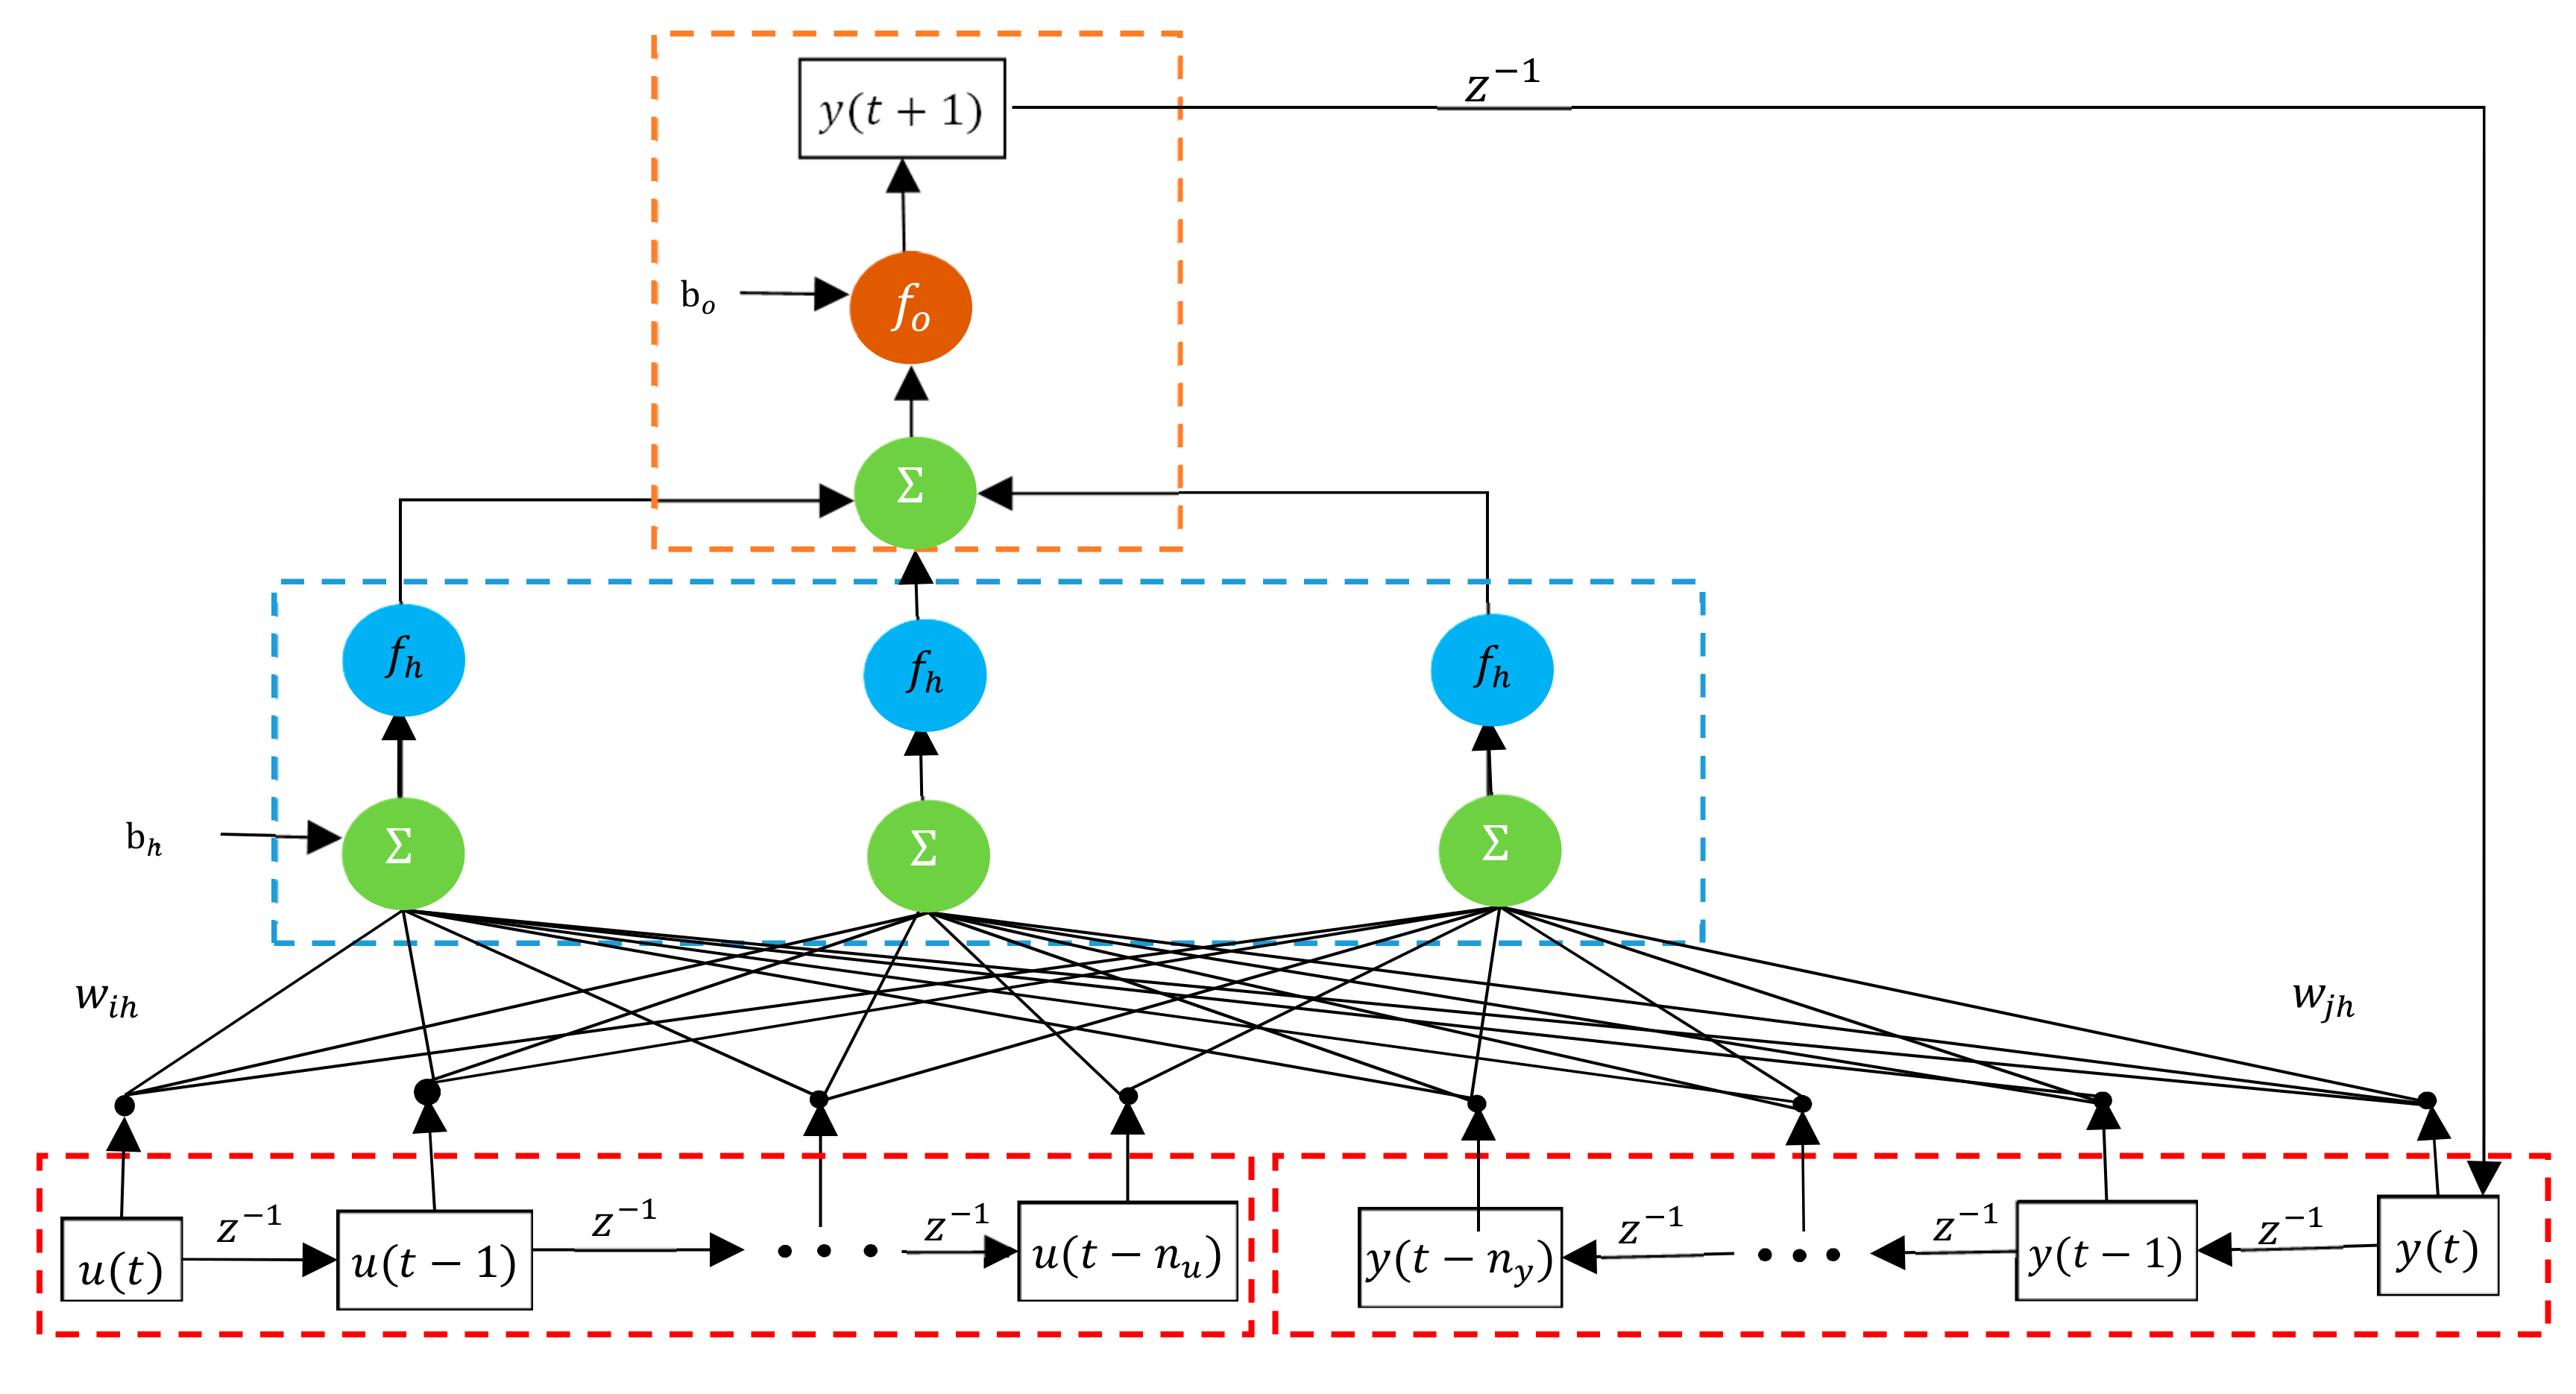
A further developed neural network configuration is the recurrent neural network (RNN), namely, a supervised learning engine that contains feedback loops. The memorizing ability in RNN renders it interesting for time series prediction and modeling with historical data. The recurrent NARX neural network (RNARXNN) is a proper engine for chaotic nonlinear forecasting problems. RNARXNN uses feedback from the output layer, instead of hidden layers in the conventional RNN structure. This configuration improves the learning capability, convergence, and generalization performances of the learning engine [32].
A schematic diagram of the RNARXNN model with one time-series is depicted in Figure 2. The formulated RNARXNN is shown as follows.
y ( t + 1 ) = f 0 [ b 0 + h = 1 N h w h 0 f h ( b h + i = 1 d u w i h u ( t i ) + j = 1 d y w j h y ( t j ) ) ]
where w i h , w j h and w h 0 are weights between independent input to the hidden layers, weights between input with past values of output to the hidden layer and weights between the hidden layer to the output layer, respectively. b 0 and b h are biases, and f 0 and f h are activation functions (linear) of the hidden layer and output layer, respectively.
A recent formulation is used to predict state variables of a power system. In this case, the input variable is the historical value of the measurement vector and the output is the state variables of the power system. Accordingly, in order to develop RNARXNN, Equation (30) is restated as follows:
x ¯ ( t + 1 ) = f 0 [ b 0 + h = 1 N h w h 0 f h ( b h + i = 1 d u w i h z ¯ ( t i ) + j = 1 d y w j h x ¯ ( t j ) ) ]
where z ¯ ( t ) indicates the measurement vector at the time interval t and x ¯ ( t + 1 ) is the predicted state variable by using the RNARXNN method.
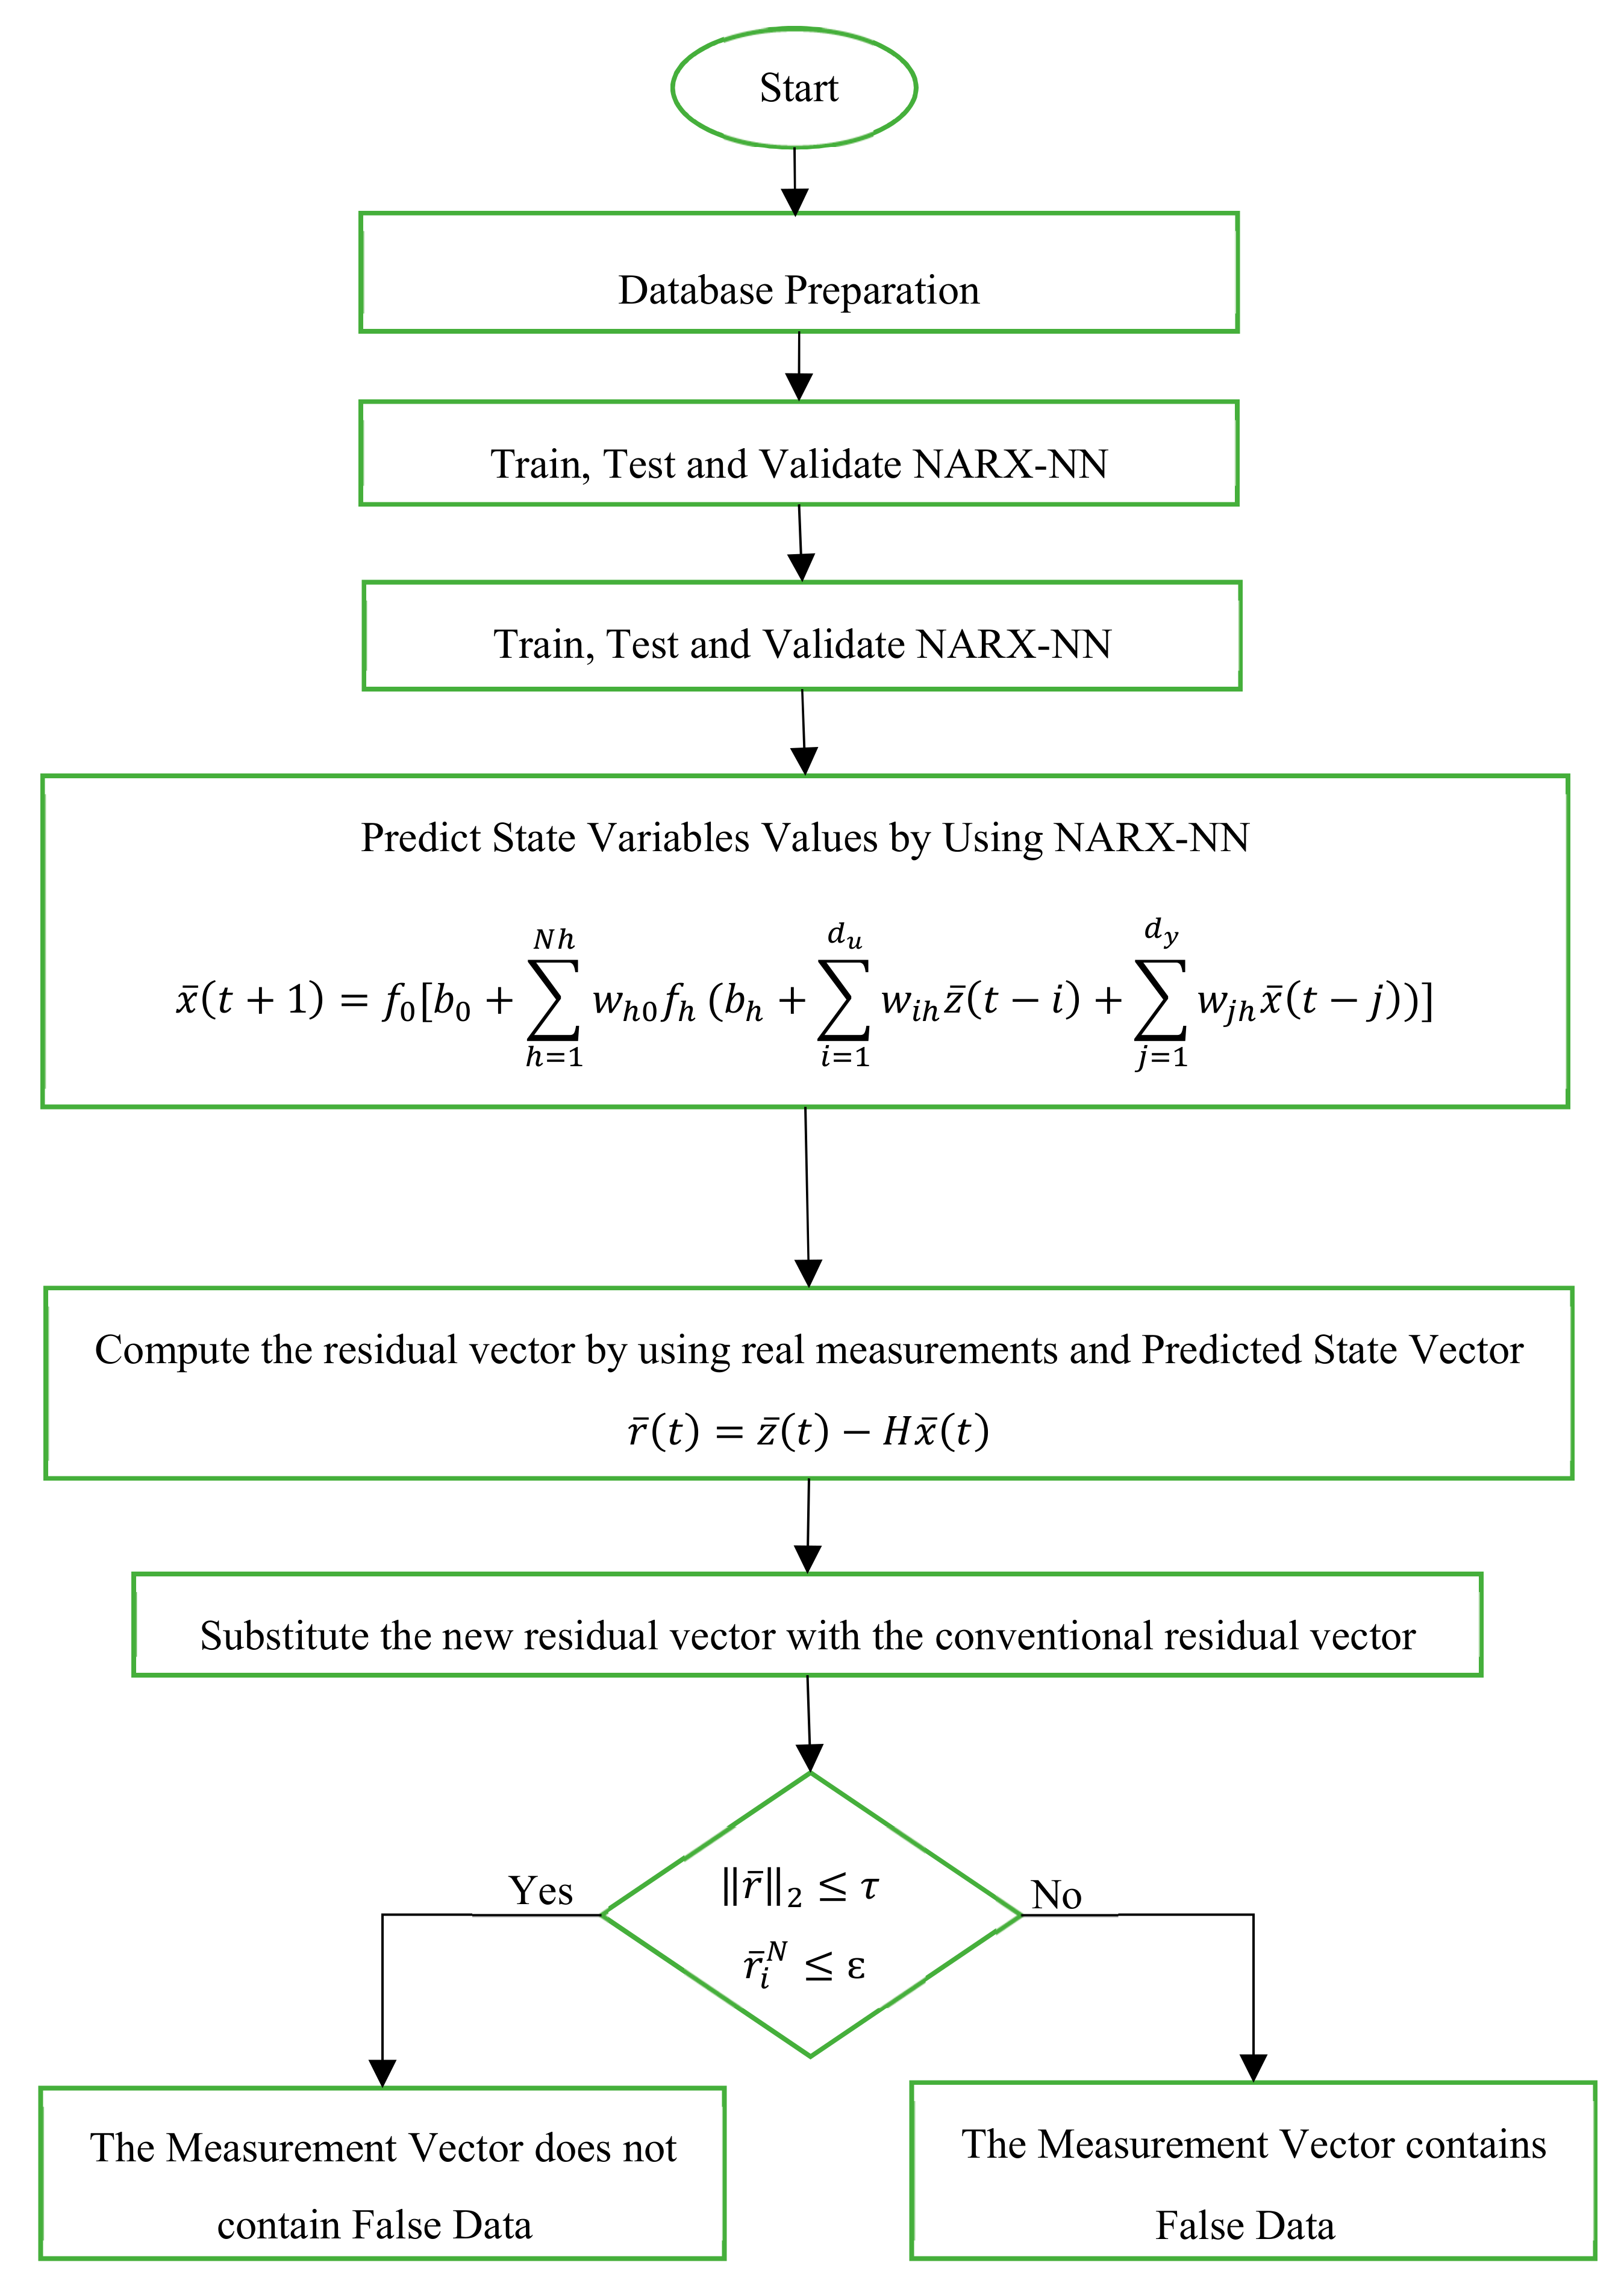
By applying this method, state variables of a power system can be forecast with previous measurement values as input vectors. The result of forecasting may contain uncertainty and approximation, which is not as accurate as analytical methods like WLS for the estimation of states. However, it can be exploited to evaluate the accuracy of measurements and detect false data.
Therefore, by using the forecasted states, the residual vector is computed as follows:
r ¯ ( t ) = z ¯ ( t ) H x ¯ ( t )
where r ¯ ( t ) is the estimated residual vector by using the predicted state variables. Instead of the conventional computation method for the residual vector (Equation (6)), the RNARXNN-based residual vector is utilized to test the measurements. Hence, the 2 norm-based residual test equation will be updated as follows:
r ¯ ( t ) 2 τ
consequently, the LNR test is changed to the following:
r ¯ ( t ) i N = r ¯ ( t ) i i i ε
Therefore, the FDIA will be identified using the updated value of the residual vector in the conventional tests; however, this type of attack could alter the power system characteristics without being detected by the conventional BDD procedure. The flowchart of the proposed method is illustrated in Figure 3.

5. Data Preparation and Application

5.1. Database Generation

According to Figure 4, the IEEE 14-bus test system is utilized to examine the proposed method [33]. In order to investigate the method more clearly, some modifications are undertaken in the system. Accordingly, the generation capacity is altered to 330 MW for unit 1, the line power flow limitation between buses 2–3, 4–5, and 6–11, are assumed to be 50 MW, 50 MW, and 30 MW, respectively. The power injection and power flow transmitters are considered for all buses and line ends. The measurement vector z consists of 40 active power flow and 14 active power injection. The normal distribution is assumed for measurement errors. The standard deviation of injection and power flow measurements are determined as 0.01 and 0.008, respectively. The state variable vector x consists of voltage angles of 13 nodes.
DC power flow and DC state estimation are performed by using the MATPOWER toolbox in MATLAB to examine the proposed model.
The load profiles illustrated in Figure 5 are presumed to perform DC power flow and state estimation in 5-min intervals during a day [34]. According to Table 1, various proportions of residential, commercial, and industrial load are determined for each node in the power system.
In order to train and test the introduced ANN, a dataset of historical data is provided. As mentioned, the state estimation and state variables are computed by using load profiles and generation units by DC Optimal Power Flow (DCOPF) program at 5-min intervals. In order to consider the variation and uncertainty in the load and generation, load profiles of all nodes are generated by a Gaussian distribution with a 5 percent deviation ( σ = 5 % ) in comparison to the original load profile. A subset of data containing 6048 measurement vectors and state variables is provided to train and test the network.

5.2. Structures of RNARXNN

There are two different architectures for RNARXNN, namely, series-parallel architecture, in which real output values are directly fed into the engine from the dataset; and parallel architecture, wherein estimated outputs are feedbacked into the neural network. Therefore, the series-parallel architecture is utilized for training and testing, whereas the parallel architecture is performed for real-time estimation. Sigmoid and linear activation functions are selected for the input neurons and hidden layer, respectively. A random selection of 70% of the historical data is used for training the network, 15% is exploited for testing the network, and 15% is used for validation. The maximum number of epochs is set to 100 and the performance goal is set as 0.0000001 after trial and error procedure in order to attain the best result. In order to examine the accuracy and precision of estimated states, mean square error (MSE) is adopted as an evaluation index, which is defined as follows:
M S E = 1 N ( x ¯ i x ¯ ^ i ) N
where N is the number of sampling observations and x ¯ i , x ¯ ^ i are measured and predicted values, respectively.

6. Numerical Results

This section presents the simulation results of the proposed method. In this case, FDIA strategies are discussed; consequently, the results of ANARXNN are illustrated, and, finally, the efficiency of the proposed method is indicated.

6.1. FDIA Strategies

Two different strategies of FDIA are formulated in Section 3. Both problems are quadratic optimization problems in the form of a T Q a with convex constraints. In this case, provided that the symmetric matrix Q is a positive definite matrix and the constraints are convex, the problem has a unique answer. In strategy I, the identity matrix I is positive and definite; hence, the problem has a unique answer. In strategy II, the Q equivalent symmetric matrix is checked in an iteration to be positive and definite. MATLAB software is utilized to solve these problems. The nominal load profile is considered for this simulation. In order to consider the impact of the Gaussian distribution error of measurements, the Monte Carlo method is implemented, with the aim of attaining the expected results. Accordingly, the state estimation is performed 1000 times by generating and adding an accidental error vector to the measurement vector. The original congestion pattern is c = [ 1 ] in this case, which means line 1 is congested throughout all transmission lines. According to the assumption, lines 1, 4, and 5 have a power transmission limitation. Hence, in order to change the congestion’s pattern, the attacker has seven options. The simulation is performed for these seven different options and the results are illustrated in Table 2.
The first column illustrates various congestion patterns selected by the attacker. The percentage values of IL in the 2nd and 5th columns indicate the identification likelihood by the conventional BDD processor for both attack strategies. E ( a 0 ) is the expectation value of sparsity of the attack vector. E ( a z ) is the proportion of the size of the attack vector to the measurement vector. According to the results, in order to attack the state estimation and change the congestion pattern, all measurements are altered in strategy I; however, fewer measurements are manipulated in strategy II. On the other hand, the proportion of the attack vector in strategy I is lower in all attacks. Actually, the result describes the objective functions in the attack strategies. The optimization problem tries to minimize the size of the attack vector and there is no limitation in the number of measurements; hence, all the measurements are altered to have an attack with the minimum size of attack vector. On the contrary, the number of measurements to be altered is less in strategy II; meanwhile, the size of the attack vector is not optimized. The identification likelihood is not dependent on the attack strategy and congestion pattern. However, the conventional BDD processor only identifies less than 10% of the attacks.

6.2. RNARXNN Training and Testing

By using historical data and the ANN toolbox in MATLAB software, the proposed estimation of power system states is performed for different values of fundamental parameters and the results are illustrated in Table 3.
According to the results illustrated in Table 3, the difference in the values of the input and feedback delay as well as hidden layer neurons do not impact remarkably on the performance of the network. In fact, owing to the high correlation between input and output variables, the network can predict the states reliably. However, the number of hidden layer neurons can desirably impress the number of epochs and the time duration for training the network. Accordingly, the higher the number of hidden layer neurons, the higher the time duration and the lower the number of epochs in the same input and feedback delays. In addition, it is quite obvious that, by increasing the value of delay, the time duration is increased to train the network. Figure 6 illustrates the training, validation and test performance of the state estimation for various delay times and different sizes of hidden layers. According to the results, the proposed method can predict the state vector effectively in all cases.

6.3. Proposed Strategy for Large Scale Power System

The real power system contains a large number of buses with several state variables and measurements. Hence, the number of input and output variables in NARX network would be much more than the proposed standard system. However, the large number of variables makes the results more accurate, because of including all correlations and links, the network would be more complicated and the training time duration may be intolerable and a more powerful computer system is needed [35]. In order to tackle this drawback, a simple still effective strategy is implemented here to make the method practical for real-world power systems. The power system is divided into several subsystems to reach to an appropriate subsystem with a smaller number of state variables and measurements. Accordingly, an individual network is considered for each zone where the number of inputs and outputs is considerably smaller than the whole power system. For instance, consider the IEEE 14-bus test system in Figure 4. The system has been divided into two different subsystems. Zone 1 contains five state variables and ten measurements. Consequently, zone 2 involves nine state variables and ten measurements. In order to examine the performance of the proposed method, two different networks have been considered for each zone.
The results in Table 4 illustrate that the network training time has been decreased dramatically in comparison to the results for the whole system listed in Table 3. Meanwhile, the mean square error is near the same as the total system. Therefore, using two separate networks the state variables can be predicted with the same accuracy. This method can be implemented for large power systems. Hence, considering the results, it can be illustrated that the proposed method can be easily utilized for various power systems with a different number of measurements and state variables. In addition, Figure 7 depicts the performance of the network for the data from both zones with different hidden layers.

6.4. FDIA Detection Using RNARXNN

In order to examine the efficiency of the proposed method, a typical day is selected and a specific time-spot is opted for an FDIA on the state estimation without being identified by the conventional BDD processor. The results for the two introduced attack strategies are illustrated in Figure 7.
As shown in Figure 8, the value of state variables is changed in a specific time spot to alter the congestion pattern. Actually, in the time interval, the line between bus number 1 and 2 is congested; hence, LMP values are not the same in all buses. However, FDIA is considered here to alter the status of the congested line to a non-congested line. This attack can alter LMPs in the real-time power market virtually. The measurement vector is altered in such a way that the residual vector is still a small value and the attack cannot be realized by using the conventional BDD processor.
Instead of using the conventional residual vector and bad data detection processor that is not efficient in the case of optimal FDIA, the proposed method can detect similar false data at a higher rate. In order to examine the proposed method, a specific network is selected, in which the input and feedback delay is 4 and the size of the hidden layer is 20. Figure 9 illustrates the results of the state variables predicted by the trained network. In this case, the residual vector computed by Equation (32) exceeds the threshold and the presence of bad data is identified in measurement vectors. Table 4 illustrates the results of various attack scenarios and the performance of the proposed method to identify the attack considering the uncertainties of measurement error.
The second column in Table 5 demonstrates the identification likelihood of the 2 norm-based residual test by using RNARXNN-based BDD processor. Accordingly, the third and fourth columns depict the identification likelihood and the number of identified measurements of the LNR test for attack strategy I, respectively. Similarly, the results for attack strategy II are illustrated in the rest of the columns. According to the results, the RNARXNN-based BDD processor is able to detect FDIAs with remarkable accuracy. Except for the first scenario, all other scenarios are detected with more than 92% precision. The exception in the first scenario happens because the altered pattern is extremely similar to the original congestion pattern without considerable variations; thus, the estimation is performed with lower accuracy compared to other scenarios. The 100% percentage values in columns 3 and 6 indicate that the residual value of at least one measurement is more than the threshold preset value for all runs. Comparing two attack strategies, the number of manipulated arrays is lower in attack strategy II; nevertheless, the majority of the manipulated measurements are detected by using the proposed method.

7. Conclusions

This paper proposes a NARX-based BDD processor to identify FDIAs on power system state estimation. The desired state variables are predicted by using a NARX network and are compared to computed state variables. Hence, by using the residual vector, potentially bad data are identified. The computed state variables passing the BDD processor can be applied as accurate results in power system operation and market clearance.
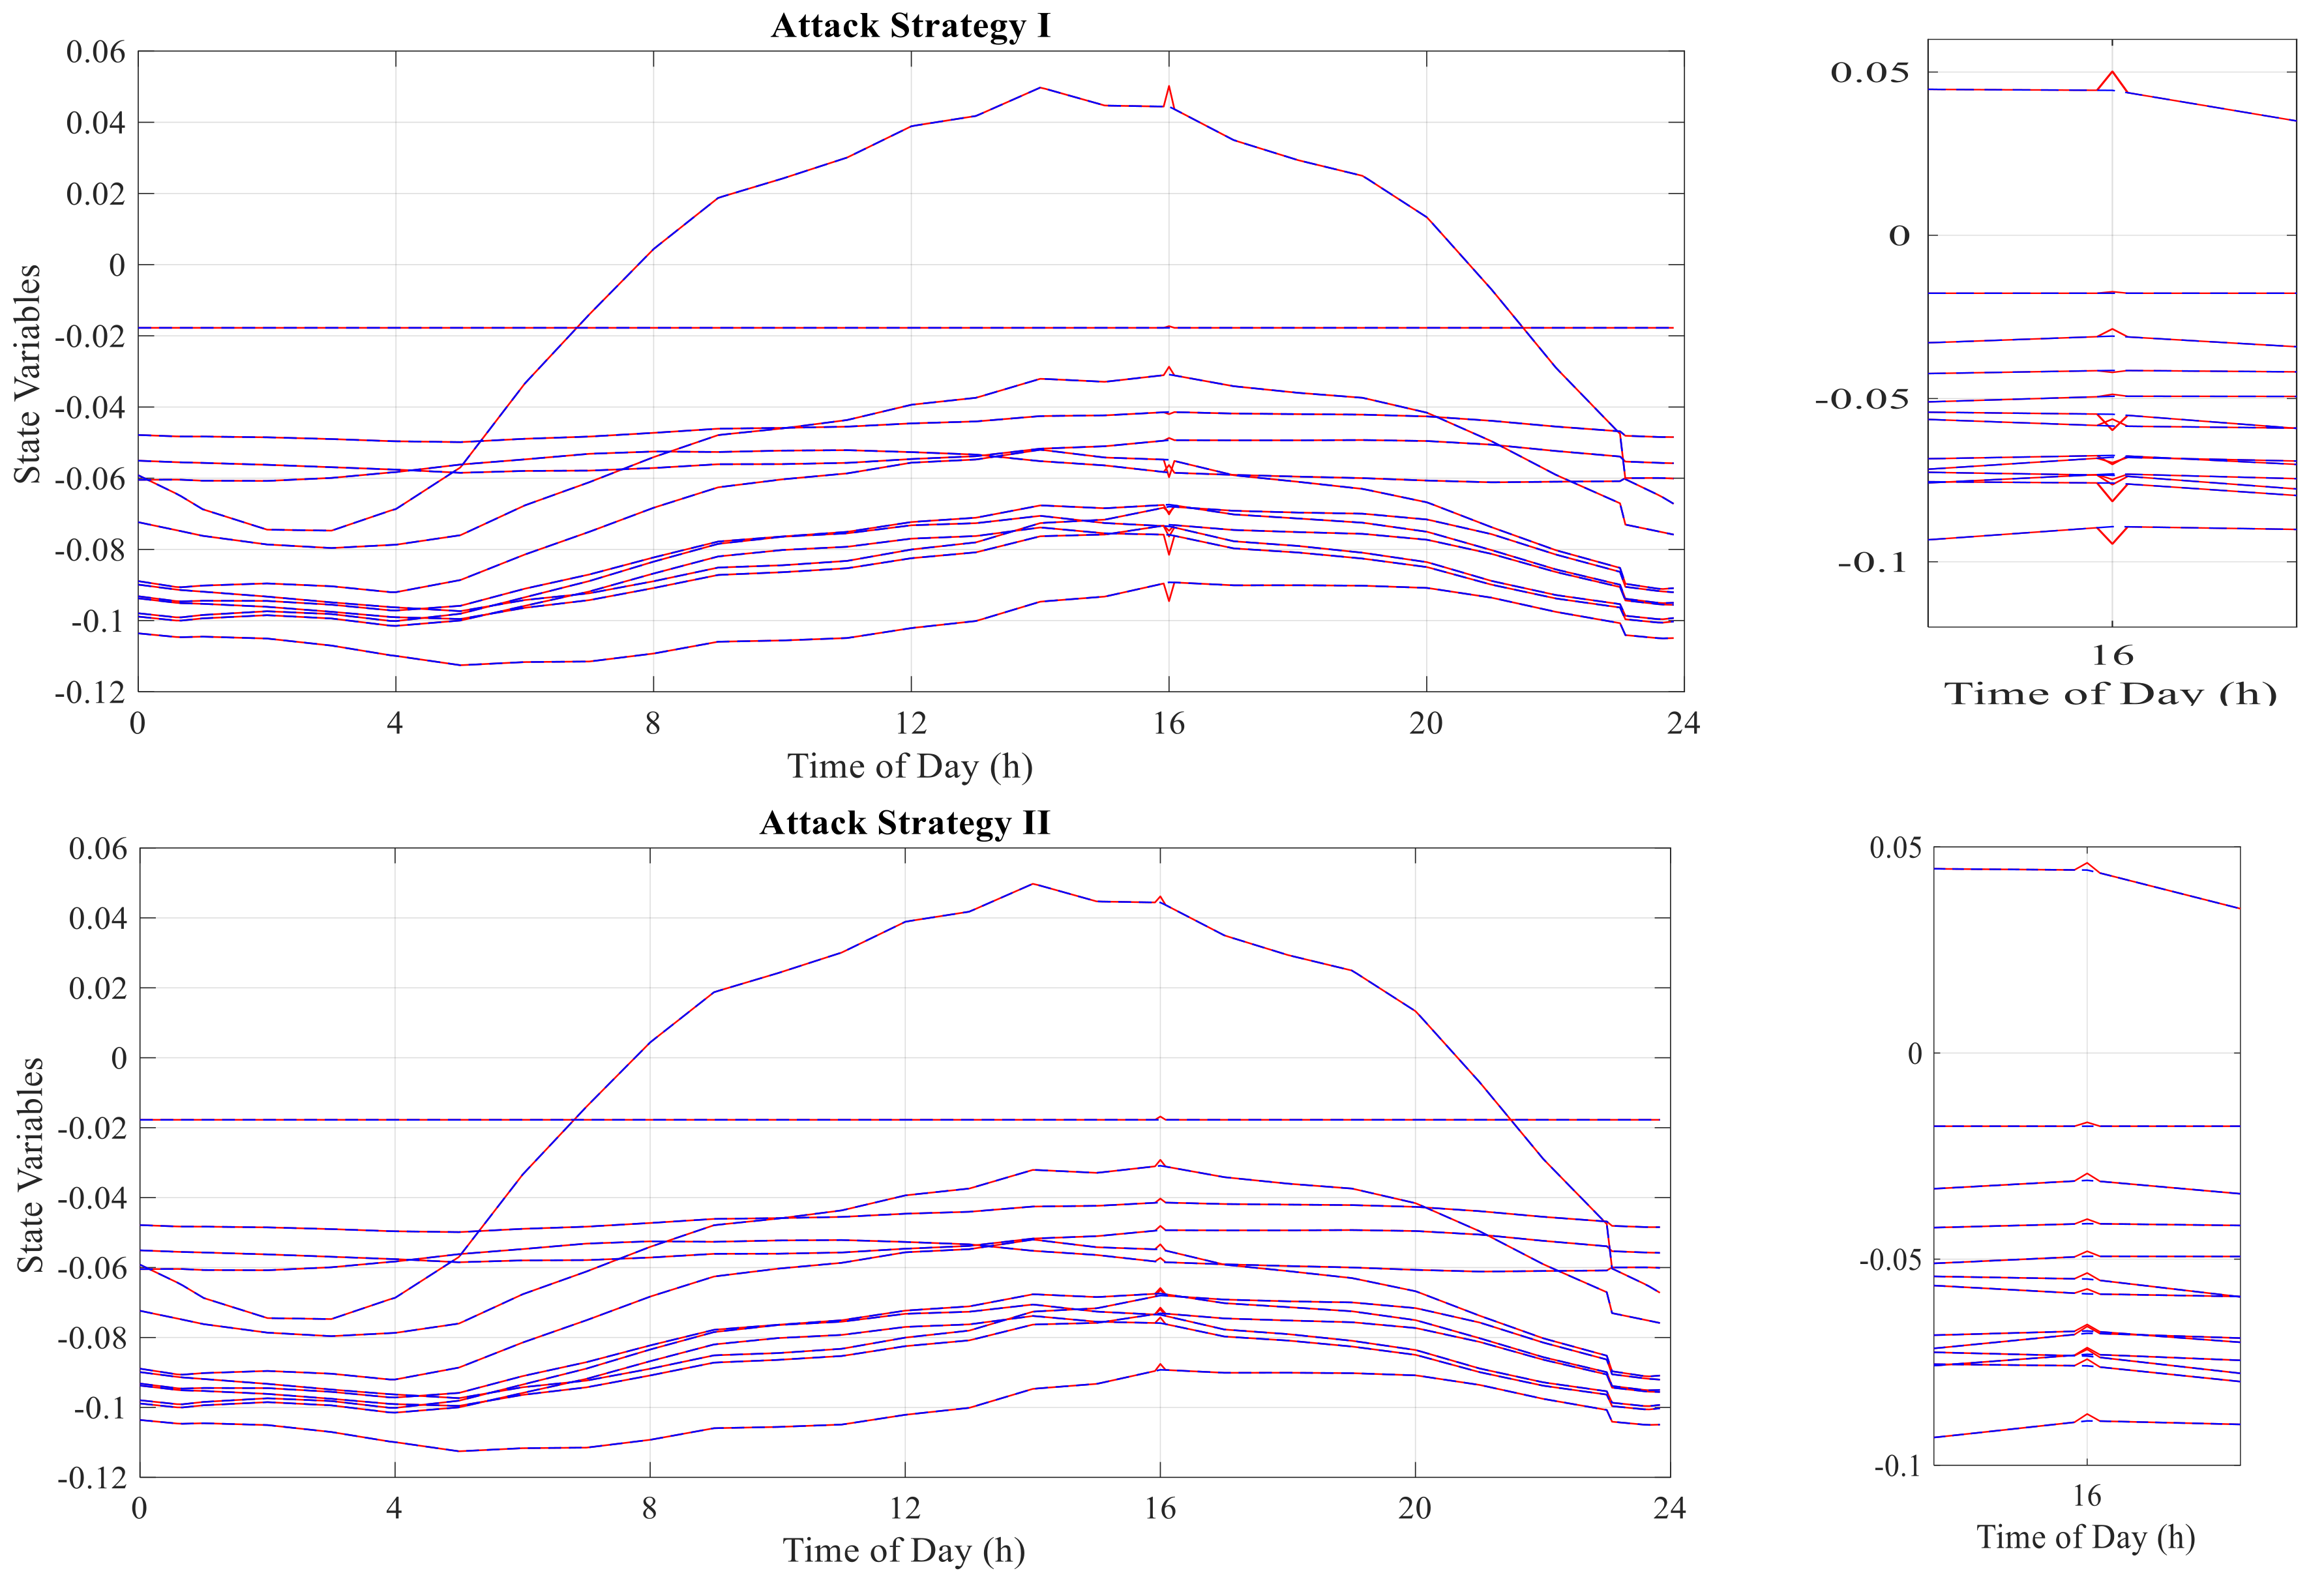
Two different FDIA strategies are considered to formulate and simulate a cyber-attack on power system state estimation. It is illustrated that this kind of attack can be launched on state estimation and can alter the line congestion pattern without being detected by conventional bad data detection processors. The results depict that only less than 10% of the formulated attacks are detected by conventional processors.
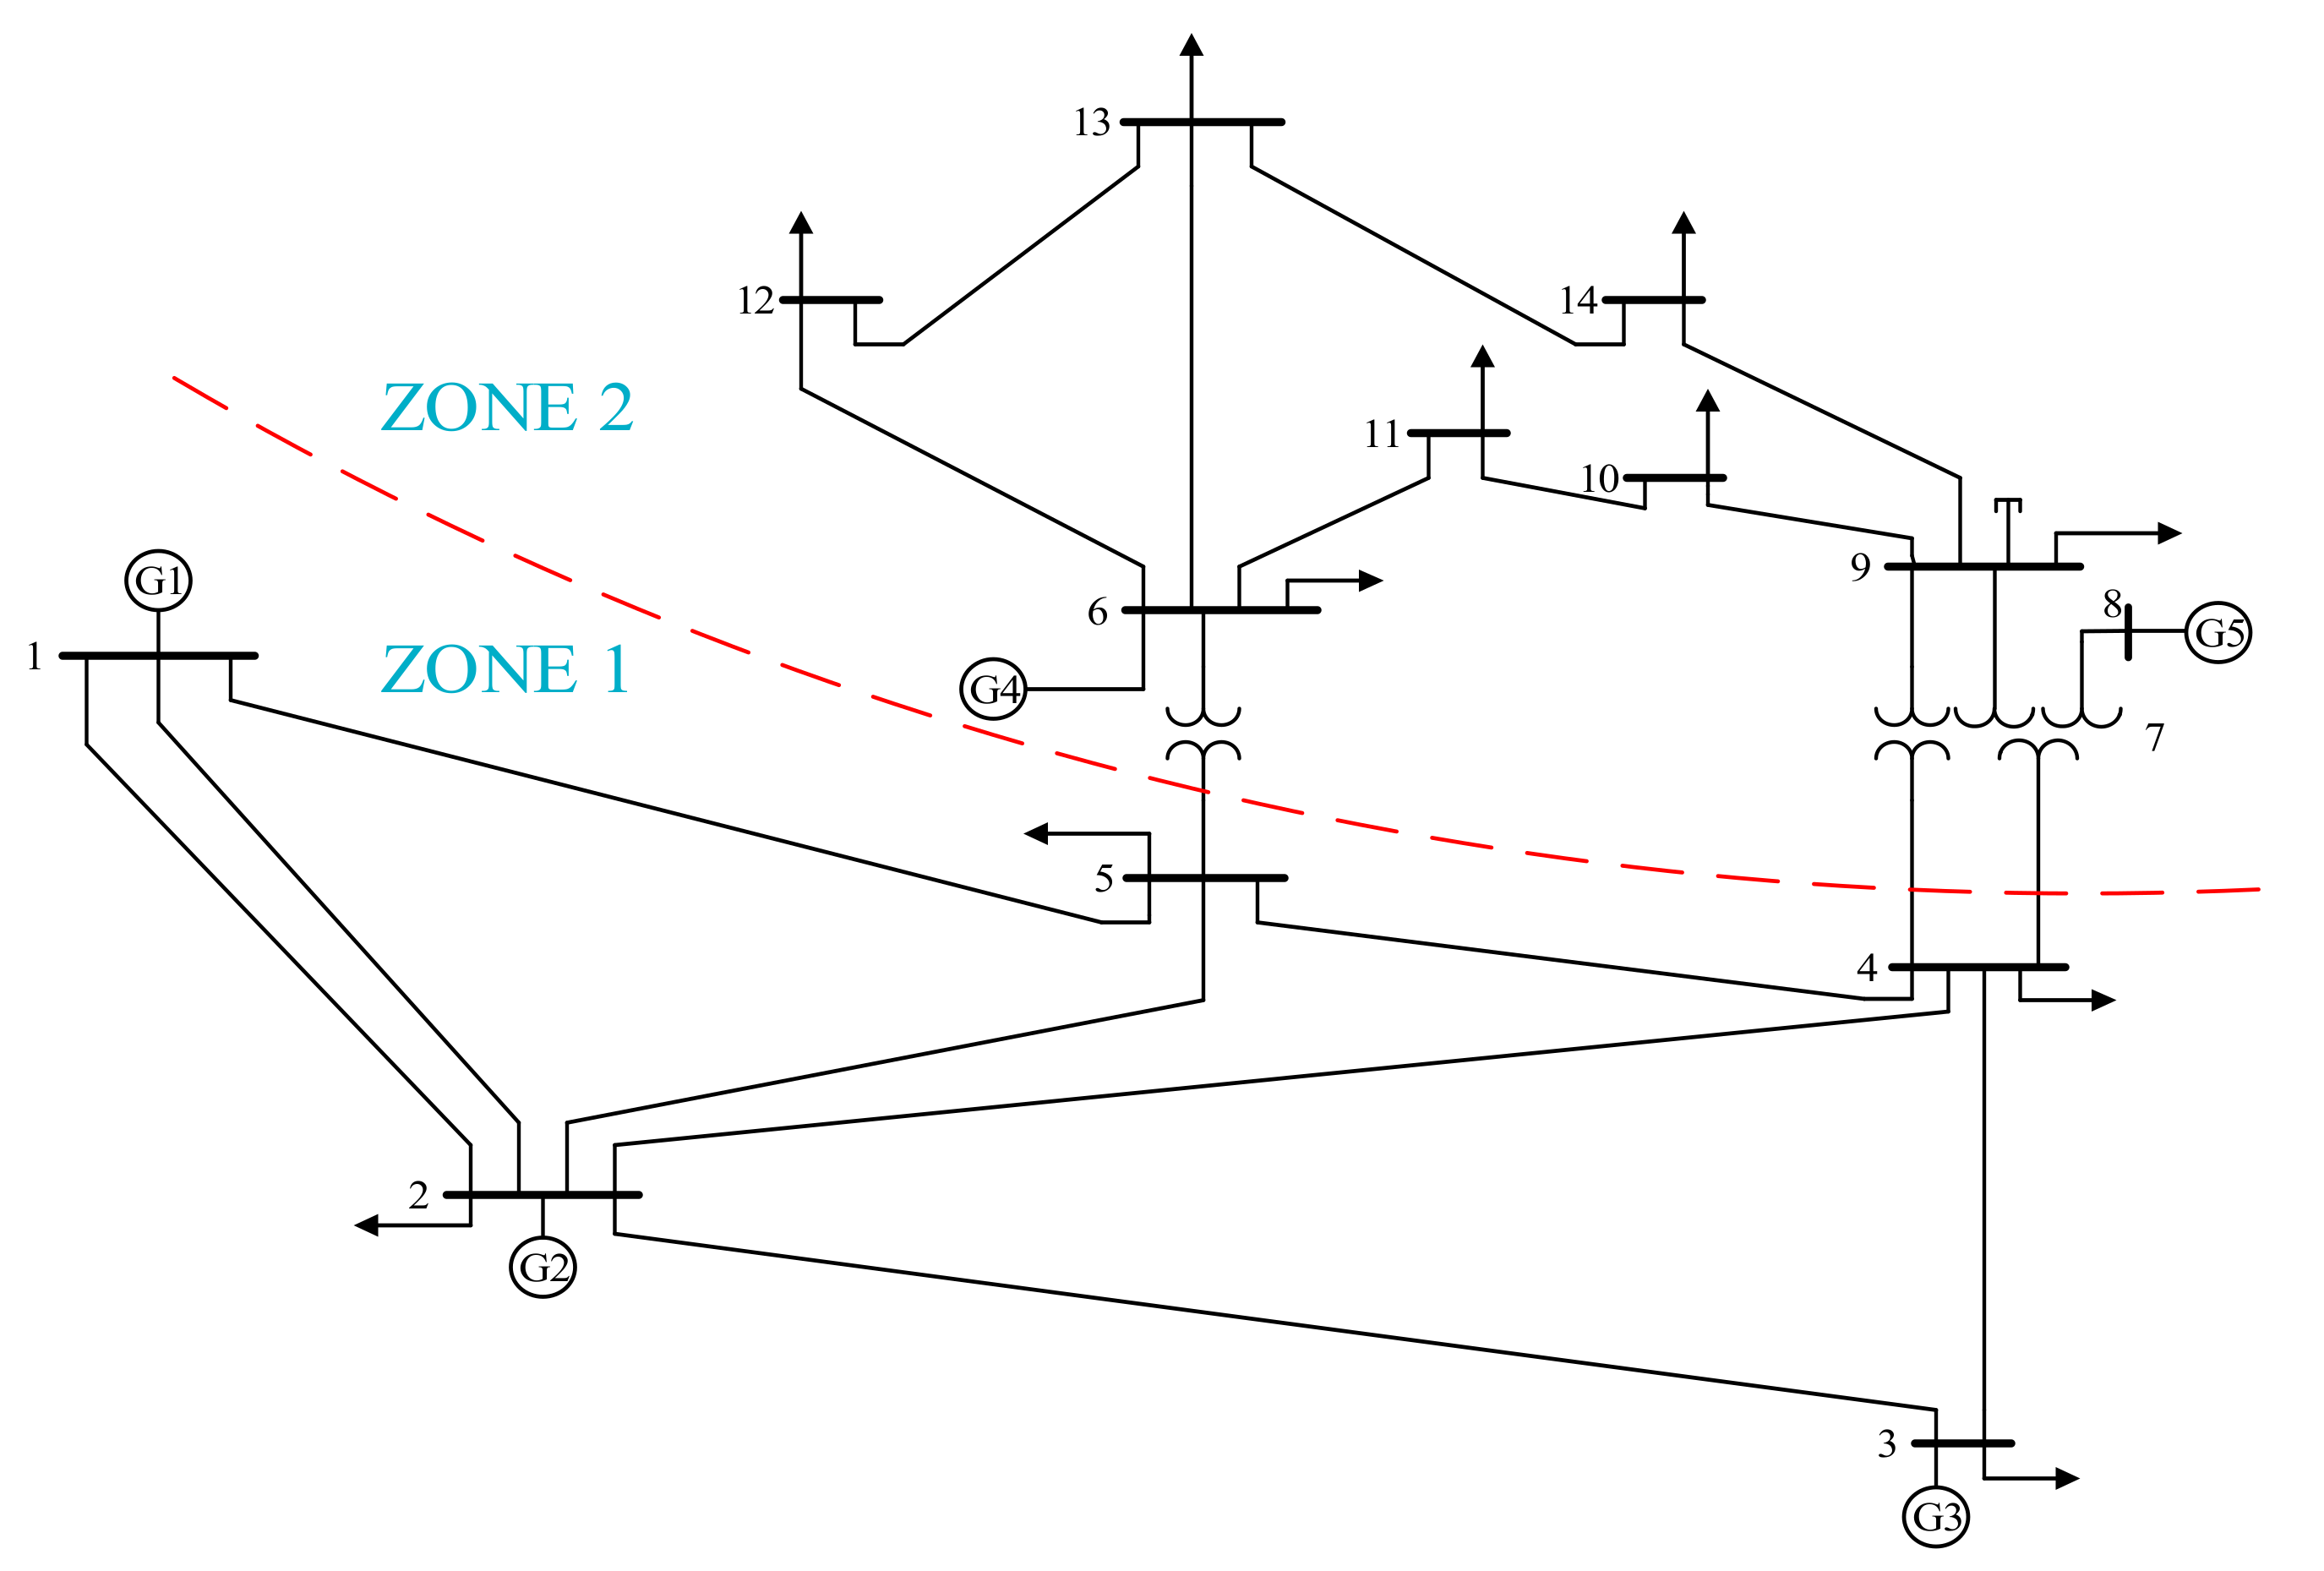
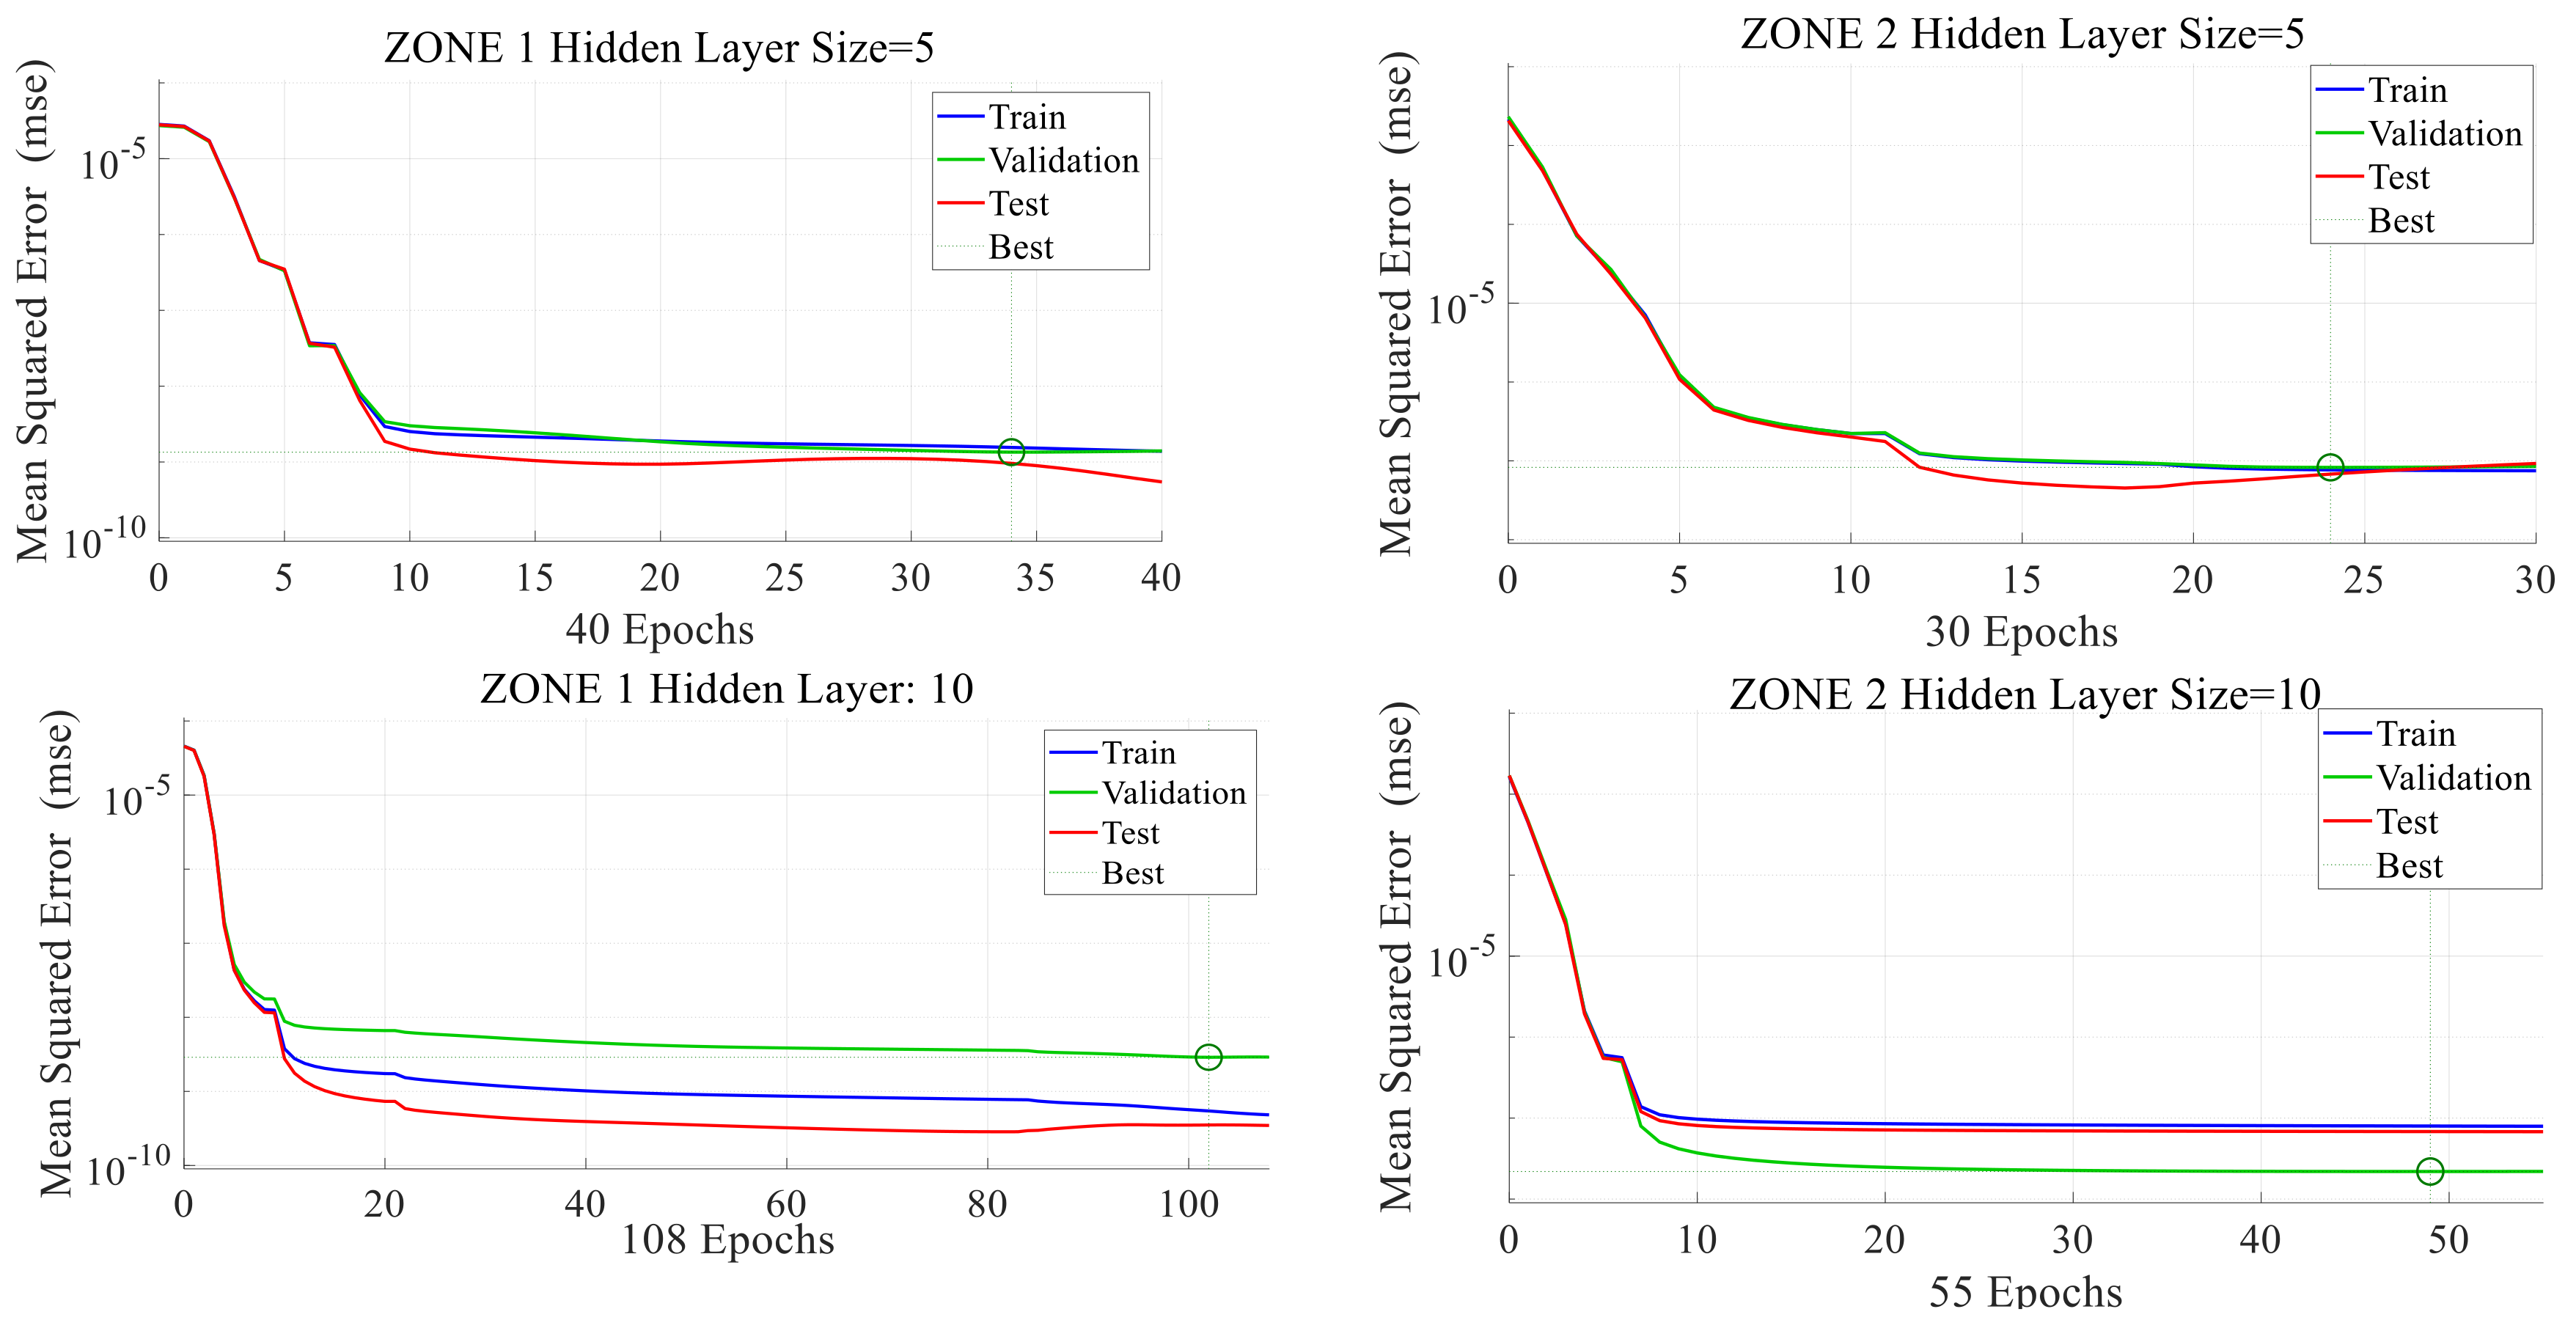
The proposed method is implemented in the IEEE 14-bus standard test system. After having prepared adequate historical data for power system measurements and state variables, an RNARXNN-based model is developed to train, test, and validate the data in order to identify FDIAs on state estimation. According to the results, owing to the correlation between input and feedback variables, the network is trained and tested with great performance and can predict the state variable vector appropriately. The results illustrate the high efficiency of the proposed method for bad data detection of FDIA on state estimation.
The proposed method can be implemented on large scale power systems by dividing the power system into several subsystems and training individual network for each subsystem. This method can decrease the training time duration by keeping the performance of the network as nearly accurate as the results of the primary system.
In future work, the presented method can be extended for AC state estimation by adding reactive power measurements and PMUs to the measurement vector and voltage magnitude to state variables.

Author Contributions

M.G. conceived the present idea. S.B. and S.N.F. developed the theory and computations. S.S. and K.-w.C. encouraged S.B. and S.N.F. to investigate and supervised the findings of this work. All the authors discussed the results and contributed to the final manuscript.

Funding

This research received no external funding.

Conflicts of Interest

The authors declare no conflict of interest.

Nomenclature

ANNArtificial Neural Network
BDDBad Data Detection
CPSCyber-Physical System
DoSDenial-of-Service
DSSE Distribution System State Estimation
FDIAFalse Data Injection Attack
KLDKullback-Leibler Distance
LMPLocational Marginal Price
LNRLargest Normalized Residual
NARXNonlinear Autoregressive Exogenous
NARXNNNonlinear Autoregressive Exogenous Neural Network
PMUPhasor Measurement Unit
PSOPower System Operator
RNARXNNRecurrent Nonlinear Autoregressive Exogenous Neural Network
RNNRecurrent Neural Network
SCADASupervisory Control and Data Acquisitions
SCEDSecurity Constrained Economic Dispatch
SVEState Vector Estimator
SVMSupport Vector Machine
WLSWeighted Least Squares

References

  1. Deng, R.; Zhuang, P.; Liang, H. CCPA: Coordinated cyber-physical attacks and countermeasures in smart grid. IEEE Trans. Smart Grid 2017, 8, 2420–2430. [Google Scholar] [CrossRef]
  2. Wang, W.; Lu, Z.J.C.N. Cyber security in the smart grid: Survey and challenges. Comput. Netw. 2013, 57, 1344–1371. [Google Scholar] [CrossRef]
  3. Yuan, Y.; Li, Z.; Ren, K. Modeling load redistribution attacks in power systems. IEEE Trans. Smart Grid 2011, 2, 382–390. [Google Scholar] [CrossRef]
  4. Jia, L.; Thomas, R.J.; Tong, L. Malicious data attack on real-time electricity market. In Proceedings of the 2011 IEEE International Conference on Acoustics, Speech and Signal Processing (ICASSP), Prague, Czech Republic, 22–27 May 2011; pp. 5952–5955. [Google Scholar]
  5. Wang, C.; Ten, C.-W.; Hou, Y.; Ginter, A. Cyber inference system for substation anomalies against alter-and-hide attacks. IEEE Trans. Power Syst. 2017, 32, 896–909. [Google Scholar] [CrossRef]
  6. Xie, L.; Mo, Y.; Sinopoli, B. Integrity data attacks in power market operations. IEEE Trans. Smart Grid 2011, 2, 659–666. [Google Scholar] [CrossRef]
  7. Liu, Y.; Ning, P.; Reiter, M.K. False data injection attacks against state estimation in electric power grids. ACM Trans. Inf. Syst. Secur. (TISSEC) 2011, 14, 13. [Google Scholar] [CrossRef]
  8. Hug, G.; Giampapa, J.A. Vulnerability assessment of AC state estimation with respect to false data injection cyber-attacks. IEEE Trans. Smart Grid 2012, 3, 1362–1370. [Google Scholar] [CrossRef]
  9. Kim, J.; Tong, L.; Thomas, R.J. Subspace methods for data attack on state estimation: A data driven approach. IEEE Trans. Signal Process. 2015, 63, 1102–1114. [Google Scholar] [CrossRef]
  10. Liu, X.; Li, Z. False data attacks against AC state estimation with incomplete network information. IEEE Trans. Smart Grid 2017, 8, 2239–2248. [Google Scholar] [CrossRef]
  11. Yu, Z.-H.; Chin, W.-L. Blind false data injection attack using PCA approximation method in smart grid. IEEE Trans. Smart Grid 2015, 6, 1219–1226. [Google Scholar] [CrossRef]
  12. Zhao, J.; Zhang, G.; Dong, Z.Y.; Wong, K.P. Forecasting-aided imperfect false data injection attacks against power system nonlinear state estimation. IEEE Trans. Smart Grid 2016, 7, 6–8. [Google Scholar] [CrossRef]
  13. Kosut, O.; Jia, L.; Thomas, R.J.; Tong, L. Malicious data attacks on the smart grid. IEEE Trans. Smart Grid 2011, 2, 645–658. [Google Scholar] [CrossRef]
  14. Jia, L.; Kim, J.; Thomas, R.J.; Tong, L. Impact of data quality on real-time locational marginal price. IEEE Trans. Power Syst. 2014, 29, 627–636. [Google Scholar] [CrossRef]
  15. Chatterjee, K.; Padmini, V.; Khaparde, S. Review of cyber attacks on power system operations. In Proceedings of the IEEE Region 10 Symposium (TENSYMP), Cochin, India, 14–16 July 2017; pp. 1–6. [Google Scholar]
  16. Deng, R.; Xiao, G.; Lu, R.; Liang, H.; Vasilakos, A.V. False data injection on state estimation in power systems—Attacks, impacts, and defense: A survey. IEEE Trans. Ind. Inform. 2017, 13, 411–423. [Google Scholar] [CrossRef]
  17. Liu, C.; Zhou, M.; Wu, J.; Long, C.; Kundur, D. Financially motivated FDI on SCED in real-time electricity markets: attacks and mitigation. IEEE Trans. Smart Grid 2017, 10, 1949–1959. [Google Scholar] [CrossRef]
  18. Kosut, O.; Jia, L.; Thomas, R.J.; Tong, L. Limiting false data attacks on power system state estimation. In Proceedings of the 44th Annual Conference on Information Sciences and Systems (CISS), Princeton, NJ, USA, 17–19 March 2010; pp. 1–6. [Google Scholar]
  19. Liu, L.; Esmalifalak, M.; Ding, Q.; Emesih, V.A.; Han, Z. Detecting false data injection attacks on power grid by sparse optimization. IEEE Trans. Smart Grid 2014, 5, 612–621. [Google Scholar] [CrossRef]
  20. Chaojun, G.; Jirutitijaroen, P.; Motani, M. Detecting false data injection attacks in ac state estimation. IEEE Trans. Smart Grid 2015, 6, 2476–2483. [Google Scholar] [CrossRef]
  21. Chakhchoukh, Y.; Liu, S.; Sugiyama, M.; Ishii, H. Statistical outlier detection for diagnosis of cyber attacks in power state estimation. In Proceedings of the Power and Energy Society General Meeting (PESGM), Boston, MA, USA, 17–21 July 2016; pp. 1–5. [Google Scholar]
  22. Ashok, A.; Govindarasu, M.; Ajjarapu, V. Online detection of stealthy false data injection attacks in power system state estimation. IEEE Trans. Smart Grid 2018, 9, 1636–1646. [Google Scholar] [CrossRef]
  23. Esmalifalak, M.; Liu, L.; Nguyen, N.; Zheng, R.; Han, Z. Detecting stealthy false data injection using machine learning in smart grid. IEEE Syst. J. 2017, 11, 1644–1652. [Google Scholar] [CrossRef]
  24. He, Y.; Mendis, G.J.; Wei, J. Real-time detection of false data injection attacks in smart grid: A deep learning-based intelligent mechanism. IEEE Trans. Smart Grid 2017, 8, 2505–2516. [Google Scholar] [CrossRef]
  25. Hao, J.; Piechocki, R.J.; Kaleshi, D.; Chin, W.H.; Fan, Z. Sparse malicious false data injection attacks and defense mechanisms in smart grids. IEEE Trans. Ind. Inform. 2015, 11, 1–12. [Google Scholar] [CrossRef]
  26. Wang, Y.; Amin, M.M.; Fu, J.; Moussa, H.B. A novel data analytical approach for false data injection cyber-physical attack mitigation in smart grids. IEEE Access 2017, 5, 26022–26033. [Google Scholar] [CrossRef]
  27. Wang, H.; Ruan, J.; Wang, G.; Zhou, B.; Liu, Y.; Fu, X.; Peng, J. Deep learning-based interval state estimation of ac smart grids against sparse cyber attacks. IEEE Trans. Ind. Inform. 2018, 14, 4766–4778. [Google Scholar] [CrossRef]
  28. Gomez-Exposito, A.; Abur, A. Power System State Estimation: Theory and Implementation; CRC Press: Boca Raton, FL, USA, 2004. [Google Scholar]
  29. Baraniuk, R.G. Compressive sensing [lecture notes]. IEEE Signal Process. Mag. 2007, 24, 118–121. [Google Scholar] [CrossRef]
  30. Candes, E.J.; Wakin, M.B.; Boyd, S.P. Enhancing sparsity by reweighted ℓ 1 minimization. J. Fourier Anal. Appl. 2008, 14, 877–905. [Google Scholar] [CrossRef]
  31. Boussaada, Z.; Curea, O.; Remaci, A.; Camblong, H.; Mrabet Bellaaj, N. A Nonlinear autoregressive exogenous (NARX) neural network model for the prediction of the daily direct solar radiation. Energies 2018, 11, 620. [Google Scholar] [CrossRef]
  32. Lipu, M.H.; Hannan, M.A.; Hussain, A.; Saad, M.H.; Ayob, A.; Blaabjerg, F. State of charge estimation for lithium-ion battery using recurrent NARX neural network model based lighting search algorithm. IEEE Access 2018, 6, 28150–28161. [Google Scholar] [CrossRef]
  33. Christie, R. Power Systems Test Case Archive; University of Washington: Washington, DC, USA, 1999. [Google Scholar]
  34. Gönen, T. Electric Power Distribution System Engineering; McGraw-Hill: New York, NY, USA, 1986. [Google Scholar]
  35. Domingos, P.M. A few useful things to know about machine learning. Commun. ACM 2012, 55, 78–87. [Google Scholar] [CrossRef] [Green Version]
Figure 1. Various strategies of false data injection attacks (FDIAs) on power system state estimation.
Energies 12 02209 g001
Figure 2. Schematic diagram of RNARXNN.
Energies 12 02209 g002
Figure 3. RNARXNN-based BDD method.
Energies 12 02209 g003
Figure 4. IEEE 14-bus standard system.
Energies 12 02209 g004
Figure 5. Different consumers’ load profiles.
Energies 12 02209 g005
Figure 6. Various scenarios of RNARXNN training to improve the performance of the state estimation.
Energies 12 02209 g006
Figure 7. RNARXNN training results for Zone 1 and 2.
Energies 12 02209 g007
Figure 8. Impacts of FDIA strategies I, II on state variables.
Energies 12 02209 g008
Figure 9. Results of RNARXNN-based state variable estimation in FDIA time spot.
Energies 12 02209 g009
Table 1. Load profile proportion for each node.
NodeNominal Active Load (MW)Residential (%)Commercial (%)Industrial (%)
10000
221.705050
394.205050
447.810000
57.605050
611.205050
70000
80000
929.510000
10905050
113.505050
126.101000
1313.501000
1414.910000
Table 2. FDIA results for various congestion patterns.
ς Attack Strategy IAttack Strategy II
IL (%) E ( a 0 ) E ( a z ) IL (%) E ( a 0 ) E ( a z )
[]5.3340.135.3130.19
[4]6.7340.398.5140.45
[5]6.4340.427.3140.49
[1,4]5.9340.378160.43
[1,5]7.3340.438.2150.50
[4,5]7.2340.416.7160.61
[1,4,5]4.3340.429.7170.63
Table 3. RNARXNN results for different delays and hidden layer neurons.
Input DelaysFeedback DelaysHidden Layer NeuronsMSEEpochsTime Duration
5525 4.8779 × 10 8 2237 min
5515 3.1571 × 10 8 4228 min
4420 3.9819 × 10 8 3020 min
3315 8.66 × 10 8 287 min
2225 3.1814 × 10 8 5015 min
2215 2.3324 × 10 8 9110 min
1125 3.8557 × 10 8 958 min
Table 4. Performance and time duration of RNARXNN for each zone.
ZONEHidden Layer SizeMSEEpochsTime Duration
15 3.9349 × 10 8 406 s
110 2.9264 × 10 8 10855 s
25 9.5893 × 10 8 552:18 min
210 1.4916 × 10 7 3230 s
Table 5. Results of FDIA identification likelihood by using the proposed method.
c   Attack Strategy IAttack Strategy II
2 norm   IL   ( % ) LNR IL (%)LNR IMN 2 norm   IL   ( % ) LNR IL (%)LNR IMN
[]78.6788778.67926
[4]92.12961996.6310010
[5]96.141002097.2610010
[1,4]97.181001997.7810010
[1,5]97.931002098.8710010
[4,5]98.631002199.0110010
[1,4,5]99.121002199.5110010

