Impact of Grid-Scale Electricity Storage and Electric Vehicles on Renewable Energy Penetration: A Case Study for Italy


1
Department of Industrial Engineering, University of Rome Tor Vergata, Via del Politecnico 1, 00133 Rome, Italy
2
Fondazione Eni Enrico Mattei, Milan, Italy
*
Author to whom correspondence should be addressed.
Energies 2019, 12(7), 1303; https://doi.org/10.3390/en12071303
Submission received: 1 March 2019
/
Revised: 25 March 2019
/
Accepted: 31 March 2019
/
Published: 4 April 2019
(This article belongs to the Special Issue Grid-Scale Energy Storage Management)
Abstract
:Storage technologies are progressively emerging as a key measure to accommodate high shares of intermittent renewables with a view to guarantee their effective integration towards a profound decarbonisation of existing energy systems. This study aims to evaluate to what extent electricity storage can contribute to a significant renewable penetration by absorbing otherwise-curtailed renewable surplus and quantitatively defines the associated costs. Under a Smart Energy System perspective, a variety of future scenarios are defined for the Italian case based on a progressively increasing renewable and storage capacity feeding an ever-larger electrified demand mostly made up of electric vehicles and, to some extent, heat pumps and power-to-gas/liquid technologies. Results are compared in terms of crucial environmental and techno-economic indicators and discussed with respect to storage operating parameters. The outcome of this analysis reveals the remarkable role of electricity storage in increasing system flexibility and reducing, in the range 24–44%, the renewable capacity required to meet a given sustainability target. Nonetheless, such achievements become feasible only under relatively low investment and operating costs, condition that excludes electrochemical storage solutions and privileges low-cost alternatives that at present, however, exist only at a pilot or demonstration scale.
1. Introduction
The energy sector is currently facing a transition driven by the commitments of different countries towards decarbonisation of the energy supply, with the aim of limiting the effects of climate change. A crucial role is played by the increasing share of electricity generation from renewable energy sources (RES), coupled to a push towards increased electricity penetration in heating, cooling and transport sectors [1].
In this context, high shares of electricity generation from non-programmable (intermittent) RES (iRES), especially wind and solar, require an increased effort in matching power demand and supply on the network [2]. While this matching is currently guaranteed thanks to the use of fossil-based backup plants and to some extent electricity storage (mainly from pumped hydro-power and flywheels), these options may not be sufficient in the future [3]. Potential alternatives include battery electricity storage [4], demand side management [5,6] and power-to-heat (P2H) [7] or power-to-gas/liquid (P2G/L) technologies [8,9]. Different strategies may include one or more of these technologies, based on multiple factors including investment and operational costs, characteristics of electricity demand and generation loads, policies and regulations [10]. Due to the number of aspects involved, no single technology outperforms others on all technical characteristics and, as a result, the choice should be made case by case [11,12].
Many literature works are available on the comparison of technologies for electricity storage [13,14,15]. While some authors suggest a significant potential of decreasing costs of battery storage [16,17], others are more favourable to the exploitation of sector coupling to store excess from RES as heat or chemical energy [18] with particular reference to the usage of electrofuels within the energy system [19].
Electric batteries present a number of advantages, and they are currently seeing a strong deployment in different applications, from electric vehicles (EV) to solar home systems integration, and some companies are exploring their application at a grid scale [20,21]. A strong driver towards the adoption of electric batteries would be the expected decrease of costs associated with large-scale production for a variety of purposes, but mainly for electric vehicles [22]. Moreover, electric batteries could have additional applications besides supporting iRES penetration, such as ancillary services [23], providing power reserve [24] and even fostering research aimed at improving the efficiency of fossil fuelled plants [25]. However, some challenges remain to be fully tackled, including relatively low efficiency, performance degradation over time and batteries lifetime.
Other works suggest that the flexibility provided by electricity storage comes at an excessive cost for the energy system [26,27], and therefore other options may be considered. Other aspects are more favourable to sector coupling over electric batteries, including the exploitation of already existing networks (such as natural gas or district heating) and the possibility of longer storage cycles. In particular, Limpens and Jeanmart suggest that, in some cases of very high inflexible RES production (>75%), electricity storage needs to be coupled to P2G applications [28]. On the other hand, some pathways are still hindered by their low overall efficiency caused by the need of multiple energy conversion processes.
The contribution of this paper is to investigate to which extent, and under which conditions, electricity storage may prove to be an effective solution in supporting progressively higher penetrations of iRES. This aspect is evaluated by considering alternative scenarios with increasing shares of EV on a national basis, to compare the effects of different strategies and highlight the most significant trends, in the framework of a Smart Energy System perspective, assuming a synergic integration among sectors and taking the Italian case as a reference. In particular, this study aims to extend the existing literature, e.g., [29,30], by quantitatively defining the role of electricity storage in reducing iRES overall installed capacity needed to achieve a given CO2 emissions reduction target. Such impact, however, has to be evaluated against storage-related costs: an economic analysis is thus included to fully assess the feasibility of electricity storage technologies, taking into account medium- and long-term projections.
The Italian energy system was taken as a case study because Italy presents features that are shared by several other developed countries with high renewable potential and large fossil fuel consumption in the transportation sector, such as Denmark, Germany or Spain. However, Italy differs from Nordic countries in the availability of wind and solar energy, with the latter taking the lion’s share among intermittent RES, as well as in the reliance on natural gas, rather than coal, for conventional electricity generation. Therefore, results for the Italian case can be extended to other national contexts featuring large renewable potential and dependence on oil products for the transport sector; some adjustments could be necessary in those countries relying more on wind than solar among renewables and on coal (or nuclear) than natural gas for conventional electricity generation. In any case, in this study, results are presented in terms of dimensionless quantities in order to make them as broadly applicable as possible.
2. Methods
2.1. Base Case Scenario Modelling
A reference scenario has been modelled with reference to the Italian energy system at 2016 with help of EnergyPLAN software, a computer model for energy system analysis. Data have been derived from updated and reliable sources following the procedure used in previous works of the authors [31]. Input data relevant to the analysis have been summarised in Appendix A listing main input parameters described in the following.
EnergyPLAN performs energy balances to simulate the operation of a particular energy system on an hourly basis and requires input parameters to fully describe energy demand and supply. The software is an input/output model of an energy system and includes a wide range of technologies with a particular attention to the synergies and interactions, which can be exploited among energy sectors. General inputs, from demand side, are represented by annual electricity loads, that can be further subdivided in the contributions for cooling, heating and transport (Table A1), individual heating demand (Table A2) as well as district and process heat demand (Table A3) and direct fuel consumption for transport (Table A4) and industry sectors (Table A5).
To allow the software to perform energy balances, the supply side, as in power plants’ capacities, efficiencies, fuel shares as well as renewable generation hourly distributions, must be fully defined. The software works out an hourly balance in which the total electricity demand is fulfilled via renewable energies, which follow the hourly power distribution given as input, and conventional power plants, defined in terms of installed capacity and efficiencies.
Heating demand is fulfilled via individual boilers, heat pumps, district heating and Combined Heat and Power (CHP) plants. Demand for district heating and process heat has been distributed among the different energy systems according to EnergyPLAN subdivision. In particular, the software allows CHP plants to be further divided into two main groups, depending on their size. Typically, large CHP plants, able to operate in electricity only mode, belong to Group 3, while Group 2 involves CHP plants working in back-pressure mode. In this work, internal combustion engines, gas turbines and back-pressure CHP plants have been included in Group 2 (referred to as CHP2), while Group 3 (named PP1 hereafter) is assumed to be made up of both large CHP plants (typically combined cycle and condensing power plants) and conventional power plants (PP1). PP and CHP installed capacities and efficiencies are shown in Table A6 and their fuel consumption in Table A7.
Finally, renewable sources for electricity generation have been modelled in terms of installed capacity, which are shown in Table A8, as well as electric power distribution, defined on an hourly basis according to data available on actual generation by technologies as provided by Terna S.p.A., the majority owner of the Italian high-voltage electricity National Transmission Grid.
Hourly-averaged power distributions, defined as the ratio between the average power at a particular hour and the yearly maximum, are needed to let the software work out energy balances throughout the whole year. Such distributions are listed in Table A9 along with sources from which values have been taken.
The model has been validated against the most significant energy indicators showing an acceptable difference (below 2.2%) with respect to 2016 actual references, as shown in Table 1.
2.2. Future Scenarios Modelling
A variety of possible future scenarios has been defined assuming a progressive rise in renewable capacity and electric vehicles’ penetration in the private transport sector, including different options in terms of storage operating parameters as well as an additional increase in electricity demand through heat pumps and P2G/L technologies, with the aim to better exploit RES surplus in the context of a Smart Energy System approach.
2.2.1. Renewable Energy Penetration
From supply side, renewable energy capacity has been linearly increased from 2016 up to nine times as compared to 2016 (9×RES from here onwards) keeping current hourly distributions. Such a large increase in RES capacity must be taken into account in order to reach significant values of RES penetration, as proven in the literature. For example, Varone and Ferrari analysed the German energy scenario and pointed out that an eightfold increase in RES capacity, together with the adoption of P2G technologies, could result in a 79% RES share of total electricity generation [34]. In the Italian case, Romanelli estimated that, if RES were to generate an annual electricity production equal to the annual amount of electricity demand, RES capacity was required to increase, above the 2013 level, by a factor of 7.5–8.5 [2], while the authors found that full electrification of private transport and a tenfold increase in iRES capacity only result in 20% emission reduction and 58% RES share of electricity generation if no other measure is implemented [31].
However, the National Association of Wind Energy (ANEV) estimated in a 2017 report that wind capacity could increase up to GW by 2030 taking into account all relevant constraints [35]. As a consequence, this 2030 projection has been taken as a conservative estimate for the upper limit on wind capacity, with PV covering the remaining capacity (Table 2).
The relation between the increase in renewable capacity and iRES actual generation is analysed in the Results and Discussion section of this work and compared to the expected national targets, in terms of RES electricity production, set by Italian Ministry of Economic Development in the document “Strategia Energetica Nazionale” (National Energy Strategy [36], referred to as SEN from here onwards): 55% RES share of electricity generation by 2030, 93% by 2050.
2.2.2. Electric Vehicles’ Penetration
From demand side, EV are assumed to replace conventional light-duty vehicle fleet by 50% and 100%. The procedure implemented for the replacement of conventional cars follows what is reported in a previous study by the authors [31]; vehicles operating parameters are derived as a weighted average from the actual fleet, taking into account real-driving conditions and auxiliary consumption [37,38]. An example, referring to a 50% replacement of the conventional fleet, is recalled in Table 3 and Table 4.
For each EV penetration scenarios, a smart charge option has been implemented: EV charge during low-power demand in order to meet drivers’ needs to recharge the vehicle at a certain time as well as to avoid grid overloading and reduce RES surplus.
2.2.3. Heat Pumps and P2G/L Options
Besides EV, other solutions have been included in the analysis with the aim to absorb renewable surplus: heat pumps (HP) in the heating sector and P2G/L technologies to replace either natural gas in the grid and liquid fuels in the heavy transport sector. This particular scenario, including HP, P2G/L and 50% of conventional fleet replaced by EV, is referred to as “mixed” scenario.
With respect to individual heating, oil demand is assumed to be first replaced by natural gas with HP ultimately replacing 25% of such demand as shown in Table 5.
It is worth mentioning that the increase in electricity demand becomes supportive in fostering RES penetration provided the contemporaneity between renewable supply and electricity load; while EV can benefit from a smart charge strategy and partially regulate vehicle charge according to renewable surplus, the electrification of heating demand, the latter being particularly weather-dependent, may eventually curb renewable penetration, at least for the Italian case whose RES mix is mostly made up of solar energy with its highest potential in summer. In this context, the role of storage becomes crucial to accommodate possible mismatch between generation and demand and ultimately allow shifting renewable electricity to the heating sector as well.
Gasification and hydrogenation parameters used for P2G/L modelling are listed in Table A10 and Table A11 in Appendix A following the procedure used in a recent work of the authors [39]. Electrolysers’ installed capacity has been set to four times the average power required to guarantee the annual hydrogen production for syngas/biogas hydrogenation processes estimated on the amount of electrofuel needed; a six days’ worth hydrogen storage capacity has been implemented. The amount of synthetic gas injected in the grid covers 20% of natural gas required for individual heating in the “mixed” scenario, produced via biomass and biogas hydrogenation (contributing for 10% each). Synthetic liquid fuels replace 20% of conventional fuel for heavy transportation, obtained through biomass hydrogenation and liquid electrofuel synthesis. The resulting parameters that allow to define P2G and P2L pathways in the “mixed” scenario are given in Table 6.
2.2.4. Electricity Storage
Electricity storage systems have been included in the energy scenarios with the assumption that they share the same round-trip efficiency , defined as the ratio of energy discharged from the storage () to the energy charged to the unit ():
No choice about the particular storage technology has been made, representing storage units as an overall national system defined by three parameters:
- electricity storage power rating (),
- electricity storage capacity (),
- round-trip efficiency
Furthermore, storage power rating has been normalized with reference to overall iRES capacity (), defining the ratio r as follows:
Analogously, storage capacity has been normalized with reference to storage power rating by means of the parameter , defined by the following equation, which can be interpreted as the storage system rated charge time, that is, the time required to fill the storage unit with the rated power:
By means of Equations (2)–(3), given the iRES capacity , the storage system is completely identified by means of the three intensive quantities r, and .
For simplicity, charge and discharge power ratings have been considered equal. Furthermore, same values of charging and discharging efficiency have also been considered, equal to the square root of round-trip efficiency:
Electricity storage has been modelled outside EnergyPLAN according to the algorithm described in the following paragraphs, based on Equations (5)–(15).
First, annual hourly distributions have been calculated for all energy scenarios by means of EnergyPLAN, without including electricity storage systems. In particular, the variables used in the storage algorithm are: RES surplus (); backup conventional power plant generation (); electricity import ().
Then, at each hour (indicated in the following equations by an index i), charging power () comes from RES surplus (if available), checking that constraints on storage power rating () and available storage capacity () are satisfied. RES surplus is then lowered by an amount corresponding to the actual storage charging power. Power () and energy () values can be directly added together in the following equations since simulations are performed with time steps of one hour each:
Electricity stored in the storage system is then used, if available, to reduce backup power plant generation and electricity import. It is worth underlining that the authors do not suggest that energy self-sufficiency should be a national goal: on the contrary, developing stronger interconnections among European countries [29,40] and possibly with Middle East and North Africa [41,42] can prove to be extremely helpful in support of a larger RES deployment, by sharing RES overall availability among different countries. In this analysis, import is reduced only to assess electricity storage potential to reduce emissions and improve RES utilisation.
Discharging power () is thus obtained as the sum of and , checking that constraints on storage power rating () and minimum storage level are satisfied. Then, backup power plant generation and electricity import are updated ( and , respectively), decreasing first the former (which has a direct impact on CO2 emissions) and then the latter (which instead does not contribute to national emissions in this model):
Finally, electricity storage level is calculated, starting from its level at the previous hour, adding charging power and subtracting discharging power taking properly into account the respective efficiencies (Equation (4)):
Annual (cumulative) values of RES surplus, RES generation and total electricity generation () are then calculated as integral over the full year of the corresponding hourly-averaged power distributions:
Annual CO2 emissions are then calculated by subtracting avoided emissions related to the decrease in backup power plant generation, taking into account the emission factor of these units (given in Table A6):
The procedure is then repeated at least once in order to ensure that stationary conditions are met, that is, that electricity storage levels at the beginning and at the end of the year are the same: in this way, storage neutrality [43] is ensured, which means that there is no net contribution from the storage to the overall energy balance (or, in other words, that storage systems do not act as sources or sinks, but supply only as much energy as is stored).
2.2.5. Costs
In this work, costs associated with iRES capacity, on the one hand, and to electricity storage, on the other hand, are evaluated and compared.
Onshore and offshore wind, as well as solar photovoltaic, have been considered as intermittent renewable energy sources in building future energy scenarios. Corresponding investment and O&M costs have been derived from Heat Roadmap Europe 4 costs database [44], which gives costs projections to 2030 and 2050 that are in good agreement with those published by International Energy Agency [45]. In particular, this costs database includes total investment cost , O&M annual costs as a percentage of annualised investment costs , amortisation period n. Values for iRES technologies are summarised in Table 7. If original data were given in USD, an exchange rate of 0.75 has been applied to convert to EUR [45].
Annualised investment costs are calculated as follows:
where summation takes place over all RES technologies involved and is the Capital Recovery Factor:
with i representing the discount rate, here assumed as 3%. A sensitivity analysis on the effect of different discount rates (3%, 7%, 10%) is reported in Appendix B. Annual O&M costs are then evaluated as:
Total annual costs related to iRES capacity are finally taken as the sum of annualised investment costs and annual O&M costs:
Costs for electricity storage technologies have been taken from Schmidt et al. [17] for established technologies, such as Pumped Hydro (PHS), Compressed Air Energy Storage (CAES), electrochemical batteries (Li-ion, Na-S, Lead-acid, Vanadium Redox Flow), hydrogen. Other sources provide comparable values [3,46]. Available data include investment costs per unit of power and per unit of energy , annual O&M costs per unit of power , O&M costs per unit of energy charged annually , shelf life n (Table 8).
Data for more recently developed storage technologies, which are still at pilot/demonstration scale, have been taken from Smallbone et al. for Pumped Heat Energy Storage (PHES) [47] and from Lin et al. for Liquid Air Energy storage (LAES) [48]. For both these technologies, O&M costs have been considered equal to CAES, given the similar operation and characteristics [47]. No reduction in investment costs has been considered for PHS and CAES, which are mature technologies, neither for PHES and LAES, even though these technologies are still at pilot/demonstration scale, because available data already take into account some cost decrease; in addition, given the relatively low cost of the components involved (thermal storage, compressors, pumps, expanders, heat exchangers), research efforts are needed to prove that these technologies are viable at large scale and to optimise operation and performance, rather than to seek significant cost reduction as in the case of electrochemical storage. Finally, also in this case an exchange rate of 0.75 has been applied to convert USD to EUR.
Investment costs for electricity storage systems can be expressed as a function of storage capacity:
Annualised storage investment costs are obtained multiplying by the Capital Recovery Factor (the same interest rate of 3% as for iRES capacity has been assumed):
Operation and Maintenance annual costs can be evaluated as follows:
where is the total annual energy charged to the storage system, given by the integral of charging power over the year. It can be expressed as a function of storage capacity by introducing the number of annual cycles :
As a consequence, O&M annual costs are a function of storage capacity too:
Finally, annual total costs per unit storage capacity are calculated as the sum of annualised investment costs and O&M costs:
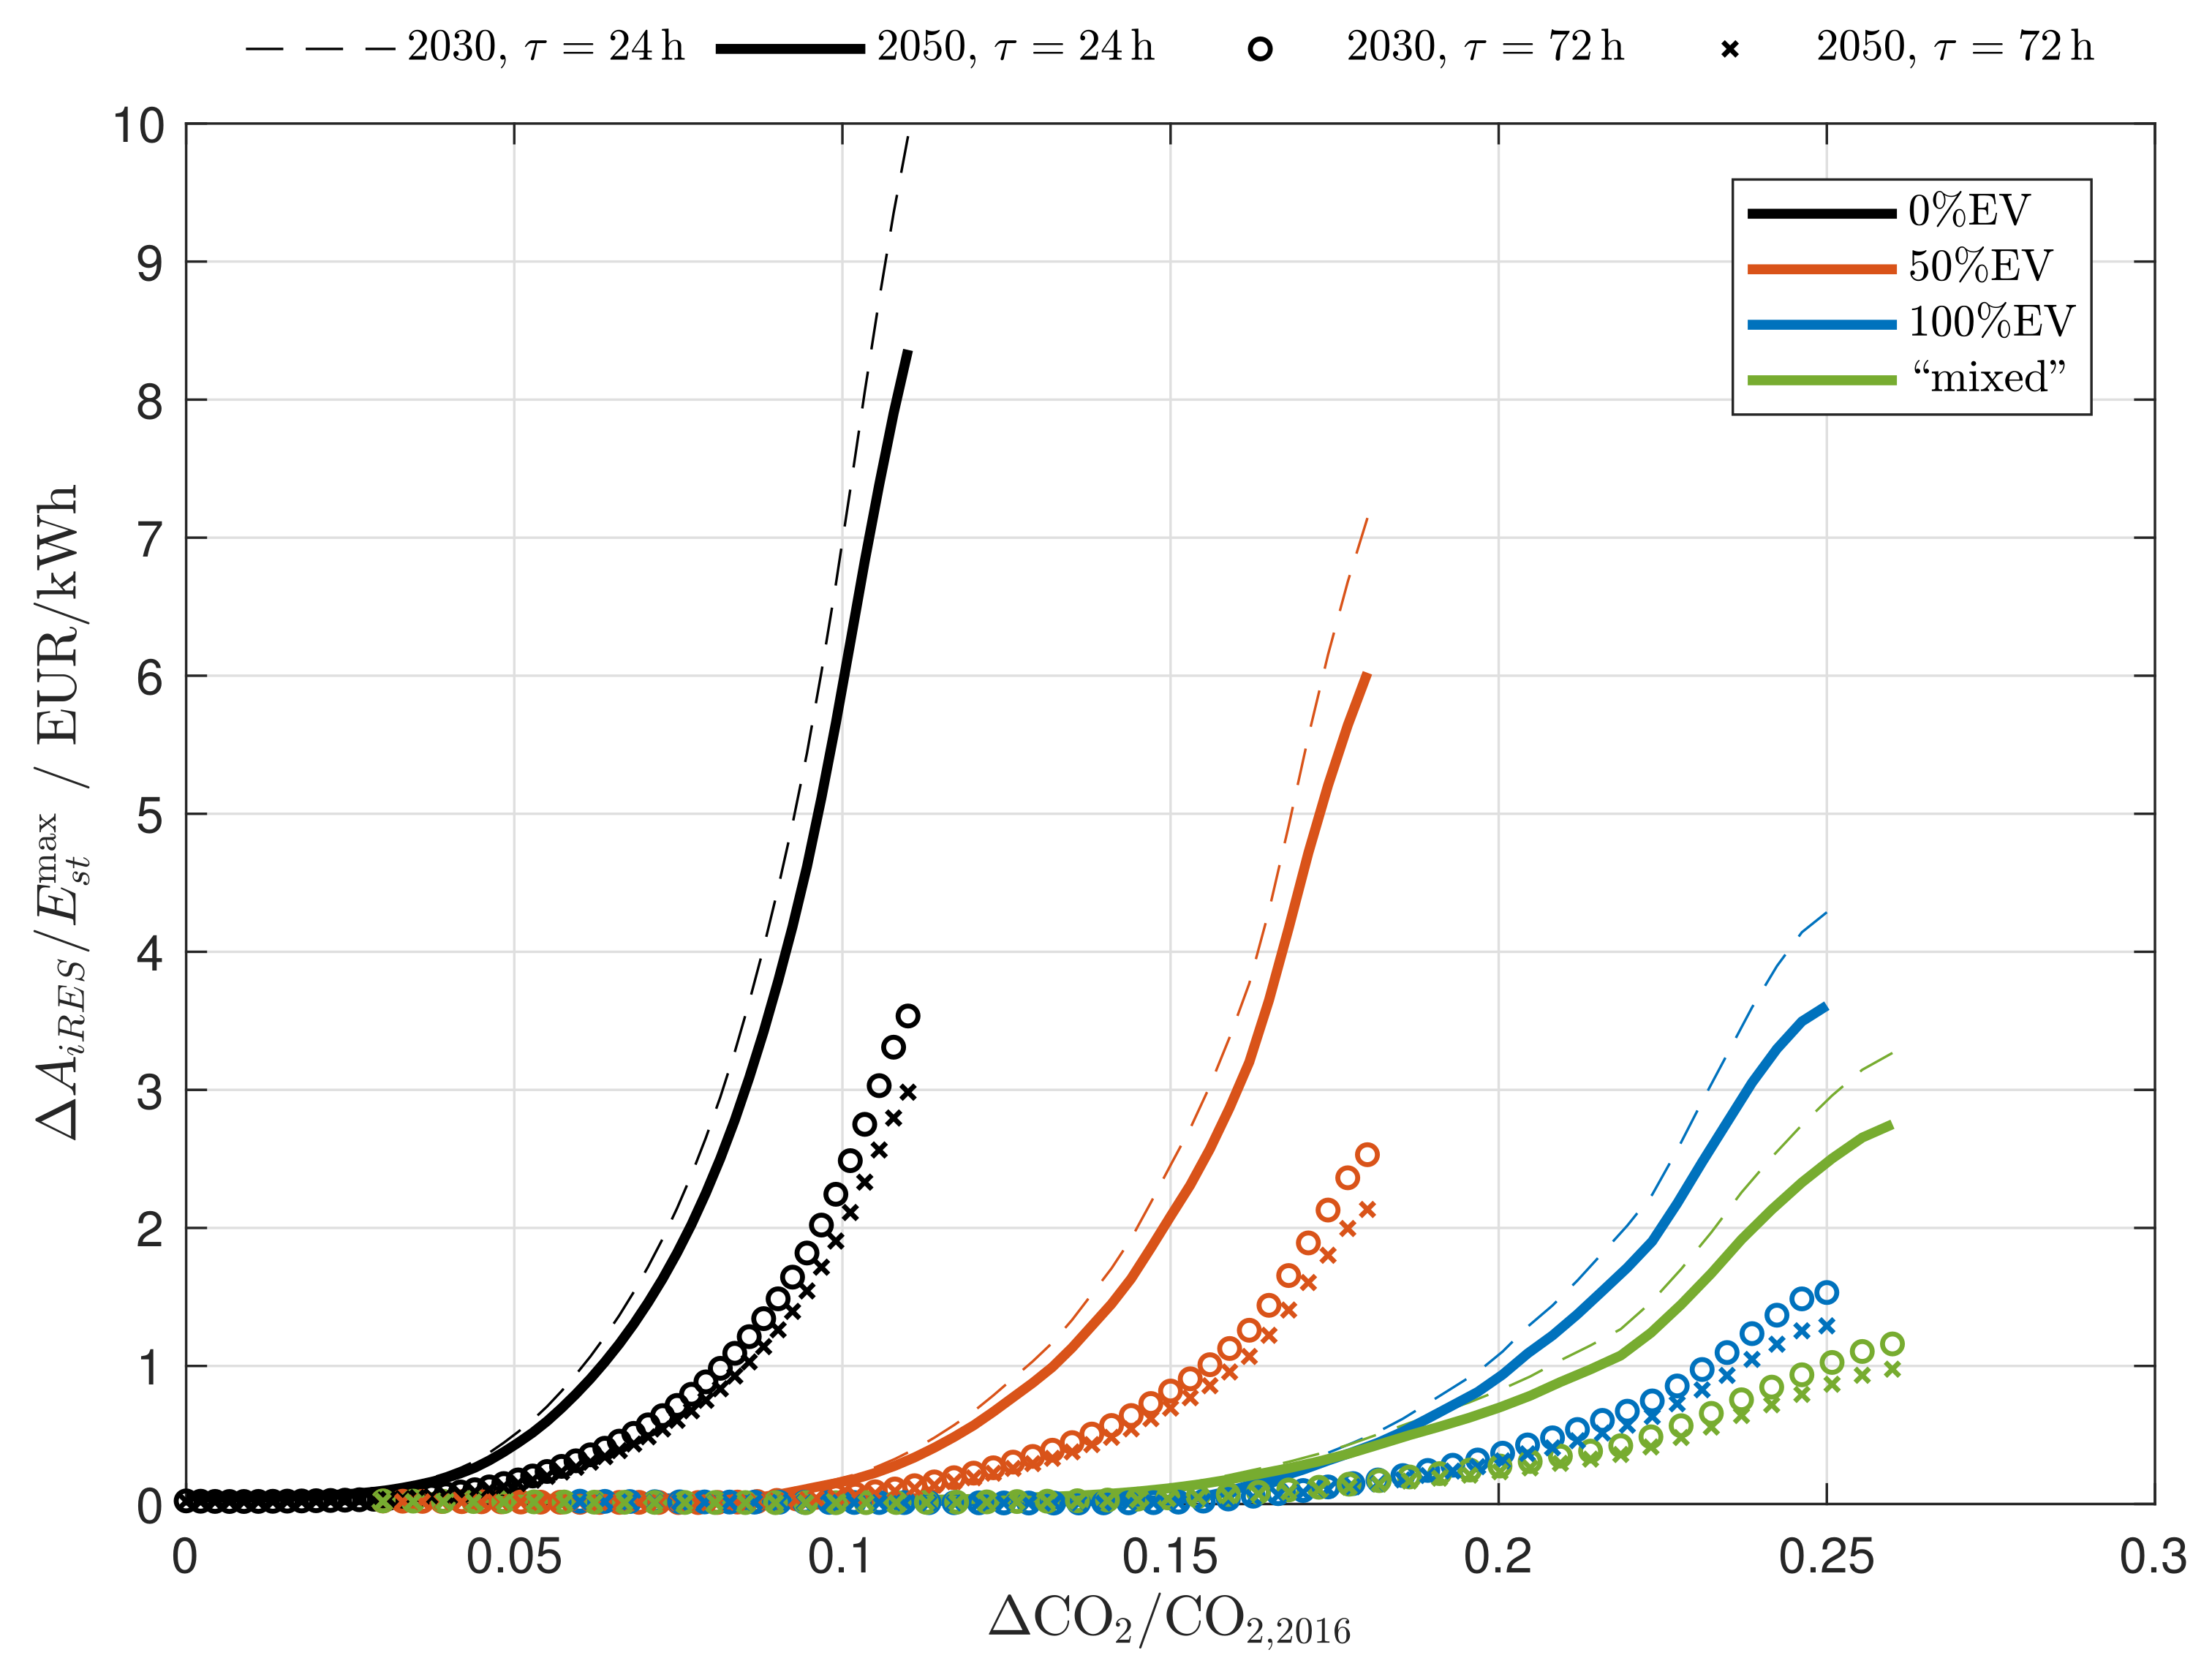
In Section 3.4, annual electricity storage costs per unit of capacity () are compared to savings in annual costs related to iRES capacity, normalized with respect to storage capacity (): these savings are allowed by the deployment of storage systems, as discussed in Section 3.2.
3. Results and Discussion
3.1. Analysis of Electricity Storage Operation
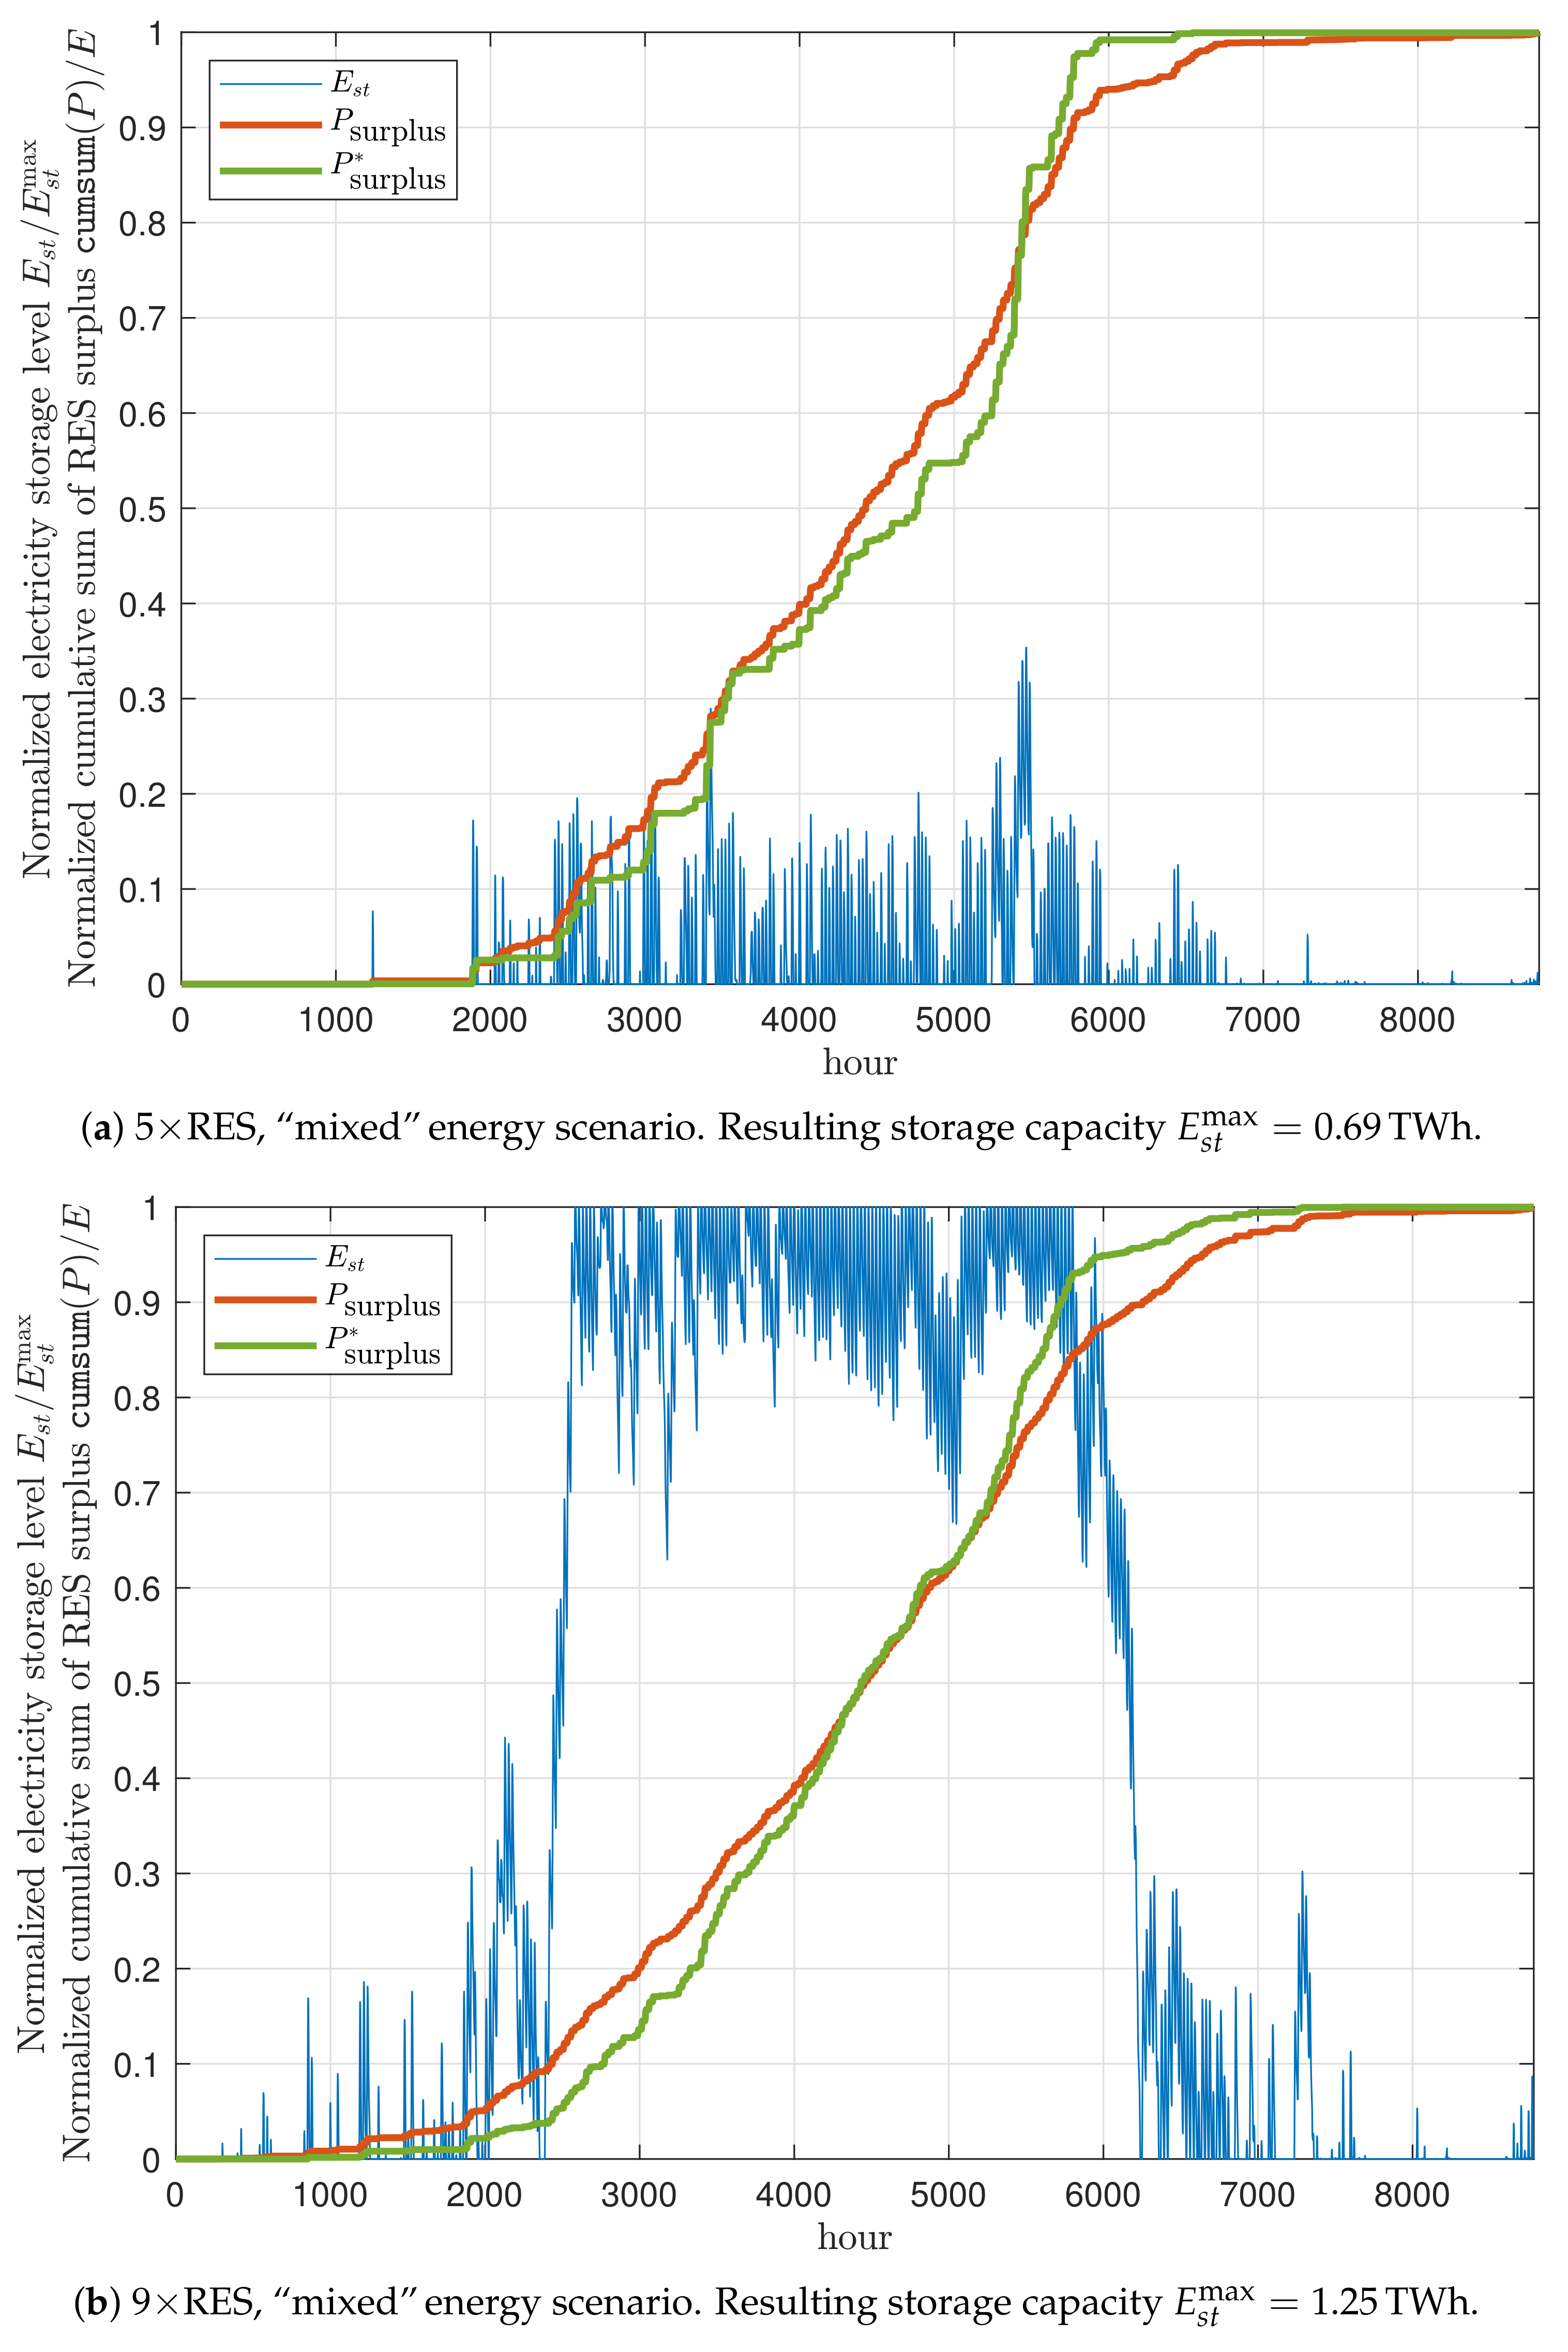
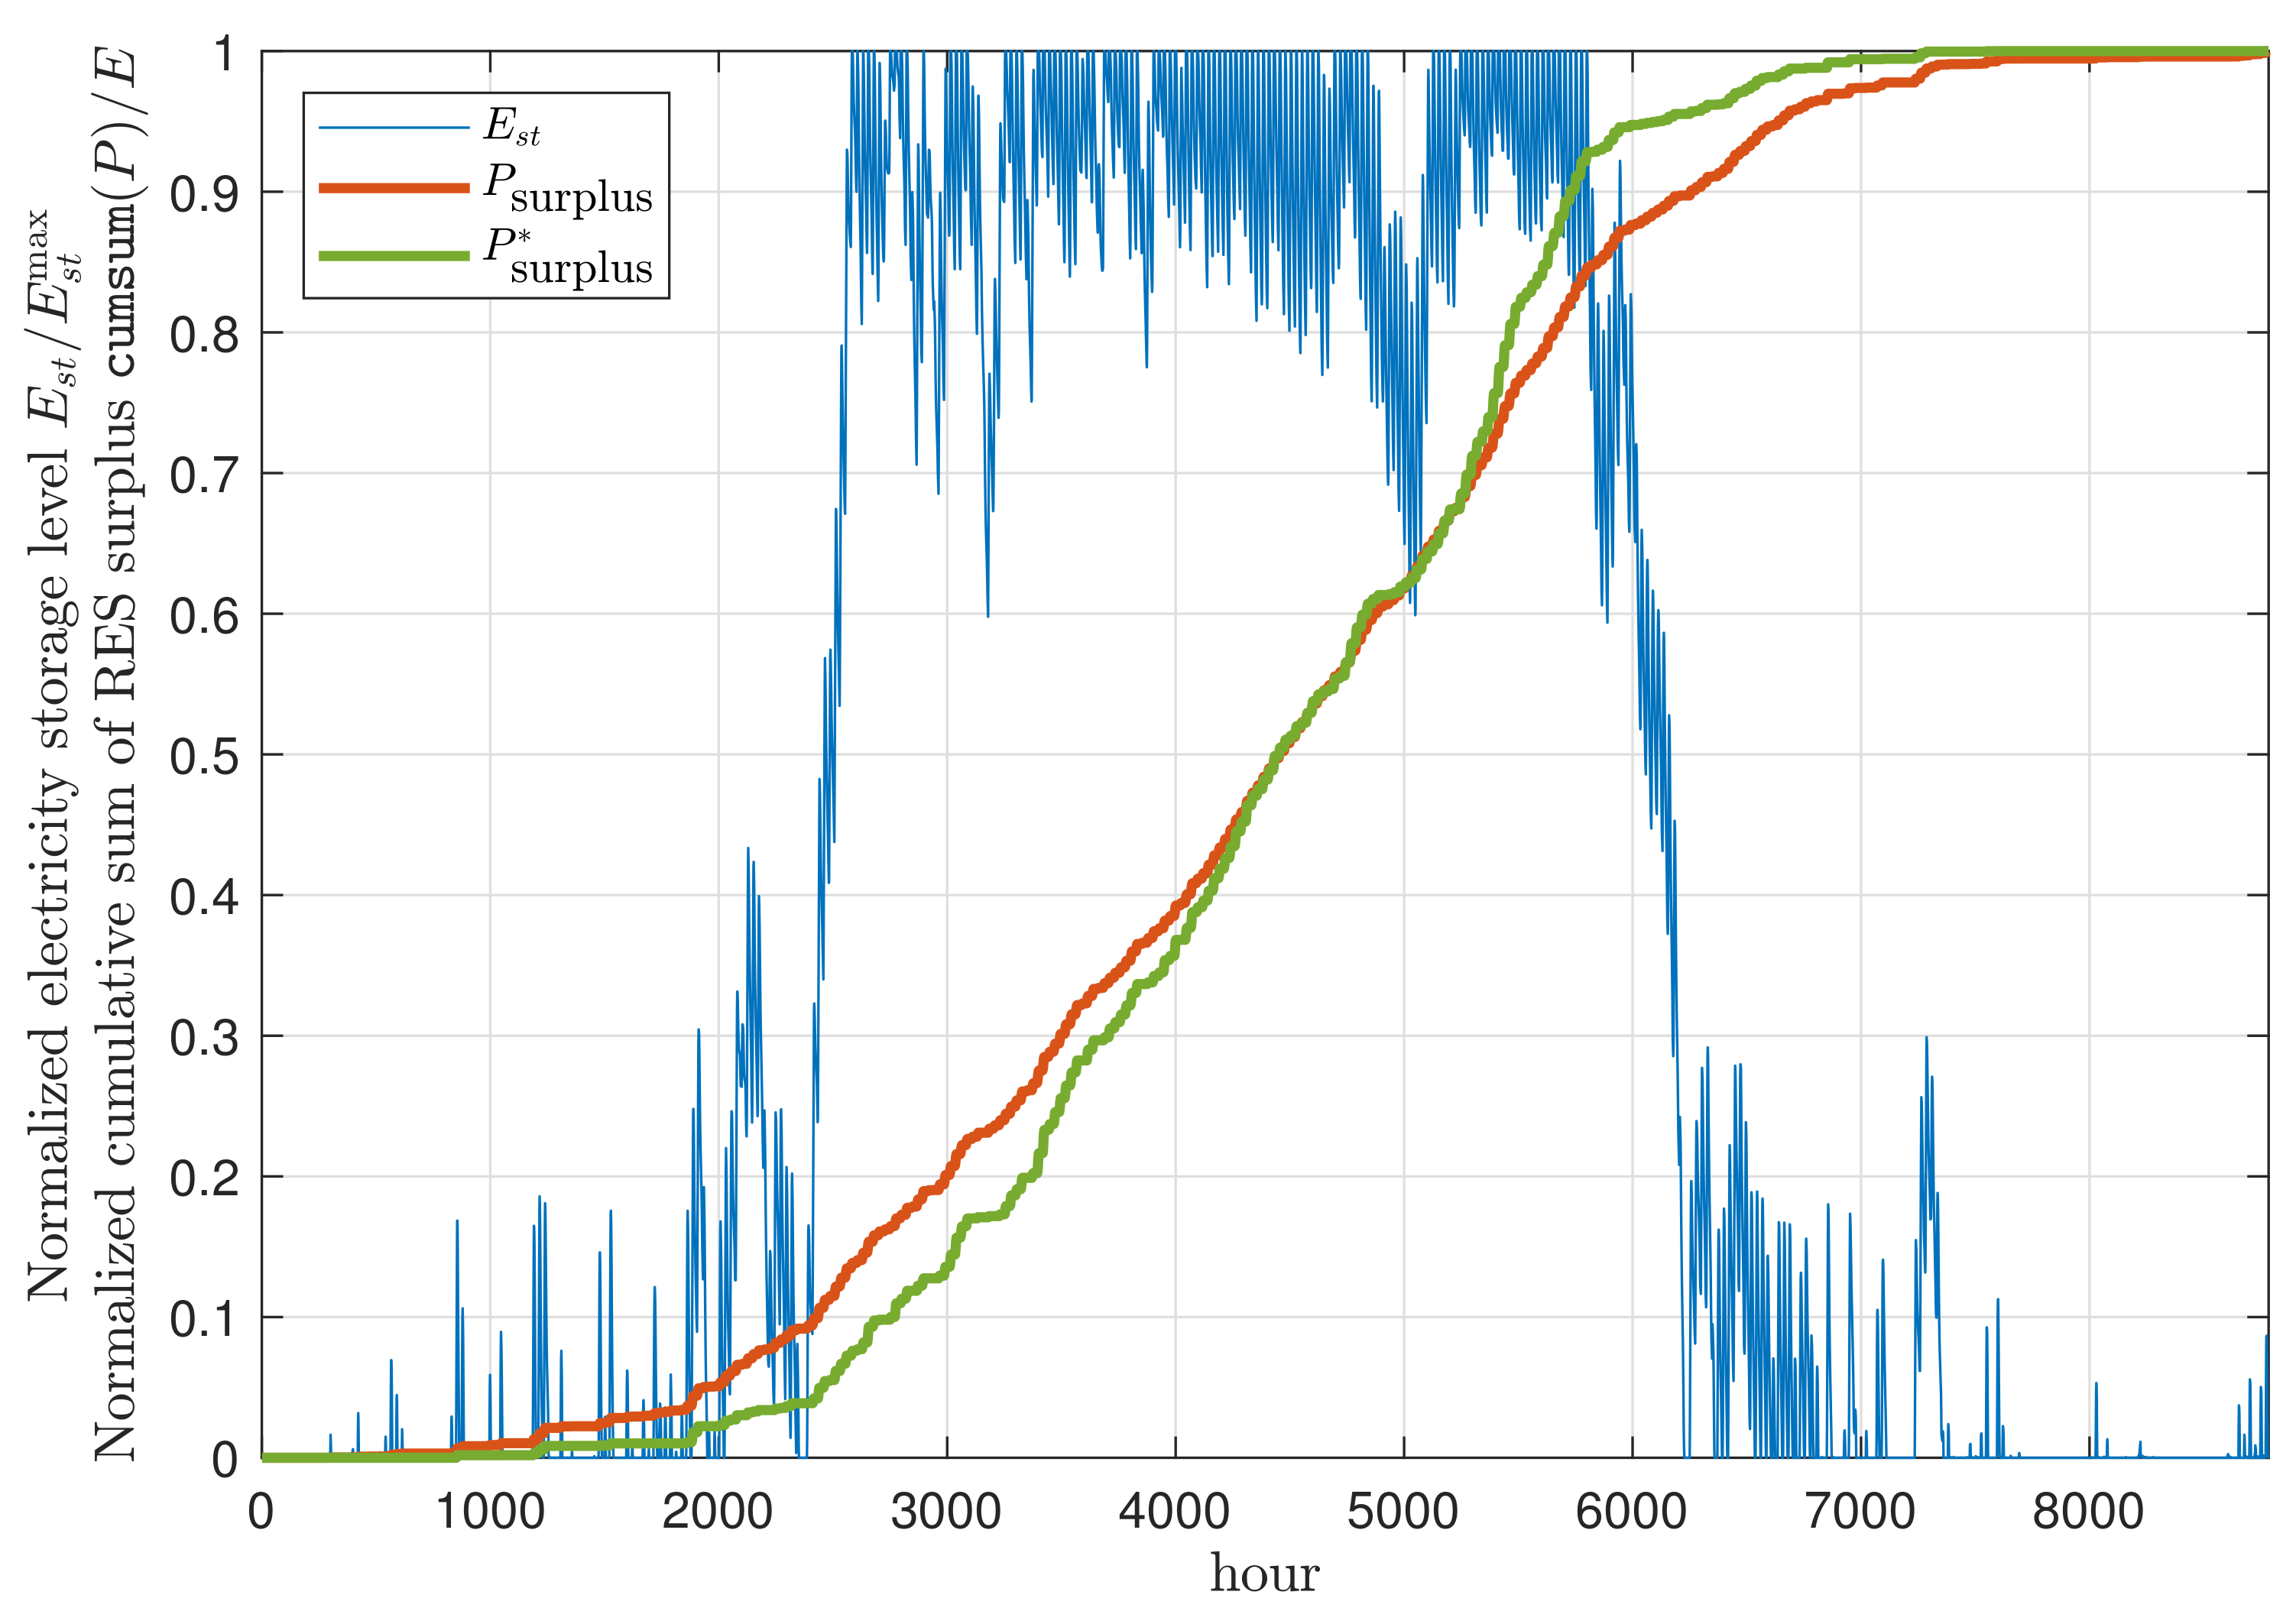
Figure 1 and Figure 2 illustrate the operation of electricity storage systems in a single case. Figure 1 shows how electric energy storage in the system changes throughout the year for two values of iRES capacity: due to the prevalence of solar over wind energy in Italy, particularly in terms of maximum capacity that can be deployed, RES surplus is concentrated in spring and summer months. As a consequence, for a large iRES deployment (Figure 1b), electricity storage systems remain relatively empty in autumn and winter months, and then rapidly fill up until reaching storage capacity if a large RES surplus is available, which is for large iRES capacities (see next section).
This behaviour entails that electricity storage systems are able to operate also on a seasonal basis, thus directly affecting the particular storage technology to be used. Requiring power provisions for months, seasonal storage excludes technologies characterised by short discharge duration (e.g., flywheels and supercapacitors) while favouring those that allow for sizing energy storage capacity independently of power capacity [17]. Moreover, self-discharge rate plays a key role when energy is required to be stored over a long time period [49]. As a result, PHS, CAES and P2G are best for long discharge application [50]; however, their deployment on a seasonal basis is hindered by the complexity of design and operation optimisation due to the length and resolution of time horizon [51].
It is also worth noting that, in the context of high iRES penetration, where a large amount of electricity surplus is available, energy losses resulting from self-discharge have less significant impact than it might at first appear. In fact, due to the abundance of iRES power, the energy stored in the system can be easily kept at the required level (Figure A6 in Appendix B shows results for a 1%/day self-discharge rate), ultimately leading to a scenario in which renewable curtailments are reduced without obviously allowing a further reduction in CO2 emissions, as shown in Figure A8 and Figure A9 in Appendix B.
On the other hand, if relatively lower iRES capacities are implemented, electricity storage systems operate on a much narrower time span (Figure 1a).
Cumulative sums of RES surplus with and without storage are also displayed in Figure 1 to show clearly the simultaneity of maximum availability of RES surplus and maximum usage of electricity storage.
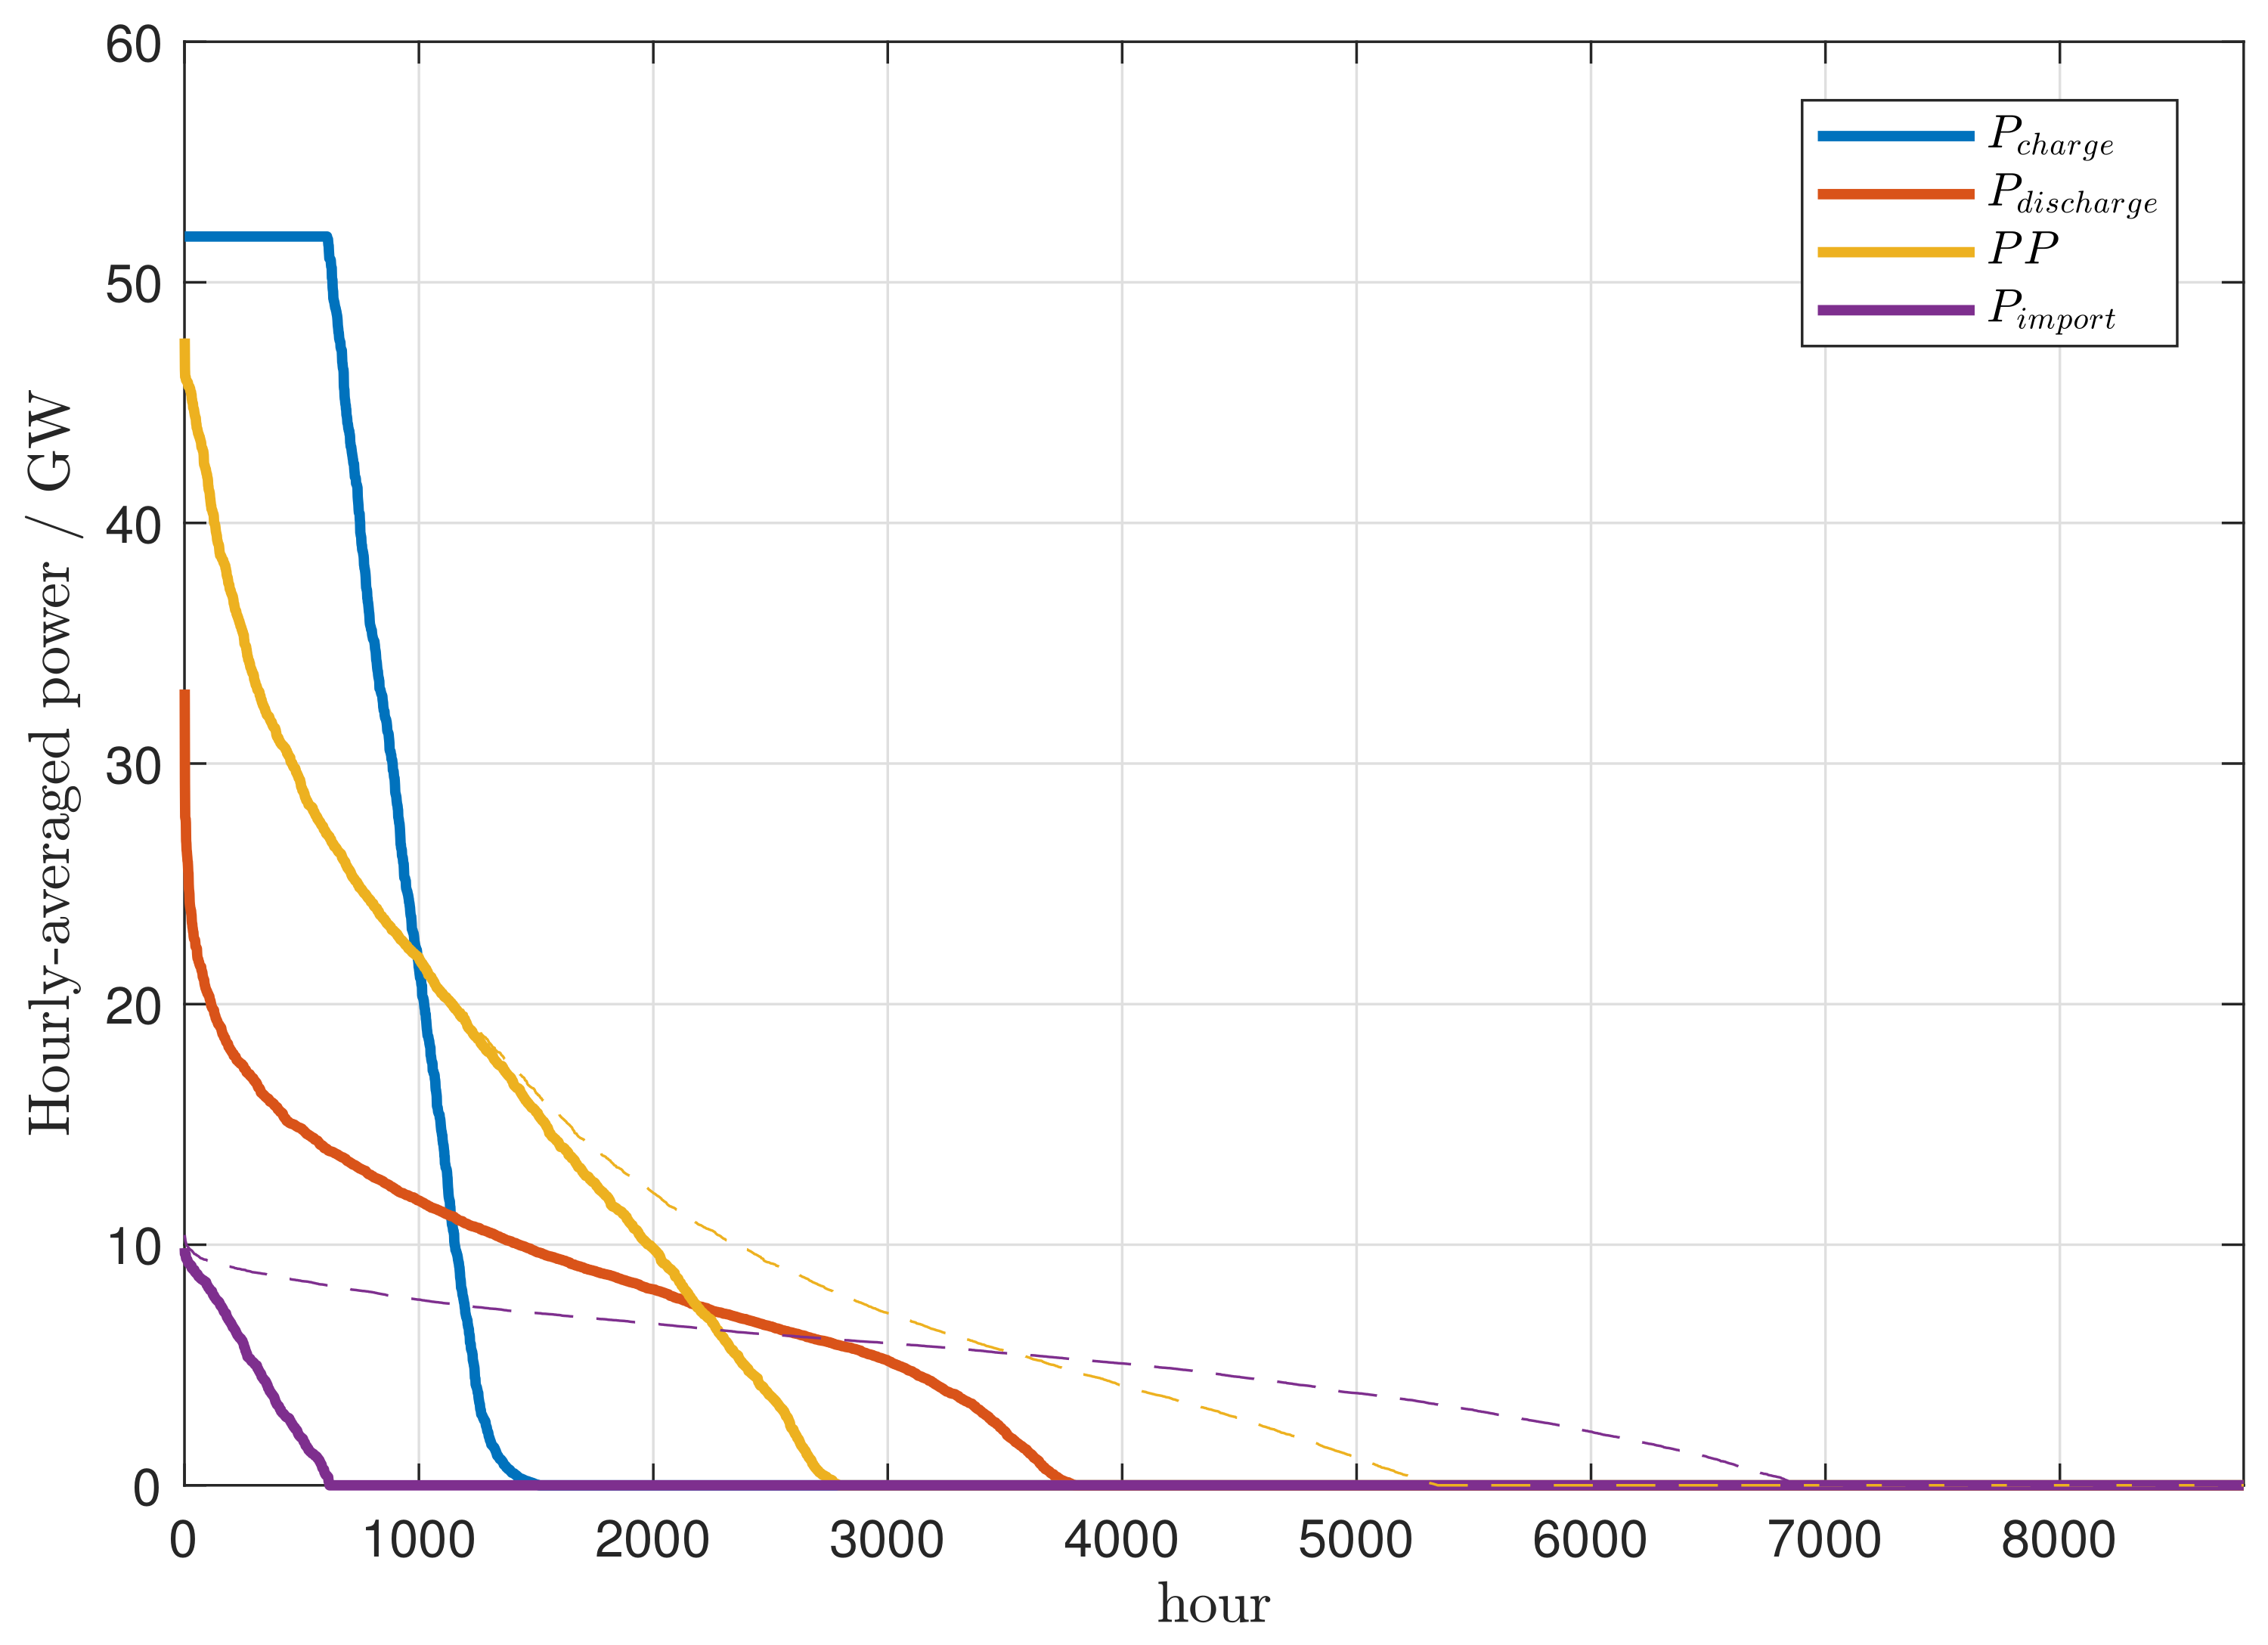
Figure 2 represents the load curves for those variables that are directly affected by electricity storage: power charged (discharged) to (from) the electricity storage; backup power plants generation; electricity imports from abroad. These curves illustrate to what extent electricity storage reduces the need for backup power plant operation and, as a result, CO2 emissions. It can also be seen that, due to the distribution of RES surplus, when it is possible to charge electricity storage systems, the available power is often very large so that it is limited to storage power rating, while discharge power follows a much smoother curve, never reaching the rated power, at least when sufficiently large storage power ratings are considered. Figure A7 in Appendix B shows the same load curves when a self-discharge rate of 1%/day is included in the simulation: the tail in the charge power curve, which is not present in Figure 2, is clearly related to charging operations that only compensate for self-discharge energy losses.
3.2. Impact of Electricity Storage Systems on Energy and Environmental Indicators
This section presents the results obtained with electricity storage systems compared to the base case without electricity storage, for a fixed set of storage parameters, precisely: ratio of storage power capacity to iRES capacity ; ratio of storage energy to power capacity ; round-trip efficiency . In the following section, a parametric analysis about the influence of each storage parameter is presented.
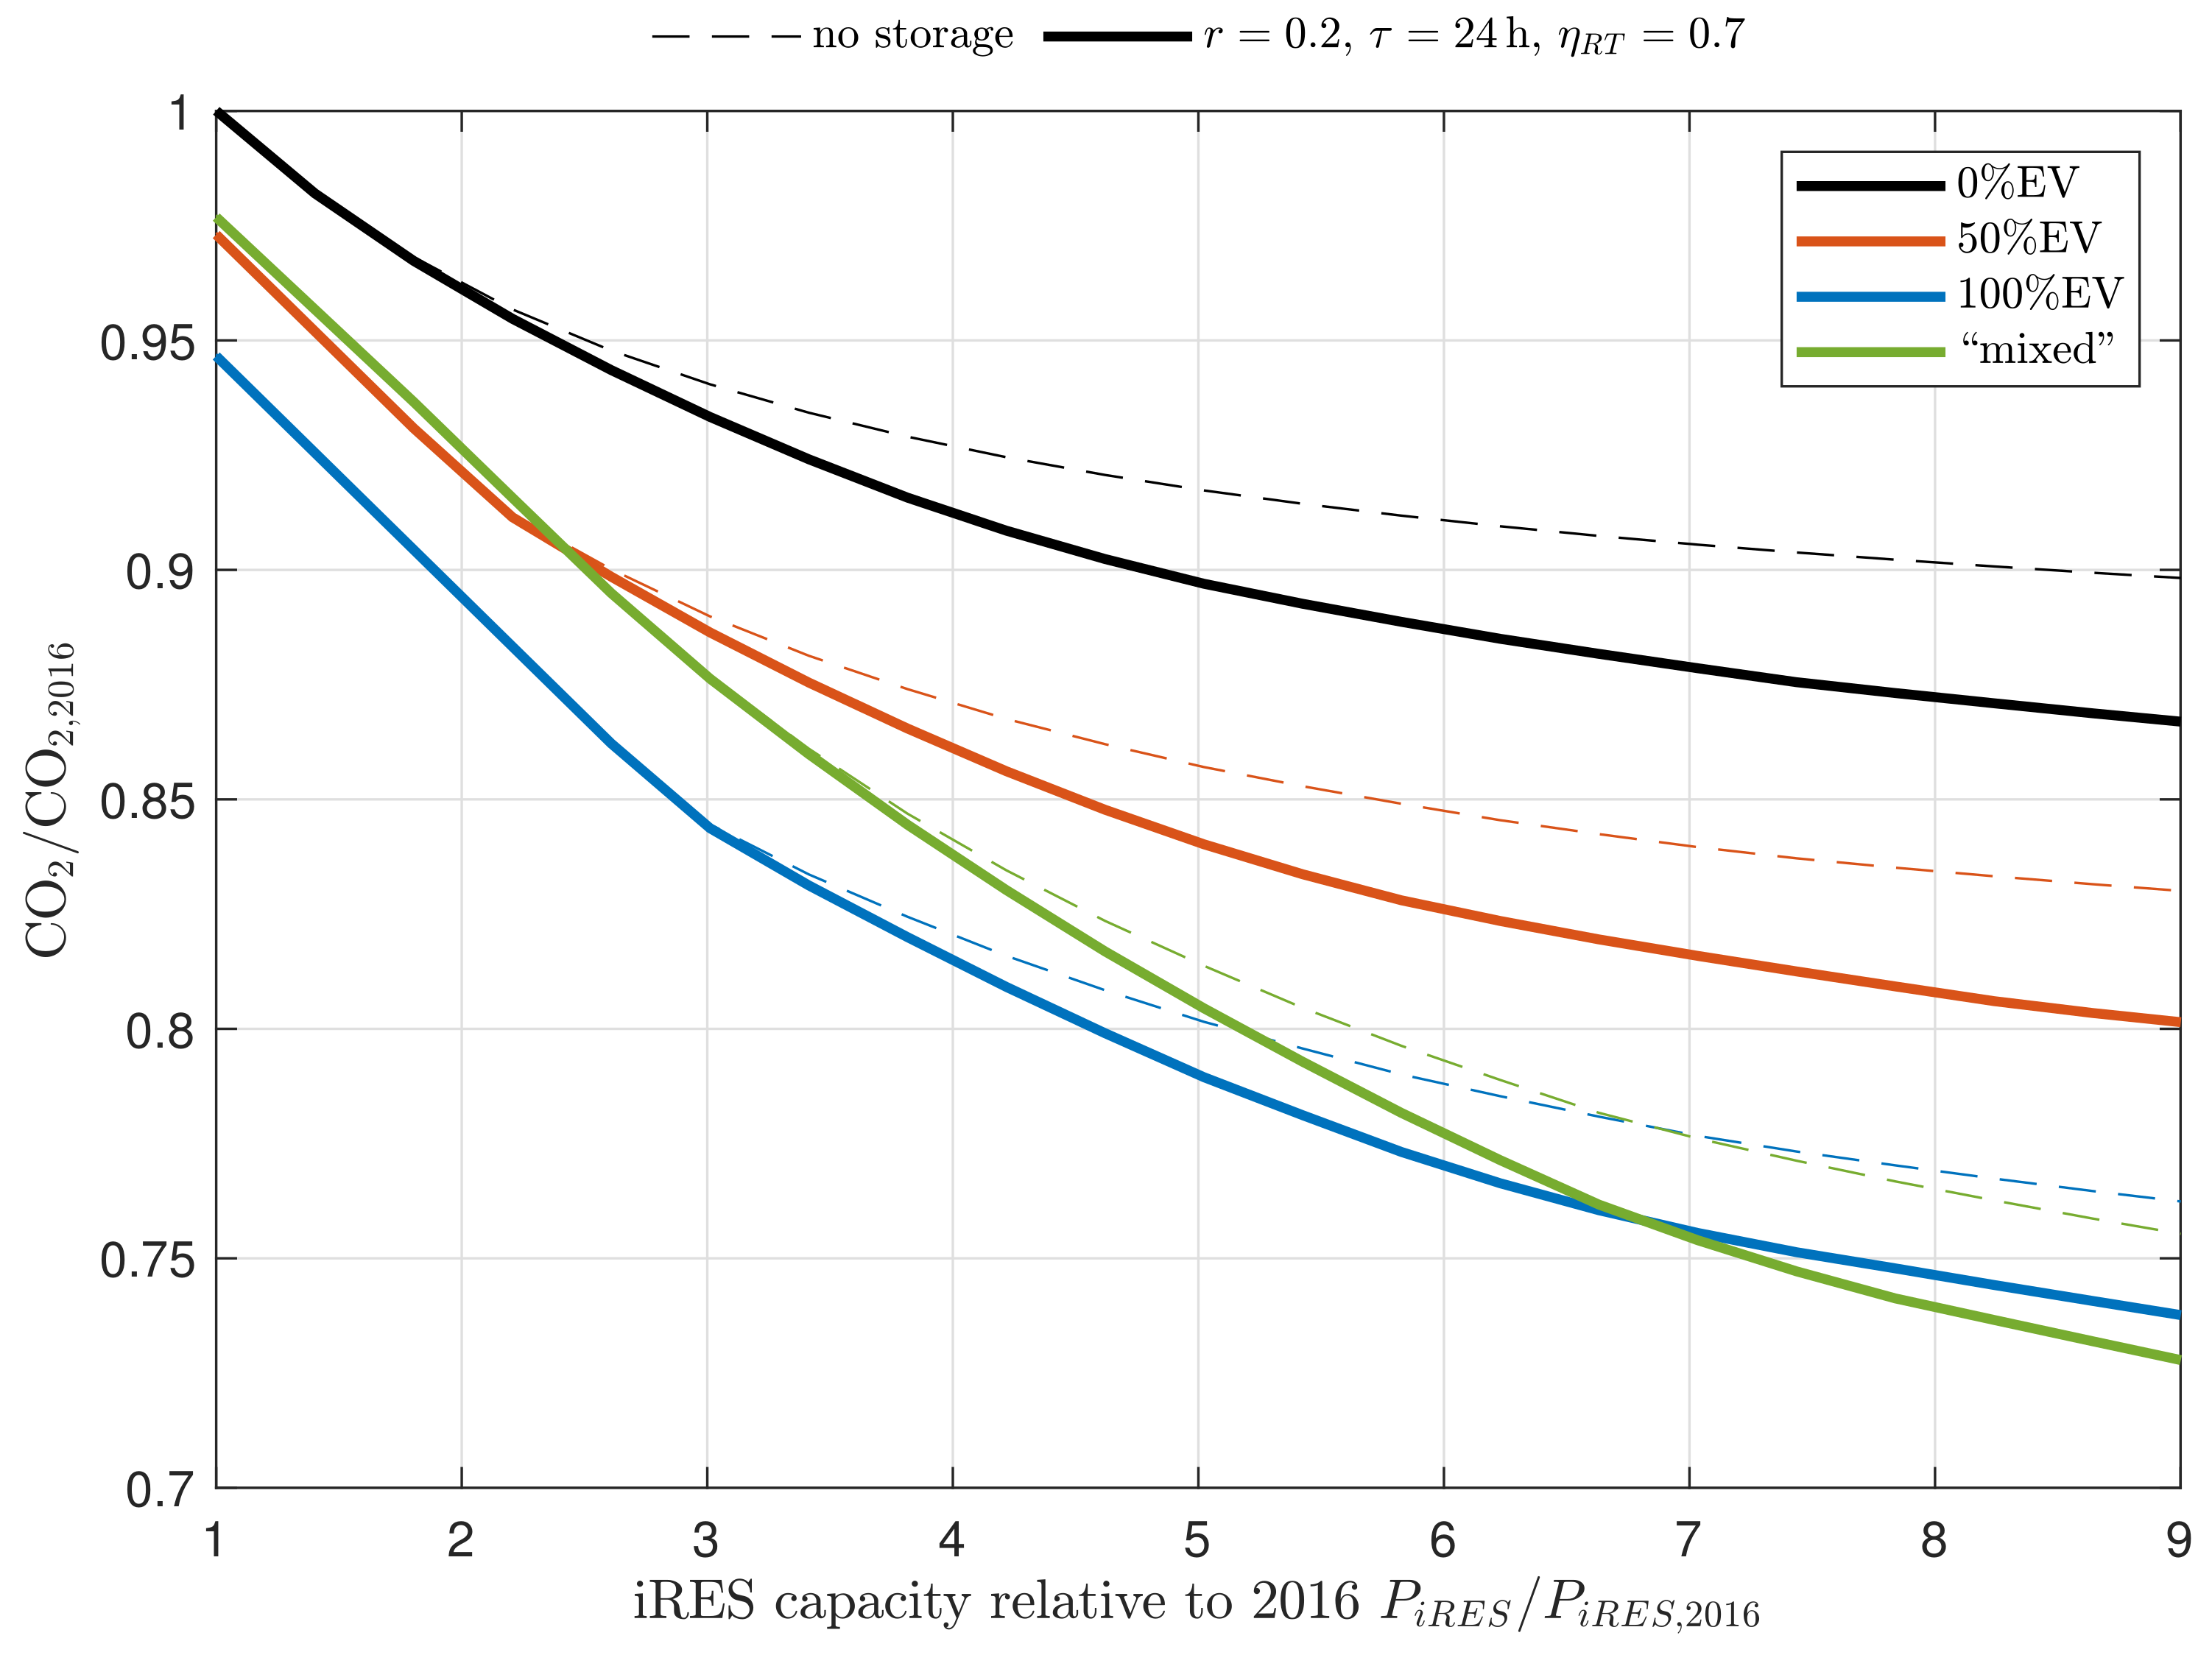
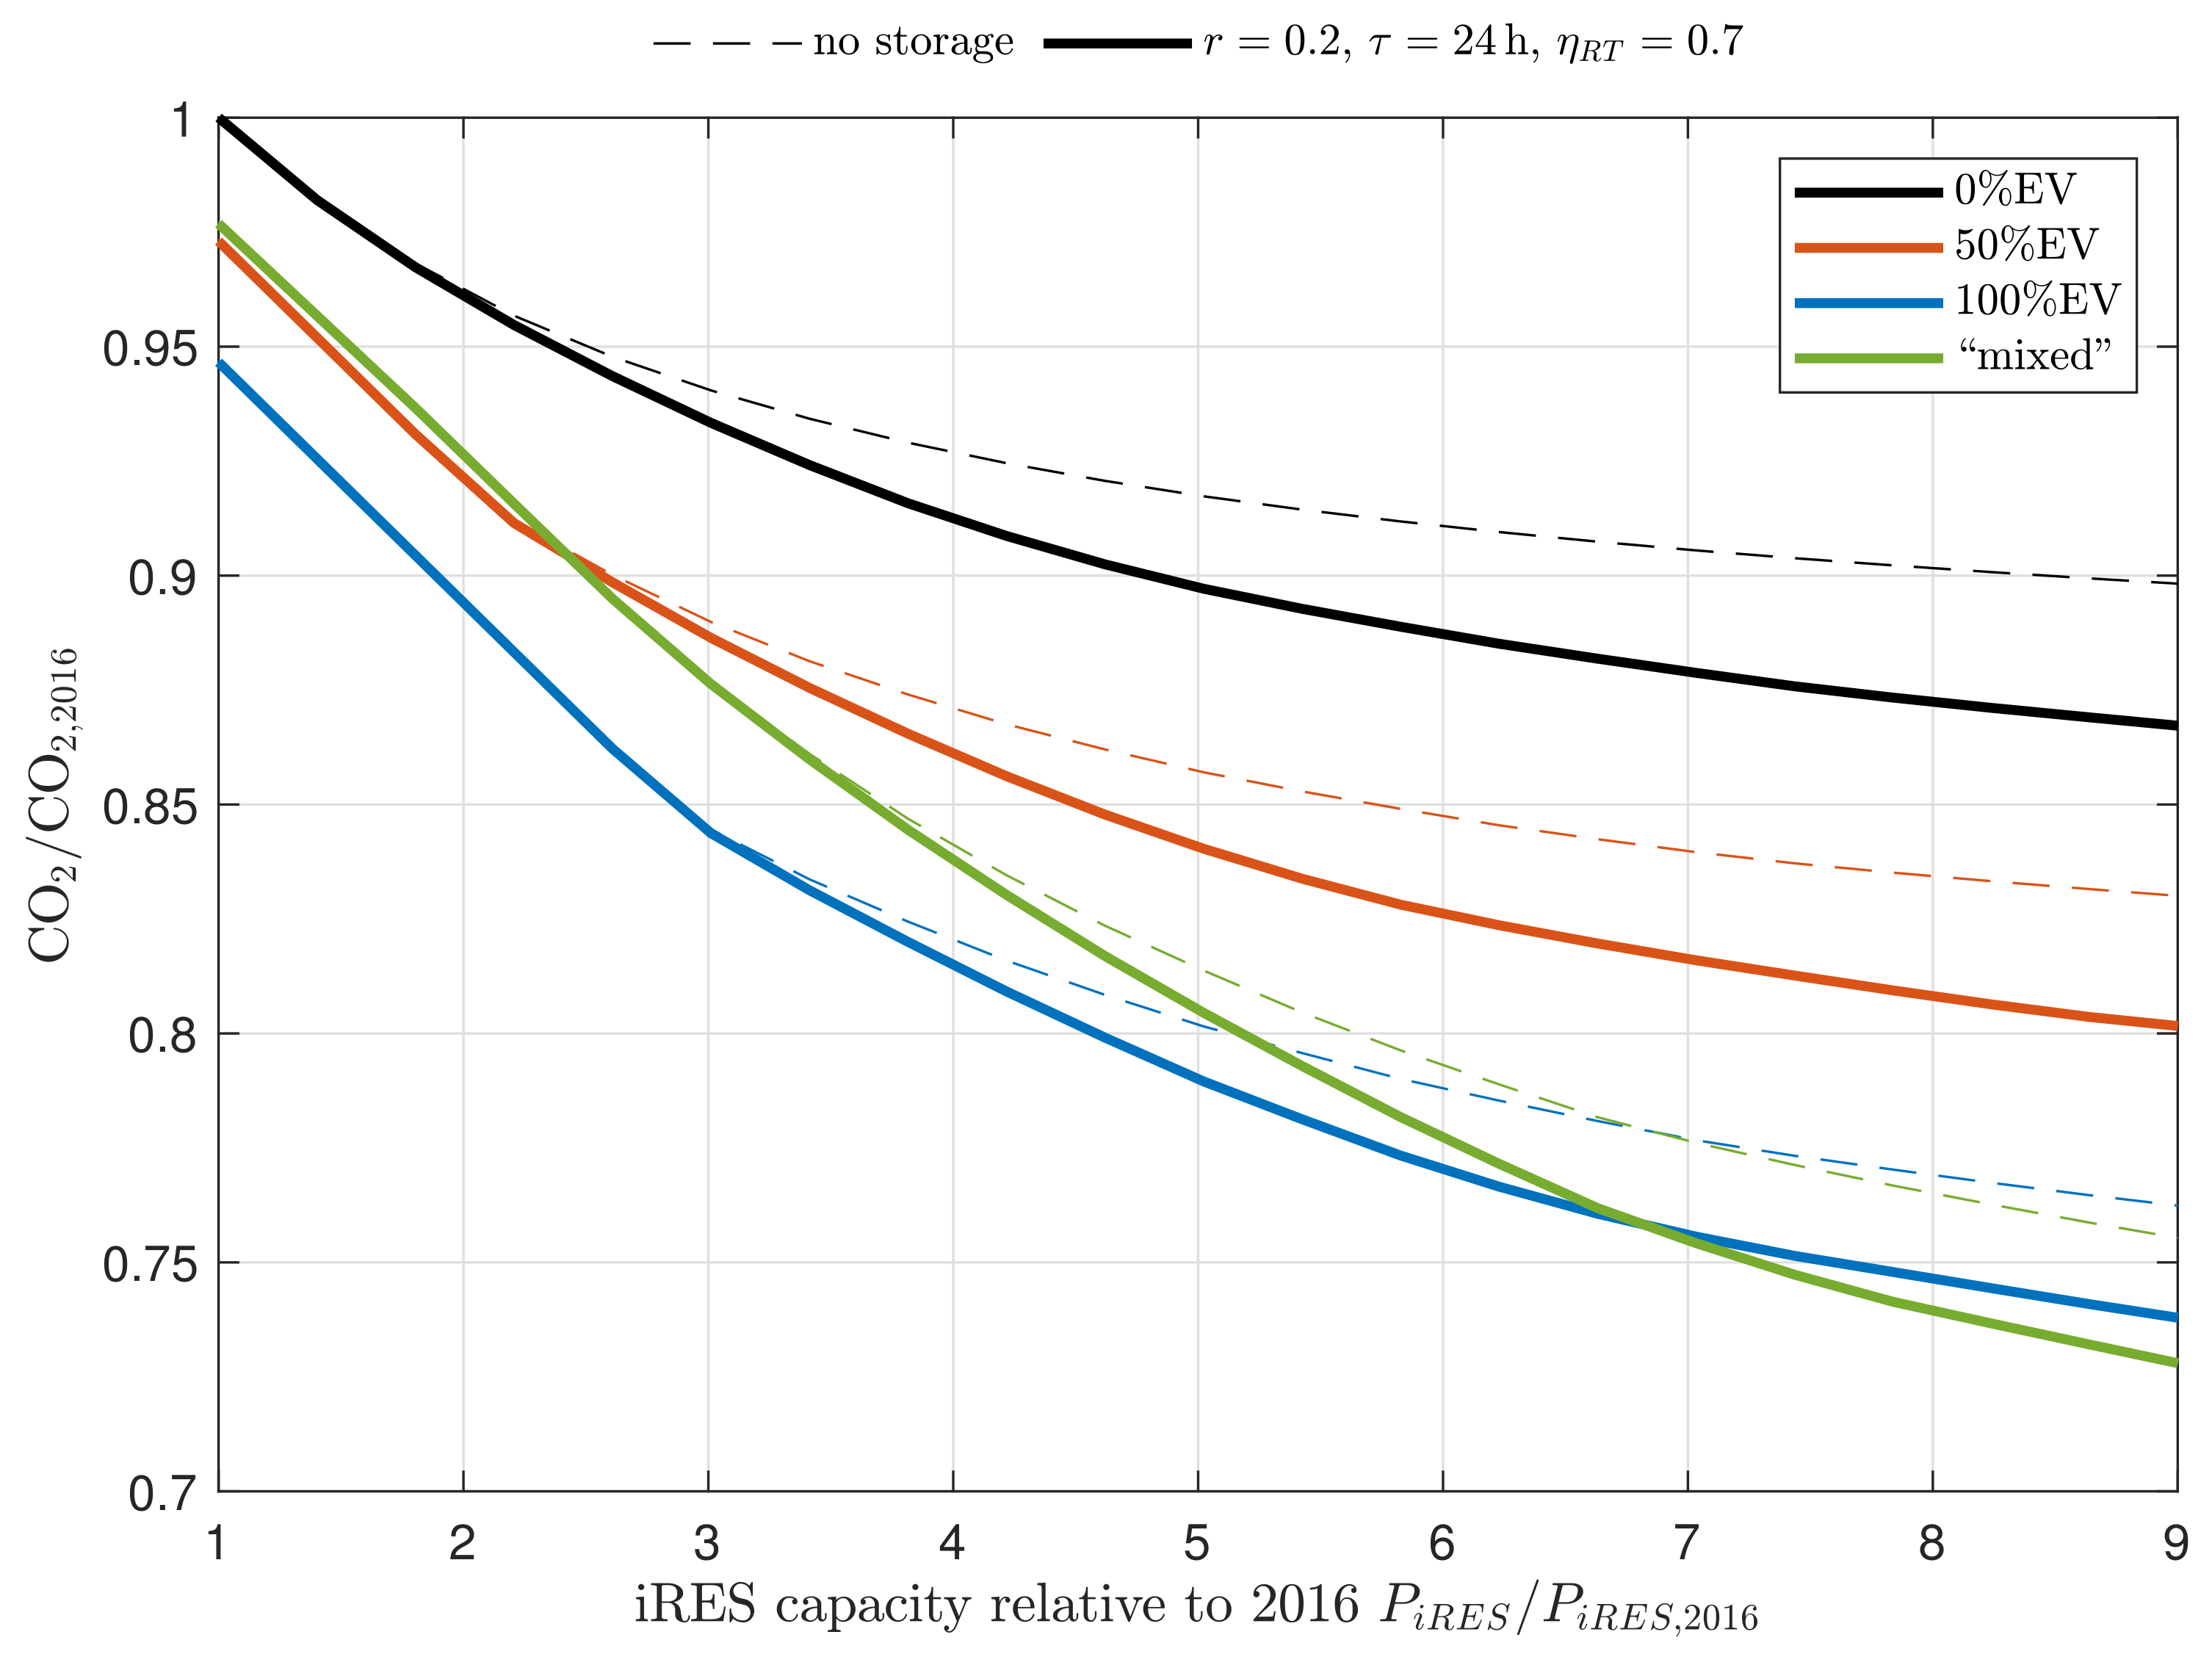
Figure 3 shows CO2 emissions for the different energy scenarios outlined in Section 2.2 as a function of iRES capacity increased up to nine times its current value. Electricity storage has a significant impact as iRES capacity increases, reducing CO2 emissions by approximately 2.5–3 percentage points at the maximum iRES capacity here considered (9×RES).
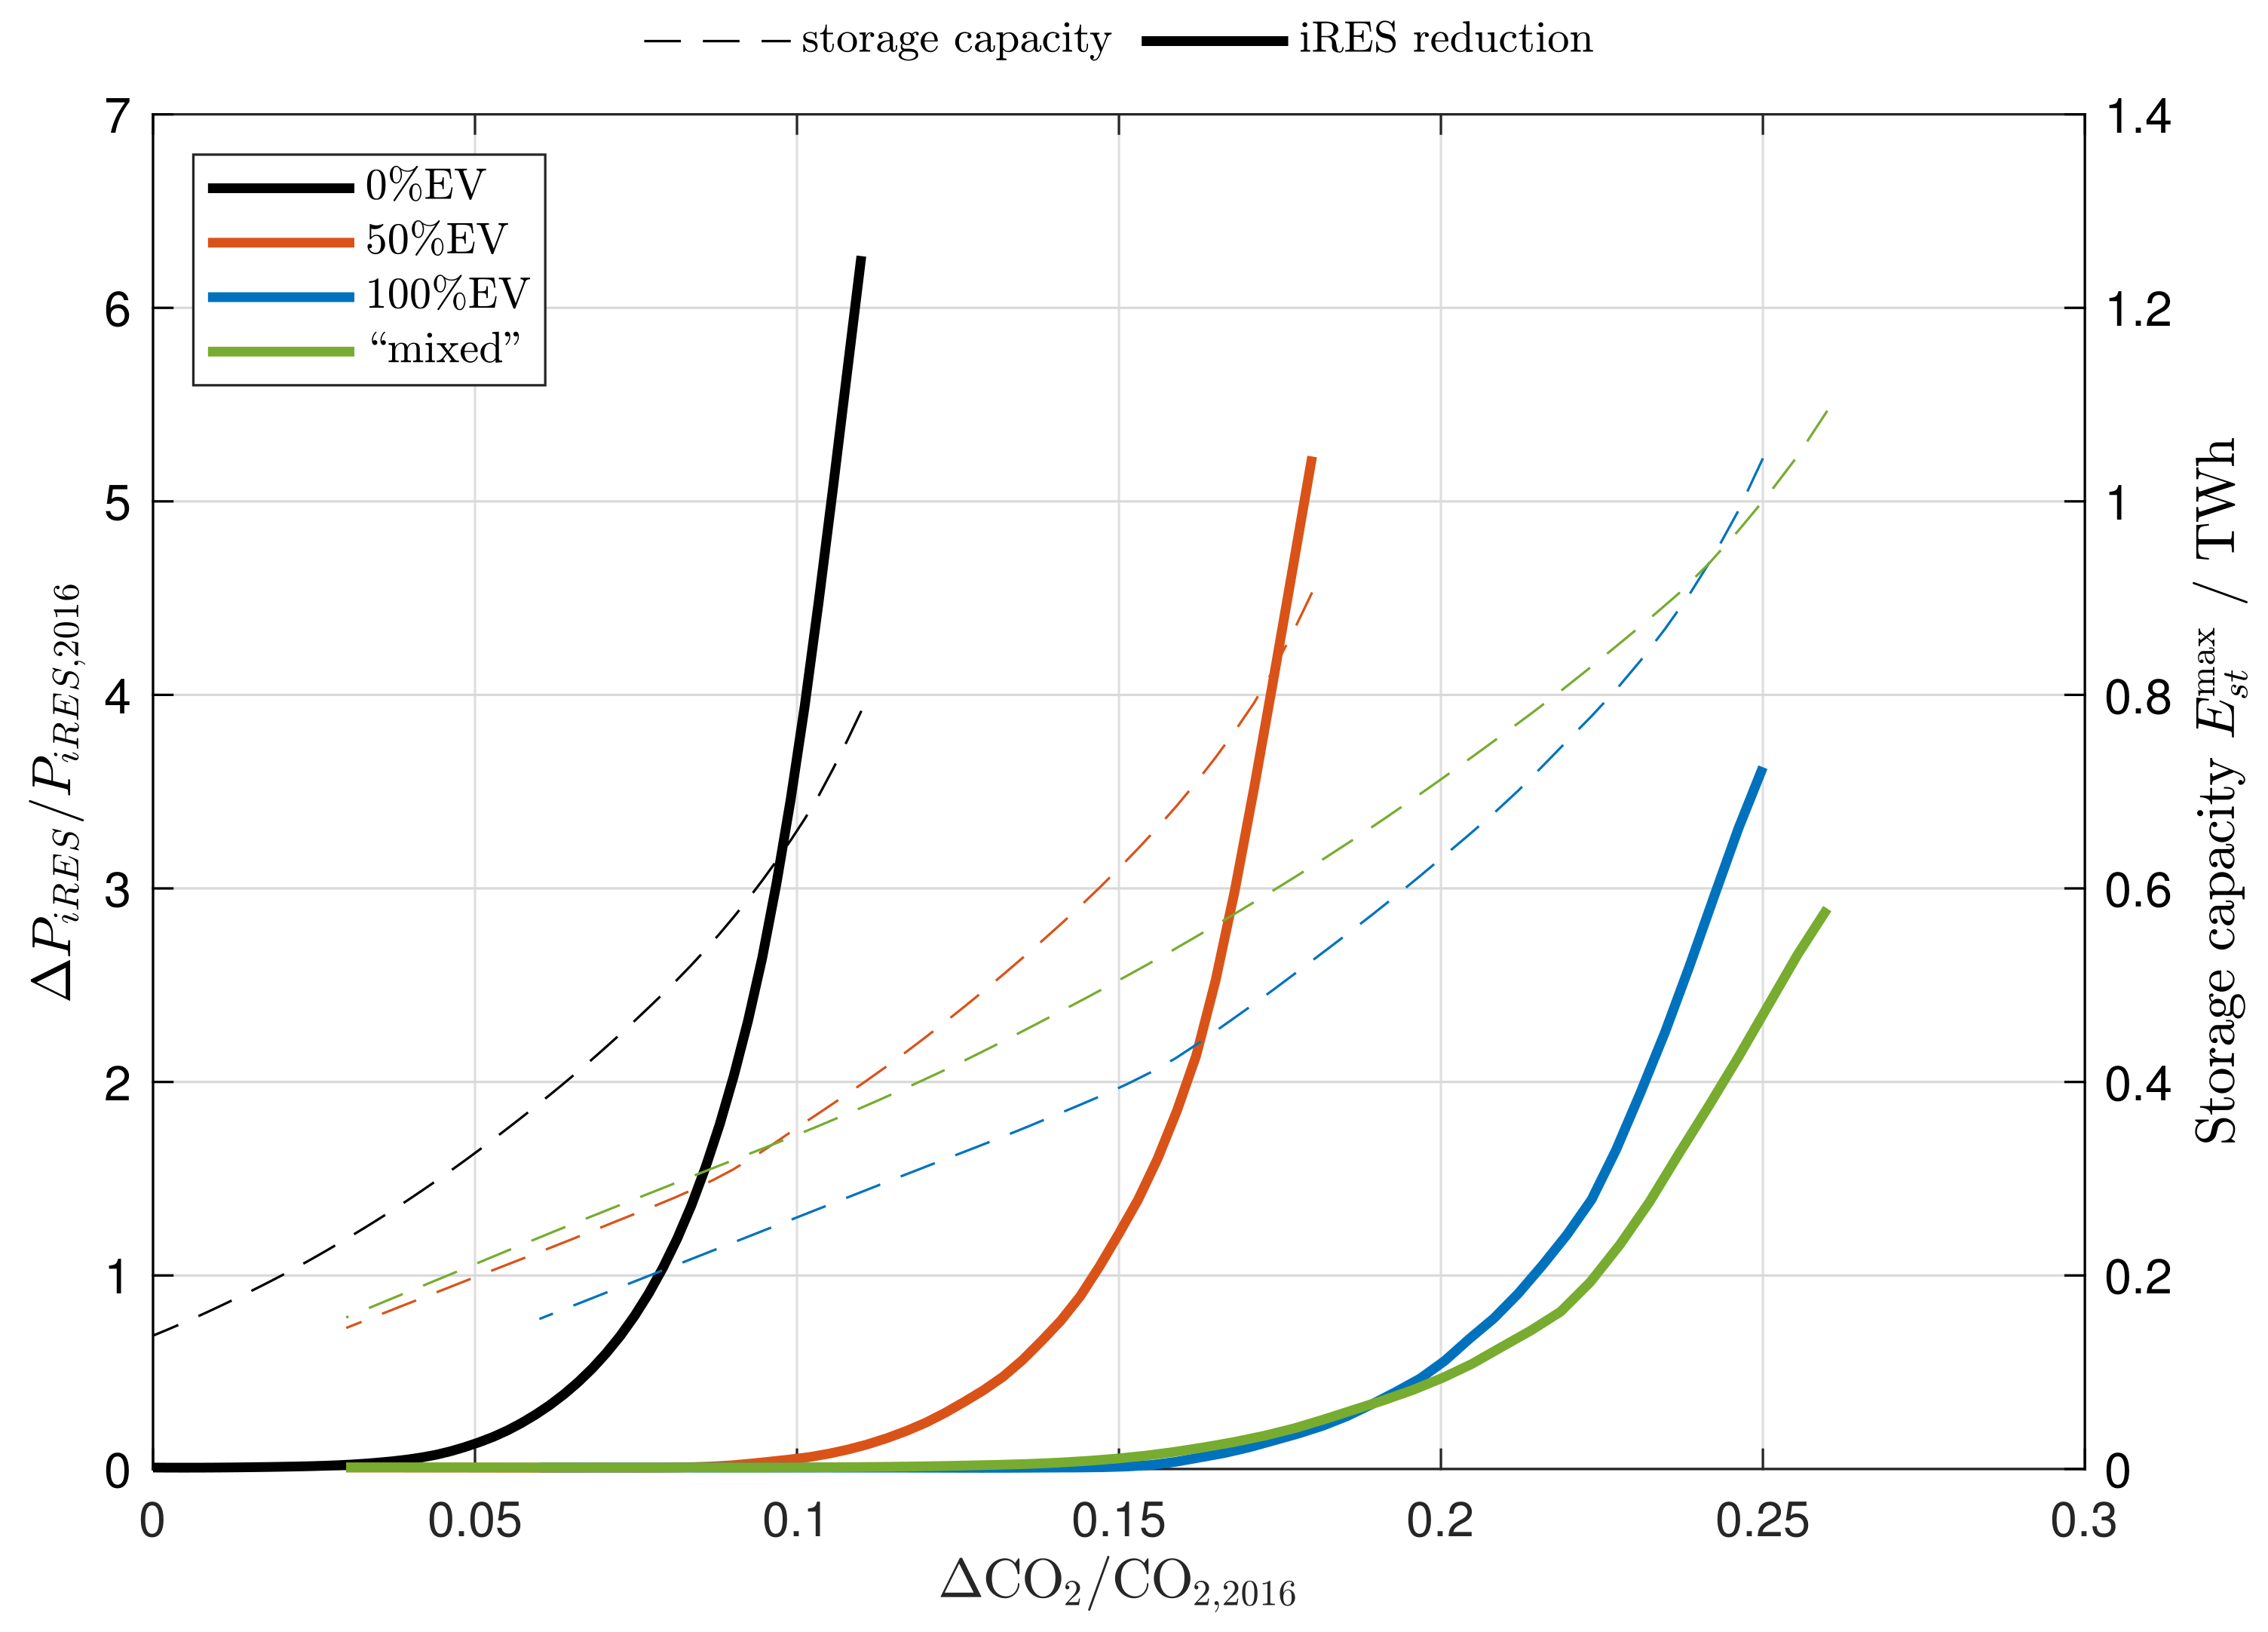
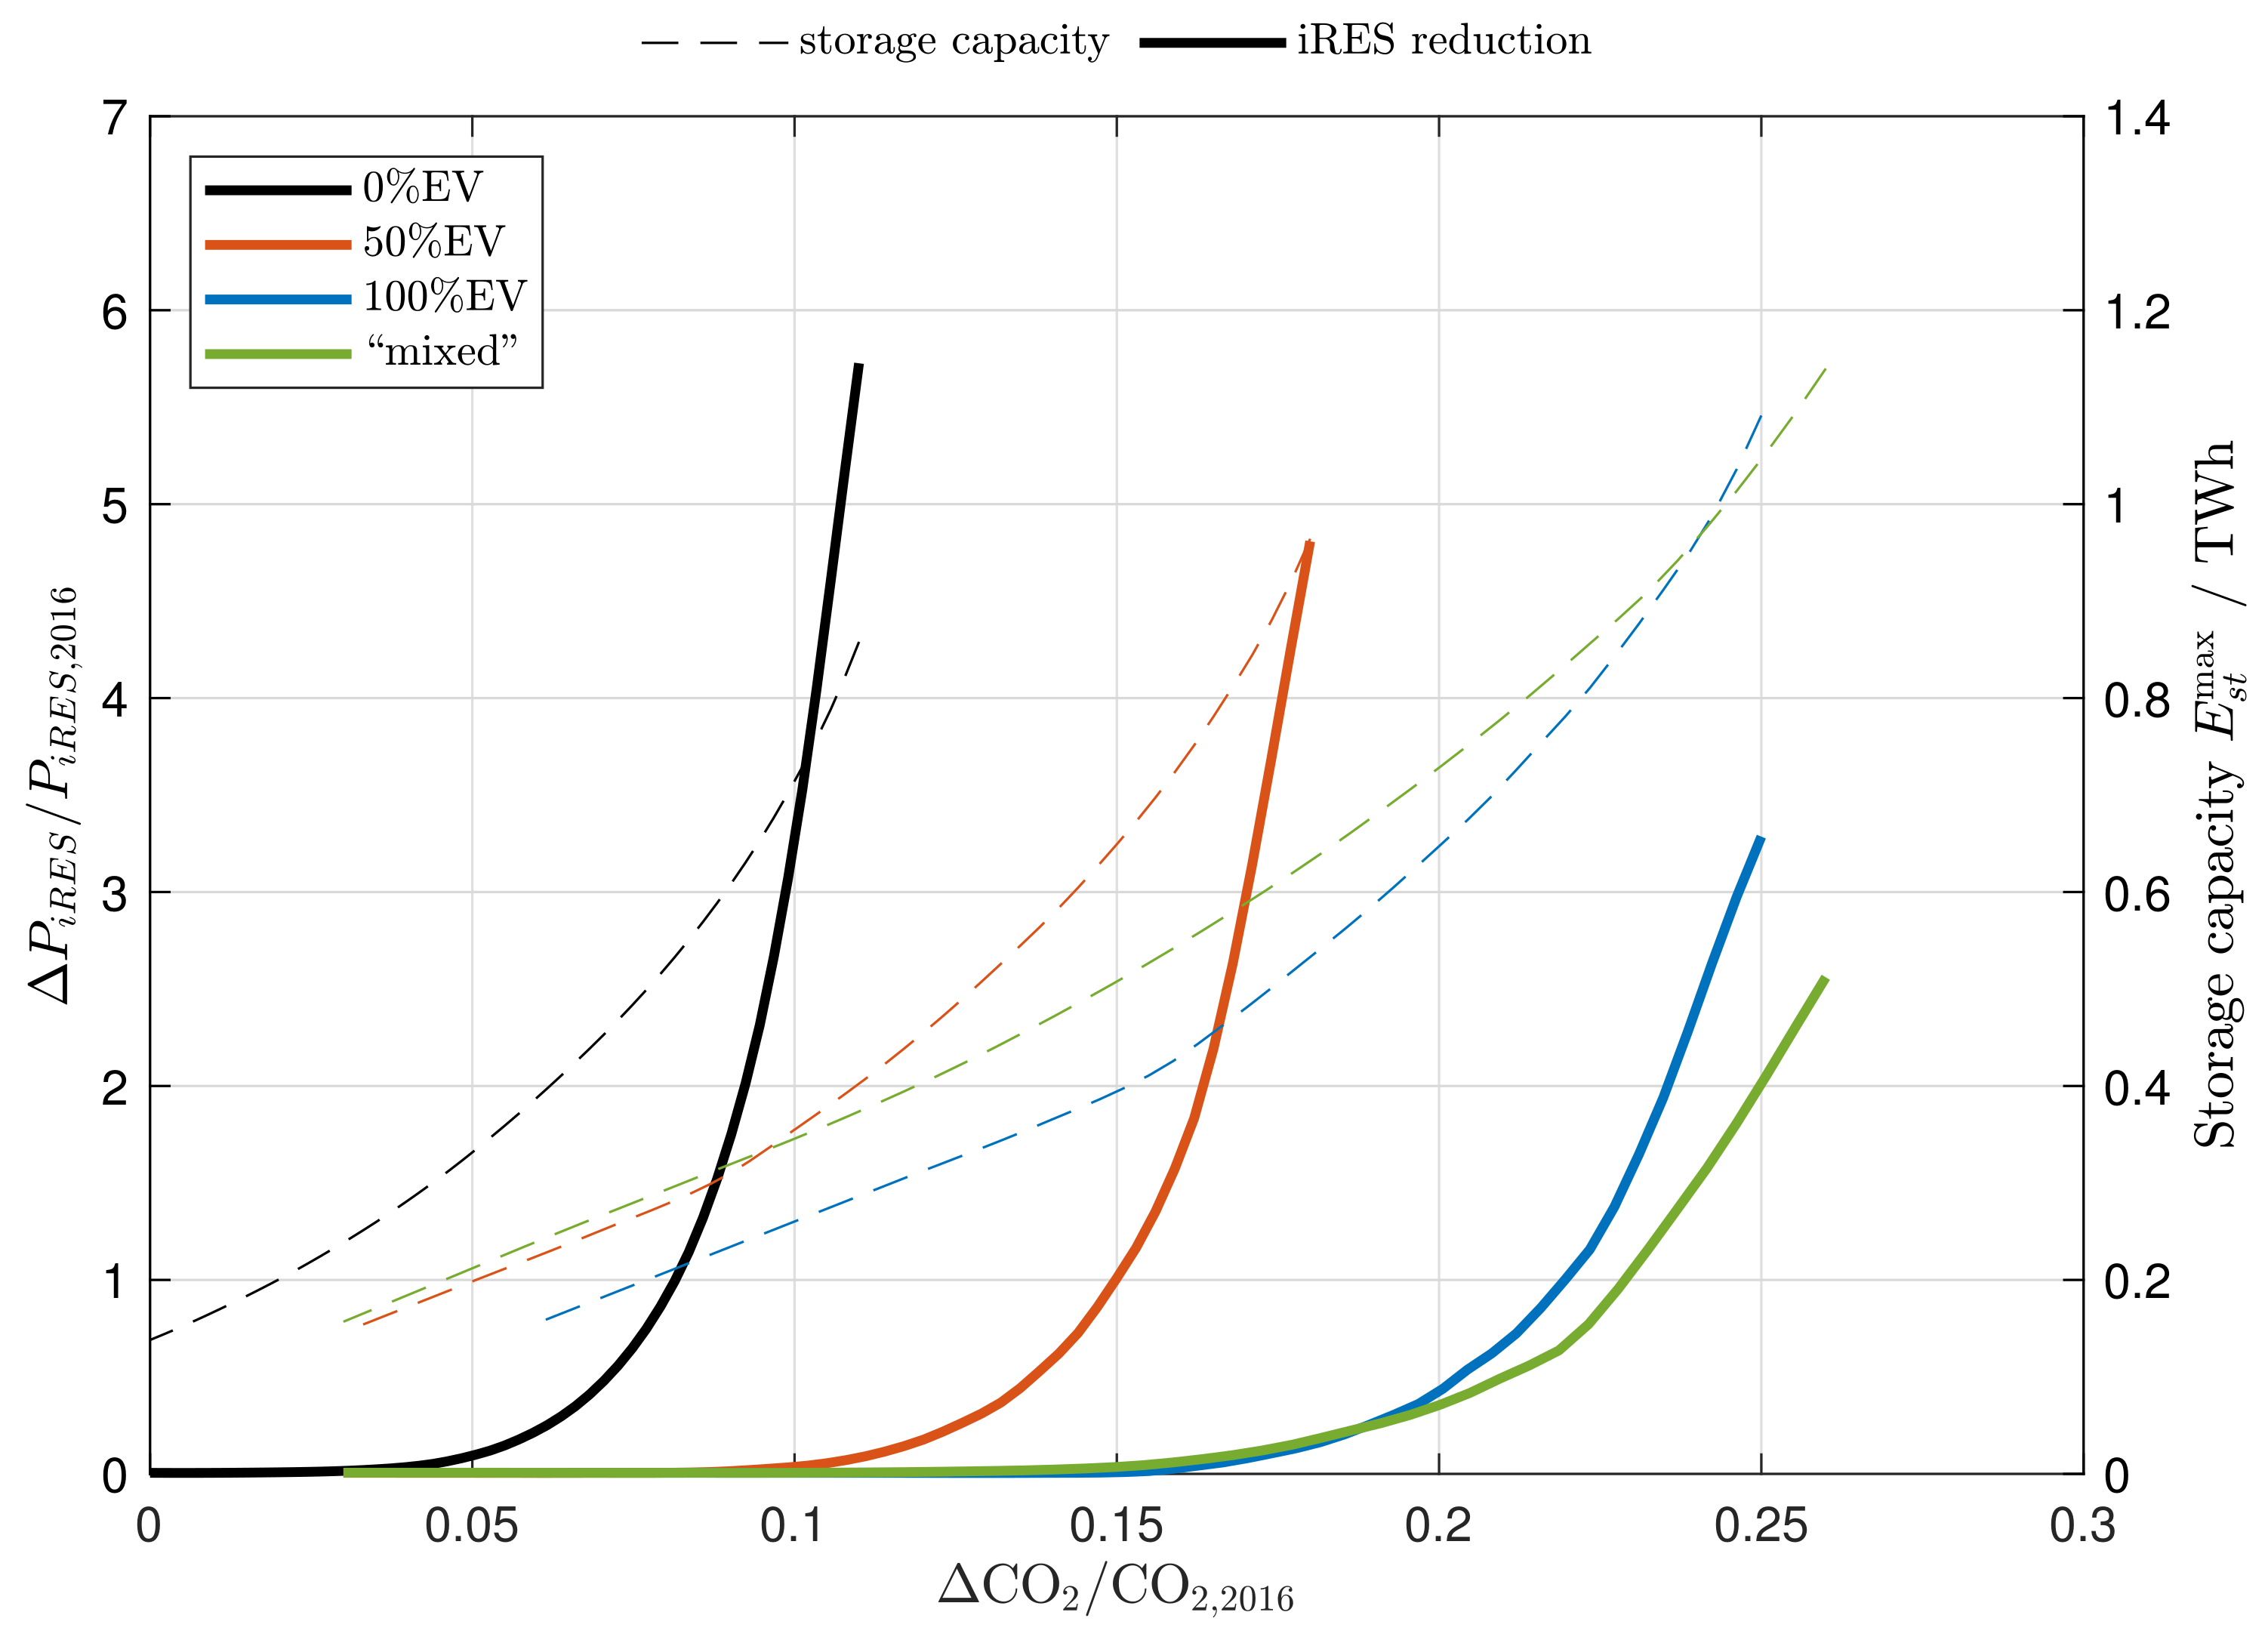
Its impact is even larger if scenarios are compared for the same reduction in CO2 emissions, rather than for the same iRES capacity: for example, in the case of the “mixed” scenario, a 24% decrease in emissions relative to 2016 can be achieved with a relative increase in iRES capacity of just 6.7, compared to 8.5 without any electricity storage. This translates to 78 GW less RES capacity required, which must be compared to the electricity storage capacity required to achieve these results. The reduction in iRES capacity required to achieve a given decrease in emissions is shown in Figure 4 for all energy scenarios here considered. In the same figure, the required electric storage capacity, which is a function of iRES capacity through storage parameters r and , is also represented. It can be seen that in the energy scenarios considered in this work a large overall storage capacity, around 1 TWh, must be deployed in order to achieve good results in terms of emissions reduction. According to Schmidt et al. [16], for current storage technologies reaching this 1 TWh target is feasible by 2027–2040 on both technical (resource availability) and economical (market growth projections and expected costs decrease) grounds. However, economic feasibility should be discussed also with reference to the possible savings in iRES capacity costs: Section 3.4 is dedicated to this subject.
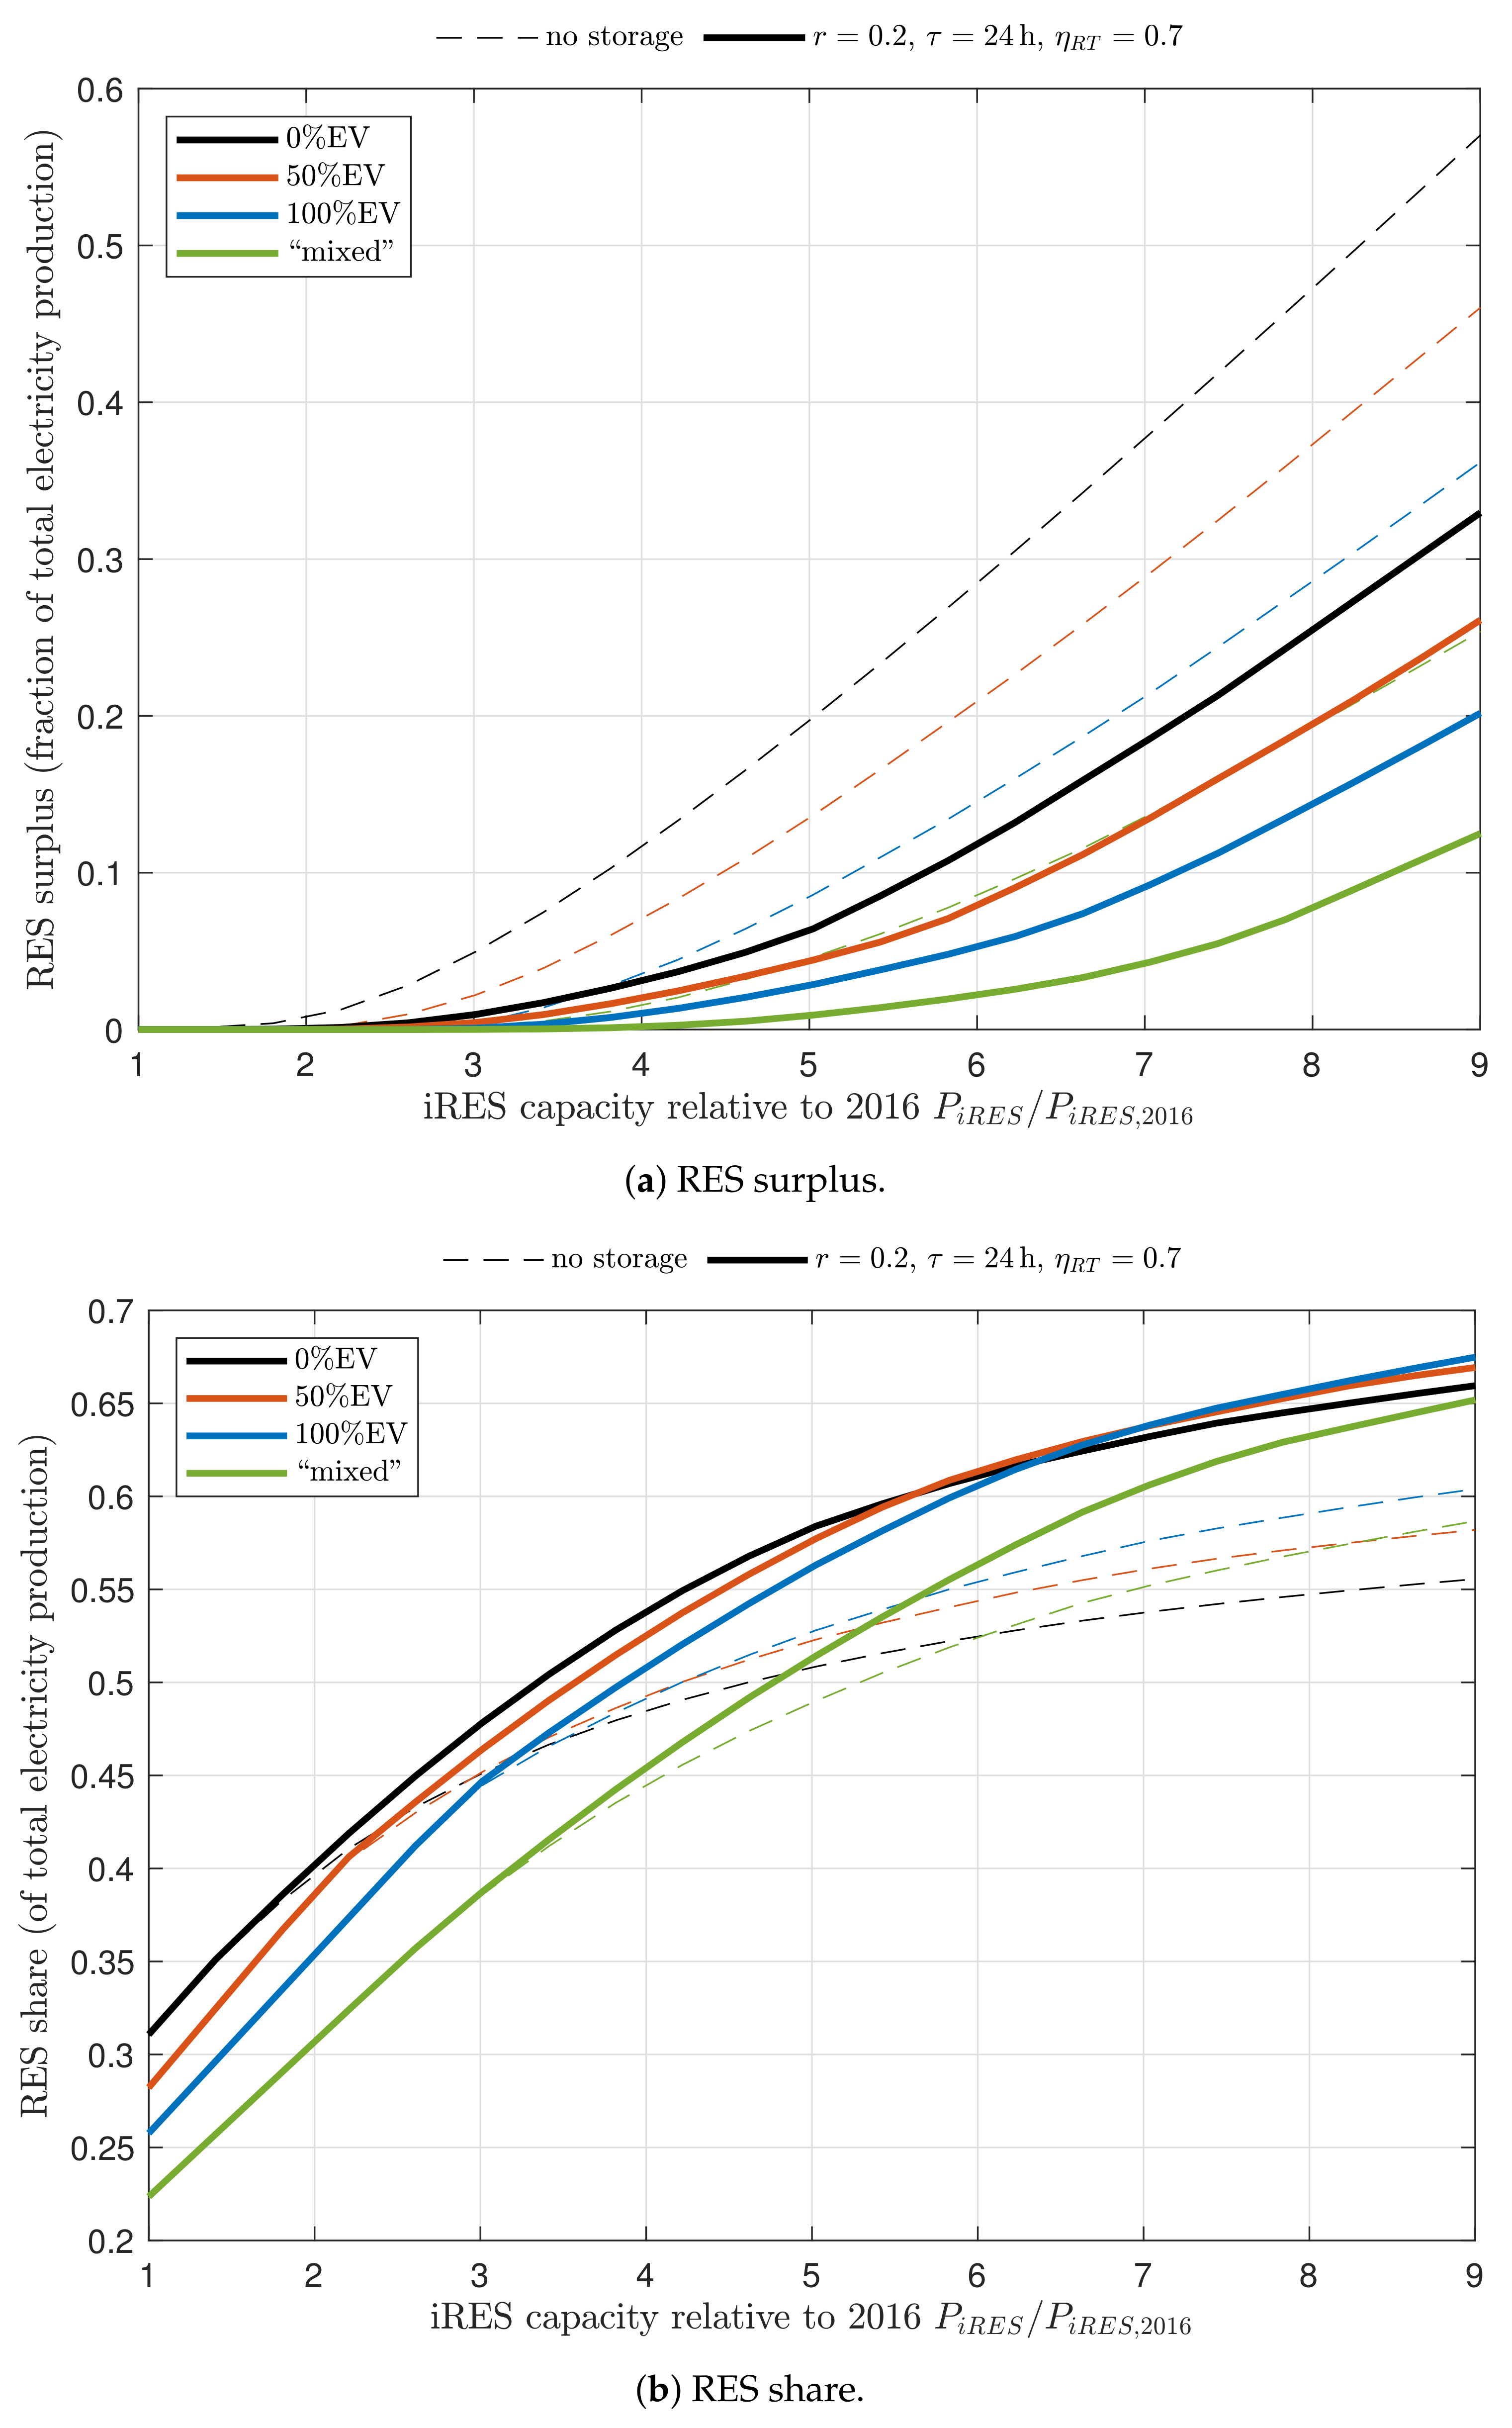
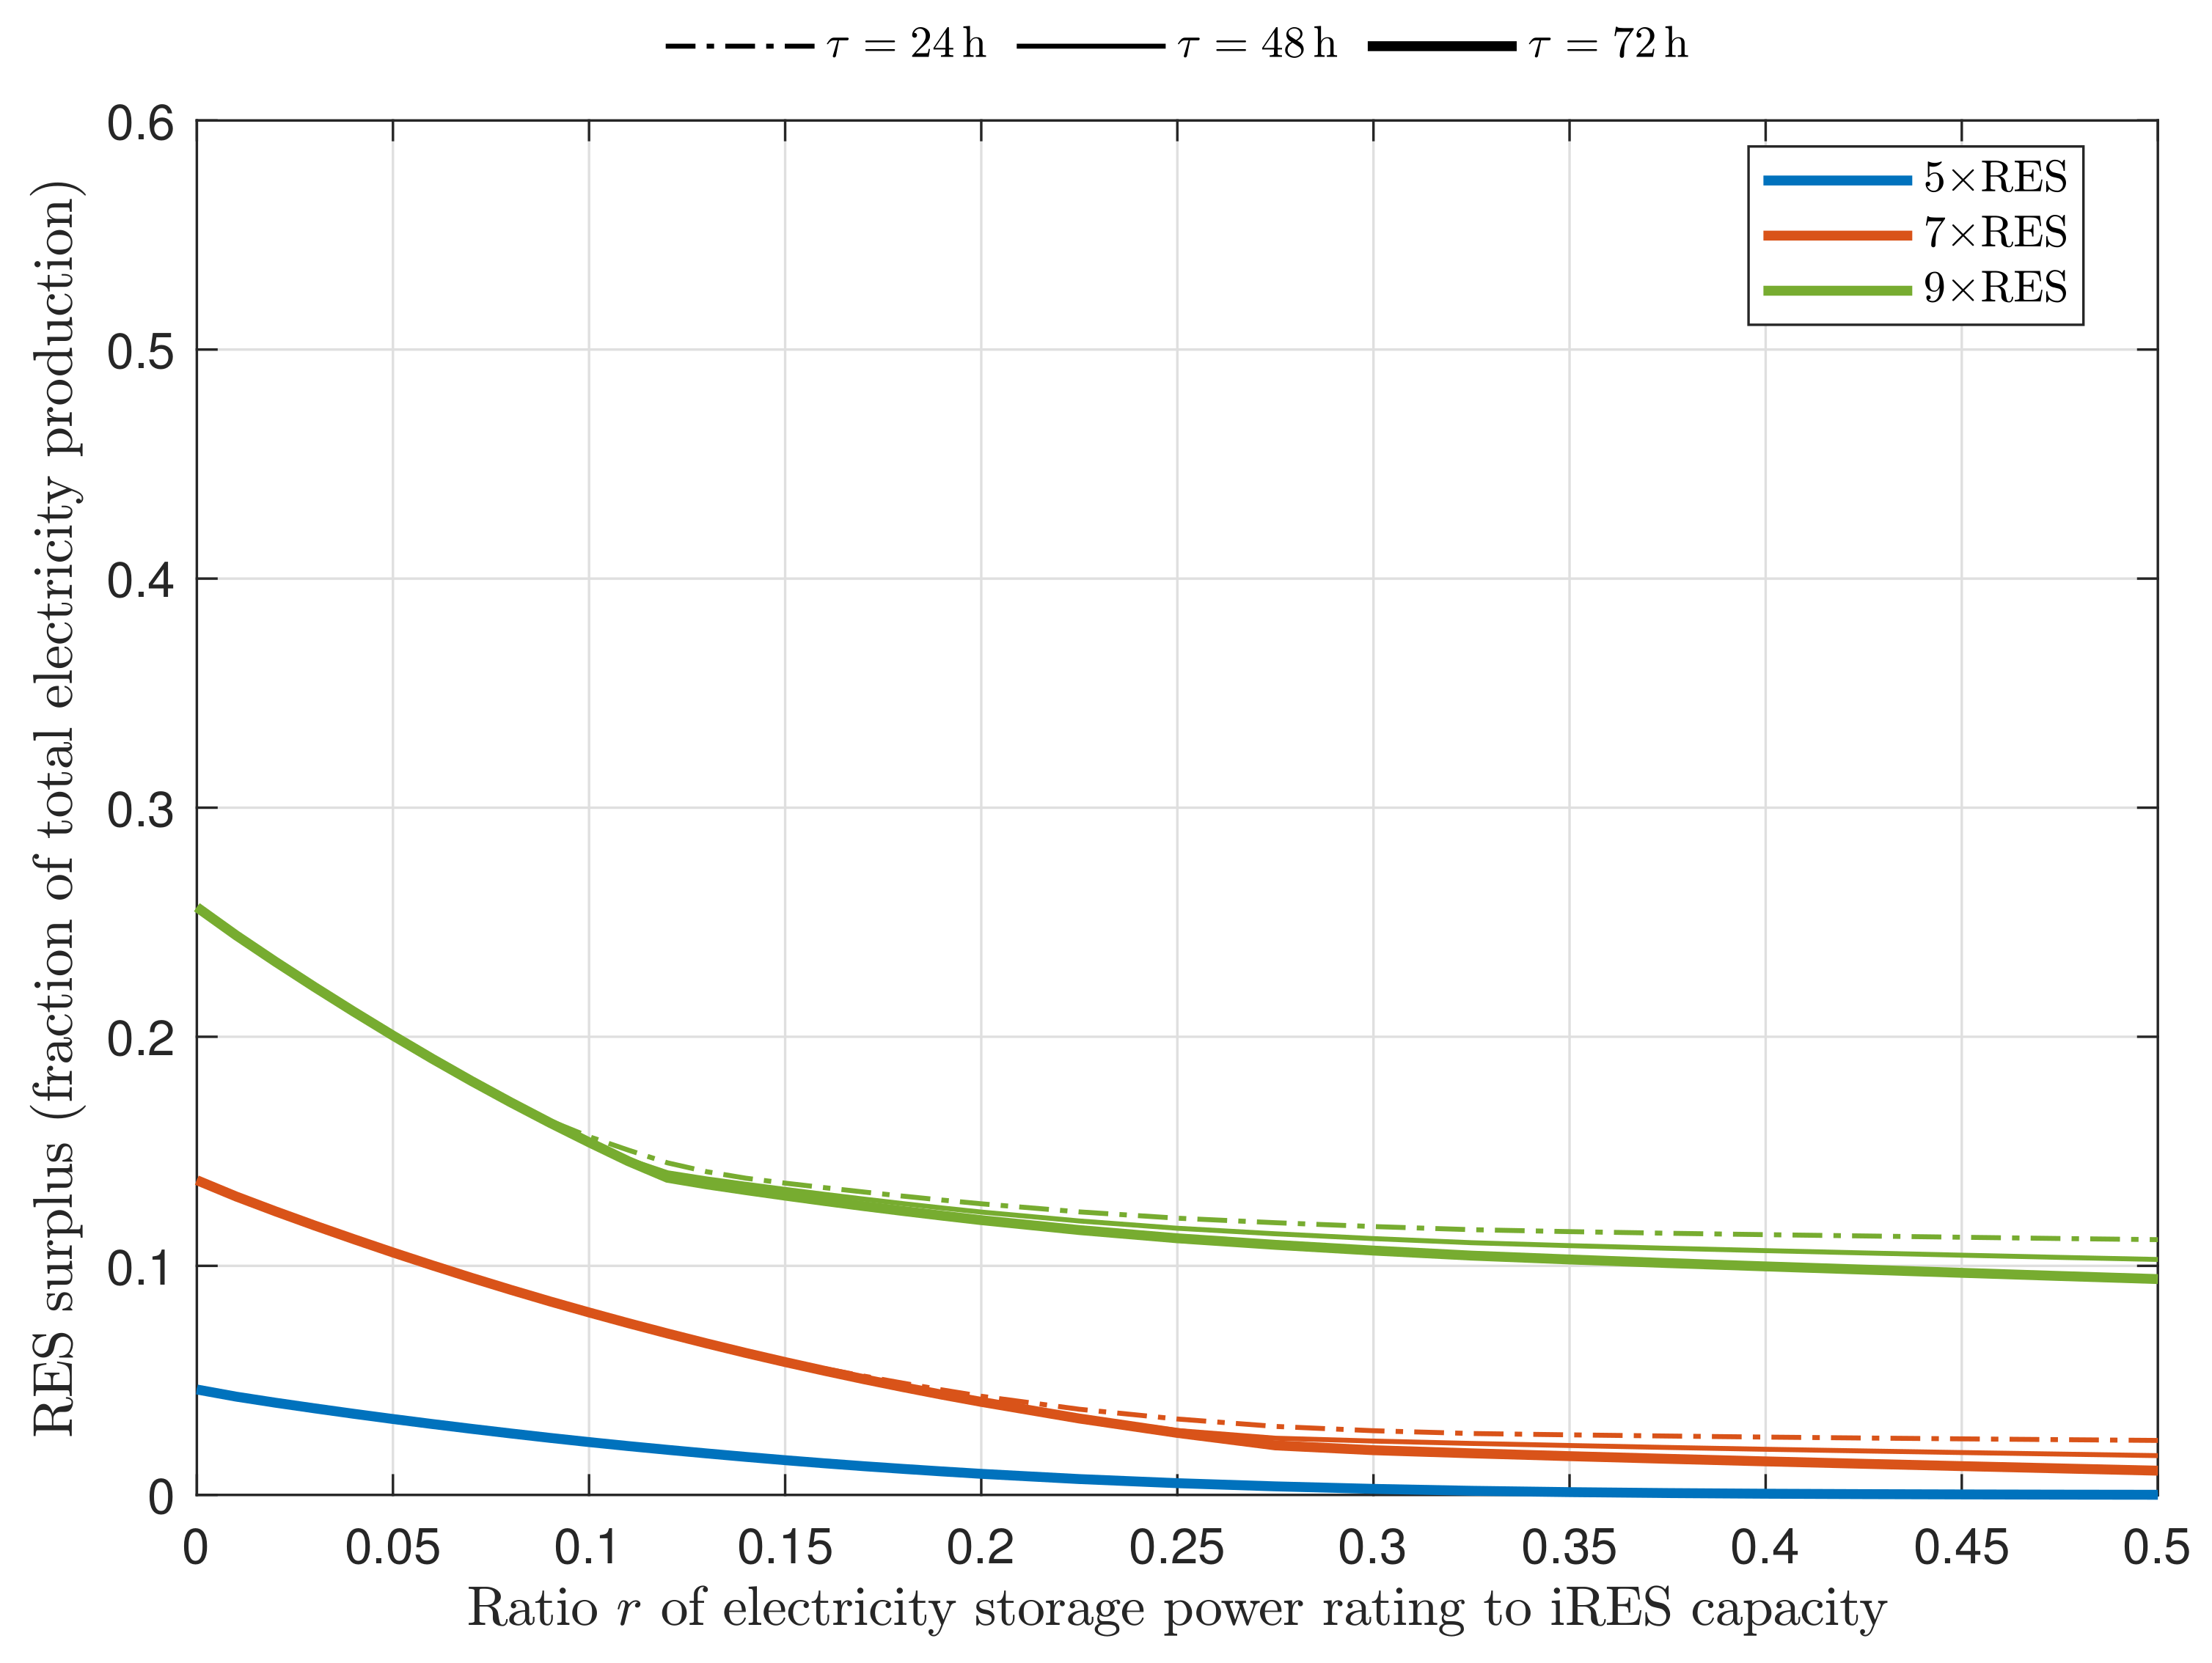
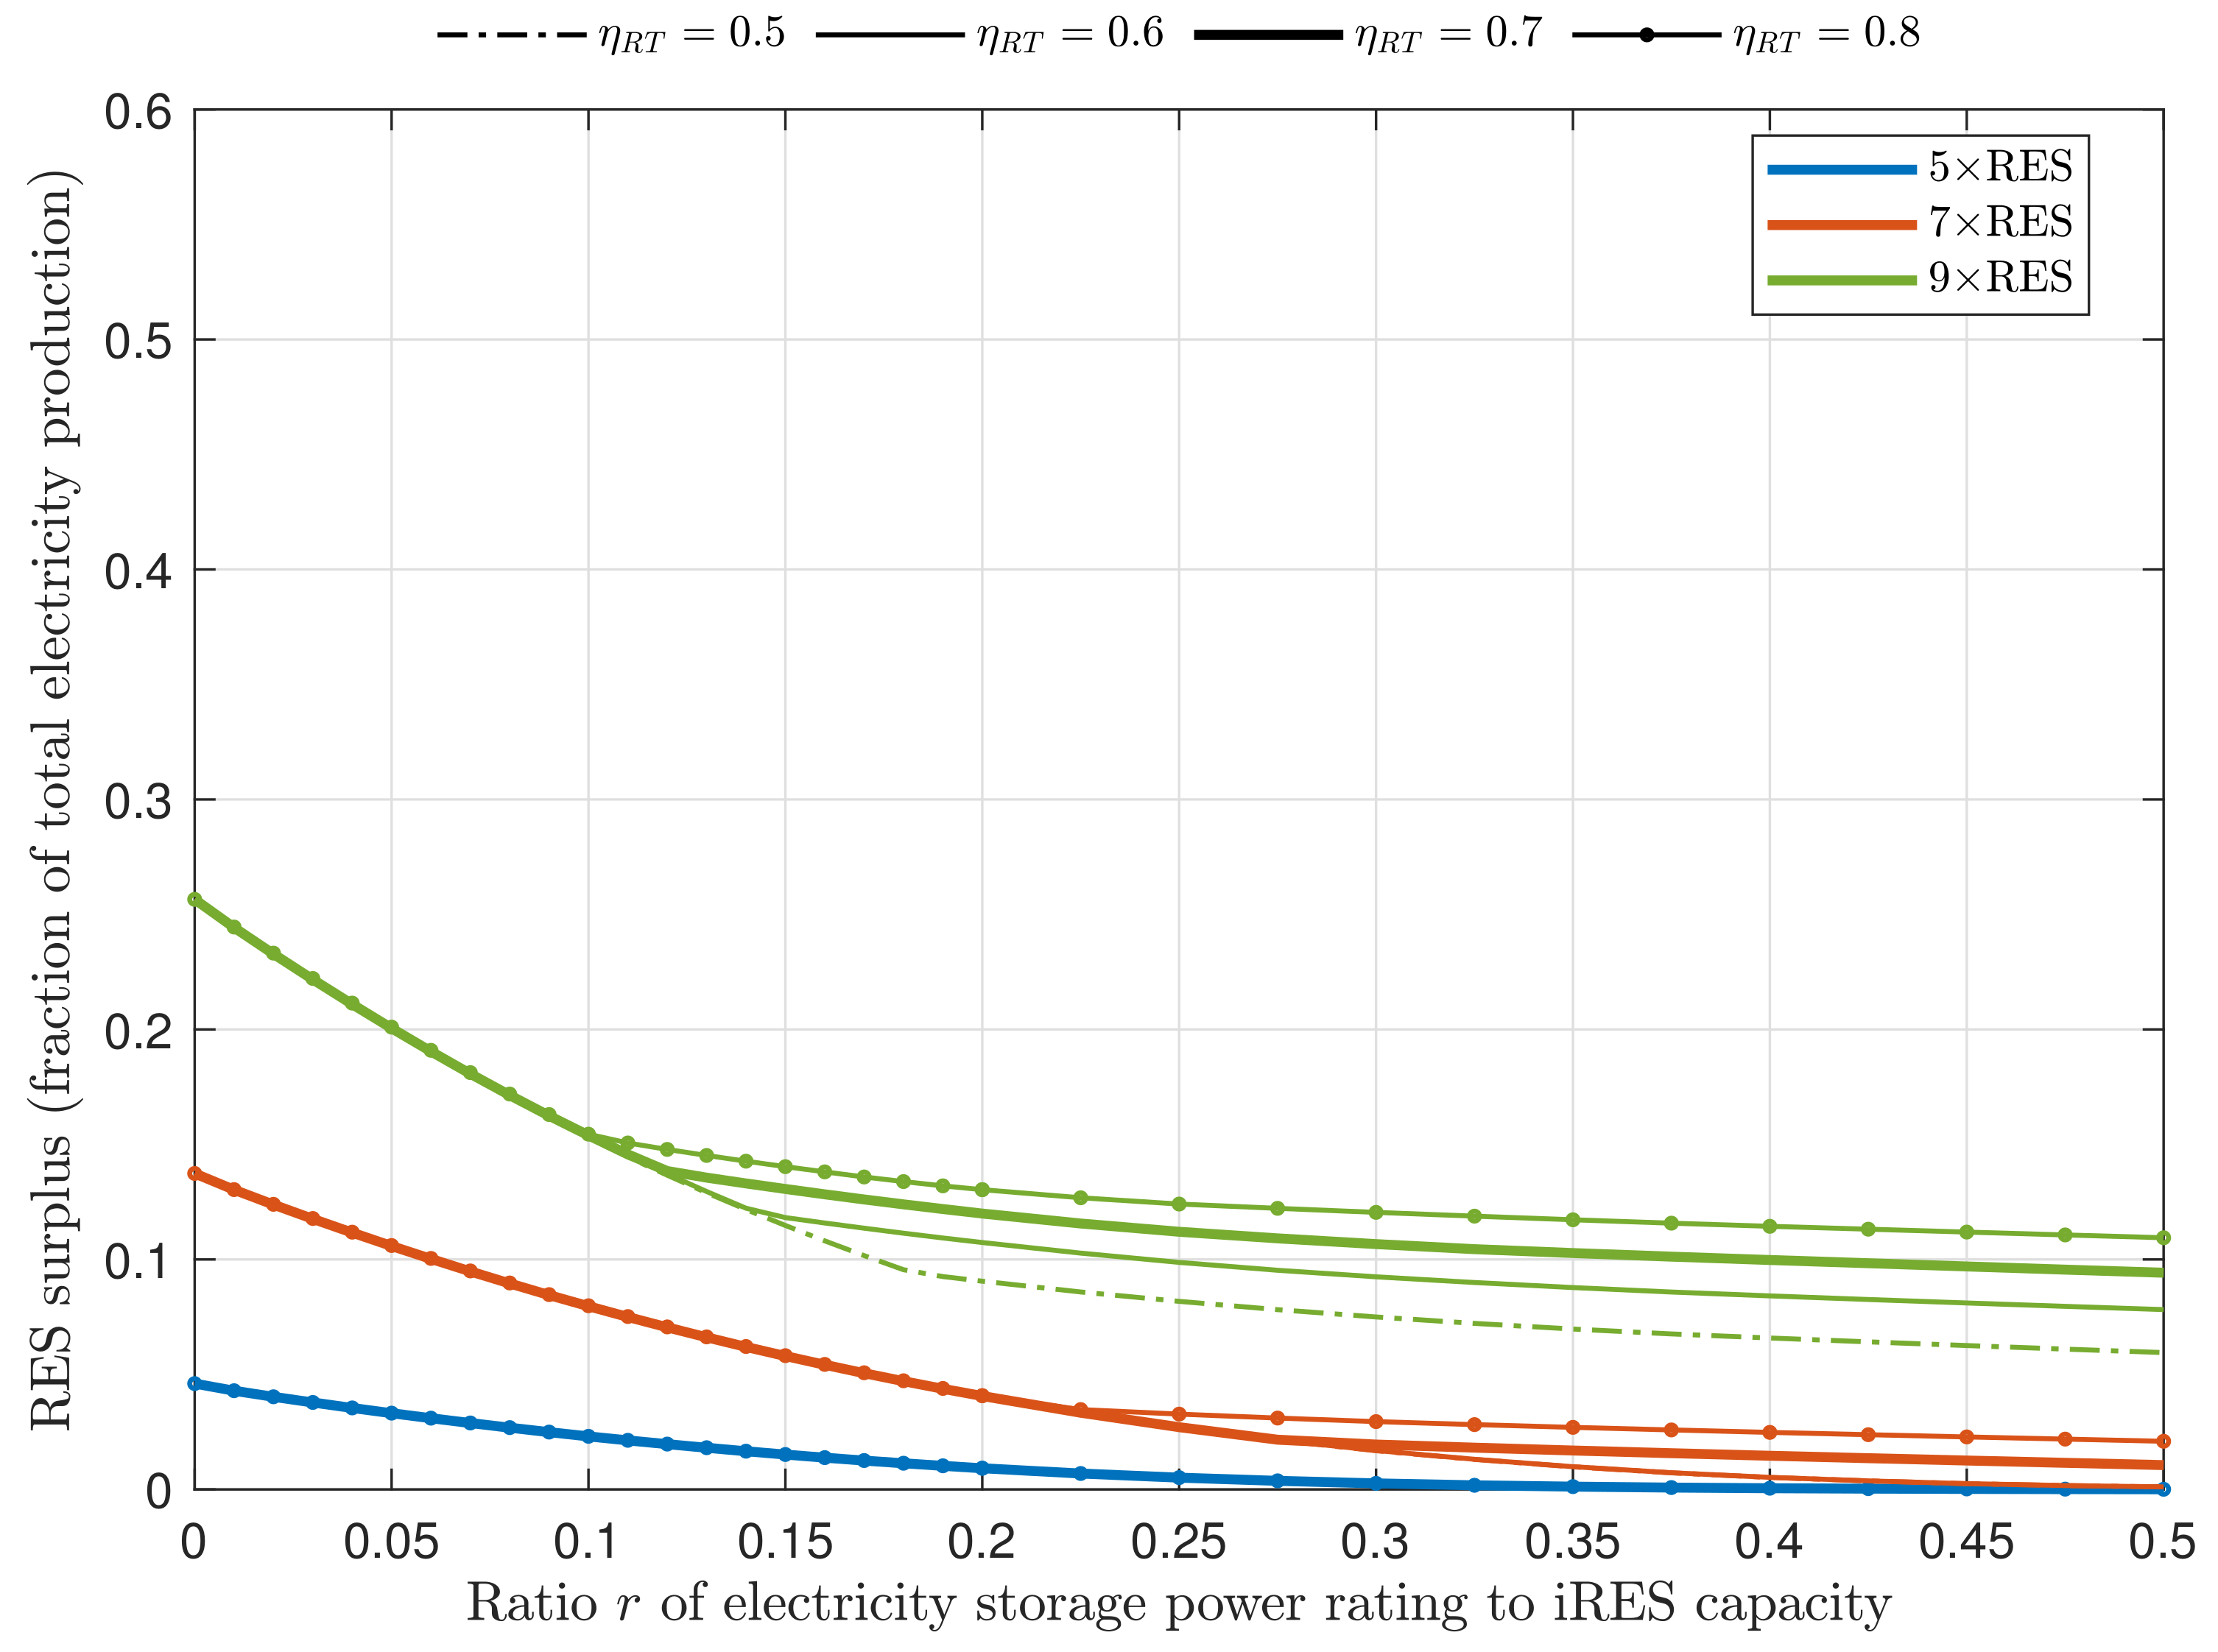
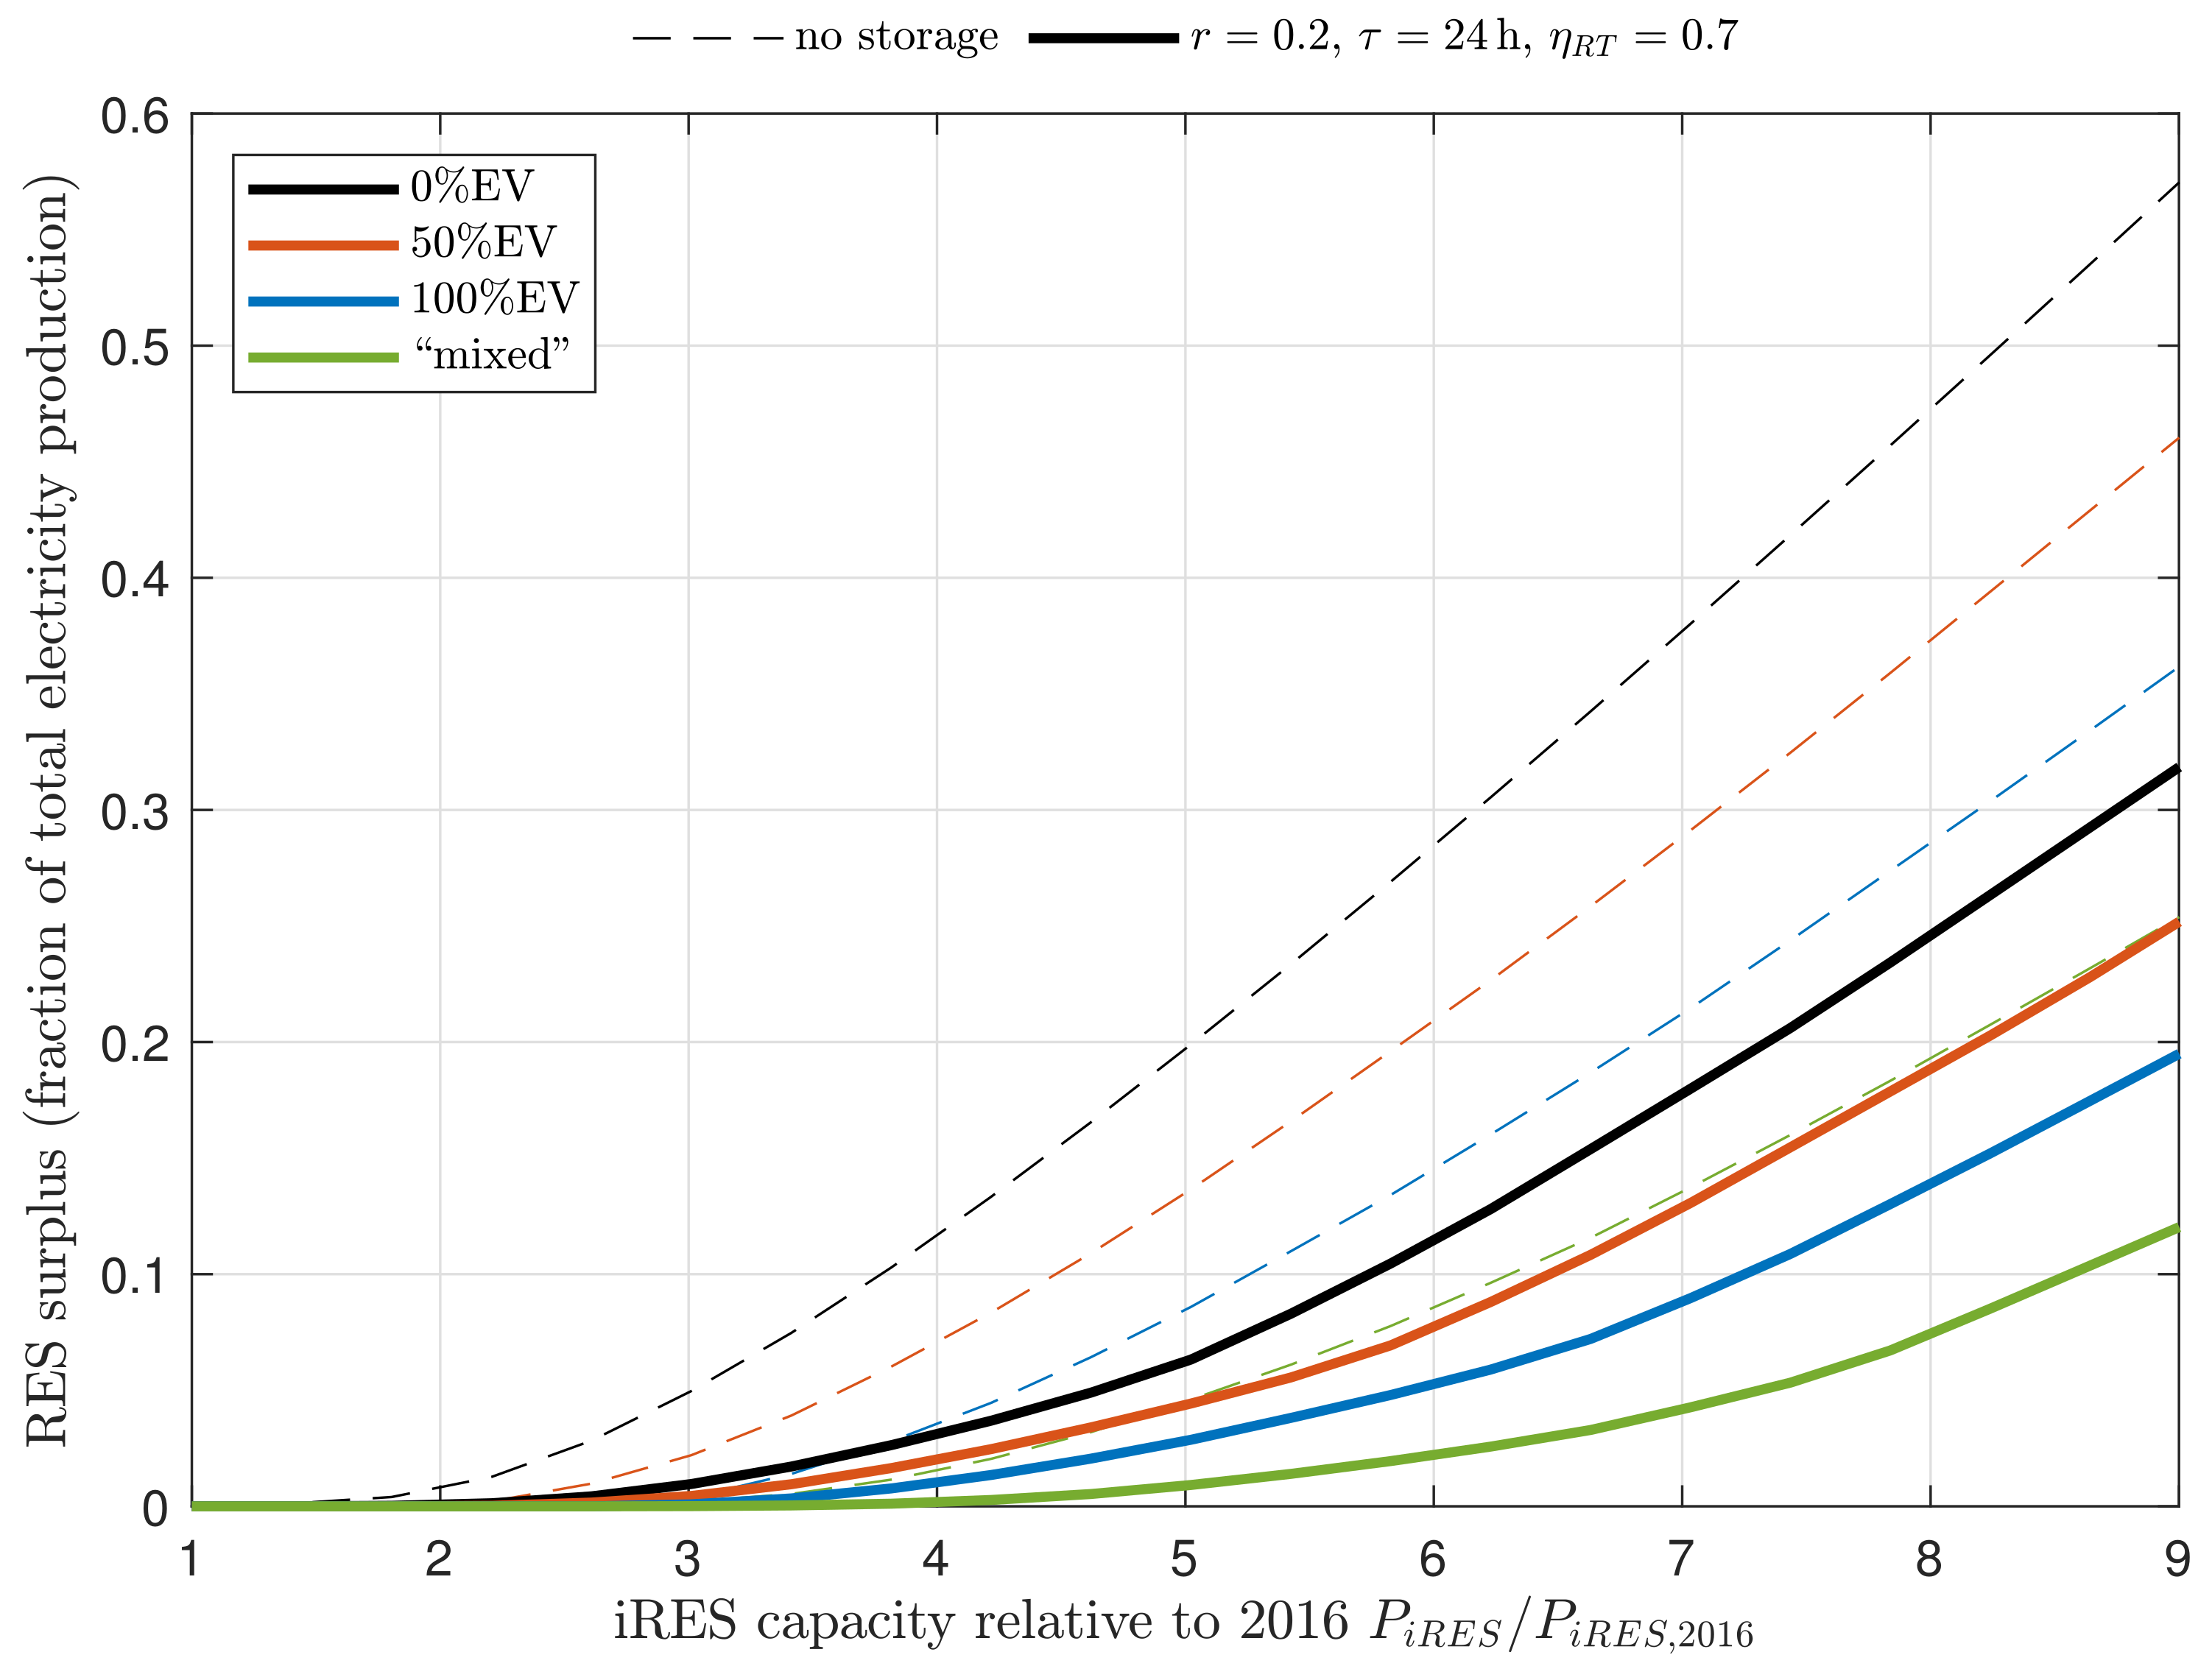
Figure 5 shows RES surplus and RES share of total electricity generation. Electricity storage makes iRES capacity more effective as it reduces considerably RES surplus (Figure 5a), that is, potential generation supply exceeding electricity demand, making it available at a later time when demand exceeds supply and avoiding generation from backup thermal power plants. In this way, RES share of electricity generation increases considerably, for example by approximately 7–10% at 9×RES (Figure 5b). Furthermore, electricity storage moves the onset of saturation in RES share curves to significantly higher values of RES capacity.
Figure 5b also allows for comparing results with SEN targets (see Section 2.2.1). With the help of electricity storage, the 55% threshold could be met with a 50% conversion of private transport to EV and a 450% increase in iRES capacity (instead of 630% without storage), and it is questionable that these shifts in the energy system could actually take place by 2030. As for the 2050 target, it is clear that the 93% threshold could only be reached with a much deeper transformation of the whole national energy system, which requires, among other measures than electricity storage, an extensive electrification of transport and heating sectors and large production of renewable electrofuels and synthetic natural gas via P2G and P2L pathways [52].
The impact of electricity storage is significant on all energy scenarios here considered, but it is less pronounced as electricity demand increases, as in the case of 100% EV and “mixed” scenarios, which, as a consequence of the larger demand, feature markedly less RES surplus than in 0% EV and 50% EV ones (Figure 5a).
3.3. Influence of Electricity Storage System Parameters
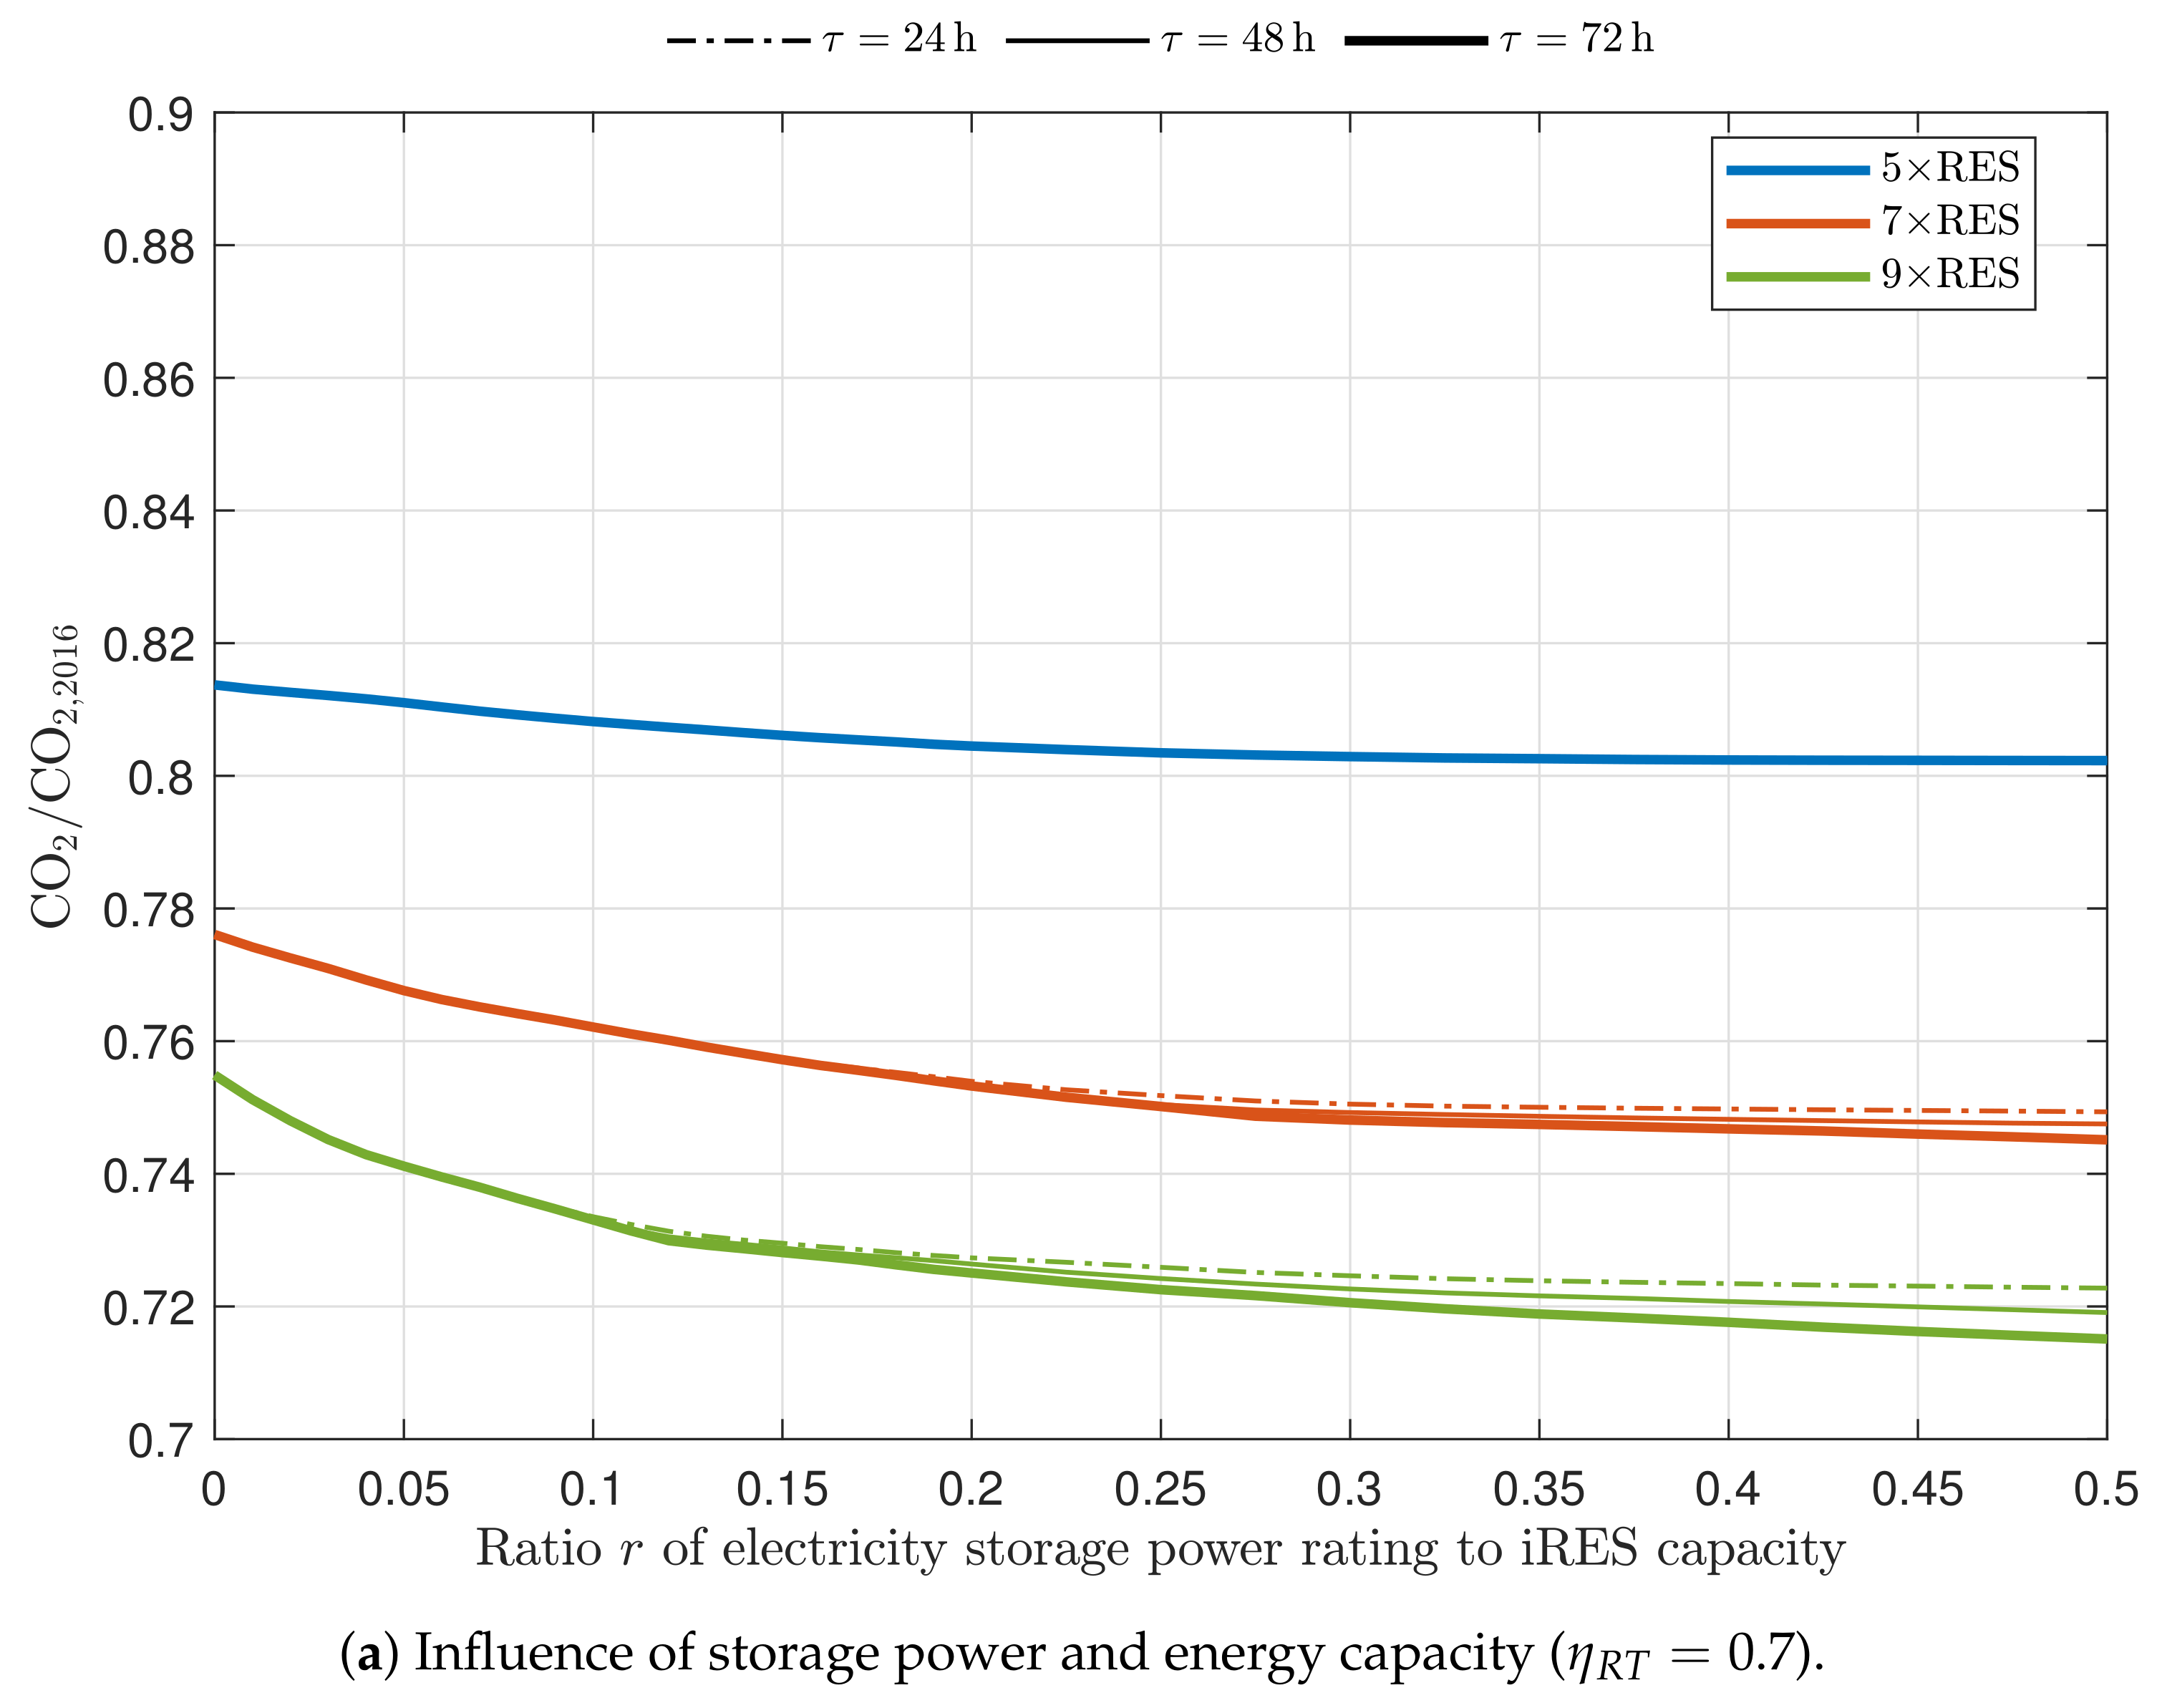
Figure 6 shows how CO2 emissions are affected by a change in electricity storage parameters. More specifically, Figure 6a shows the impact of the ratio of electricity storage power rating to iRES capacity r and the electricity storage energy-to-power capacity ratio , for the “mixed” scenario and three different values of iRES capacity, while Figure 6b represents the influence of round-trip efficiency. Figure A1 and Figure A2 in Appendix B show how RES surplus is affected by storage parameters. Results for other energy scenarios are very similar and are not shown for brevity.
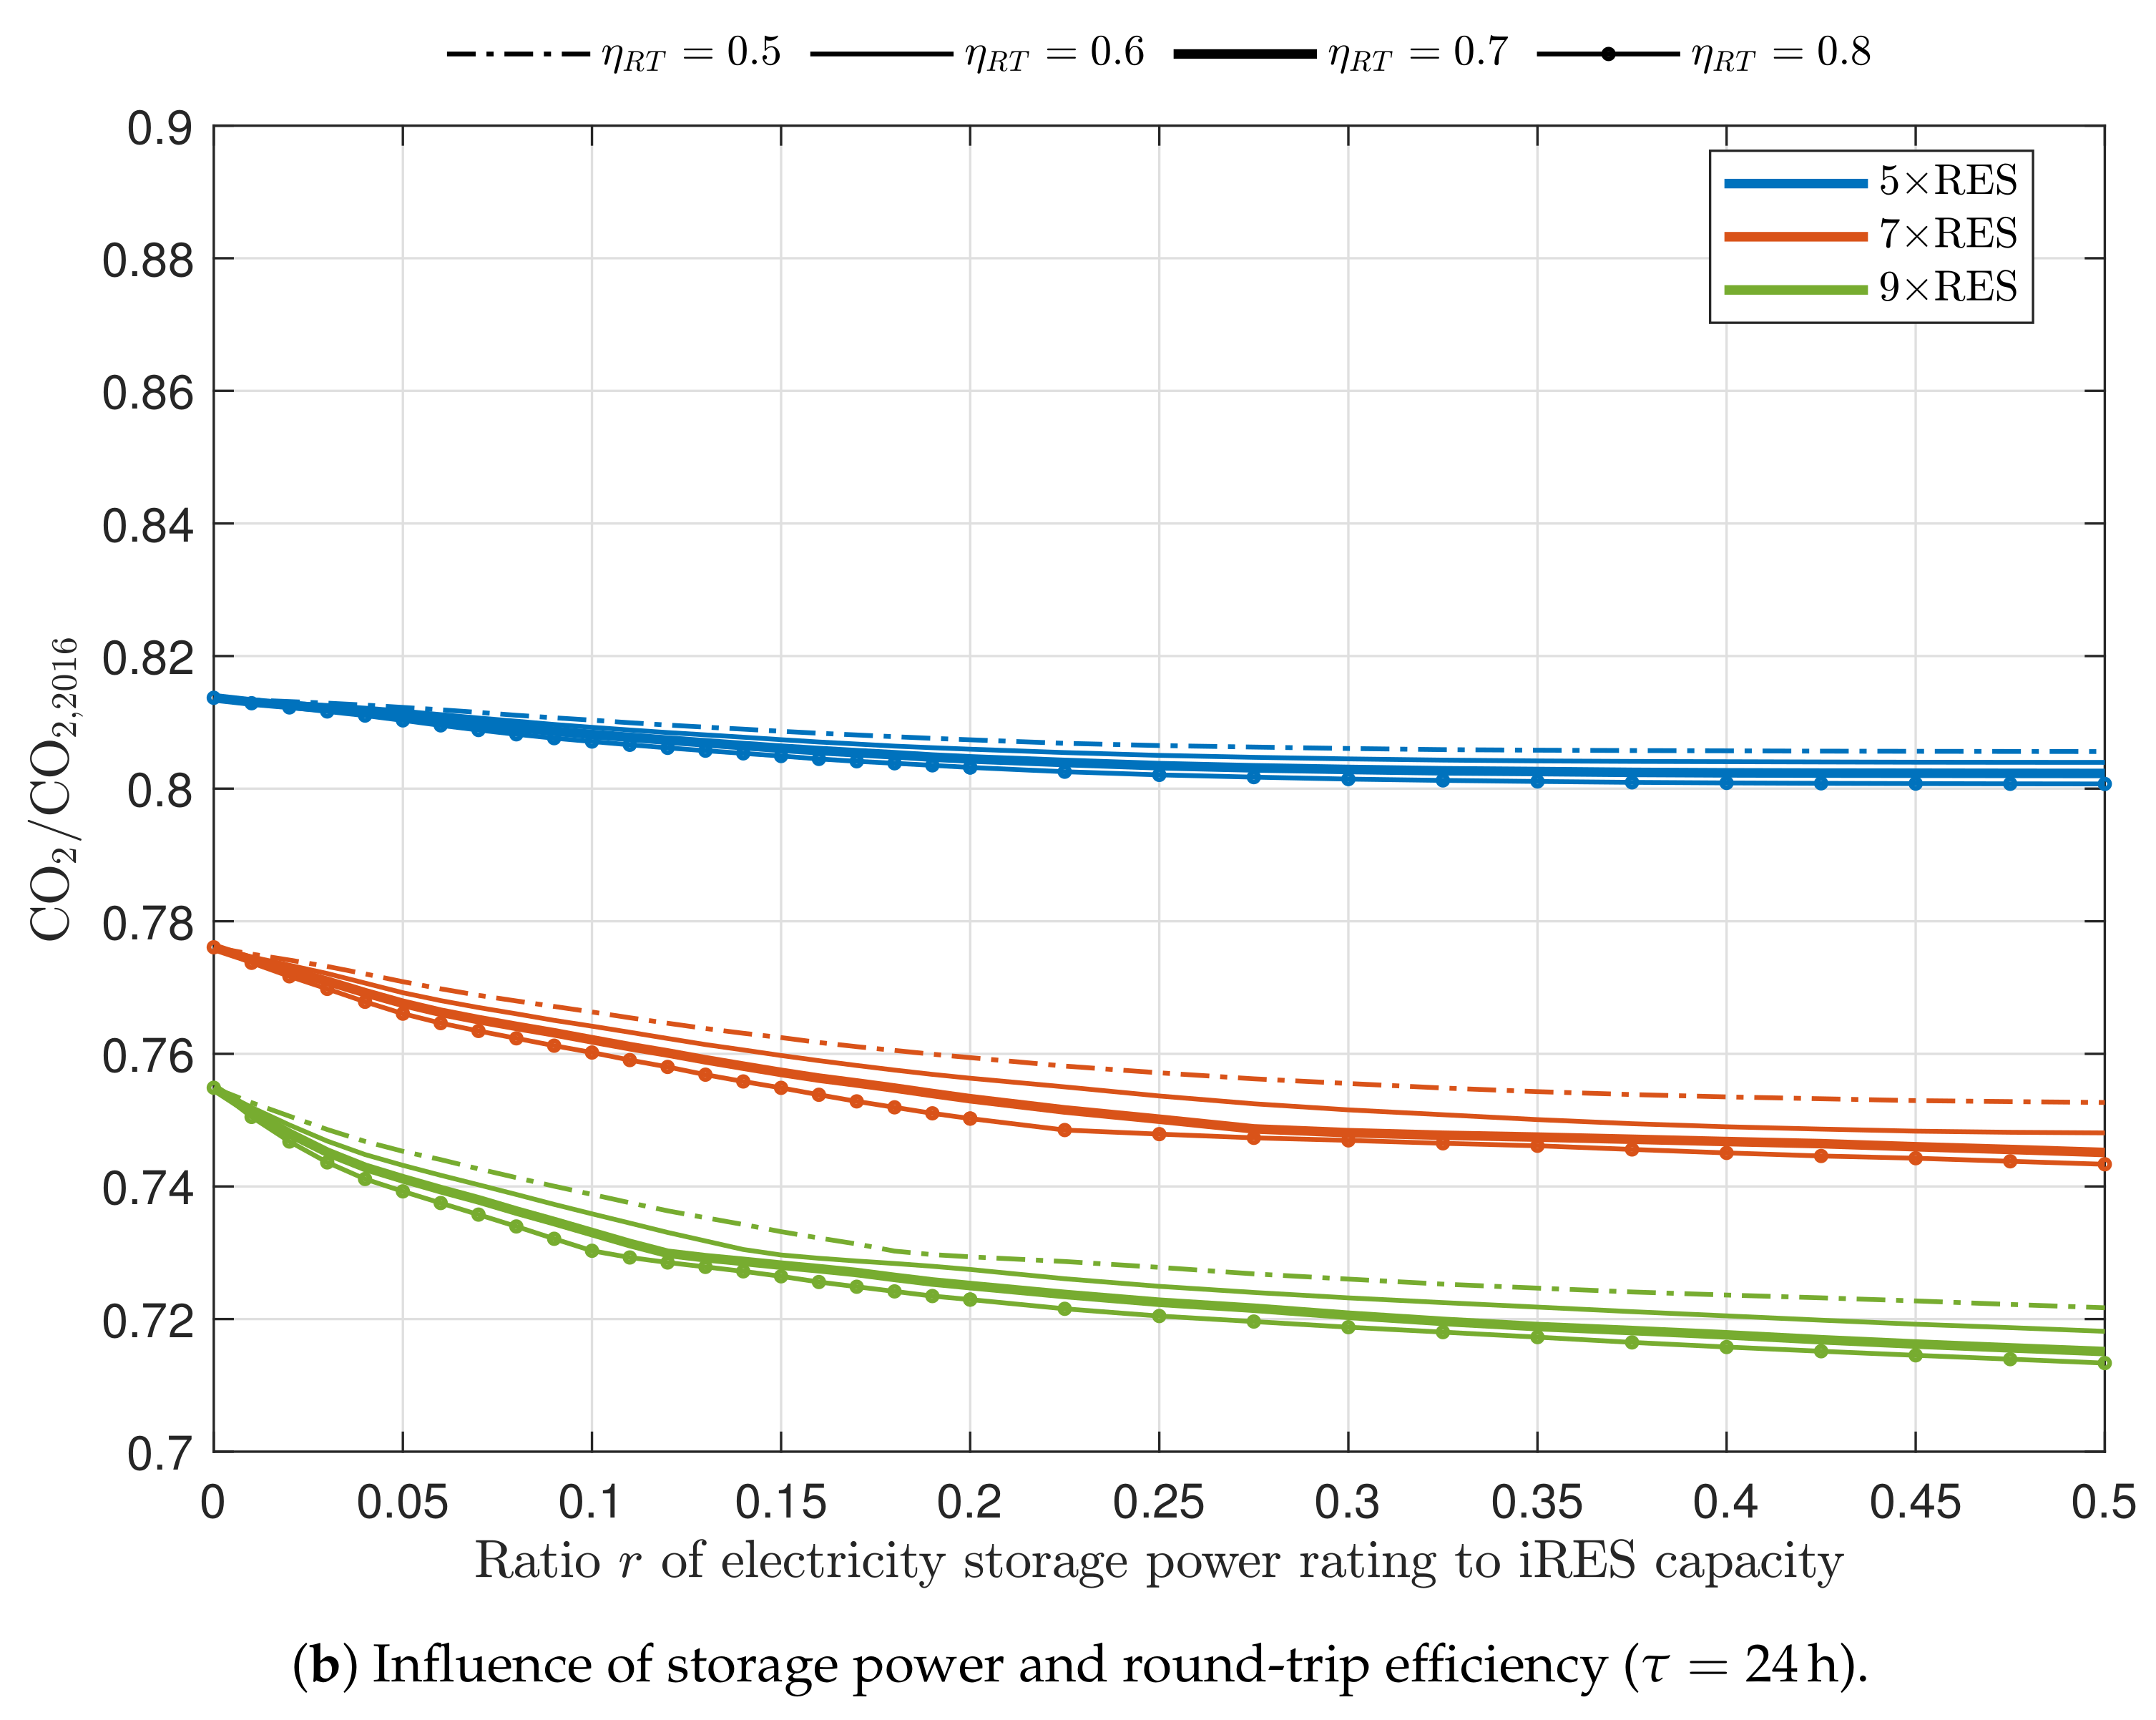
An increase in electricity storage power rating and capacity generates rapid improvements on all performance indicators, in particular when large iRES capacities are considered, until saturation is reached. A discontinuity in the slope of each curve for 7× and 9×RES scenarios can be clearly seen, while it is absent in the 5×RES scenario. This discontinuity arises when the maximum yearly value of electricity stored reaches the storage capacity, as shown in Figure 7: for the 5×RES scenario, this situation does not occur due to the limited amount of RES surplus that can be stored, while, for 9×RES, saturation is rapidly achieved.
Overall, an increase in storage power rating rapidly reaches saturation: for example, at 9×RES with , CO2 emissions first decrease by approximately 2.3 percentage points for a 0.1 increase in the ratio r, then the rate of decrease falls to approximately 0.4 percentage points. Therefore, it seems reasonable to limit electricity storage power rating, and a ratio appears to be a good compromise among all the energy scenarios here presented and it has been selected as reference value for all other analyses. Obviously, this parameter, as well as several others, could be the subject of a techno-economic optimisation, which is however beyond the scope of this study.
As for the ratio of storage capacity to power rating , its increase is clearly beneficial when there is a large surplus that can be tapped (scenarios 7× and 9×RES), but Figure 6a shows that a threefold increase in does not produce correspondingly large improvements. Indeed, the results of the cost analysis discussed in the next section prove that it is very difficult for electricity storage systems to be also economically effective at (at least, with a storage-to-iRES power ratio of ). Therefore, a ratio of has been chosen as reference value.
Finally, Figure 6b shows the influence of electricity storage round-trip efficiency. This parameter is a feature of the particular storage technology considered, rather than a design parameter that can be freely chosen in a suitable range as in the case of power rating and capacity. Round-trip efficiencies vary considerably, from approximately 40–50% for diabatic CAES and LAES up to 80–90% for PHS and electro-chemical storage [13,17]. However, for round-trip efficiencies in the range 50–90%, the curves are bound in a rather narrow band, pointing out that very similar results can be obtained with storage technologies that present even extreme values of round-trip efficiency, as confirmed by comparing results shown in Figure A3 in Appendix B, related to a round-trip efficiency of 50%, to those of Figure 4. Therefore, a value of has been conservatively chosen as reference.
3.4. Cost Analysis
Figure 8 shows savings in iRES capacity that are made possible by electricity storage systems. Based on the possible decrease in iRES capacity (Figure 4), annual iRES cost savings have been calculated according to Equation (19) and normalized with respect to the required storage capacity. RES costs have been projected to 2030 and 2050, and two values of energy-to-power ratio for electricity storage systems have been considered: and .
Results show that electricity storage systems can bring savings in annual costs of around 2.8–4.3 EUR/kWh for a 25% decrease in CO2 emissions for the most ambitious energy scenarios (100% EV and “mixed”). However, larger savings can be obtained if emissions are to be cut more aggressively, even though it must be pointed out that the best way to pursue this goal is to change the energy scenario (for example, with stronger sector couplings by means of an increase in HP and P2G/L penetration) rather than to increase electricity storage capacity in a “constant” energy scenario.
As already observed in Section 3.2, the impact of electricity storage and the associated cost savings are less pronounced as the energy scenario gets more advanced, due to the decrease in RES surplus that “feeds” electricity storage systems, if results are compared for the same iRES capacity. However, it is also possible to observe that electricity storage comes in support of ever larger deployment of renewables by reducing the iRES capacity needed to achieve a desired outcome.
If storage systems with different energy-to-power ratios are considered, Figure 8 shows that an increase in this parameter is not cost-effective (at least for the same storage-to-iRES power ratio): despite a threefold increase in , with storage costs approximately trebled, the decrease in iRES capacity allowed by storage systems is much less pronounced (Figure 4), hence the marked reduction in annual cost savings that fall in a range 1.0–1.5 EUR/kWh.
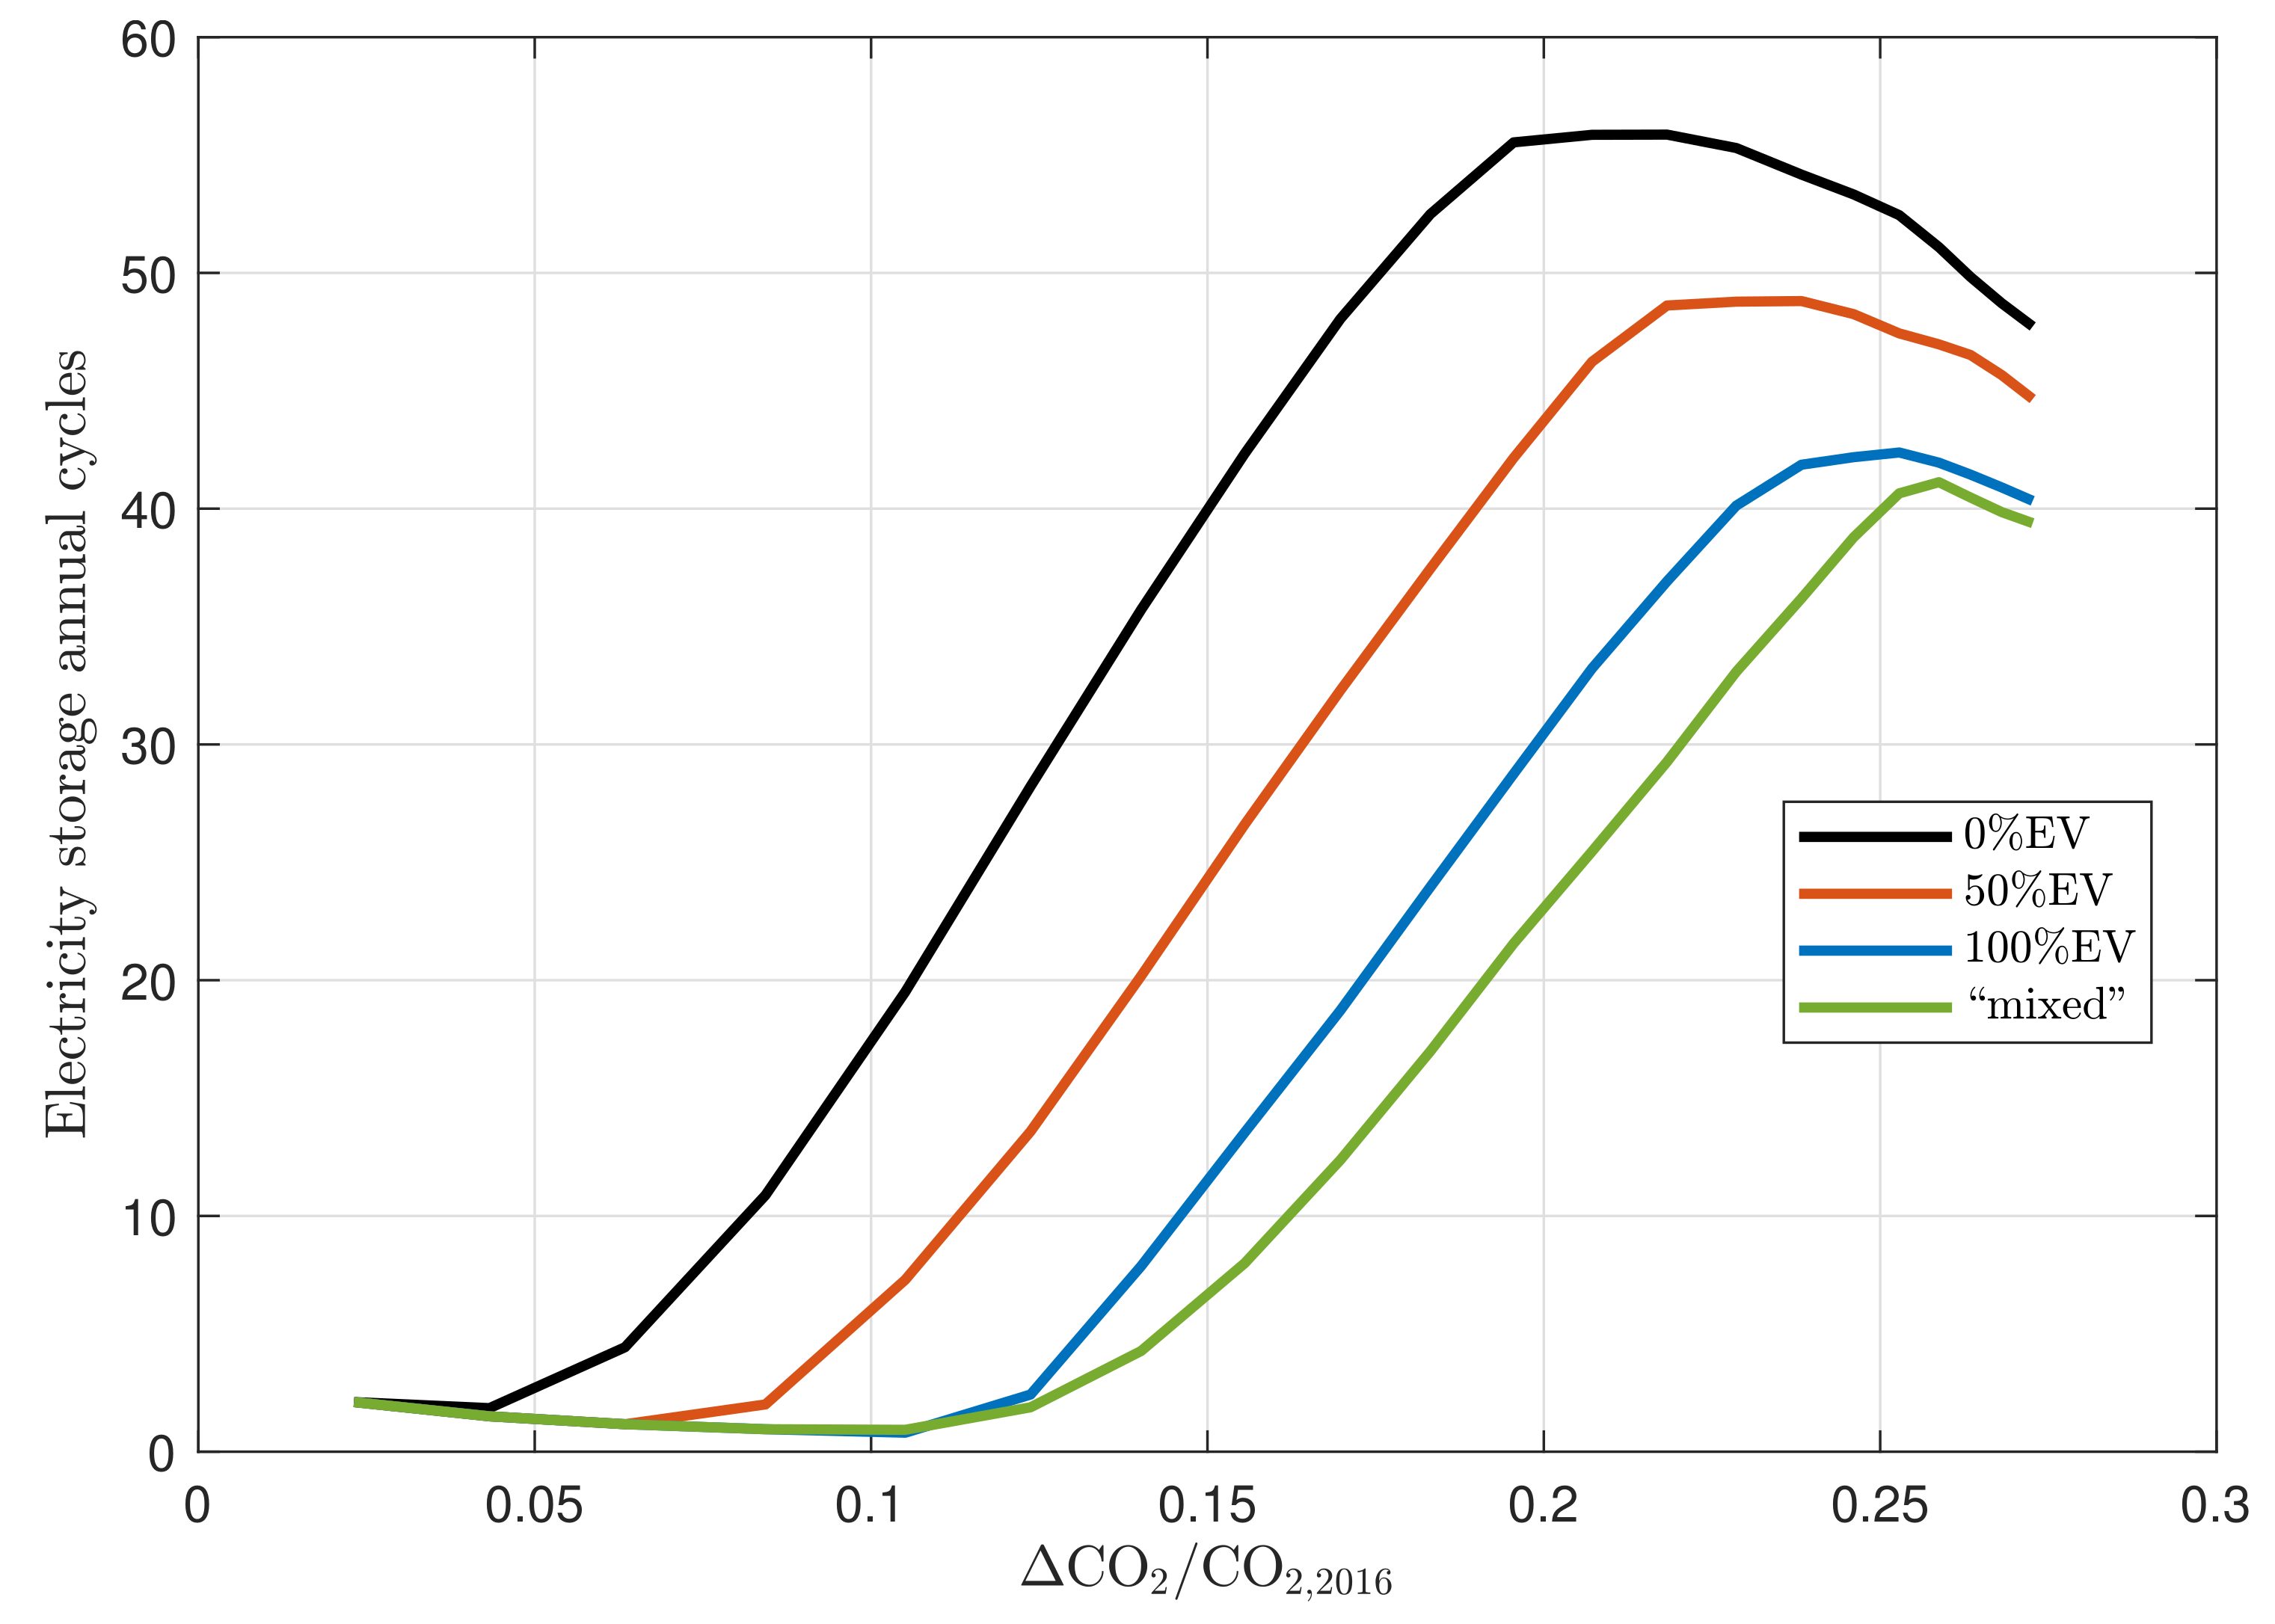
Finally, these cost savings are compared to annual costs incurred for electricity storage systems per unit of storage capacity (Equation (25)). Energy-based O&M costs require the evaluation of annual energy actually charged to the systems or the number of annual cycles, which is a way to identify the former quantity based on storage capacity (Equation (23)). Figure 9 shows the number of cycles required for different energy scenarios as a function of the relative decrease in CO2 emissions. To compute O&M costs, the maximum value of (around 56) across all energy scenarios has been conservatively taken into account.
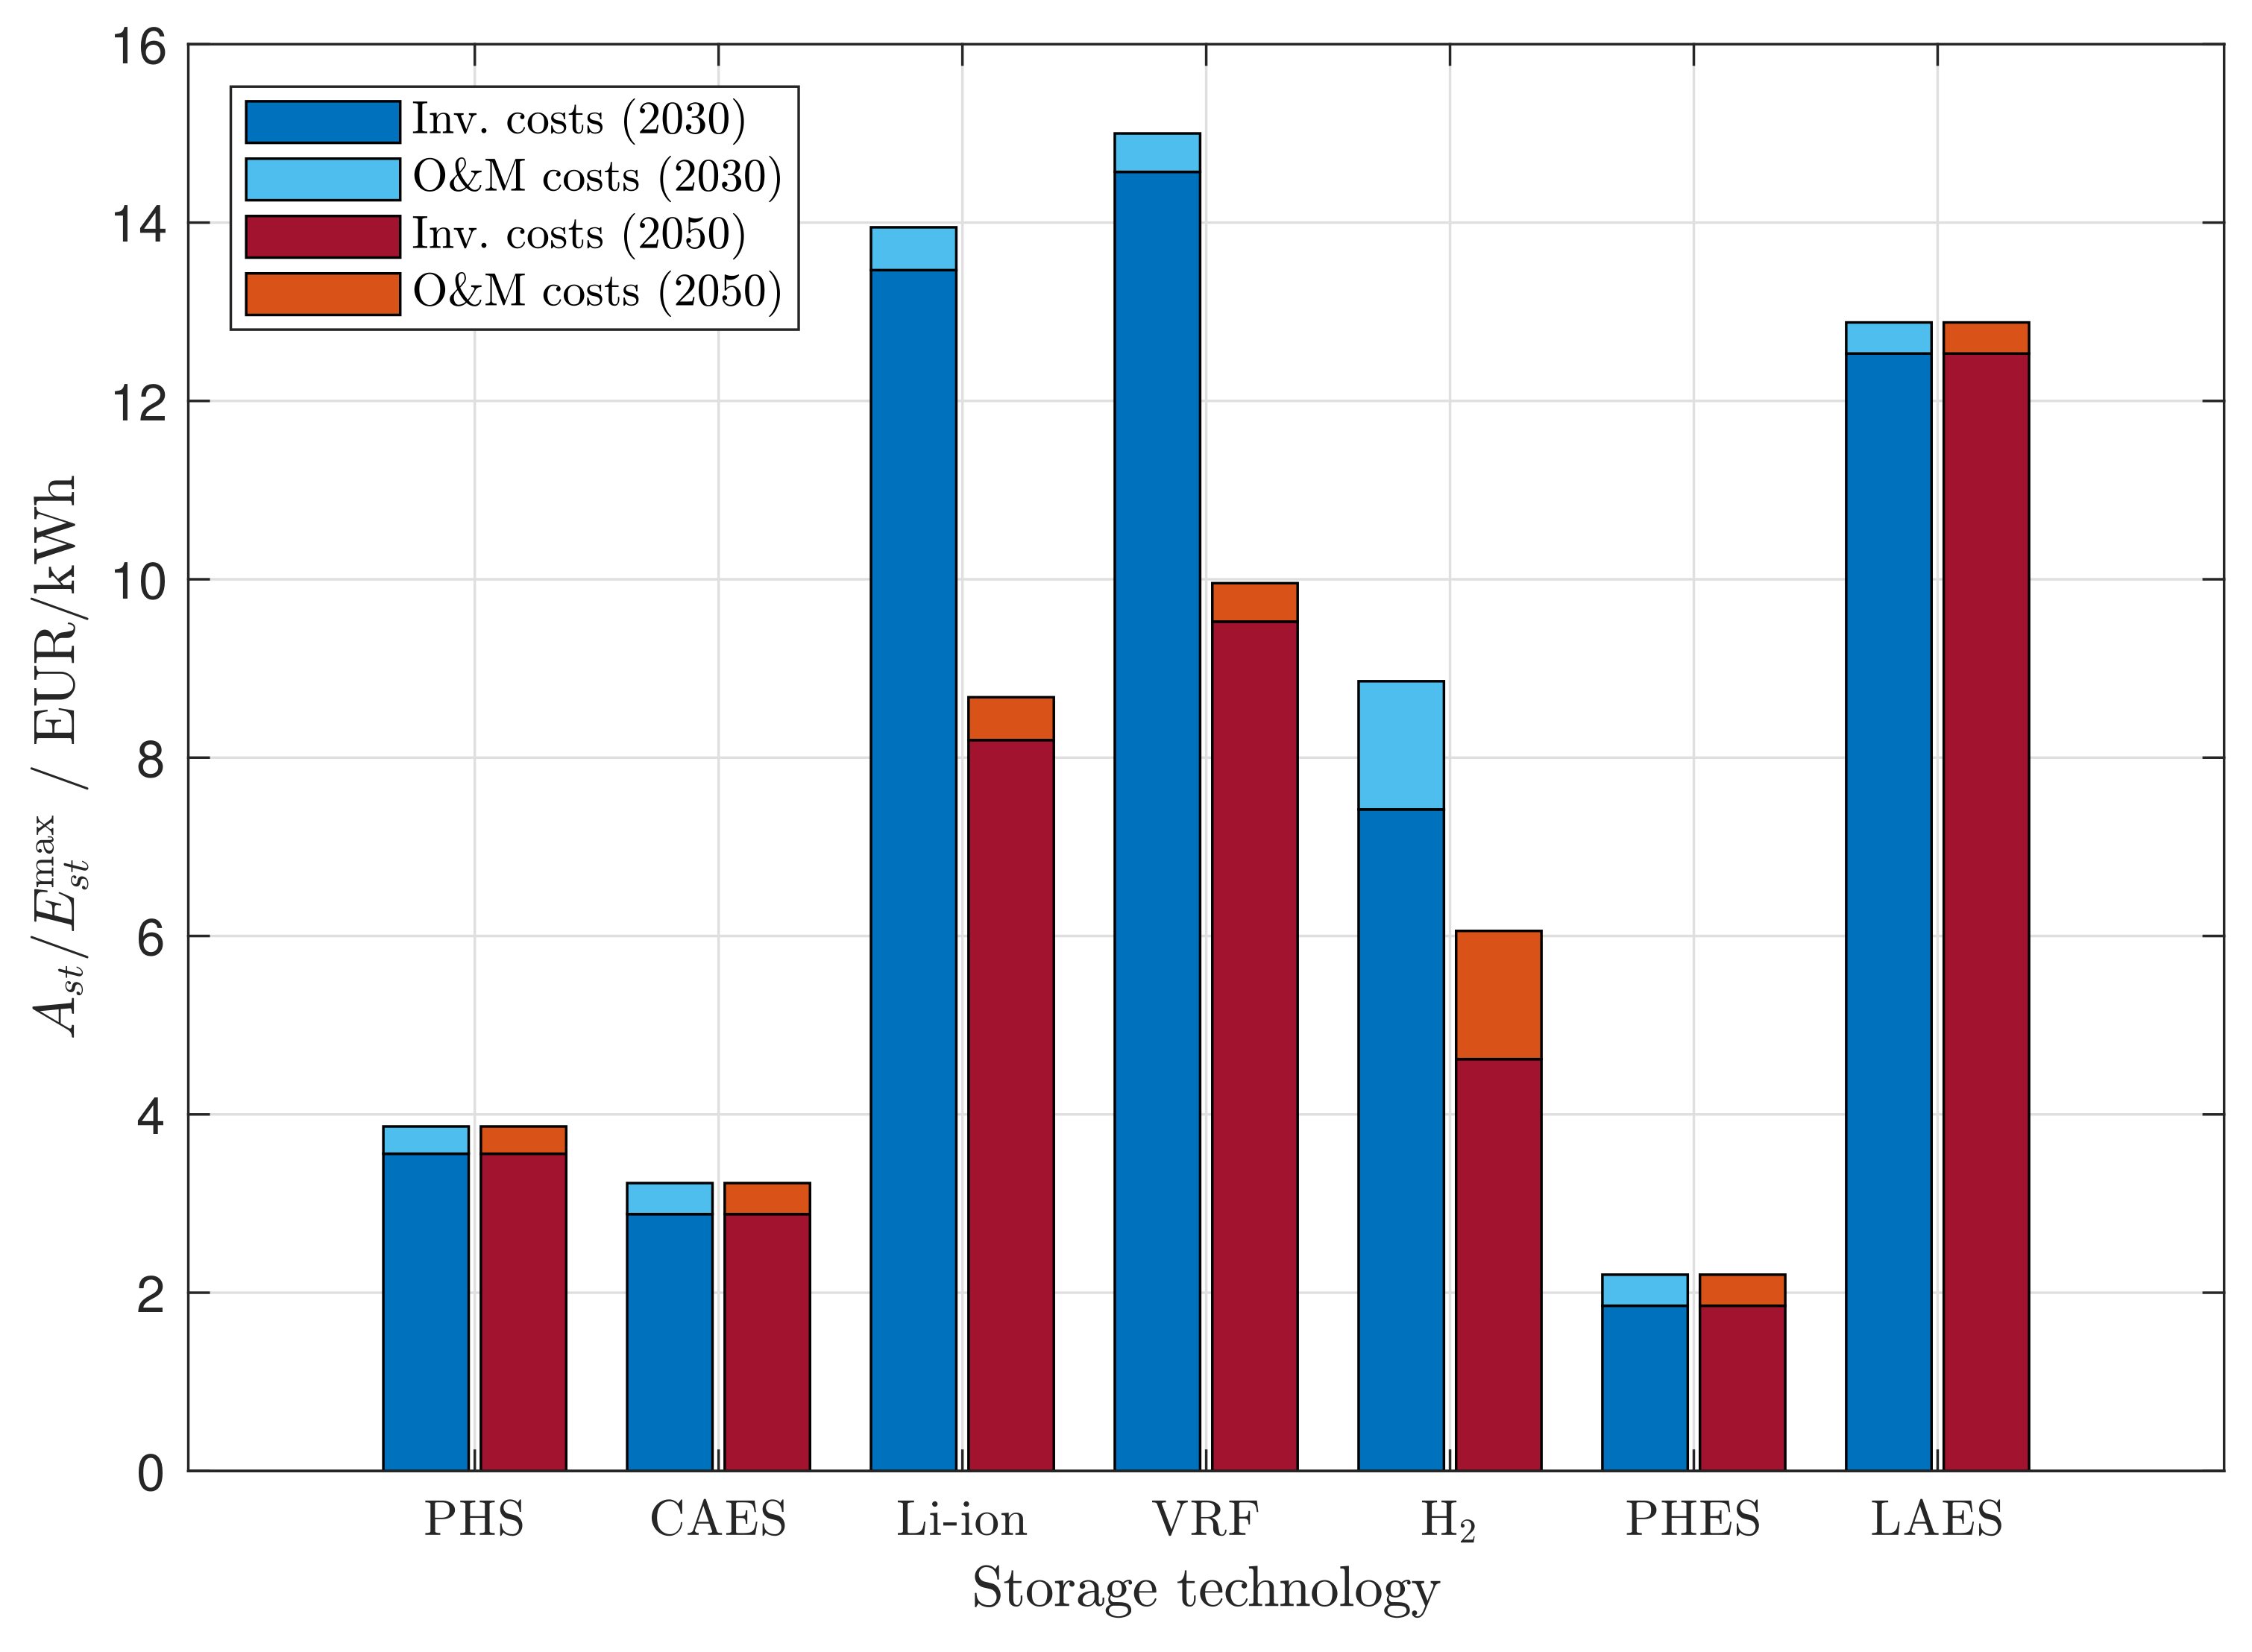
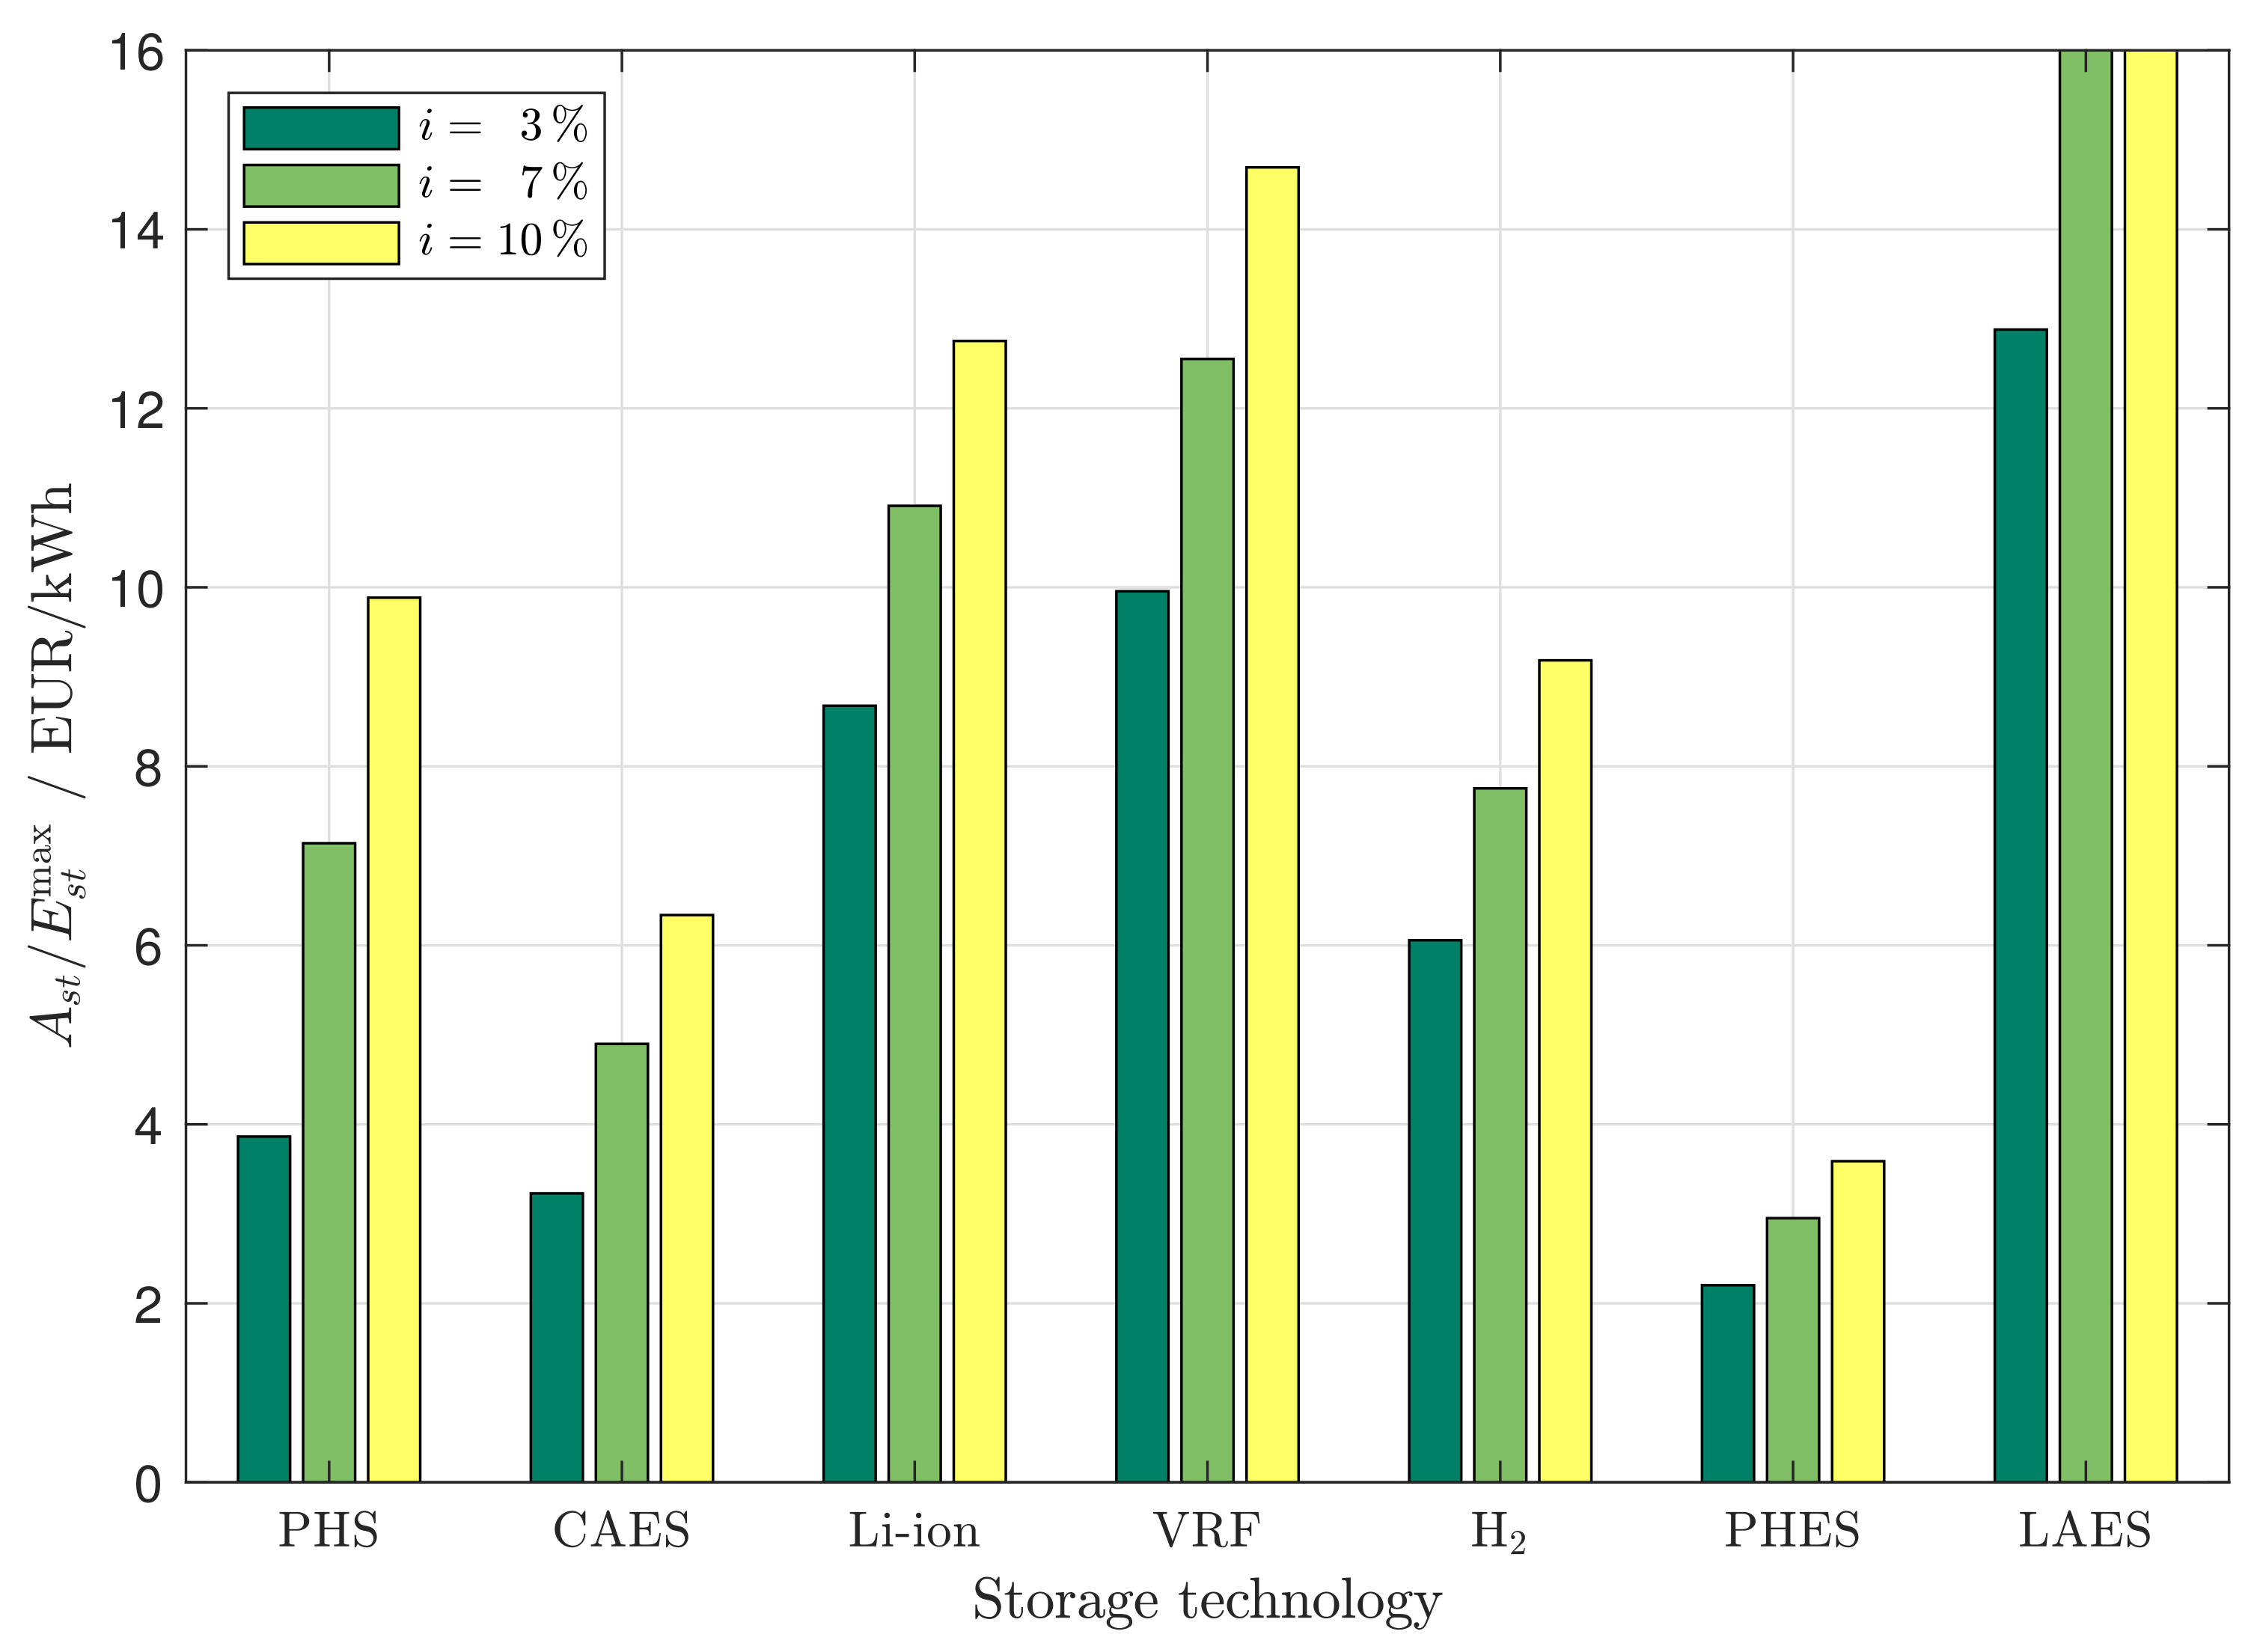
Figure 10 presents annual costs for electricity storage systems, projected to 2030 and 2050, only for those storage technologies for which annual costs are below 15 EUR/kWh. Based on cost savings resulting from the implementation of electricity storage systems (Figure 8), only a few storage technologies promise to be cost-effective, with annual costs below 5 EUR/kWh, which can be considered as a break-even point with iRES: PHES, CAES and PHES. Among these, PHS and CAES are well established and mature technologies, that, however, are severely limited by geographical constraints and cannot be expanded to the capacities required by very large iRES deployment. PHES is a promising technology that could also potentially serve as both electricity and thermal storage, in a sort of polygeneration storage unit; however, it is relatively new and, even though its components come from well-established industries, it must still prove its potential in grid-scale applications.
As for the other storage technologies, cryogenic energy storage, and in particular LAES, should prove that its cost can be significantly reduced as it scales up from demonstration plants. Hydrogen-based electricity storage systems are close to break even with iRES, but it could be argued that hydrogen storage could be more effective within P2G/P2L pathways to provide flexibility to these systems [39,52]. Finally, electrochemical storage presents annual costs that are significantly larger than possible cost savings even taking into account very large projected reduction in investment costs at 2030 and 2050 (Table 8).
Among electrochemical batteries, Li-ion ones promise to be the most attractive. It is worth observing that, even though they may not prove to be cost competitive for stationary storage applications, Li-ion batteries are nonetheless projected to play a decisive role in these energy scenarios as they store electric energy for transportation applications. Furthermore, EV batteries can additionally serve as short-term stationary storage systems if a Vehicle-to-Grid network is implemented, as it is widely expected in the long term [53], or if batteries are given a “second life” at the end of their automotive application [54,55]. In both cases, investment costs can be considered already “paid off” by the transport sector [29], which makes the problem of cost-competitiveness with RES capacity irrelevant.
Finally, it is worth observing that, if iRES capacity grows up to very large values, saturation is likely to occur, thus leading to ever larger costs to further increase RES penetration: in this situation, even relatively expensive electricity storage systems could become a viable option in support of RES deployment and of a larger decarbonisation of the energy system.
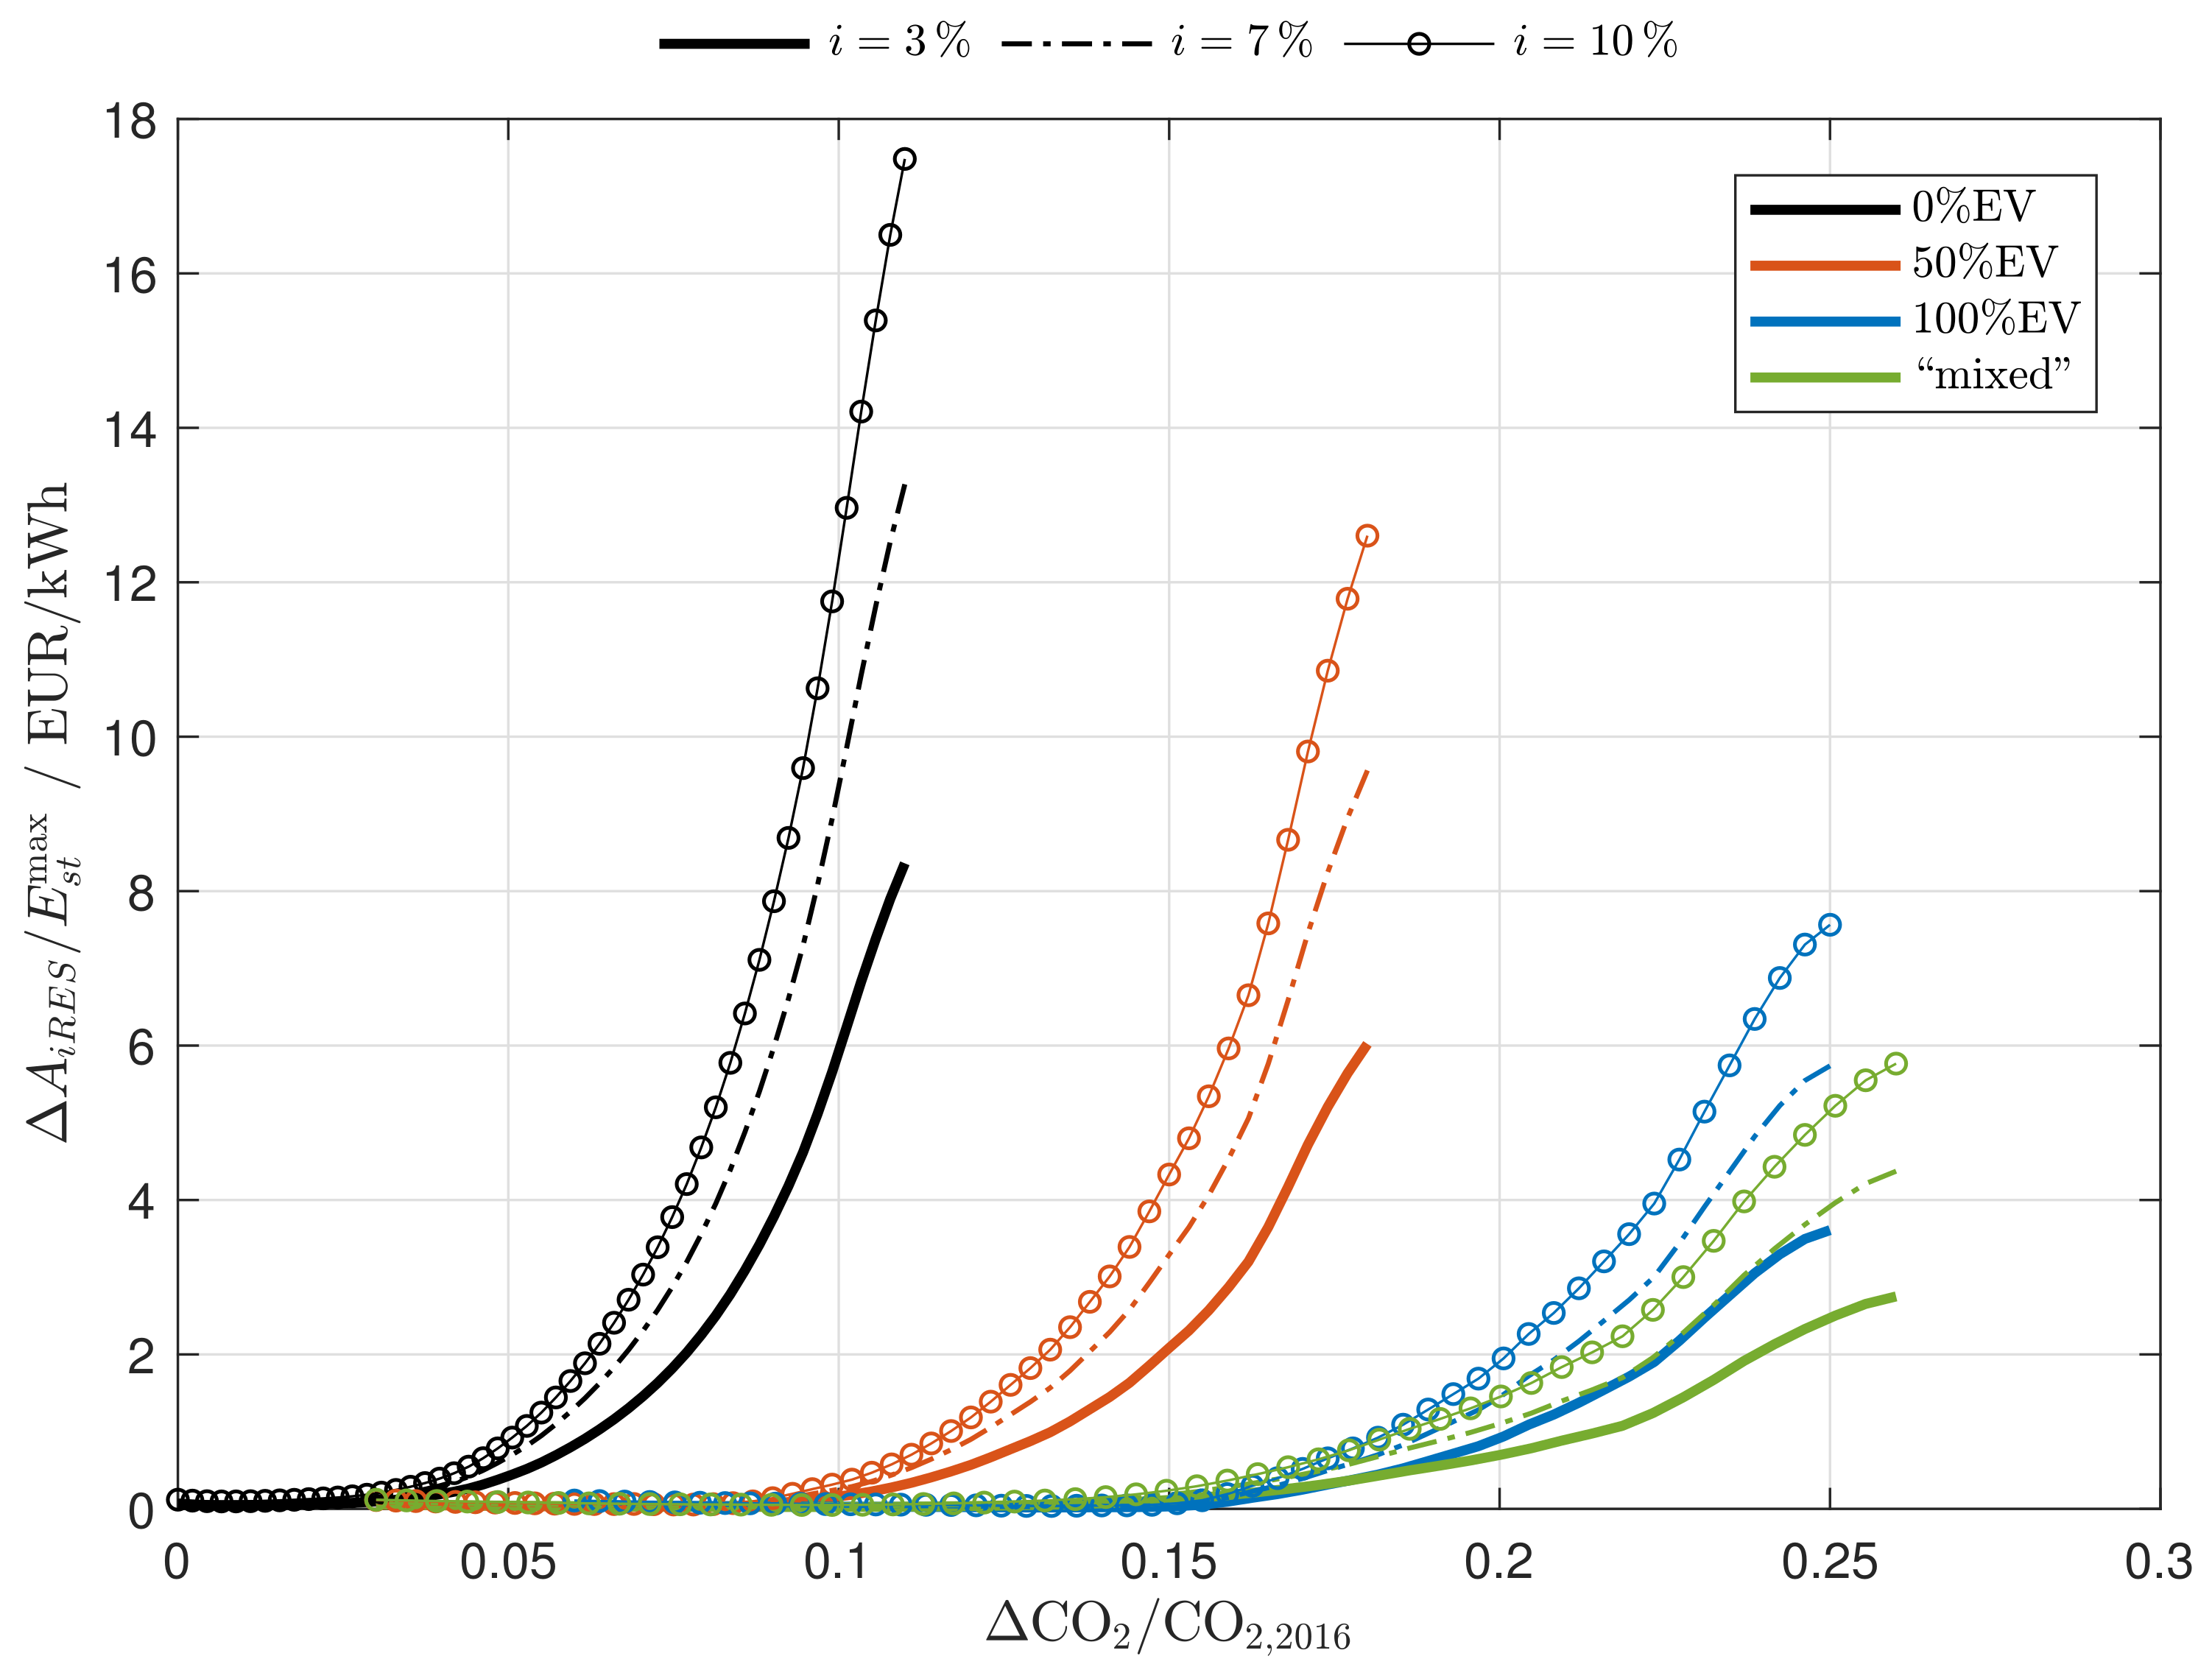
Appendix B presents the results of a sensitivity analysis regarding discount rates: in particular, Figure A4 shows annual cost savings in RES capacity allowed by electricity storage for different discount rates, while Figure A5 describes the influence of this parameter on annual storage costs. Clearly, discount rates impact significantly on the quantitative estimation of both savings (in RES capacity) and storage costs; however, if the same discount rate is considered for both RES capacity and storage systems, the main results discussed with reference to a discount rate of 3% can be replicated for other rates, even though it must be pointed out that systems with a long shelf-life (such as PHS) are comparatively disadvantaged by an increase in discount rates.
A sensitivity analysis on RES investment costs has not been included because annual cost savings are simply in direct proportion to RES costs (Equation (19)). Therefore, how cost savings are influenced by a given increase/reduction on RES investment costs can be easily inferred from the results presented in Figure 8 for the reference investment costs.
3.5. Policy Recommendations
Electricity storage at grid level has traditionally been limited to PHS, which has proven to be economically viable in different regions worldwide, given the availability of proper sites. Other technologies are available, but their use has never reached a proper development. The current energy transition towards iRES generation, whose costs have decreased thanks to specific policies aiming at climate change targets in different regions, will require the support of flexibility solutions to reach higher shares of iRES in the electricity mix.
The policy support towards storage, or other equivalent flexibility options (such as demand side management or interconnections with other markets), needs to be implemented by properly giving value to the additional iRES generation that storage can allow. This aspect will be particularly relevant for very high iRES penetrations, beyond the levels considered in this paper, since the achievement of a total decarbonisation would not occur without a mix of solutions to compensate the variability of iRES, including short-term as well as long-term storage.
Thus, the policy support to storage and flexibility solutions should be developed in the perspective of unlocking additional iRES generation, with all the consequent advantages and positive externalities. A more transparent definition of power network operation costs is required, especially in relation to grid balance. The potential value given by flexibility should be clearly defined through proper markets, by a clear definition of the hidden costs of network management that may increase in the future.
Current electricity markets are generally limiting the participation to large-size units, due to the traditional paradigm of centralised power generation. However, decentralisation and digitalisation trends are unlocking new paradigms that may affect the evolution of electricity markets. While large-scale electricity storage may lead to better economies of scale, the current trend of household storage combined with PV is gaining momentum (also thanks to dedicated incentive schemes). There are already some examples [56,57,58] of “virtual power plants”, i.e., the aggregation of multiple small-size units (including generation units, storage units as well as demand side management) via dedicated web platforms to reach the minimum power required by regulations to participate to the market. Those business models may continue to evolve, while an alternative possibility would be the expansion of the markets towards smaller units, but at the cost of a significant increase of their operational complexity.
A final aspect that is crucial for such policies is whether they should be technology-neutral, i.e., focused on the desired objective rather than supporting specific solutions decided a priori. This would ensure a competitive evolution among available solutions, leading to the optimal use of available public financing, and avoiding potential biases that may occur during the phase of policy definition. However, some studies argue that in some cases the development of technology-neutral policies in the short term may lock-out new technologies with the potential of delivering lower costs in a long-term horizon [59]. Technology neutrality should not always be prioritised as the main guiding principle [60], but further studies are needed on the specific features of flexibility in power systems to assess the best policy approach.
4. Conclusions
This study assesses the role of electricity storage in supporting high shares of intermittent renewable energies under a Smart Energy System approach, including a progressive penetration of electric vehicles in private transport. The added flexibility translates into a large reduction of renewable capacity needed to achieve a certain CO2 emissions reduction target (up to −44% for a 10% reduction if no other measures than iRES growth are included, and −24% for a 25% reduction in a more advanced smart energy system scenario) or, alternatively, into a further significant decrease of renewable surplus and CO2 emissions as iRES capacity grows.
As a result of electricity storage combined with a fully electrified private mobility, renewable integration, expressed as a percentage of total electricity production, can almost reach 70% and allows national energy strategy targets for 2030 to be met if other sustainable measures (i.e., heat pumps and electrofuels) are included in the energy system.
An analysis of electricity storage parameters reveals a saturation in the increase of performance indicators if electricity storage power capacity is pushed above approximately 20% of iRES overall capacity. Moreover, the effect of storage system energy-to-power ratio, along with round-trip efficiency, becomes visible, though limited, only at particularly high storage rated power. This analysis provides the basis for a first assessment of a possible good trade-off between costs and environmental benefits to be further investigated in the context of a techno-economic optimisation.
Besides allowing a more effective usage of renewable power availability, a wide deployment of grid-scale electricity storage entails, to be fully feasible, particularly low investments and operating costs as well as a limited energy-to-power ratio. Electrochemical storage will probably play an important role in providing ancillary services and grid stabilisation; however, its cost is found to be excessive for bulk energy storage applications. Indeed, low investment and operating costs of storage technologies are found to be crucial aspects, more than round-trip efficiency, for high-level renewables integration: among the possible options considered, PHS and CAES confirm their potential although limited by geographical constraints that hinder further development, while PHES, in its various instances, promises to be a valid solution provided its widespread deployment in the near future.
Author Contributions
Conceptualisation, S.B. and M.M.; methodology, S.B. and M.M.; software, S.B. and M.M.; validation, S.B., M.M. and M.N.; investigation, S.B. and M.M.; writing—original draft preparation, S.B., M.M. and M.N.; writing—review and editing, S.B., M.M., M.N. and M.V.; visualisation, S.B. and M.M.; supervision, M.M. and M.V.
Funding
This research received no external funding.
Conflicts of Interest
The authors declare no conflict of interest.
Abbreviations
The following abbreviations and symbols are used in this manuscript:
| A | annual costs/EUR |
| c | specific costs/ or |
| i | investment rate |
| E | energy/ |
| P | hourly-averaged power/ |
| electricity storage systems total capacity/ | |
| electricity storage systems total charging/discharging power rating/ | |
| n | investment period |
| r | ratio of electricity storage systems power rating to iRES capacity |
| Greek Letters | |
| CO2 emission factor/ | |
| electricity storage systems round-trip efficiency | |
| electricity storage systems energy-to-power capacity ratio/ | |
| Subscripts | |
| c | charge |
| d | discharge |
| import | |
| I | investment |
| storage | |
| Acronyms | |
| CAES | Compressed Air Energy Storage |
| COP | Coefficient Of Performance |
| CRF | Capital Recovery Factor |
| EV | Electric Vehicles |
| HP | Heat Pump |
| iRES | intermittent Renewable Energy Sources |
| LAES | Liquid Air Energy Storage |
| O&M | Operation & Maintenance |
| P2G | Power-to-Gas |
| P2L | Power-to-Liquid |
| PHES | Pumped Heat Energy Storage |
| PHS | Pumped Hydro Storage |
| PP | (backup) Power Plants |
| PV | Photovoltaic |
| RES | Renewable Energy Sources |
| VRF | Vanadium-Redox Flow battery |
Appendix A. Base Case Scenario Modelling Input Data

Table A1.
Electricity loads (TWh/year) at 2016. Data taken from listed sources.
| Load | Consumption | Source |
|---|---|---|
| Electric cooling | 8.37 | [61,62] |
| Electricity for heat pumps (individual) | 18.63 | [63] |
| Electric heating (individual) | 8.37 | [61] |
| Electricity for transport | 11.72 | [64] |
| Other electricity loads | 285.86 | [65] |
| Total demand (gross) | 332.95 | |
| Net import | 43.18 | [66] |
| Total domestic production (gross) | 289.77 |
Table A2.
Fuel/electricity consumption and demand (TWh/year) and efficiencies for individual heating at 2016. Data taken from listed sources.
Table A2.
Fuel/electricity consumption and demand (TWh/year) and efficiencies for individual heating at 2016. Data taken from listed sources.
| Technology | Consumption (Sources: [67,68]) | Efficiency/COP (Sources: [44,63]) | Demand |
|---|---|---|---|
| Oil boilers | 29.19 | 0.85 | 24.81 |
| Natural gas boilers | 262.73 | 0.90 | 236.46 |
| Biomass boilers | 79.44 | 0.75 | 59.58 |
| Heat pumps | 18.63 | 2.63 | 49.00 |
| Electric boilers | 8.37 | 1.00 | 8.37 |
Table A3.
Derived heat demand (TWh/year) at 2016 (Data from [68]).
Table A3.
Derived heat demand (TWh/year) at 2016 (Data from [68]).
| End Use | Demand |
|---|---|
| Energy industry own use | 16.24 |
| Residential and services | 13.86 |
| Industry | 31.82 |
| Fuel | Consumption |
|---|---|
| JP (Jet Fuel) | 8.05 |
| Diesel | 262.92 |
| of which biodiesel | 11.72 |
| Petrol | 88.42 |
| of which biopetrol | 0.38 |
| Natural gas | 12.86 |
| LPG | 21.24 |
| Electricity | 11.16 |
Table A5.
Industry and various sector fuel consumption (TWh/year) at 2016 (Data from [68]).
Table A5.
Industry and various sector fuel consumption (TWh/year) at 2016 (Data from [68]).
| Fuel | Industry | Various |
|---|---|---|
| Coal | 11.16 | 0.05 |
| Oil | 30.94 | 61.08 |
| Natural gas | 97.23 | 27.35 |
| Biomass and waste | 7.64 | - |
| Group | Capacity | Specific Emissions g/kWh | ||
|---|---|---|---|---|
| PP1 | 58952 | 0.429 | - | 501.7 |
| CHP2 | 5981 | 0.358 | 0.344 | 544.1 |
| CHP3 | 20264 | 0.427 | 0.196 | 452.2 |
| Fuel | PP1 | CHP2 | CHP3 |
|---|---|---|---|
| Coal | 100.58 | 1.96 | 7.63 |
| Oil | 36.54 | 13.64 | 30.73 |
| Natural gas | 219.6 | 44.76 | 134.98 |
| Biomass | 62.5 | 10.29 | 28.73 |
Table A8.
RES capacity (MW) at 2016 (Data from [65]).
Table A8.
RES capacity (MW) at 2016 (Data from [65]).
| Technology | Capacity |
|---|---|
| Onshore wind | 9410 |
| Offshore wind | - |
| Photovoltaic | 19,283 |
| River Hydro | 5430 |
| Dammed Hydro | 18,719 |
| Geothermal | 815 |
Table A9.
Sources used for hourly distributions.
| Electricity demand | [69] | Cooling demand | [44] |
| Fixed Import/Export | [66] | Electricity for transport | [44] |
| District heating demand | [70] | Wind power | [33] |
| Individual heating demand | [71,72] | PV generation | [33] |
| Industrial CHP heating demand | [44] | River Hydro power | [33] |
| Industry gas demand | [71] | Geothermal power | [33] |
Table A10.
Gasification plant operating parameters.
| Steam share | 0.13 |
| Steam efficiency | 1.25 |
| Cold gas efficiency | 0.90 |
Table A11.
Hydrogenation methods operating parameters.
| Method | Efficiency | Hydrogen Share | ||
|---|---|---|---|---|
| SNG | P2L | SNG | P2L | |
| Biogas hydrogenation | 0.83 | - | 0.50 | - |
| Syngas hydrogenation | 0.87 | 0.60 | 0.36 | 0.38 |
Appendix B. Additional Results
Figure A1.
RES surplus for different electricity storage parameters (“mixed” scenario): influence of storage power and energy capacity.
Figure A1.
RES surplus for different electricity storage parameters (“mixed” scenario): influence of storage power and energy capacity.

Figure A2.
RES surplus for different electricity storage parameters (“mixed” scenario): influence of storage power and round-trip efficiency.
Figure A2.
RES surplus for different electricity storage parameters (“mixed” scenario): influence of storage power and round-trip efficiency.

Figure A3.
Decrease in iRES capacity allowed by electricity storage and corresponding electricity storage capacity required. Storage parameters: ; ; .
Figure A3.
Decrease in iRES capacity allowed by electricity storage and corresponding electricity storage capacity required. Storage parameters: ; ; .

Figure A4.
Decrease in iRES annual costs allowed by electricity storage for different discount rates. Cost projections at 2050. Storage parameters: and ; ; .
Figure A4.
Decrease in iRES annual costs allowed by electricity storage for different discount rates. Cost projections at 2050. Storage parameters: and ; ; .

Figure A5.
Projections of electricity storage annual costs for different technologies at 2050 for different discount rates.
Figure A5.
Projections of electricity storage annual costs for different technologies at 2050 for different discount rates.

Figure A6.
Normalised annual distribution of electricity storage level and cumulative sum of RES surplus for 9×RES, “mixed” energy scenario. Storage parameters: ; ; ; 1%/day self-discharge rate.
Figure A6.
Normalised annual distribution of electricity storage level and cumulative sum of RES surplus for 9×RES, “mixed” energy scenario. Storage parameters: ; ; ; 1%/day self-discharge rate.

Figure A7.
Load curves related to storage charge and discharge, backup power plant generation and electricity import at 9×RES, “mixed” energy scenario. Storage parameters: ; ; ; 1%/day self-discharge rate. Dashed lines: load curves with no electricity storage.
Figure A7.
Load curves related to storage charge and discharge, backup power plant generation and electricity import at 9×RES, “mixed” energy scenario. Storage parameters: ; ; ; 1%/day self-discharge rate. Dashed lines: load curves with no electricity storage.

Figure A8.
CO2 emissions for increasing iRES capacity and different energy scenarios. Storage simulated with a 1%/day self-discharge rate.
Figure A8.
CO2 emissions for increasing iRES capacity and different energy scenarios. Storage simulated with a 1%/day self-discharge rate.

Figure A9.
RES surplus for increasing iRES capacity and different energy scenarios. Storage simulated with a 1%/day self-discharge rate.
Figure A9.
RES surplus for increasing iRES capacity and different energy scenarios. Storage simulated with a 1%/day self-discharge rate.

References
- International Energy Agency. Energy Tecnology Perspectives. 2017. Available online: https://www.iea.org/etp2017/summary/, http://www.webcitation.org/776E8460p (accessed on 25 March 2019).
- Romanelli, F. Strategies for the integration of intermittent renewable energy sources in the electrical system. Eur. Phys. J. Plus 2016, 131, 53. [Google Scholar] [CrossRef]
- Luo, X.; Wang, J.; Dooner, M.; Clarke, J. Overview of current development in electrical energy storage technologies and the application potential in power system operation. Appl. Energy 2015, 137, 511–536. [Google Scholar] [CrossRef]
- Argyrou, M.C.; Christodoulides, P.; Kalogirou, S.A. Energy storage for electricity generation and related processes: Technologies appraisal and grid scale applications. Renew. Sustain. Energy Rev. 2018, 94, 804–821. [Google Scholar] [CrossRef]
- Calise, F.; D’Accadia, M.; Barletta, C.; Battaglia, V.; Pfeifer, A.; Duic, N. Detailed Modelling of the Deep Decarbonisation Scenarios with Demand Response Technologies in the Heating and Cooling Sector: A Case Study for Italy. Energies 2017, 10, 1535. [Google Scholar] [CrossRef]
- Bartolucci, L.; Cordiner, S.; Mulone, V.; Santarelli, M. Short-therm forecasting method to improve the perfomance of a model predictive control strategy for a residential hybrid renewable energy system. Energy 2019. [Google Scholar] [CrossRef]
- Bloess, A.; Schill, W.P.; Zerrahn, A. Power-to-heat for renewable energy integration: A review of technologies, modeling approaches, and flexibility potentials. Appl. Energy 2018, 212, 1611–1626. [Google Scholar] [CrossRef]
- Ghaib, K.; Ben-Fares, F.Z. Power-to-Methane: A state-of-the-art review. Renew. Sustain. Energy Rev. 2018, 81, 433–446. [Google Scholar] [CrossRef]
- Muñoz-Aguilar, R.S.; Molognoni, D.; Bosch-Jimenez, P.; Borràs, E.; Della Pirriera, M.; Luna, Á. Design, Operation, Modeling and Grid Integration of Power-to-Gas Bioelectrochemical Systems. Energies 2018, 11, 1947. [Google Scholar] [CrossRef]
- Palizban, O.; Kauhaniemi, K. Energy storage systems in modern grids—Matrix of technologies and applications. J. Energy Storage 2016, 6, 248–259. [Google Scholar] [CrossRef]
- Gallo, A.; Simões-Moreira, J.; Costa, H.; Santos, M.; Moutinho dos Santos, E. Energy storage in the energy transition context: A technology review. Renew. Sustain. Energy Rev. 2016, 65, 800–822. [Google Scholar] [CrossRef]
- Kim, J.; Suharto, Y.; Daim, T.U. Evaluation of Electrical Energy Storage (EES) technologies for renewable energy: A case from the US Pacific Northwest. J. Energy Storage 2017, 11, 25–54. [Google Scholar] [CrossRef]
- Nadeem, F.; Hussain, S.M.S.; Tiwari, P.K.; Goswami, A.K.; Ustun, T.S. Comparative Review of Energy Storage Systems, Their Roles, and Impacts on Future Power Systems. IEEE Access 2019, 7, 4555–4585. [Google Scholar] [CrossRef]
- Stoppato, A.; Benato, A. The Importance of Energy Storage. In World Scientific Series in Current Energy Issues: Volume 4 Energy Storage; World Scientific Publishing Company: Singapore, 2017; Chapter 1; pp. 1–26. [Google Scholar]
- Yekini Suberu, M.; Wazir Mustafa, M.; Bashir, N. Energy storage systems for renewable energy power sector integration and mitigation of intermittency. Renew. Sustain. Energy Rev. 2014, 35, 499–514. [Google Scholar] [CrossRef]
- Schmidt, O.; Hawkes, A.; Gambhir, A.; Staffell, I. The future cost of electrical energy storage based on experience rates. Nat. Energy 2017, 2, 17110. [Google Scholar] [CrossRef]
- Schmidt, O.; Melchior, S.; Hawkes, A.; Staffell, I. Projecting the Future Levelized Cost of Electricity Storage Technologies. Joule 2019, 3, 81–100. [Google Scholar] [CrossRef]
- Lund, H.; Østergaard, P.A.; Connolly, D.; Ridjan, I.; Mathiesen, B.V.; Hvelplund, F.; Thellufsen, J.Z.; Sorknæs, P. Energy Storage and Smart Energy Systems. Int. J. Sustain. Energy Plan. Manag. 2016, 11, 3–14. [Google Scholar] [CrossRef]
- Ridjan, I. Integrated Electrofuels and Renewable Energy Systems. Ph.D. Thesis, Aalborg University, Aalborg, Denmark, 2015. Available online: http://www.webcitation.org/776DW9uVm (accessed on 25 March 2019).
- Terna. Pilot Storage Projects. 2017. Available online: http://www.terna.it/SistemaElettrico/ProgettiPilotadiaccumulo.aspx, http://www.webcitation.org/776D68wiX (accessed on 25 March 2019).
- Benato, R.; Bruno, G.; Palone, F.; Polito, R.M.; Rebolini, M. Large-Scale Electrochemical Energy Storage in High Voltage Grids: Overview of the Italian Experience. Energies 2017, 10, 108. [Google Scholar] [CrossRef]
- Nykvist, B.; Sprei, F.; Nilsson, M. Assessing the progress toward lower priced long range battery electric vehicles. Energy Policy 2019, 124, 144–155. [Google Scholar] [CrossRef]
- Rossi, A.; Stabile, M.; Puglisi, C.; Falabretti, D.; Merlo, M. Evaluation of the energy storage systems impact on the Italian ancillary market. Sustain. Energy Grids Netw. 2019, 17, 100178. [Google Scholar] [CrossRef]
- Staffell, I.; Rustomji, M. Maximising the value of electricity storage. J. Energy Storage 2016, 8, 212–225. [Google Scholar] [CrossRef]
- Lazkano, I.; Nøstbakken, L.; Pelli, M. From fossil fuels to renewables: The role of electricity storage. Eur. Econ. Rev. 2017, 99, 113–129. [Google Scholar] [CrossRef]
- Østergaard, P.A. Comparing electricity, heat and biogas storages’ impacts on renewable energy integration. Energy 2012, 37, 255–262. [Google Scholar] [CrossRef]
- Rech, S.; Lazzaretto, A. Smart rules and thermal, electric and hydro storages for the optimum operation of a renewable energy system. Energy 2018, 147, 742–756. [Google Scholar] [CrossRef]
- Limpens, G.; Jeanmart, H. Electricity storage needs for the energy transition: An EROI based analysis illustrated by the case of Belgium. Energy 2018, 152, 960–973. [Google Scholar] [CrossRef]
- Després, J.; Mima, S.; Kitous, A.; Criqui, P.; Hadjsaid, N.; Noirot, I. Storage as a flexibility option in power systems with high shares of variable renewable energy sources: A POLES-based analysis. Energy Econ. 2017, 64, 638–650. [Google Scholar] [CrossRef]
- Child, M.; Haukkala, T.; Breyer, C.; Child, M.; Haukkala, T.; Breyer, C. The Role of Solar Photovoltaics and Energy Storage Solutions in a 100% Renewable Energy System for Finland in 2050. Sustainability 2017, 9, 1358. [Google Scholar] [CrossRef]
- Bellocchi, S.; Gambini, M.; Manno, M.; Stilo, T.; Vellini, M. Positive interactions between electric vehicles and renewable energy sources in CO2-reduced energy scenarios: The Italian case. Energy 2018, 161, 172–182. [Google Scholar] [CrossRef]
- International Energy Agency. Statistics|Italy—Key Indicators for 2016. Available online: https://www.iea.org/statistics/?country=ITALY&year=2016&category=Key%20indicators&indicator=TPESbyPop&mode=table&dataTable=INDICATORS (accessed on 3 December 2018).
- Terna Rete Italia. Ex Post Data on the Actual Generation. Available online: http://www.terna.it/SistemaElettrico/TransparencyReport/Generation/Expostdataontheactualgeneration.aspx (accessed on 3 December 2018).
- Varone, A.; Ferrari, M. Power to liquid and power to gas: An option for the German Energiewende. Renew. Sustain. Energy Rev. 2015, 45, 207–218. [Google Scholar] [CrossRef]
- Associazione Nazionale Energia del Vento. Anev 2017. Available online: http://www.webcitation.org/776CwvRH4 (accessed on 25 March 2019).
- Italian Ministry of Economic Development. Strategia Energetica Nazionale. 2017. Available online: http://www.webcitation.org/776Clm2a4 (accessed on 25 March 2019).
- Electric Vehicle Database, 2018. Available online: https://ev-database.uk/ (accessed on 4 December 2018).
- Bellocchi, S.; Guizzi, G.L.; Manno, M.; Salvatori, M.; Zaccagnini, A. Reversible heat pump HVAC system with regenerative heat exchanger for electric vehicles: Analysis of its impact on driving range. Appl. Therm. Eng. 2018, 129, 290–305. [Google Scholar] [CrossRef]
- Bellocchi, S.; De Falco, M.; Gambini, M.; Manno, M.; Stilo, T.; Vellini, M. Opportunities for Power-to-Gas and Power-to-Liquid in CO2-reduced energy scenarios: The Italian case. Energy 2019, 175, 847–861. [Google Scholar] [CrossRef]
- Collins, S.; Deane, P.; Ógallachóir, B.; Pfenninger, S.; Staffell, I. Impacts of Inter-annual Wind and Solar Variations on the European Power System. Joule 2018, 2, 2076–2090. [Google Scholar] [CrossRef] [PubMed]
- Boie, I.; Kost, C.; Bohn, S.; Agsten, M.; Bretschneider, P.; Snigovyi, O.; Pudlik, M.; Ragwitz, M.; Schlegl, T.; Westermann, D. Opportunities and challenges of high renewable energy deployment and electricity exchange for North Africa and Europe—Scenarios for power sector and transmission infrastructure in 2030 and 2050. Renew. Energy 2016, 87, 130–144. [Google Scholar] [CrossRef]
- Trieb, F.; Schillings, C.; Pregger, T.; O’Sullivan, M. Solar electricity imports from the Middle East and North Africa to Europe. Energy Policy 2012, 42, 341–353. [Google Scholar] [CrossRef]
- Rasmussen, M.G.; Andresen, G.B.; Greiner, M. Storage and balancing synergies in a fully or highly renewable pan-European power system. Energy Policy 2012, 51, 642–651. [Google Scholar] [CrossRef]
- Heat Roadmap Europe 4. Energy Models for 14 EU MSs. 2018. Available online: https://heatroadmap.eu/energy-models/ (accessed on 14 February 2019).
- International Energy Agency. Projected Costs of Generating Electricity. 2015. Available online: http://www.webcitation.org/776CPkYMU (accessed on 25 March 2019).
- International Energy Agency. Technology Roadmap—Energy Storage. 2014. Available online: http://www.webcitation.org/776CbvihQ (accessed on 25 March 2019).
- Smallbone, A.; Jülch, V.; Wardle, R.; Roskilly, A.P. Levelised Cost of Storage for Pumped Heat Energy Storage in comparison with other energy storage technologies. Energy Convers. Manag. 2017, 152, 221–228. [Google Scholar] [CrossRef]
- Lin, B.; Wu, W.; Bai, M.; Xie, C.; Radcliffe, J. Liquid air energy storage: Price arbitrage operations and sizing optimization in the GB real-time electricity market. Energy Econ. 2019, 78, 647–655. [Google Scholar] [CrossRef]
- Beaudin, M.; Zareipour, H.; Schellenberglabe, A.; Rosehart, W. Energy storage for mitigating the variability of renewable electricity sources: An updated review. Energy Sustain. Dev. 2010, 14, 302–314. [Google Scholar] [CrossRef]
- Hedegaard, K.; Meibom, P. Wind power impacts and electricity storage—A time scale perspective. Renew. Energy 2012, 37, 318–324. [Google Scholar] [CrossRef]
- Gabrielli, P.; Gazzani, M.; Martelli, E.; Mazzotti, M. Optimal design of multi-energy systems with seasonal storage. Appl. Energy 2018, 219, 408–424. [Google Scholar] [CrossRef]
- Connolly, D.; Lund, H.; Mathiesen, B. Smart Energy Europe: The technical and economic impact of one potential 100% renewable energy scenario for the European Union. Renew. Sustain. Energy Rev. 2016, 60, 1634–1653. [Google Scholar] [CrossRef]
- Lund, H.; Kempton, W. Integration of renewable energy into the transport and electricity sectors through V2G. Energy Policy 2008, 36, 3578–3587. [Google Scholar] [CrossRef]
- Neubauer, J.; Pesaran, A. The ability of battery second use strategies to impact plug-in electric vehicle prices and serve utility energy storage applications. J. Power Sources 2011, 196, 10351–10358. [Google Scholar] [CrossRef]
- Cicconi, P.; Landi, D.; Morbidoni, A.; Germani, M. Feasibility analysis of second life applications for Li-Ion cells used in electric powertrain using environmental indicators. In Proceedings of the 2012 IEEE International Energy Conference and Exhibition, Florence, Italy, 9–12 September 2012; pp. 985–990. [Google Scholar]
- Loßner, M.; Böttger, D.; Bruckner, T. Economic assessment of virtual power plants in the German energy Market—A scenario-based and model-supported analysis. Energy Econ. 2017, 62, 125–138. [Google Scholar] [CrossRef]
- Moreno, B.; Díaz, G. The impact of virtual power plant technology composition on wholesale electricity prices: A comparative study of some European Union electricity markets. Renew. Sustain. Energy Rev. 2019, 99, 100–108. [Google Scholar] [CrossRef]
- Hooshmand, R.A.; Nosratabadi, S.M.; Gholipour, E. Event-based scheduling of industrial technical virtual power plant considering wind and market prices stochastic behaviors—A case study in Iran. J. Clean. Prod. 2018, 172, 1748–1764. [Google Scholar] [CrossRef]
- de Mello Santana, P.H. Cost-effectiveness as energy policy mechanisms: The paradox of technology-neutral and technology-specific policies in the short and long term. Renew. Sustain. Energy Rev. 2016, 58, 1216–1222. [Google Scholar] [CrossRef]
- Azar, C.; Sandén, B.A. The elusive quest for technology-neutral policies. Environ. Innov. Soc. Transit. 2011, 1, 135–139. [Google Scholar] [CrossRef]
- Energy Economics Group. Italy—Development of the Building Related Energy Demand for Space Heating, Hot Water and Cooling. 2015. Available online: http://eeg.tuwien.ac.at/zebra/ (accessed on 25 March 2018).
- Salza, P. Strategie per L’ottimizzazione di Sistemi di Produzione e Utilizzazione di Energia in Ipotesi di Penetrazione Significativa di Fonti Rinnovabili. Master’s Thesis, Università di Pisa, Pisa, Italy, 2008. Available online: https://etd.adm.unipi.it/t/etd-01182010-140621/ (accessed on 25 March 2019).
- Gestore dei Servizi Energetici. Energia da Fonti Rinnovabili in Italia—Anno 2016. 2018. Available online: http://www.webcitation.org/776BMzSuK (accessed on 25 March 2019).
- ISPRA. Annuario dei dati Ambientali 2017—Versione Integrale. Available online: http://www.webcitation.org/776BcqSOo (accessed on 24 March 2019).
- Terna Rete Italia. Dati Statistici sull’Energia Elettrica in Italia. Available online: http://www.terna.it/it-it/sistemaelettrico/statisticheeprevisioni/datistatistici.aspx (accessed on 25 March 2019).
- Terna Rete Italia. Aggregated Realised Commercial and Physical Flows per Interconnection. Available online: http://www.terna.it/en-gb/sistemaelettrico/transparencyreport/transmissionandinterconnection/aggregatedrealisedcommercialandphysicalflows.aspx (accessed on 3 December 2018).
- Gestore dei Servizi Energetici. Valutazione del Potenziale Nazionale di Applicazione della Cogenerazione ad Alto Rendimento e del Teleriscaldamento Efficiente. 2015. Available online: http://www.webcitation.org/776CDAfiA (accessed on 25 March 2019).
- International Energy Agency. Statistics|Italy—Balances for 2016. Available online: https://www.iea.org/statistics/?country=ITALY&year=2016&category=Energy%20supply&indicator=TPESbySource&mode=chart&dataTable=BALANCES (accessed on 24 March 2019).
- Terna Rete Italia. Actual Load. Available online: http://www.terna.it/SistemaElettrico/TransparencyReport/Load/ActualLoad.aspx (accessed on 3 December 2018).
- Noussan, M.; Jarre, M.; Poggio, A. Real operation data analysis on district heating load patterns. Energy 2017, 129, 70–78. [Google Scholar] [CrossRef]
- Snam. Operating Data—Physical Flows on the National Network. Available online: http://www.snam.it/en/transportation/operational-data-business/0-Phisical_Flows_on_the_national_network/ (accessed on 24 March 2019).
- Entso-e. Actual Generation per Production Type. 2016. Available online: https://transparency.entsoe.eu/generation/r2/actualGenerationPerProductionType/show (accessed on 24 March 2019).
Figure 1.
Normalised annual distribution of electricity storage level and cumulative sum of RES surplus for different scenarios. Storage parameters: ; ; .
Figure 1.
Normalised annual distribution of electricity storage level and cumulative sum of RES surplus for different scenarios. Storage parameters: ; ; .

Figure 2.
Load curves related to storage charge and discharge, backup power plant generation and electricity import at 9×RES (“mixed” scenario). Storage parameters: ; ; . Dashed lines: load curves with no electricity storage.
Figure 2.
Load curves related to storage charge and discharge, backup power plant generation and electricity import at 9×RES (“mixed” scenario). Storage parameters: ; ; . Dashed lines: load curves with no electricity storage.

Figure 3.
CO2 emissions for increasing iRES capacity and different energy scenarios.

Figure 4.
Decrease in iRES capacity allowed by electricity storage and corresponding electricity storage capacity required. Storage parameters: ; ; .
Figure 4.
Decrease in iRES capacity allowed by electricity storage and corresponding electricity storage capacity required. Storage parameters: ; ; .

Figure 5.
RES surplus and RES share of total electricity generation for increasing iRES capacity and different energy scenarios.
Figure 5.
RES surplus and RES share of total electricity generation for increasing iRES capacity and different energy scenarios.

Figure 6.
CO2 emissions for different electricity storage parameters (“mixed” scenario).


Figure 7.
Maximum yearly value of electricity storage: 5×RES (top); 9×RES (bottom). Dashed lines represent the value of the electricity storage total capacity .
Figure 7.
Maximum yearly value of electricity storage: 5×RES (top); 9×RES (bottom). Dashed lines represent the value of the electricity storage total capacity .

Figure 8.
Decrease in iRES annual costs allowed by electricity storage. Costs projections at 2030 and 2050. Storage parameters: and ; ; .
Figure 8.
Decrease in iRES annual costs allowed by electricity storage. Costs projections at 2030 and 2050. Storage parameters: and ; ; .

Figure 9.
Electricity storage system annual cycles. Storage parameters: ; ; .

Figure 10.
Projections of electricity storage annual costs for different technologies at 2030 and 2050.
Figure 10.
Projections of electricity storage annual costs for different technologies at 2030 and 2050.

Table 1.
Model validation.
| Indicator | Units | Model | Actual | Difference | Source |
|---|---|---|---|---|---|
| CO2 emissions | 322.7 | 326.0 | −1.0% | [32] | |
| TPES | 140.2 | 143.4 | −2.2% | [32] | |
| RES electricity | 89.9 | 89.5 | 0.4% | [33] | |
| PP electricity | 94.6 | 93.6 | −1.0% | [33] | |
| CHP electricity | 105.0 | 105.1 | −0.2% | [33] |
Table 2.
iRES capacity () at 2016 and 9×RES scenario.
| Technology | 2016 | 9×RES |
|---|---|---|
| Onshore wind | 9410 | 16,000 |
| Offshore wind | - | 1150 |
| Photovoltaic | 19,283 | 242,370 |
| Tot. iRES | 28,693 | 259,520 |
Table 3.
Petrol and diesel vehicles fuel consumption at 50% replacement.
| Size | Share | Initial Vehicles (×106) | Final Vehicles (×106) | Individual Consumption () | Total Consumption | |
|---|---|---|---|---|---|---|
| Petrol | Small | 0.86 | 13.75 | 6.87 | 6.19 | 27.90 |
| Medium | 0.13 | 2.04 | 1.02 | 6.79 | 4.54 | |
| Large | 0.01 | 0.12 | 0.06 | 9.38 | 0.37 | |
| Total | 1.00 | 15.91 | 7.95 | 32.81 | ||
| Diesel | Small | 0.35 | 5.27 | 2.63 | 4.79 | 16.87 |
| Medium | 0.61 | 9.06 | 4.53 | 5.56 | 33.71 | |
| Large | 0.04 | 0.64 | 0.32 | 8.09 | 3.44 | |
| Total | 1.00 | 14.96 | 7.48 | 54.02 |
Table 4.
EV electricity consumption at 50% replacement.
| Size | Share | Individual Consumption | Vehicles ×106 | Total Consumption | Battery Capacity | PHEV Fuel |
|---|---|---|---|---|---|---|
| Small | 0.62 | 16.59 | 9.51 | 18.17 | 161.85 | - |
| Medium | 0.36 | 17.80 | 5.55 | 11.38 | 167.98 | 0.13 |
| Large | 0.02 | 22.37 | 0.38 | 0.97 | 22.62 | 0.12 |
| Total | 15.43 | 30.52 | 352.46 | 0.25 |
Table 5.
Assumptions for individual heating consumption and demand (TWh/year).
| Fuel Consumption | Efficiency/COP | Heating Demand | ||
|---|---|---|---|---|
| 2016 | “Mixed” | |||
| Oil | 29.2 | 0.85 | 24.8 | 0.0 |
| Natural gas | 262.7 | 0.90 | 236.5 | 196.0 |
| Biomass | 79.4 | 0.75 | 59.6 | 59.6 |
| Heat pumps | - | 2.60 | 49.0 | 114.3 |
| Electric heating | - | 8.4 | 8.4 | |
| Total | 371.4 | 378.2 | 378.2 | |
Table 6.
P2G/L parameters for the “mixed” scenario.
| Parameter | Units | Value |
|---|---|---|
| Electrolysers capacity | 22.56 | |
| Electrolysers efficiency | - | 0.73 |
| Hydrogen storage capacity | 3.25 | |
| Biogas required | 11.76 | |
| Syngas from biogas | 19.60 | |
| Biomass required | 65.40 | |
| Syngas from biomass gasification → P2G | 19.60 | |
| Synthetic liquid fuel | 37.09 |
Table 7.
Current and projected investment and O&M costs of iRES technologies (Data from [44]).
Table 7.
Current and projected investment and O&M costs of iRES technologies (Data from [44]).
| Technology | Investment Costs () | O&M Fraction (%) | Investment Period n | ||||||
|---|---|---|---|---|---|---|---|---|---|
| 2015 | 2030 | 2050 | 2015 | 2030 | 2050 | 2015 | 2030 | 2050 | |
| Onshore Wind | 970 | 830 | 860 | 3.21 | 3.27 | 3.40 | 25 | 30 | 30 |
| Offshore Wind | 1990 | 1400 | 1390 | 2.07 | 1.94 | 1.93 | 25 | 30 | 30 |
| Photo-voltaic | 1170 | 800 | 670 | 1.00 | 1.00 | 1.00 | 30 | 40 | 40 |
| Parameter | Units | Year | PHS | CAES | Li-ion | Na-S | Pb | VRF | H2 | PHES | LAES |
|---|---|---|---|---|---|---|---|---|---|---|---|
| EUR/kW | 2015 | 847 | 653 | 509 | 493 | 506 | 622 | 4063 | 350 | 675 | |
| 2030 | 847 | 653 | 117 | 261 | 319 | 162 | 2153 | 350 | 675 | ||
| 2050 | 847 | 653 | 71 | 163 | 294 | 106 | 1341 | 350 | 675 | ||
| EUR/kWh | 2015 | 60 | 29 | 602 | 554 | 353 | 570 | 23 | 13 | 218 | |
| 2030 | 60 | 29 | 138 | 293 | 223 | 148 | 12 | 13 | 218 | ||
| 2050 | 60 | 29 | 84 | 183 | 205 | 97 | 8 | 13 | 218 | ||
| - | 6.00 | 3.00 | 7.50 | 8.25 | 6.00 | 9.00 | 34.5 | 3.00 | 3.00 | ||
| - | 1 | 4 | 3 | 3 | 1 | 1 | 0 | 4 | 4 | ||
| n | - | - | 55 | 30 | 13 | 14 | 10 | 13 | 18 | 20 | 30 |
© 2019 by the authors. Licensee MDPI, Basel, Switzerland. This article is an open access article distributed under the terms and conditions of the Creative Commons Attribution (CC BY) license (http://creativecommons.org/licenses/by/4.0/).
Share and Cite
MDPI and ACS Style
Bellocchi, S.; Manno, M.; Noussan, M.; Vellini, M. Impact of Grid-Scale Electricity Storage and Electric Vehicles on Renewable Energy Penetration: A Case Study for Italy. Energies 2019, 12, 1303. https://doi.org/10.3390/en12071303
AMA Style
Bellocchi S, Manno M, Noussan M, Vellini M. Impact of Grid-Scale Electricity Storage and Electric Vehicles on Renewable Energy Penetration: A Case Study for Italy. Energies. 2019; 12(7):1303. https://doi.org/10.3390/en12071303
Chicago/Turabian StyleBellocchi, Sara, Michele Manno, Michel Noussan, and Michela Vellini. 2019. "Impact of Grid-Scale Electricity Storage and Electric Vehicles on Renewable Energy Penetration: A Case Study for Italy" Energies 12, no. 7: 1303. https://doi.org/10.3390/en12071303
Note that from the first issue of 2016, this journal uses article numbers instead of page numbers. See further details here.