Energy and Environmental Analysis of Membrane-Based CH4-CO2 Replacement Processes in Natural Gas Hydrates


CIRIAF, University of Perugia, Via G. Duranti 67, 06125 Perugia, Italy
*
Author to whom correspondence should be addressed.
Energies 2019, 12(5), 850; https://doi.org/10.3390/en12050850
Submission received: 29 January 2019
/
Revised: 25 February 2019
/
Accepted: 28 February 2019
/
Published: 5 March 2019
Abstract
:Natural gas hydrates are the largest reservoir of natural gas worldwide. This paper proposes and analyzes the CH4-CO2 replacement in the hydrate phase and pure methane collection through the use of membrane-based separation. The investigation uses a 1 L lab reactor, in which the CH4 hydrates are formed in a quartz sand matrix partially saturated with water. CH4 is subsequently dissociated with a CO2 stream supplied within the sediment inside the reactor. An energy and environmental analysis was carried out to prove the sustainability of the process. Results show that the process energy consumption constitutes 4.75% of the energy stored in the recovered methane. The carbon footprint of the CH4-CO2 exchange process is calculated as a balance of the CO2 produced in the process and the CO2 stored in system. Results provide an estimated negative value, equal to 0.004 moles sequestrated, thus proving the environmental benefit of the exchange process.
1. Introduction
Global warming has become one of the main issues in the public domain, and its importance is steadily increasing. The temperature increase can be in good part ascribed to the increase in anthropogenic carbon emissions, as a result of mankind’s massive dependence on carbon-based fossil fuels for the majority of energy production. In order to prevent or at least decelerate the advancement of global climate changes, the carbon footprint of human activities needs to be reduced [1]. Combustion of cleaner fuels, increased use of renewable energies and a focus on CO2 capture technologies can all contribute to this ultimate goal [2].
Natural gas use in power generation provides low capital costs and favorable heat rates, for this reason is an attractive fuel [3]. Moreover, the decarbonisation in the energy sector indicates a process of progressive decrease over time of the H/C ratio in the different sources of energy supply. Methane, with a ratio of 4, presents the highest value among fossil energy sources.
In addition to conventional gas and oil wells, unconventional deposits such as shale gas, tight gas, or coal bed methane deposits have been studied as huge gas resources. Nevertheless, the largest amount of methane worldwide is trapped in the permafrost and oceanic sediments, as natural gas hydrates (NGH).
Gas hydrates are solid crystalline compounds, in which small gas molecules are trapped inside cages of hydrogen-bonded water molecules. They form when the guest gas (i.e., CH4) and water coexist at sufficiently low temperatures and high pressures. There are important results in literature about experimental and molecular simulations, which describe in detail the mechanisms of gas hydrate nucleation and crystal growth [4,5] thermal and mechanical properties [6,7], mass and heat transport processes [8,9,10].
One volume of solid methane hydrate contains 164 volumes of gaseous methane at standard temperature and pressure (STP), which is equivalent to room temperature at 18 MPa [11]. The amount of organic carbon contained in NGH reserves around the globe is estimated to be twice the amount contained in all currently recoverable worldwide conventional hydrocarbon resources [12]. Numerical estimates of world NGH deposits range from the first published number of 3053 × 1015 Sm3 [13] to more conservative values of 15 × 1015 Sm3 [14], 2.5 × 10¹⁵ Sm3 [15] and 120 × 1015 Sm3 [16].
NGH exist in those areas where both biogenic or thermogenic gas sources occur under large, cold masses providing high pressure values and low temperatures. These conditions occur beneath quite thick frozen soils such as arctic permafrost. Several areas in the Arctic show potential for having gas hydrate accumulations, in North America, in Russia, in Norway.
Another primary hydrate stability zone are regions in the subsea floor sediment, where temperatures and pore pressures are suitable for stable NGH [17]. NGH marine deposits are generally found along the continental slopes and shelves with abundance of organic matter supply and with water depths exceeding 500 m. In the deepest ocean regions, below around 2000 to 3000 m, hydrates are scarcely found because of the limited availability of methane that in the ocean is produced by microbial decomposition of organic matter sinking down from the sunlit zone near the surface. Conversely, no NGHs are found in marginal seas because of the insufficient pressure for their stability [18]. Recent programs of gas hydrate field drilling have assessed gas hydrate accumulations in the marine sands in the Cascadia Margin, Gulf of Mexico and Nankai Trough, and also other types in offshore India, Malaysia and Korea [12].
The natural gas production from oceanic and permafrost sediments is currently being performed using methods such as injection of hydrate inhibitors, depressurization and thermal stimulation.
The chemical inhibition method seeks to displace the NGH local conditions of pressure and temperature outside the thermodynamic conditions of hydrate stability zone through the injection of a liquid inhibitor from the surface down to NGH bearing layers [19].
The depressurization method dissociates methane hydrate by decreasing the pressure in the wellbore drilled inside the NGH sediments [20]. When pressure decreases, NGH becomes thermodynamically unstable and dissociates absorbing sensible heat from the surrounding sediments as well as geothermal heat flow. Depressurization method has been extensively investigated at laboratory scales [21].
The thermal stimulation method decomposes NGH by raising temperature beyond the hydrate stability zone. Most of the thermal dissociation tests have been performed via the injection of heat transfer fluids, such as steam, into the hydrate sediment [22]. Other proposed thermal stimulation techniques are microwave heating, electro-magnetic heating, and in-situ combustion [19]. These methods are considered more promising than the conventional heated fluid injection methods, thanks to the direct energy contribution necessary for the dissociation at the hydrate zone [17].
The in-situ combustion process consists in locating a point heat source in the hydrate region, via direct combustion of a liquid fuel and an oxidant [23,24].
Recovering methane from hydrate reservoirs can be also combined with simultaneous permanent CO2 sequestration [23,25,26]. The CO2 injection into the NGH sediments causes the gaseous CH4 release and the formation of CO2 hydrate, even if global conditions of pressure and temperature remain within the CH4 hydrate stability zone. This gives the opportunity to simultaneously recover an energy resource while entrapping a greenhouse gas.
Many experimental and numerical studies have been performed to understand the CH4-CO2 replacement [27]. Baig et al. in [28] stated that conversion of CH4 hydrates in CO2 hydrates occurs according to two mechanisms: new CO2 hydrate formation starting from gaseous CO2 and free water surrounding hydrates and a direct conversion in the solid state.
The solid-state exchange is slow because of mass transport limitations. The formation of new hydrates is a faster process since it releases heat, assisting the in situ dissociation of the methane hydrate. This is faster, because heat transport is very rapid in these systems [29].
There is a sound body of knowledge in literature about energy potential of NGH reservoirs, with studies in laboratory settings and some recent field trials, deeply reviewed in [12]. According to a hydrate research roadmap by the U.S. National Methane Hydrate R&D program [30], the key research topics to be investigated are the development technologies of sampling, characterization, and production, the investigation on the role of gas hydrate in the global climate change. Some production technologies have been recently proposed, such as the use of horizontal wellbore [31].
The present paper aims at addressing the issue of a production technology development, proposing a membrane-based CH4-CO2 replacement process for methane recovery and CO2 storage in NGH. Production control during NGH exploitation is considered by the NGH scientific community a key priority which involves appropriate drilling and hazard monitoring technologies [32]. Nevertheless, to the best of our knowledge, studies on the CH4-CO2 replacement process, which take into account the separation efficiency and propose a process to recover pure methane, are not present in literature.
In the present paper, an integrated process with a membrane section is proposed and analyzed from an energy and environmental point of view. The use of mechanical devices such as membranes [33] is proposed to separate the CO2 and CH4 which have not taken part to the replacement process. In this way, pure methane can be recovered and CO2 can be recirculated in the sediment.
The methane recovery and the CH4-CO2 replacement in the hydrate phase is studied experimentally in a 1 L lab scale reactor. The CH4 hydrates are formed in a matrix resembling geological properties of natural seafloor and are subsequently dissociated by a CO2 stream supplied in the upper part of the reactor. Experimental results will be used as input for energy and environmental evaluations to prove the sustainability of the process.
2. Materials and Methods
The present paper aims at studying a continuous CH4-CO2 replacement process, which integrates the use of a membrane separation section for pure methane recovery.
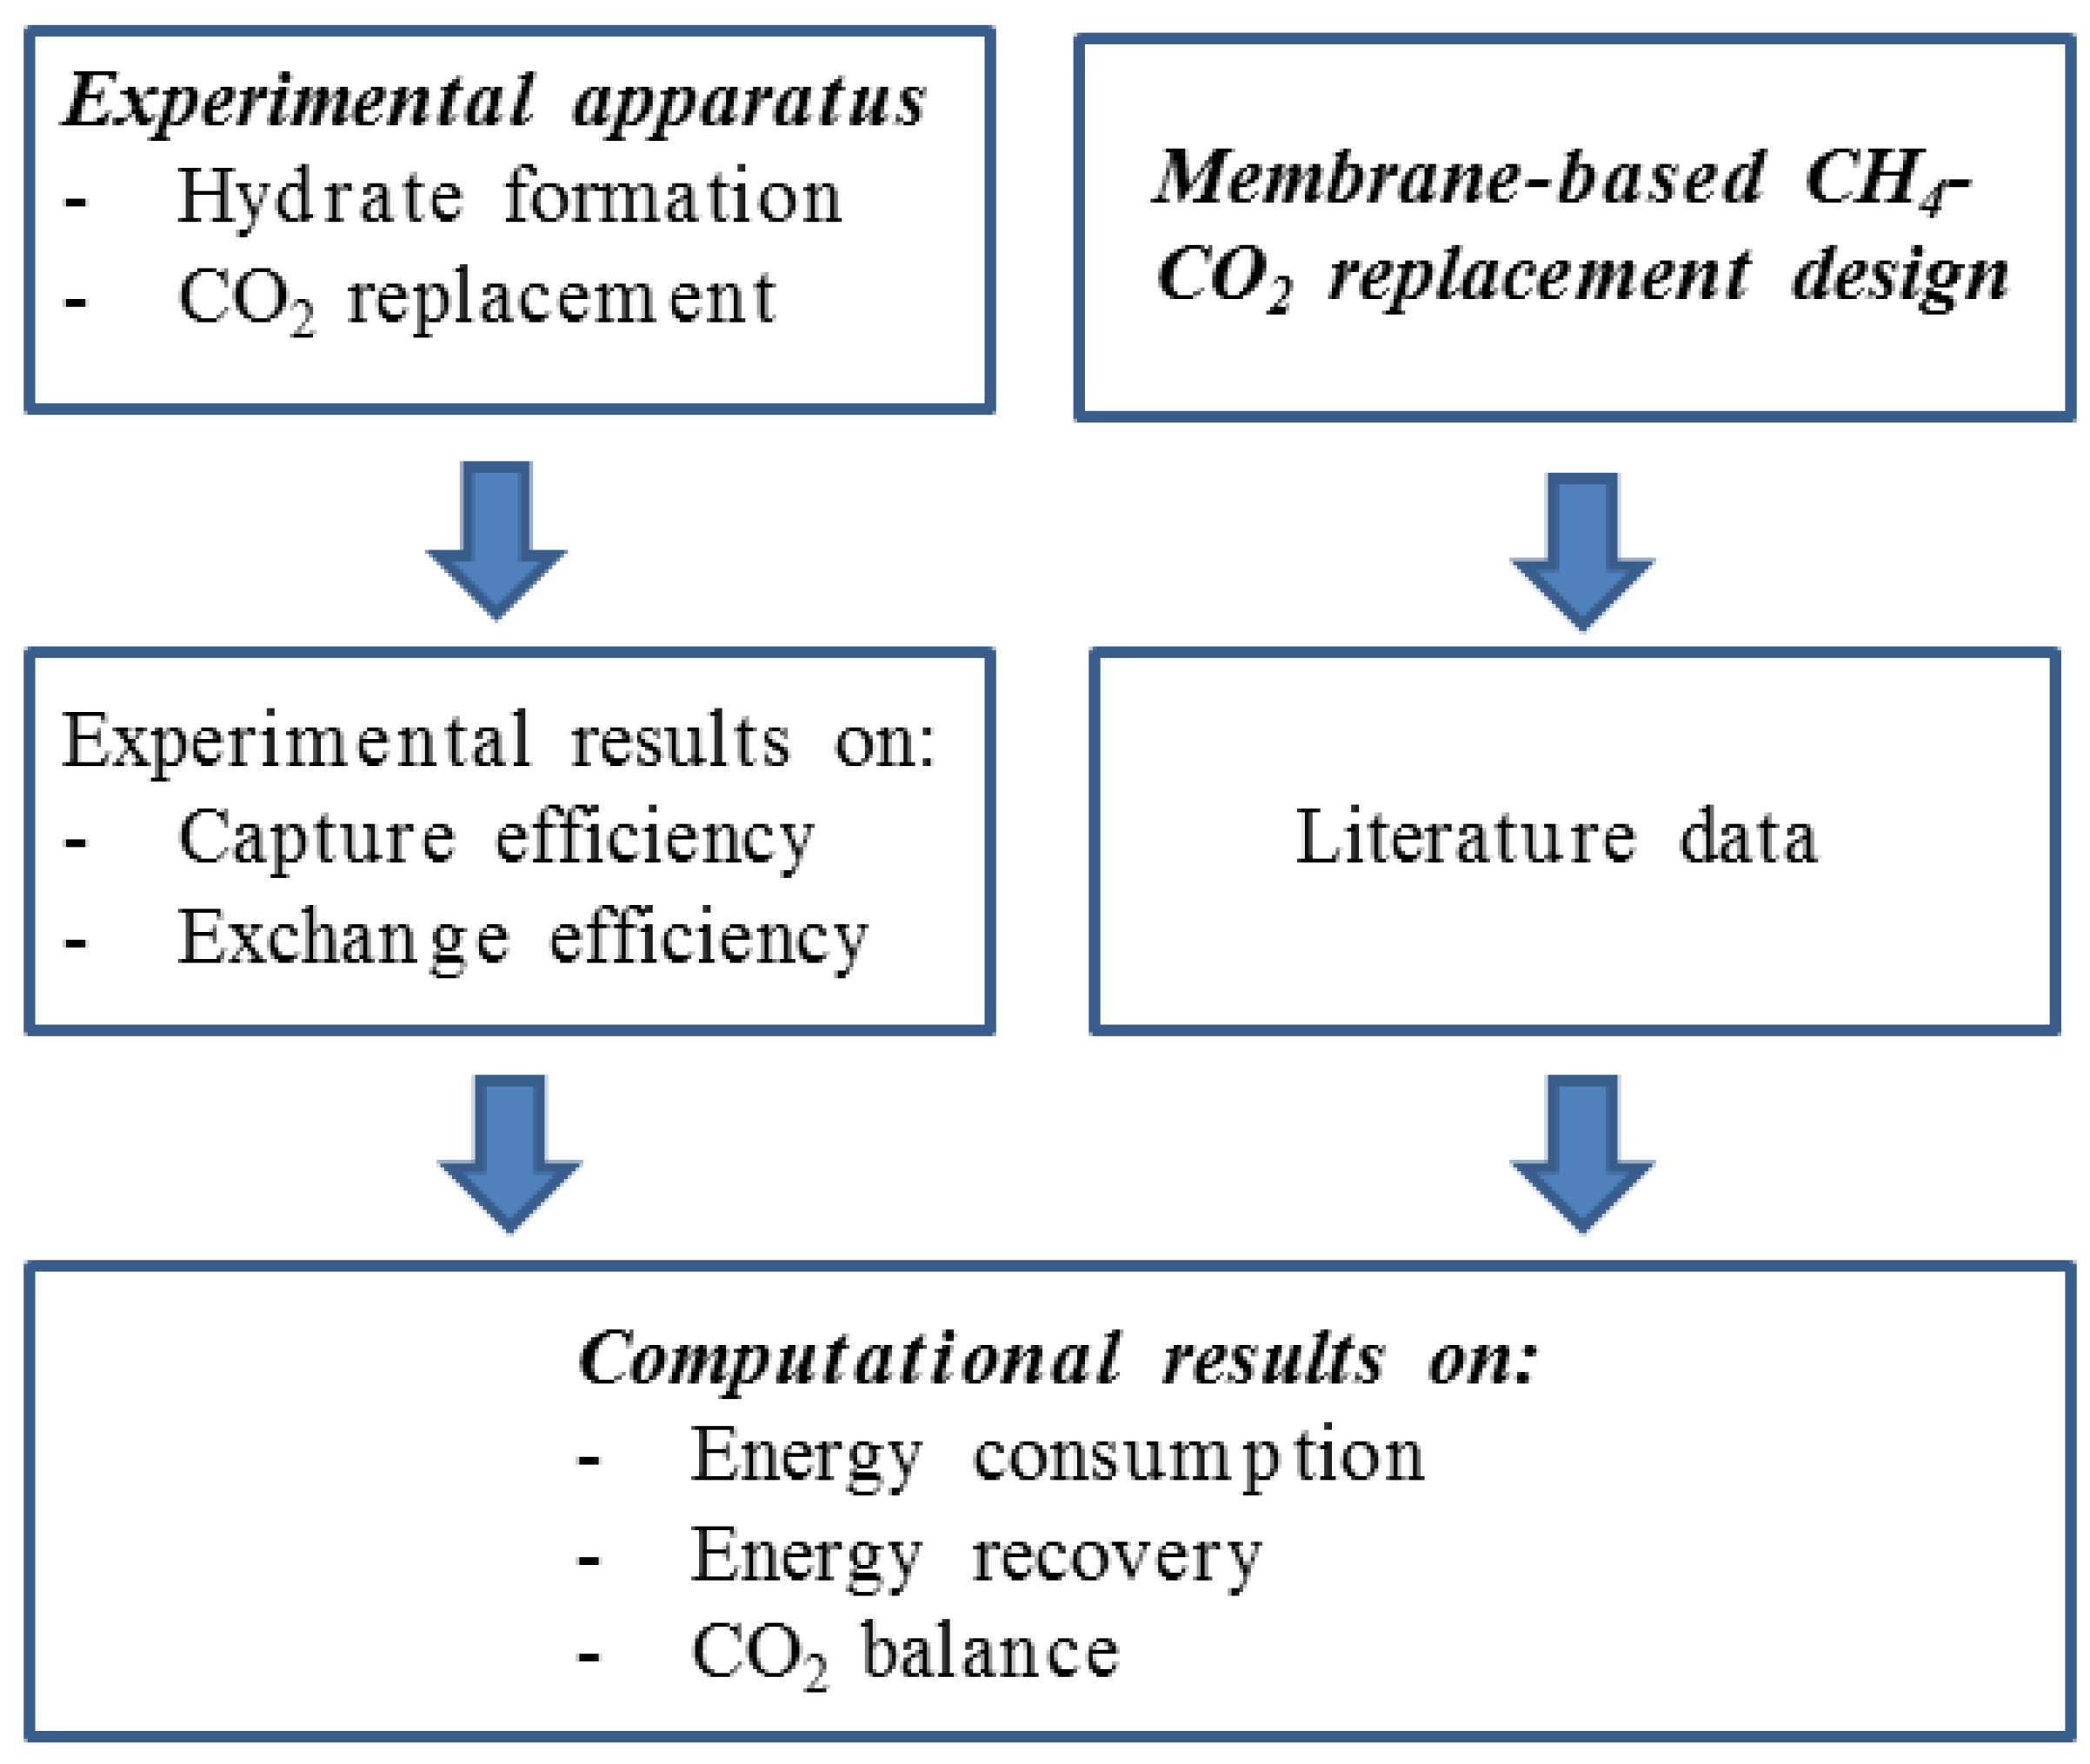
An experimental apparatus was used to reproduce NGH marine sediments and perform the CH4-CO2 replacement. The experimental data are used together with the membrane operation data to obtain energy and environmental results through a numerical simulation, as shown in Figure 1.
The experimental tests consist in a first step of artificial reproduction of the NGH sediment inside the reactor and in a second step of CH4-CO2 replacement in the NGH. On the basis of the experimental results obtained, an energy and environmental analysis about the integration of the CH4-CO2 replacement with the proposed membrane separation section is then discussed.
2.1. Experimental Apparatus
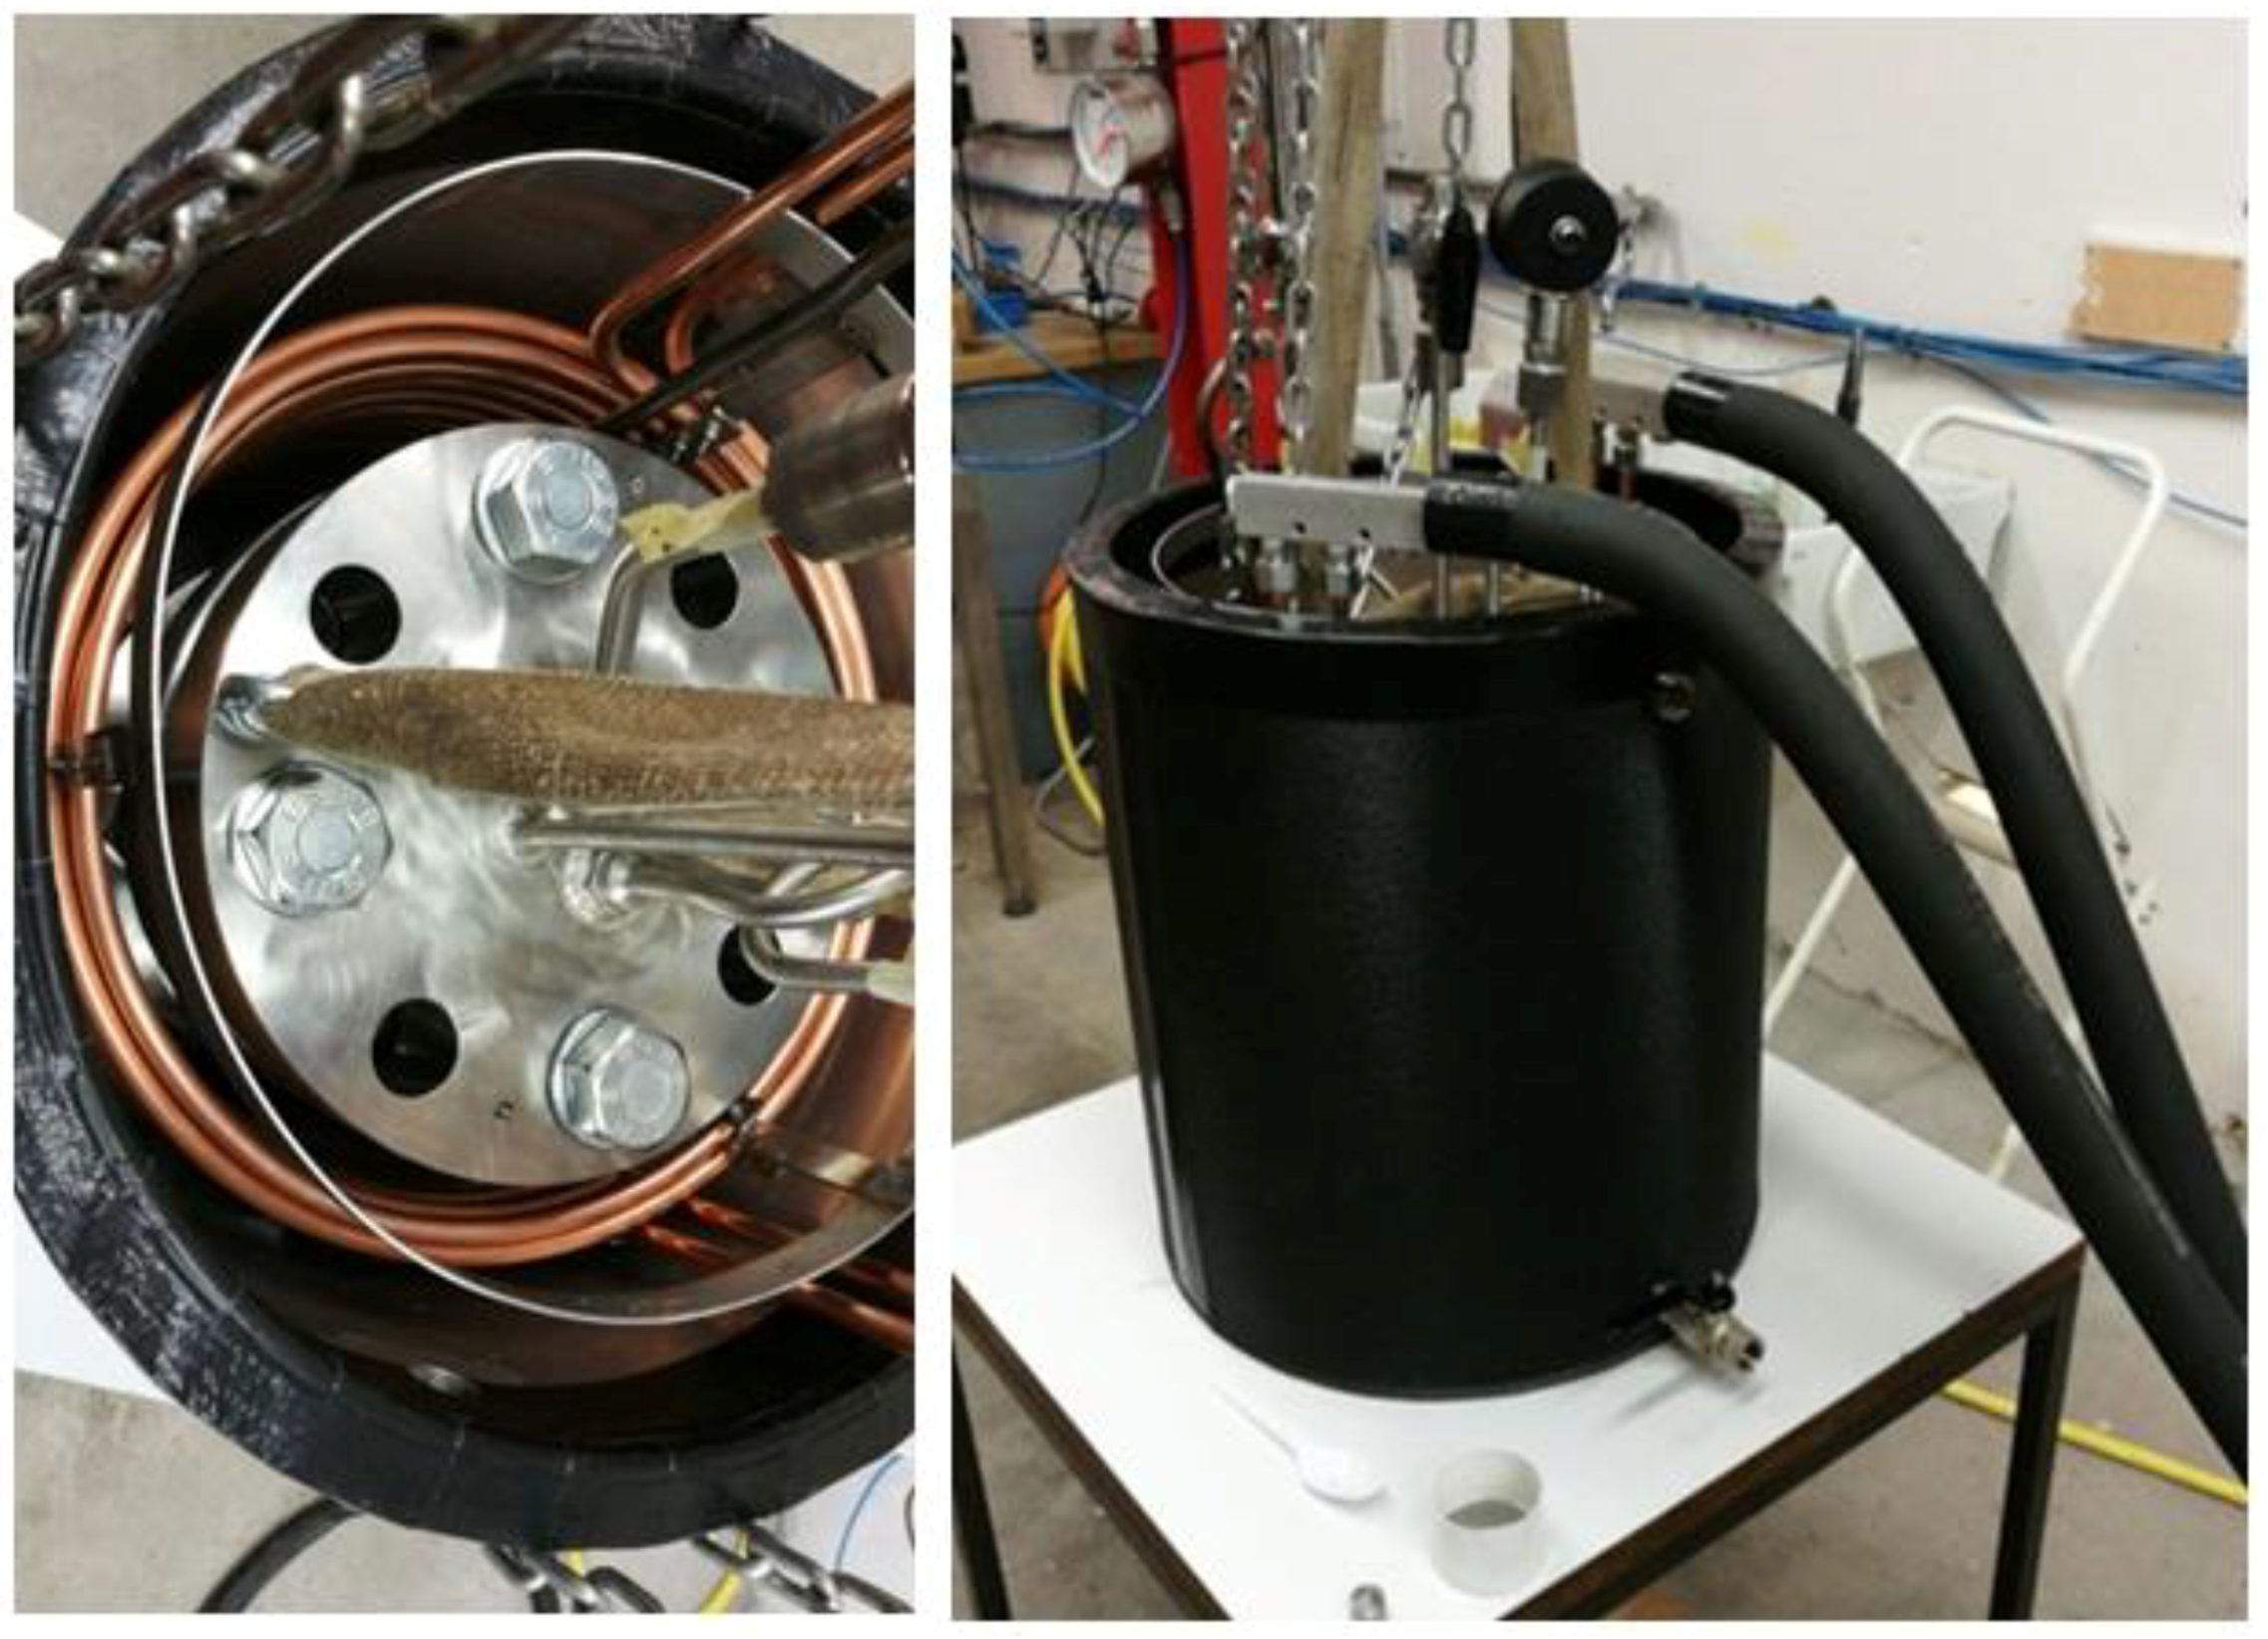
The reactor is built in 316 stainless steel and has a 0.073 m internal diameter, a 0.2 m length and a 0.0076 m wall thickness. The reactor is closed by two plates of 0.047 m thickness, which have several ports to connect the input and output gas lines and instrumentation. Flanges are secured by bolts. The vessel is designed to withstand a 15 MPa internal pressure. The reactor is positioned inside a thermostatic bath to ensure temperature control, as shown in Figure 2. The lower flange has one central 3/8” port, used for methane injection. The upper flange has several gates: (i) one central inlet is used for CO2 injection, (ii) gates are used for positioning four thermocouples, (iii) one gate is used for checking valve and pressure gauge, (iv) one outlet is used for gas recovery.
The CO2 inlet is equipped with ¼” tube to inject the CO2 inside the hydrate sediment. The four 1-mm K type thermocouples are inserted in the reactor at different depths through a high pressure multi-sensor fitting (supplied by Spectite, Hillside, Illinois, USA). Thermocouples are called T16, T11, T07 and T02 and are located inside the reactor at different depth: these are respectively 16, 11, 7 and 2 cm far from the upper flange. A pressure release valve and a digital manometer (supplied by Kobold, Settimo M.se Milano, Italy) are inserted in the third gate to monitor the headspace pressure and provide depressurization in case of pressure increase above the nominal value. The fourth gate is used to recovery methane after dissociation and CH4-CO2 replacement. Gas flows are monitored by mass flowmeters (El-flow Series) supplied by Bronkhorst (Ruurlo, The Netherlands), calibrated for CH4-CO2 flow rates of 0–4 Nm3h−1. Instruments are connected to a National Instruments (Austin, TX, USA) data acquisition equipment for monitoring and recording experimental data. A gas chromatograph (model CP 4900 Micro-GC Varian, Agilent, Santa Clara, CA, USA) was used for gas chromatographic analyses. Periodic measurements with certified mixtures were performed to evaluate the uncertainties, which are always lower than 1%, ensuring an excellent repeatability on sequences of samples [34].
2.2. Materials
The vessel is filled with quartz sand grains characterized by the following properties: (i) a mean particle diameter of 200 µm; (ii) sand porosity equal to 34%. For accumulation of gas and pressurization, a 0.01 m headspace is left over the sand deposit. Water is added to the sand to reach the targeted initial water saturation. Gas bottles of methane and carbon dioxide (99% purity) are provided by Air Liquide Italia Service (Lanuvio, Rome, Italy). Internal volumes are given in Table 1.
2.3. Experimental Procedure
The experimental investigation starts with CH4 hydrate formation. It is then followed by CO2 injection.
2.3.1. Hydrate Formation
The procedure starts when the experimental apparatus has an internal temperature in the 275–277 K range at a pressure of 0.1 MPa. Methane is injected in the closed vessel through the inlet port at the bottom plate and it flows through the sand occupying the sediment pores and the empty head space. CH4 moles injected inside the reactor are measured by CH4 flowmeter.
Gas injection is stopped when the pressure reaches the initial value Pi (usually in 40–50 bar range), then the closed system is cooled down to the initial temperature. At these conditions, the system is in the hydrate thermodynamic region and hydrate formation starts. During the hydrate formation, since gaseous methane is entrapped into the hydrate phase, the internal pressure gradually decreases. Reaction heat causes a noticeable temperature increase. The thermostatic bath removes reaction heat and ensures temperature control.
The formation test is considered completed when all the thermocouples measure the initial temperature, and the internal pressure goes back to the equilibrium pressure.
The number of hydrate moles formed in the system are calculated with the Equation (1) given in [35]:
where:
- Pi and Pf are respectively the initial and final system pressure;
- Zi and Zf are the compressibility factors, calculated with the Peng-Robinson equation
- ρhyd is the ideal molar density of hydrate, calculated assuming 100% cage occupancy.
Pore space saturation is calculated with Equation (2) given in [35]:
The final system pressure Pf is the final equilibrium pressure for methane hydrate at the given temperature. Since Pf is fixed, the number of hydrate moles, and then pore space saturation, depends on the initial pressure Pi reached with the gas injection.
To evaluate experimentally the amount of the formed CH4 hydrates, it is necessary to dissociate the formed hydrates and measure the dissociation pressure achieved to establish the number of moles of the entrapped CH4. Gas moles obtained by the hydrate dissociation are calculated with the Peng Robinson equation.
2.3.2. CO2 Replacement
At the end of the methane hydrate formation, when the equilibrium pressure is achieved, the CO2 injection starts with a pure CO2 inlet flow through the CO2 injection valve and a mixed CH4-CO2 outlet flow through the reactor outlet valve.
The CO2 inlet flow is equal to 0.1 Sl s−1: this low value allows to control pressure and temperature. During the CO2 flow, temperature is kept constant while pressure is reduced. This allows to reach suitable thermodynamic conditions for CO2 hydrates formation and to promote the CH4-CO2 replacement process.
At the end of the CO2 injection, the valves are closed and the CH4-CO2 replacement process starts. Before the replacement process, the composition of the internal gaseous phase is determined via gas chromatographic analysis. The process ends with the pressure stabilization due to the hydrates formation.
The outlet valve is then opened and the internal pressure reaches 0.1 MPa. The vessel is closed again and the hydrate dissociate with the gas release. CO2 and CH4 volume fractions in the released gaseous phase are assessed via gas chromatographic analysis and the obtained CH4 and CO2 moles are calculated with the Peng Robinson equation.
2.4. Membrane-Based Gas Separation Process
In the experimental process, the CO2 injection is performed through the upper central tube which ends in the NGH sediment.
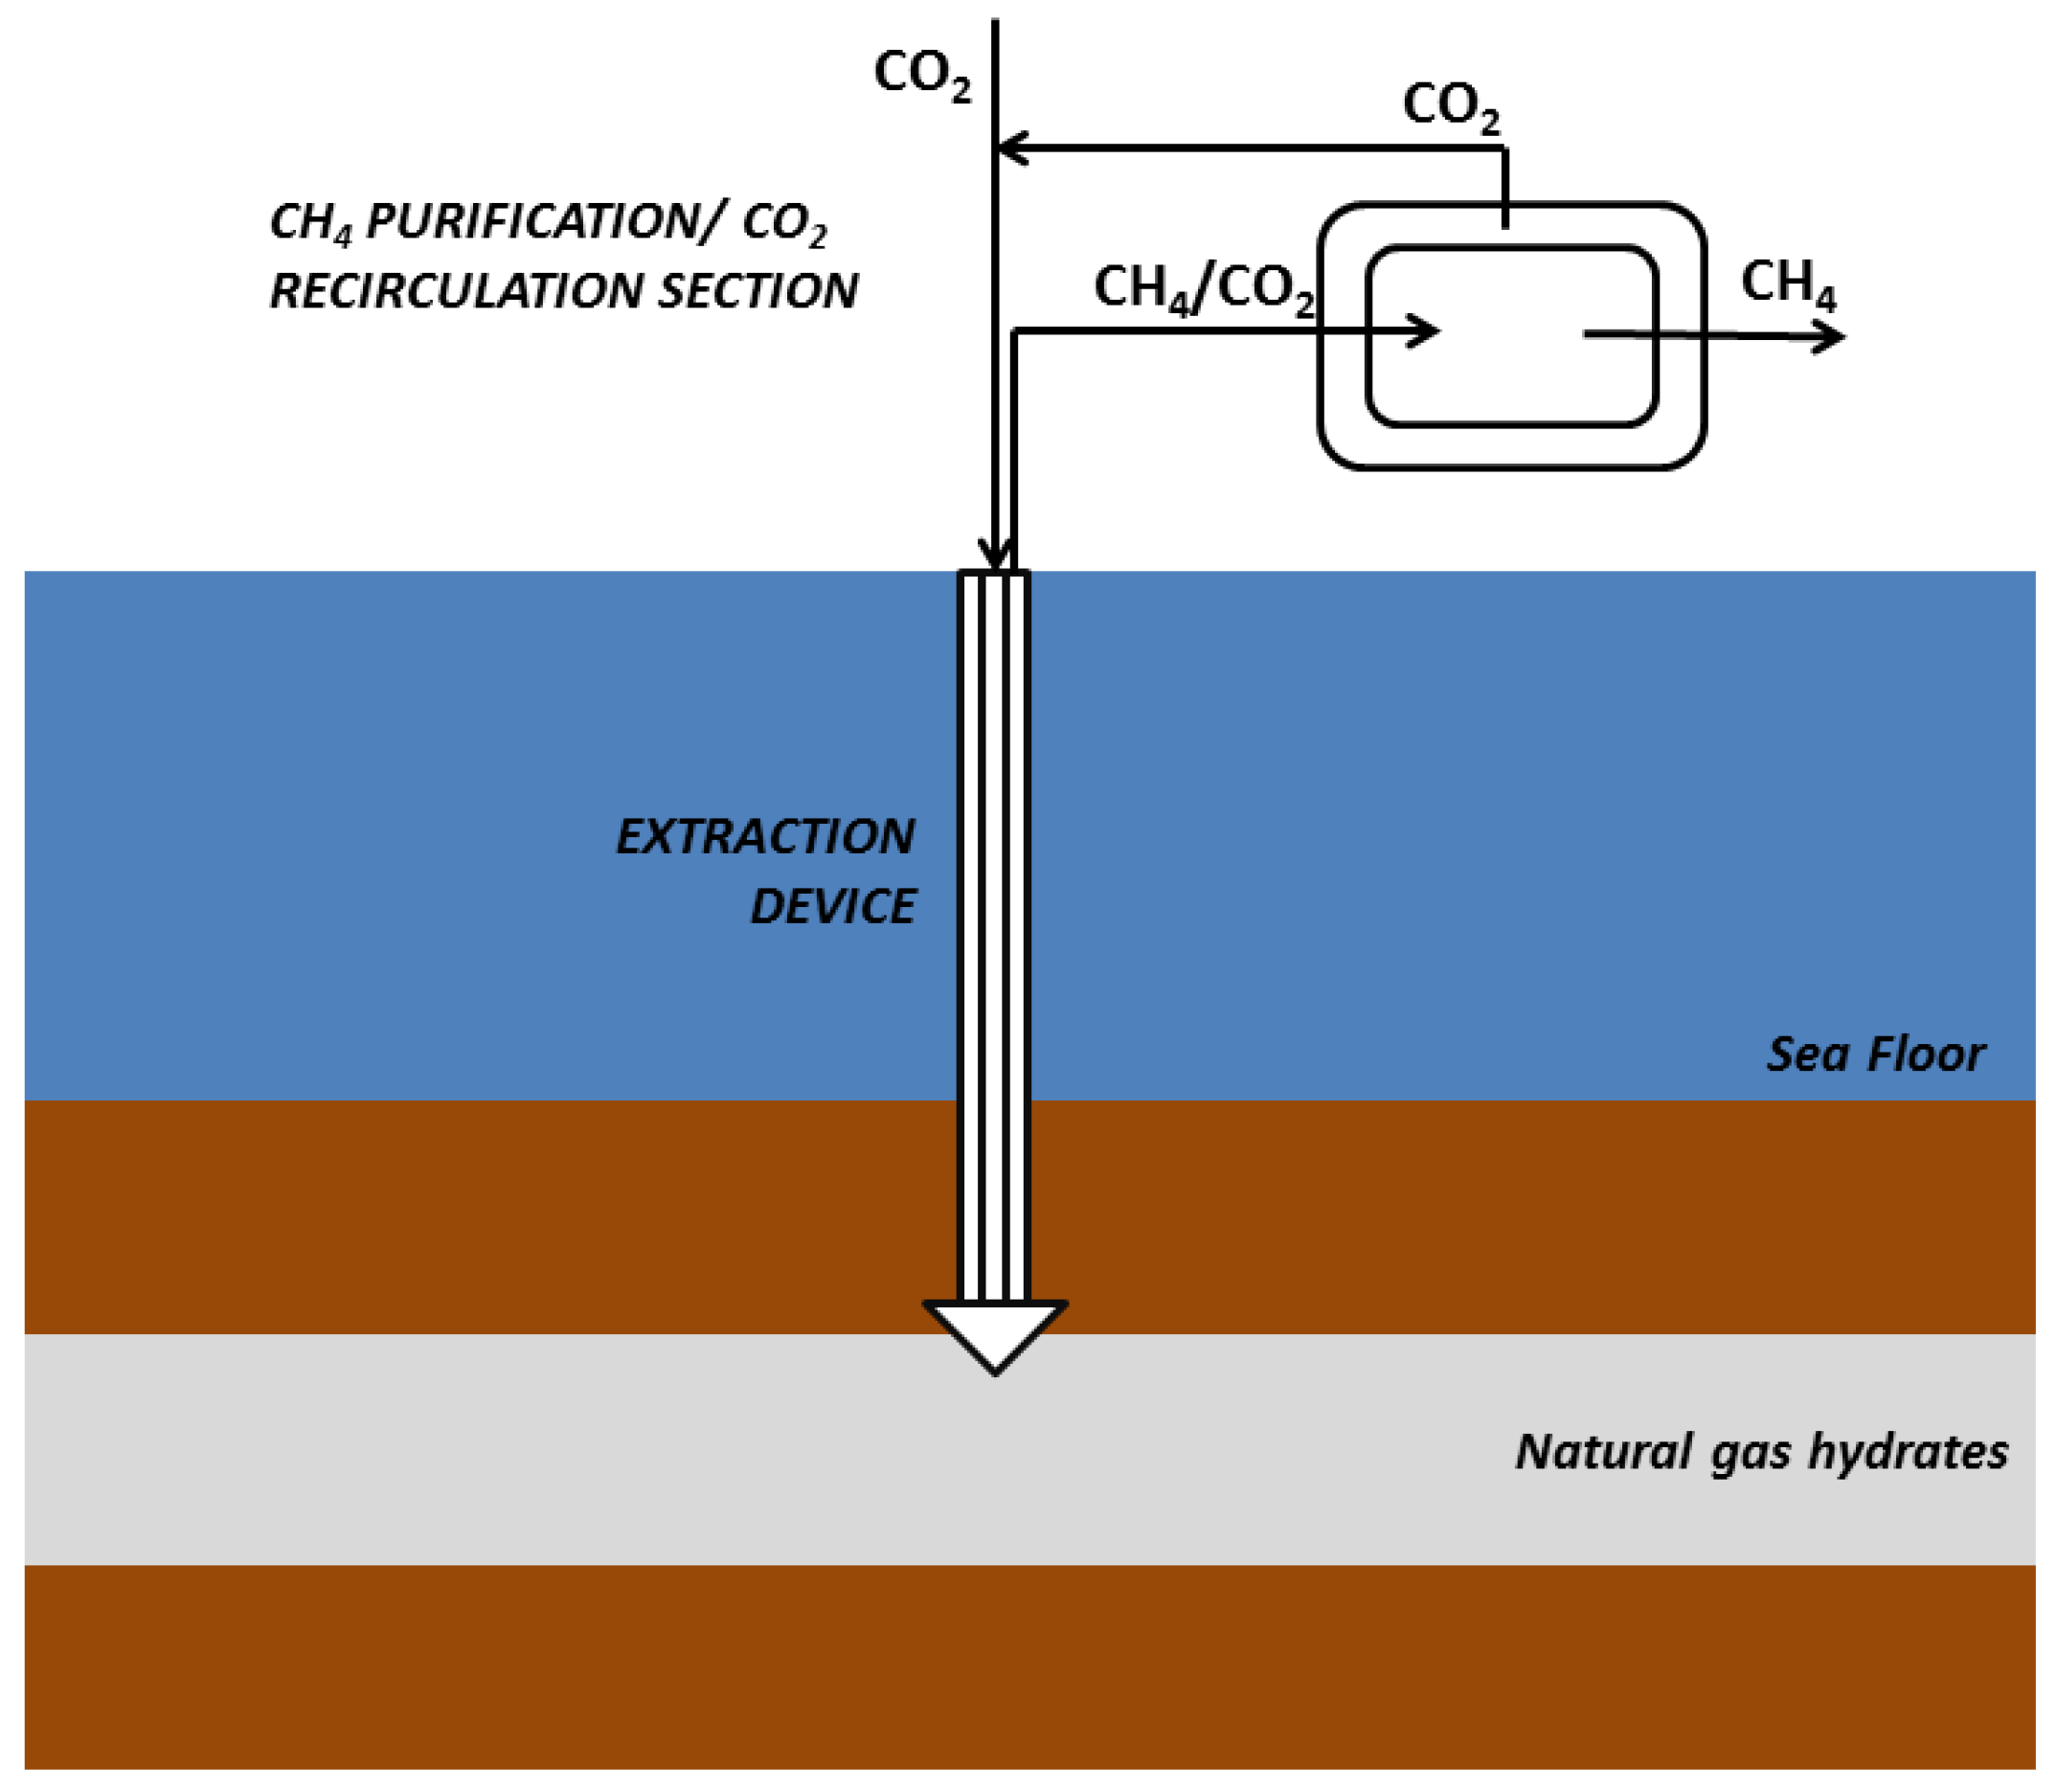
In ideal conditions, the replacement occurs with a 1:1 carbon ratio, resulting in the recovery of pure methane. In real field conditions, instead, the result of the CH4-CO2 exchange is a CH4-CO2 gaseous mixture. To pursue pure natural gas recovery and a simultaneous massive CO2 sequestration, an integrated process is proposed: the recovered gaseous mixture is sent to a membrane-based separation section in which CH4 is separated from the CO2, which did not take part in the exchange, and collected. CO2 is recirculated and injected again in the internal sediment for another replacement cycle. Figure 3 shows a drawing of the proposed process integrated with the in-field methane recovery system from the NGH sediment.
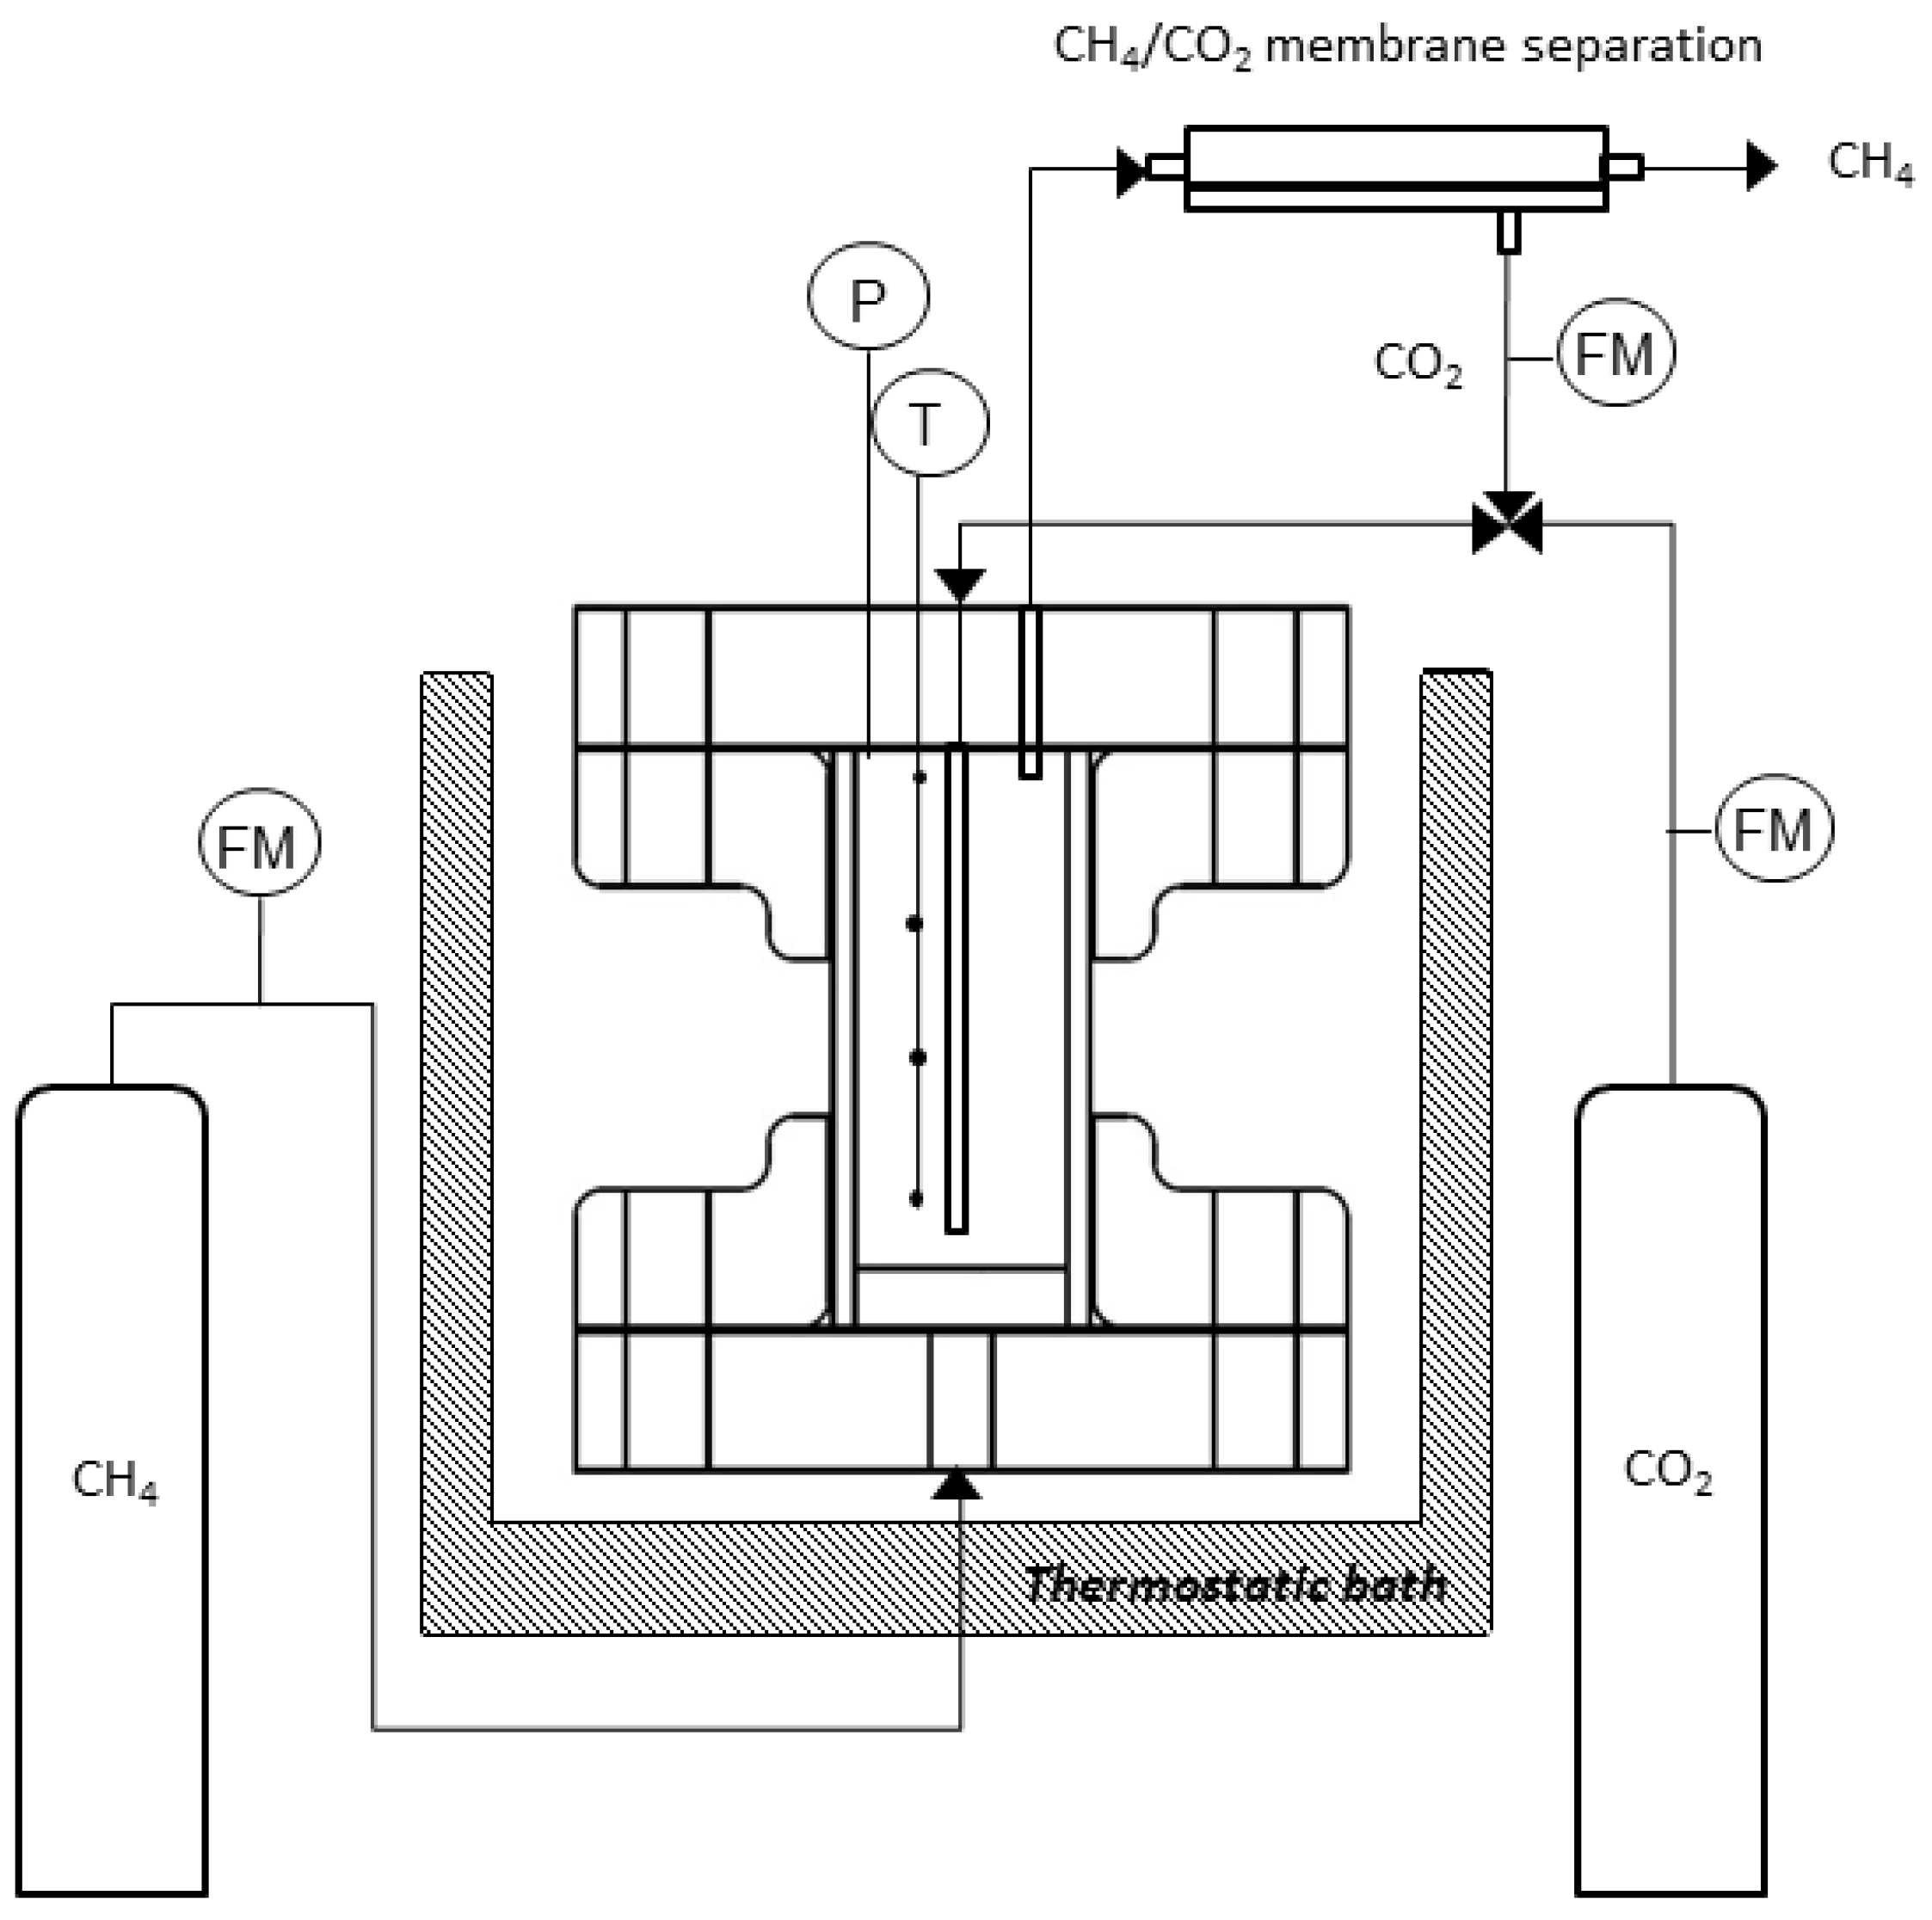
The purpose of the membrane-based gas separation section is the separation of the recovered CH4 from the CO2 which was not encapsulated in the hydrate phase. The schematic of Figure 4 proposes the integration of the separation section with the experimental apparatus (the last one already in operation).
The selected membrane is formed by hollow fibers. They are small silicone micro-tubes with very thin walls (PDMSXA-10, PermSelect, Ann Arbor, MI, USA). The selected membrane module has 30 hollow fibers with a 10 cm2 surface area. Technical data are shown in Table 2.
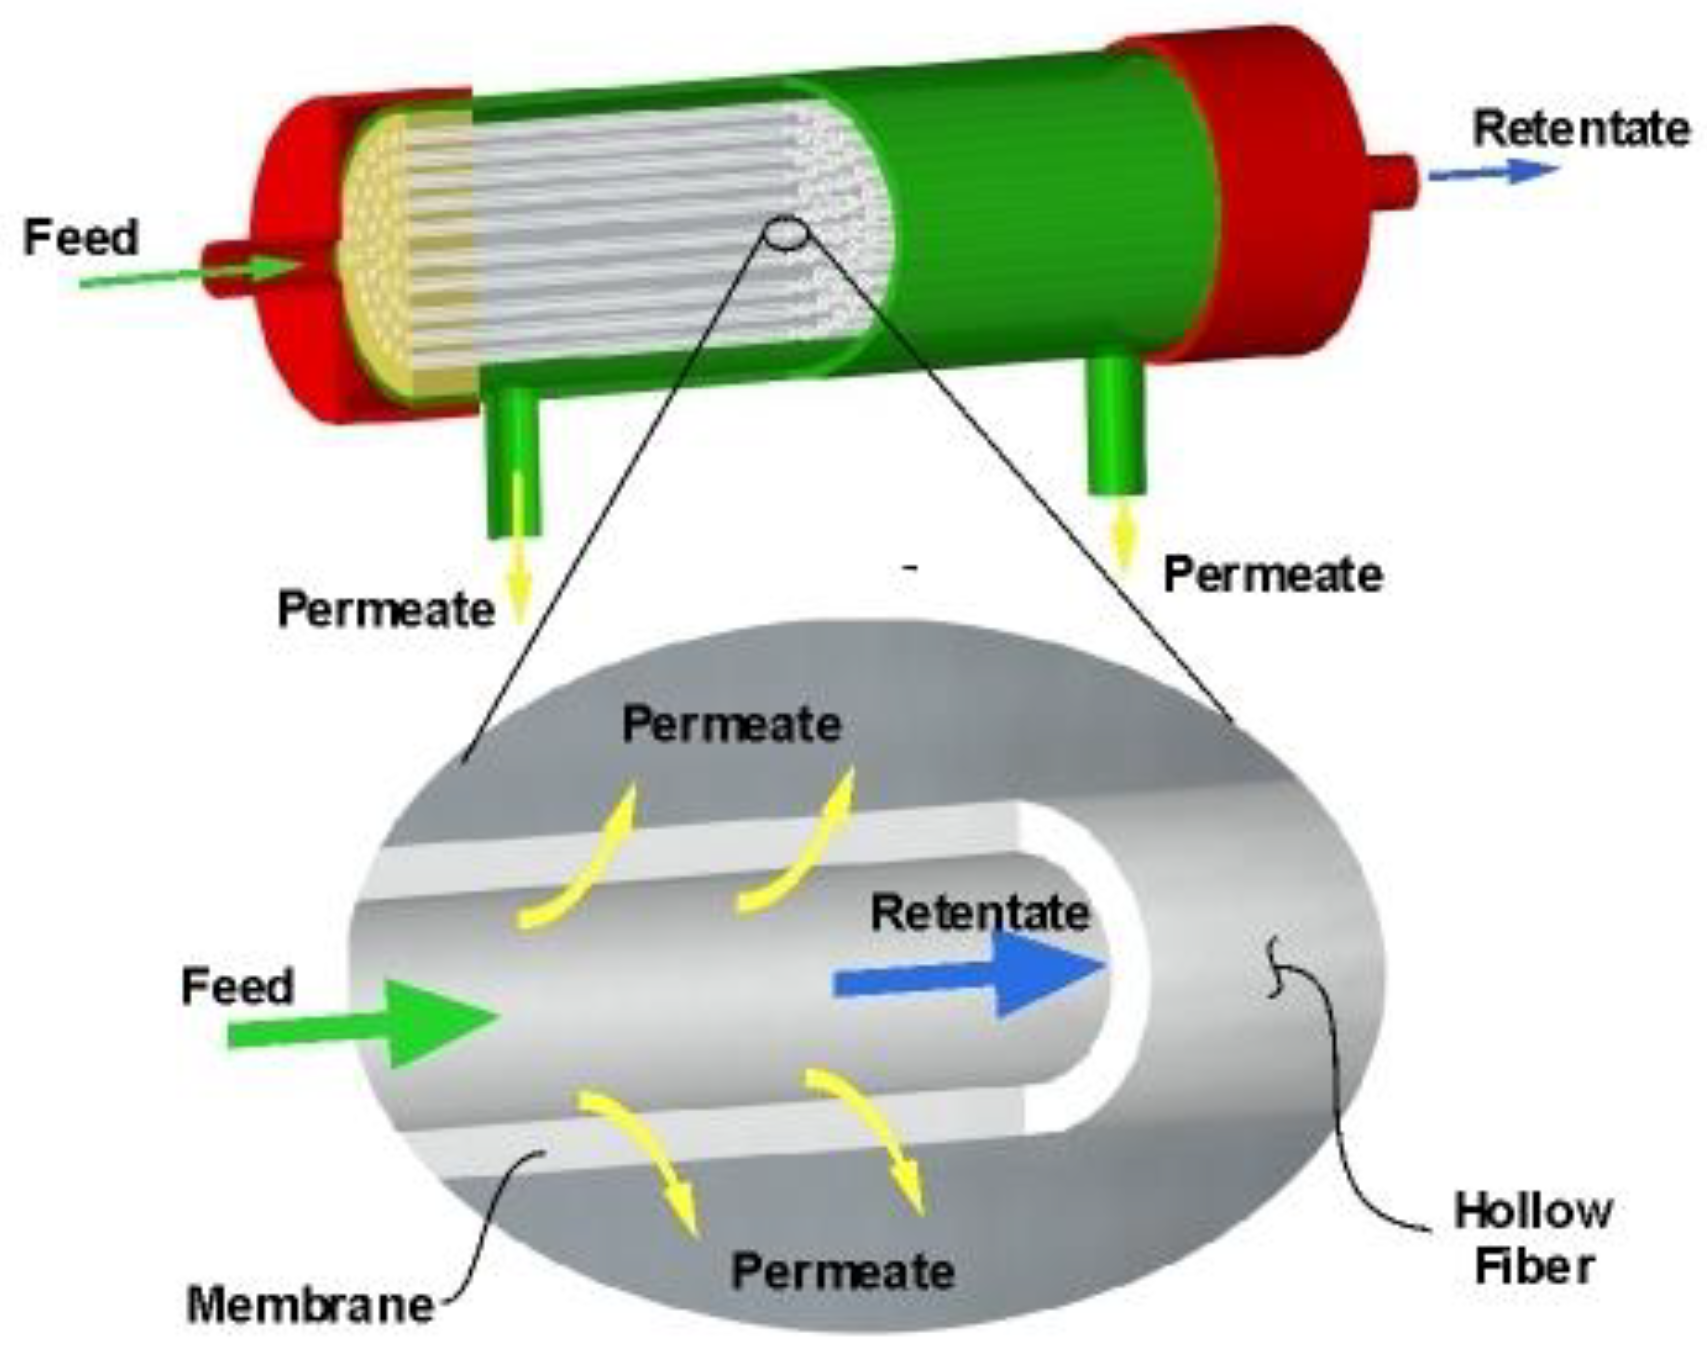
The permeability difference between gases controls the separation in the fibers. The permeability coefficient is defined as the rate of gas permeation per unit area, per unit membrane thickness, per unit transmembrane driving force. The permeability coefficient, at 298 K and 0.1 MPa, for CH4 is 950 barrer while for CO2 is 3250 barrer [36]. The CH4-CO2 mixture is injected inside the membrane module via the inlet port to the tube side and then flows through the hollow fibers, as shown in Figure 5.
CO2 has the highest permeability and permeates across the thin silicone walls because of its partial pressure difference between the inside and the outside of the hollow fibers. The transferred gas, CO2, is called the permeate. The retentate exits the outlet of the tube side and it is fromed by a gas mixture with a higher concentration of methane.
3. Experimental Results
In this section, results of the experimental tests carried out in laboratory are presented and discussed.
3.1. Hydrate Formation
An experimental test with a hydrate saturation equal to 10% was carried out to obtained experimental data useful for energy and environmental analysis of the membrane based integrated process. A 10% hydrate saturation was chosen because a good solution to well simulate the hydrate deposit conditions and effectively control temperature is to maintain a low sand pore saturation. In Table 3 the experimental conditions and the obtained results are showed.
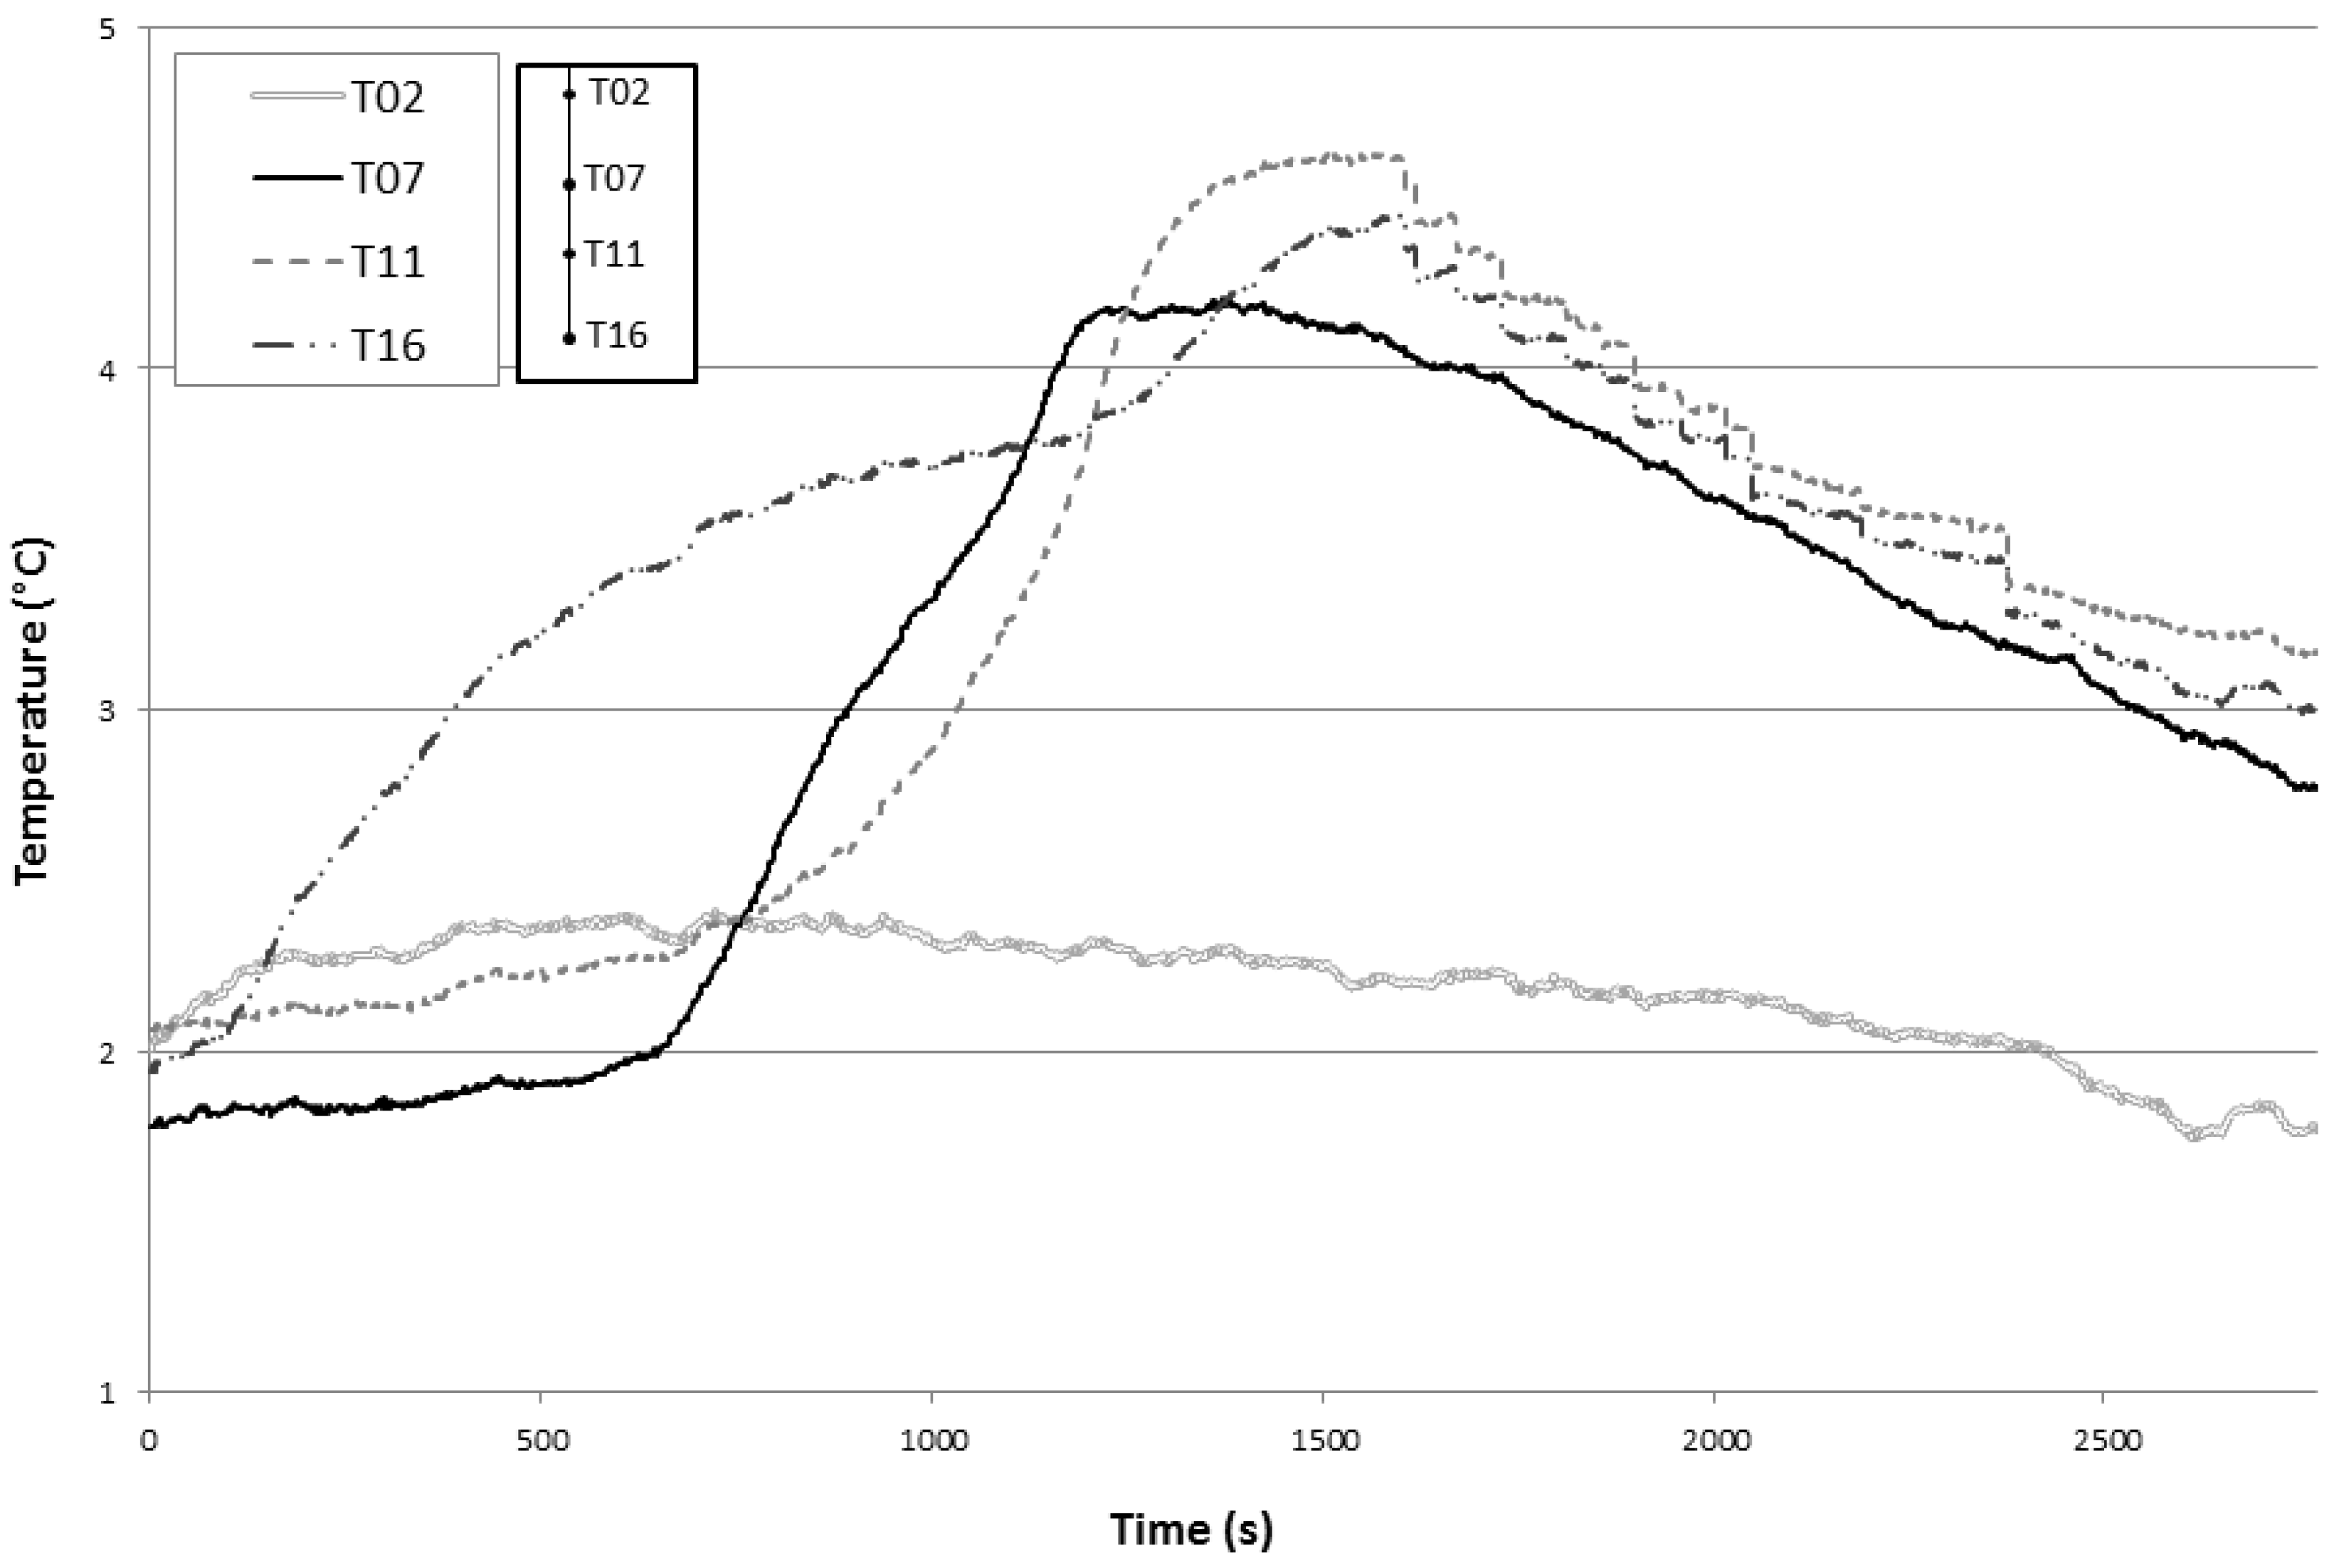
Test 1 was carried out at 10% hydrate saturation with an initial pressure and temperature respectively of 42.0 bar and 1.0 °C. To reach the initial pressure equal to 42.0 bar, 0.2307 moles were injected. The equilibrium pressure achieved at the end of the hydrate formation phase was 28.3 bar. At the end of the test, the dissociation pressure, which was reached inside the reactor because of the hydrate dissociation, was equal to 16.5 bar corresponding to CH4 moles in the hydrate phase equal to 0.0769. Assuming an ideal hydration number equal to 6 and considering the negligible methane dissolved in water at system conditions (0.0012 mol kgH2O−1), a total of 0.948 moles of water are required in the hydrate formation. Figure 6 shows temperature profiles when the methane hydrate start forming in Test 1, carried out with saturation of 10%.
Figure 6 shows the temperature vs. time diagram, in which the temperature increase due to the exothermic nature of the formation is visible. Temperature increase due to hydrate formation is bigger in the lower part of the reactor (corresponding to thermocouples T11 and T16), while in the upper part (T07), temperature starts increasing previously but it then decreases sharper. The thermocouple T02 is positioned in the headspace, where only gas is present and there is no sand, temperature remains quite constant, suggesting no hydrate formation in this area.
The temperature increase in the middle part of the diagram shows the exothermic nature of the hydrate formation process, and this is particularly noticeable in a small scale reactor like this. In order to avoid that thermodynamic conditions strays from the equilibrium curve, it is necessary to cool the reactor and then reducing the peak amplitude, achieving the previous temperature value as soon as possible. Monitoring temperature is also necessary to obtain the same value both at the beginning and at the ending of the test.
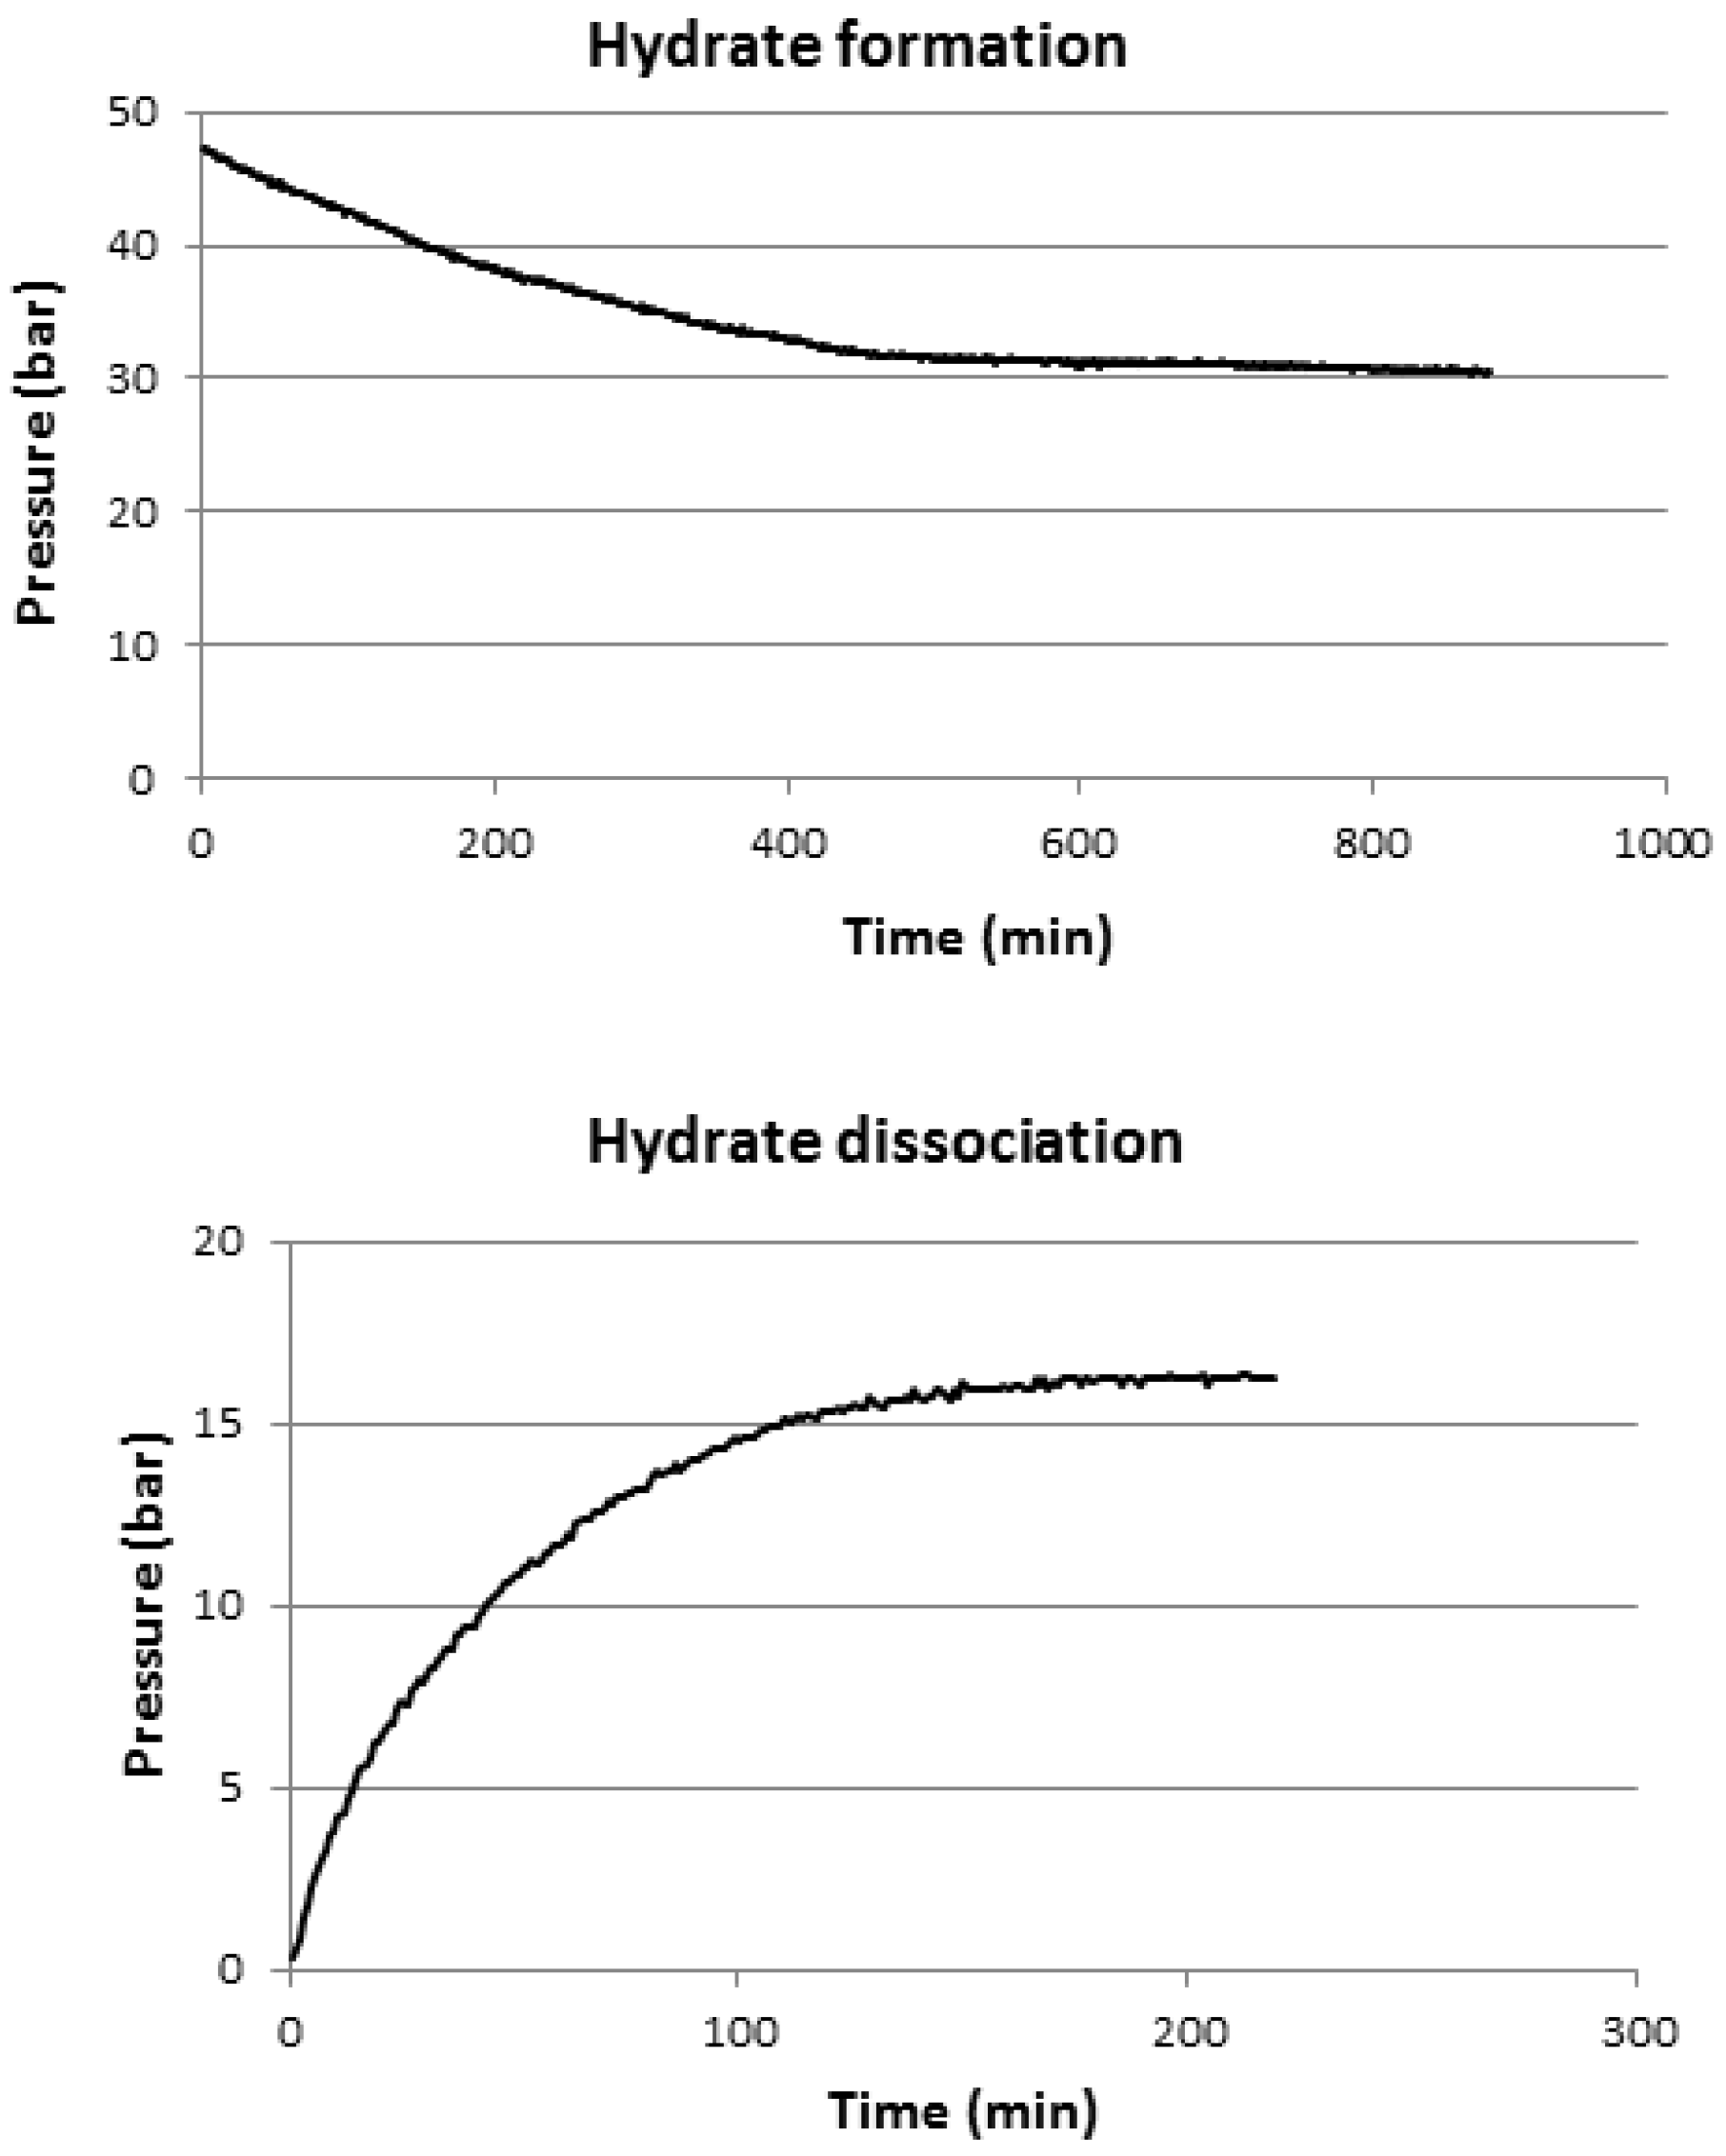
CH4 hydrate formation starts in the T07 region and, and then it moves towards the T11 and T16 regions. This is consistent with other experimental results. Zhou et al. [38], in a 60 L reactor, found that hydrate formation starts from the gas-liquid interface in the top head space and then the hydrate formation front improves downward, thanks to the larger free water availability in the lower part of the reactor. From this comparison, it appears that temporal and spatial distribution of the CH4 hydrate formation does not depend on the reactor’s size. Figure 7 reports pressure profile during the formation and dissociation process for Test 1.
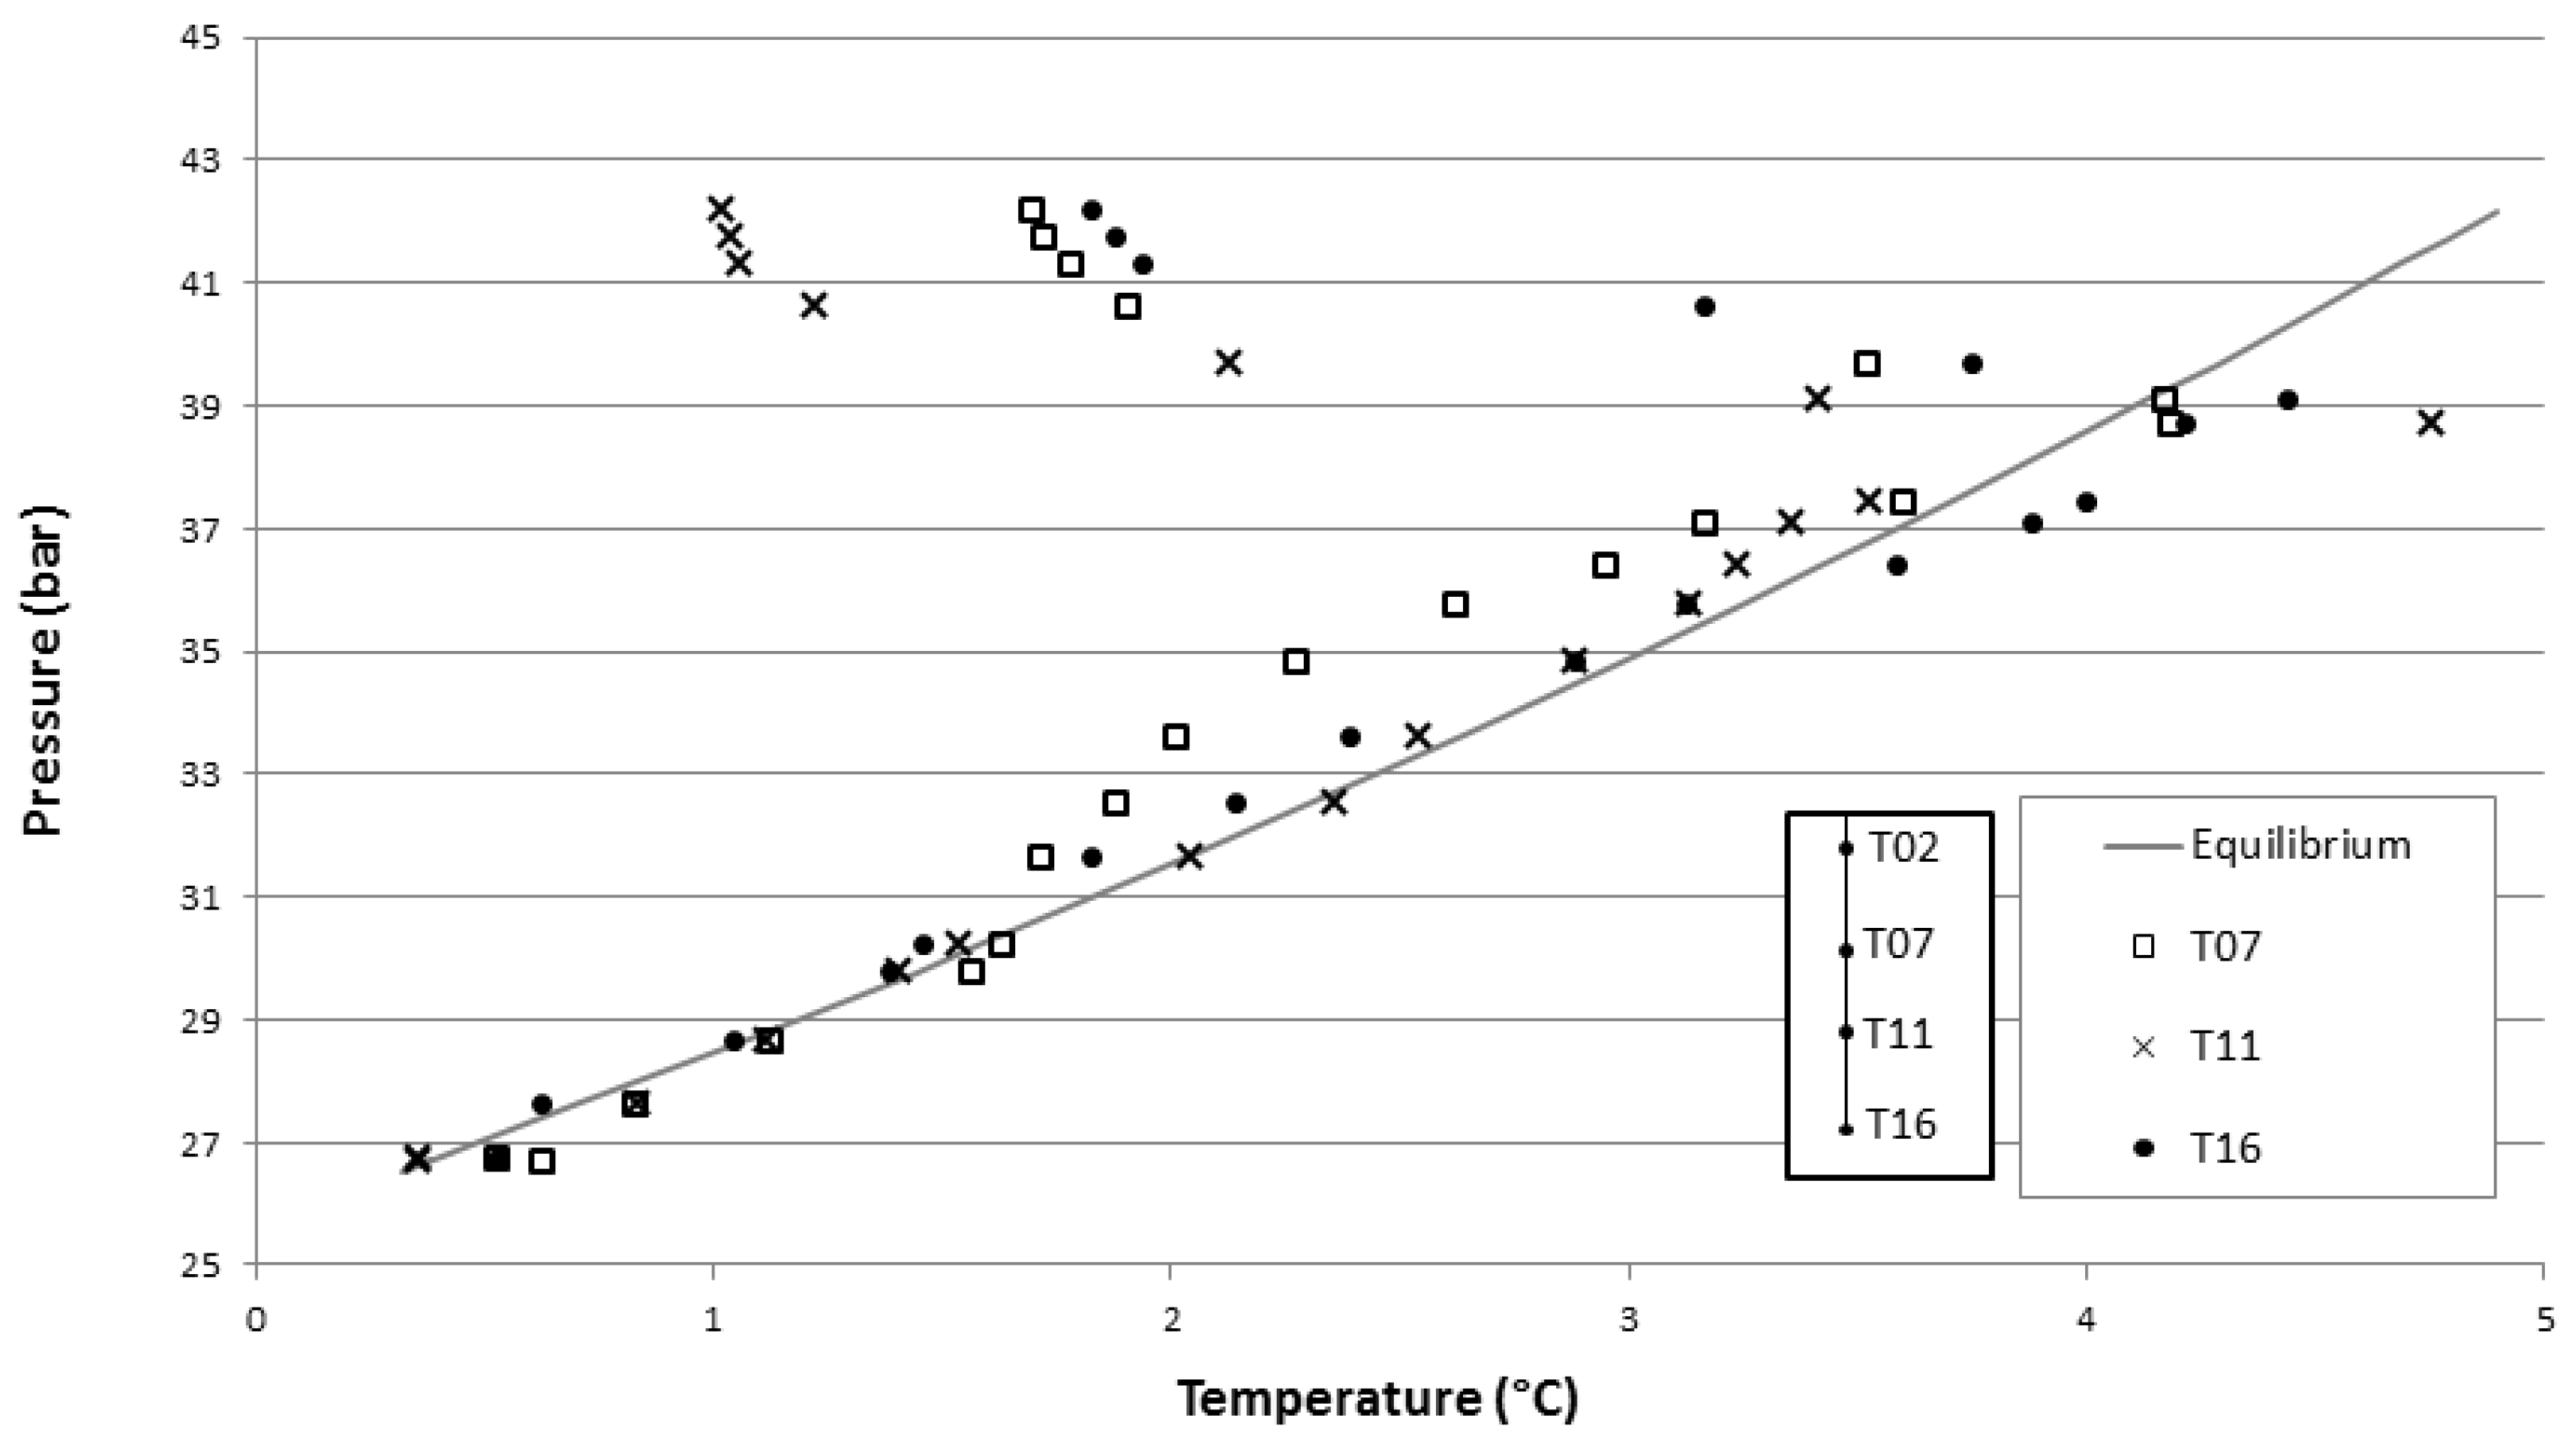
The hydrate formation causes a pressure decrease due to the methane adsorption inside the clathrate solid structure. Once pressure is stabilized, the reactor was opened to eject all gaseous CH4 present inside. Then the vessel was closed again and pressure started increasing, due to the hydrate dissociation and the releasing of methane from solid to gaseous phase. In both situations the pressure variation happens in the first hours, then it assumes an asymptotic trend until reaching the equilibrium value. Figure 8 shows the pressure-temperature graph, in which the theoretical thermodynamic conditions and the experimental one are compared.
The distance between the theoretical line and experimental points is greater in the upper area, corresponding to the hydrate formation beginning, or when reaction has not involved yet the whole reactor internal volume. The temperature increase due to the formation reaction moves the experimental conditions towards the equilibrium line and during hydrate formation there is an overlap between T07, T11 and T16 points and the equilibrium graph until the hydrate formation is completed.
3.2. CO2 Replacement
The CO2 replacement was carried out by depressurization of the internal environment; the substitution was then started by bringing the reactor from the value of 28.3 bar to a pressure of 20.4 bar. In Table 4 values of the experimental parameters are shown.
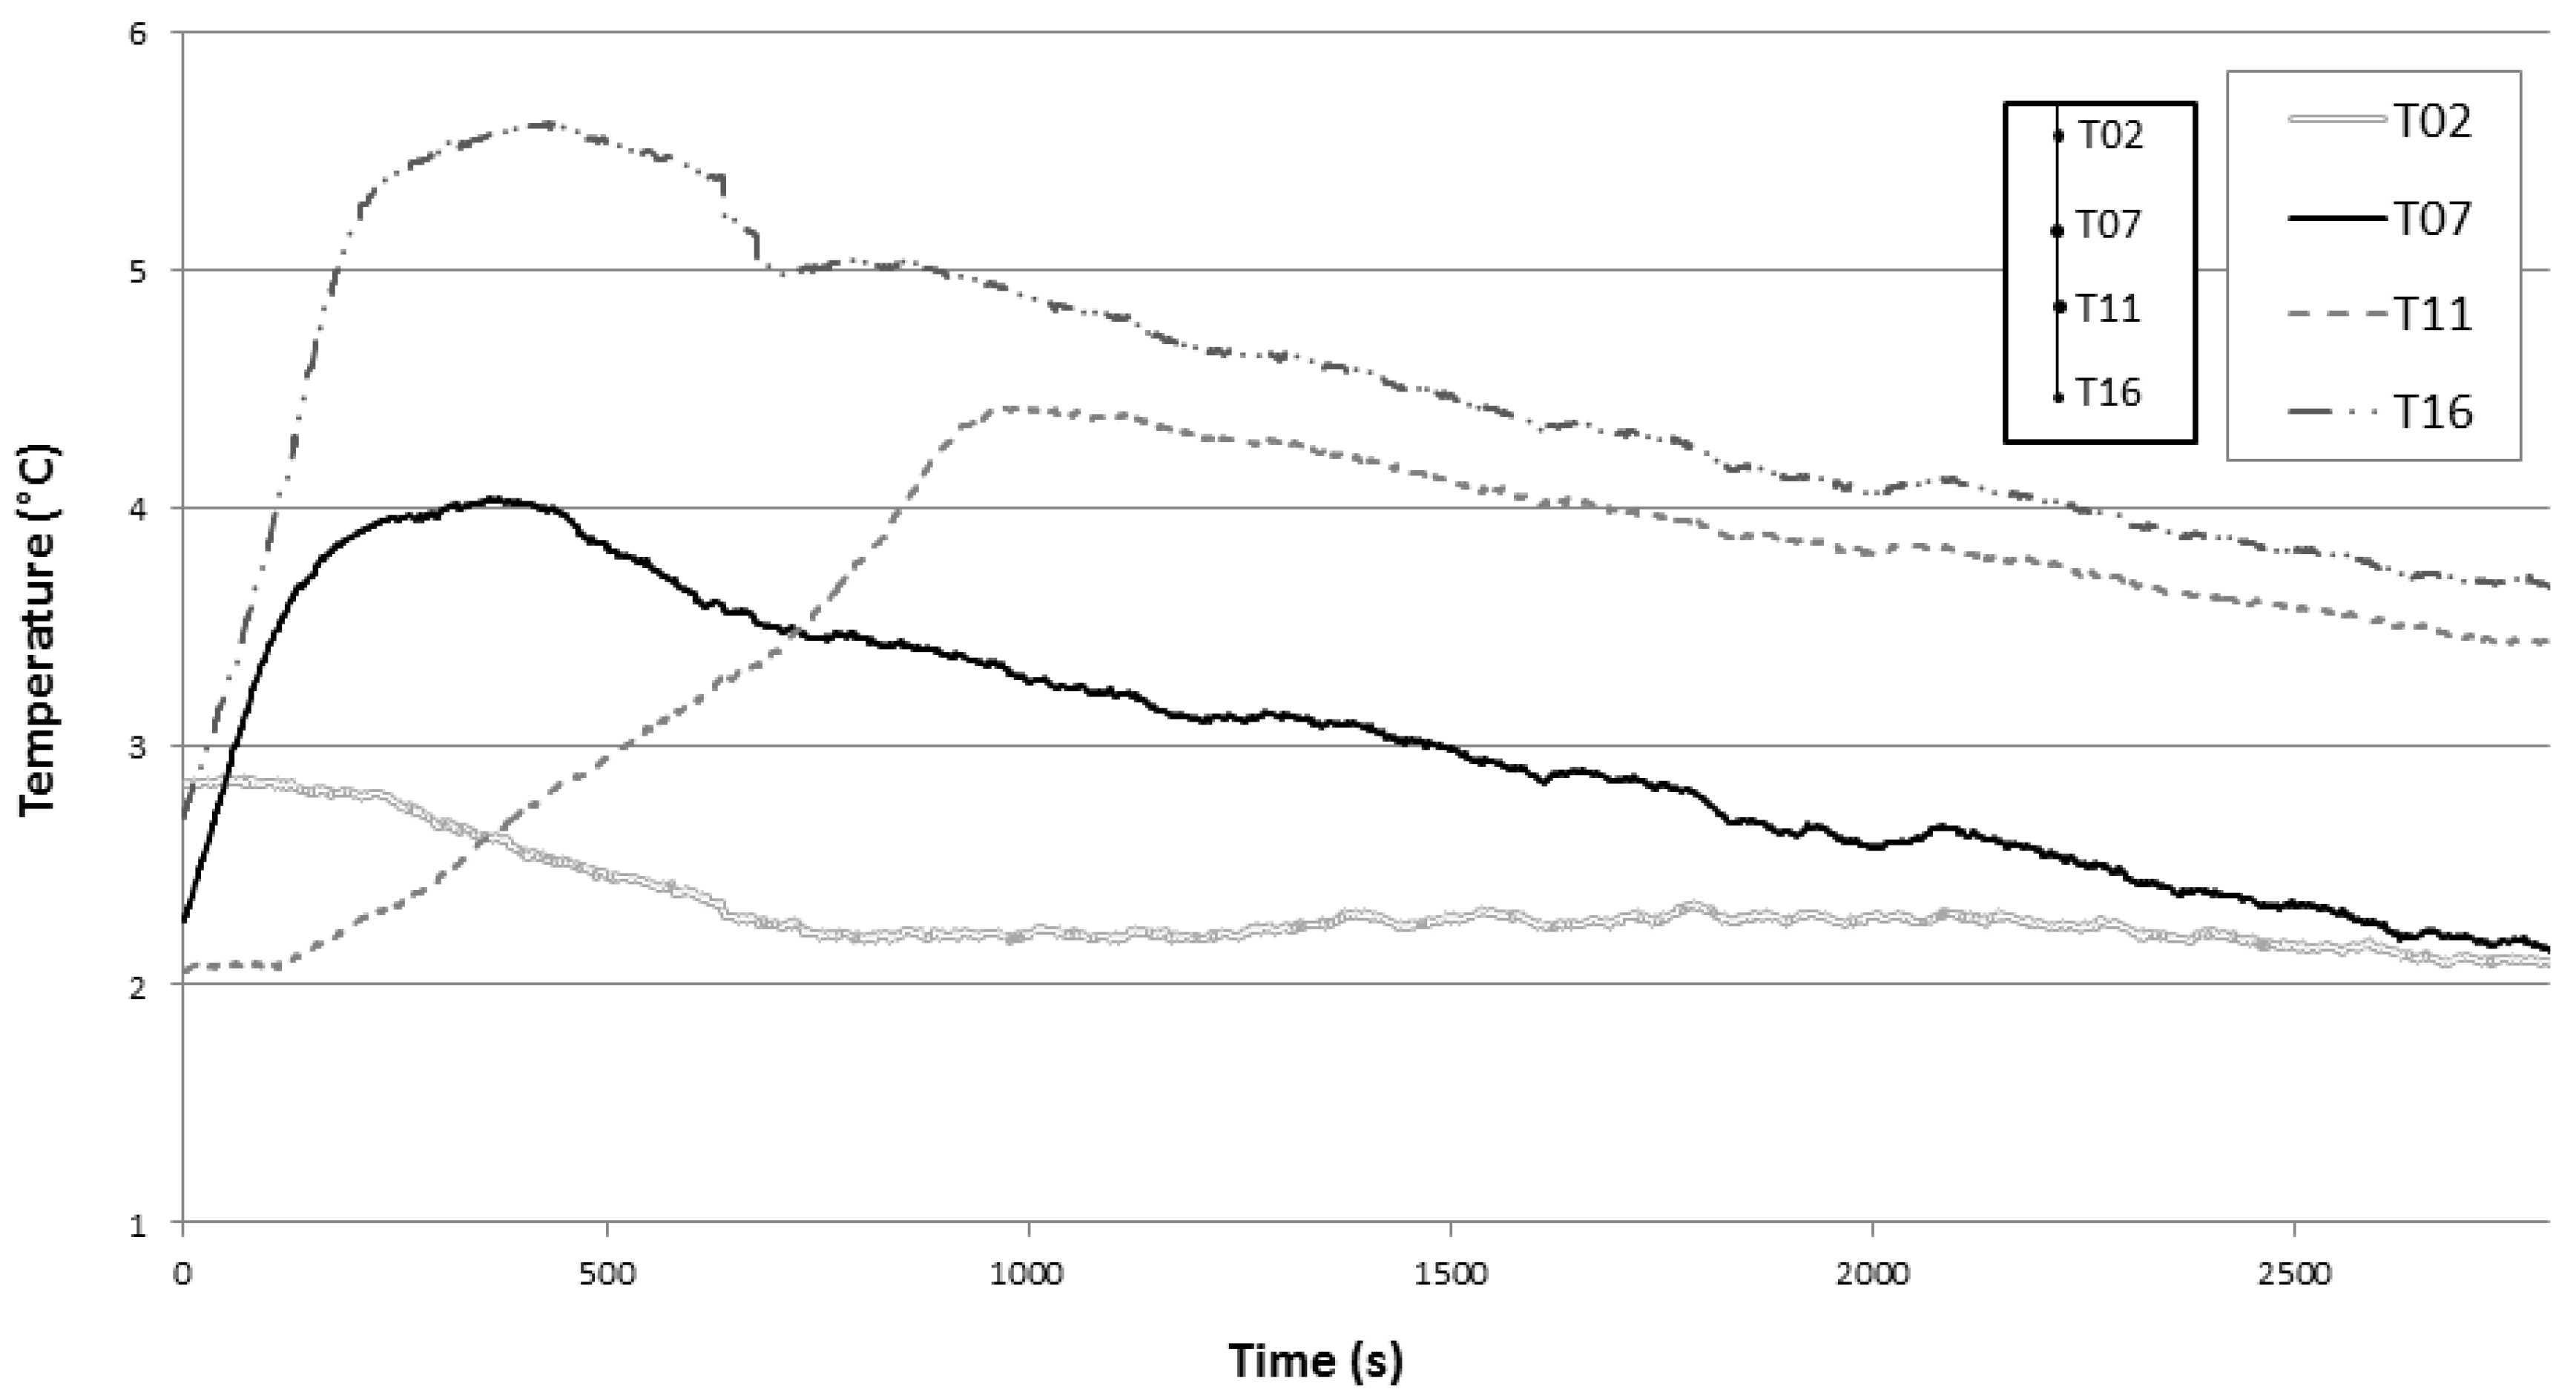
CO2 injection started and continued for 1620 s. After that in the reactor 0.119 CO2 moles are present. At the end of the CO2 injection, the gas composition is 75.4% CO2 and 24.6% CH4. Figure 9 shows the temperature trends during the replacement test, starting from internal reactor conditions immediately after the methane hydrate formation.
The test starts at an average internal temperature equal to 1.5 °C. Over time, the first temperature peak occurs in the higher part of the reactor at T07, but it is the lowest temperature value reached, with an increase of about 2 °C. The higher temperature value is reached in the lower area at T16, which is the second peak in temporal order. This suggests that the zone involved firstly with an exothermic process is the lower part where the CO2 injection point is located. This is also an area of the reactor rich in water, so the higher temperature increase with respect to the other thermocouples could suggest new hydrate formation rather than a replacement process. A second phase follows in the upper part of the sediment, near the gaseous headspace. The last peak occurs in T11, after few minutes, in the central area of the reactor.
The comparison of the obtained temperature peaks in the three different areas of the sediment suggests that a CH4-CO2 replacement took place in the central part of the reactor (T07 and T11) where the formation of CO2 hydrates and the simultaneous dissociation of CH4 hydrates avoided the formation of high temperature peaks.
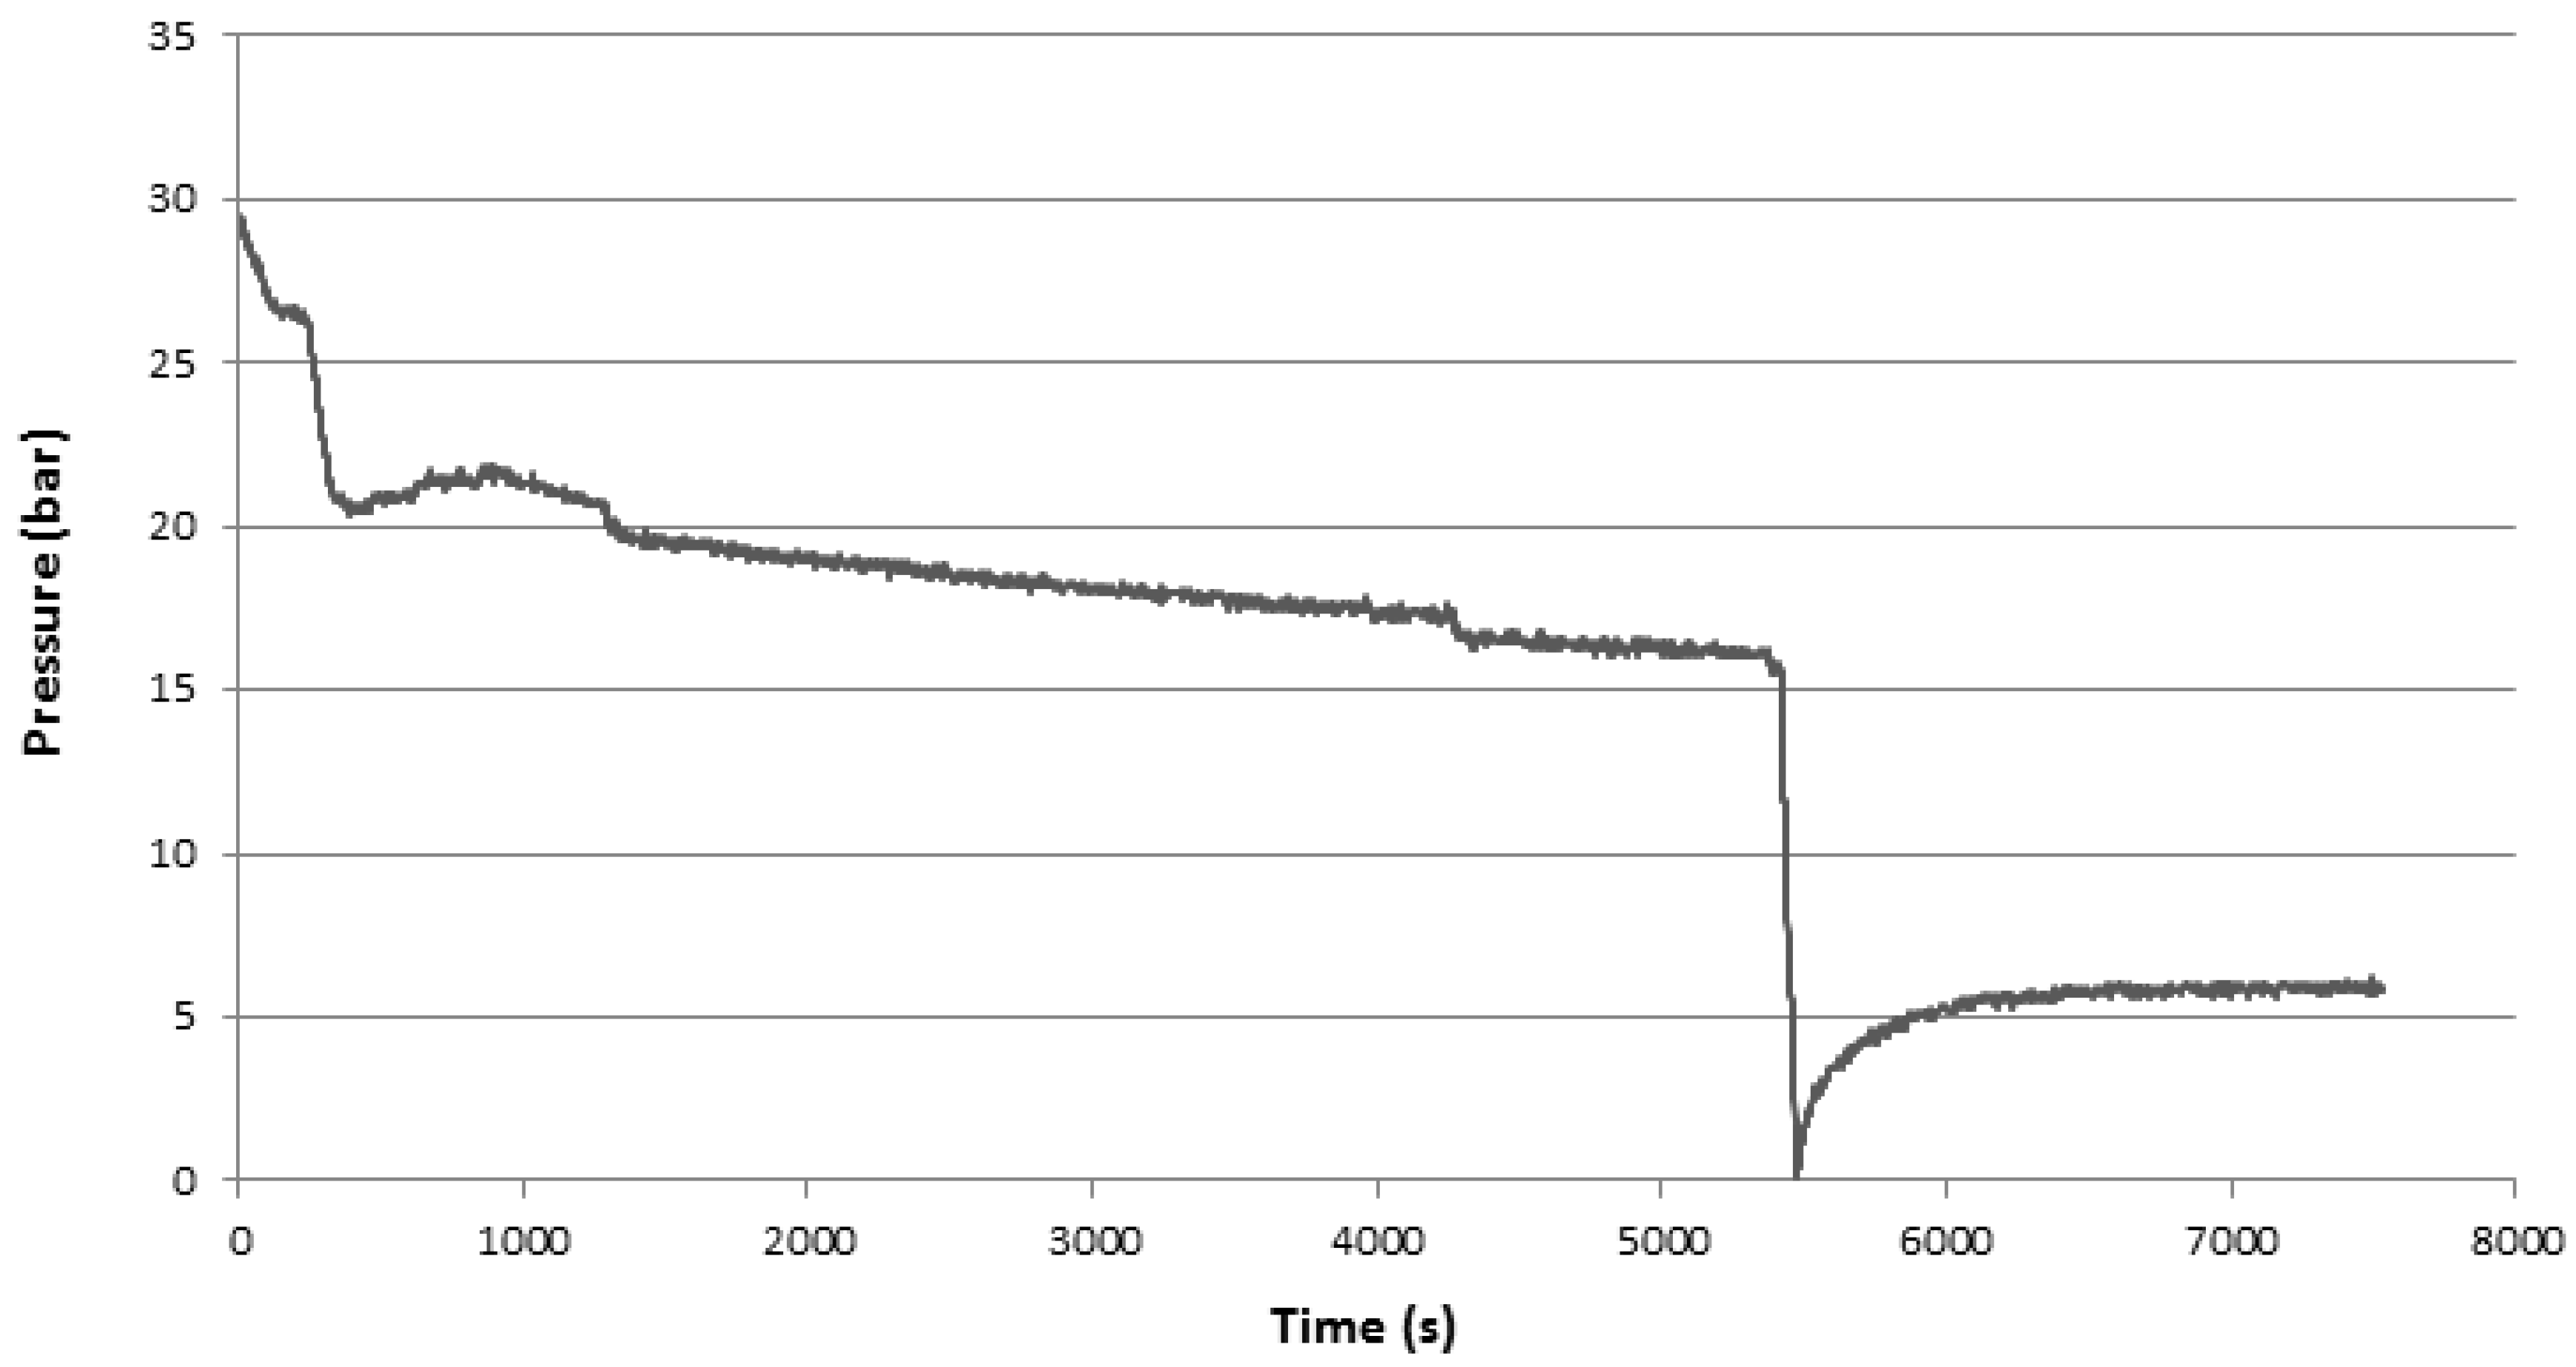
Figure 10 shows the trend of the pressure during the test. In the left side of the graph, is visible the pressure drop made to move below the stability conditions for methane hydrates, while remaining in the CO2 hydrate formation area. The constant pressure drop due to the formation of CO2 hydrates, ends with the reactor opening, carried out to leave only the hydrates formed and the gas contained therein inside. The pressure increase in the right side represents the dissociation process of hydrates and the release of CH4 and CO2 contained in them.
Once the CO2 fluxing was completed, the reactor was closed and a sample of gas was withdrawn to make the gas chromatographic analysis. In this way the concentration of CO2 in the reactor was determined. A second sample was collected and analyzed at the end of the dissociation phase to evaluate the new concentrations of the two gases. Knowing pressure and temperature conditions, it was therefore determined both the number of moles of CO2 present before the starting of the replacement phase, and the number of moles stored in form of hydrate.
The CH4-CO2 hydrate dissociation causes a pressure increase from 1 to 6.05 bar (see Table 3); the gas sample analysis proves that 78.47% of entrapped gas into hydrates is CO2, while the remaining part is CH4. The total gas moles which have formed hydrates are 0.043 mol (0.034 mol of CO2 and 0.009 mol of CH4).
Two parameters are calculated for the described process, in order to quantify the CO2 sequestration and the CH4-CO2 exchange. Capture efficiency is the ratio of the CO2 moles stored in the system through CO2 hydrate formation to the total injected moles (Equation (3)):
The exchange factor is the ratio of the CO2 moles sequestered in the hydrate phase to the CH4 moles produced from the hydrate phase and it gives an extent of the replacement process (Equation (4)). In this case, it is equal to 0.54.
At the end of the process, 0.063 CH4 moles were released from the system and 0.034 CO2 moles were captured in the hydrate phase.
4. Energy and Environmental Evaluations
An energy and environmental evaluation was carried out considering that the replacement process is integrated with a membrane-based separation process, used for the purification of the methane released by the replacement process and for the recirculation of the CO2 separated.
The evaluation is based both on the experimental data obtained in laboratory and on theoretical calculations, in which the energy content associated to the recovered methane is compared to the energy consumption spent for its recovery and for CO2 sequestration.
On the membrane separation section, the following assumptions were made: (i) the composition of the gas flow sent to the membrane separation section is exclusively formed by CO2 and CH4; (ii) with a separation efficiency of 0.98, the retentate gas has a composition in volume of 3% CO2 and 97% CH4; (iii) the permeate is pure CO2, which is recompressed and recirculated in the vessel to take part in the replacement process.
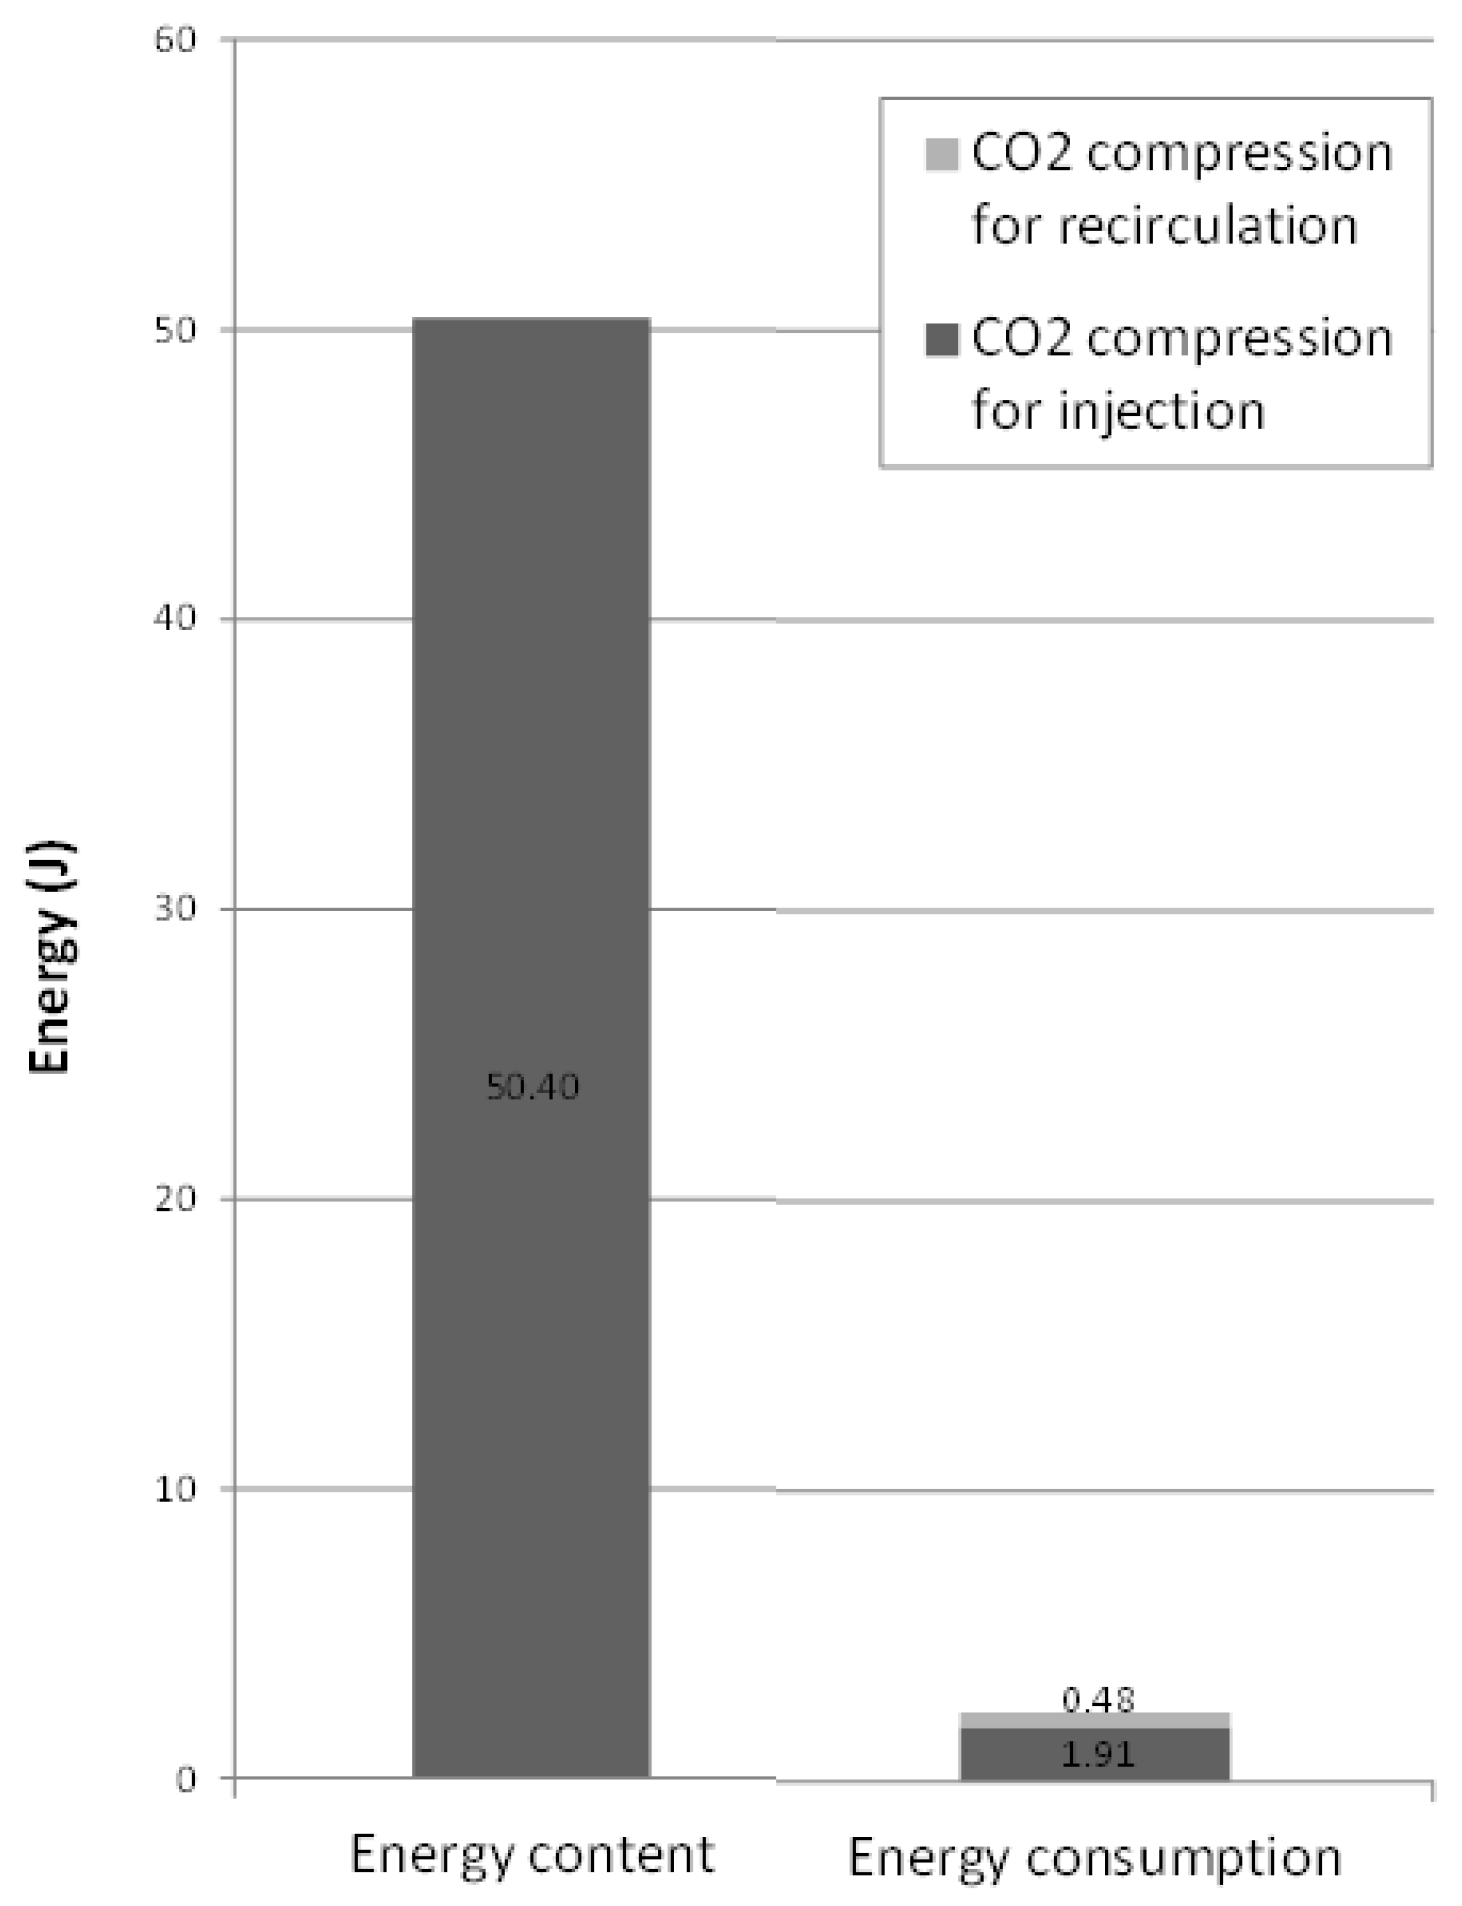
Since the methane heat of combustion is 50,000 kJ kg−1, the energy content of the recovered methane (0.063 mol) is 50.40 kJ. Nevertheless, the CH4-CO2 replacement process presents energy consumption due to: (i) CO2 compression for its injection in the sediment, (ii) compression of the separated CO2 to be recirculated in the sediment. These contributions were evaluated considering the following assumptions. The compression work was calculated considering the compression as a multi-stage adiabatic process with a compression efficiency of 85% and inter-cooling. The energy consumption for the cooling operations, in which the environment can be used as a heat sink, was considered zero. CO2 is assumed to be compressed from atmospheric pressure to 42 bar, with an initial temperature of 298 K (25 °C), through a 3-stage compression, with inter-cooling until 293 K (20 °C) with the environment as a heat sink. The work of compression for the injected CO2 is equal to 1.91 kJ (361.93 kJ kgCO2−1).
After passing the membrane separation section at 3 bar, the permeated CO2 is recirculated to be re-injected in the hydrate-bearing sediment inside the reactor. The permeated CO2 is compressed to 42 bar starting from 3 bar and an initial temperature of 277 K, through a 2-stage compression with inter-cooling until 293 K (20 °C) with the environment as heat sink. The work of compression for the recirculation the permeated CO2 is equal to 0.48 kJ (252.81 kJ kgCO2−1). For the described contributions, considering a global efficiency of 0.46, the primary energy consumption is equal to 2.39 kJ, equivalent to the combustion of 0.006 moles of CH4. The primary energy consumption for the injection of a CO2 mass unit (kgCO2) is equal to 1336.4 kJ kgCO2−1, which corresponds to the combustion of 1.671 moles of CH4. Results are summarized in Figure 11. The ratio between the spent energy and the stored energy in the recovered CH4 is 4.75%.
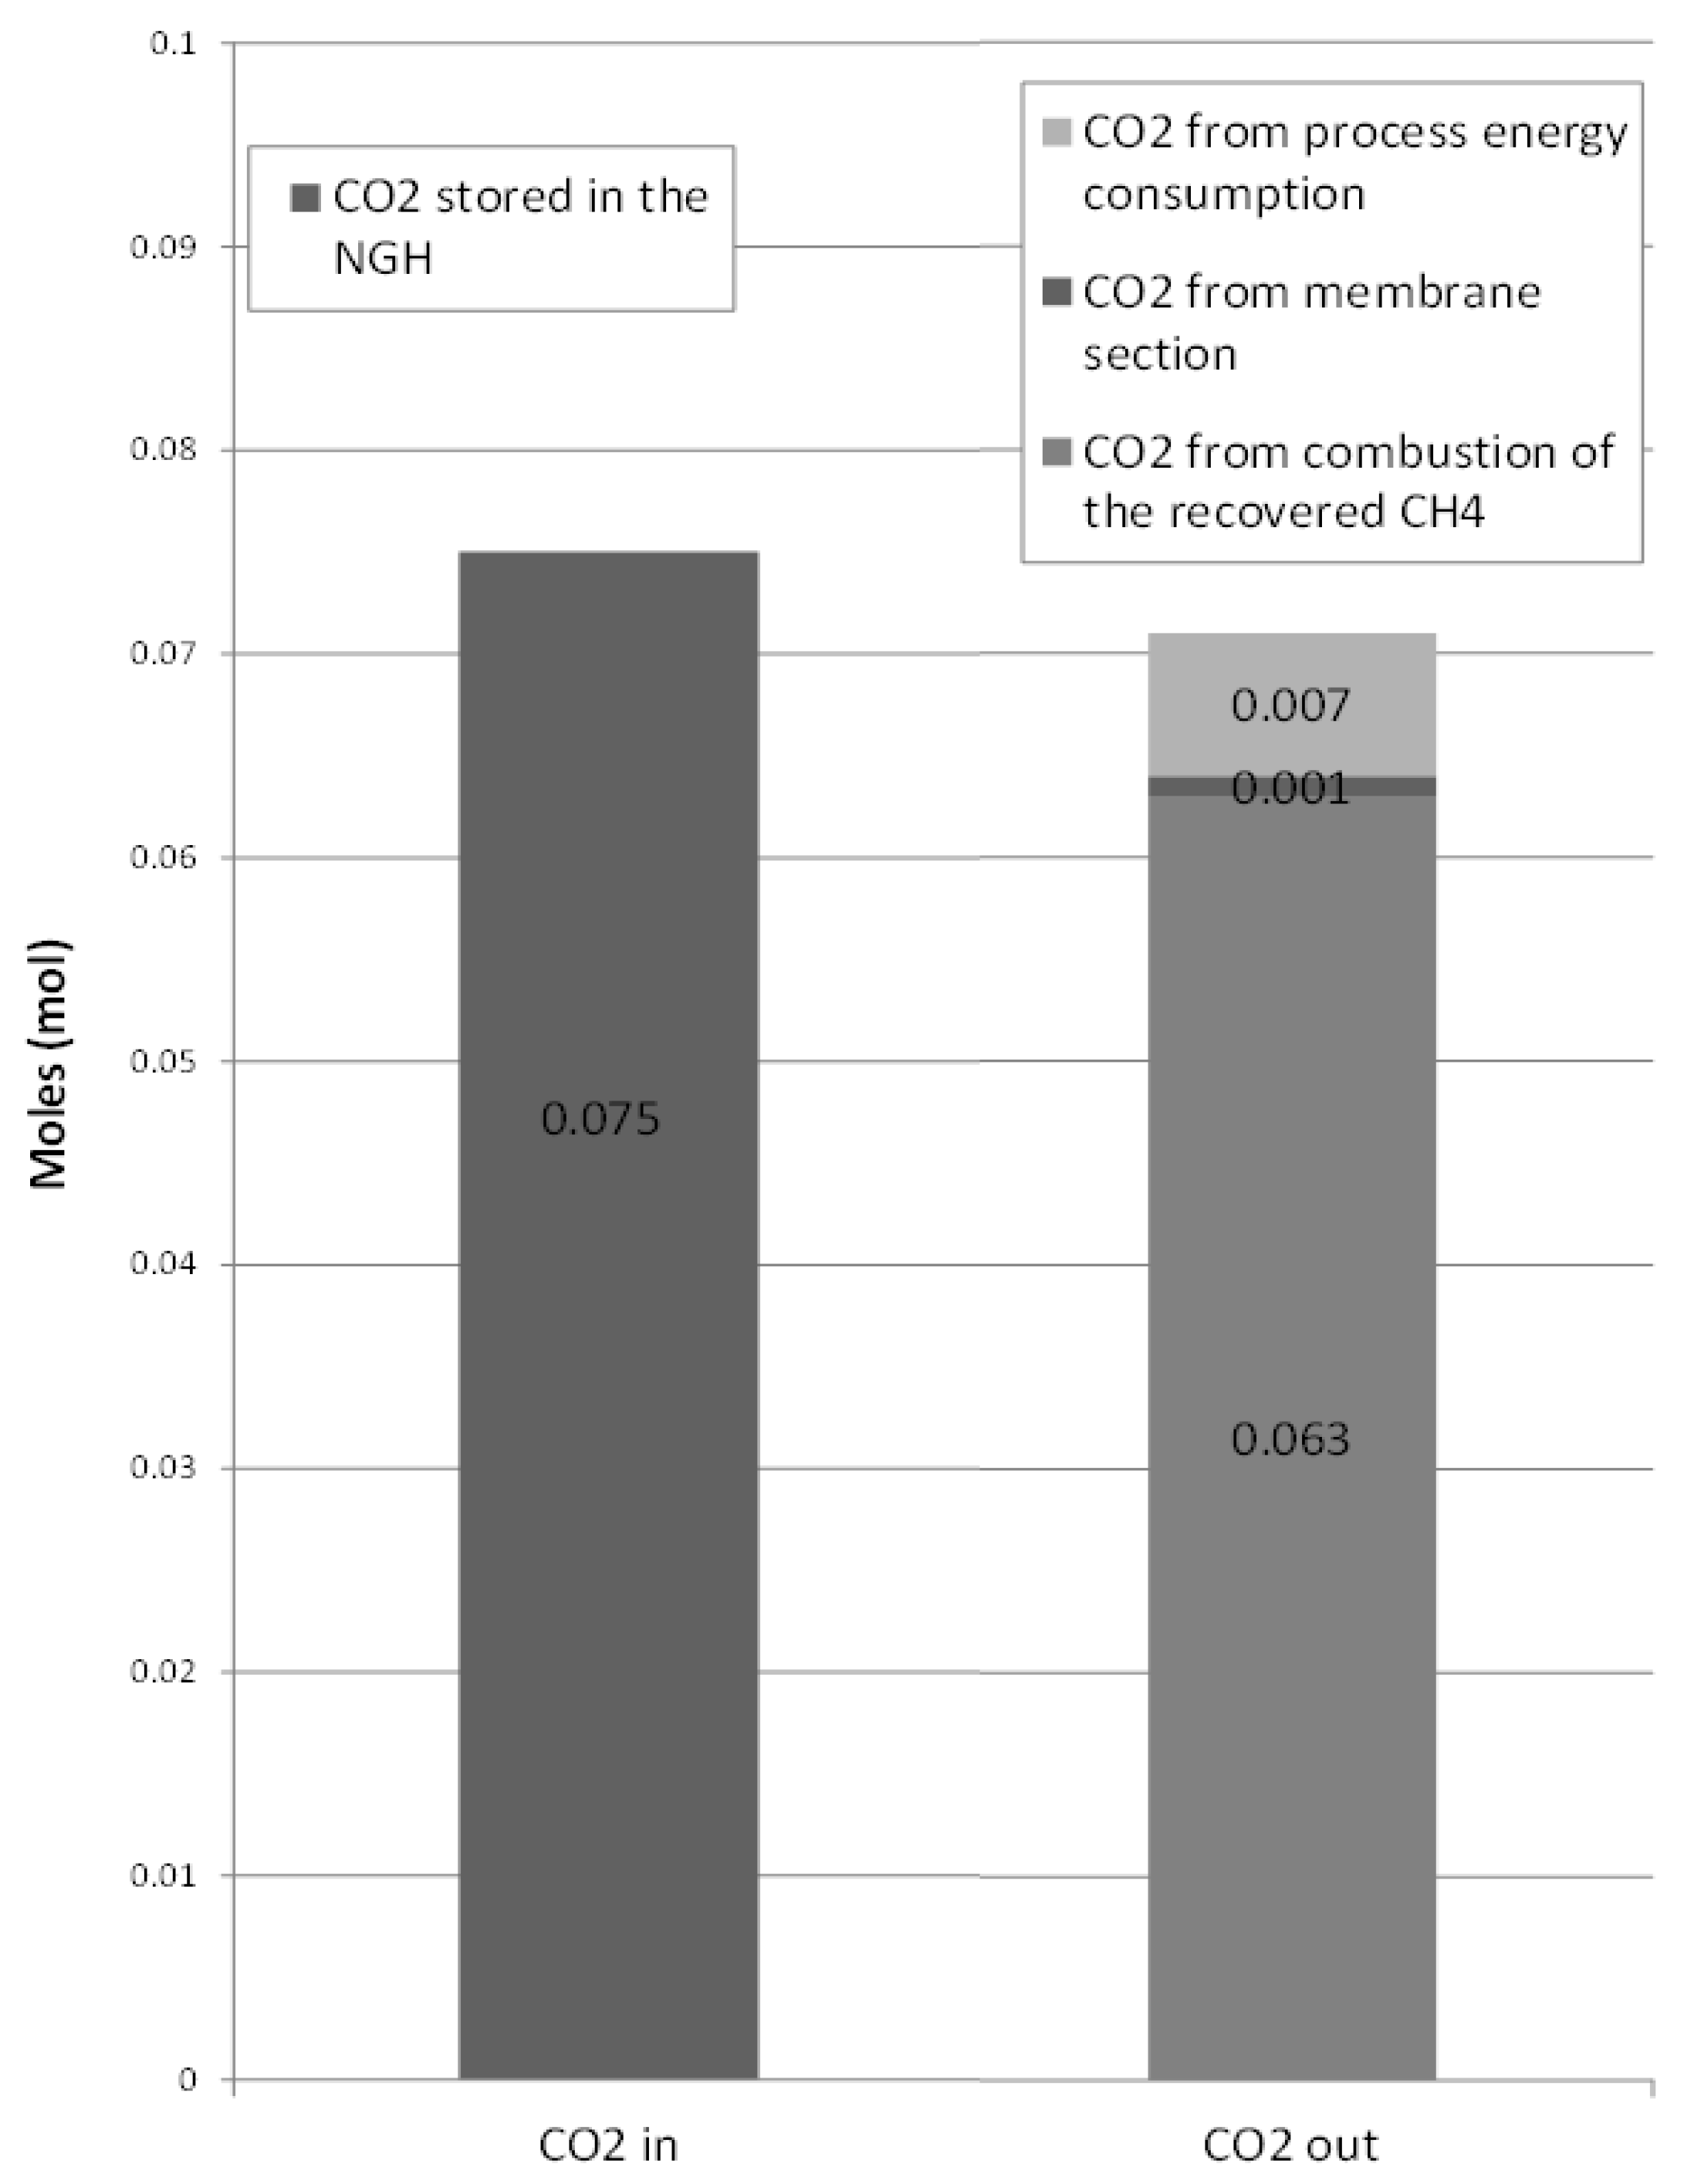
The carbon footprint of the CH4-CO2 exchange process is calculated as a balance of the CO2 produced in the process and the CO2 stored in system. The CO2 produced in the process is due to: (i) combustion of the recovered CH4; (ii) CO2 related to the primary energy consumption; (iii) CO2 from the membrane gas retentate. As the CH4-CO2 carbon ratio is 1:1, the stoichiometric combustion of 0.063 recovered CH4 moles produces the same number of CO2 moles. On the same basis, the primary energy consumption associated to the compression of the injected CO2, brings to the production of 0.007 moles of CO2. CO2 from the membrane separation is 0.001 mol (Figure 12). The amount of CO2 moles (0.075 moles) is calculated adding the moles stored in hydrates to the moles dissolved in water.
Also in this second case we can speak of permanent storage, as the thermodynamic conditions of the environment will lead to the formation of new hydrates. The carbon footprint therefore results in an estimated negative value, equal to 0.004 moles sequestrated, thus proving that the exchange process acts as carbon storage sink with consequent beneficial environmental effects.
5. Conclusions
The present paper proposes a process for pure methane recovery and carbon storage in natural gas hydrate sediments based on membrane separation. The CH4-CO2 exchange process was studied in a simulated hydrate-bearing sediment in a 1 L lab reactor, where the CH4 hydrates are formed in a quartz sand matrix, partially saturated with water. The gaseous flow, which results from the CH4-CO2 exchange process, is a CH4-CO2 mixture. The separation of the two components is proposed to be carried out by a membrane-based separation section.
Test of artificial reproduction of natural gas hydrates with a hydrate saturation of 10% show that the hydrate formation goes downward, to the lower part of the reactor. From comparison with literature data, temporal and spatial distribution of the CH4 hydrate formation is not affected by the reactor’s size. The CO2 replacement shows a capture factor of 0.28 and an exchange factor equal to 0.54.
Energy and environmental evaluations were carried out to assess the viability of the process. The energy analysis takes into account the process energy costs, related to the compression and heating of the injected CO2 and the compression of the CO2 separated in the membrane and recirculated in the sediment. Results show that the spent energy constitutes 4.75% of the energy stored in the recovered methane.
The carbon footprint of the CH4-CO2 exchange process is calculated as a balance of the CO2 produced in the process and the CO2 stored in system. Results provide an estimated negative value, equal to 0.004 moles sequestered, thus proving the environmental benefit of the exchange process. Coupling the CH4-CO2 exchange process in the methane hydrate reservoirs with a membrane based separation process to obtain pure gaseous methane is proved to be viable.
Further experimental studies to improve exchange and capture efficiency are planned. Geological and mechanical properties of the reproduced hydrates reservoir will be monitored, especially during the dissociation and exchange process.
Author Contributions
Conceptualization, B.C. and F.R.; methodology, B.C.; investigation, B.C. and A.M.G.; data curation, B.C., A.M.G. and A.N.; writing—original draft preparation, B.C.; writing—review and editing, A.N.; supervision, F.R.
Funding
This research received no external funding.
Conflicts of Interest
The authors declare no conflict of interest.
References
- Castellani, B.; Rossi, F.; Filipponi, M.; Nicolini, A. Hydrate-based removal of carbon dioxide and hydrogen sulphide from biogas mixtures: Experimental Investigation and energy evaluations. Biomass Bioenergy 2014, 70, 330–338. [Google Scholar] [CrossRef]
- Hansen, J.; Sato, M.; Ruedy, R.; Lacis, A.; Oinas, V. Global warming in the twenty-first century: An alternative scenario. Proc. Natl. Acad. Sci. USA 2000, 97, 9875–9880. [Google Scholar] [CrossRef] [PubMed] [Green Version]
- Howarth, R.W.; Ingraffea, A.; Engelder, T. Natural gas: Should fracking stop? Nature 2011, 477, 271–275. [Google Scholar] [CrossRef] [PubMed]
- Liang, S.; Kusalik, P.G. Nucleation of Gas Hydrates within Constant Energy Systems. J. Phys. Chem. B 2013, 117, 1403–1410. [Google Scholar] [CrossRef] [PubMed]
- Liang, S.; Rozmanov, D.; Kusalik, P.G. Crystal Growth Simulations of Methane Hydrates in the Presence of Silica Surfaces. Phys. Chem. Chem. Phys. 2011, 13, 19856–19864. [Google Scholar] [CrossRef] [PubMed]
- Wu, J.; Ning, F.; Trinh, T.T.; Kjelstrup, S.; Vlugt, T.J.; He, J.; Skallerud, B.H.; Zhang, Z. Mechanical Instability of Monocrystalline and Polycrystalline Methane Hydrates. Nat. Commun. 2015, 6, 8743. [Google Scholar] [CrossRef] [PubMed]
- English, N.J.; Tse, J.S. Mechanisms for Thermal Conduction in Methane Hydrate. Phys. Rev. Lett. 2009, 103, 015901. [Google Scholar] [CrossRef] [PubMed]
- Jiang, H.; Myshakin, E.M.; Jordan, K.D.; Warzinski, R.P. Molecular Dynamics Simulations of the Thermal Conductivity of Methane Hydrate. J. Phys. Chem. B 2008, 112, 10207–10216. [Google Scholar] [CrossRef] [PubMed]
- Demurov, A.; Radhakrishnan, R.; Trout, B.L. Computations of Diffusivities in Ice and CO2 Clathrate Hydrates via Molecular Dynamics and Monte Carlo Simulations. J. Chem. Phys. 2002, 116, 702–709. [Google Scholar] [CrossRef]
- Buch, V.; Devlin, J.P.; Monreal, I.A.; Jagoda-Cwiklik, B.; Uras-Aytemiz, N.; Cwiklik, L. Clathrate Hydrates with Hydrogen-Bonding Guests. Phys. Chem. Chem. Phys. 2009, 11, 10245–10265. [Google Scholar] [CrossRef] [PubMed]
- Makogon, Y.F.; Holditch, S.A.; Makogon, T.Y. Natural gas-hydrates—A potential energy source for the 21st century. J. Pet. Sci. Eng. 2007, 56, 14–31. [Google Scholar] [CrossRef]
- Chong, Z.R.; Yang, S.H.B.; Babu, P.; Linga, P.; Li, X.S. Review of natural gas hydrates as an energy resource: Prospects and challenges. Appl. Energy 2016, 162, 1633–1652. [Google Scholar] [CrossRef]
- Trofimuk, A.A.; Cherskiy, N.V.; Tsarev, V.P. Accumulation of natural gases in hydrate formation zones of the world’oceans. Doklady Akademii Nauk SSSR 1973, 212, 931. [Google Scholar]
- Moridis, G.J.; Reagan, M.T.; Boyle, K.L.; Zhang, K.N. Evaluation of the gas production potential of some particularly challenging types of oceanic hydrate deposits. Transp. Porous Media 2011, 90, 269–299. [Google Scholar] [CrossRef]
- Milkov, A.V. Global estimates of hydrates-bound gas in marine sediments: How much is really out there? Earth Sci. Rev. 2004, 66, 183–197. [Google Scholar] [CrossRef]
- Klauda, J.B.; Sandler, S.I. Global Distribution of Methane Hydrate in Ocean Sediment. Energy Fuels 2005, 19, 459–470. [Google Scholar] [CrossRef]
- Fitzgerald, G.C.; Castaldi, M.J. Thermal stimulation based methane production from hydrate bearing quartz sediment. Ind. Eng. Chem. Res. 2013, 52, 6571–6581. [Google Scholar] [CrossRef]
- Ruppel, C. Methane Hydrates and the Future of Natural Gas; Gas Hydrates Project; MITEI Natural Gas Report, Supplementary Paper on Methane Hydrates; U.S. Geological Survey: Woods Hole, MA, USA, 2011.
- Zhao, J.; Fan, Z.; Wang, B.; Dong, H.; Liu, Y.; Song, Y. Simulation of microwave stimulation for the production of gas from methane hydrate sediment. Appl. Energy 2016, 168, 25–37. [Google Scholar] [CrossRef]
- Uddin, M.; Wright, F.; Dallimore, S.; Coombe, D. Gas hydrate dissociations in Mallik hydrate bearing zones A, B, and C by depressurization: Effect of salinity and hydration number in hydrate dissociation. J. Nat. Gas Sci. Eng. 2014, 21, 40–63. [Google Scholar] [CrossRef]
- Song, Y.; Cheng, C.; Zhao, J.; Zhu, Z.; Liu, W.; Yang, M.; Xue, K. Evaluation of gas production from methane hydrates using depressurization, thermal stimulation and combined methods. Appl. Energy 2015, 145, 265–277. [Google Scholar] [CrossRef]
- Pang, W.; Xu, W.; Sun, C.; Zhang, C.; Chen, G. Methane hydrate dissociation experiment in a middle sized quiescent reactor using thermal method. Fuel 2009, 88, 497–503. [Google Scholar] [CrossRef]
- Castellani, B.; Rossetti, G.; Tupsakhare, S.; Rossi, F.; Nicolini, A.; Castaldi, M.J. Simulation of CO2 storage and methane gas production from gas hydrates in a large scale laboratory reactor. J. Pet. Sci. Eng. 2016, 147, 515–527. [Google Scholar] [CrossRef]
- Schicks, J.M.; Spangenberg, E.; Giese, R.; Steinhauer, B.; Klump, J.; Luzi, M. New Approaches for the Production of Hydrocarbons from Hydrate Bearing Sediments. Energies 2011, 4, 151–172. [Google Scholar] [CrossRef] [Green Version]
- Rossi, F.; Gambelli, A.M.; Sharma, D.K.; Castellani, B.; Nicolini, A.; Castaldi, M.J. Experiments on methane hydrates formation in seabed deposits and gas recovery adopting carbon dioxide replacement strategies. Appl. Therm. Eng. 2019, 148, 371–381. [Google Scholar] [CrossRef]
- Yang, S.H.B.; Babu, P.; Chua, S.F.S.; Linga, P. Carbon dioxide hydrate kinetics in porous media with and without salts. Appl. Energy 2016, 162, 1131–1140. [Google Scholar] [CrossRef]
- Merey, S.; Al-Raoush, R.I.; Jung, J.; Alshibli, K.A. Comprehensive literature review on CH4-CO2 replacement in microscale porous media. J. Pet. Sci. Eng. 2018, 171, 48–62. [Google Scholar] [CrossRef]
- Baig, K.; Kvamme, B.; Kuznetsova, T.; Bauman, J. Impact of water film thickness on kinetic rate of mixed hydrate formation during injection of CO2 into CH4 hydrate. AIChE J. 2015, 61, 3944–3957. [Google Scholar] [CrossRef]
- Kvamme, B.; Qasim, M.; Baig, K.; Kivelä, P.-H.; Bauman, J. Hydrate phase transition kinetics from Phase Field Theory with implicit hydrodynamics and heat transport. Int. J. Greenh. Gas Control 2014, 29, 263–278. [Google Scholar] [CrossRef]
- Boswell, R.; Coffin, R.; Collett, T.S.; Frye, M.; Haq, B.; Niglio, L.; Seol, Y.; Smith, G.; Ruppel, C.; Shedd, B.; et al. An Interagency Roadmap for Methane Hydrate Research and Development: 2015–2030. 2013. Available online: https://www.energy.gov/sites/prod/files/2013/06/f1/Roadmap%202013%20FAC%20Draft%205-28-13.pdf (accessed on 29 January 2019).
- Chong, Z.R.; Zhao, J.; Chan, J.H.R.; Yin, Z.; Linga, P. Effect of horizontal wellbore on the production behavior from marine hydrate bearing sediment. Appl. Energy 2018, 214, 117–130. [Google Scholar] [CrossRef]
- Wang, F.; Zhao, B.; Li, G. Prevention of Potential Hazards Associated with Marine Gas Hydrate Exploitation: A Review. Energies 2018, 11, 2384. [Google Scholar] [CrossRef]
- Chmielewski, A.G.; Urbaniak, A.; Wawryniuk, K. Membrane enrichment of biogas from two-stage pilot plant using agricultural waste as a substrate. Biomass Bioenergy 2013, 58, 219–228. [Google Scholar] [CrossRef]
- Castellani, B.; Rinaldi, S.; Bonamente, E.; Nicolini, A.; Rossi, F.; Cotana, F. Carbon and energy footprint of the hydrate-based biogas upgrading process integrated with CO2 valorization. Sci. Total Environ. 2018, 615, 404–411. [Google Scholar] [CrossRef] [PubMed]
- Fitzgerald, G.C.; Castaldi, M.J.; Zhou, Y. Large scale reactor details and results for the formation and decomposition of methane hydrates via thermal stimulation dissociation. J. Pet. Sci. Eng. 2012, 94–95, 19–27. [Google Scholar] [CrossRef]
- Robb, W.L. Thin silicone membranes-their permeation properties and some applications. Ann. N. Y. Acad. Sci. 1968, 146, 119–137. [Google Scholar] [CrossRef] [PubMed]
- Membrane Basics. Available online: https://www.permselect.com/membranes (accessed on 4 March 2019).
- Zhou, Y.; Castaldi, M.J.; Yegulalp, T.M. Experimental investigation of methane gas production from methane hydrate. Ind. Eng. Chem. Res. 2009, 48, 3142–3149. [Google Scholar] [CrossRef]
Figure 1.
Flowchart of the methodology used.

Figure 2.
Experimental apparatus: view from above on the left, side view on the right.

Figure 3.
Membrane-based separation process for CH4 recovery from NGH.

Figure 4.
Schematic drawing of the membrane-based replacement process.

Figure 5.
Membrane gas separation principle (Permselect, available online [37]).
Figure 5.
Membrane gas separation principle (Permselect, available online [37]).

Figure 6.
Temperature profiles—Test 1, 10% hydrate saturation.

Figure 7.
Pressure trend in Test 1.

Figure 8.
P-T graph, comparison between experimental conditions and theoretical equilibrium profile.
Figure 8.
P-T graph, comparison between experimental conditions and theoretical equilibrium profile.

Figure 9.
Temperature trend in the reactor during the CO2 replacement phase.

Figure 10.
Pressure trend during the CO2 replacement test.

Figure 11.
CH4-CO2 replacement energy consumption and the recovered CH4 energy content.

Figure 12.
Carbon footprint of the process.


Table 1.
Reactor internal volumes.
| Headspace volume | 109 cm3 |
| Reactor internal volume | 949 cm3 |
| Sand sediment volume | 744 cm3 |
| Sand sediment porosity | 0.34% |
| Sand pore volume | 253 cm3 |
| Water pore saturation | 50% |
| Water volume | 126 cm3 |
Table 2.
Membrane properties and operating conditions.
| Material | PDMS (silicone) |
|---|---|
| Type | Dense Hollow Fiber |
| Fiber diameter (µm) | 190 |
| Fiber Wall Thickness (µm) | 55 |
| Fiber Count | 30 |
| Membrane Area (cm2) | 10 |
| Module Length (cm) | 10.9 |
| Module Diameter (cm) | 0.95 |
| Maximum Operating Temperature (K) | 333 |
| Maximum Shell Side Pressure (MPa) | 0.3 |
| Gas Flow Rate (Sm3 h−1) | 6·10−5–6·10−3 |
Table 3.
Experimental tests and results.
| Test | Hydrate Saturation (%) | Initial Pressure (bar) | Equilibrium Pressure (bar) | Temperature (°C) | Dissociation Pressure (bar) | Injected Methane (mol) | Released Methane (mol) |
|---|---|---|---|---|---|---|---|
| 1 | 10 | 42.0 | 28.3 | 1.0 | 16.5 | 0.2307 | 0.0769 |
Table 4.
Experimental parameters for CO2 replacement test.
| Hydrate Saturation (%) | Initial Pressure (bar) | Equilibrium Pressure (bar) | Injected CO2 Temperature (°C) | Initial Internal Temperature (°C) | Dissociation Pressure (bar) | Injected Moles (mol) |
|---|---|---|---|---|---|---|
| 10 | 20.4 | 16.5 | 15.0 | 1.5 | 6.05 | 0.119 |
© 2019 by the authors. Licensee MDPI, Basel, Switzerland. This article is an open access article distributed under the terms and conditions of the Creative Commons Attribution (CC BY) license (http://creativecommons.org/licenses/by/4.0/).
Share and Cite
MDPI and ACS Style
Castellani, B.; Gambelli, A.M.; Nicolini, A.; Rossi, F. Energy and Environmental Analysis of Membrane-Based CH4-CO2 Replacement Processes in Natural Gas Hydrates. Energies 2019, 12, 850. https://doi.org/10.3390/en12050850
AMA Style
Castellani B, Gambelli AM, Nicolini A, Rossi F. Energy and Environmental Analysis of Membrane-Based CH4-CO2 Replacement Processes in Natural Gas Hydrates. Energies. 2019; 12(5):850. https://doi.org/10.3390/en12050850
Chicago/Turabian StyleCastellani, Beatrice, Alberto Maria Gambelli, Andrea Nicolini, and Federico Rossi. 2019. "Energy and Environmental Analysis of Membrane-Based CH4-CO2 Replacement Processes in Natural Gas Hydrates" Energies 12, no. 5: 850. https://doi.org/10.3390/en12050850
Note that from the first issue of 2016, this journal uses article numbers instead of page numbers. See further details here.