Comprehensive Hydraulic Improvement and Parametric Analysis of a Francis Turbine Runner


1
Department of Energy and Power Engineering, Tsinghua University, Beijing 100084, China
2
Hunan Vanguard Group Co. Ltd., Changsha 100761, China
*
Author to whom correspondence should be addressed.
Energies 2019, 12(2), 307; https://doi.org/10.3390/en12020307
Submission received: 10 December 2018
/
Revised: 11 January 2019
/
Accepted: 13 January 2019
/
Published: 19 January 2019
Abstract
:Hydraulic turbines are usually required to operate in a wide range. The operation at off-design conditions not only reduces the unit efficiency, but also significantly deteriorates the dynamic stability of the turbines. In order to develop a turbine runner with good performances under multi operation conditions, a comprehensive hydraulic improvement has been done of a Francis turbine runner with a multipoint and multi-objective optimization design system. Compared with the initial runner, the runner generated from this method has a satisfactory improvement. In detail, unit efficiencies of the preferred runner are increased by 0.91%, 0.47% and 0.37%, respectively, under the rated head, a high head and the maximum head. The lowest pressure at blade surface is improved by 376.2 kPa under the rated head. CFD calculations are conducted to analyze the flow conditions inside of the preferred runner. In addition, runners with different main design inputs, namely blade lean, blade loading and blade meridional shape are furtherly investigated to reveal their relationship with runner’s internal flow and outer performances. In summary, this optimization system supplies satisfactory results and convincing recommendations to determine the design inputs for low-head Francis turbine runners.
1. Introduction
Hydropower is known as a well-developed and cost-competitive renewable energy technology. In line with the current energy development, i.e., growing proportion of photovoltaic and wind power, hydropower is assumed to become increasingly important. On one hand, it produces renewable energy, on the other hand, it is utilized to satisfy the energy storage requirements associated to the new renewable energy sources [1,2]. Generally, hydraulic turbines are designed at the rated operational point at which standard operating conditions are met and the best efficiency can be obtained [3]. However, hydraulic the turbines, responding to fast and elastic grid fluctuations, are often forced to operate under the off-design conditions. In such conditions, the efficiency is reduced because the hydraulic losses become higher, and the dynamic stability of the turbines is weakened significantly [4], therefore, it is necessary for the design strategies to be improved to satisfy the new requirements.
Hydropower is a renewable source of energy with a long history [5]. So far hydropower is used in more than 150 countries, and it accounts for about 16.6% of worldwide electricity production [6]. With an installed capacity of 1246 GW and an annual generation of about 4102 TWh in 2016 [7], hydropower is the largest single renewable energy source all over the world. By the end of 2017, China has installed 341.19 GW of hydropower, which ranks the first place worldwide, and accounts for about 50% in the total exploitable amount. In developed countries, the average hydropower exploitation has exceeded 60% of the total resource based on the data collected in the Hydropower & Dams, World Atlas and Industrial Guide in 2013. Accordingly, capacity-increasing transformation for the existing hydropower stations already contributes and will increasingly do to participate to renewable energy production. In the USA, about 85% of the newly developed 15,363 MW hydropower from 2005 to 2013 is from the expansion of existing hydropower stations [8]. In China, most of the existing hydropower stations will need to be modernized since the design of existing hydraulic turbines may not be optimum due to the limitations of contemporary technology [3].
In summary, in terms of both the requirements of design technologies improvement and modernization of hydropower stations, new design strategies with comprehensive consideration of multi-objective and multipoint must be developed. With the aid of these strategies, time and cost can be saved in design process and runners with satisfactory performance in a broader operation region can be generated.
Optimizing the hydraulic performance of turbines has become more and more common with the development of computational fluid dynamics (CFD) [9,10,11]. Based on fluid analyses by CFD, the shape of runners and guide vanes can be modified through changing the input design parameters. However, CFD analysis cannot directly figure out a satisfactory blade configuration. In addition, CFD-based design techniques cost considerable time and require extensive experience. On the other hand, the so-called inverse design methods have become increasingly popular in the past thirty years in the turbomachinery field [12,13,14,15]. As the inverse design methods are employed, the unknown configuration of the flow parts can be directly decided when the design specifications are given. Therefore, a closer relationship between the design parameters and the flow field can be built, whereas, there is still no direct relationship between geometric parameters and hydraulic performances for these flow parts. As a result, trial and error in the design process is still ineludible
In order to set up a clear relationship between geometric parameters and hydraulic performance, optimization technologies have widely employed in industry applications, such as aviation machinery and turbomachinery [16,17,18,19,20]. The optimized algorithms used in these works can be divided into two basic groups: local and global [21]. Gradient-based optimization algorithms have been successfully used in airfoil design [16,17]. However, in spite of the higher convergence rate of gradient techniques, they may not be a good choice due to the lack of reliability of the global optima they generate. In contrast, multi-objective evolutionary algorithms (MOEAs) have been given more chance to show their outstanding properties over the past several decades [21,22,23]. Population-based schemes mimic the evolution of species and the survival of the fittest, and they have some outstanding properties, including good approximations to optimal sets of solutions and the generation of multiple trade-off solutions in a single iteration [18,19,21]. Recently, a multi-objective optimization design system has been established to improve pump-turbine runners [24,25]. This system combines several tools, including 3D inverse design method, CFD analysis, design of experiments (DoE), response surface methodology (RSM), and multi-objective genetic algorithms (MOGAs). The combination of such technologies makes the optimization work easy and systematic. Different from the computational fluid dynamics (CFD)-based optimization, these kinds of system can reduce the time consumption and experience requirements. In addition, these systems can be widely employed in many kinds of fluid machines, since they can be coupled with many numerical tools, including CAD, CAE and CFD techniques.
In the present paper, a widely-used Francis turbine runner is hydraulically improved based on a comprehensive optimization strategy [24,25]. Firstly, the multipoint and multi-objective optimization design strategy is introduced, and the runner is redesigned under three operation conditions. Meanwhile, a parametric design study is carried and the impacts of blade lean, blade loading and meridional blade shape are assessed. Through the optimization redesign, the initial runner is comprehensively improved, not only increasing the turbine unit efficiency, and improving the cavitation characteristics, but also enhancing the operation stability significantly. Moreover, the analysis of the effects of the geometries parameters on the hydraulic performance offers some important guidelines for the design or redesign of low-head Francis turbine runners based on the internal flow analyses and performance comparisons.
2. Research Object
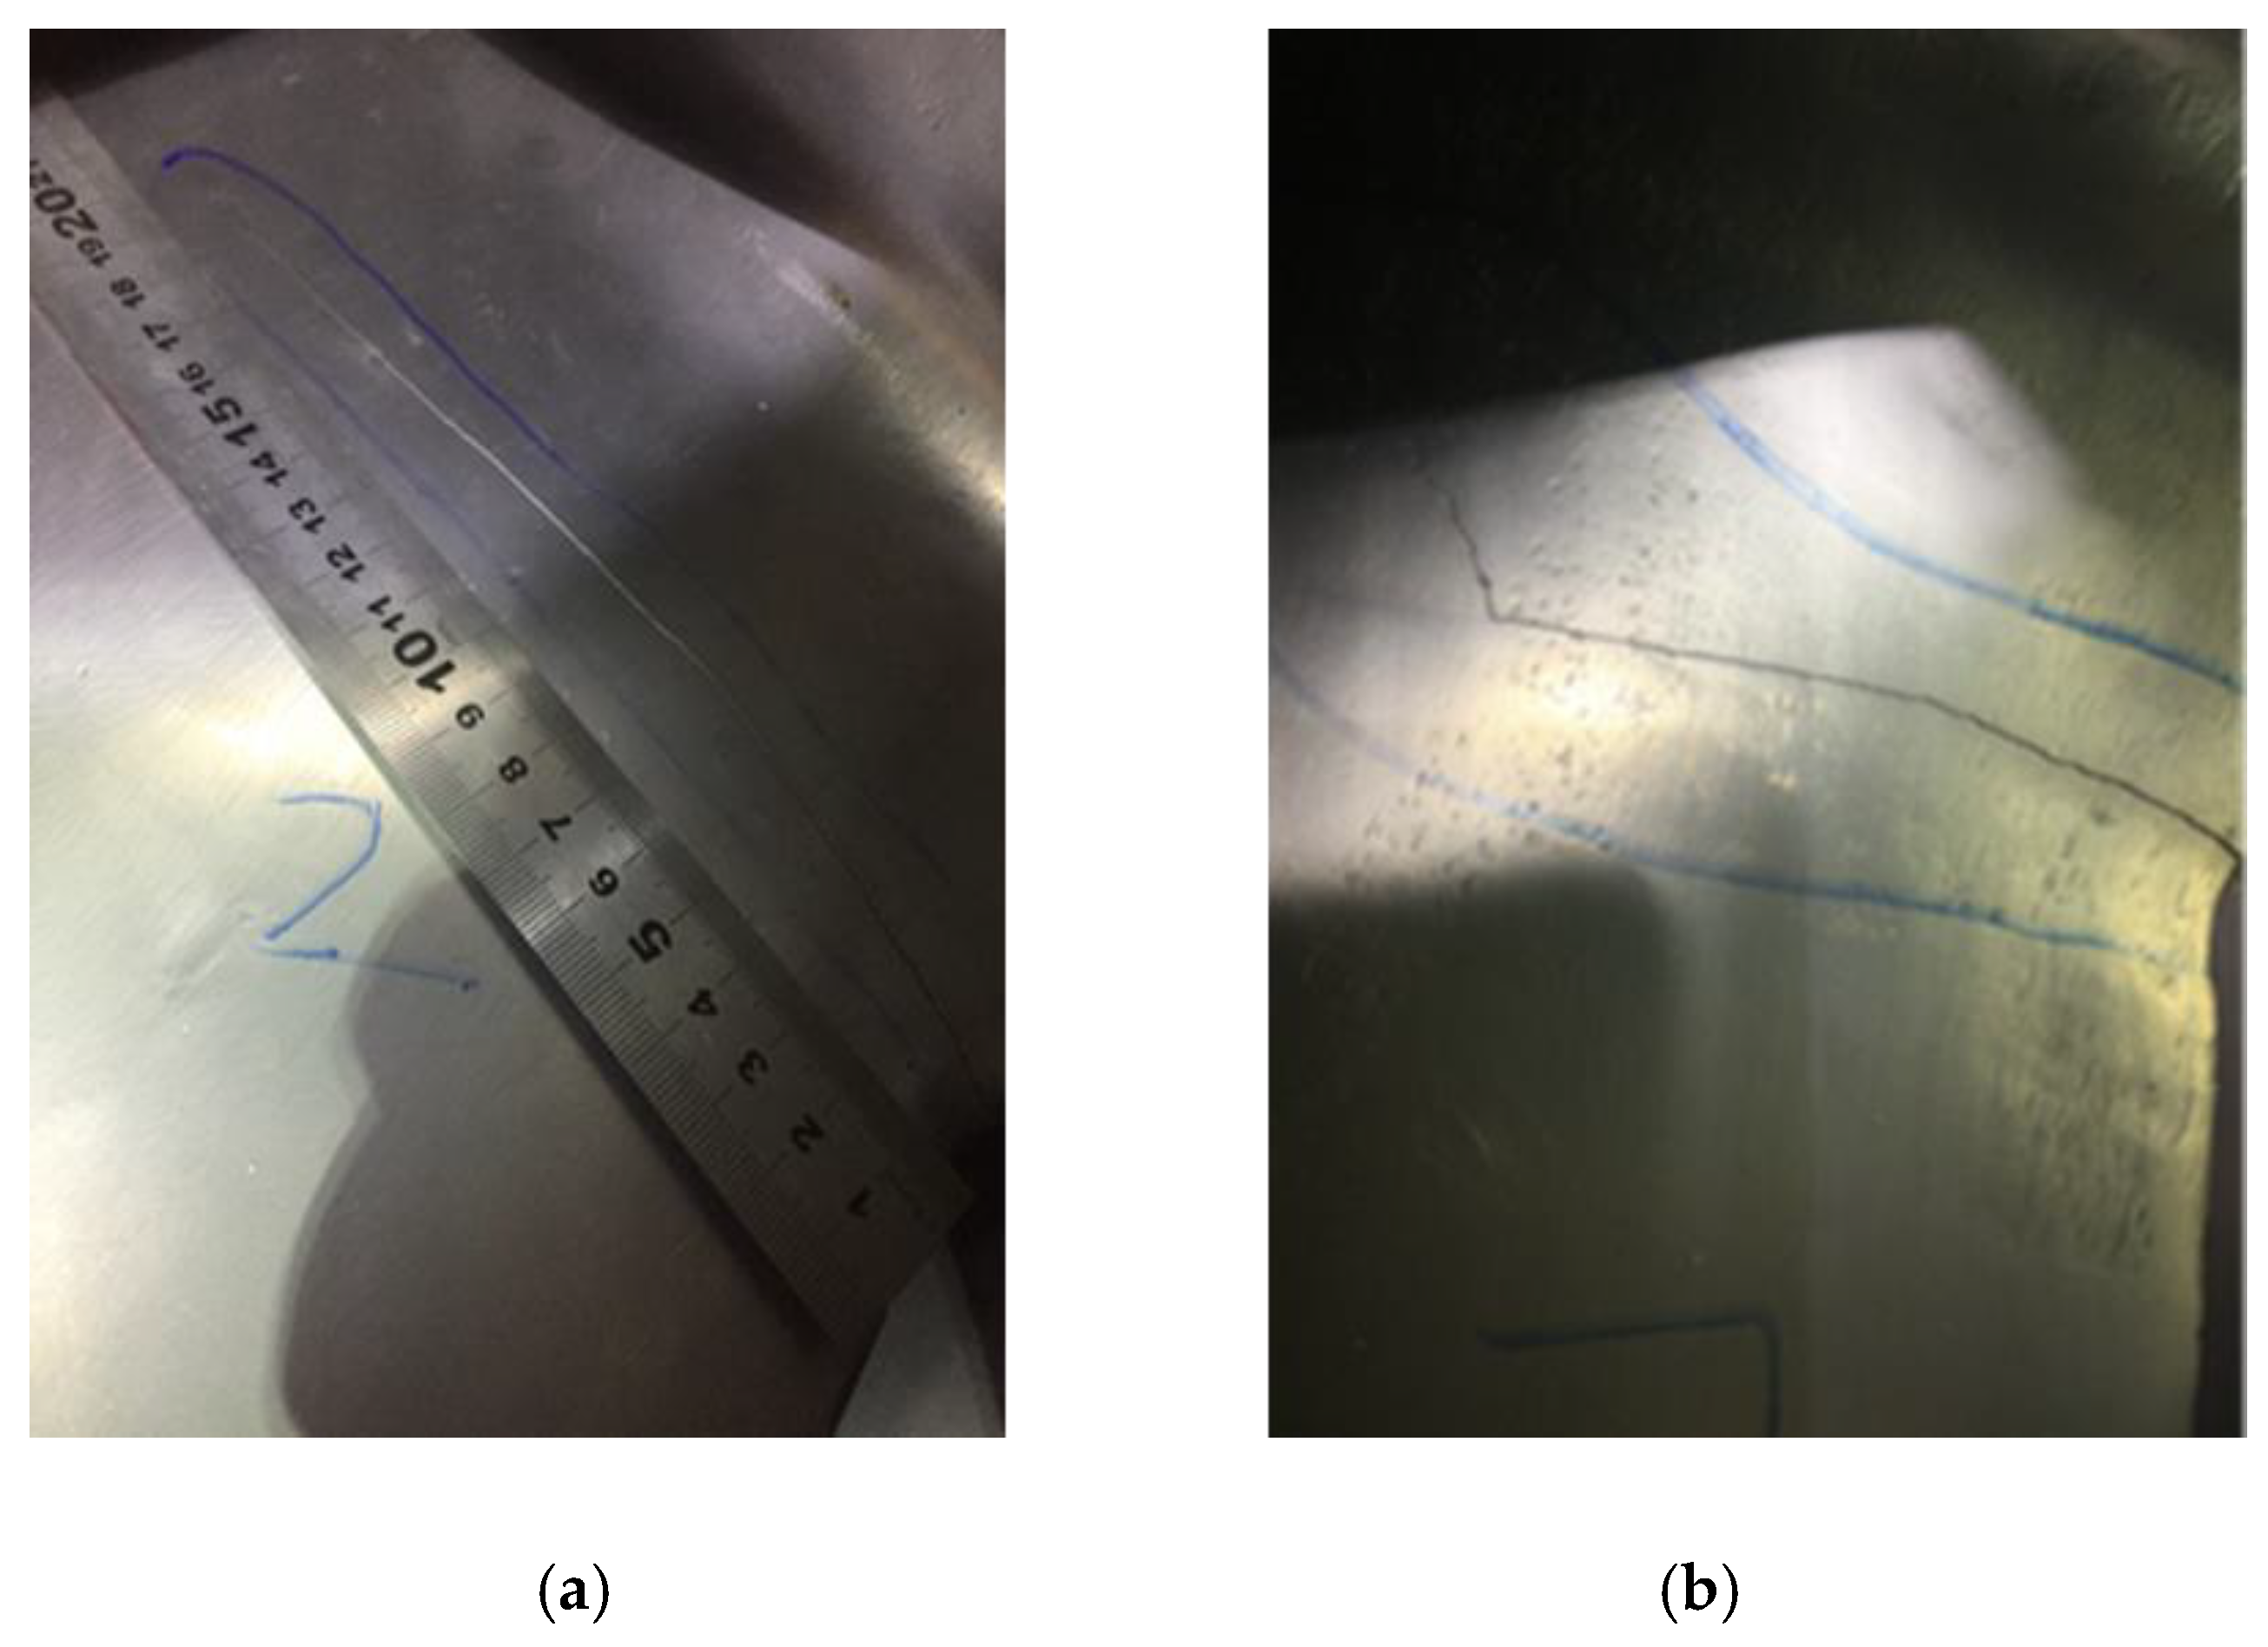
The hydraulic turbine installed in Chengzigou Hydropower Station located in Gansu Province in Northwest China is investigated in this paper. Three Francis turbine generator units were installed in the station, and the first one started to generate power in August 2014. After about two and half years’ operation, cracks were found on the runner blades in June 2017. As shown in Figure 1, the cracks occurred from the blade exit and near the hub.
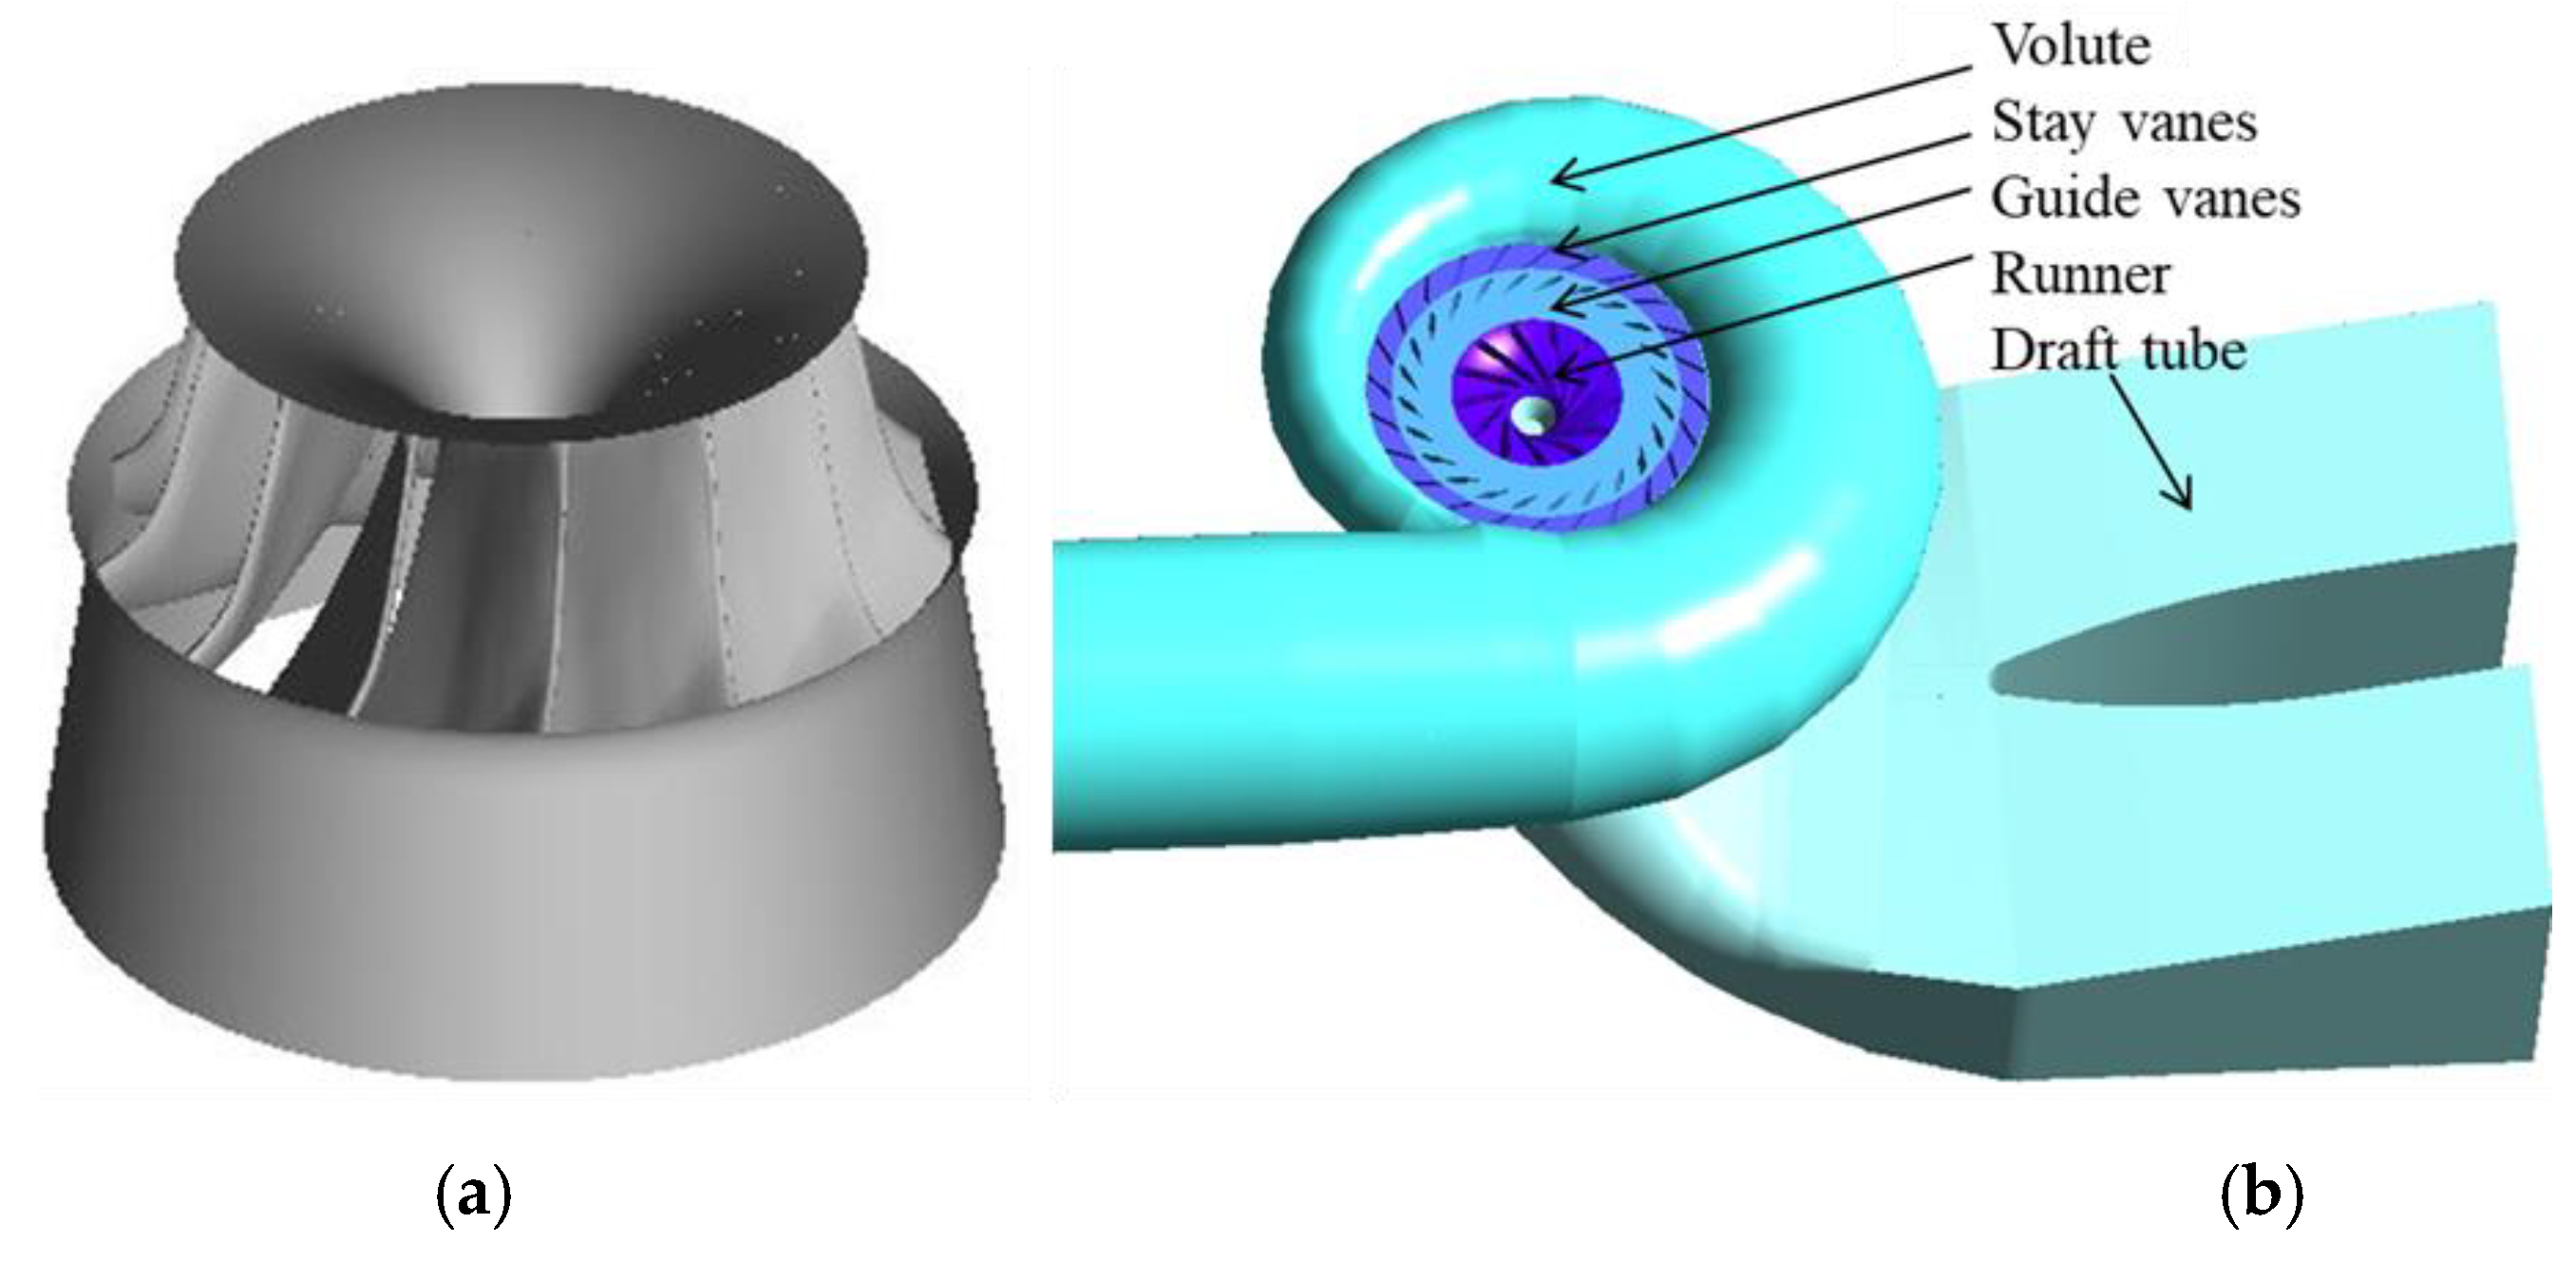
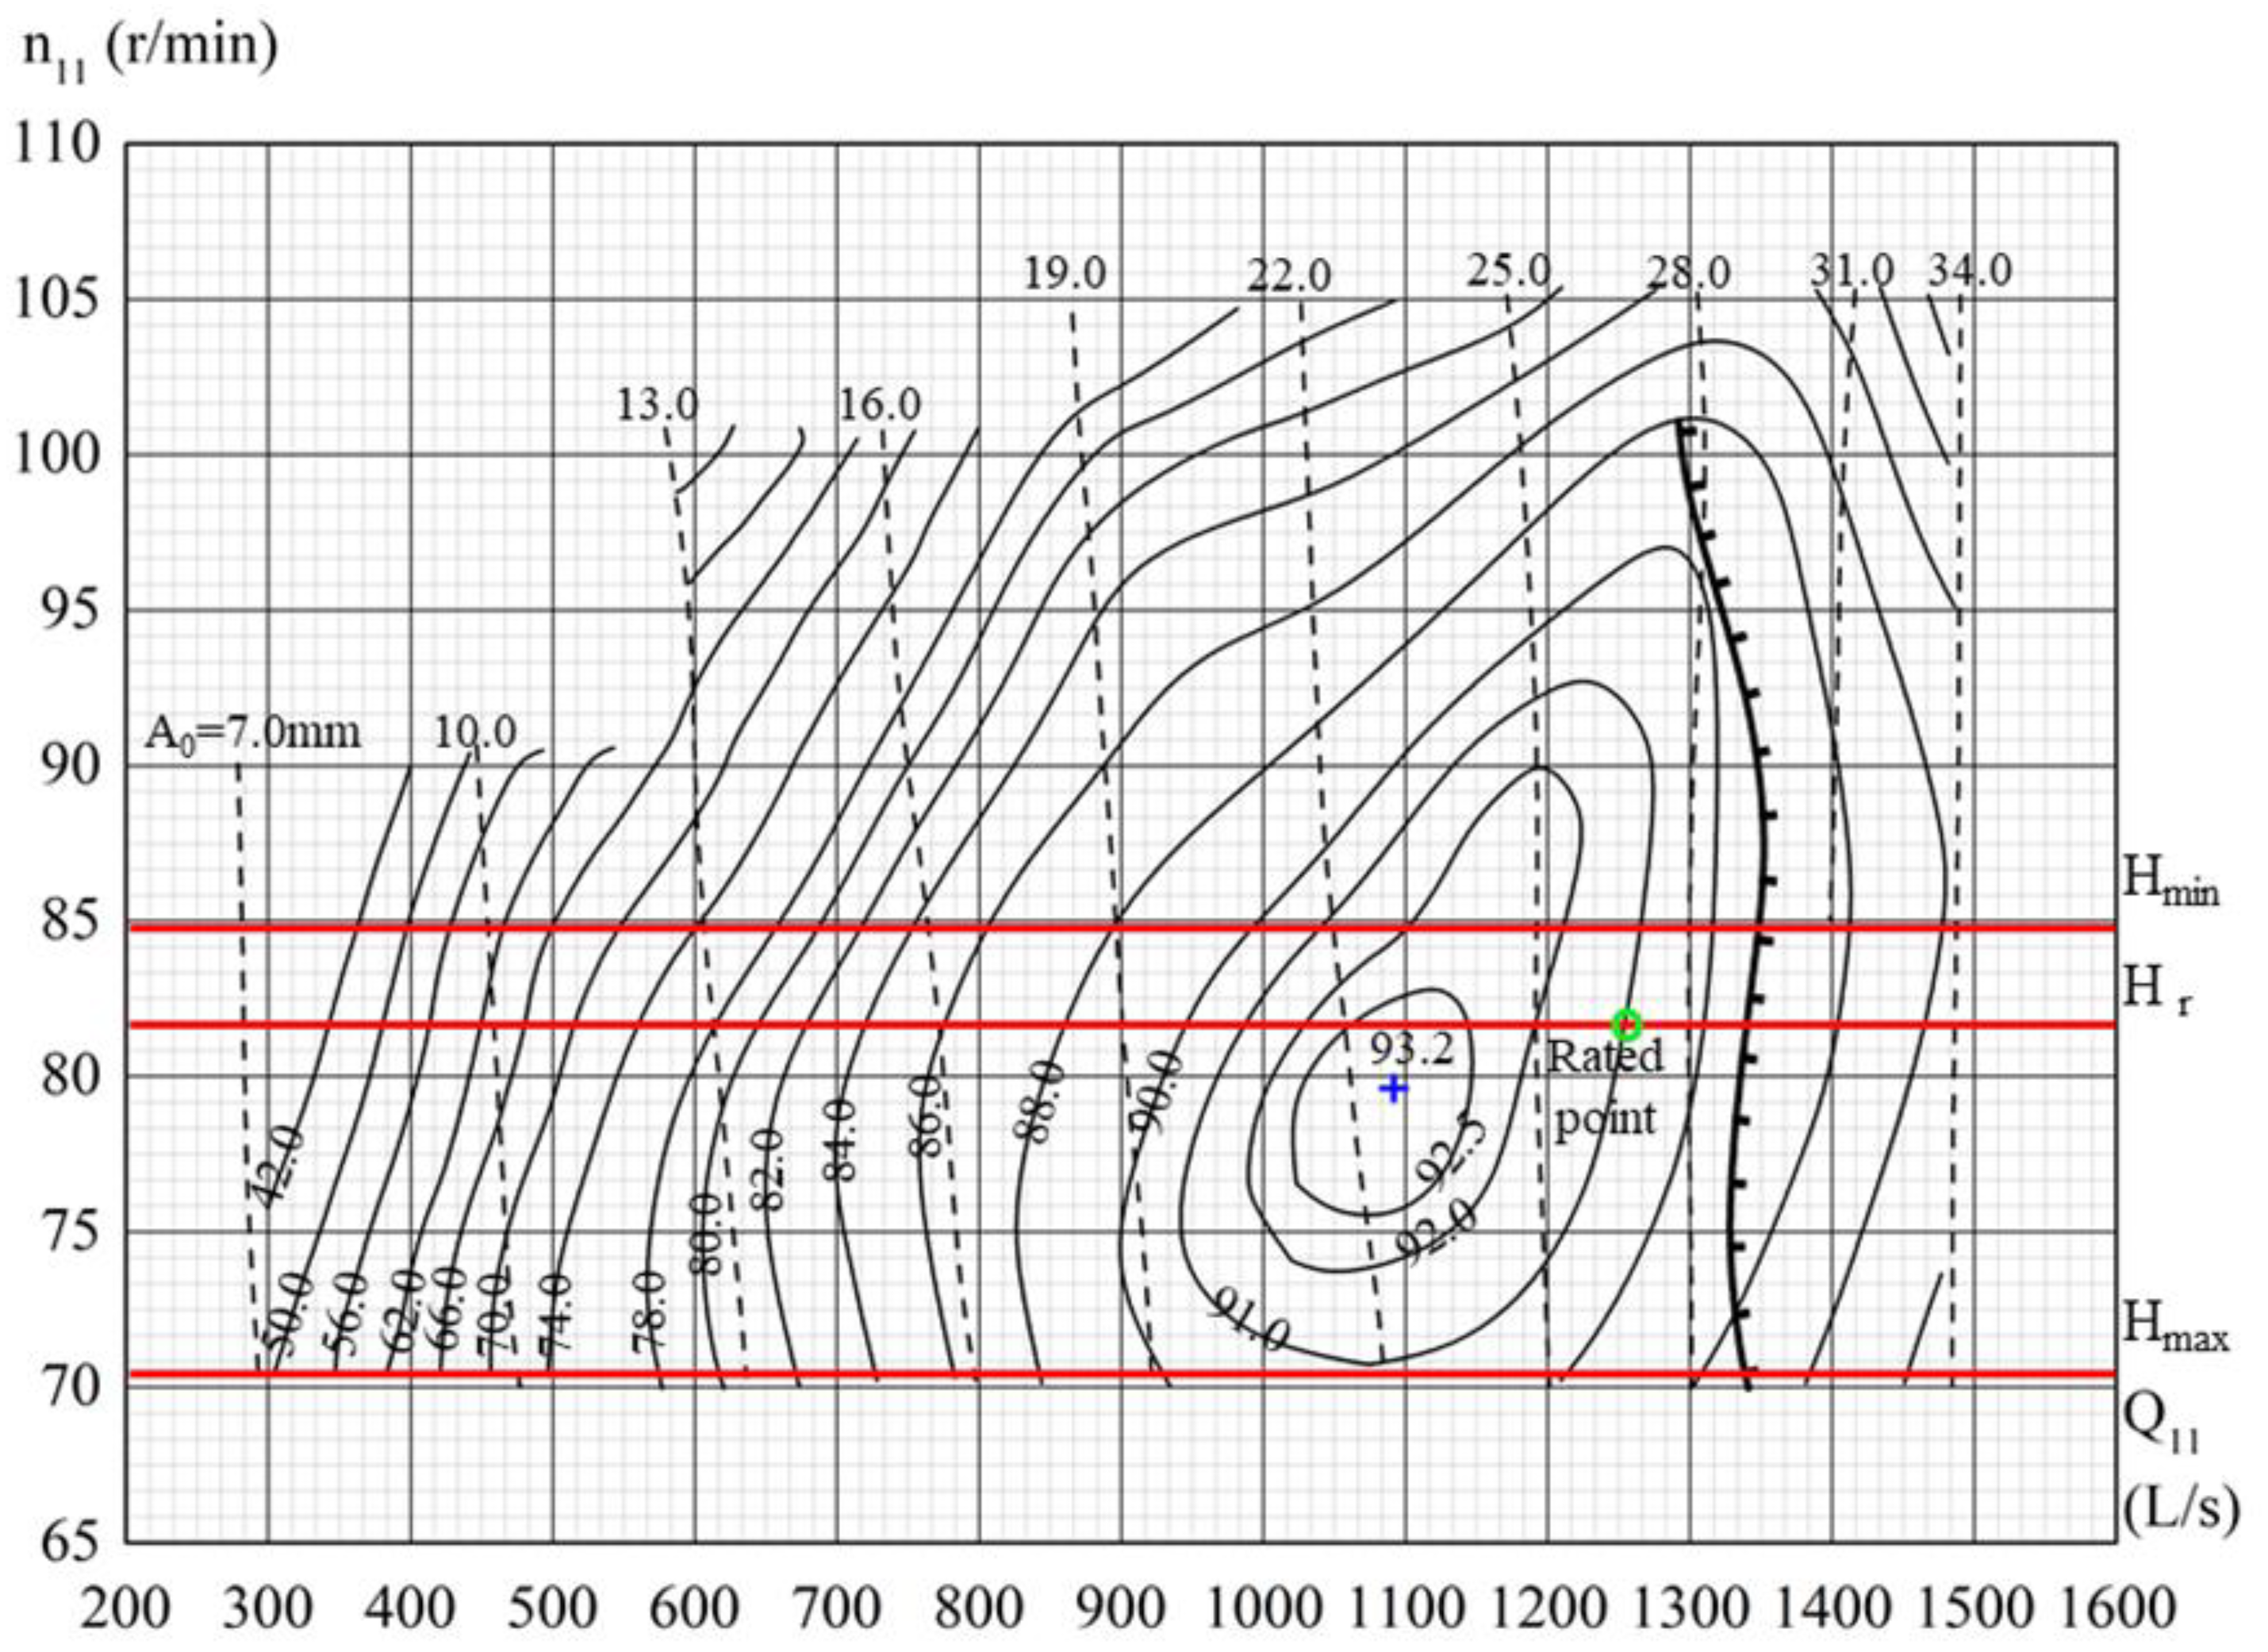
The initial runner equipped in the hydraulic turbine is shown in Figure 2. The specific design parameters of the designed runner are shown in Table 1. The runner type is HLA551 in the Chinese series of Francis turbines. The turbine’s model performance curve is shown in Figure 3. According to Figure 3, it can be found that the rated point of the turbines does not coincide with the best efficiency point (BEP) of the model runner. Therefore, the turbines operate out of the optimal mode, which exposes the turbines to the risks of operating instability, structural fatigue and even mechanical damage, as shown in Figure 1.
3. Optimization Scheme
The redesign of the runner shown in Figure 2 is based on a multi-objective optimization strategy [24,25]. The new approach combines some tools including the 3D inverse design method, CFD analysis and multipoint and multi-objective optimization technology. These tools are employed to produce the blade, to estimate the performance and to generate multiple trade-off solutions, respectively.
3.1. 3D Inverse Design
3D design software TURBODesign 5.2 was employed to parametrize the blade geometry [12,18]. In the process, blades were represented by sheets of vorticity and their strength was calculated based on the distribution of circumferentially averaged swirl velocity :
where B represents the number of the runner blade.
In incompressible potential flow, the pressure distribution can be expressed as follows:
where is the pressure difference across the blade, ρ is the fluid density, and is the fluid’s velocity relative to the runner on the blade surface, and m is in the direction of streamlines in the meridional plane. Equation (2) demonstrates the relationship between the pressure difference across the blade and meridional derivative of . Therefore, is an important design parameter, and it is referred to as blade loading.
3.2. CFD Analyses
CFD were conducted to estimate the objective functions and to validate the optimized runners as well as to analyses these runners. The commercial ANSYS CFX code was used for the CFD calculations. Three-dimensional steady flow simulations were performed in the entire flow passage turbine with the Reynolds-Averaged Navier-Stokes (RANS) equations which were shown as:
where V is the velocity, p is the pressure, ρ is the density, ν is the kinematic viscosity, and τij are the Reynolds stresses, respectively. The Reynolds stresses τij were modeled with the extensively validated renormalization group (RNG) k-ε model, because it is economical and robust for predicting performance parameters like efficiency and cavitation with acceptable accuracy for turbomachinery [15,26,27,28,29,30].
The entire channels domain included the spiral casing, stay vanes, guide vanes, runner and draft tube as shown in Figure 2b. Frozen rotor model was employed at interfaces between the stationary and rotating components. Walls in both stationary and rotating parts were set to no-slip conditions. The flow discharge and the static pressure were set at the inlet and the outlet, respectively. A 5.0% free stream turbulent intensity was adopted in all the simulations.
3.3. Optimization Strategy
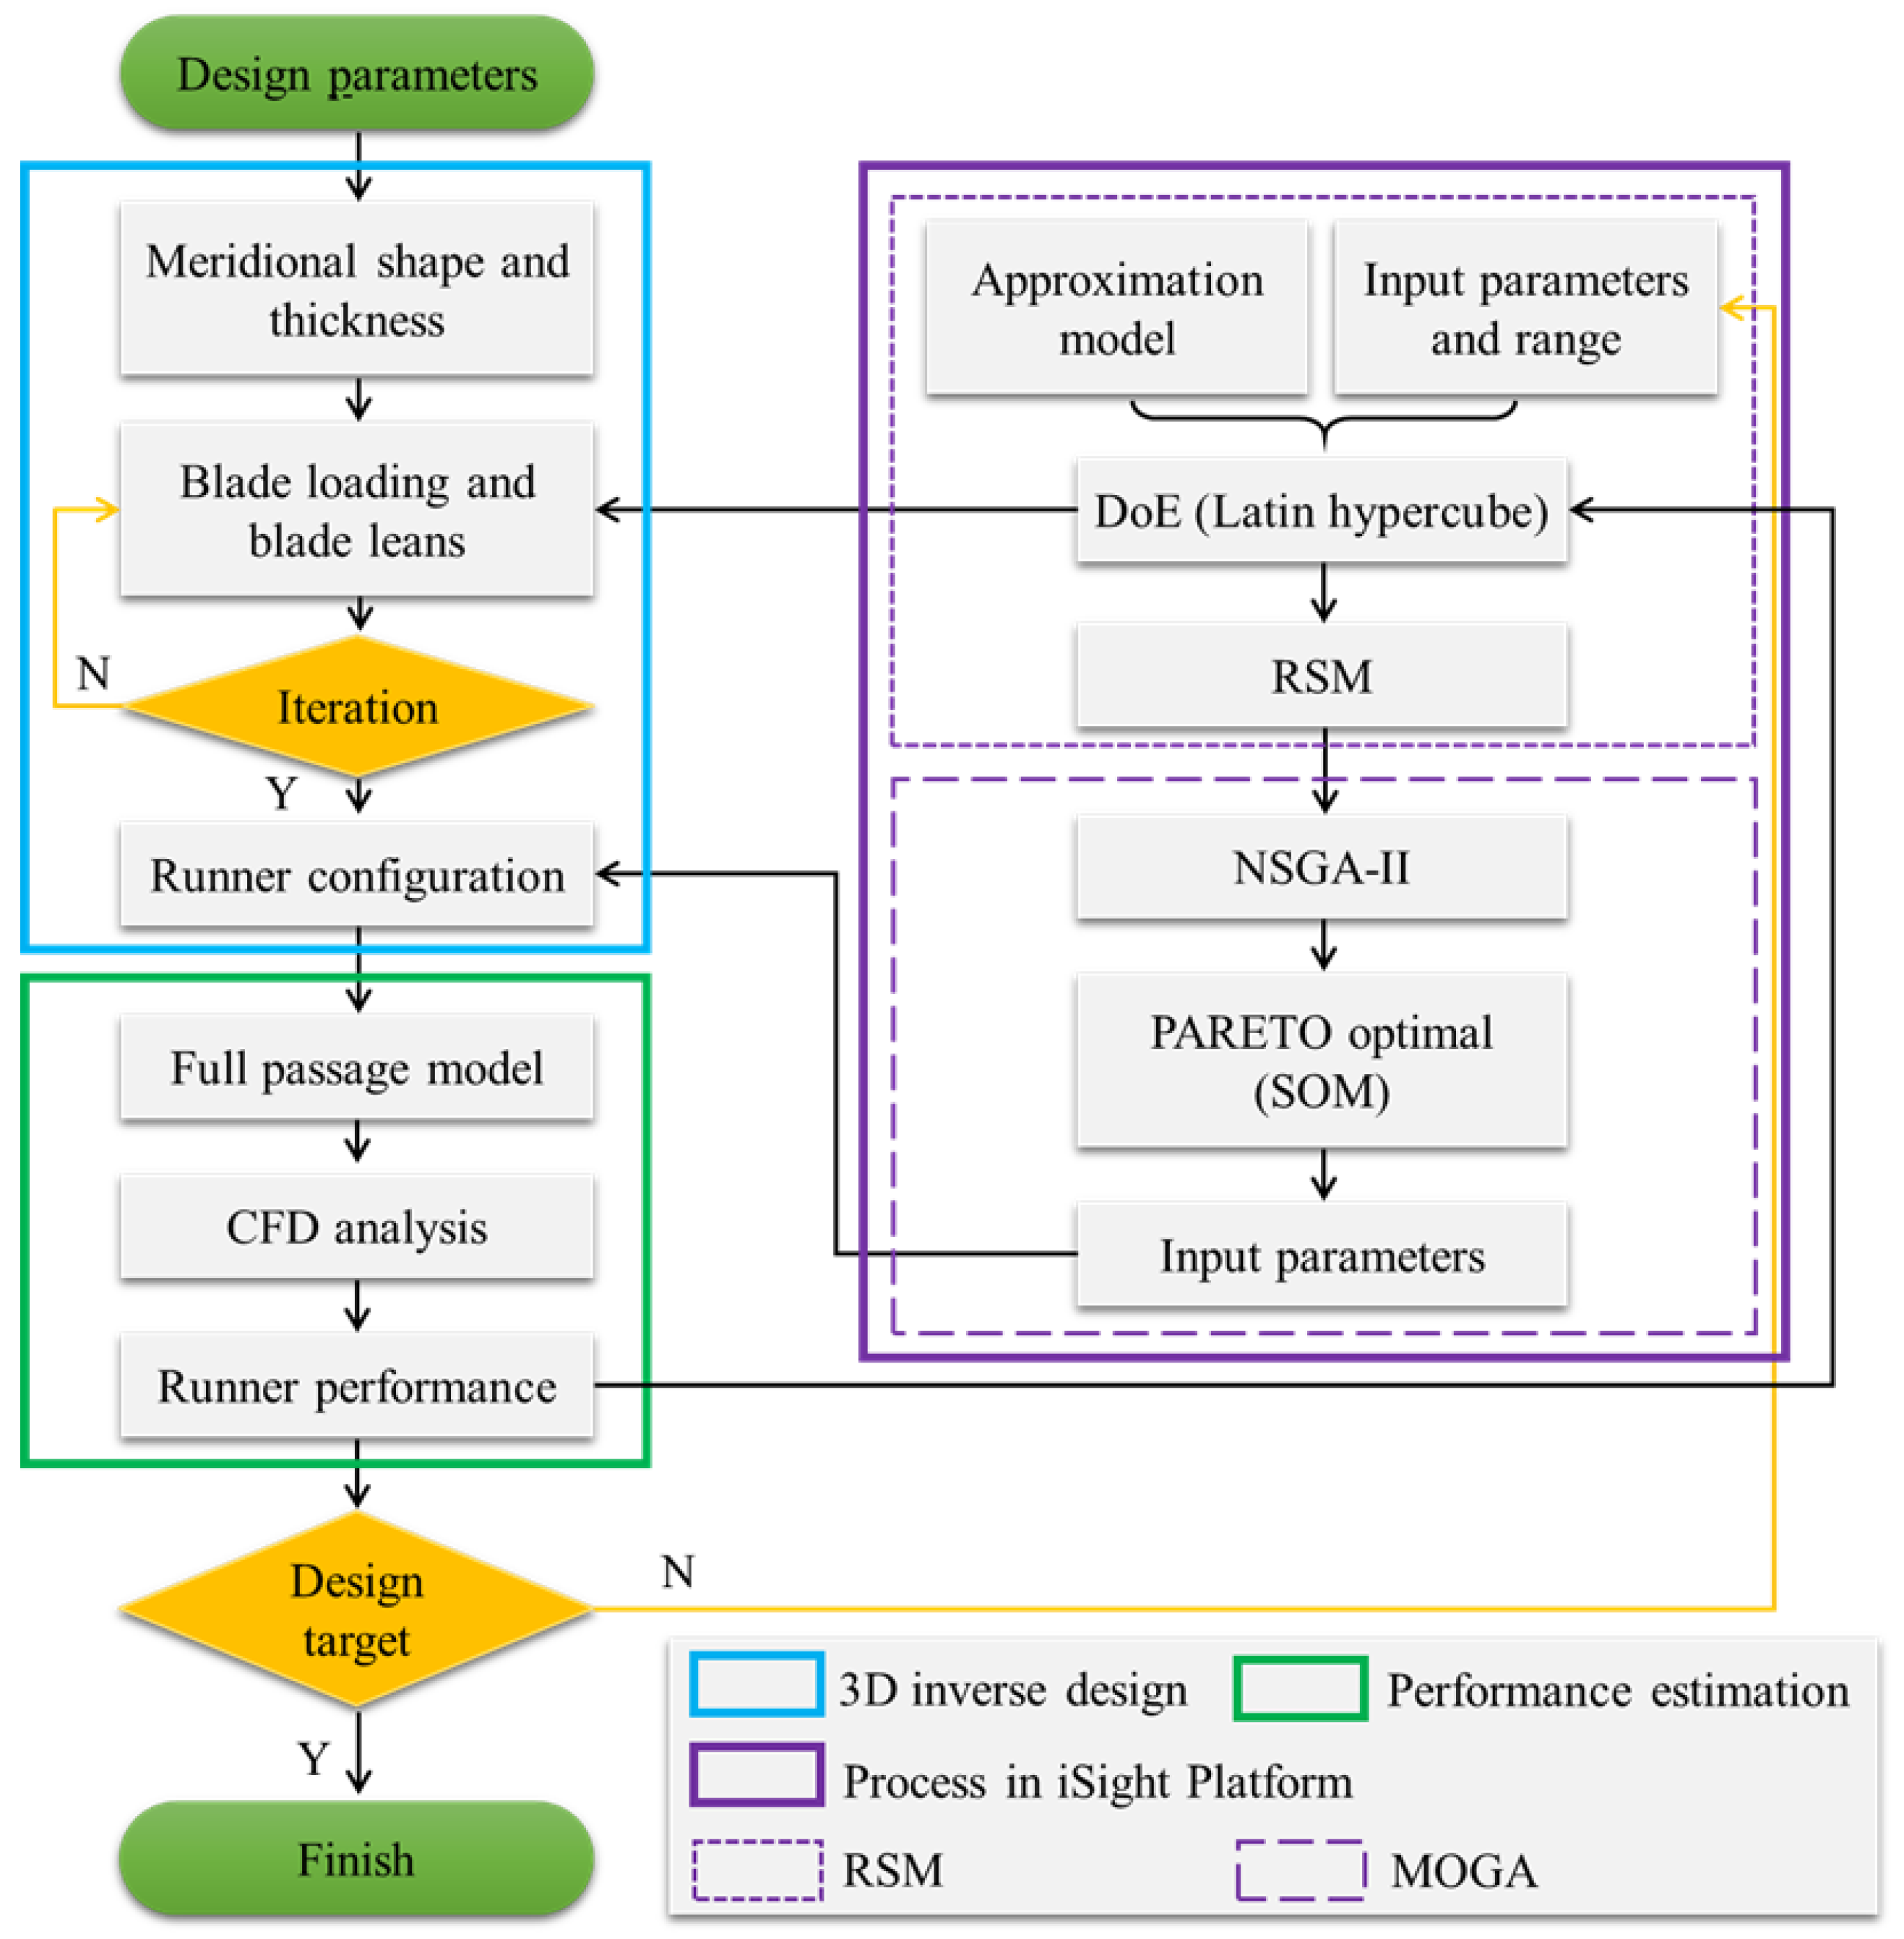
The whole optimization strategy includes runner configuration, performance estimation and the optimization calculations. Figure 4 displays the flow chart of the strategy in the present work.
An approximate relationship between the optimization objectives and input design parameters is obtained using the second-order polynomial function by RSM:
where β0, βi, βii and βik are the coefficients of the polynomial. The coefficients can be determined based on sample points in the design space by the least squares method.
In the DoE, a Latin hypercube sampling method is employed which can produces equiprobable, random sample points orthogonally distributed in the design space. To implement the multi-objective optimization a modified non-dominated sorting genetic algorithm called NSGA-II was employed. This algorithm combining the fast non-dominated sorting and crowding technique can reduce complexity of the process and improve the elitism of the strategy [21,22,23].
The optimization process began with selection of the input parameters needed in TURBODesign. These parameters can be divided into fixed and changing parameters. When the ranges of the changing parameters were decided, various runner configurations could be generated based on different groups of the input parameters by DoE.
The commercial software ANSYS CFX 17.0 was then employed to assess runner performances under different operating conditions. Based on the simulations of the CFD, the RSM between the objectives and input parameters could be determined. Finally, NSGA-II was implemented on the RSM to figure out the optimal solutions.
The Pareto front can directly visualize the trade-off relationships when the target objectives are two [21,22]. In the case of three objectives, it is still possible to visualize the Pareto surface in three-dimensional space [24,25]. However, it is not easy to visualize the Pareto space if there are more than four objectives. SOM (Self-Organizing Map) are usually used to visualize the optimization results when there are four and more objectives [31,32]. SOM is a type of artificial neural network (ANN) not only for visualization but also for the intelligent compression of sample data. In SOM, sample data in high dimensional space can be projected onto two-dimensional space so that the implicit relations such as attributes and features among data can be extracted clearly.
4. Redesign Settings
4.1. Design Parameters
Main inputs of TURBODesign include six parts: design specifications and design conditions, meridional geometry, blade thickness, blockage factor, blade loading, as well as blade stacking. Among the inputs, meridional channel geometry, blade loading, and blade stacking are dominant to generate the blade geometry and influencing performances [12,18,24,25]. Therefore, these three inputs were optimized to parameterize the blade geometry in present work, while the other inputs remained constant.
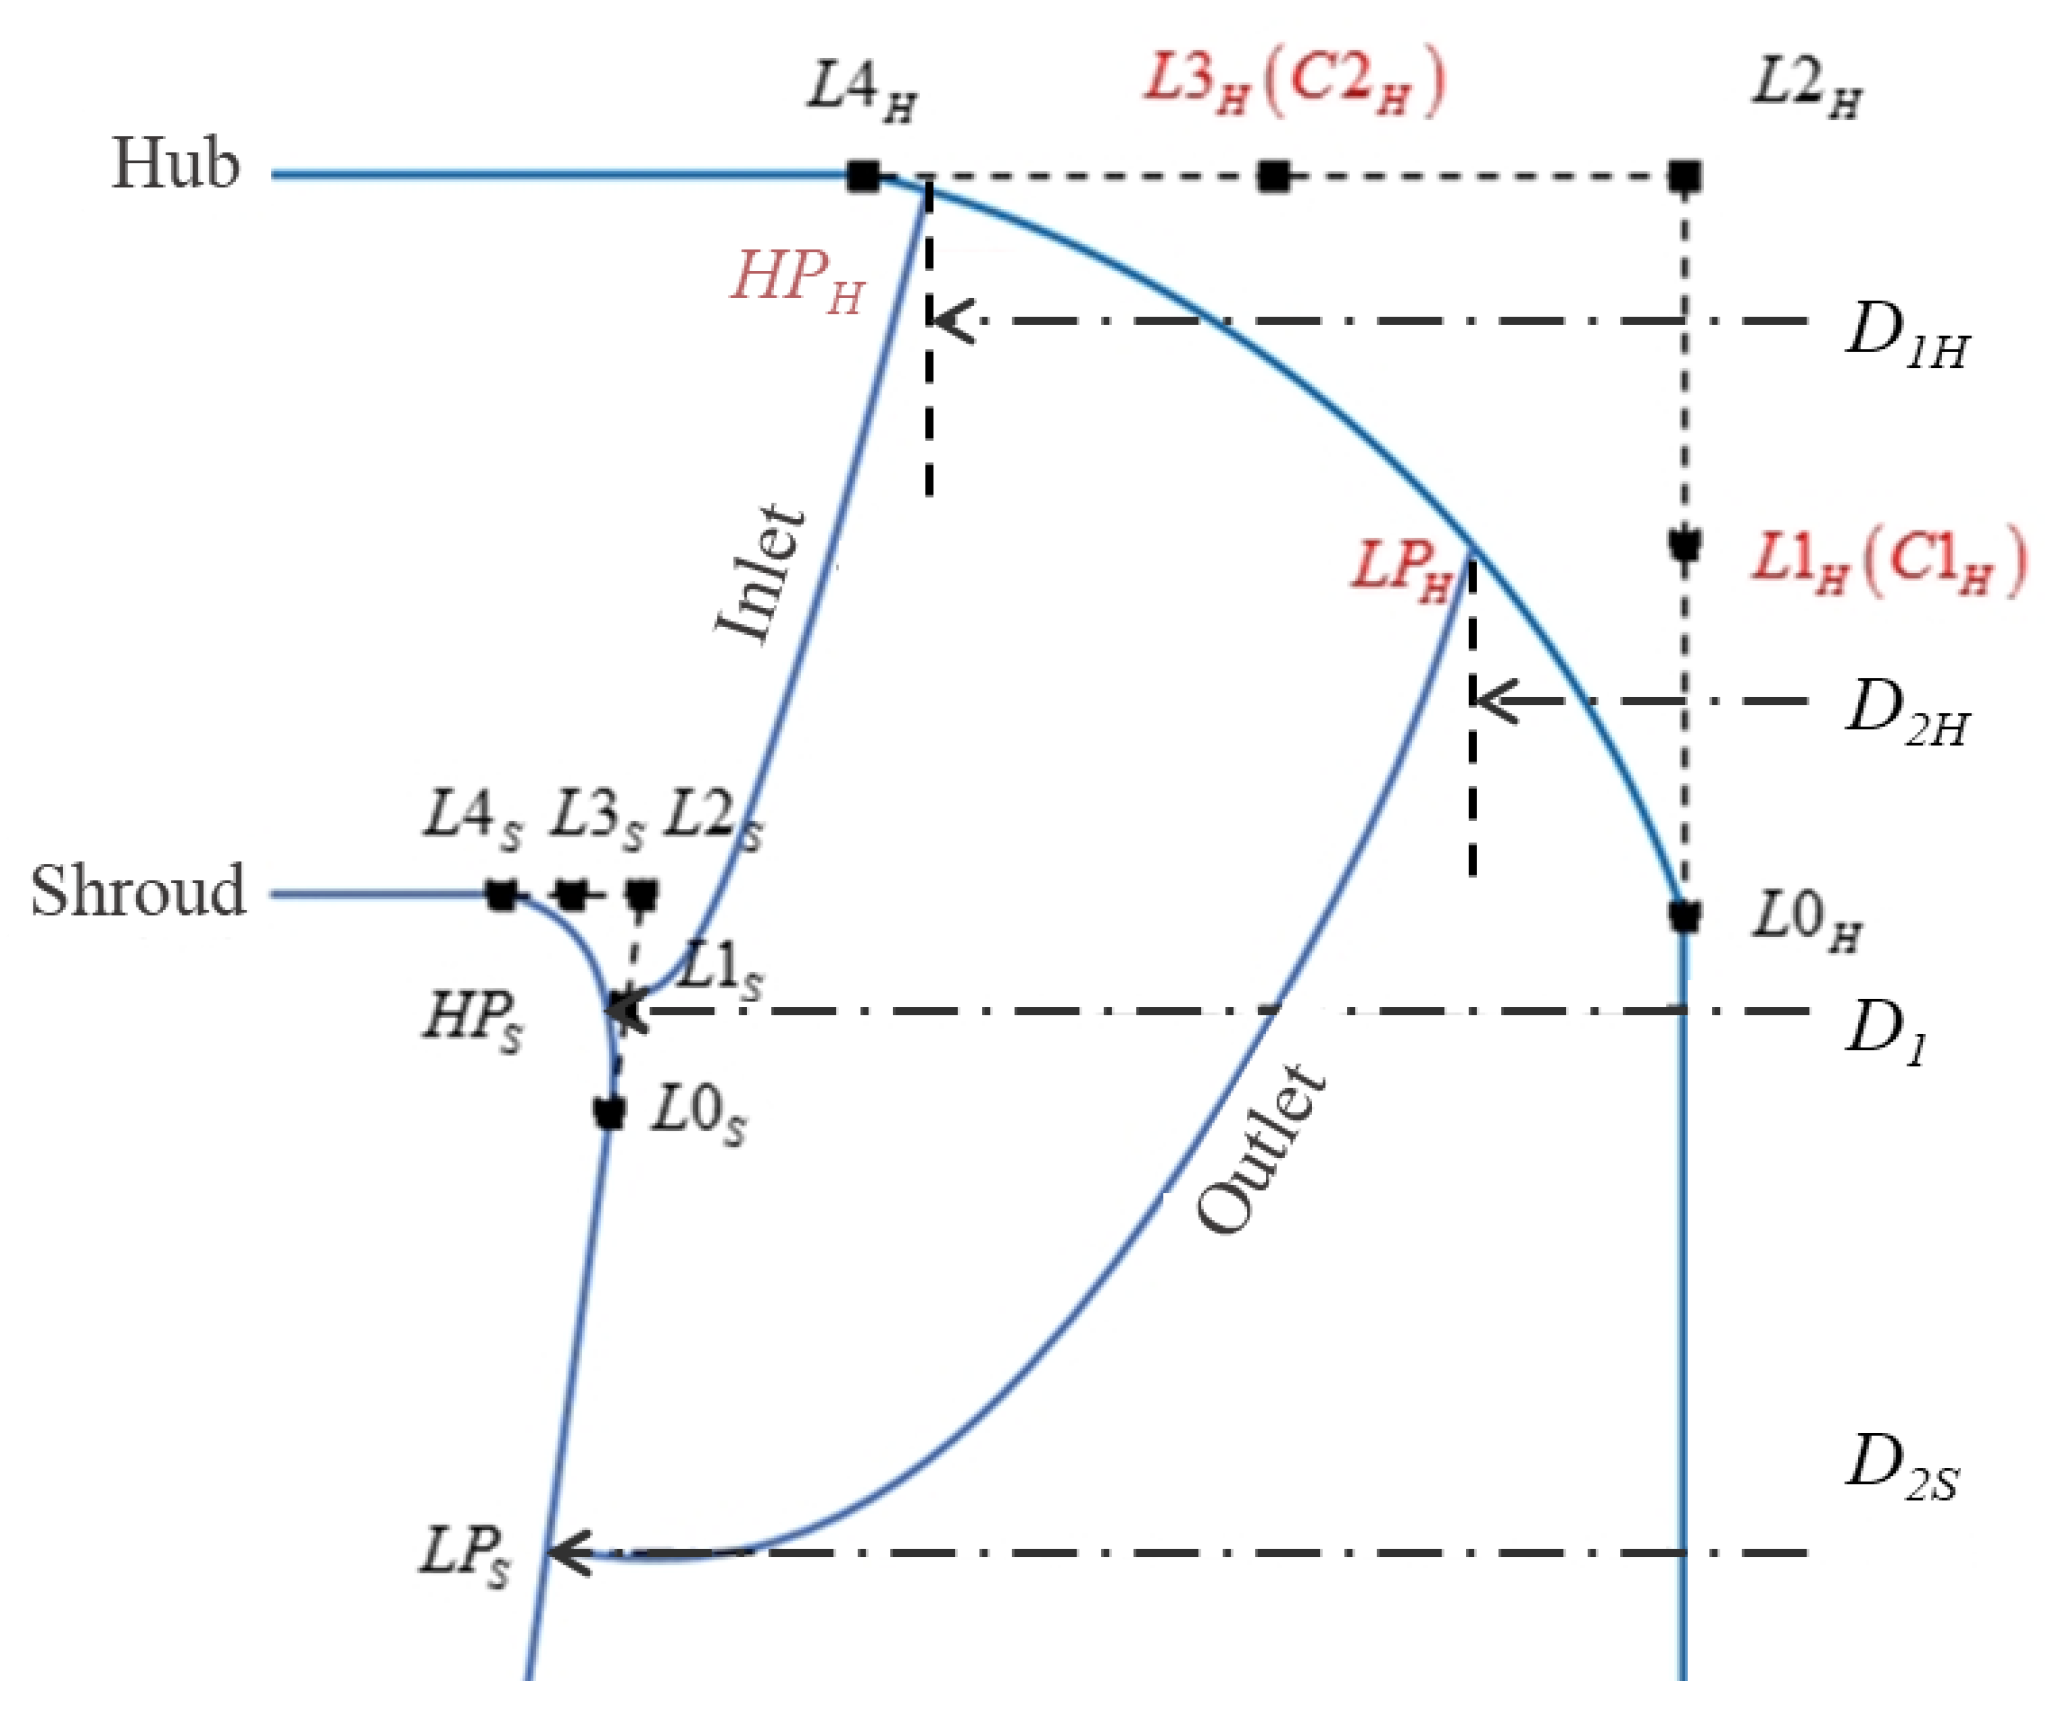
The shape of the meridional channel is composed of hub, shroud, inlet and outlet of the runner. Figure 5 shows the meridional shape for the original runner, here D1 is the shroud diameter in inlet edge, it is the nominal diameter; and D2S is the shroud diameter in outlet of the runner. The hub and shroud curves are determined by Bezier control points L0H–L4H and L0S–L4S, respectively. Considering the inlet diameter and inlet height of the runner cannot be changed during the redesign, the shroud shape remains same with the original runner. For the hub curve, Bezier points L0H, L2H, and L4H are fixed, L1H and L3H can move only along the straight line , and, separately. To facilitate the optimization calculation, the position of L1H and L3H is represented by the normalized parameters , and , respectively. Diameters D1 and D2S remain unchanged within this redesign process, therefore points HPS and LPS on shroud are fixed. The curvatures of inlet and outlet can be controlled by moving two points HPH and LPH along the hub. So that, the normalized parameters and can be utilized to change the inlet and outlet in the meridional channel shape based on the initial one.
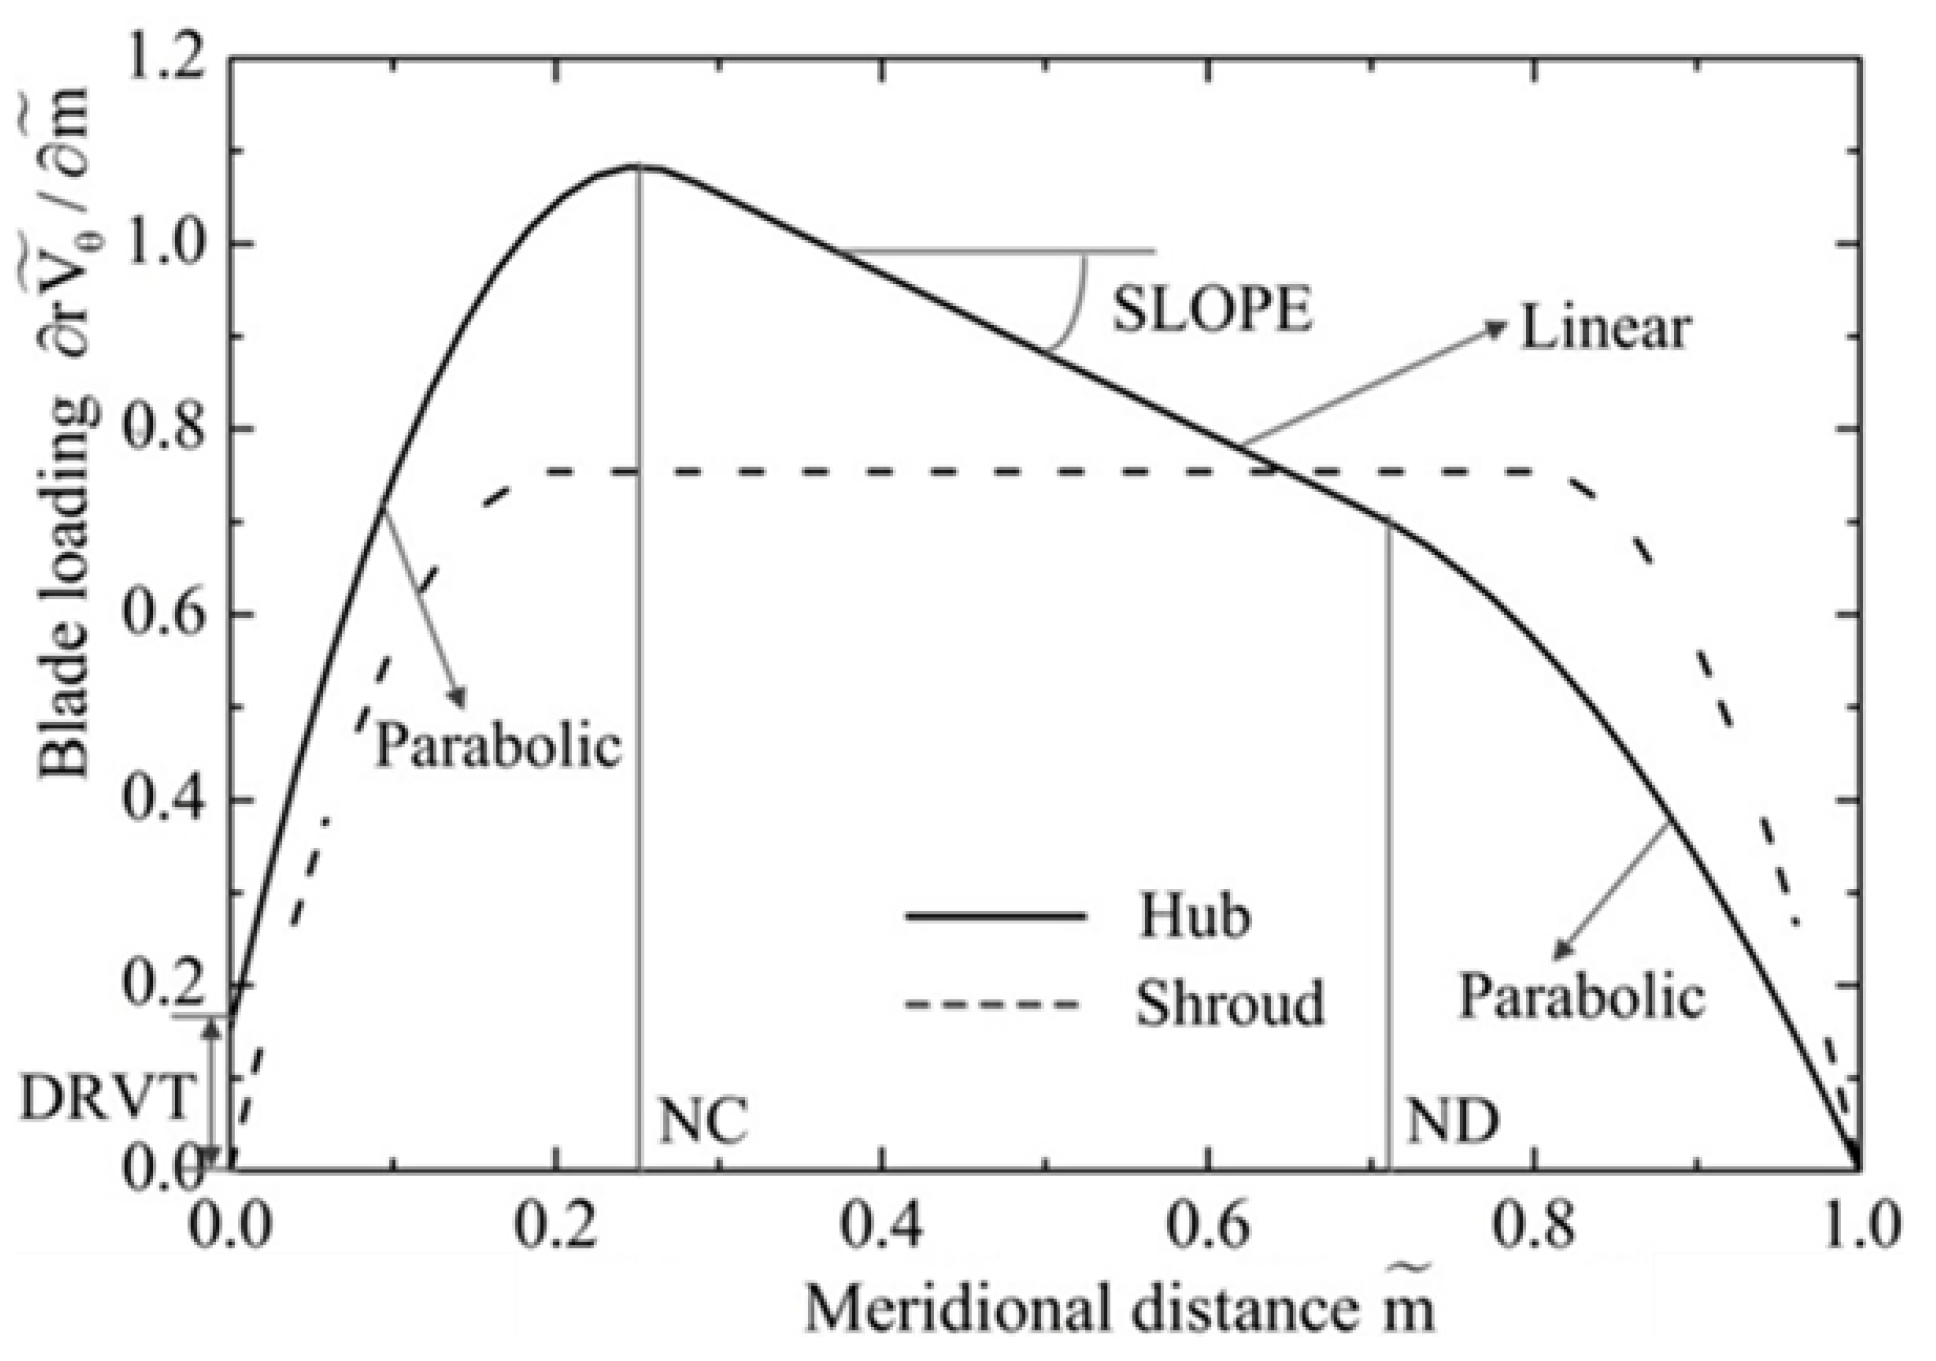
The distributions of blade loading are usually specified along the streamlines at hub and shroud. As shown in Figure 6, along each streamline, three-segment distribution was chosen and four parameters, namely, connection point locations NC and ND, slope of the linear line SLOPE, and loading at the leading edge DRVT, were employed to adjust the distribution curve. The blade loading inside the blade channel were determined by linear interpolation between the hub and shroud.
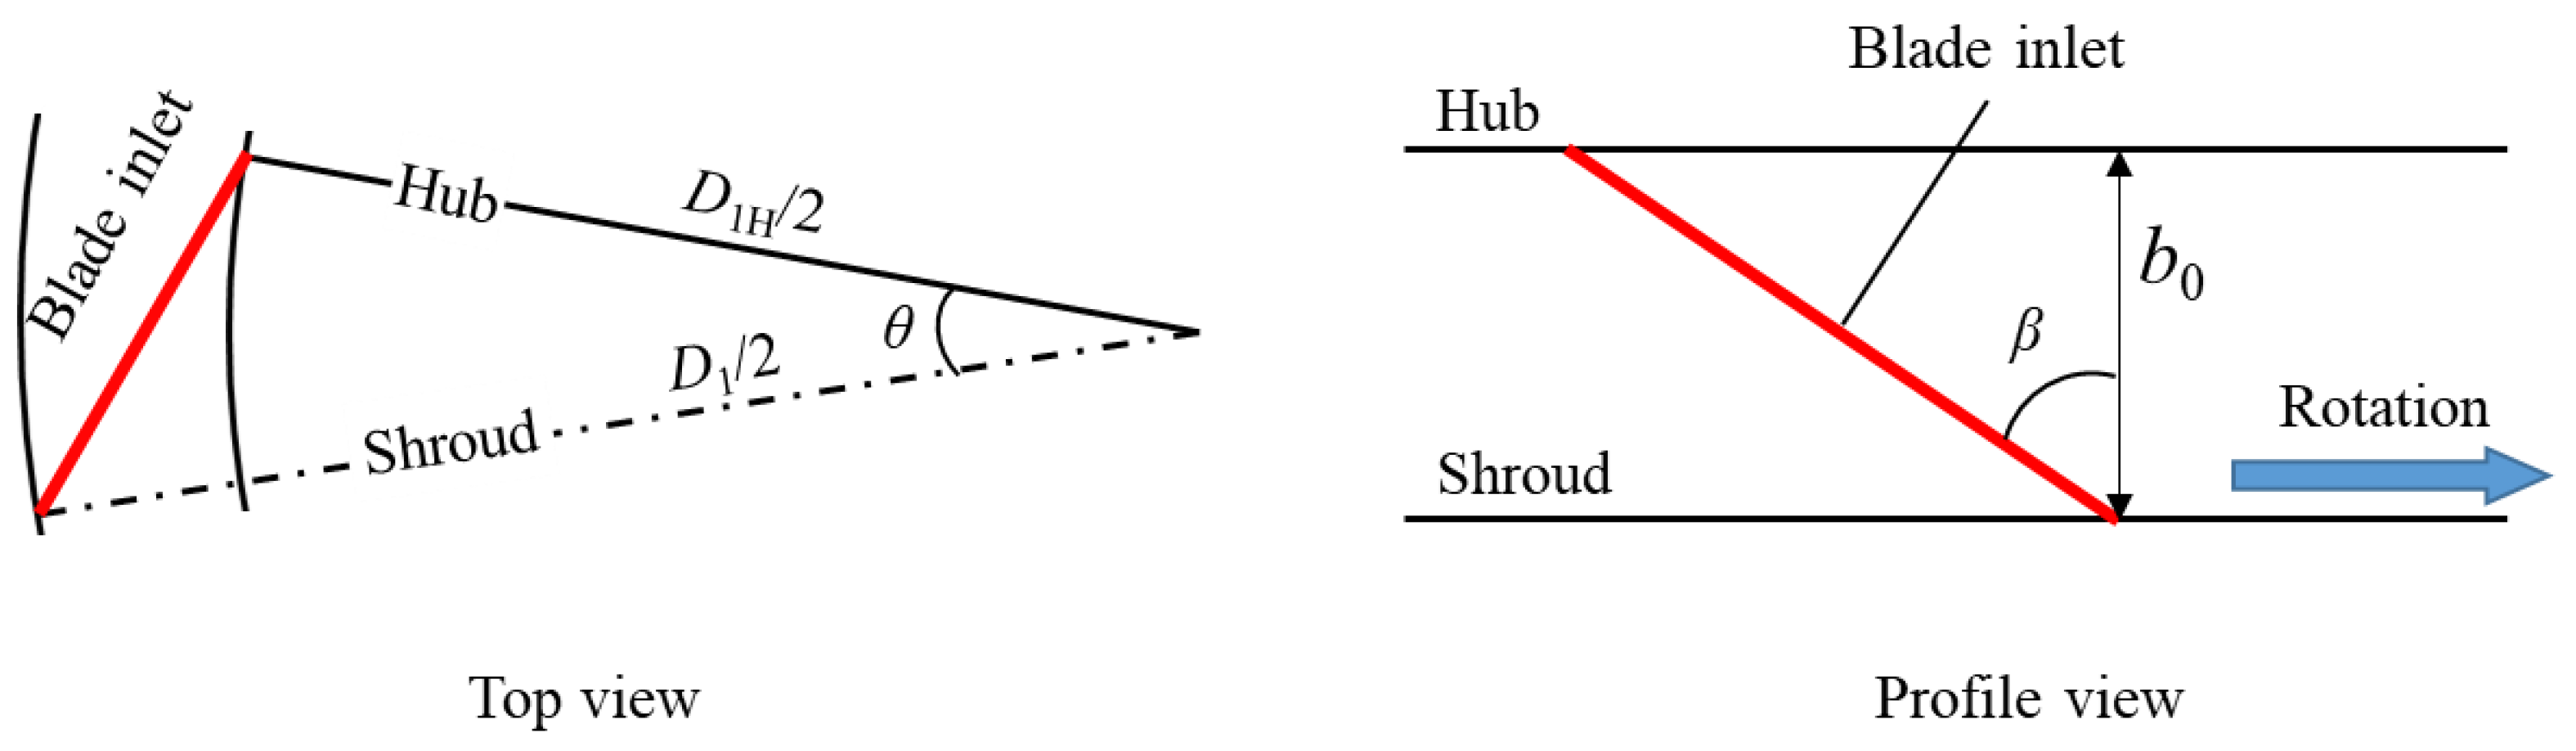
The stacking condition specifies blade lean θ at the blade inlet edge of turbine runner, which is used to prescribe the wrap angle of the blades as shown in Figure 6. The rake angle β is calculated as . Figure 7 shows that the blades are leaned against the direction of runner rotation, namely the blade at the shroud leading the blades at the hub, and θ is defined as negative. The negative blade lean increases the pressure loading at the hub and decreases the pressure loading at the shroud.
4.2. Optimization Settings
The accuracy of RSM model depends significantly on the distribution of sampling points in design space. Since the quadratic approximation Equation (5) is employed, the least number of sample points is Smin = (N + 1)(N + 2)/2, where N is the number of the selected inputs. Two-step optimization was chosen to minimize the calculation load in this study. In Table 2, the design parameters and objectives during the two steps optimization process are shown.
In the first step, the meridional channel shape was fixed, only the blade loading and blade lean at the runner inlet were optimized. As shown in the Figure 6, eight parameters were essential to change the blade loading. A great deal of trial designs was produced to figure out whether blades with a reasonable geometry could be generated in this method. In these trial designs, ND for the hub and shroud in these runners were fixed at NDH = NDS = 0.8. Ranges of the other variables were selected as shown in Table 2.
Only the turbine unit efficiency η and the minimum pressure pmin on the blade surface at rated point were taken as the targets in the first step to reduce the time cost in the total process. The efficiency η is defined in Equation (6):
where Q and H are the flow discharge and head given, and ω is the angular velocity, which can be calculated using the rotational speed n given in Table 1. In addition, torque on the runner M was calculated by CFD mode.
In the second step optimization, blade loading, blade lean at runner’s inlet as well as meridional channel shape were adjusted as inputs listed in Table 2. Based on the first step optimization results, slopes of linear lines shown in Figure 6 was more important to determine runner performance, so only these slopes were altered to produce different blade loading. Meantime, the negative blade lean was selected and the variation range was enlarged. For the meridional channel shape, the shroud was fixed, the shape of the hub, runner inlet and outlet were improved by adjusting variables C1H, C2H, CPH, and CLH.
Considering to supply a satisfactory optimization with a relative larger operation head variation by the optimization, the minimum head conditions (Hmin = 47.0 m) were excluded in the study since its head was very close to the head of the rated head conditions (Hr = 50.4 m). Apart from the condition of the rated head, the unit efficiencies at a high head (Hh = 59.7 m) conditions and the maximum (Hmax = 67.9 m) condition, as well the pmin at the blade surface at rated head were set as the optimized targets.
In order to generate the RSM model in the two steps optimization, 40 different runner geometries were gained by TURBODesign based on the least number of sample point’s requirement. The parameters setting for NSGA-II in both steps were the same, as listed in Table 3. In total 10,000 different optimized runners could be produced in each step.
4.3. Optimization Results
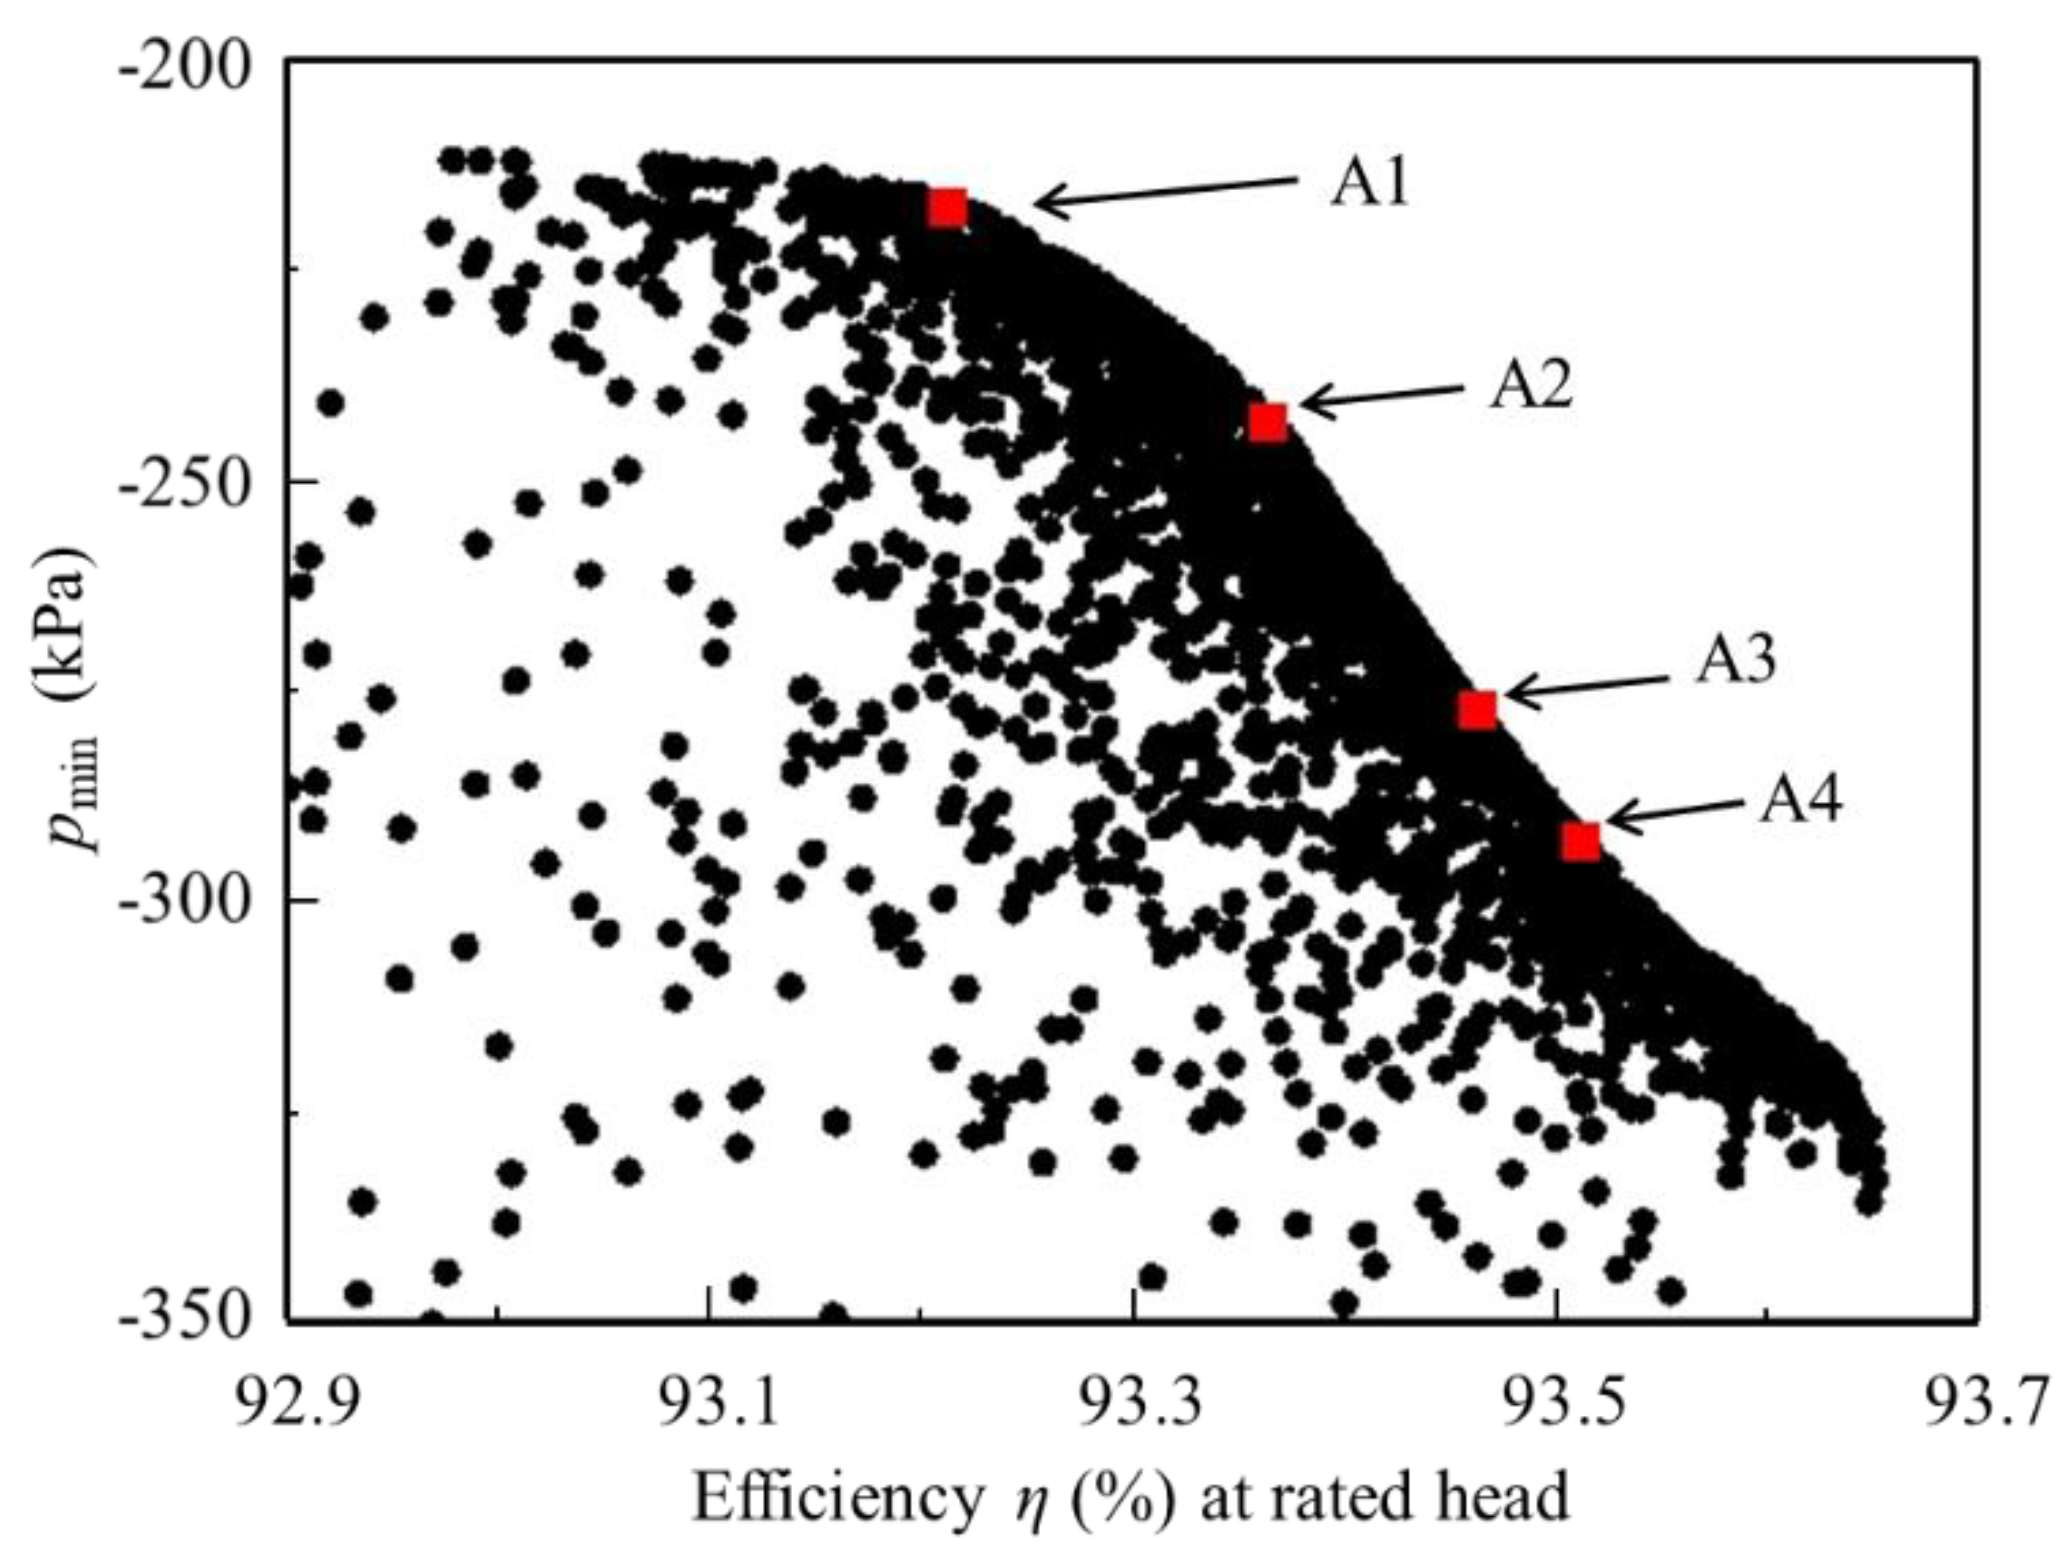
Figure 8 presents the plots of the resulting Pareto front of the first step optimization. With the increasing unit efficiency η, the minimum pressure pmin on the blade surface decreases, which means that the cavitation performance deteriorates. Four runners (A1~A4) configurations on the Pareto front in Figure 8 are chosen for further investigations in detail.
Table 4 shows the optimized input parameters, and Table 5 shows the optimized objectives obtained from the first step optimization. The comparisons of unit efficiency η and the minimum pressure pmin reckoned by RSM model and calculated by CFD for four runners A1~A4 are given. The optimized loading and blade lean of the redesigned runners display in Table 4. It can be found that the estimated values by RSM agree well with the CFD results. Compared with original runner, the unit efficiency η can be increased by 0.54% for runner A4 with optimization, whereas the minimum pressure pmin increases greatly for all the optimized runners. It also should be noticed that the optimized blade lean is −30° for all four runners A1~A4. This means that the variation range of the blade lean in the first step is not big enough, thus in the second optimization, the variation range of blade was enlarged to 0~−60° according to Table 2.
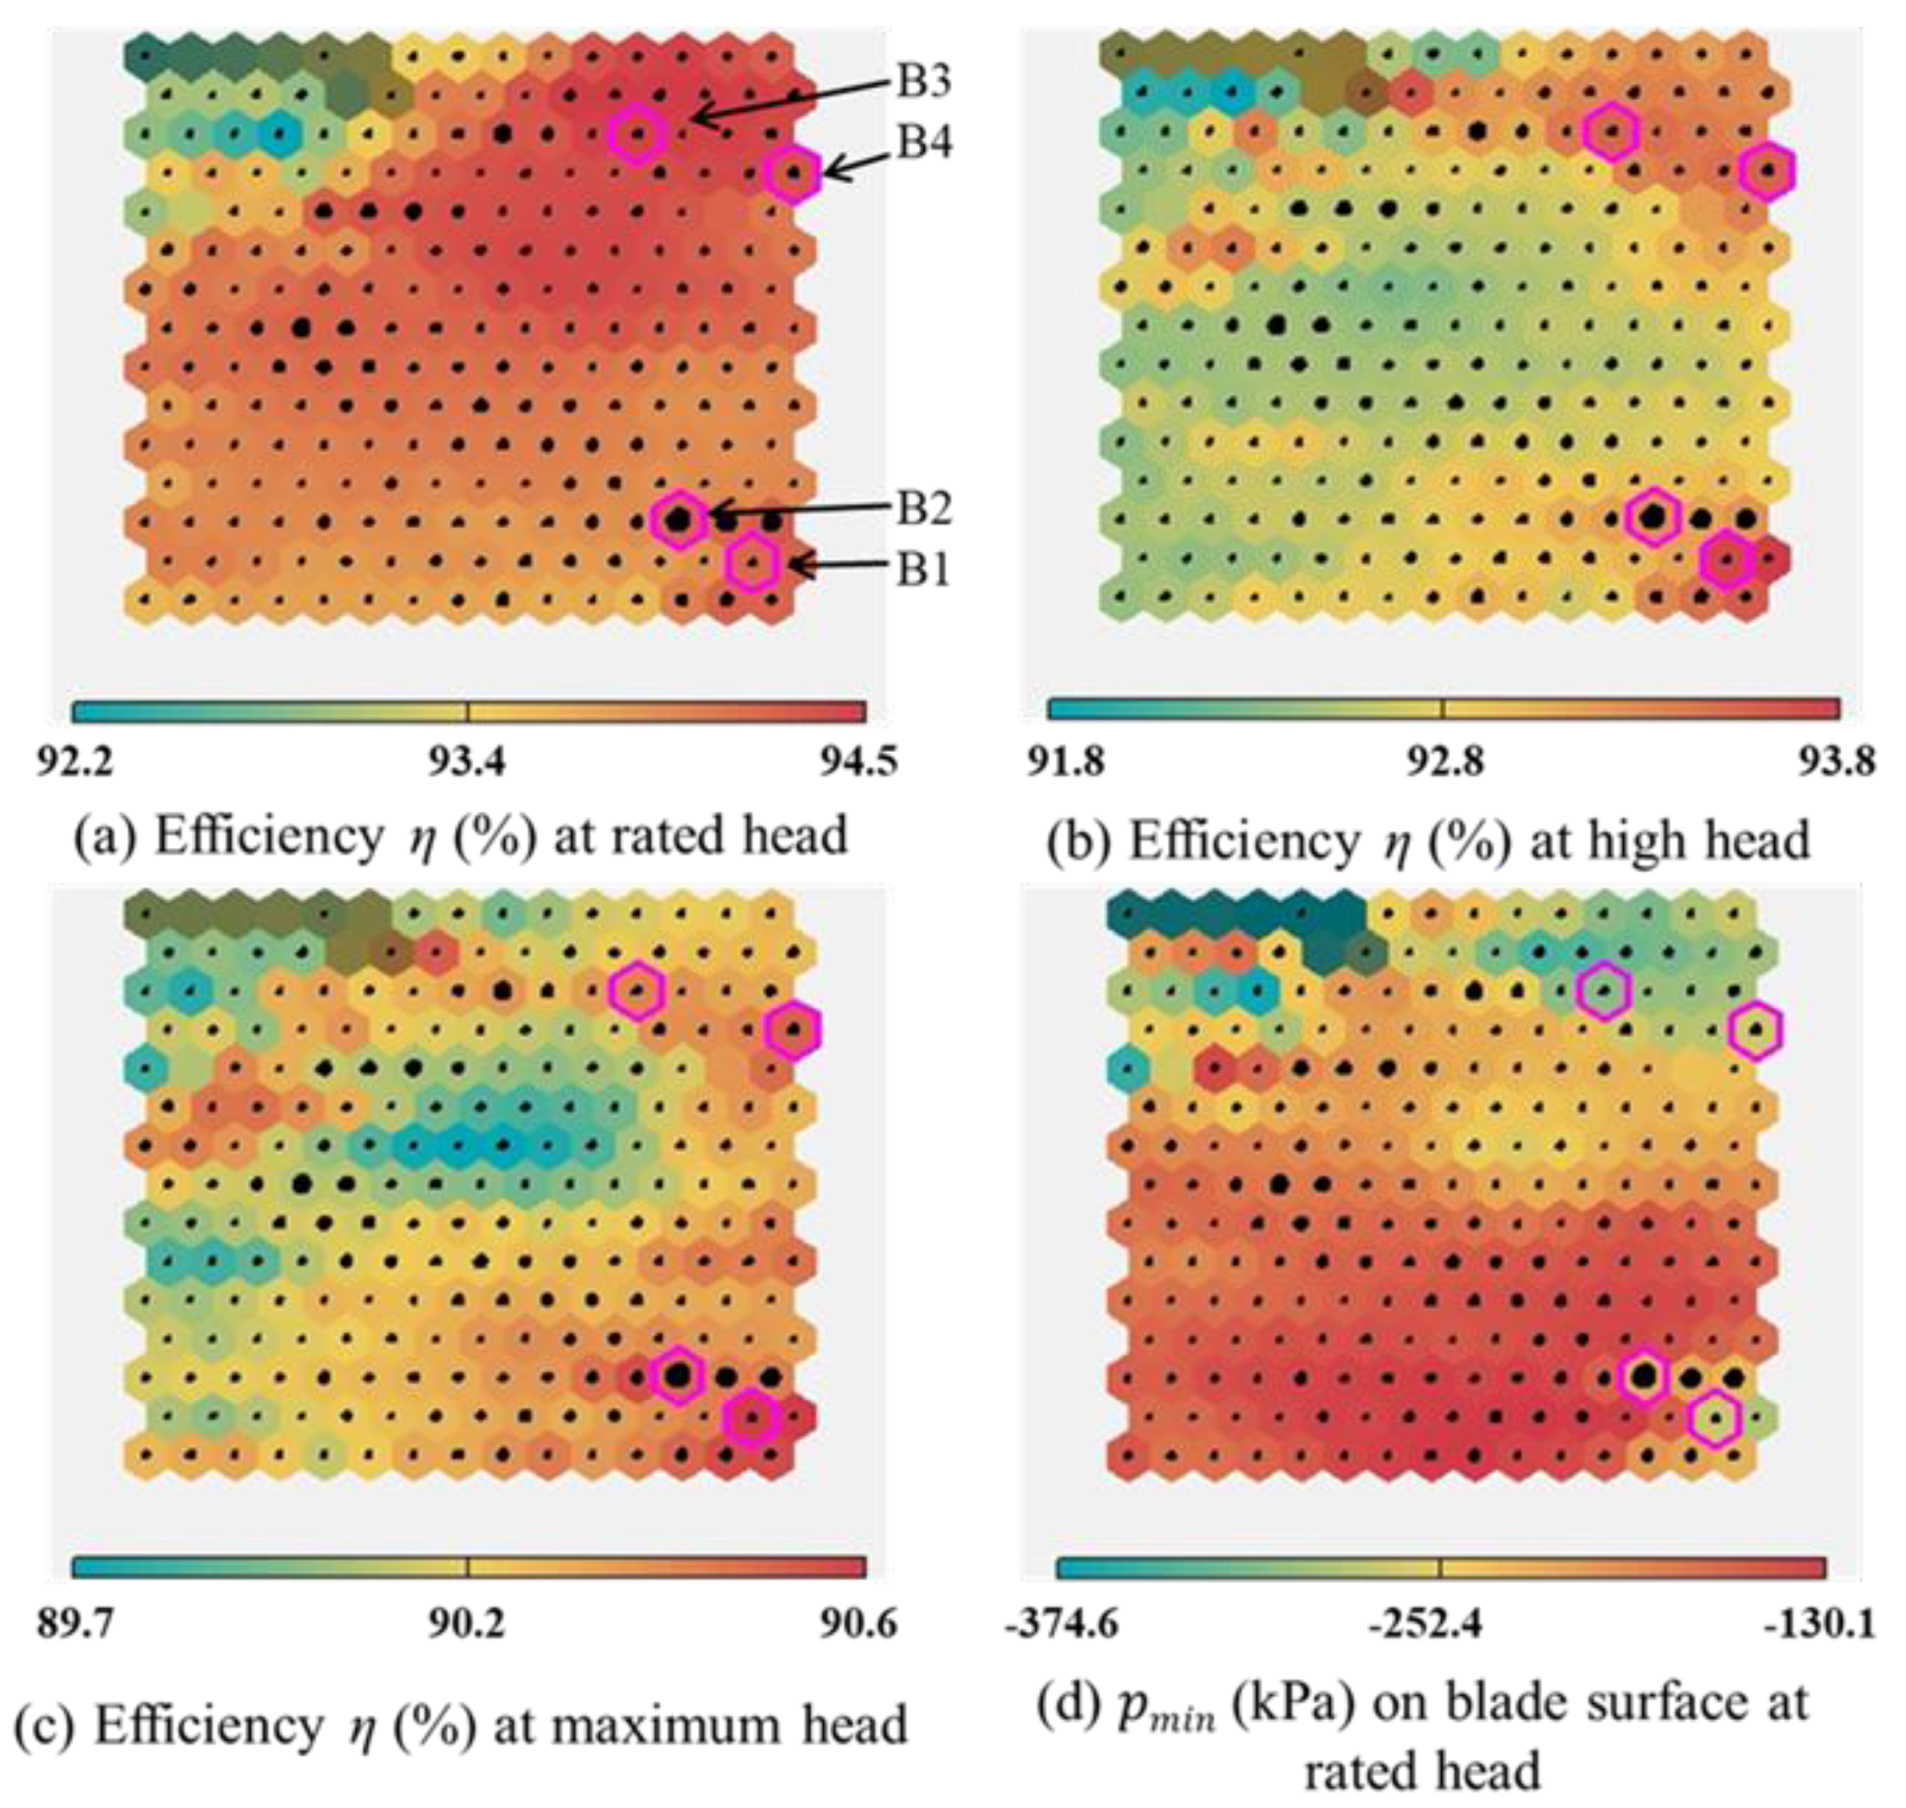
Figure 9 is the obtained SOMs in the second step optimization, where regular spacing in hexagonal grids represent a number of runners with similar input parameters and objectives. The dots in grids present Pareto solutions, and the size represents the number of the runners, the bigger of the dots the more of the runners’ number. SOMs are meanwhile colored by characteristic design objectives. The minimum and maximum values of the color bar are set using the corresponding values of each objectives in the optimization, respectively. As shown in Figure 9, there is no a sweet spot solution for all objectives, since almost of the design problems have a multi-objective nature. However, with the data mining visualization as shown in Figure 9, the selection can be handled efficiently. Four groups runner are screened as shown in Figure 9, and one runner with better comprehensive performance is selected from each group, denoted with denoted by B1~B4, respectively.
Like Table 4 and Table 5, Table 6 and Table 7 show the optimized input parameters and objectives in the second step optimization, respectively. It can be found that runners B1~B4 have better comprehensive performance than runners A1~A4. When the efficiencies and cavitation are taken into account, runner B4 is recommended as the preferred runner. For the preferred runner B4, the turbine unit efficiencies at the rated, high and maximum head are 93.96%, 93.27% and 90.33%, respectively. Compared with the initial runner, efficiencies are improved by 0.91%, 0.47% and 0.37%, correspondingly. Meanwhile, cavitation performance of the preferred runner is much better than the initial runner, the lowest pressure on the blade surface is increased by 376.2KPa at the rated head.
5. Effects of Inputs on Runner Characteristics
5.1. Comparisons between the Preferred and Original Runner
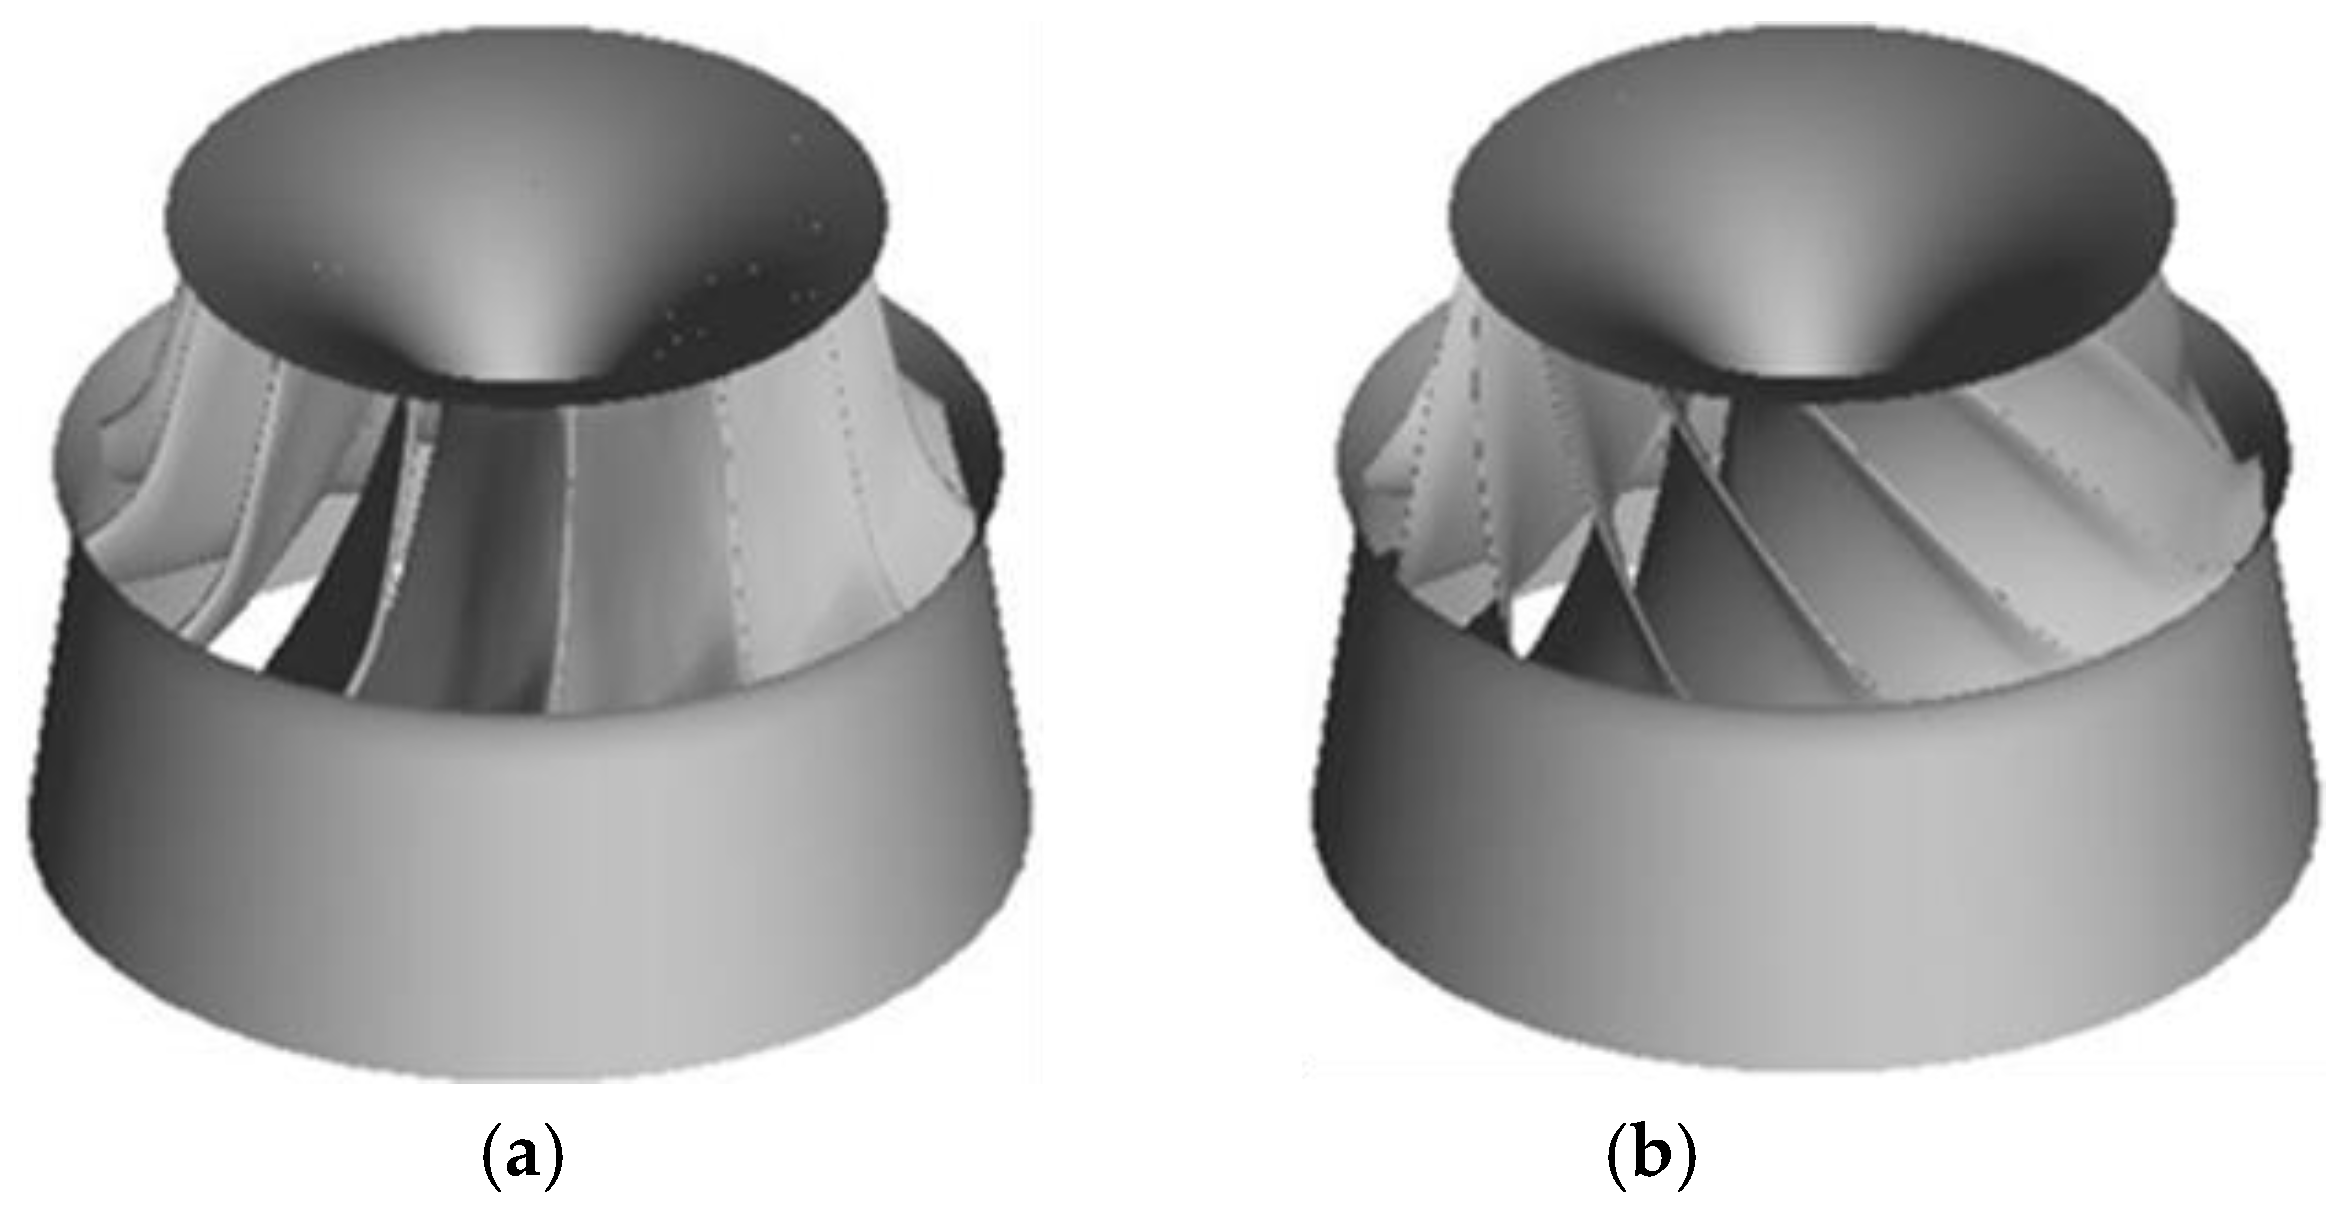
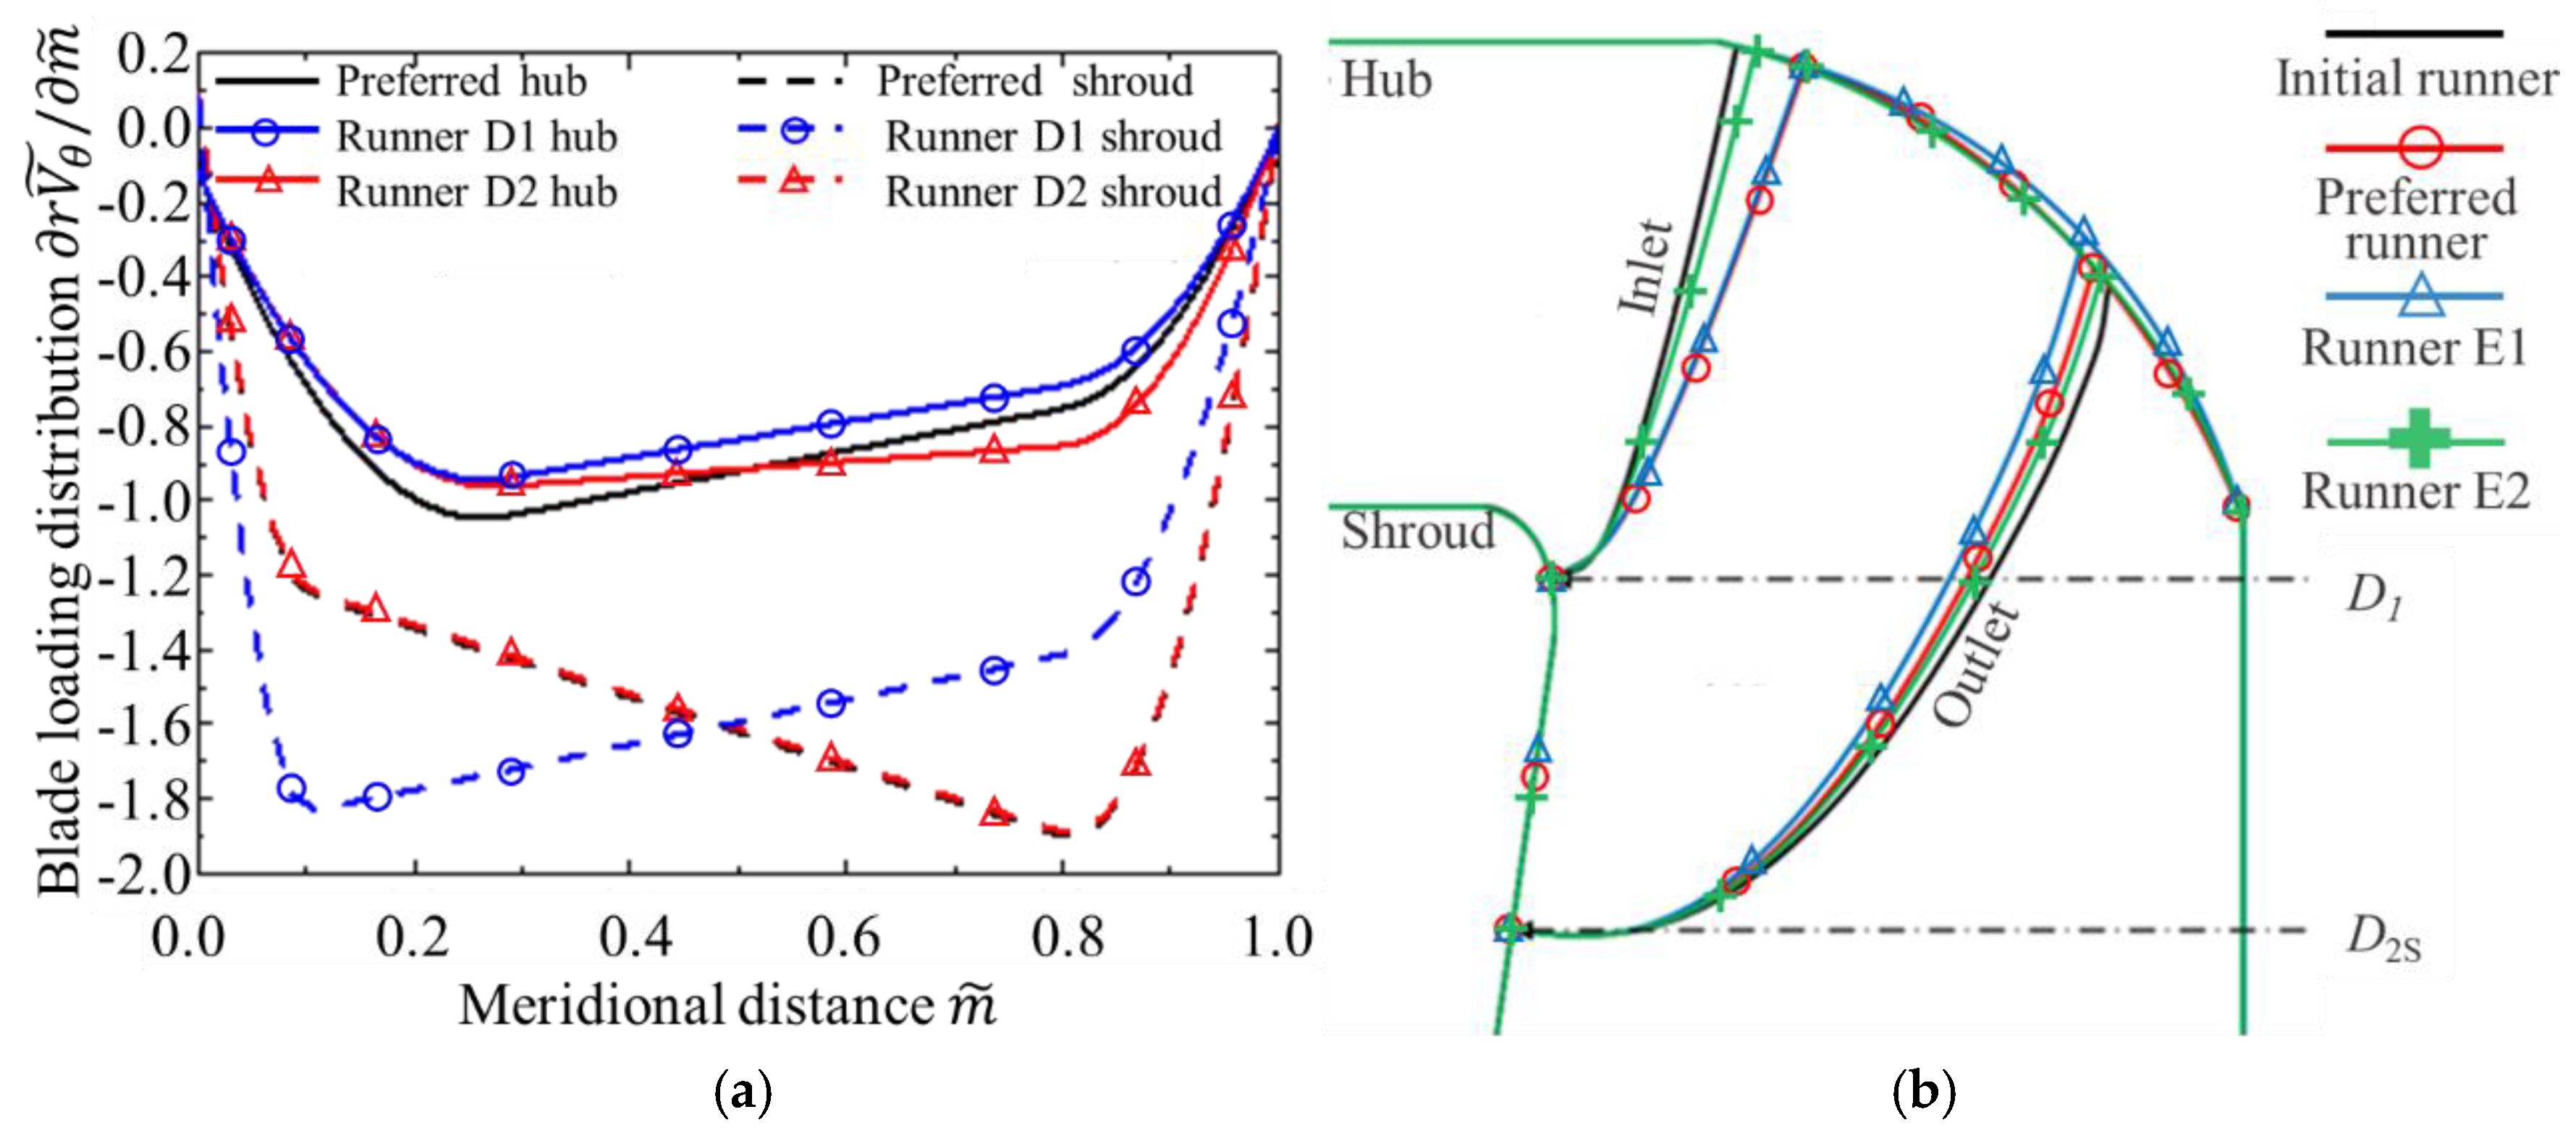
Figure 10 shows the geometries of the initial and preferred runners. The preferred runner has a large negative blade lean θ = −45.78°, while the initial runner has no lean on the runner inlet edge. It is demonstrated in Figure 11, the distributions of blade loading for the preferred runner are fore-loaded and aft-loaded on the hub and shroud respectively. According to Figure 11, the meridional channel shape is slightly narrowed, and then the meridional velocity is increased for the preferred runner, compared with the initial runner.
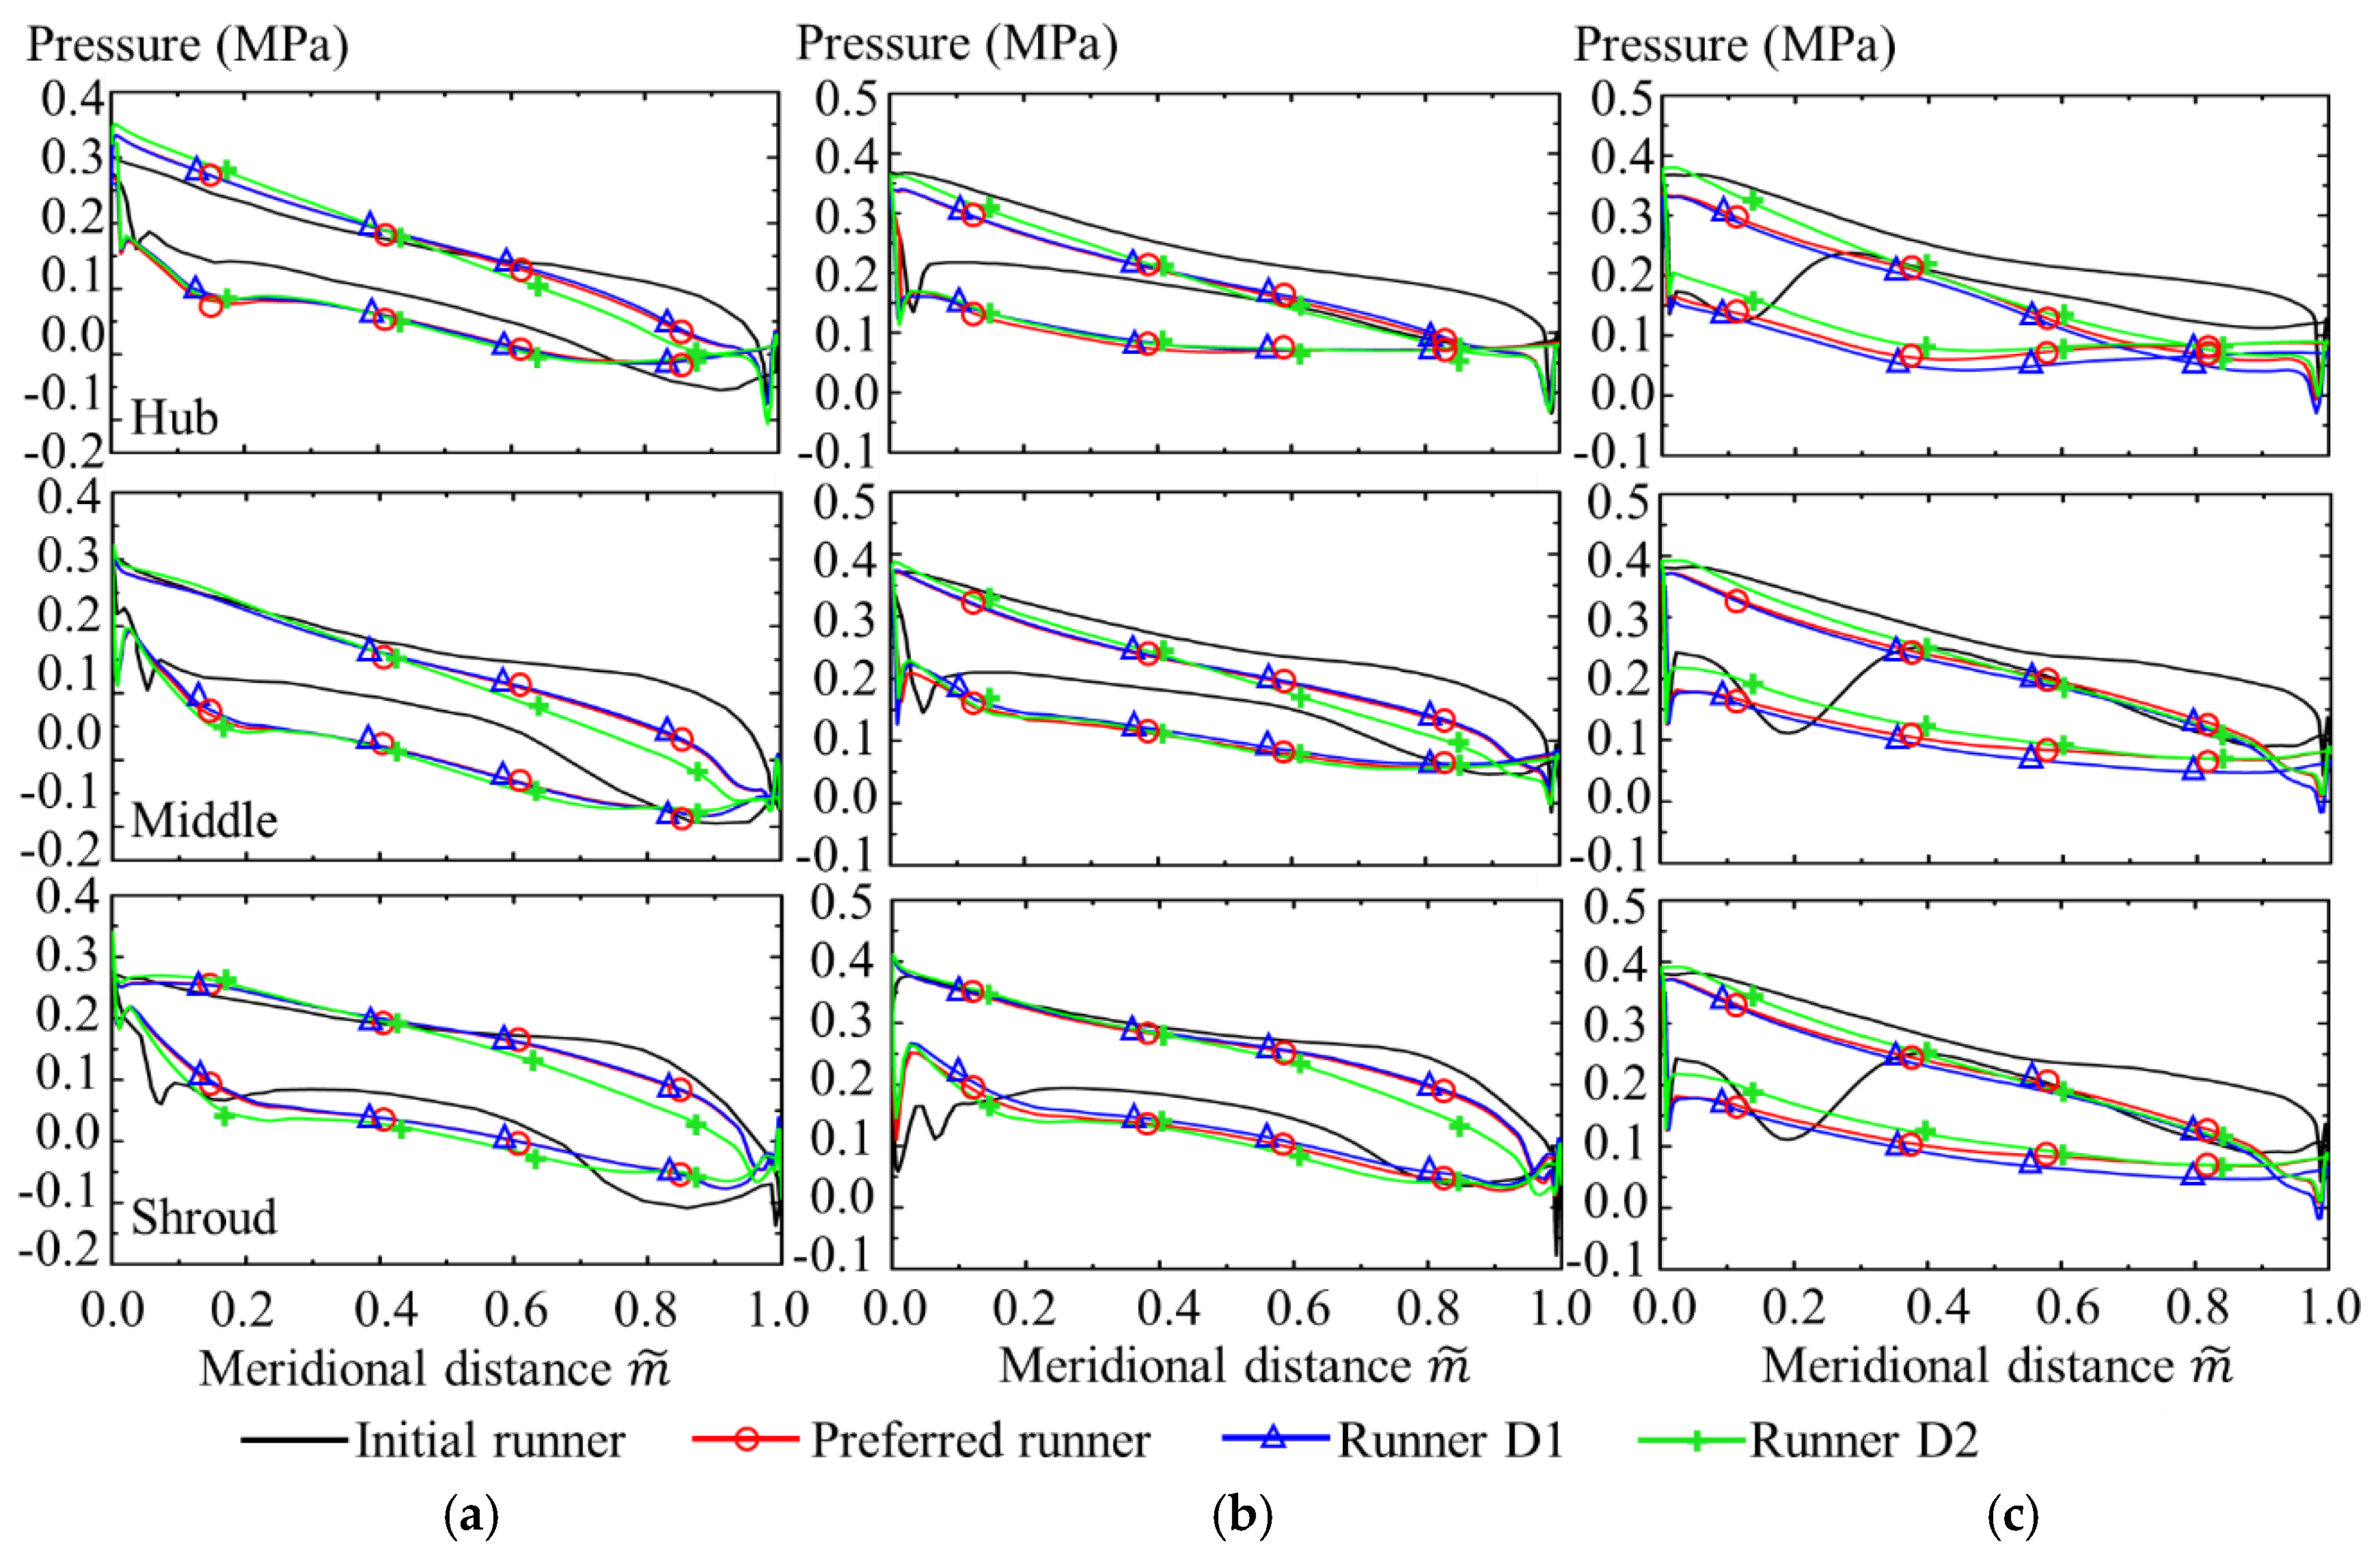
Figure 12 shows the pressure distributions comparisons on the blade surface for the initial and preferred runner under the rated head. These pressures analyzed are extracted at the hub, middle span and the shroud. By optimizing, pressure differences across the blade become well-distributed. The pressure both at the blade inlet () and outlet () is reduced, especially at the blade outlet edge, thus significantly improving the cavitation performance for the preferred runner.
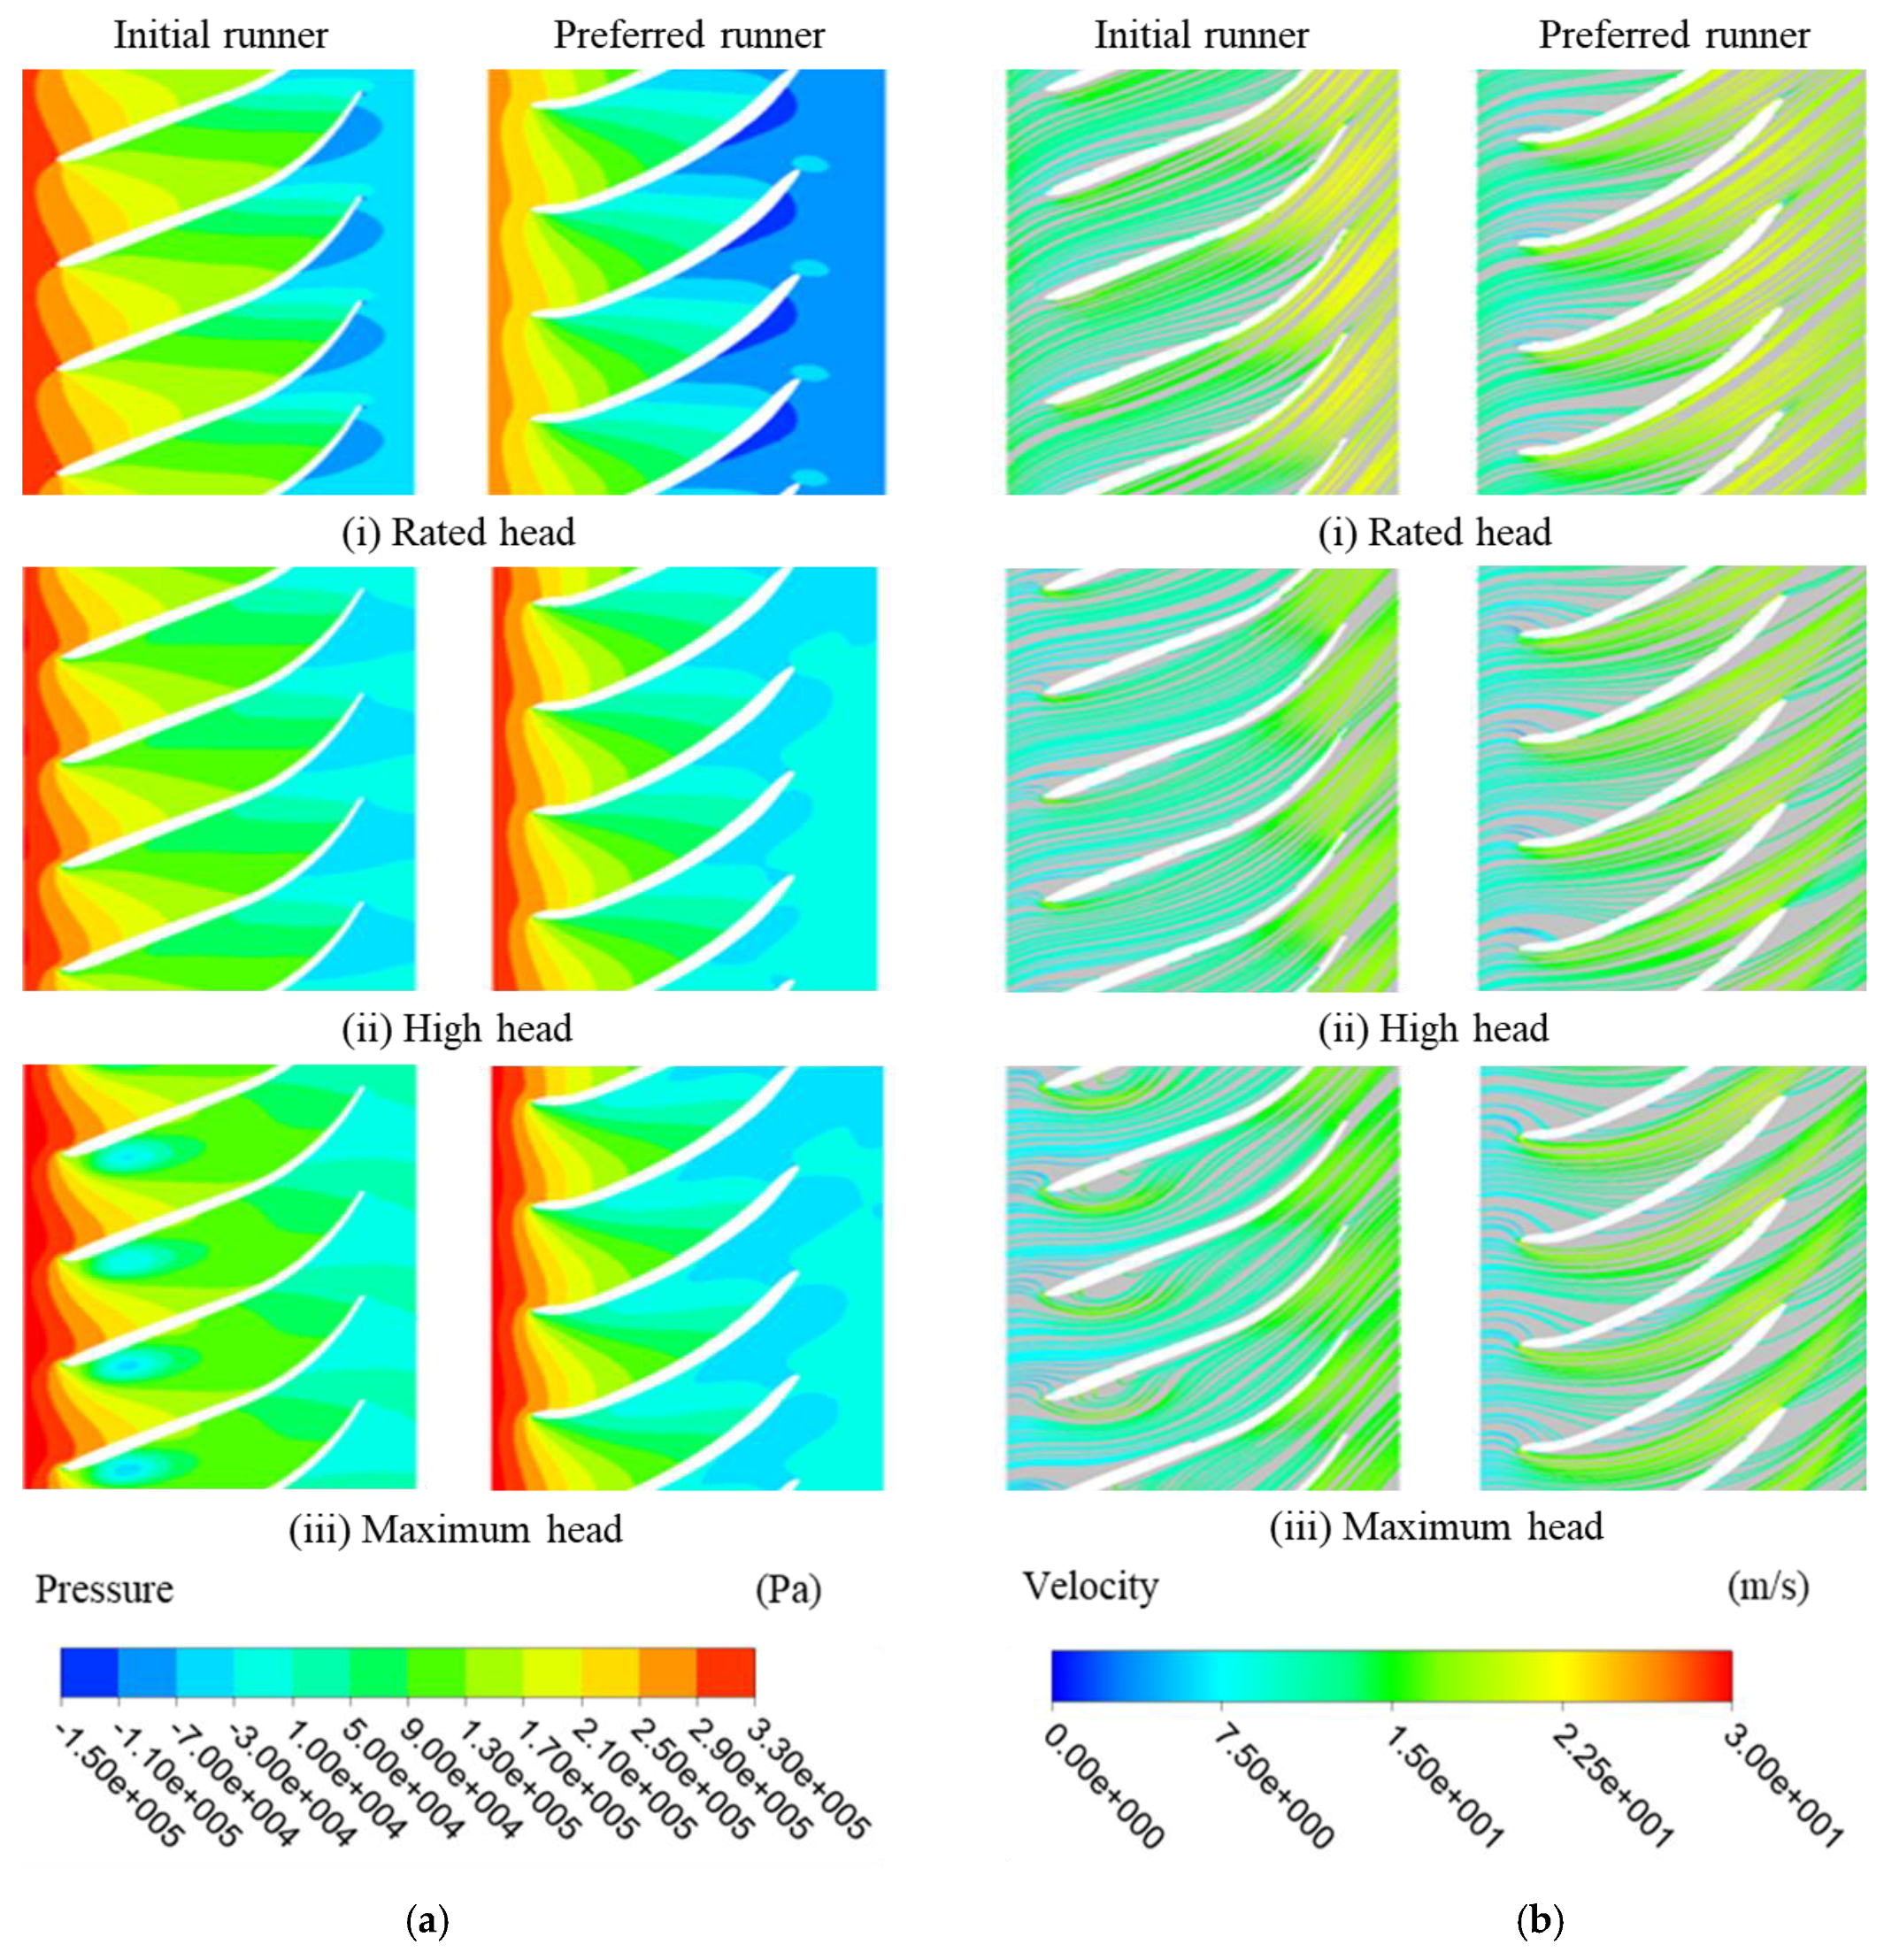
Figure 13 shows the pressure and streamline contours on the middle spanwise surface for the initial and preferred runners under three operational head conditions. As the operational head increases, the flow patterns near the blade inlet deteriorate, and flow impingement occurs at the high and maximum head for both the initial and preferred runners. For initial runner under maximum head as shown in Figure 13a, near the inlet and on the blade suction sides, separated vortices are generated, which are the so-called interblade vortices. The interblade vortices usually occur at high operation head, and induce pressure fluctuations and blade vibrations [33,34]. Therefore, the cracks occurred in Figure 1 maybe induced by the vortices in the flow passages under the maximum head for a long period. By conducting the optimization, as shown in Figure 13b, the interblade vortices are vanished under the maximum head. Therefore, with optimization redesign, not only efficiency can be increased, operation stability can be improved and operation life can be lengthened as well.
5.2. Effects of Optimized Parameters
In order to estimate the effects of the main design inputs on the unit performances and to validate the optimized results, more runners listed in Table 8 are selected from the optimized runners in the second step optimization. The performances of these runners, as well as the initial runner and the preferred runner are listed in Table 9.
5.2.1. Effects of Blade Lean
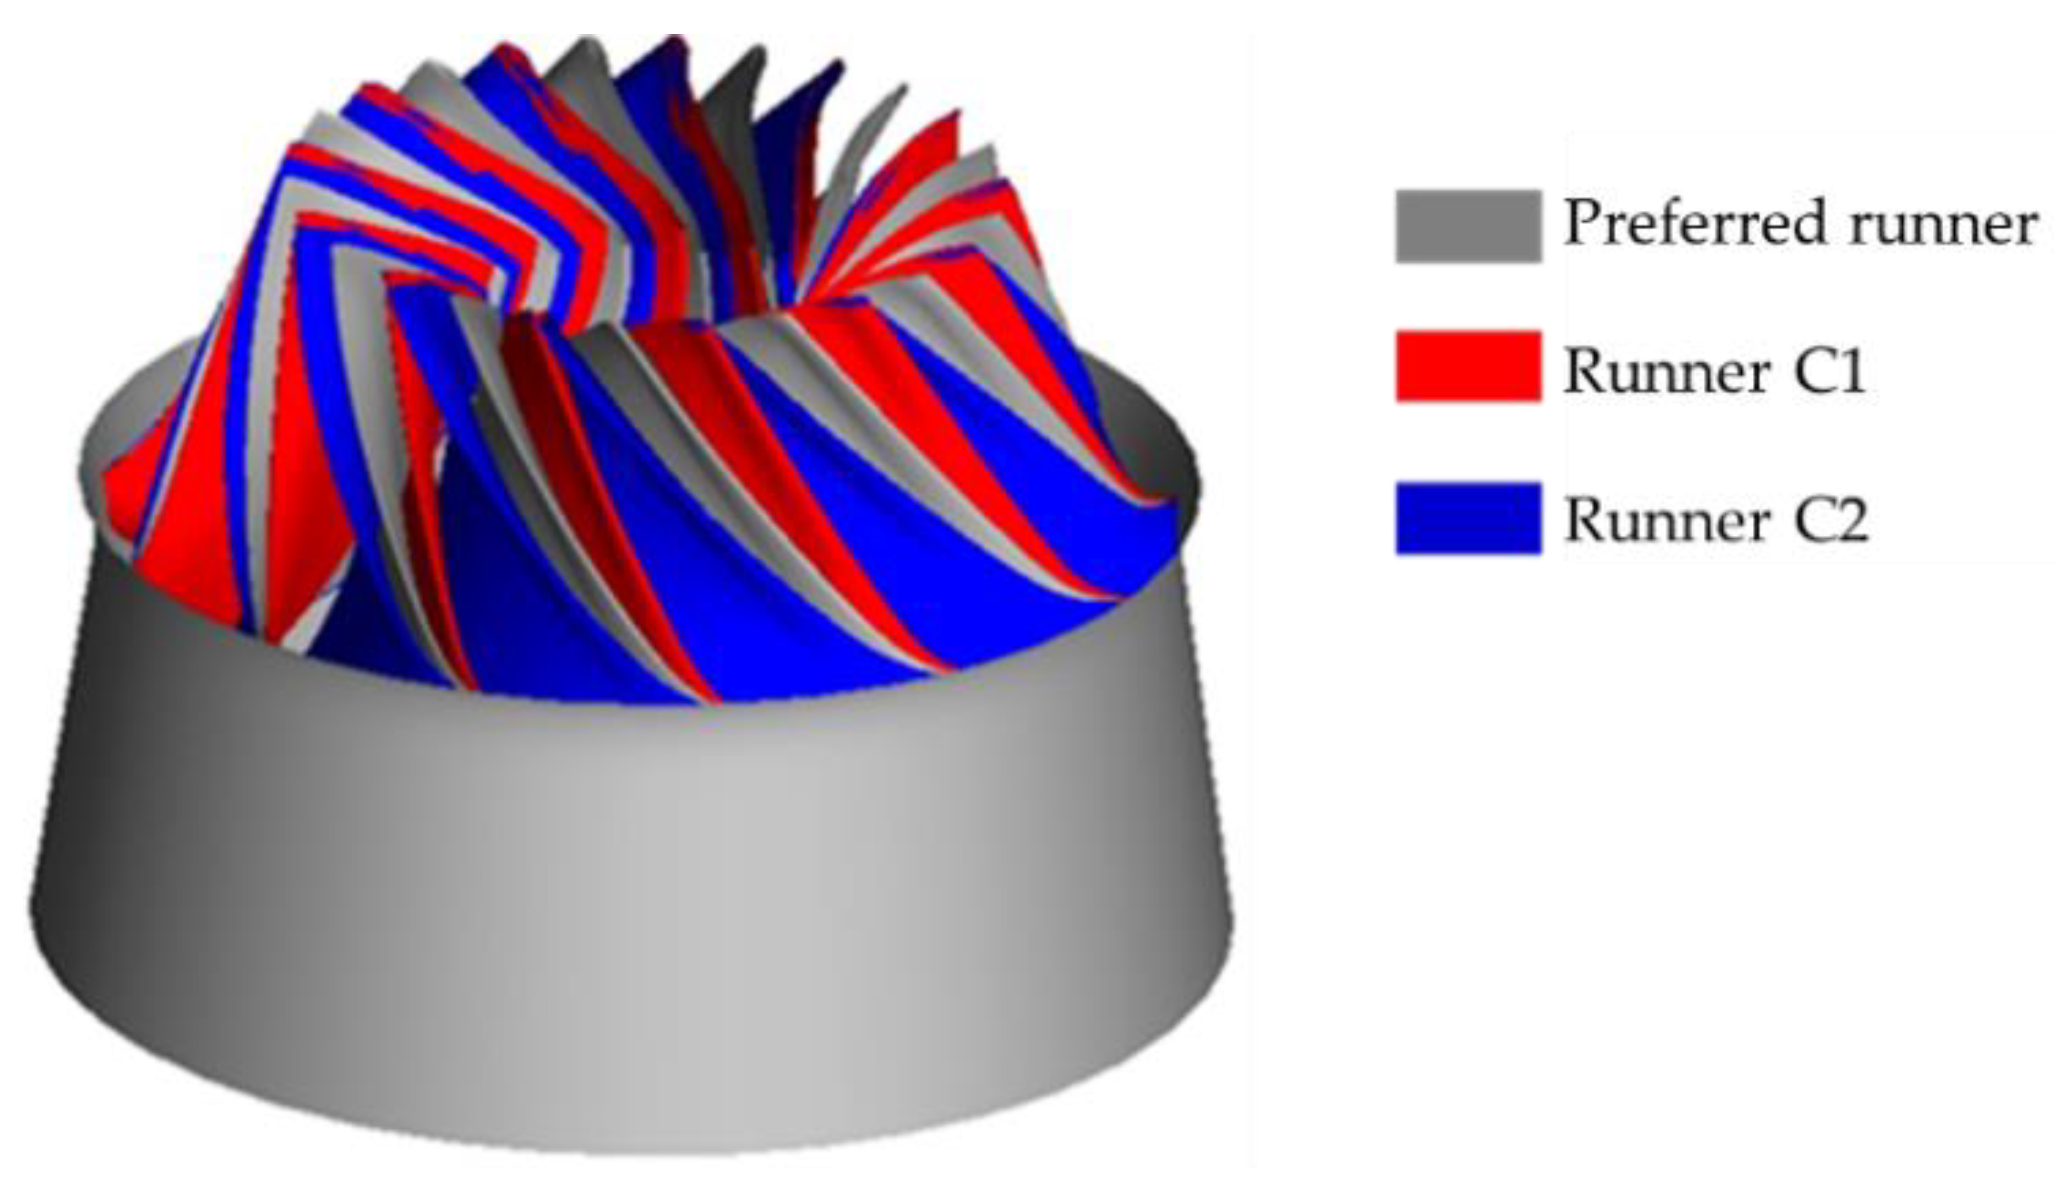
For runners C1 and C2, according to Table 8, the blade loading distributions and meridional shapes are nearly the same with the preferred runner, whereas the blade lean angles changed significantly, θC1 = −31.44°, θP = −45.78° and θC2 = −59.93°, respectively. Figure 14 demonstrates the configurations of these runners, the blade shape changes largely.
Table 9 shows that the preferred runner has highest unit efficiency, runner C1 has higher unit efficiency, which is better than the initial runner, and runner C2 has almost some efficiency with the initial runner. For all the runners, the minimum pressure on the blade surface is much smaller than the value in the initial runner under the rated head.
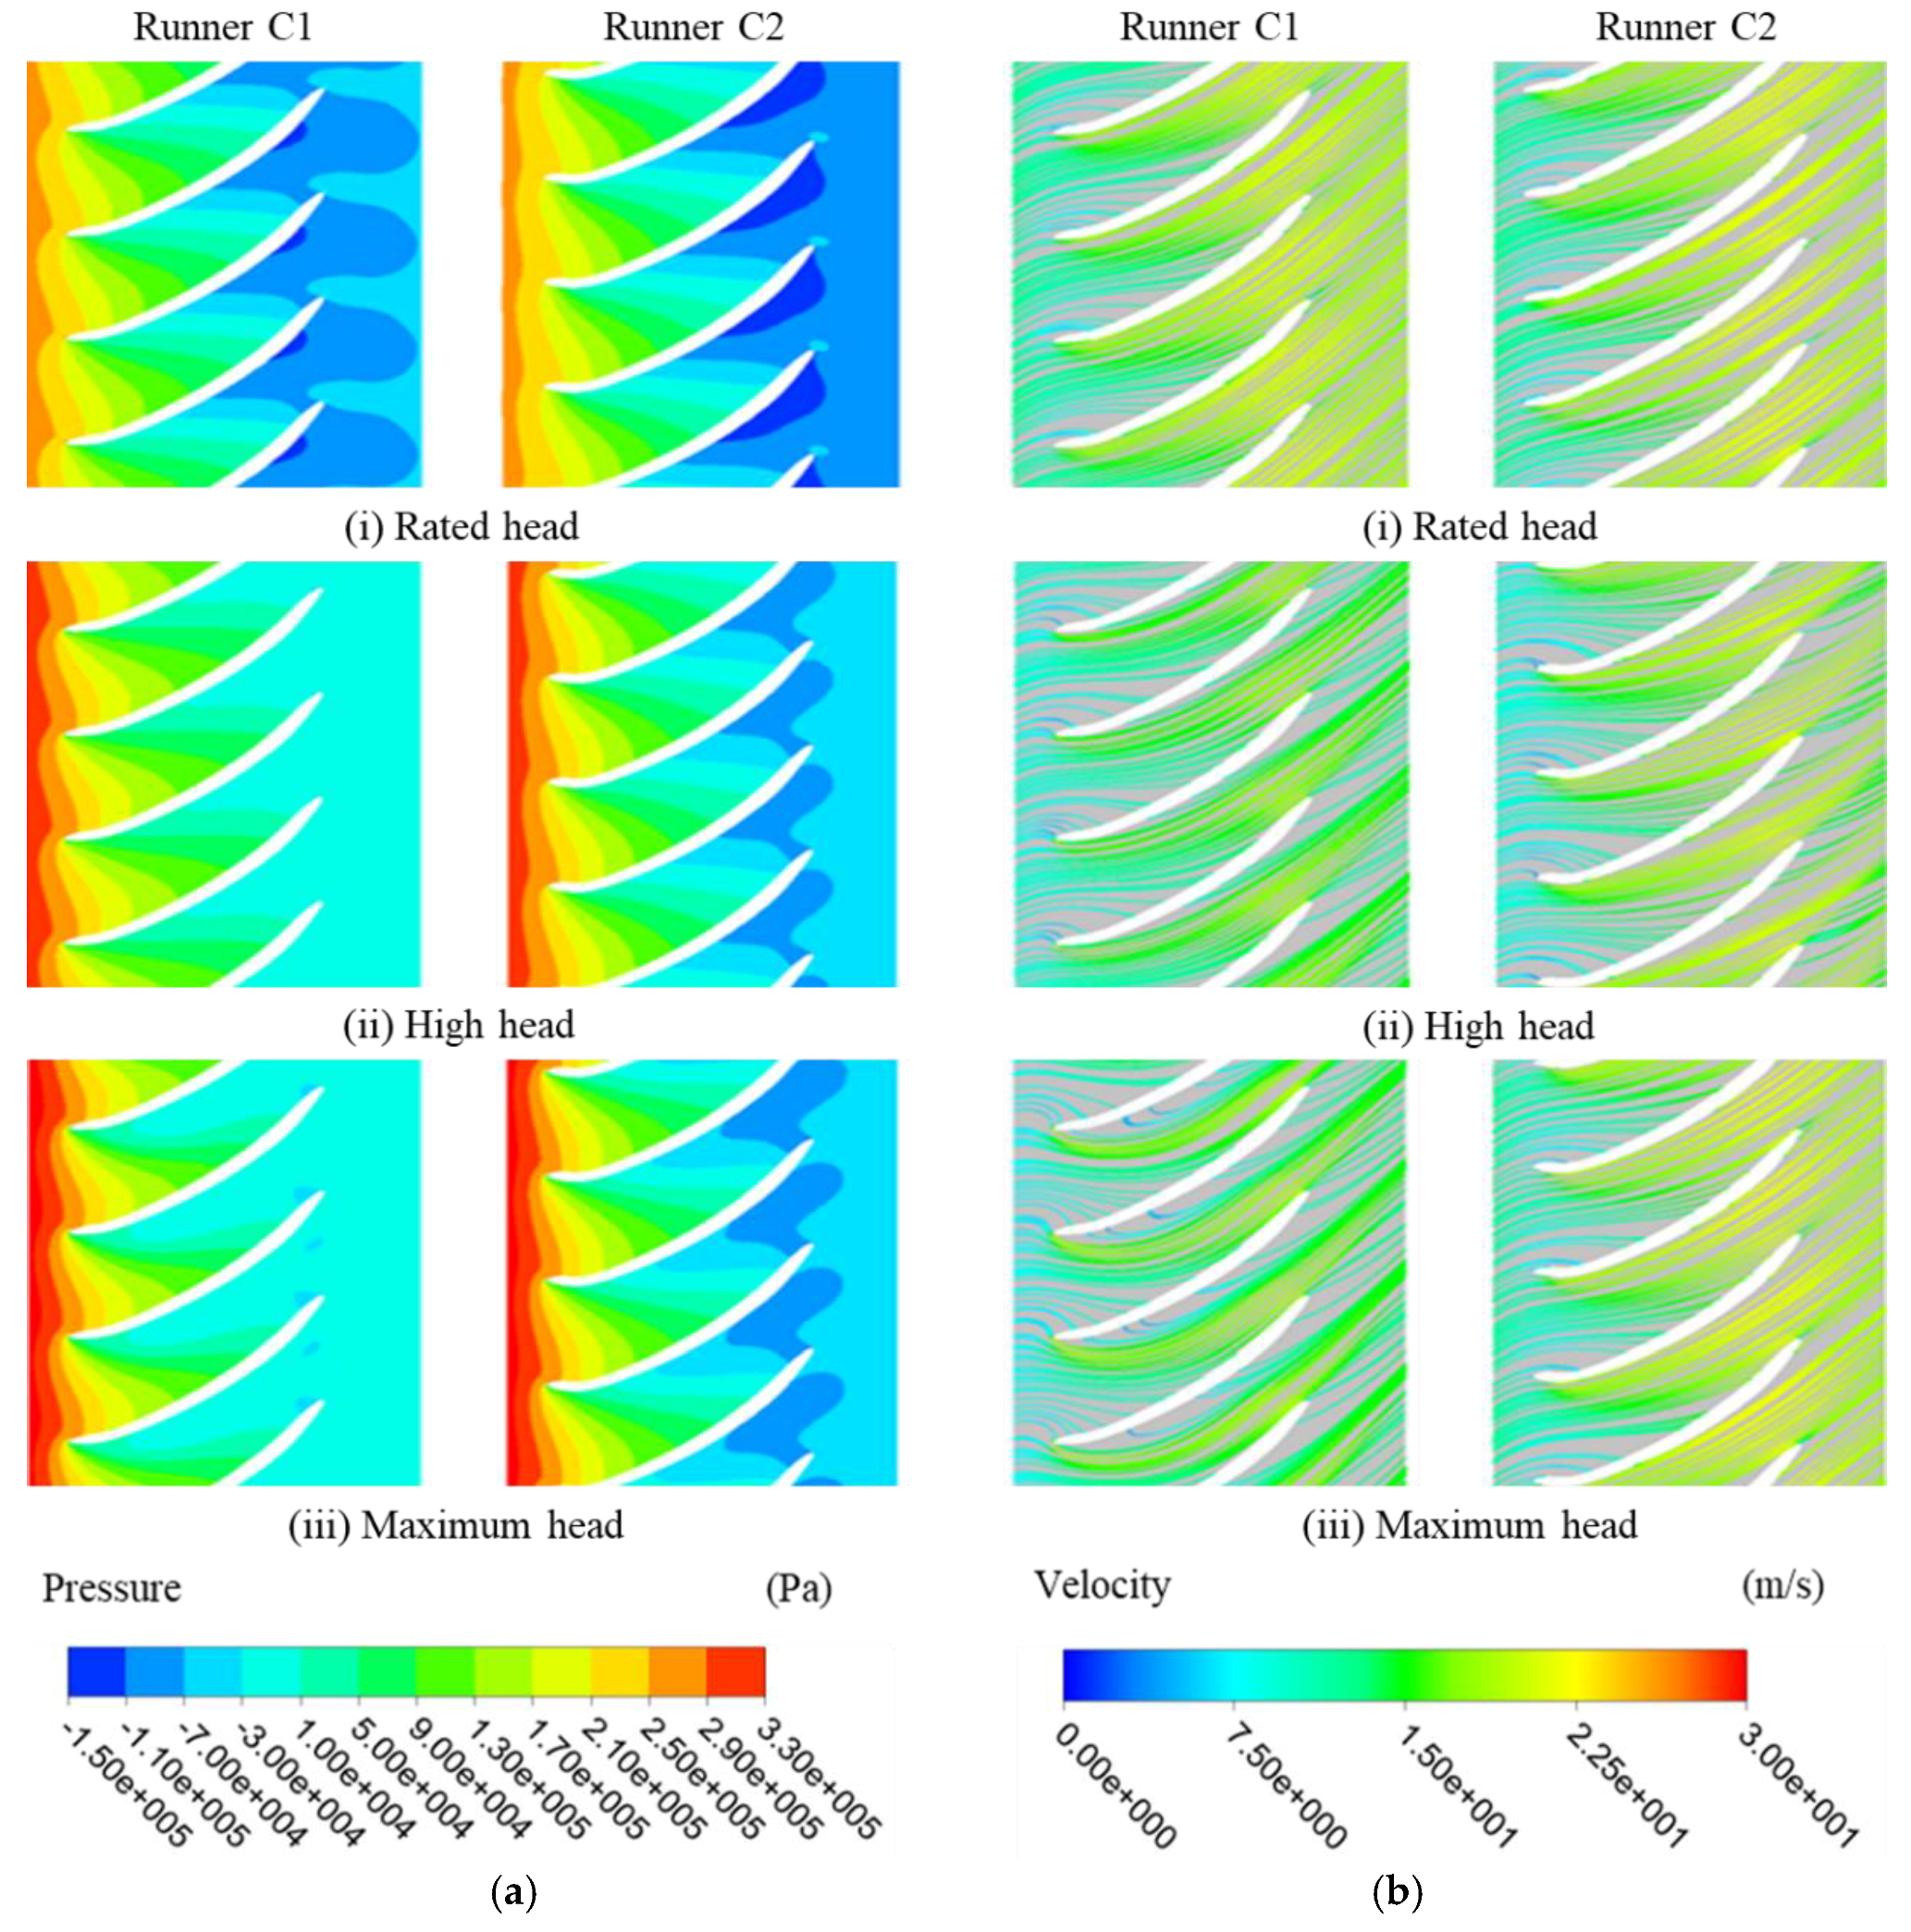
Pressure and streamline contours on the middle surface for runners C1 and C2 under three conditions are shown in Figure 15. Because of short flow passage of the runners, the blade lean on the inlet has obvious influence on the pressure distribution near the outlet. Based on Figure 13a and Figure 15a, it can be found that as the blade tilt increases, low pressure region enlarges along the blade suction side near the outlet. Thus, large blade lean on the inlet can induce the blade geometry vary near outlet, and likely reduces the cavitation characteristics. On the other hand, the streamline contours given in Figure 13b and Figure 15b show that the blade tilt can improve inflow condition, reduces flow separation and avoids the occurrence of interblade vortices at high head and low flow discharge. Therefore, relatively negative larger blade lean can be recommended to be employed in runners with short flow passages when cavitation, efficiency and operation stability are taken into account [35,36,37].
5.2.2 Effects of Blade Loading
The blade loading distributions of the preferred runner and runners D1 and D2 are presented in Figure 11. The blade lean angles and meridional shapes for these three optimized runners are almost the same. According to Figure 11, for all the runners, the distributions are similar and fore-loaded on the hub. Almost same aft-loading is applied on the shroud for the preferred runner and runner D1. But for runner D2, fore-loading is applied on shroud, different with the preferred runner and runner D1.
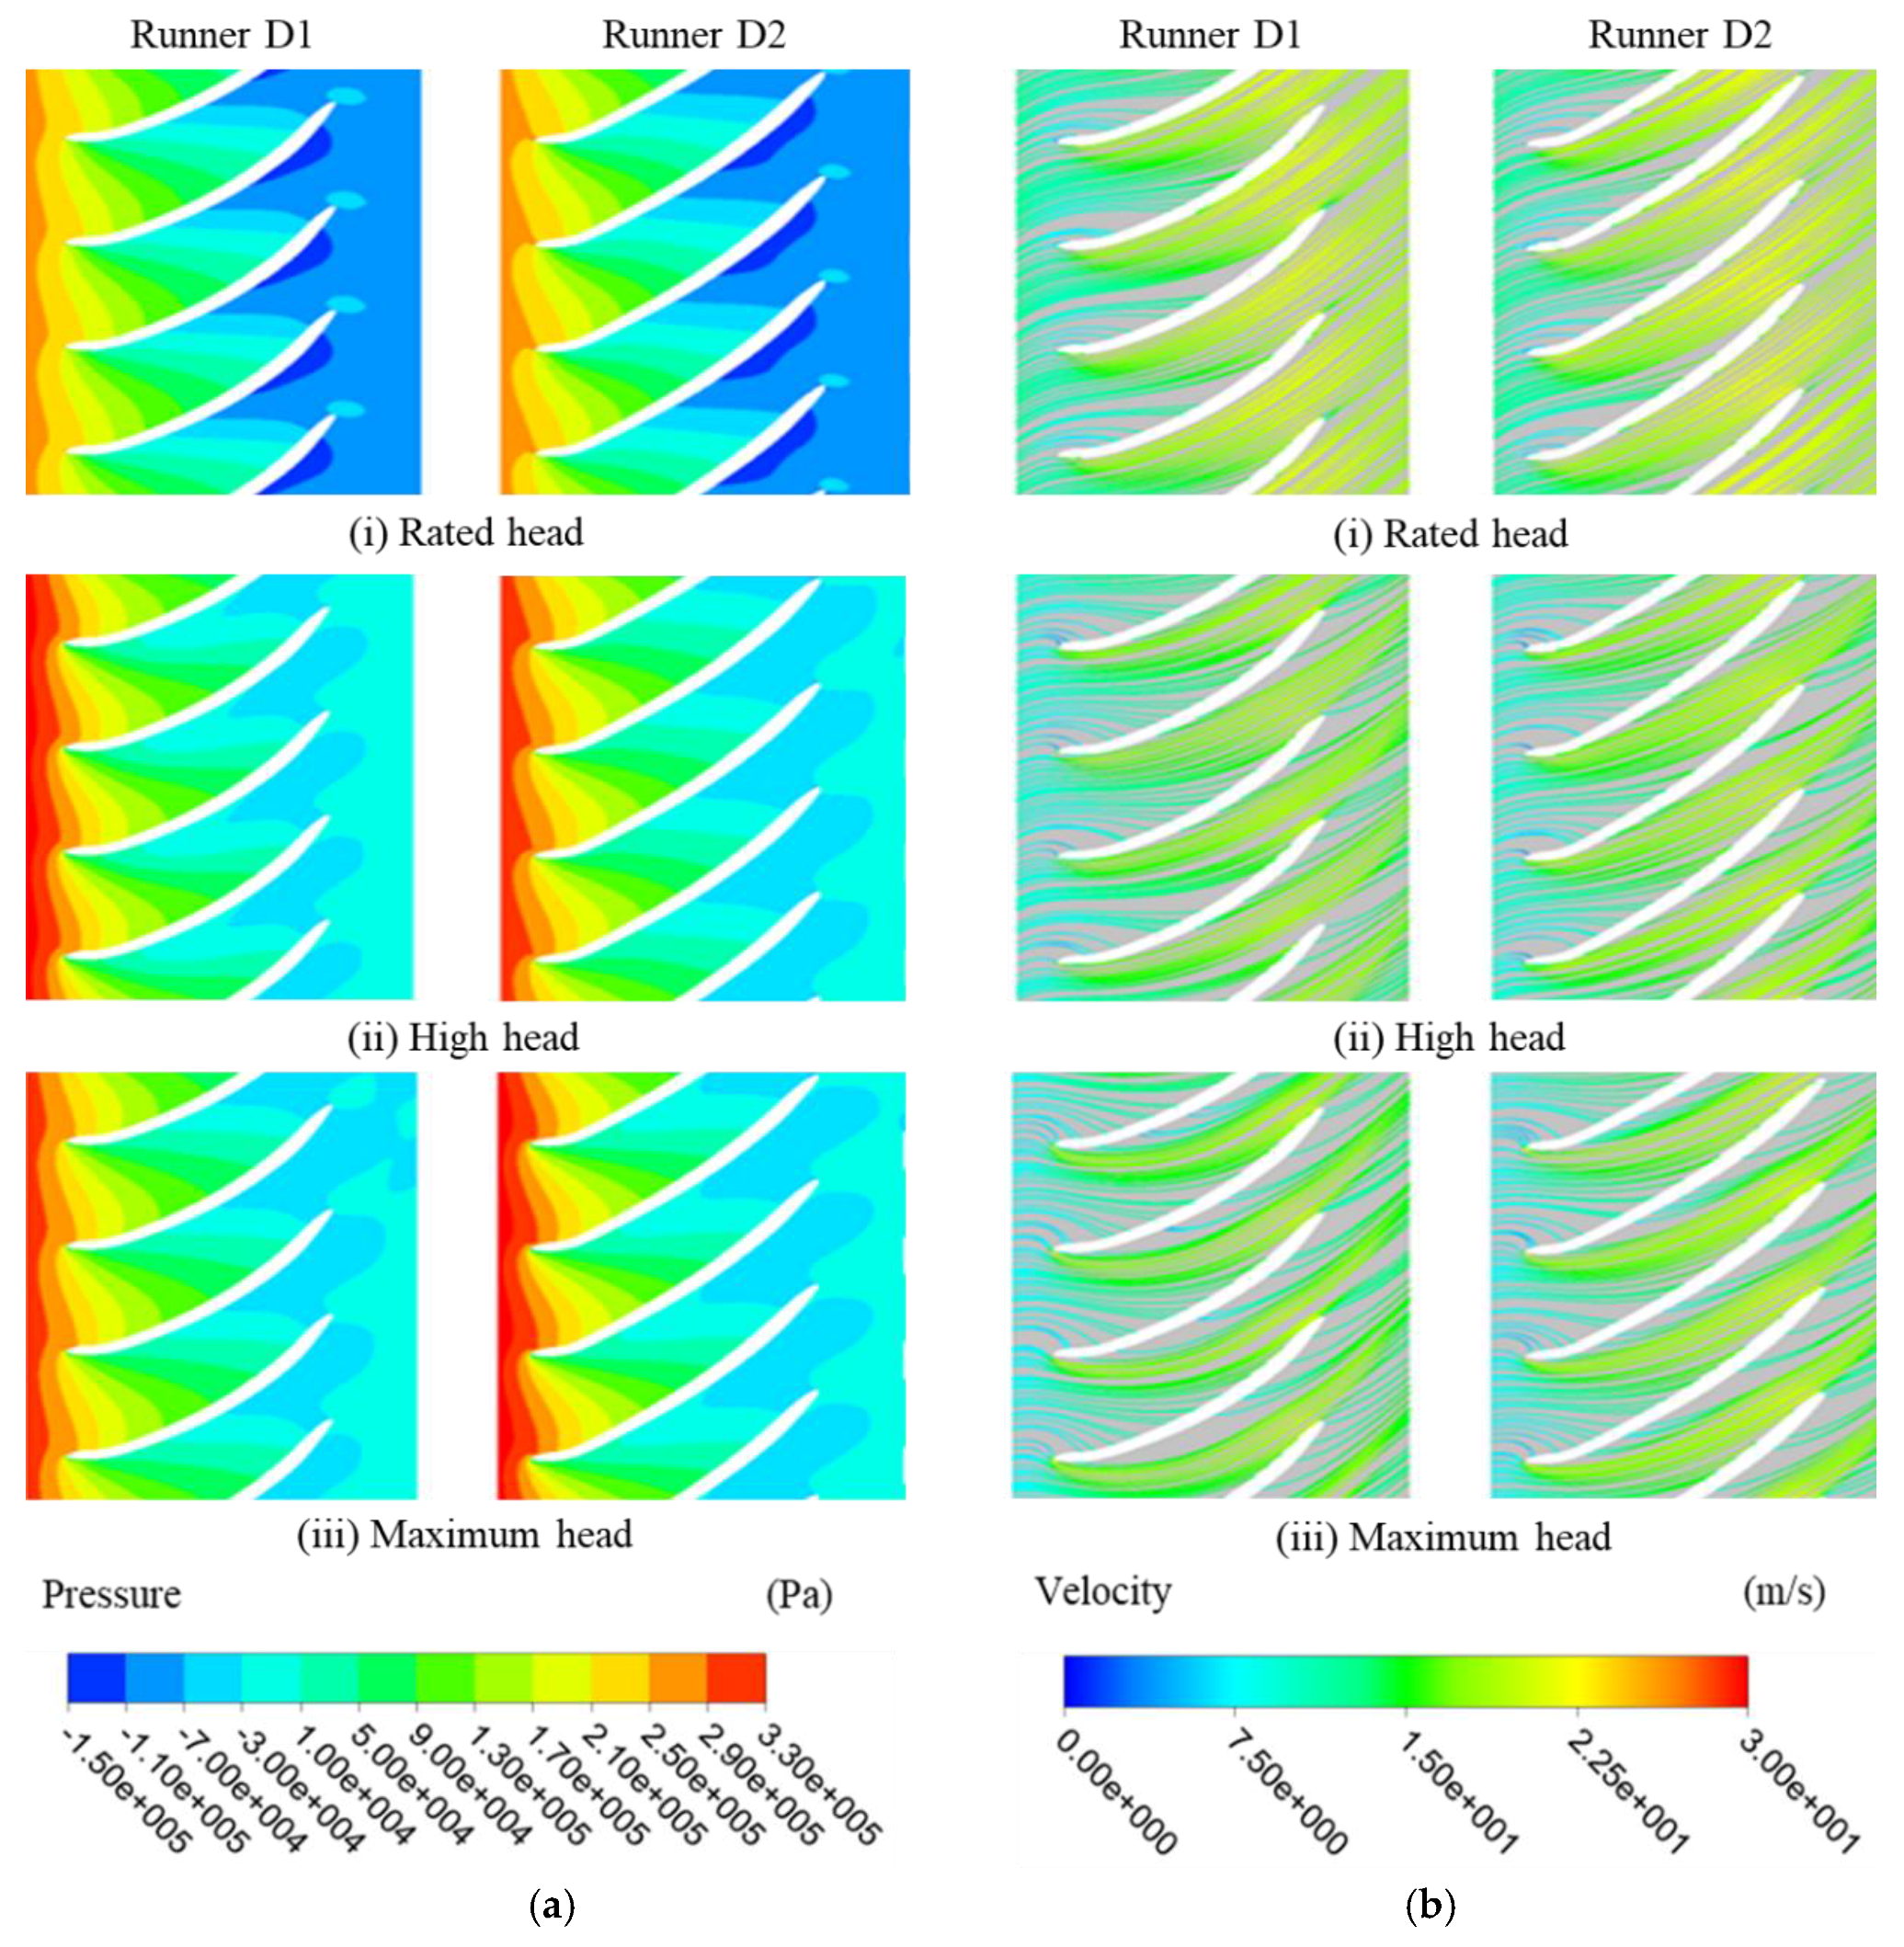
As shown in Table 9, preferred runner and runner D1 have higher efficiencies. Efficiency of runner D2 and the initial runner is almost the same. However, the minimum pressure at the blade suction surface of three optimized runners is much lower than the initial runner. Figure 16 shows the pressure contours and streamline on the middle span surface for runners D1 and D2. Runners D1 and D2 have the similar flow characteristics in pressure and velocity distributions. By comparing Figure 13, Figure 15 and Figure 16, it can be found that blade lean on the runner inlet have much more significant effects on the internal flow field than that of blade loading.
The comparison of pressure distributions on different spanwise on the blade surface for runners D1 and D2 with the preferred runner can be found in Figure 12. The pressure difference distributions across the blade from inlet edge ( = 0) to outlet edge ( = 1) have a better uniformity for preferred runner and runner D1. The fore-loading on shroud for runner D2 increases the pressure difference across the blade on inlet edge and decrease it on outlet edge. The uneven pressure difference across the blade induces the low efficiency of runner D2.
5.2.3 Effects of Meridional Shape
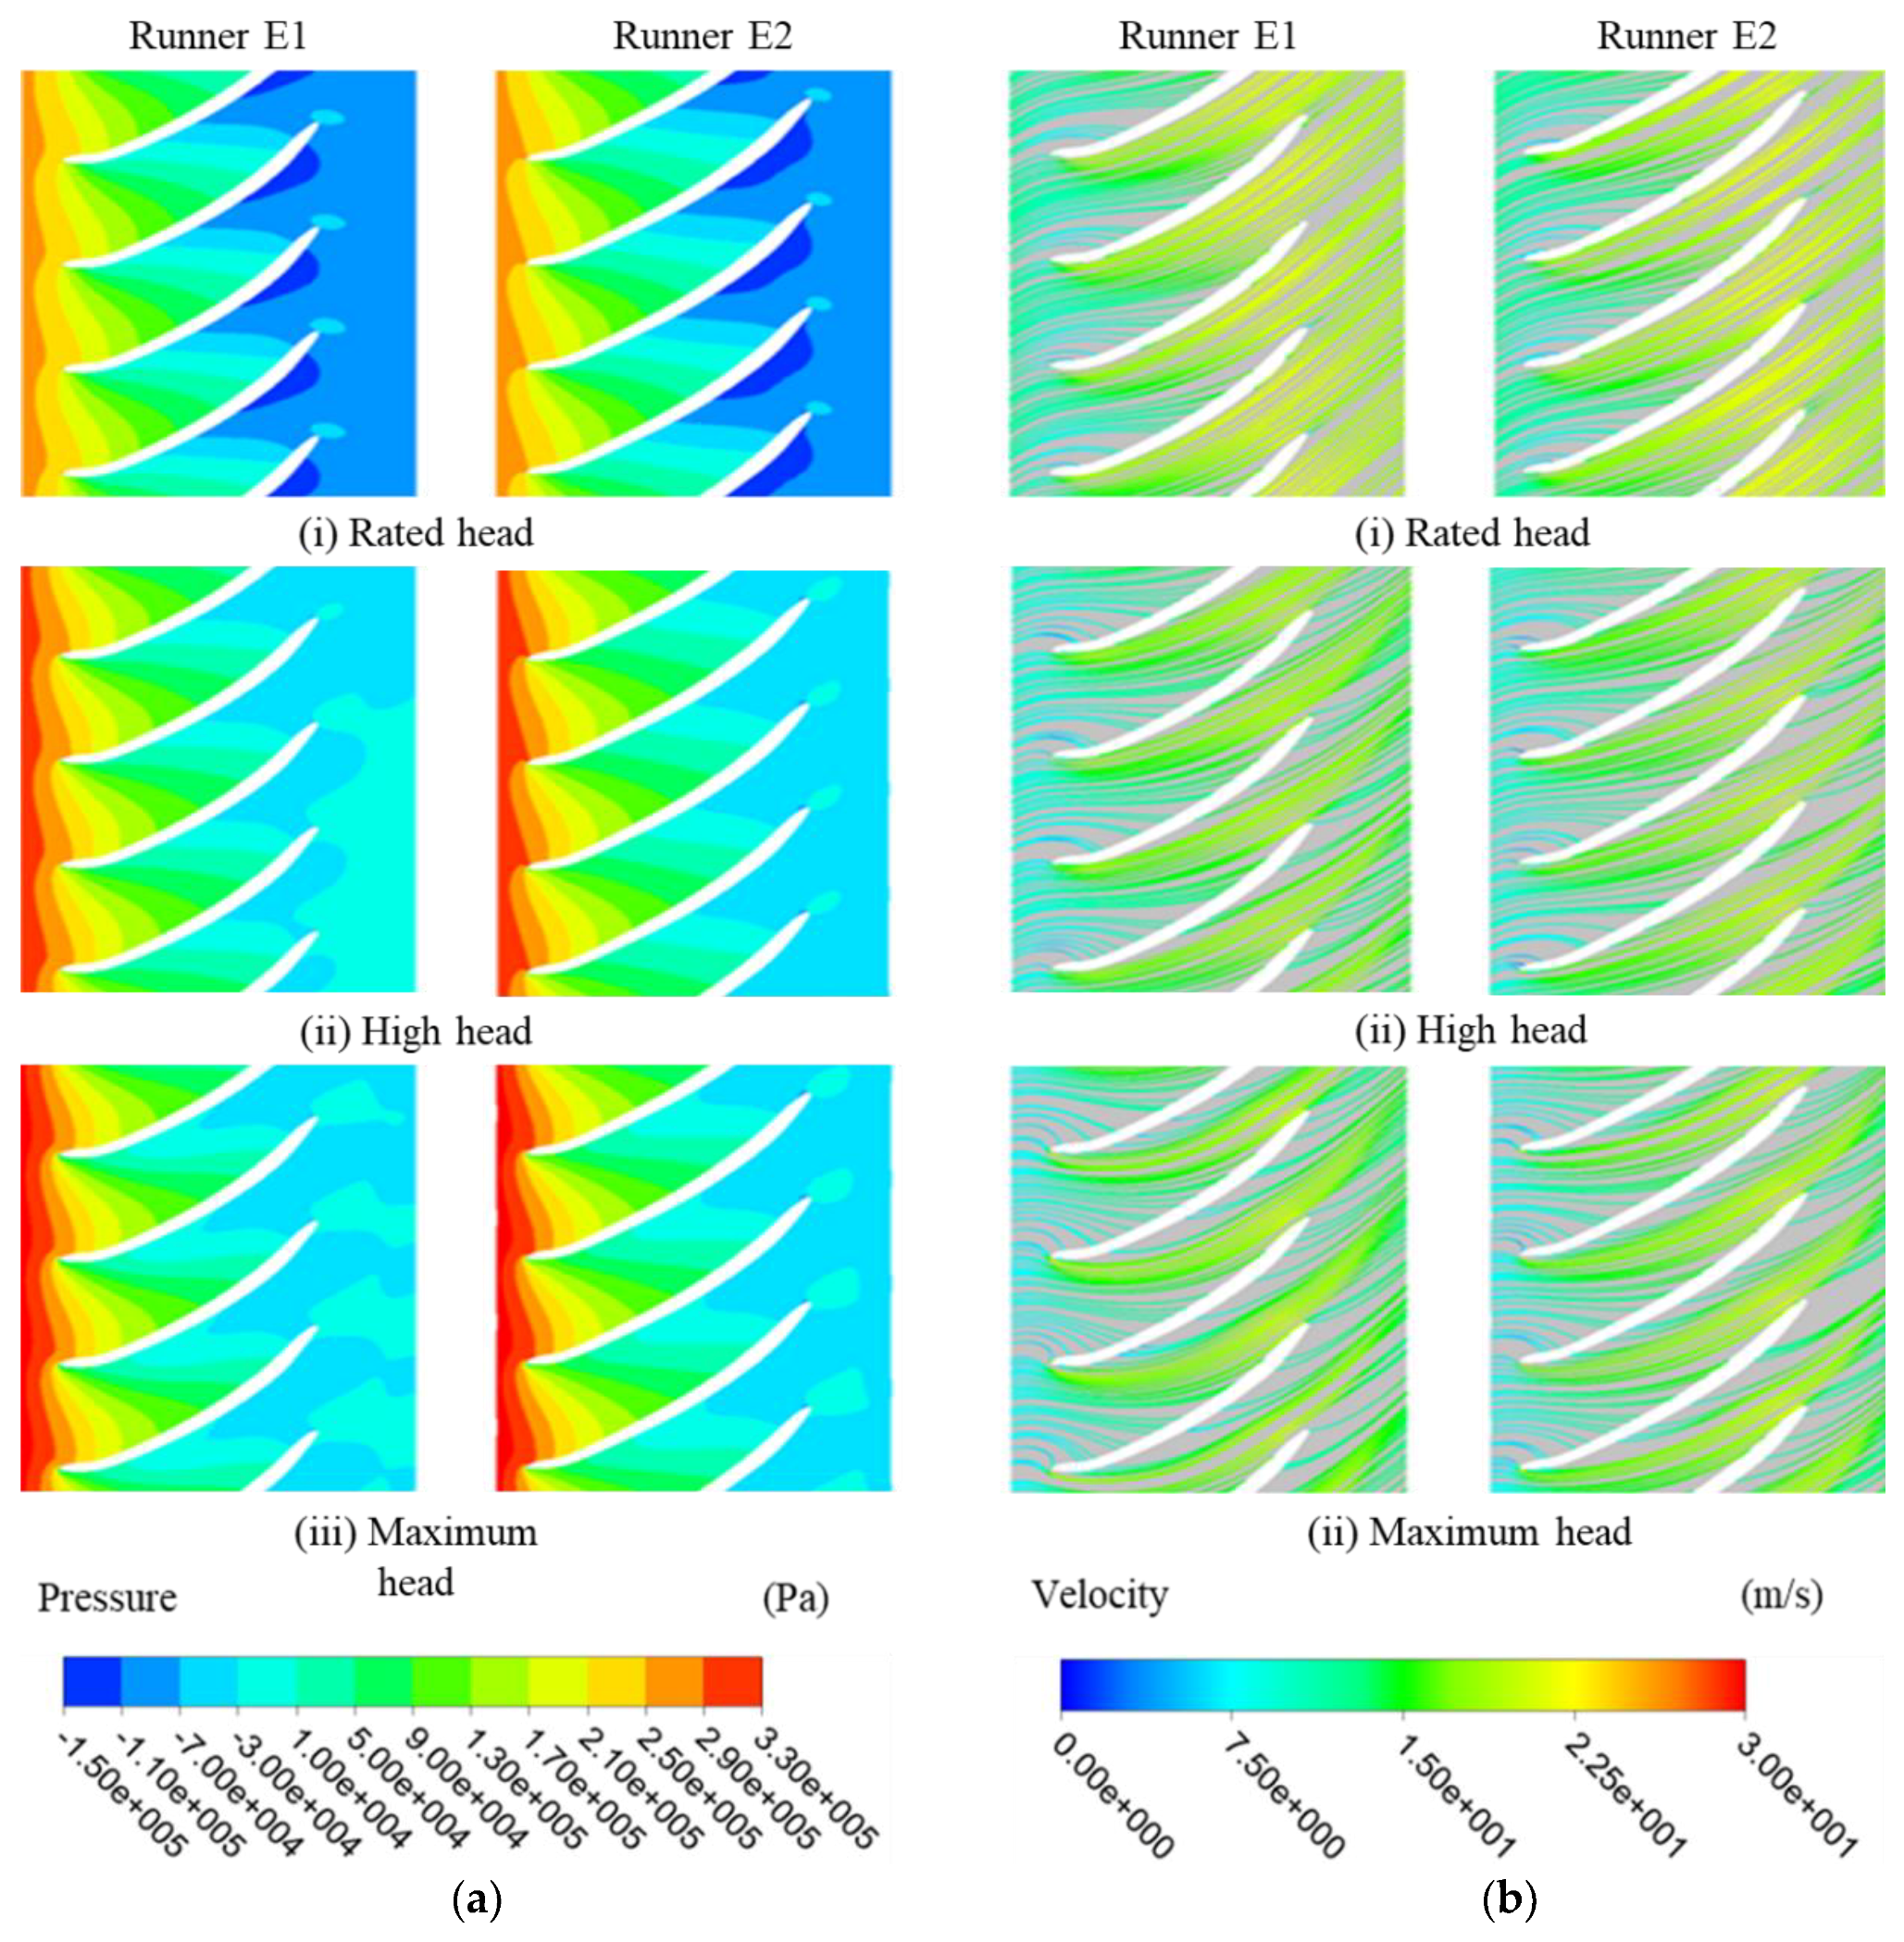
For other two runners marked by E1 and E2, the blade loading distributions and blade lean angles are almost the same with the preferred runner. The main control parameters of the meridional blade shape are listed in Table 8. As shown in Figure 11, runner E1 and the preferred runner have close meridional blade shapes, while runner E2 and the initial runner have similar meridional blade shapes. Compared with runner E2 and initial runner, meridional channel is narrowed down for runner E1 and preferred runner, and then meridional velocity is increased.
According to Table 9, runner E1 has almost the same performance with the preferred runner, including efficiency and cavitation characteristics. Efficiencies of runner E2 and the initial runner are almost the same. Therefore, for the present hydraulic turbine, the runners with short channel near hub has higher efficiency.
Figure 17 shows the pressure and streamline contours on the middle span surface for runners E1 and E2. Due to a broadened shape near hub, the blades of runner E2 are longer than runner E1. Although the low pressure zones under high and maximum head in runner E2 are larger than runner E1, there are no interblade vortices occurrence in both runners E1 and E2. The disappearance of the interblade vortices is attributed to the improved blade loading and blade lean by optimization.
6. Conclusions
A comprehensive hydraulic improvement of a traditional Francis turbine runner by a multipoint and multi-objective optimization strategy was employed in the present study. The process combines 3D inverse design method, DoE, RSM, MOGA and SOM and established a reliable, effective and reduced time-cost parameterized system.
During the optimization, blade loading, blade lean, and meridional channel shape were chosen as the main inputs to be optimized. In addition, objectives were the turbine unit efficiencies under rated head, high head and maximum head, as well as the lowest pressure on the blade surface at the rated head. In order to minimize the CFD calculation time, optimization process was divided in two steps. In the first optimization step, blade loading and blade lean angle were selected as the inputs and the main parameters that had greater effects on optimal runner were filtered. In the second step, the parameters filtered in the first step and meridional channel shape were selected as the input parameters for optimization and a preferred runner was recommended.
The turbine unit efficiencies with the preferred runner under rated head, high head and maximum head are 93.96%, 93.27% and 90.33%, respectively. Compared with the initial runner, these efficiencies are increased by 0.91%, 0.47% and 0.37%, respectively. Meanwhile, the preferred runner’s cavitation performance at rated head is much better than the initial runner’s. Compared with the initial runner, the lowest pressure at blade surface is improved by 376.2 kPa. Moreover, the interblade vortices generated under maximum head for the initial runner are prevented. Therefore, by using the optimization techniques, the redesign can not only increase the unit efficiency and cavitation performance but also improve the operation stability of the turbine.
Besides the flow analyses and performance comparisons between the initial runner and preferred runner, three groups of runners were selected for exploring the effects of design parameters. The CFD analyses show that, for the runners with a short flow passage, large inlet blade lean can change the inflow conditions and suppress flow separation, and especially prevent interblade vortices under the maximum head. The runners with fore-loading on the hub and aft-loading on the shroud have a good comprehensive performance. The aft-loading on the shroud can reduce the low pressure region near the blade trailing edge and improve the runner’s cavitation characteristics. As for meridional channel shape, compared with the initial runner, the runners with a little shortened hub have better performance.
Author Contributions
Z.M. and C.R. made the computational simulations and prepared the first draft of the paper. B.Z. and Y.S. planned the study project, conceived, designed, as well as revised the paper. Z.M. contributed in data analyses.
Funding
This research was funded by the National Natural Science Foundation of China, grant numbers: 51679122, 51736008.
Acknowledgments
The authors would like to thank the reviewers for their constructive comments and suggestion.
Conflicts of Interest
The authors declare no conflict of interest.
Nomenclature
| A0 | Guide vanes opening |
| CFD | Computational fluid dynamics |
| C1H~C2H | Normalized control location on hub |
| C1S~C2S | Normalized control location on shroud |
| CPH | Normalized parameter for the position of inlet edge on hub |
| CPL | Normalized parameter for the position of outlet edge on hub |
| D1 | Shroud diameter for inlet edge |
| D1H | Hub diameter for outlet edge |
| D2 | Shroud diameter for outlet edge |
| D2H | Hub diameter for outlet edge |
| DRVT | Blade loading at leading edge |
| F | Optimization targets |
| H | Head height |
| Hmax | Maximum head height |
| Hmin | Minimum head height |
| Hr | Rated head height |
| L0H~L4H | Bezier control points on hub |
| L0S~L4S | Bezier control points on shroud |
| Meridional distance | |
| n11 | Unit speed |
| N | Number of selected input parameters |
| NPSH | Net positive suction head of the model |
| NC | Fore connection point on blade loading distribution curve |
| ND | Aft connection point on blade loading distribution curve |
| p | Pressure |
| Q | Discharge |
| Q11 | Unit discharge |
| r | Radius or radial direction |
| SLOPE | Slope of the middle line on blade loading distribution curve |
| V | Velocity |
| X | Input parameter |
| Z | Number of runner blades |
| Zg | Number of guide vanes |
| Zs | Number of stay vanes |
| β | Blade rake angle or coefficients in polynomial for RSM |
| η | Unit efficiency |
| θ | Blade lean angle or tangential component |
| ρ | Fluid density |
| ω | Angular velocity |
| Superscripts | |
| Normalization | |
| Subscripts | |
| H | Hub |
| S | Shroud |
| θ | Tangential direction |
References
- Karier, T.; Fazio, J. How hydropower enhances the capacity value of renewables and energy efficiency. Electron. J. 2017, 30, 1–5. [Google Scholar] [CrossRef]
- Li, X.Z.; Chen, Z.J.; Fan, X.C.; Cheng, Z.J. Hydropower development situation and prospects in China. Renew. Sustain. Energy Rev. 2018, 82, 232–239. [Google Scholar] [CrossRef]
- Liu, X.; Luo, Y.; Karney, B.W.; Wang, W. A selected literature review of efficiency improvements in hydraulic turbines. Renew. Sustain. Energy Rev. 2015, 51, 18–28. [Google Scholar] [CrossRef]
- Dörfler, P.; Sick, M.; Coutu, A. Flow-Induced Pulsation and Vibration in Hydroelectric Machinery; Springer: London, UK, 2013; ISBN 978-1-4471-4252-2. [Google Scholar]
- Mattmann, M.; Logar, I.; Brouwer, R. Hydropower externalities: A meta-analysis. Energy Econ. 2016, 57, 66–77. [Google Scholar] [CrossRef] [Green Version]
- Renewables 2017 Global Status Report. Available online: http://www.ren21.net/gsr-2017/ (accessed on 14 January 2018).
- IHA. Hydropower Status Report; International Hydropower Association: London, UK, 2017; Volume 42. [Google Scholar]
- Uriamartinez, R.; O’Connor, P.W.; Johnson, M.M. 2014 Hydropower Market Report (2015). Available online: https://energy.gov/eere/water/downloads/2014-hydropower-market-report (accessed on 16 September 2016).
- Wu, J.; Shimmei, K.; Tani, K.; Niikura, K.; Sato, J. CFD-Based Design Optimization for Hydro Turbines. J. Fluids Eng. 2007, 129, 159–168. [Google Scholar] [CrossRef]
- Olimstad, G.; Nielsen, T.; Børresen, B. Dependency on Runner Geometry for Reversible-Pump Turbine Characteristics in Turbine Mode of Operation. J. Fluids Eng. 2012, 134, 121102:1–121102:9. [Google Scholar] [CrossRef]
- Aradag, S.; Akin, H.; Celebioglu, K. CFD based design of a 4.3 MW Francis turbine for improved performance at design and off-design conditions. J. Mech. Sci. Technol. 2017, 31, 5041–5049. [Google Scholar] [CrossRef]
- Zangeneh, M. A compressible three-dimensional design method for radial and mixed flow turbomachinery blades. Int. J. Numer. Methods Fluids 2010, 13, 599–624. [Google Scholar] [CrossRef]
- Asuaje, M.; Bakir, F.; Kouidri, S.; Rey, R. Inverse Design Method for Centrifugal Impellers and Comparison with Numerical Simulation Tools. Int. J. Comput. Fluid Dyn. 2004, 18, 101–110. [Google Scholar] [CrossRef]
- Peng, G. A Practical Combined Computation Method of Mean Through-Flow for 3D Inverse Design of Hydraulic Turbomachinery Blades. J. Fluids Eng. 2005, 127, 1183–1190. [Google Scholar] [CrossRef]
- Tan, L.; Cao, S.; Wang, Y.; Zhu, B.S. Direct and inverse iterative design method for centrifugal pump impellers. Proc. IMechE Part A J. Power Energy 2012, 226, 764–775. [Google Scholar] [CrossRef]
- Hua, J.; Kong, F.; Liu, P.; Zingg, D. Optimization of Long-Endurance Airfoils. AIAA-2003-3500. In Proceedings of the 21st AIAA Appl Aerodynamics Conference, Orlando, FL, USA, 23–26 June 2003; pp. 23–26. [Google Scholar]
- Secanell, M.; Suleman, A. Numerical Evaluation of Optimization Algorithms for Low-Reynolds-Number Aerodynamic Shape Optimization. AIAA J. 2015, 43, 2262–2267. [Google Scholar] [CrossRef]
- Bonaiuti, D.; Zangeneh, M. On the Coupling of Inverse Design and Optimization Techniques for the Multiobjective, Multipoint Design of Turbomachinery Blades. J. Turbomach. 2009, 131, 021014:1–021014:16. [Google Scholar] [CrossRef]
- Oyama, A.; Okabe, Y.; Shimoyama, K.; Fujii, K. Aerodynamic Multiobjective Design Exploration of a Flapping Airfoil Using a Navier-Stokes Solver. J. Aerosp. Comput. Inf. Commun. 2014, 6, 1–34. [Google Scholar] [CrossRef]
- Schleicher, W.C.; Oztekin, A. Hydraulic design and optimization of a modular pump-turbine runner. Energy Convers. Manag. 2015, 93, 388–398. [Google Scholar] [CrossRef] [Green Version]
- Koziel, S.; Yang, X.S. Computational Optimization, Methods and Algorithms; Springer: Heidelberg, Germany, 2011; ISBN 978-3-642-20858-4. [Google Scholar]
- Zitzler, E.; Thiele, L. Multiobjective evolutionary algorithms: A comparative case study and the strength Pareto approach. IEEE Trans. Evol. Comput. 1999, 3, 257–271. [Google Scholar] [CrossRef]
- Lee, D.S.; Gonzalez, L.F.; Periaux, J.; Srinivas, K. Robust design optimisation using multi-objective evolutionary algorithms. Comput. Fluids 2008, 37, 565–583. [Google Scholar] [CrossRef]
- Zhu, B.S.; Wang, X.H.; Tan, L.; Zhou, D.Y.; Zhao, Y.; Cao, S.L. Optimization design of a reversible pump–turbine runner with high efficiency and stability. Renew. Energy 2015, 81, 366–376. [Google Scholar] [CrossRef]
- Liu, L.; Zhu, B.S.; Bai, L.; Liu, X.B.; Zhao, Y. Parametric Design of an Ultrahigh-Head Pump-Turbine Runner Based on Multiobjective Optimization. Energies 2017, 10, 1169. [Google Scholar] [CrossRef]
- Ding, H.; Visser, F.C.; Jiang, Y.; Furmanczyk, M. Demonstration and Validation of a 3D CFD Simulation Tool Predicting Pump Performance and Cavitation for Industrial Applications. J. Fluids Eng. 2011, 133, 011101:1–011101:14. [Google Scholar] [CrossRef]
- Tan, L.; Zhu, B.S.; Cao, S.L.; Bing, H.; Wang, Y.C. Influence of blade wrap angle on centrifugal pump performance by numerical and experimental study. China J. Mech. Eng. 2014, 27, 171–177. [Google Scholar] [CrossRef]
- Tan, L.; Zhu, B.S.; Cao, S.L.; Wang, Y.; Wang, B. Influence of Prewhirl Regulation by Inlet Guide Vanes on Cavitation Performance of a Centrifugal Pump. Energies 2014, 7, 1050–1065. [Google Scholar] [CrossRef] [Green Version]
- Zhang, W.; Yu, Z.; Zahid, M.; Li, Y. Study of the Gas Distribution in a Multiphase Rotodynamic Pump based on Interphase Force Analysis. Energies 2018, 11, 1069. [Google Scholar] [CrossRef]
- Zhang, W.W.; Yu, Z.Y.; Muhammad, N.Z.; Li, Y.J. Influence of Tip Clearance on Pressure Fluctuation in Low Specific Speed Mixed-Flow Pump Passage. Energies 2017, 10, 148. [Google Scholar] [CrossRef]
- Kohonen, T.; Timo, T. Kohonen Network. Scholarpedia 2007, 2, 1568. [Google Scholar] [CrossRef]
- Goto, A. Historical Perspective on Fluid Machinery Flow Optimization in an Industry. Int. J. Fluid Mach. Syst. 2016, 9, 75–84. [Google Scholar] [CrossRef]
- Zhang, P.Y.; Zhu, B.S.; Zhang, L.F. Numerical Investigation on Pressure Fluctuations Induced by Interblade Vortices in a Runner of Francis Turbine. Large Electron. Mach. Hydraul. Turbine 2009, 35, 35–38. (In Chinese) [Google Scholar]
- Zuo, Z.; Liu, S.; Liu, D.; Qin, D.Q.; Wu, Y.L. Numerical Predictions of the Incipient and Developed Interblade Vortex Lines of a Model Francis Turbine by Cavitation Calculations. Adv. Mech. Eng. 2013, 5, 397583:1–397583:7. [Google Scholar] [CrossRef]
- Denton, J.D.; Xu, L. The exploitation of three-dimensional flow in turbomachinery design. Proc. IMechE Part C J. Mech. Eng. Sci. 1999, 213, 125–137. [Google Scholar] [CrossRef]
- D’Ippolito, G.; Dossena, V.; Mora, A. The Influence of Blade Lean on Straight and Annular Turbine Cascade Flow Field. ASME J. Turbomach. 2011, 133, 1379–1389. [Google Scholar] [CrossRef]
- Zhu, B.S.; Tan, L.; Wang, X.H.; Ma, Z. Investigation on Flow Characteristics of Pump-Turbine Runners with Large Blade Lean. J. Fluids Eng. 2018, 140, 031101. [Google Scholar] [CrossRef]
Figure 1.
Cracks on the runner blades. (a) The crack on the first blade; (b) The crack on the second blade.
Figure 1.
Cracks on the runner blades. (a) The crack on the first blade; (b) The crack on the second blade.

Figure 2.
Sketch of the model. (a) Model of the runner; (b) Model of the whole passage.

Figure 3.
Performance curves measured in model test of runner HLA551.

Figure 4.
Flow chart of the optimization strategy.

Figure 5.
Meridional channel parameterization.

Figure 6.
Blade loading distributions.

Figure 7.
Schematic of blade lean at inlet edge.

Figure 8.
Obtained runners in first step optimization.

Figure 9.
The optimized two-dimensional SOMs.

Figure 10.
Geometry of the runners. (a) Initial runner; (b) Preferred runner.

Figure 11.
Comparison among different runners. (a) Blade loading distributions; (b) Meridional channel.
Figure 11.
Comparison among different runners. (a) Blade loading distributions; (b) Meridional channel.

Figure 12.
Pressure distribution on different spanwise for the initial and optimized runners under rated head. (a) Hub; (b) Middle span; (c) Shroud.
Figure 12.
Pressure distribution on different spanwise for the initial and optimized runners under rated head. (a) Hub; (b) Middle span; (c) Shroud.

Figure 13.
Flow conditions on the middle span surface for initial and preferred runners. (a) Pressure contours; (b) Surface streamlines.
Figure 13.
Flow conditions on the middle span surface for initial and preferred runners. (a) Pressure contours; (b) Surface streamlines.

Figure 14.
Geometry comparison for runners C1, C2 and the preferred runner.

Figure 15.
Flow conditions on the middle span surface of runners C1 and C2. (a) Pressure contours; (b) Surface streamlines.
Figure 15.
Flow conditions on the middle span surface of runners C1 and C2. (a) Pressure contours; (b) Surface streamlines.

Figure 16.
Flow conditions on the middle span surface of runners D1 and D2. (a) Pressure contours; (b) Surface streamlines.
Figure 16.
Flow conditions on the middle span surface of runners D1 and D2. (a) Pressure contours; (b) Surface streamlines.

Figure 17.
Flow conditions on the middle span surface of runners E1 and E2, (a) pressure contours, (b) surface streamlines.
Figure 17.
Flow conditions on the middle span surface of runners E1 and E2, (a) pressure contours, (b) surface streamlines.


Table 1.
Design parameters of the Francis turbine runner.
| D1 (m) | Z | Zs | Zg | Hr (m) | Hmin (m) | Hmax (m) | Qr (m3/s) | Pr (MW) | nr (rpm) |
|---|---|---|---|---|---|---|---|---|---|
| 3.1 | 13 | 24 | 24 | 50.4 | 47.0 | 67.9 | 86.22 | 29.52 | 187.5 |
Table 2.
Design parameters and objective functions.
| Variable | First Step | Second Step | |||||
|---|---|---|---|---|---|---|---|
| Item | Input | Variable | Value | Input | Variable | Value | |
| Design Input | Blade loading | NCH | 0.05~0.75 | Blade loading | SLOPEH | −2.0~2.0 | |
| NCS | 0.05~0.75 | SLOPES | −2.0~2.0 | ||||
| SLOPEH | −2.0~2.0 | Blade lean | θ | 0~−60.0° | |||
| SLOPES | −2.0~2.0 | Meridional blade shape | C1H | 0.70~1.00 | |||
| DRVTH | −0.2~0.2 | C2H | 0.70~1.00 | ||||
| DRVTS | −0.2~0.2 | CHH | 0.85~0.95 | ||||
| Blade lean | θ | −30.0~30.0° | CLH | 0.35~0.45 | |||
| Optimization Objective | Unit efficiency at rated point | Unit efficiency at three operation points | |||||
| Minimum pressure pmin at the blade surface at rated point | Minimum pressure pmin at the blade surface at rated point | ||||||
Table 3.
Parameter settings for NSGA-II.
| Parameter | Value |
|---|---|
| Population size | 100 |
| Number of generations | 100 |
| Crossover probability | 0.9 |
| Crossover distribution index | 10 |
| Mutation distribution index | 20 |
| Initialization mode | random |
Table 4.
Optimized parameters by the first step optimization.
| Variable | NCH | NCS | SLOPEH | SLOPES | DRVTH | DRVTS | θ | |
|---|---|---|---|---|---|---|---|---|
| Runner | ||||||||
| A1 | 0.050 | 0.337 | −0.94 | −1.99 | 0.200 | 0.191 | −30.00° | |
| A2 | 0.056 | 0.461 | −1.52 | −1.23 | 0.200 | 0.103 | −30.00° | |
| A3 | 0.234 | 0.456 | −1.89 | −1.07 | 0.200 | 0.066 | −30.00° | |
| A4 | 0.361 | 0.481 | −1.93 | −1.04 | 0.200 | 0.056 | −30.00° | |
Table 5.
Results in the first step optimization.
| Objective | Unit Efficiency η (%) at Rated Point | Minimum Pressure pmin (kPa) at the Blade Surface at Rated Point | |||
|---|---|---|---|---|---|
| Runner | RSM | CFD | RSM | CFD | |
| A1 | 93.21 | 93.44 | −217.6 | −244.6 | |
| A2 | 93.36 | 93.48 | −242.9 | −227.9 | |
| A3 | 93.46 | 93.42 | −277.5 | −253.3 | |
| A4 | 93.51 | 93.59 | −293.1 | −277.7 | |
| Initial Runner | 93.05 | −597.1 | |||
Table 6.
Optimized parameters by the second step optimization.
| Variable | SLOPEH | SLOPES | θ (°) | C1H | C2H | CPH | CLH | |
|---|---|---|---|---|---|---|---|---|
| Runner | ||||||||
| B1 | 0.58 | −2.00 | 37.82 | 1.00 | 0.71 | 0.85 | 0.45 | |
| B2 | 0.11 | −2.00 | 39.93 | 0.85 | 0.70 | 0.85 | 0.45 | |
| B3 | 1.08 | −2.00 | 52.30 | 1.00 | 0.70 | 0.85 | 0.45 | |
| B4 (Preferred) | 1.20 | −2.00 | 45.78 | 1.00 | 0.70 | 0.85 | 0.45 | |
Table 7.
Results in the second step optimization.
| Objective | Unit Efficiency η (%) at Rated Head | Unit Efficiency η (%) at High Head | Unit Efficiency η (%) at Maximum Head | Minimum Pressure pmin (kPa) on the Blade at Rated Head | |||||
|---|---|---|---|---|---|---|---|---|---|
| Runner | RSM | CFD | RSM | CFD | RSM | CFD | RSM | CFD | |
| B1 | 94.23 | 93.74 | 93.75 | 93.25 | 90.56 | 90.40 | −264.5 | −233.3 | |
| B2 | 94.24 | 93.80 | 93.26 | 93.16 | 90.41 | 90.48 | −223.4 | −255.1 | |
| B3 | 94.45 | 93.94 | 93.51 | 92.92 | 90.32 | 89.95 | −310.7 | −229.6 | |
| B4 (Preferred) | 94.37 | 93.96 | 93.57 | 93.27 | 90.48 | 90.33 | −298.3 | −220.9 | |
| Initial runner | 93.05 | 92.80 | 89.96 | −597.1 | |||||
Table 8.
Optimized input parameters by the second step optimization.
| Variable | SLOPEH | SLOPES | θ (°) | C1H | C2H | CPH | CPH | |
|---|---|---|---|---|---|---|---|---|
| Runner | ||||||||
| C1 | 1.51 | −1.99 | 31.44 | 1.00 | 0.71 | 0.85 | 0.45 | |
| C2 | 1.43 | −2.00 | 59.93 | 1.00 | 0.70 | 0.85 | 0.45 | |
| D1 | 0.45 | −2.00 | 46.22 | 1.00 | 0.70 | 0.85 | 0.45 | |
| D2 | 0.94 | 1.30 | 44.62 | 1.00 | 0.88 | 0.86 | 0.43 | |
| E1 | 1.03 | −2.00 | 46.13 | 0.74 | 0.71 | 0.85 | 0.44 | |
| E2 | 1.07 | −2.00 | 46.36 | 0.84 | 0.86 | 0.89 | 0.41 | |
| Preferred Runner | 1.20 | −2.00 | 45.78 | 1.00 | 0.70 | 0.85 | 0.45 | |
Table 9.
Performances of the selected runners.
| Objective | Unit Efficiency η (%) at Rated Head | Unit Efficiency η (%) at High Head | Unit Efficiency η (%) at Maximum Head | Minimum Pressure pmin (kPa) on the Blade at Rated Head | |||||
|---|---|---|---|---|---|---|---|---|---|
| Runner | RSM | CFD | RSM | CFD | RSM | CFD | RSM | CFD | |
| C1 | 94.16 | 93.60 | 93.70 | 93.18 | 90.61 | 90.39 | −214.4 | −231.2 | |
| C2 | 94.50 | 93.80 | 93.31 | 92.53 | 90.10 | 89.78 | −351.3 | −234.0 | |
| D1 | 94.37 | 93.95 | 93.63 | 93.13 | 90.45 | 90.14 | −279.0 | −231.1 | |
| D2 | 93.22 | 93.06 | 92.43 | 92.29 | 90.01 | 89.74 | −253.5 | −243.6 | |
| E1 | 94.20 | 93.96 | 93.64 | 93.13 | 90.44 | 90.05 | −264.4 | −222.7 | |
| E2 | 93.20 | 93.17 | 92.04 | 92.32 | 90.01 | 90.13 | −185.2 | −236.3 | |
| Preferred runner | 94.37 | 93.96 | 93.72 | 93.27 | 90.48 | 90.33 | −298.3 | −220.9 | |
| Initial runner | ― | 93.05 | ― | 92.80 | ― | 89.96 | ― | −597.1 | |
© 2019 by the authors. Licensee MDPI, Basel, Switzerland. This article is an open access article distributed under the terms and conditions of the Creative Commons Attribution (CC BY) license (http://creativecommons.org/licenses/by/4.0/).
Share and Cite
MDPI and ACS Style
Ma, Z.; Zhu, B.; Rao, C.; Shangguan, Y. Comprehensive Hydraulic Improvement and Parametric Analysis of a Francis Turbine Runner. Energies 2019, 12, 307. https://doi.org/10.3390/en12020307
AMA Style
Ma Z, Zhu B, Rao C, Shangguan Y. Comprehensive Hydraulic Improvement and Parametric Analysis of a Francis Turbine Runner. Energies. 2019; 12(2):307. https://doi.org/10.3390/en12020307
Chicago/Turabian StyleMa, Zhe, Baoshan Zhu, Cong Rao, and Yonghong Shangguan. 2019. "Comprehensive Hydraulic Improvement and Parametric Analysis of a Francis Turbine Runner" Energies 12, no. 2: 307. https://doi.org/10.3390/en12020307
Note that from the first issue of 2016, this journal uses article numbers instead of page numbers. See further details here.