Partial Discharge Analysis in High-Frequency Transformer Based on High-Frequency Current Transducer
by
 ,
,
Jun Jiang
1,* ,
,
Mingxin Zhao
1,
Chaohai Zhang
1,
Min Chen
2,
Haojun Liu
2 and
Ricardo Albarracín
3 1
Jiangsu Key Laboratory of New Energy Generation and Power Conversion, Nanjing University of Aeronautics and Astronautics, Nanjing 211106, China
2
State Grid Zhejiang Electric Power Co. Ltd., Research Institute, Hangzhou 310014, China
3
Departamento de Ingeniería Eléctrica, Electrónica, Automática y Física Aplicada, Escuela Técnica Superior de Ingeniería y Diseño Industrial, Universidad Politécnica de Madrid, Ronda de Valencia 3, 28012 Madrid, Spain
*
Author to whom correspondence should be addressed.
Energies 2018, 11(8), 1997; https://doi.org/10.3390/en11081997
Submission received: 14 July 2018
/
Revised: 24 July 2018
/
Accepted: 26 July 2018
/
Published: 1 August 2018
(This article belongs to the Section F: Electrical Engineering)
Abstract
:High-frequency transformers are the core components of power electronic transformers (PET), whose insulation is deeply threatened by high voltage (HV) and high frequency (HF). The partial discharge (PD) test is an effective method to assess an electrical insulation system. A PD measurement platform applying different frequencies was set up in this manuscript. PD signals were acquired with a high-frequency current transducer (HFCT). For improving the signal-to-noise (SNR) ratio of PD pulses, empirical mode decomposition (EMD) was used to increase the SNR by 4 dB. PD characteristic parameters such as partial discharge inception voltage (PDIV) and PD phase, number, and magnitude were all analyzed as frequency dependent. High frequency led to high PDIV and a smaller discharge phase region. PD number and magnitude were first up and then down as the frequency increased. As a result, a suitable frequency for evaluating the insulation of high-frequency transformers is proposed at 8 kHz according to this work.
1. Introduction
To establish a smart grid, it is necessary to accomplish electronic power conditioning and control of electric power production and distribution [1]. In this trend, electronic-based power devices are migrating from the on/off control to a modern control, such as the direct control (DC) microgrid (DCMG) [2] and railway traction systems [3], etc. Power electronic transformers (PET), functioning as energy routers in the power grids at various voltage levels have gained widespread concern. Since PET is a combination of power electronics and high frequency (HF) transformers, it has a great capacity to convert electrical energy with different electrical characteristics and to make reactive power compensation for the system. To reduce the space share of PET, the operating frequency of PET is designed mainly to a few thousand hertz [4,5,6], much higher than the conventional power frequency of 50/60 Hz. The more severe working conditions of high power, high voltage, and high frequency threaten the insulation of PET [7]. As a core component of PET, HF transformers play a role in isolating and transmitting power, the insulation of which is particularly important. Damaged insulation of HF transformers not only has low energy conversion efficiency but also leads to power failures of the power and electronic equipment [8], further causing the whole crash of PET.
Partial discharge (PD) in high-voltage (HV) equipment is deemed as one of the most significant phenomena to be investigated for determining defects and degradation in electrical insulation and an apparatus’s lifetime. Similar to the conventional HV power apparatus, scholars have paid attention to PD in high-frequency transformers to determine whether there is a fault and to evaluate the health status.
The frequency dependence of PD sources has been taken into account and a model developed in order to study the effect of applying higher frequency (50 to 600 Hz) on the behavior of PD activity [9]. Experimental research has been carried out [10] in the range of 50 to 1000 Hz. However, according to field experiences of oscillating waves ranging from 20 Hz to several hundred hertz, the frequency of the power source makes little difference to PD activities [11,12,13]. More research has been done at higher frequencies. A semi-square voltage of 2 kHz has been used in [14]; even tens of kilohertz (kHz) repetitive pulse-width modulation (PWM), such as HV pulses stressed on power electronic devices, is considered important for the reduction of the insulation reliability and its life cycle [10,15]. As to the high- frequency transformer in PET, the non-sinusoidal waveform is not suitable for the voltage step-up/step-down [7]. As a result, the sinusoidal waveform with more than 1000 Hz should attract more attention.
As is well known, PD detection and the diagnosis of low-frequency power transformers depend on various techniques on which there have been extensive studies [16,17,18,19,20]. Several PD detection methods have been developed according to the physical properties of the insulation system, which accompany PD activity, such as current pulse method [21], ultrasonic detection, ultra-high-frequency (UHF) detection, and the optical method [22,23]. However, the lower frequency limit of conventional pulse current methods is close to that in the high-frequency transformer, the ultrasonic detection is not sensitive enough because of the complex acoustic impedance, the UHF signals are affected by communication signals, and there is still no known experience with optical measurements in this kind of electrical equipment. In this sense, the wide-band current method is proposed to be a good choice for PD detection in high-frequency transformers [24]. This paper is structured as follows. In Section 2, the measurement setup is described. The denoising process of empirical mode decomposition is depicted in Section 3; the signal-to-noise (SNR) ratio of the PD signal is increased by 4 dB. In Section 4, PD results and discussions are described, covering which parameters were frequency-dependent and how the parameters (PD phase region, PD number, PD magnitude, etc.) varied at different frequencies. The conclusions about appropriate conditions for testing HF transformers are presented in Section 5.
2. Partial Discharge Measurement Setup
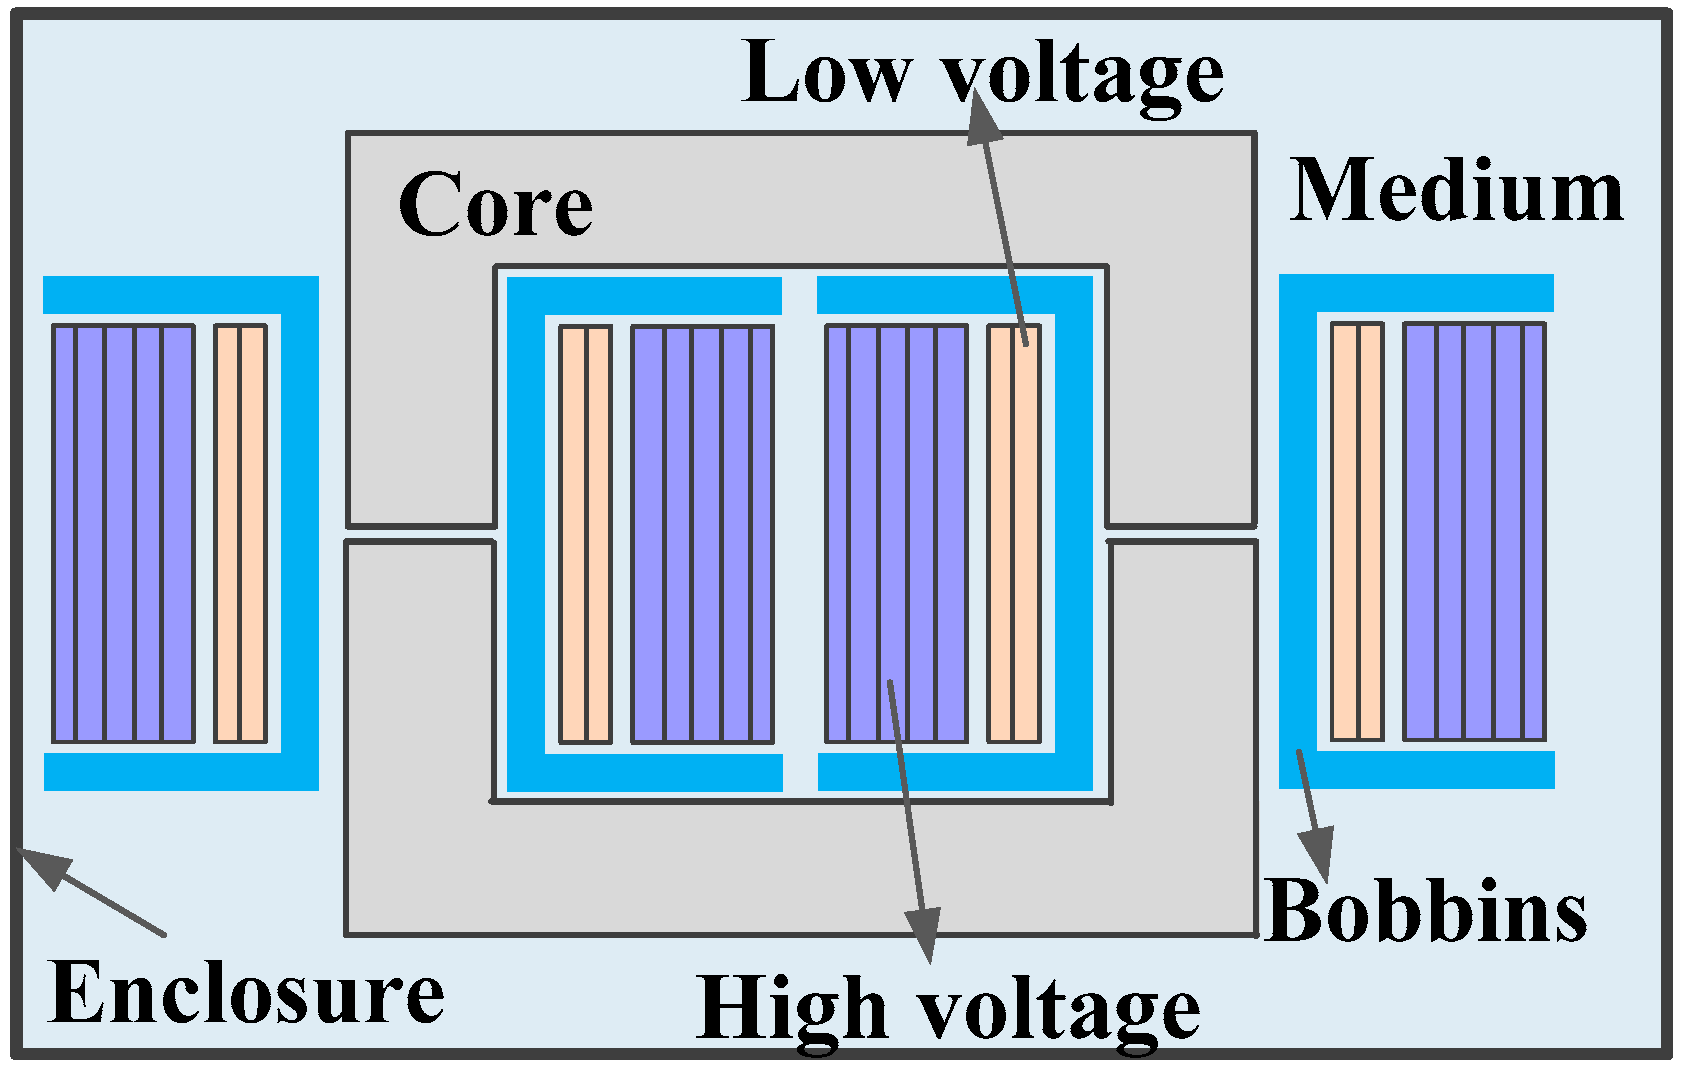
Insulation defects of HF transformers are caused by many factors, of which free metal particles often cause suspension potential or even suspension discharge. Suspension discharge is the greatest number of partial discharges [14,25]. A schematic diagram of a typical HF transformer is shown in Figure 1.
The structure of HF transformers are similar to conventional transformers.
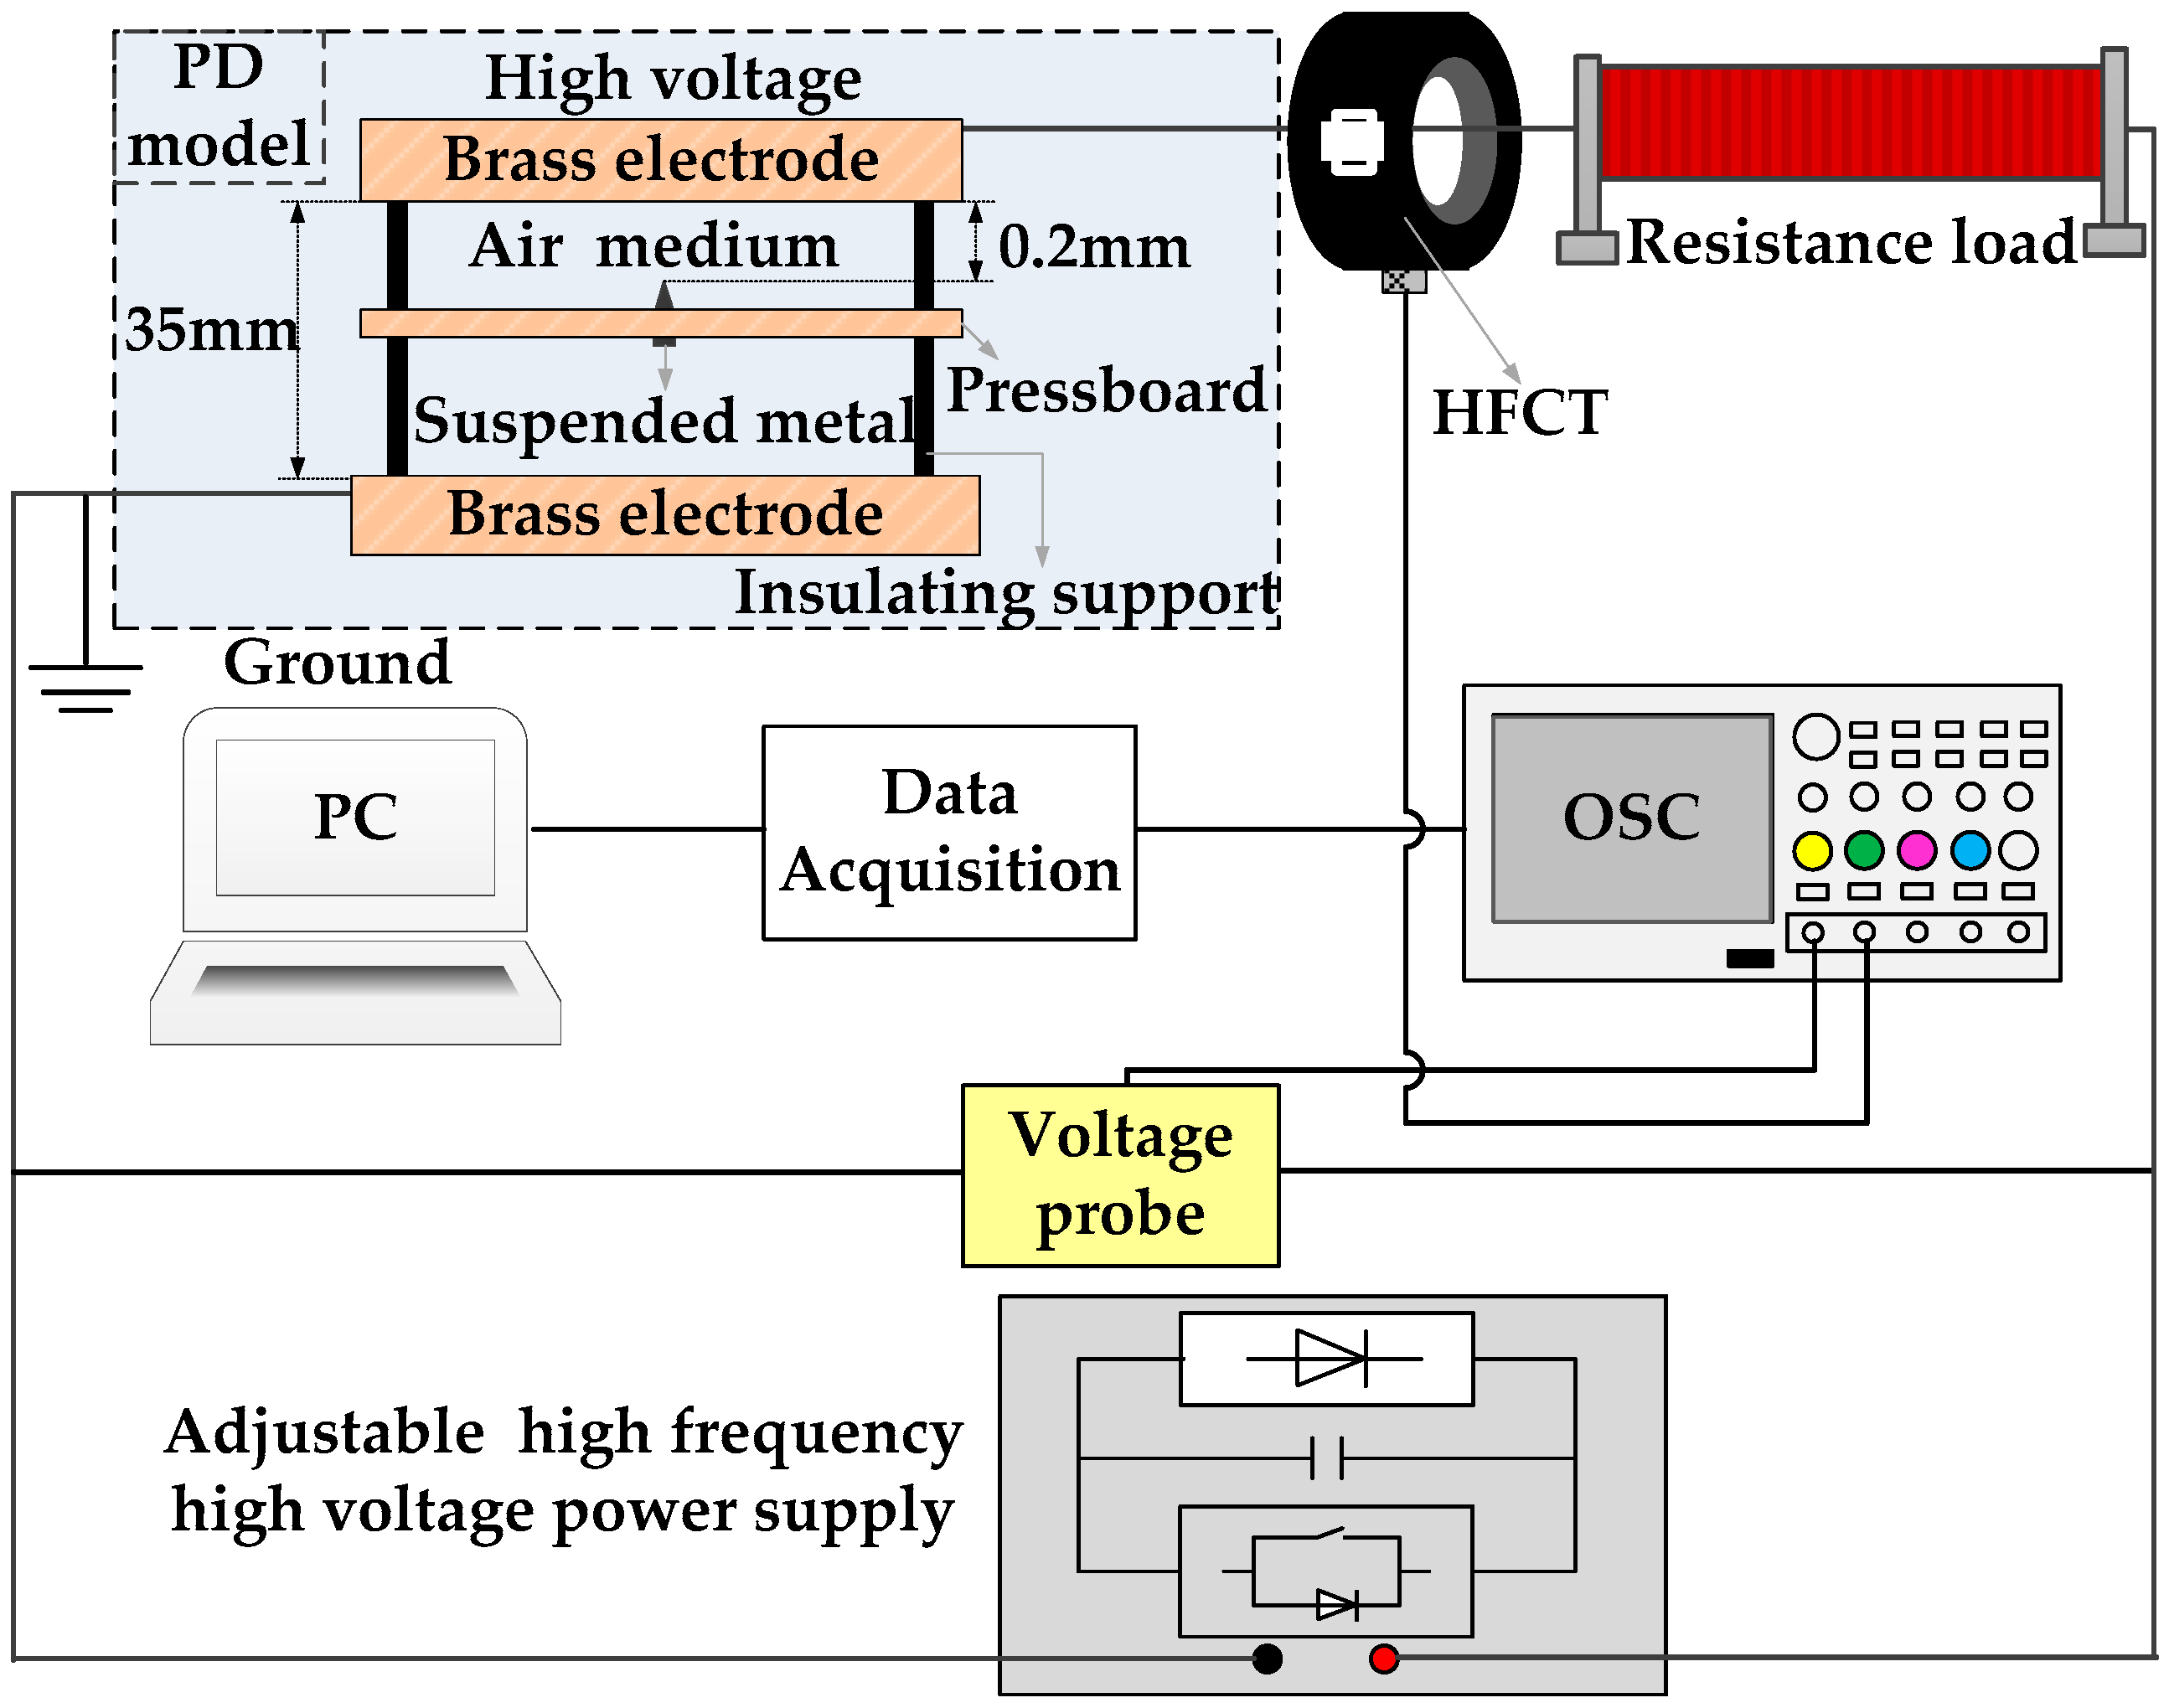
HF transformers consist of a magnetic core, copper windings, and insulation parts. However, the special operating conditions place more demand on the core material, winding distribution, and insulation performance. To achieve high efficiency in energy conversion and high power density, a high frequency through the magnetic core has been selected and a compact winding design was considered [7,26]. A large number of coils in a restrictive volume makes the inter-turn insulation gain strong electrical stress, and additional insulation failures should be taken into consideration in HF transformers. Insulating cardboard coordination has been adopted as the insulation for transformers [27], and the hot spots (the most likely point of suspension discharge) were in the winding of HF transformers [28]. Therefore, a suspension discharge model under insulating cardboard was designed to imitate the suspended discharge of a high-frequency transformer winding [29], as shown in Figure 2.
In the test platform, voltage output was provided to suspend the discharge model in series with a resistance of 10 MΩ by the power supply (CTP2000, Suman, Nanjing, China). A high-precision high-frequency current transformer (HFCT), type iHFCT-54 (Innovit, Xi’an, China), connected to the oscilloscope (DLM2034 with a high sample rate of 2.5 GS/s and high bandwidth of 350 kHz, Yokagawa, Tokyo, Japan) collected the whole signals.
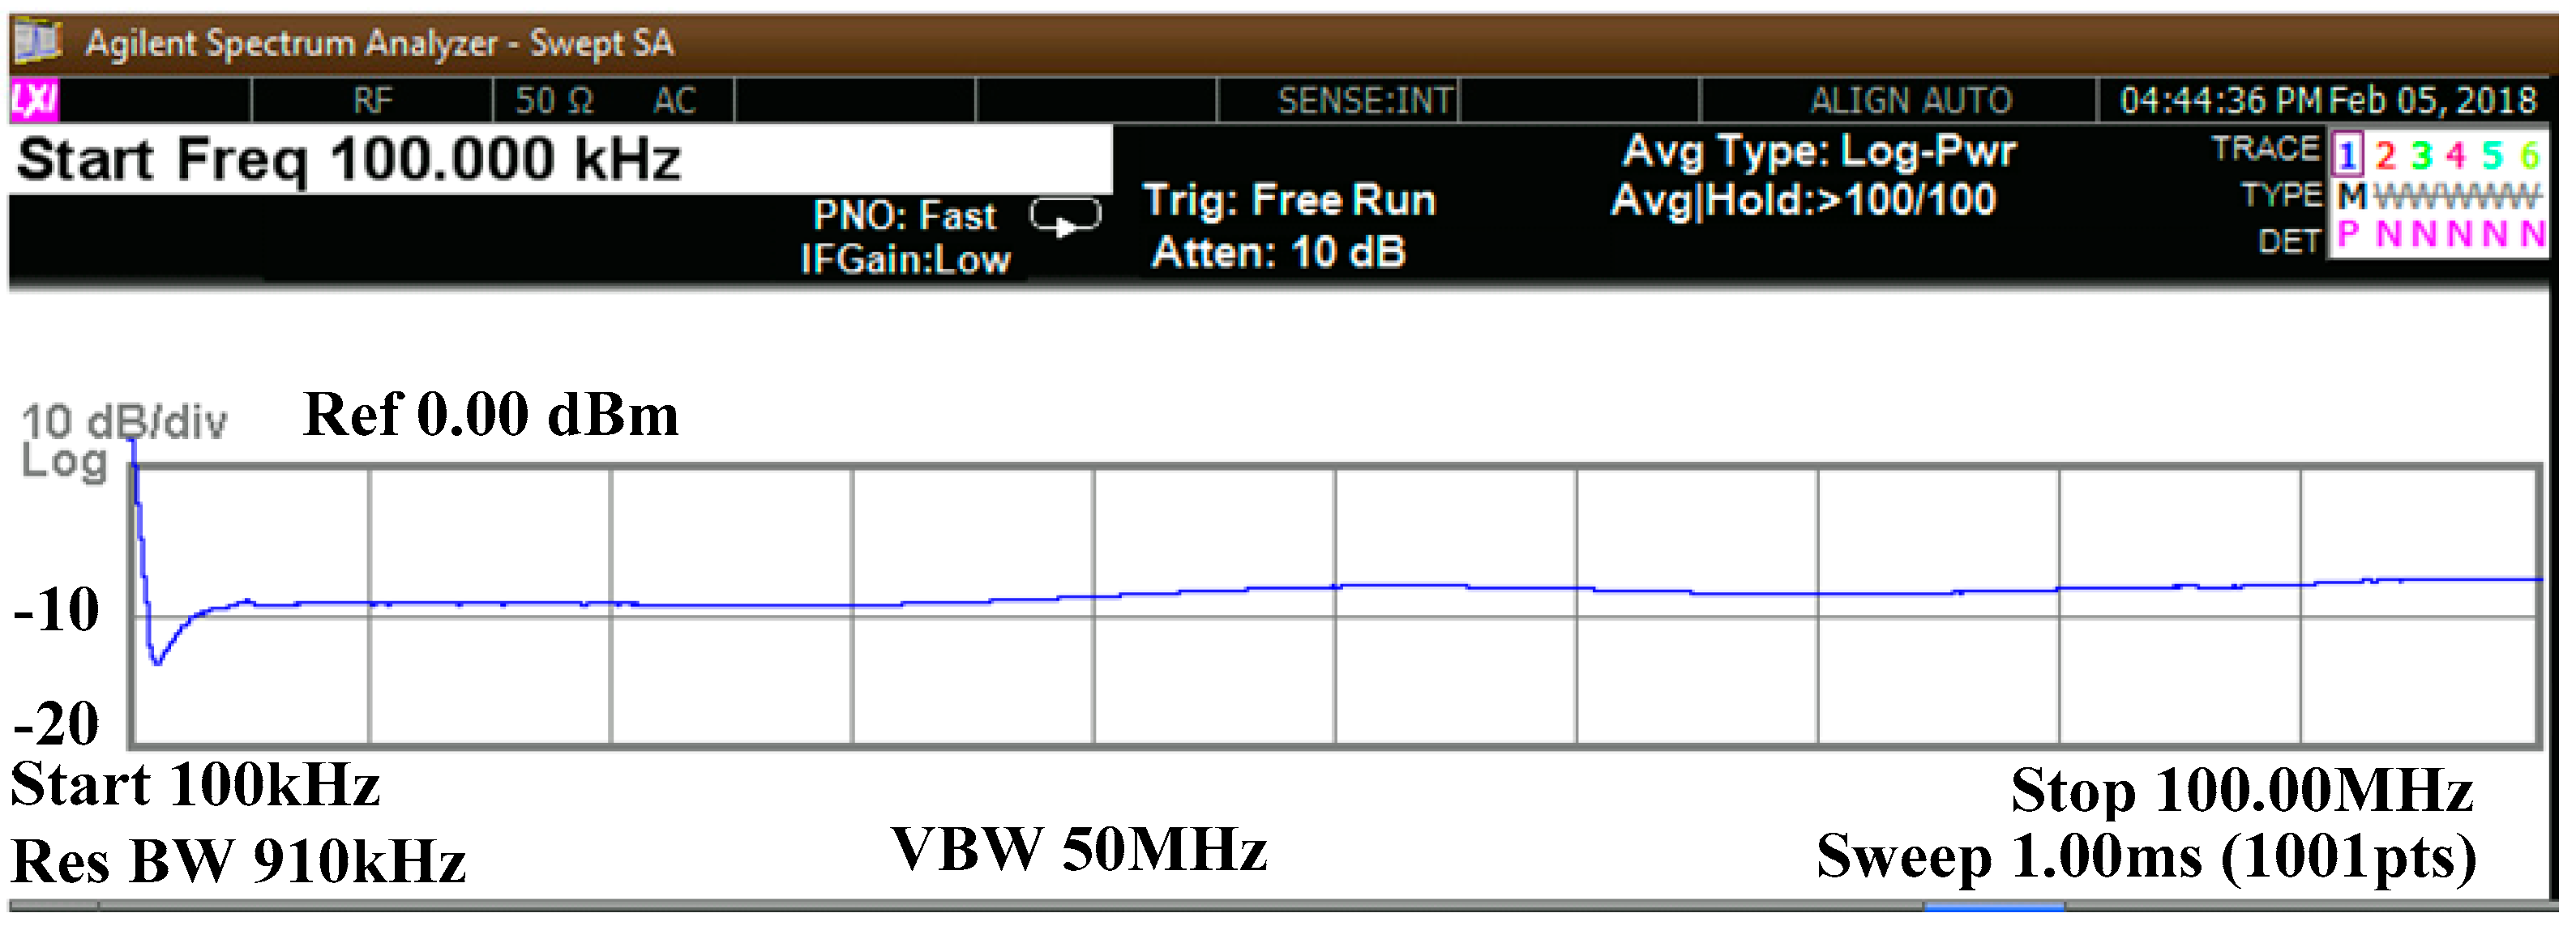
One of the core devices in the test platform is the PD model. The large potential difference between the two parallel brass plates with a 35 mm gap provided a strong electric field in the air medium. Thus, the metal suspended in the strong electric field by the insulating paperboard and support carried a floating potential. Suspension discharges were generated due to the large potential difference between the suspended metal and HV side brass plate, but with a small gap of 2 mm. The other core device was HFCT, shown in Figure 1. It is a magnetic core surrounded by a multi-turn conductive coil. After a discharge, a large amount of charge moves rapidly toward the defect until it discharges again. This process is cyclic and generates a high-frequency current in the circuit. The magnetic field generated by the rapid current change passes through the magnetic core, resulting in an induction voltage of the coil, which is the signal output of the HFCT. The iHFCT-54 sensor has high accuracy, and the detection frequency range can reach 0.3~100 MHz. There is no electrical connection between the measurement circuit and the measured current. With a front fastening, the iHFCT-54 used in the non-intrusive detection method can realize online monitoring of PD. The output characteristic of this HFCT is shown in Figure 3.
3. Denoise Processing of PD Signal
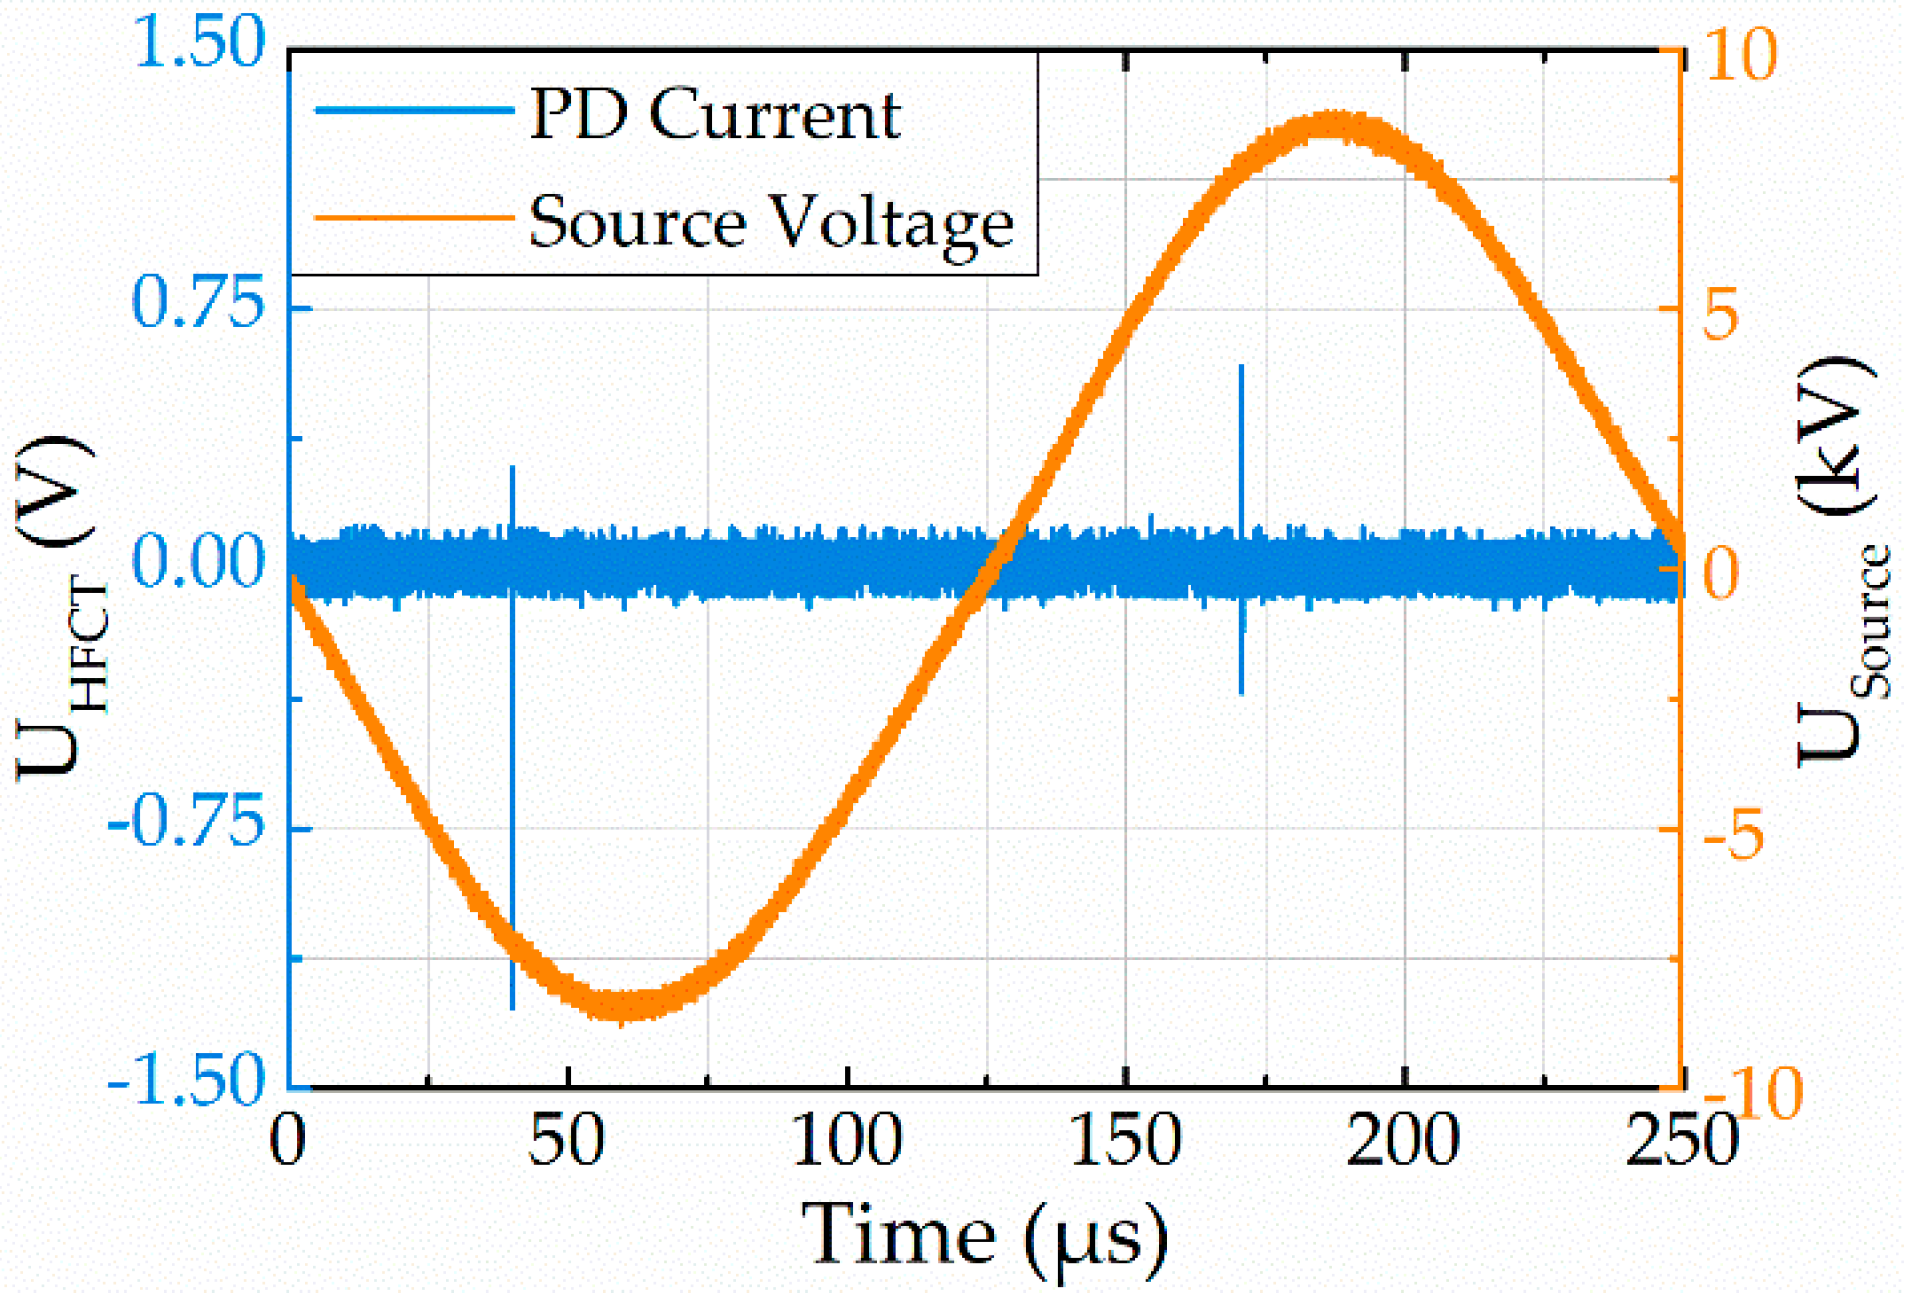
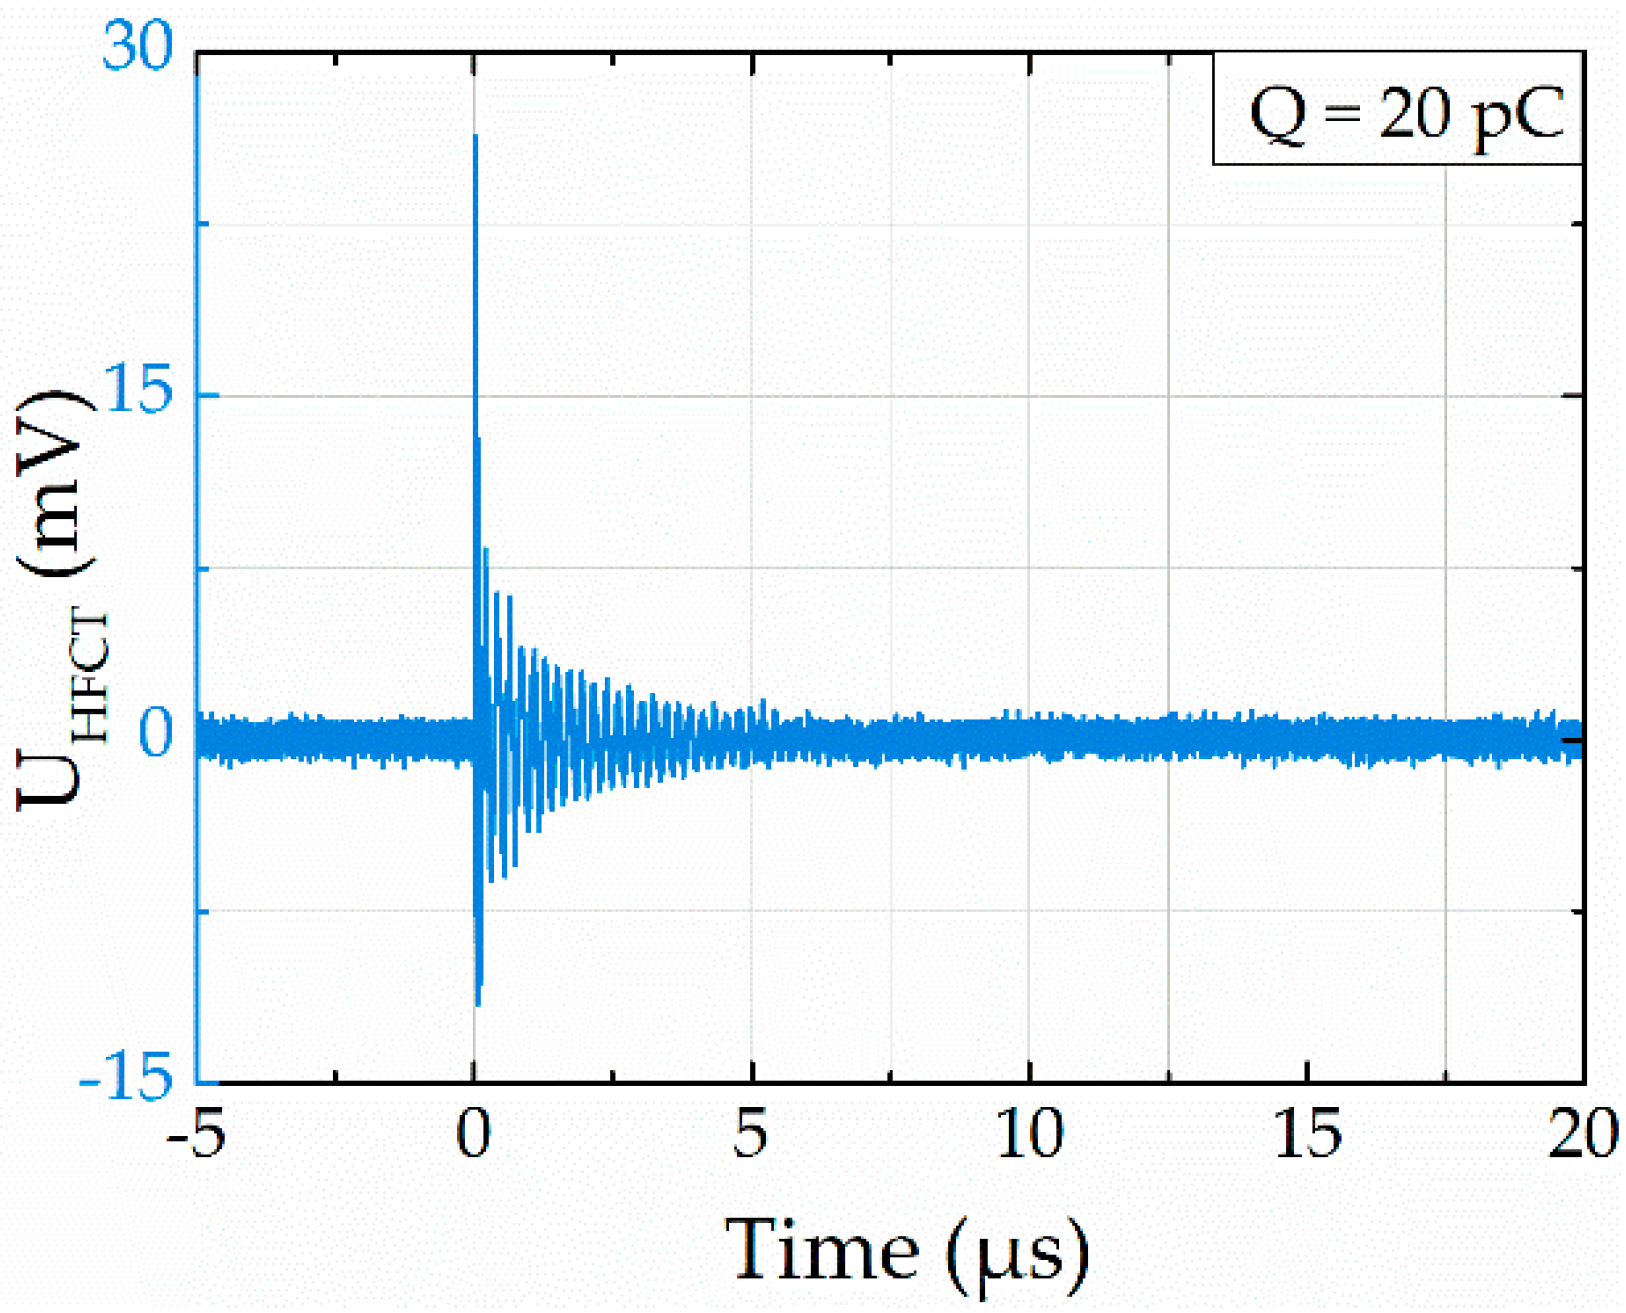
A typical PD current signal is shown in Figure 4 when the power supply exerted a peak-to-peak amplitude of 20 kV and frequency of 4 kHz sinusoidal voltage. The output amplitude of HFCT is UHFCT.
PD activity was detected on both positive and negative axes in a period, according to Figure 4. UHFCT attained a peak-to-peak value of 1.61 V with noise of 0.232 V, which reduced the PD magnitude accuracy. An improved signal-to-noise ratio (SNR) of PD signal is required. Consequently, empirical mode decomposition (EMD) was used to improve the SNR in this manuscript because of its merits on processing nonlinear and non-stationary signal.
3.1. Process of Empirical Mode Decomposition
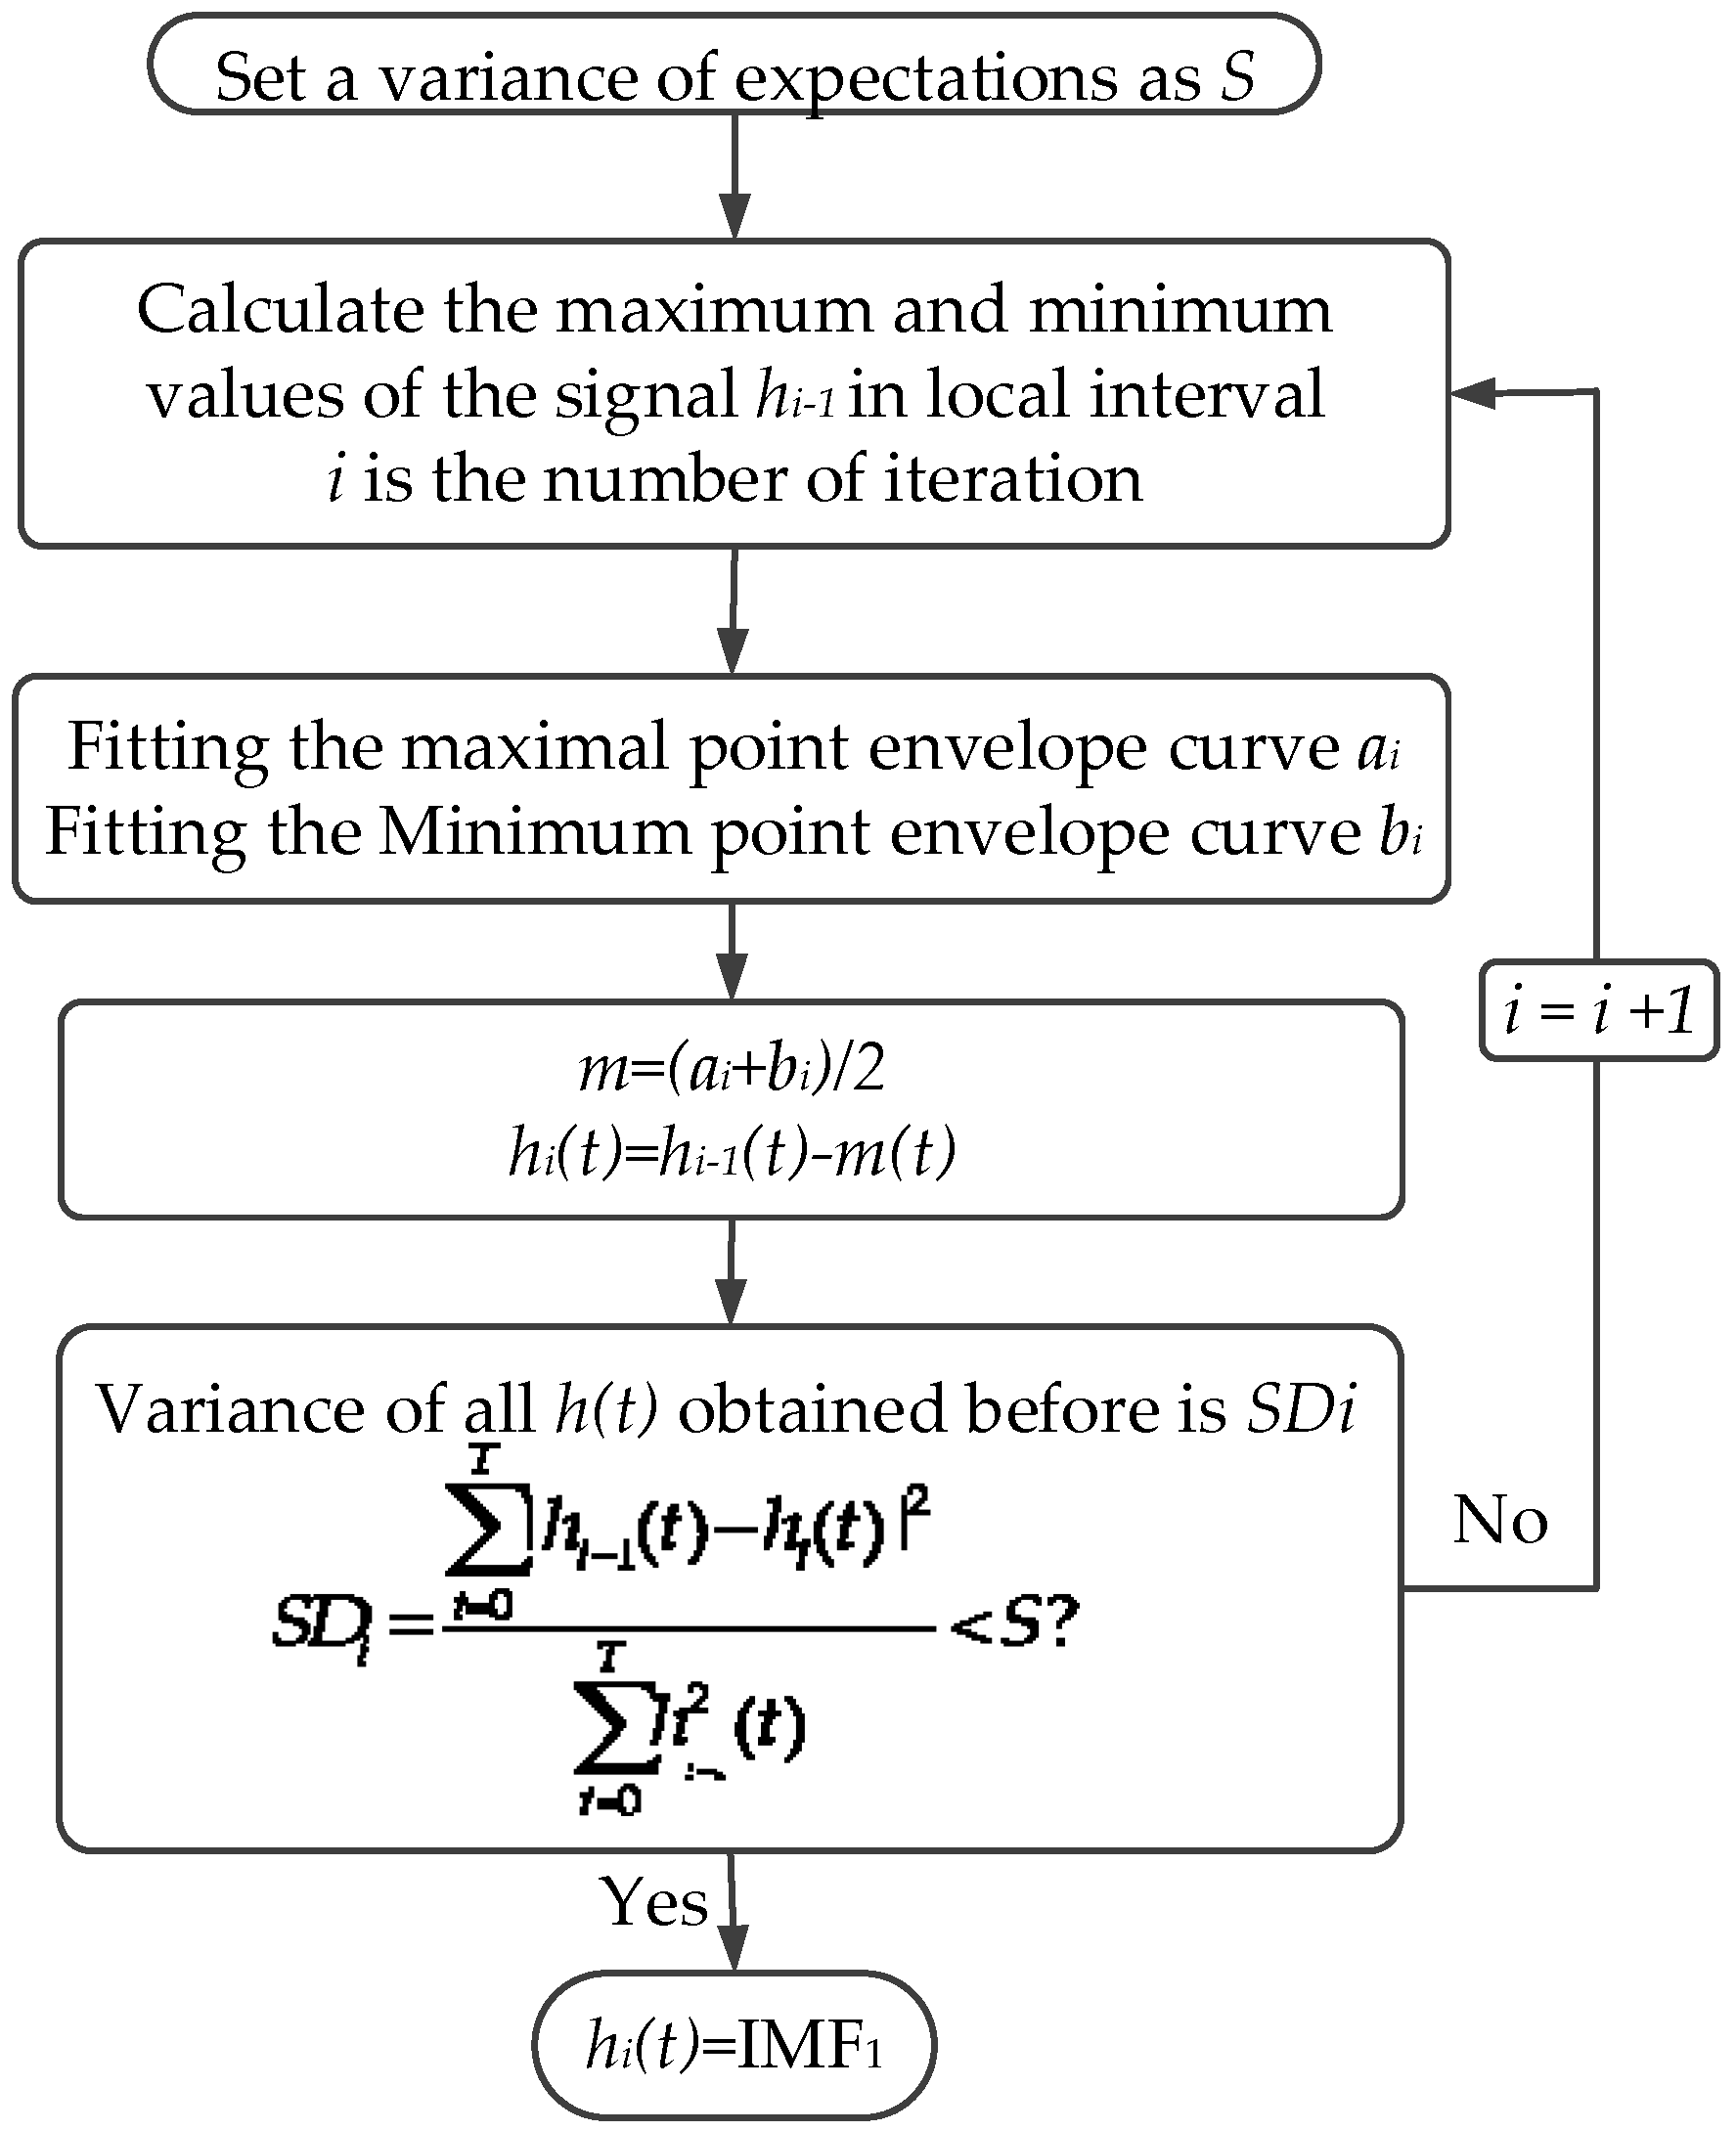
EMD has an advantage in dealing with nonlinear non-stationary signals because it has great self-adaptability. EMD is based on the Hilbert–Huang transform. The Hilbert–Huang transform assumes that all data contain different simple internal oscillation modes called intrinsic mode functions (IMFs) [29]. In this way, complex data are superimposed by many different IMFs whose amplitude and frequency vary as a function of time. Based on such an assumption, the process of EMD to process signals is shown in Figure 5.
A variance S is set associated with the expected noise reduction. Then, the upper and lower envelope of the original signal is obtained by calculating the local maximum/minimum. The upper envelope is denoted as ai while the lower is bi. m is the arithmetic mean of ai and bi. The residual signal extracted from some information is represented by h. If the variance of all h obtained before SDi is less than S, then the first IMF will equal hi, and the hi+1 is the new pending signal S.
The total sum of IMFs can match the original signal perfectly. The IMF is especially effective on the local nonlinear distortion of the waveform, showing potential signaling processes and revealing the instantaneous change of the process as a whole.
3.2. Analysis of Noise Reduction on PD Signal
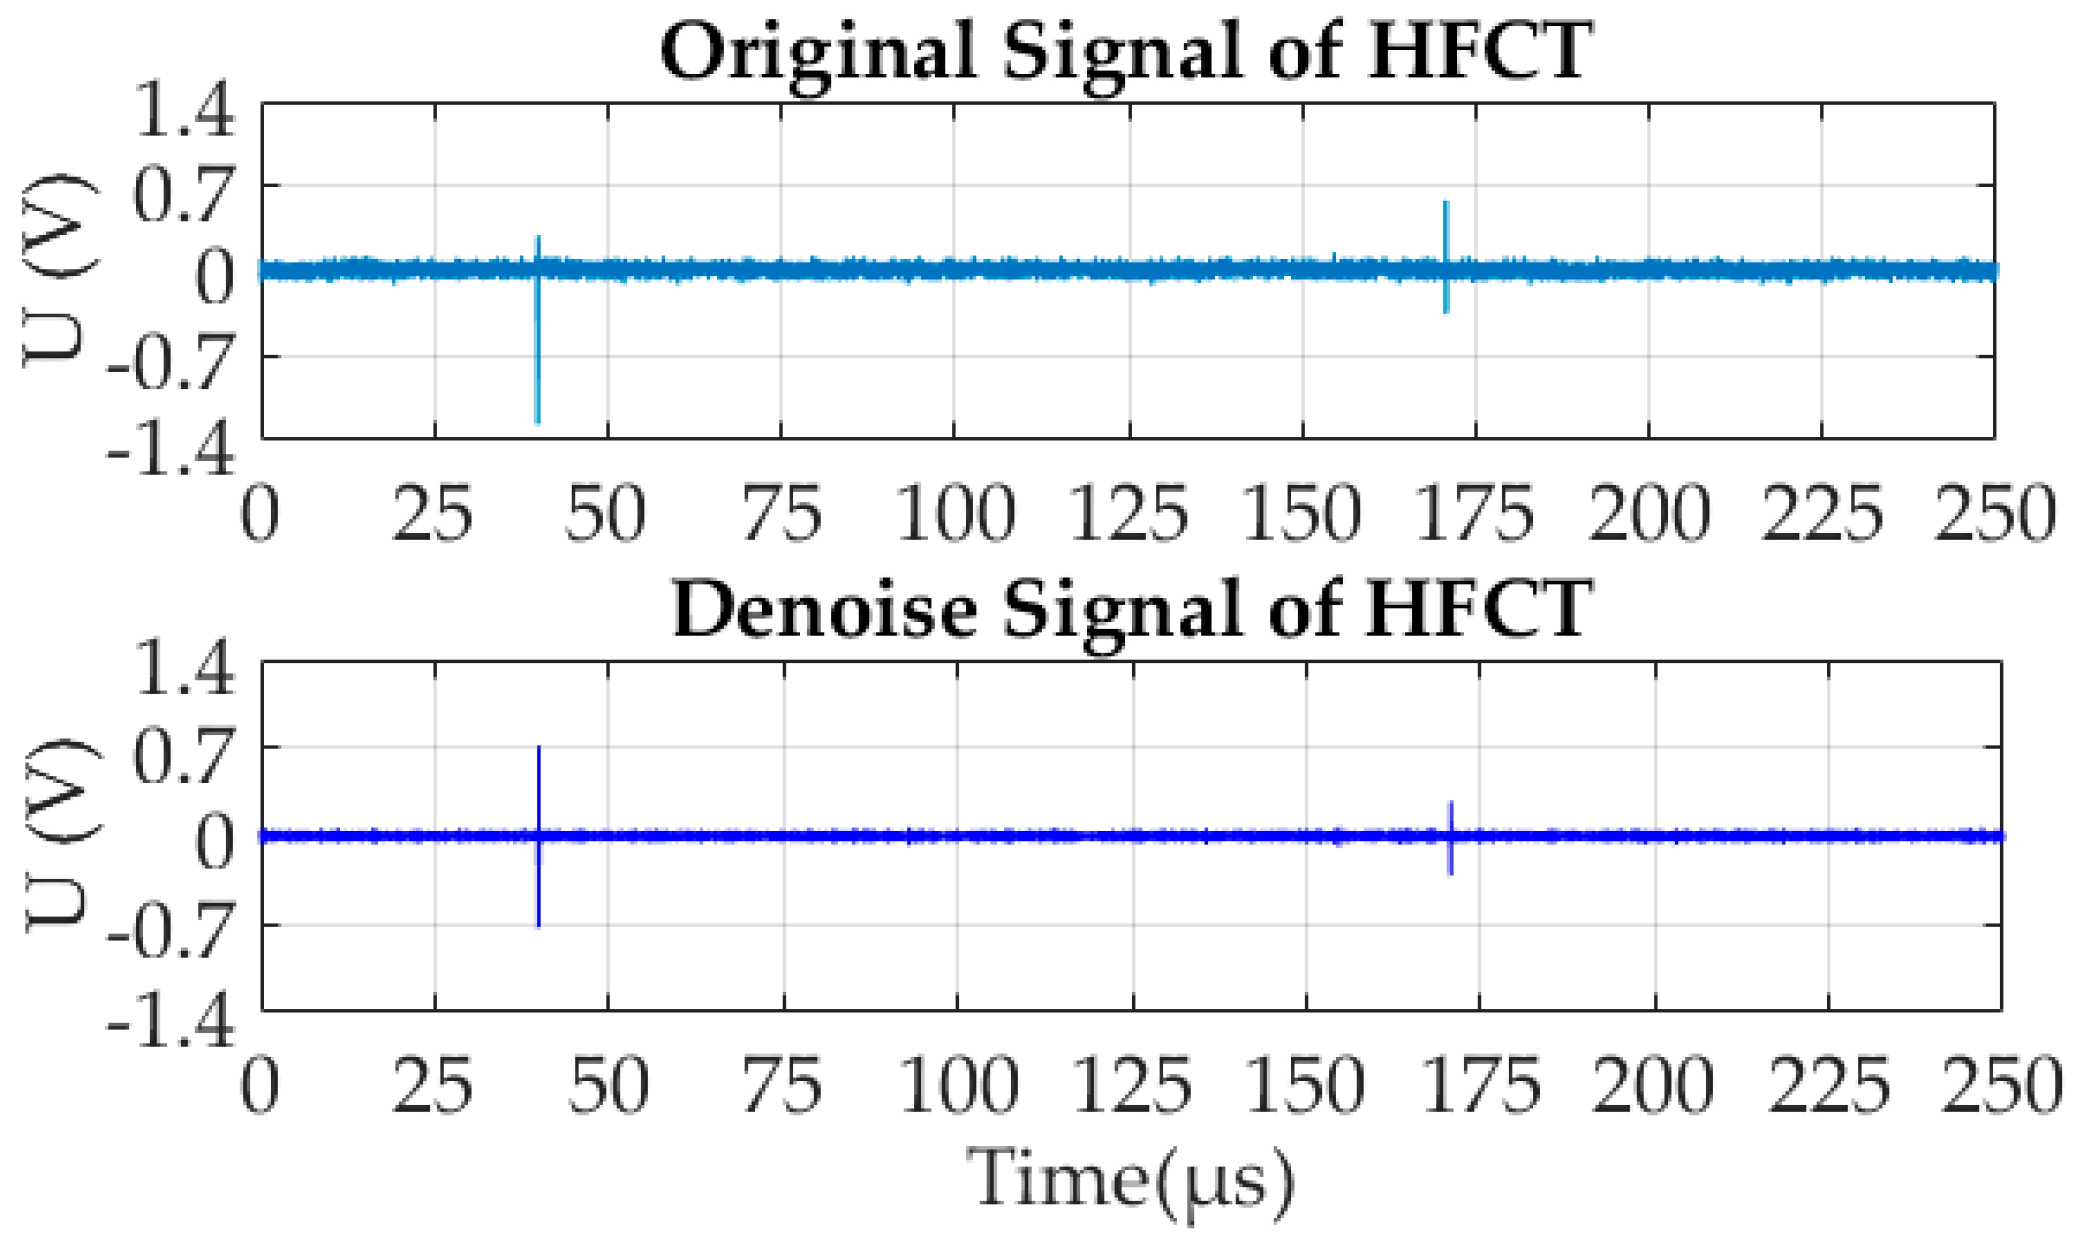
After PD current signal was carried out by EMD, the denoising results (Figure 6) were obtained.
As shown in Figure 6, the denoised signal has been corrected to some extent, in terms of Equation (1), for SNR.
At t = 40 μs, the peak-to-peak amplitude of the original signal was 1.61 V. At t = 170 μs, the peak-to-peak amplitude of the original signal was 0.79 V. At t = 40 μs, the amplitude of the denoised signal was 1.32 V. At t = 170 μs, the amplitude of the denoised signal was 0.65 V. Therefore, noise reduction does not change the linear relationship between the current signal and PD magnitude. SNR of the original signal is shown in Equation (2):
SNR of the denoised signal is shown in Equation (3):
Comparing Equation (2) and Equation (3), SNR increased by 4 dB for PD current signals after the EMD noise reduction. After denoising, the relationship between PD current output by the HFCT and PD magnitude was obtained (Figure 7).
The peak-to-peak UHFCT was 40 mV when applied at 20 pC charge to PD model. A linear relationship between PD magnitude (Q) and the response of HFCT (UHFCT) can be obtained.
4. Results and Discussion
This section describes how the applied frequency influences the PD characteristics. The statistics of the PD results for 100 periods applying variable frequencies of 4 kHz, 6 kHz, 8 kHz, 10 kHz, and 12 kHz are shown in this section.
4.1. Partial Discharge Inception Voltage at Different Frequencies
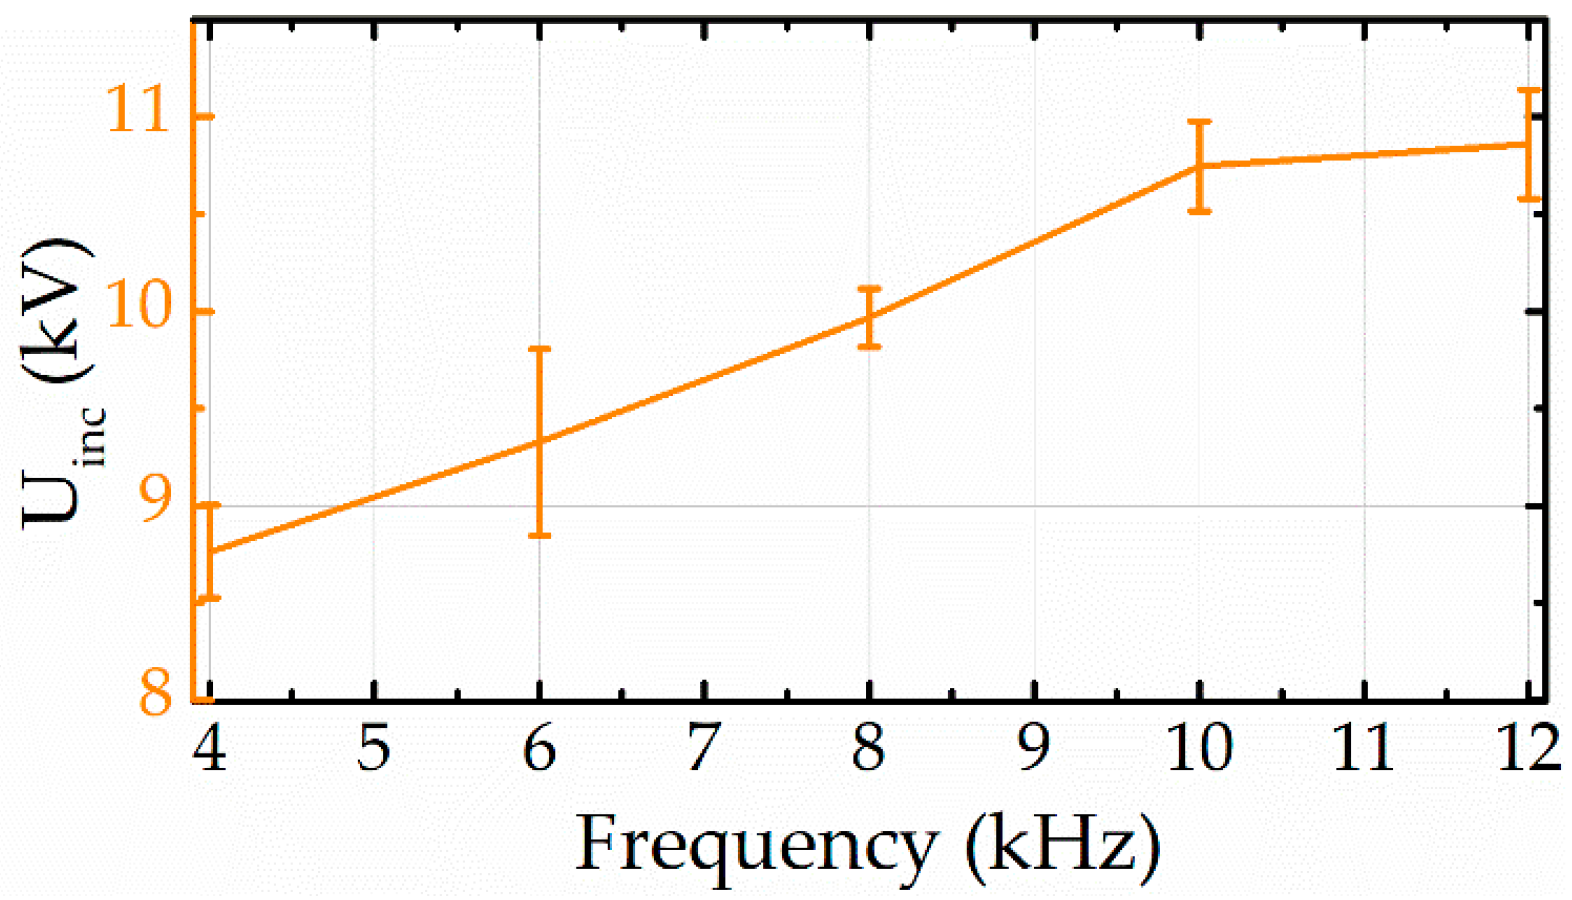
The partial discharge inception voltage (PDIV) at different frequencies was detected multiple times at each frequency. The amplitude of PDIV is Uinc, as shown in Figure 8.
The measurement results in Figure 8 show that Uinc was in a range at a fixed frequency. An increasing tendency of the range was evident while increasing the frequency. At 8 kHz, the distribution range of Uinc was minimal with a high measurement accuracy.
4.2. Results of PD Spectrum at Different Frequencies
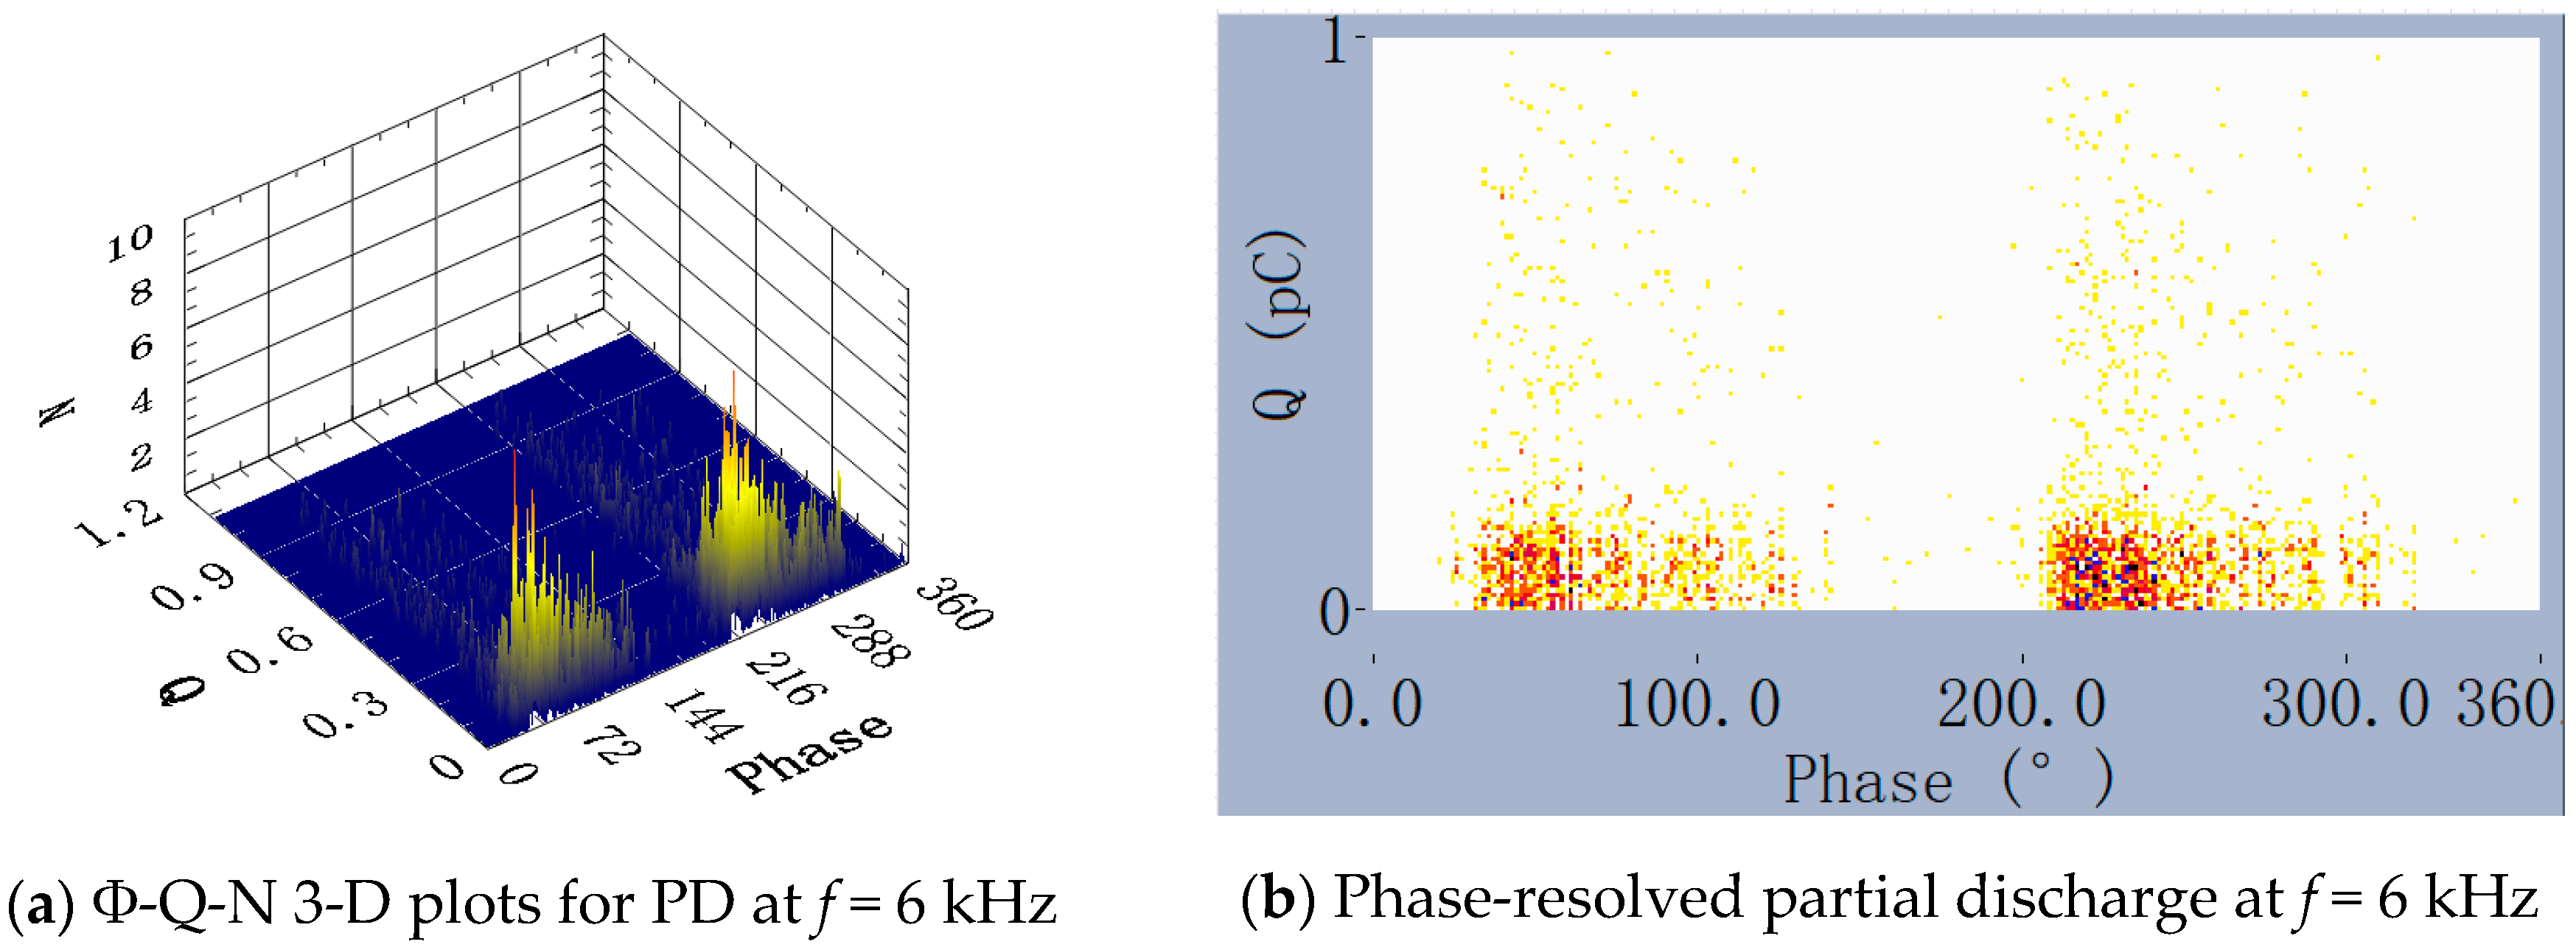
The basic parameters for characterizing PD patterns are phase angle (Ф) in degrees, discharge magnitude (Q) in pC, and number of discharges (N). A 3-D pattern is shown in Figure 9a and phase-resolved partial discharge (PRPD) is presented in Figure 9b.
4.2.1. PD Q-Ф Scatter Plot at Different Frequencies
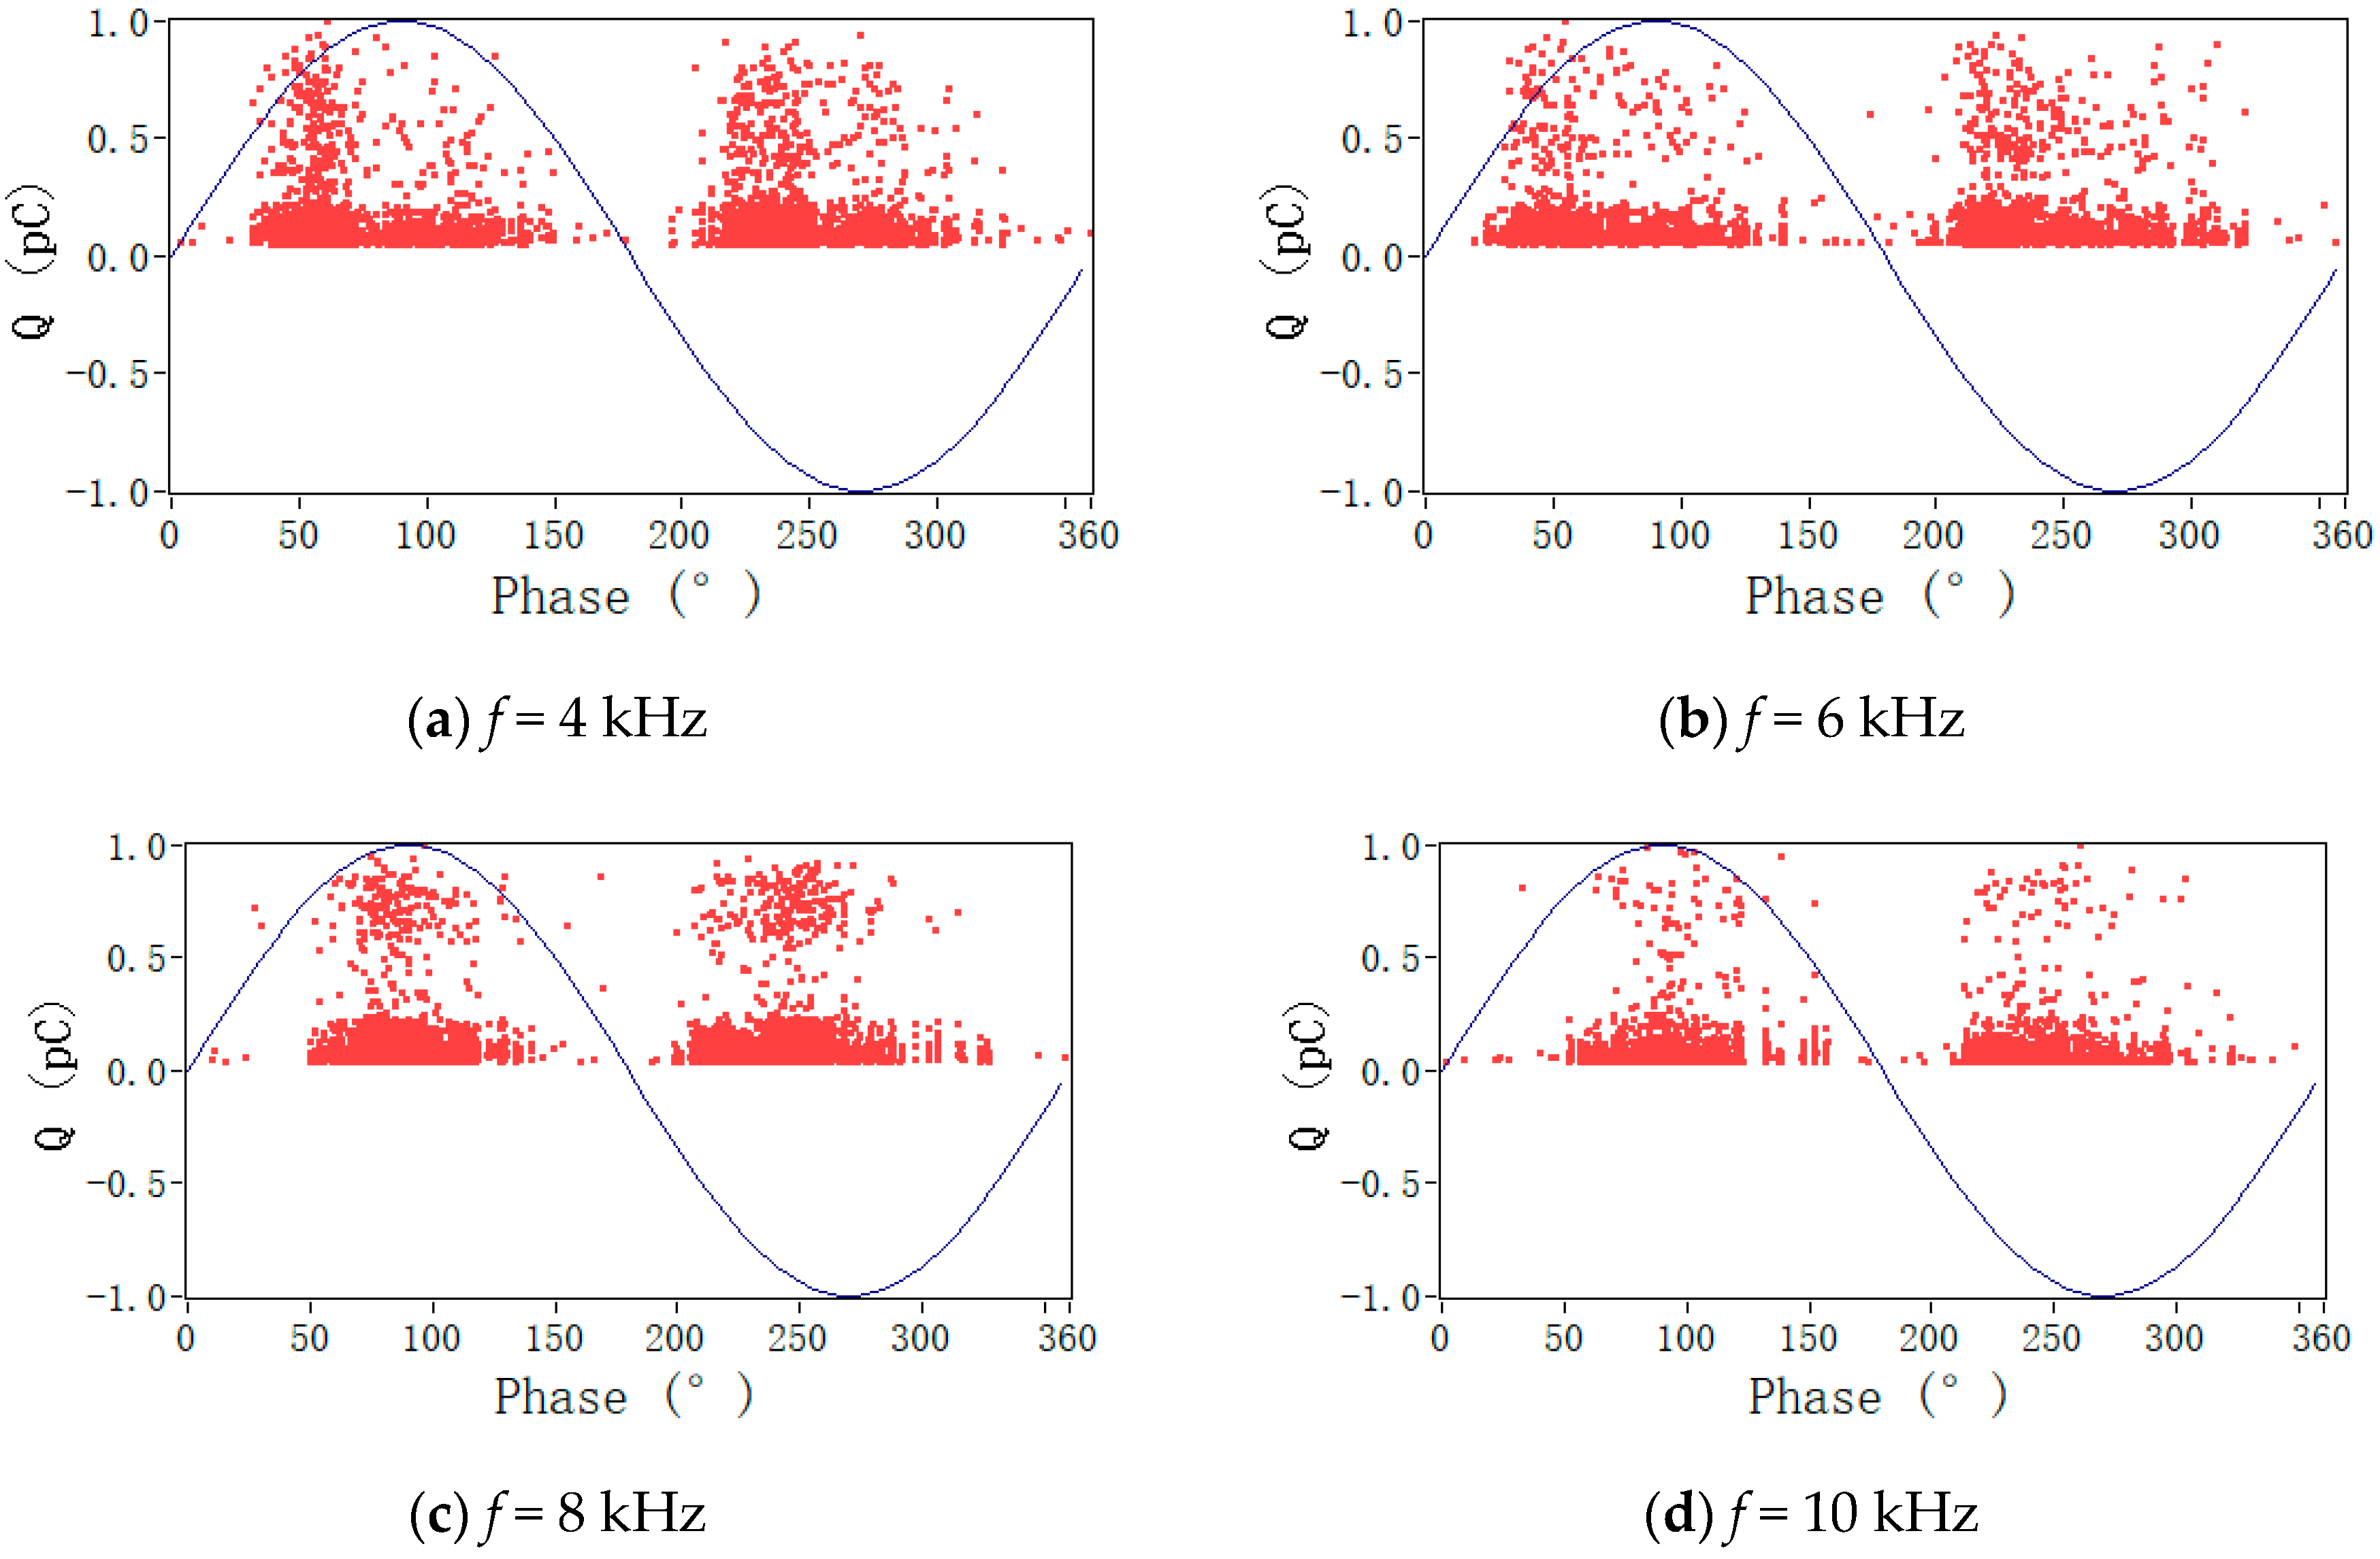
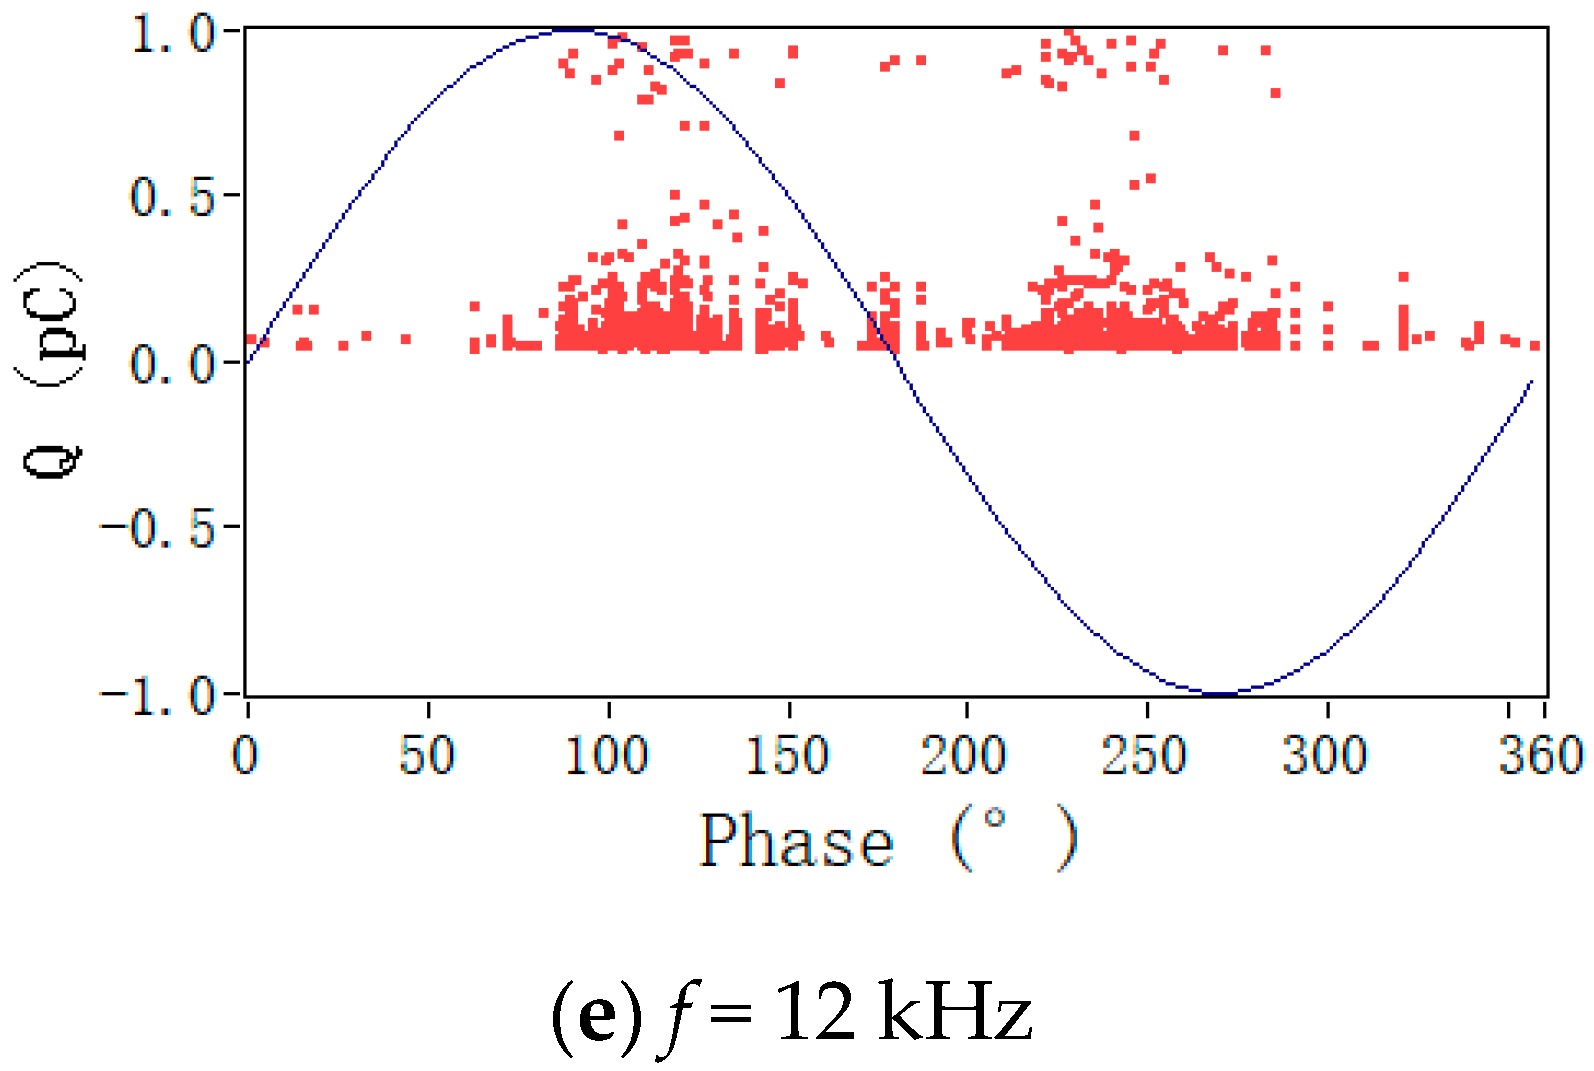
The main detection parameter of PD is PD magnitude (Q), which is the basis of other detection parameters. The PD U-Ф scatter plot in Figure 10 is the distribution statistic diagram of discharge magnitude in each phase.
As shown in Figure 10, the scattered pattern of PD current in the semi-axes was an ‘hourglass’ shape. As the frequency increased, the ‘hourglass’ waist became thinner. This means that the PD magnitude in the low frequencies was more polarized.
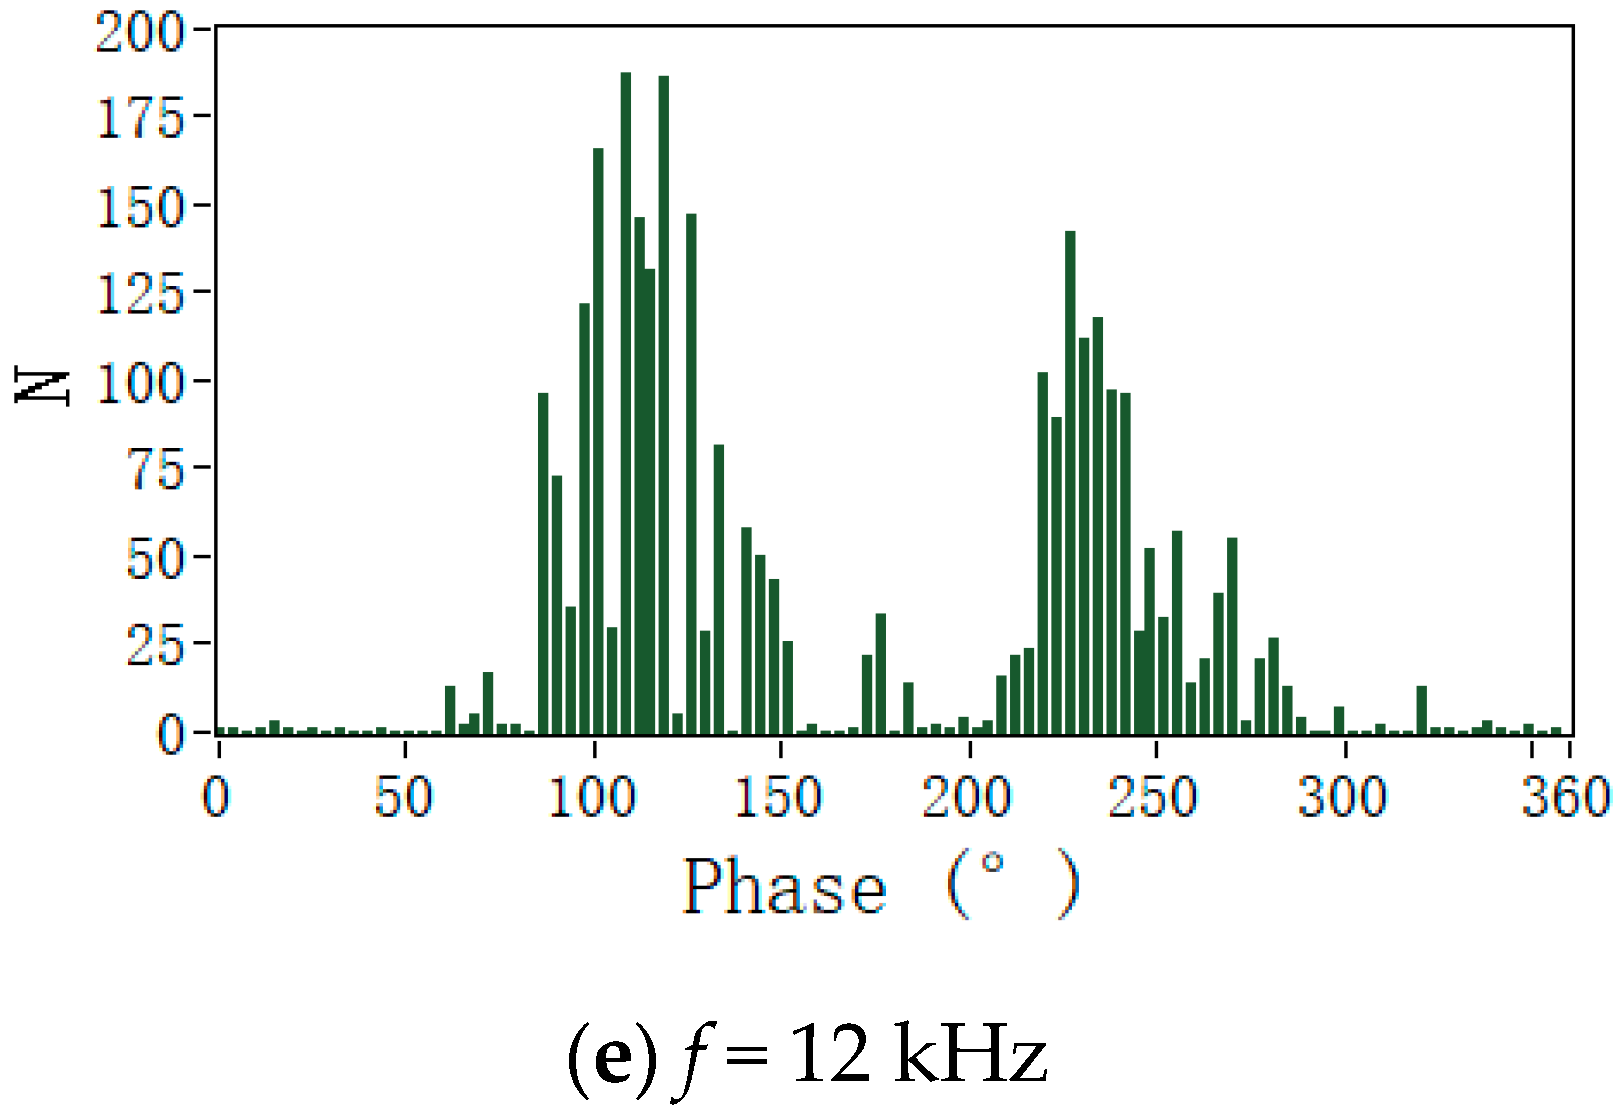
4.2.2. PD N-Ф Spectrogram at Different Frequencies
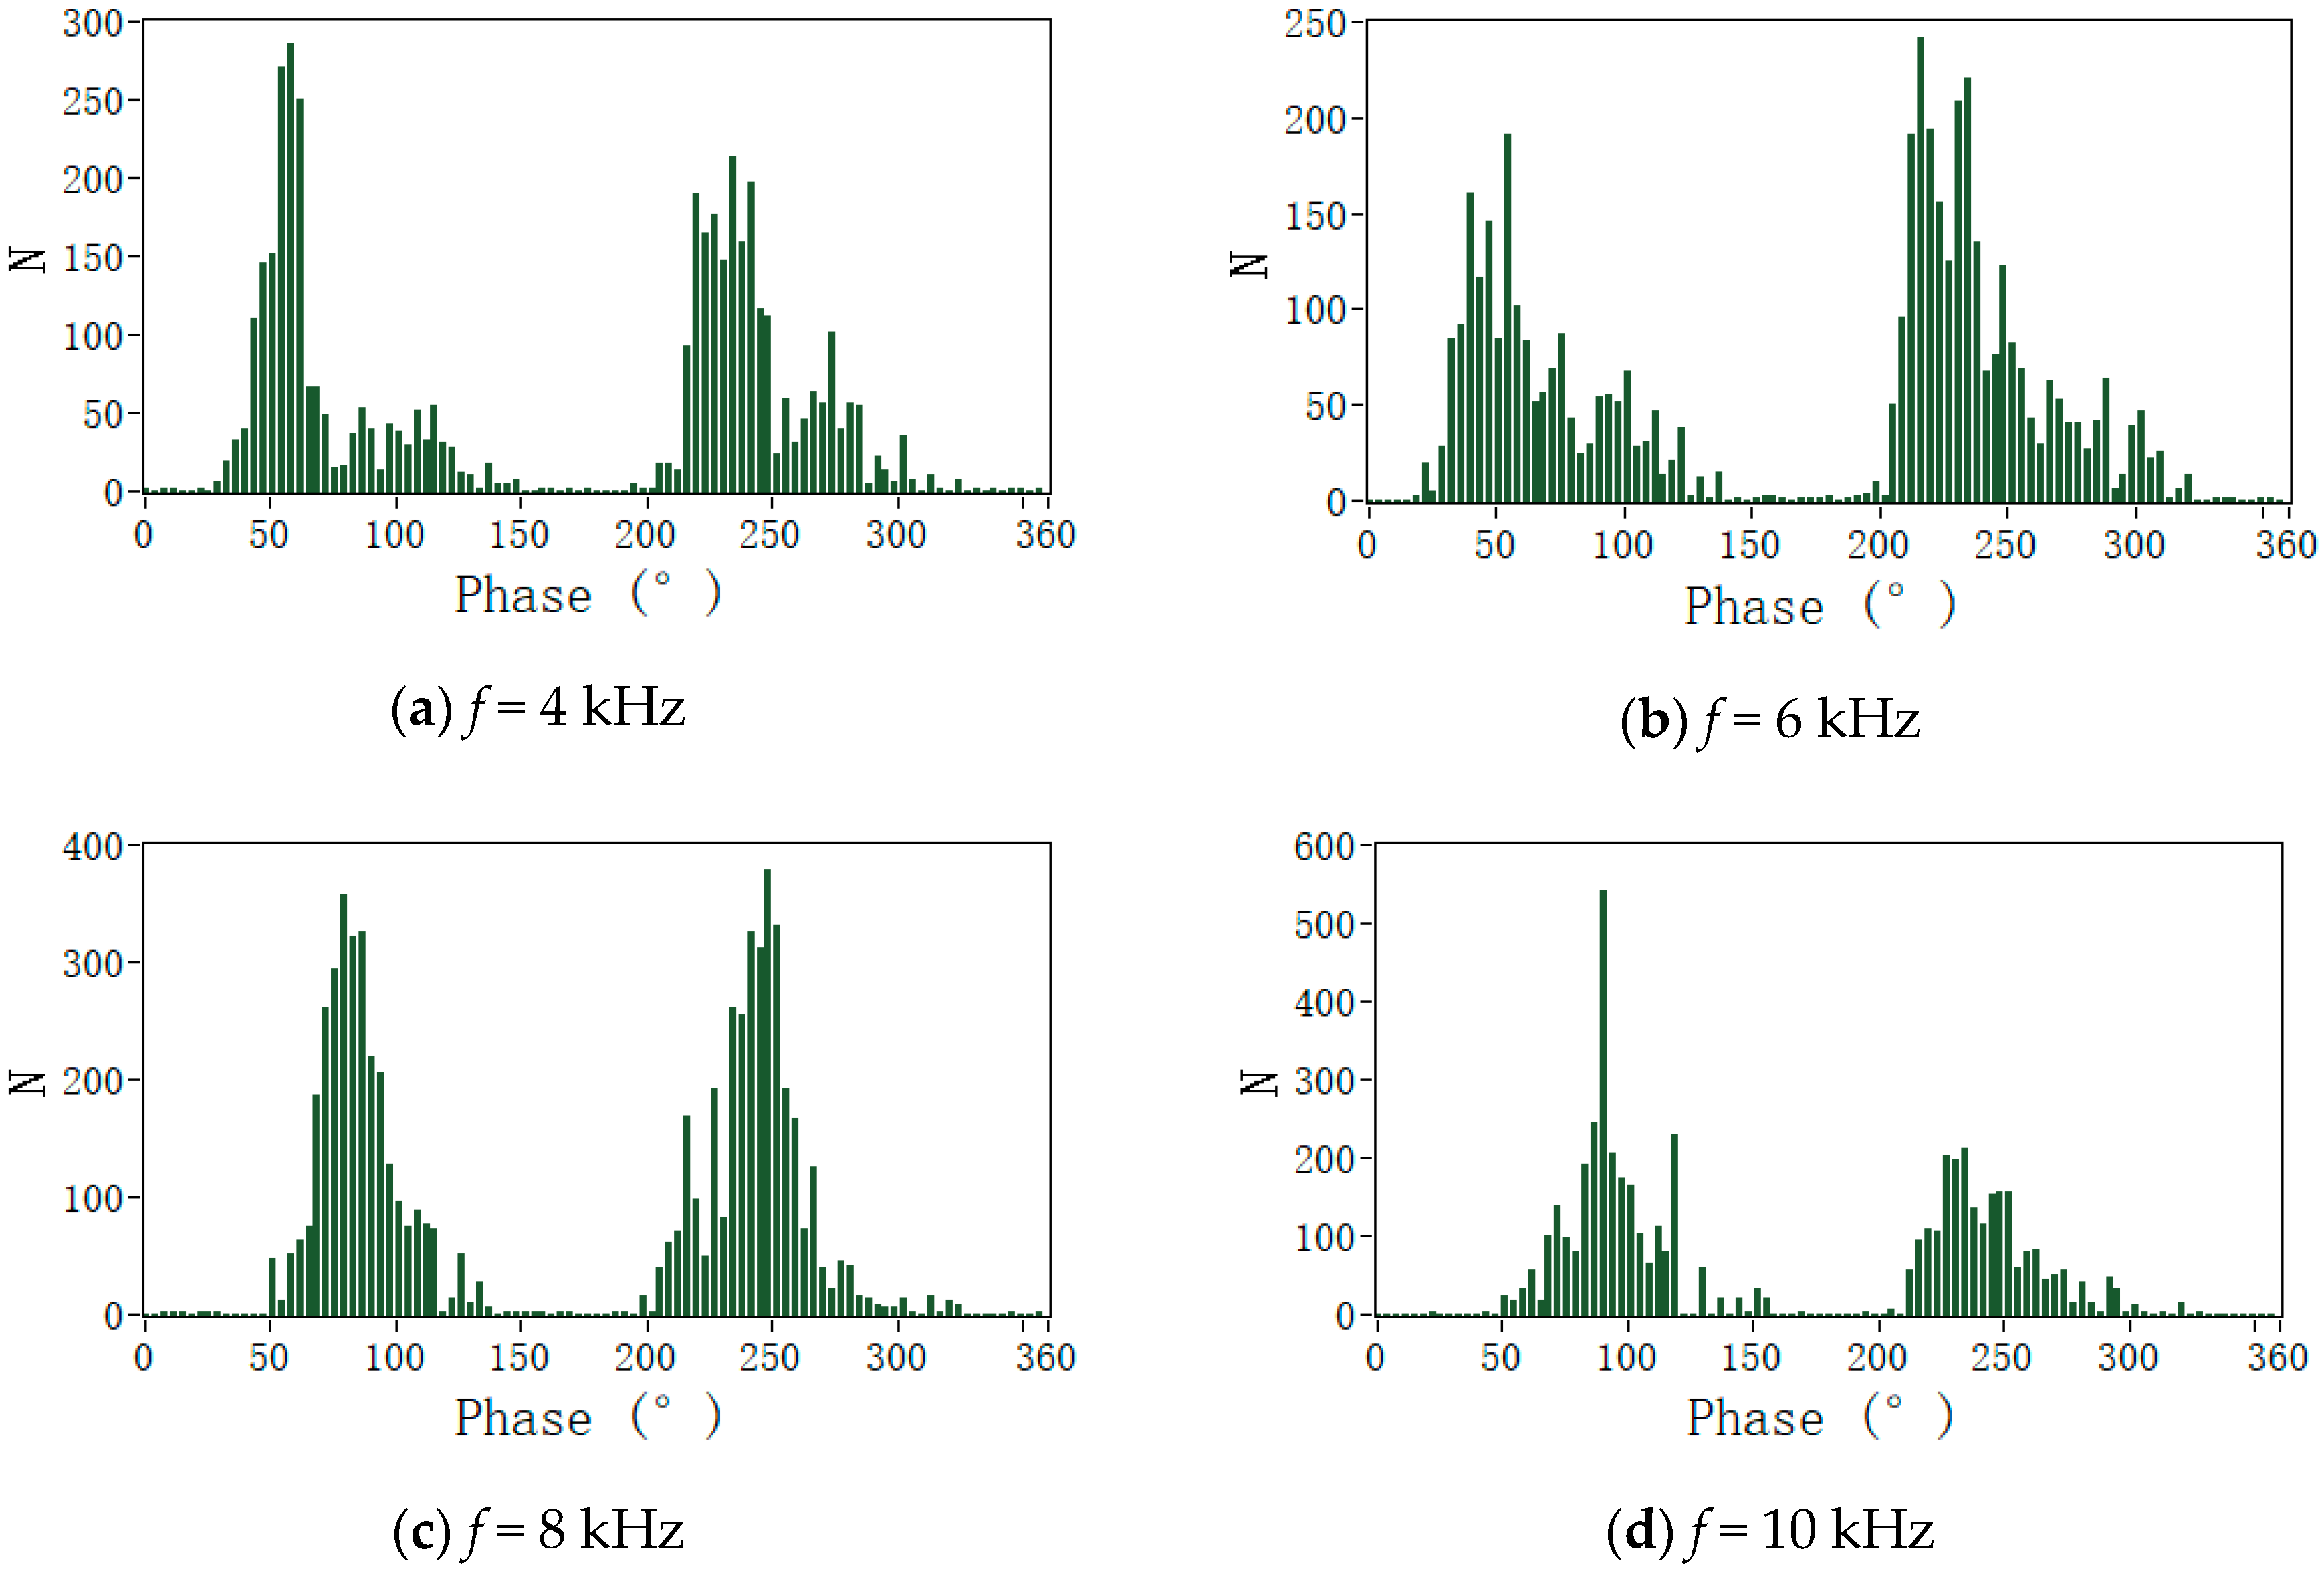
The PD N-Ф spectrogram illustrates the PD proper phase displaying the occurrence time of PD.
Figure 11 shows that almost no PD occurred near the power zero crossing point. PD current N-Ф spectra appeared as an ‘M’ shape, often called a “rabbit ear” shape. A transformation of the spectrogram in the semi-period from a right triangle to an acute triangle occurred with increasing frequency. From Figure 11, PD phase distribution information as a phase region and phase center is shown in Table 1.
PD phase distribution was closely related to the polarity of power and frequency. The frequency increase led to three phenomena on the PD phase distribution:
- Initial PD discharge phase in the positive semi-period gradually shifted to the right, the end PD phase fluctuated at 150°, and the PD phase region decreased;
- Initial PD phase in the negative semi-period fluctuated at 200° and the end PD phase gradually shifted to the left, giving rise to the decreasing PD phase region;
- Positive discharge center phase shifted to the right with increasing frequency; the negative discharge center phase was maintained around 230°.
4.2.3. PD Statistical Data at Different Frequencies
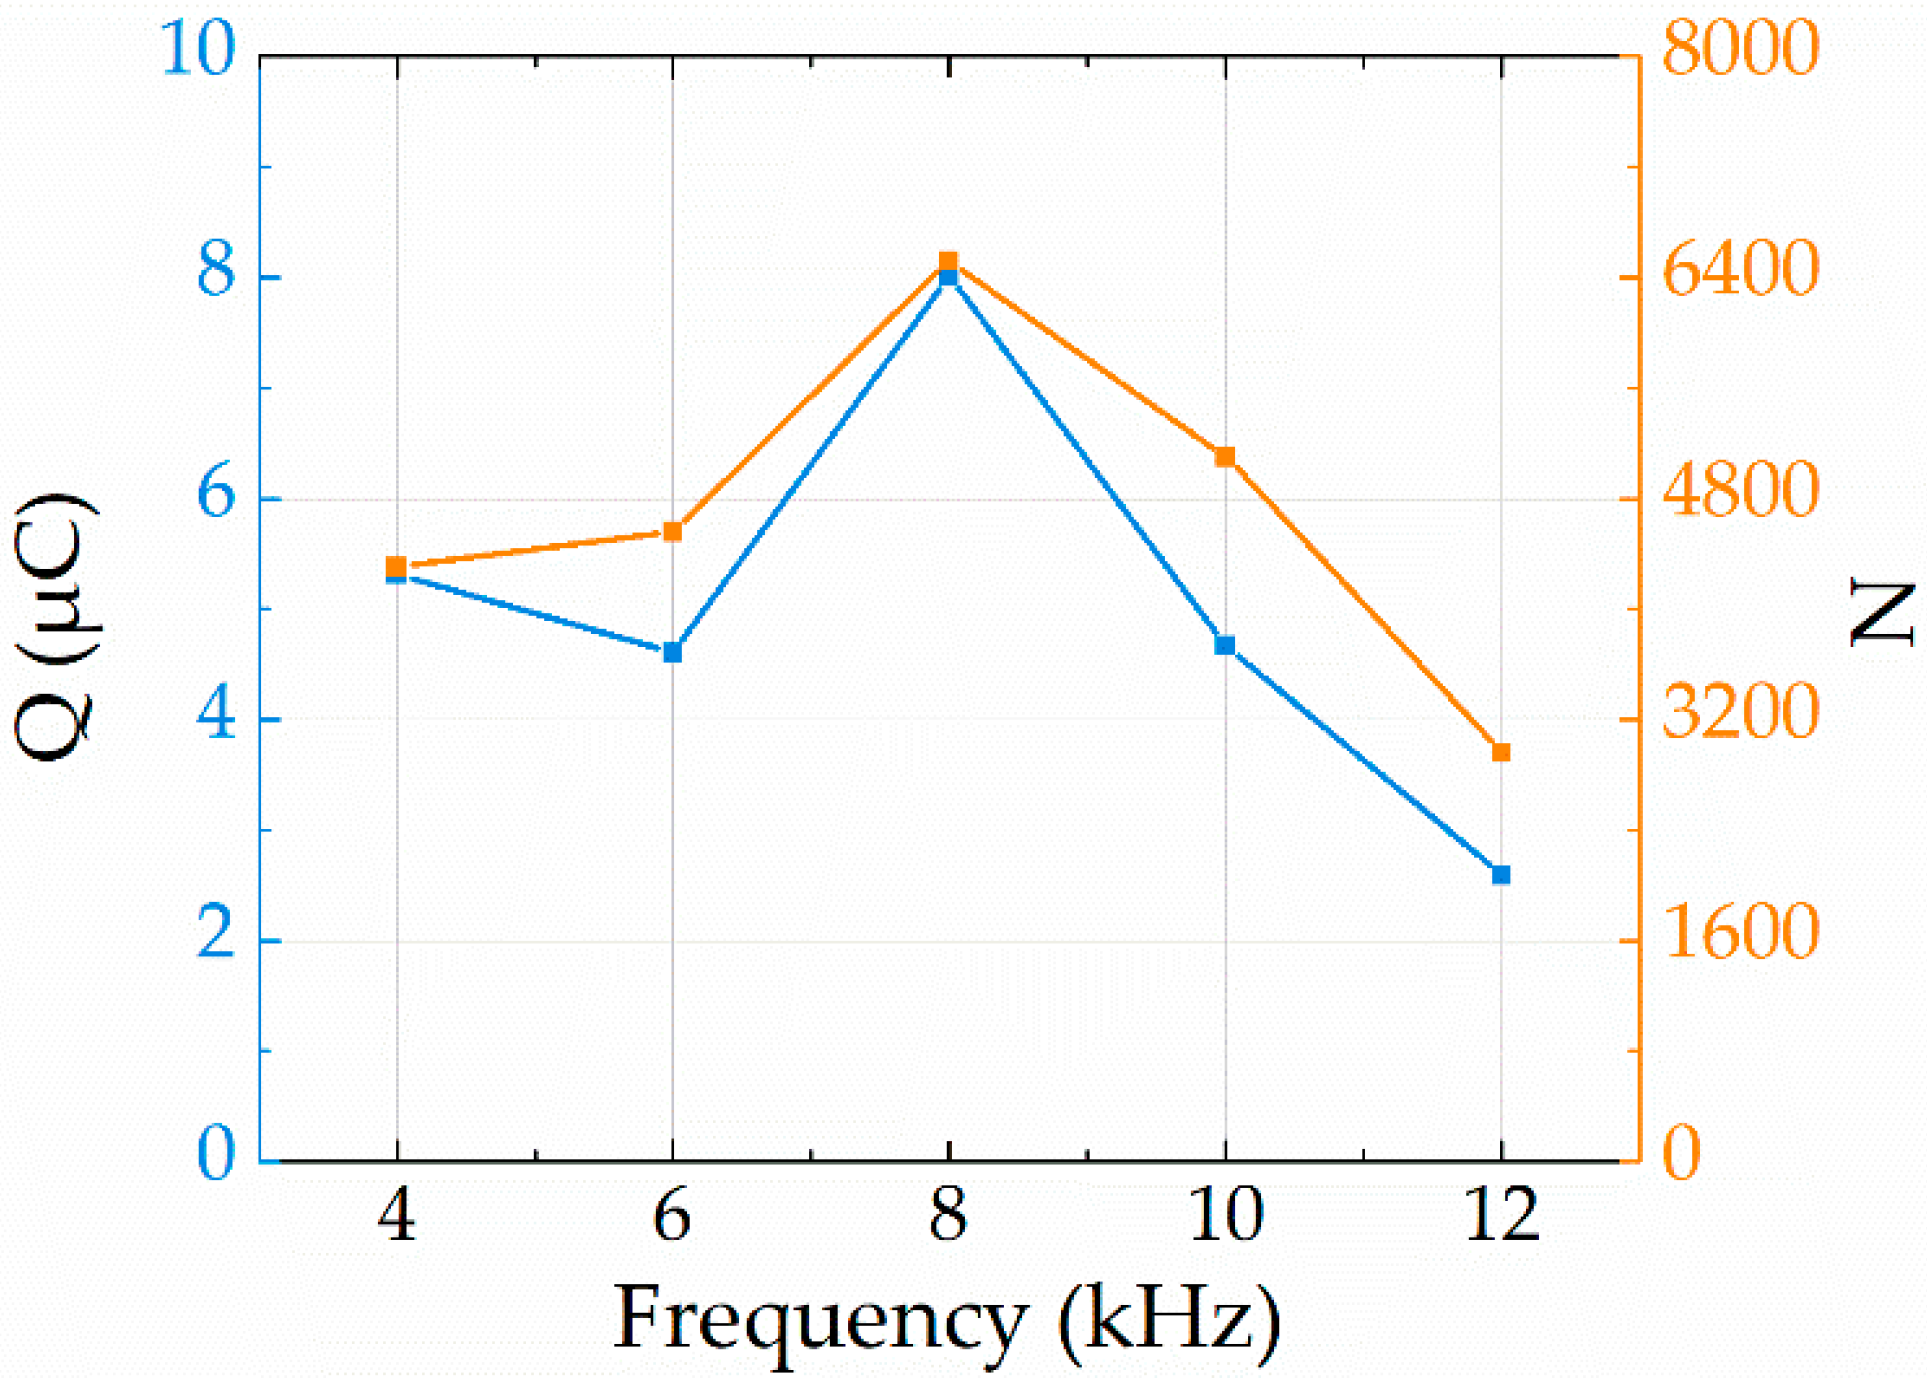
The average magnitude of each discharge (Qave) and N at two polarities of power were detected through statistics. The sum of PD magnitude in 100 periods was marked as Qall. The PD parameters are shown in Table 2.
According to Table 2, Qave and N values at two polarities of power were approximated at each frequency. The polarity of power had little effect on PD number and magnitude. N and Qall in 100 periods are shown in Figure 12.
The wave of PD numbers and magnitudes exist in an ascent stage at lower frequencies and tend to decline at higher frequencies, resulting in a frequency-induced inflection point.
4.3. Frequency-Dependant PD Number and Magnitude
PD number and magnitude are the main parameters describing PD. Therefore, an analysis on changing the PD number and magnitude is described in this part.
Space charge distribution directly determines the characteristics of the partial discharge. The frequency mainly affects PD by affecting the polarization degree and the diffusion process of the space charge. Under AC voltage, the movement of charged particles occurs in the air medium between the electrodes in the discharge model, causing the air to polarize. The degree of polarization can be represented by g [20]:
where is an equivalent parameter of space-charge polarization in air (fS/m); is the conductivity of air (fS/m) where at 25 °C, 110 kPa; is the relative dielectric constant (F/m) where at 25 °C, 110 kPa; is the applied electric field angular frequency.
g is a frequency-dependent parameter. It tends to increase because of the increase in frequency. A high g means a strengthened air polarization, intensifying the unevenness of the electric field. PD occurs easily when the electric field is non-uniform. Therefore, high frequency results in a high PD number and magnitude. However, because the polarization process of space charge takes a certain amount of time. Once the period at high frequency less than polarization time, the polarization effect of space charge no longer occupies the dominant position in affecting the partial discharge at an over-high frequency.
Discharge is a neutralization process of charged particles. When PD occurs, most of the charged particles are neutralized and release energy. A handful of charged particles are retained on insulated surfaces, called the retention effect [21]. Space charge diffuses along the cutoff surface under the action of an electric field between the electrodes. The dissipation process of space charges is described by Equation (5):
where is the number of space charge; is the discharge interval of PD (s); is the time between the occurrence of the power voltage amplitude larger than PDIV and the first discharge [22]:
where U is the amplitude of the source (V); Vvoi is the equivalent gas volume exposed to electric field (m3); Cd is the radiation ionization coefficient; Фd is the radiation quantum flux density (Wb); is the gas density (kg/m3); is the intensity of air pressure (Pa); is the value of PDIV (V). β is a positive constant.
The value of Cd × Фd is 2 × 10⁶ kg−1·s−1 in air and p = 110 kPa. The value of ρ/p is 10−5 kg·m−3·Pa−1 at 25 °C. is a monotonic decreasing function of . Frequency increase causes and increases according to Figure 8; thus, decreases. Therefore, increases with an increasing frequency. Meanwhile, a rapid change of voltage results in a decrease in . is a monotone decreasing function of over . gradually increases due to the decrease of and the increase of , meaning that space charges are intrinsically insulated. The polarity of the voltage changes after a half-cycle but space charge remains on the insulating surface, resulting in an electric field that is opposite to the power source and suppresses the partial discharge.
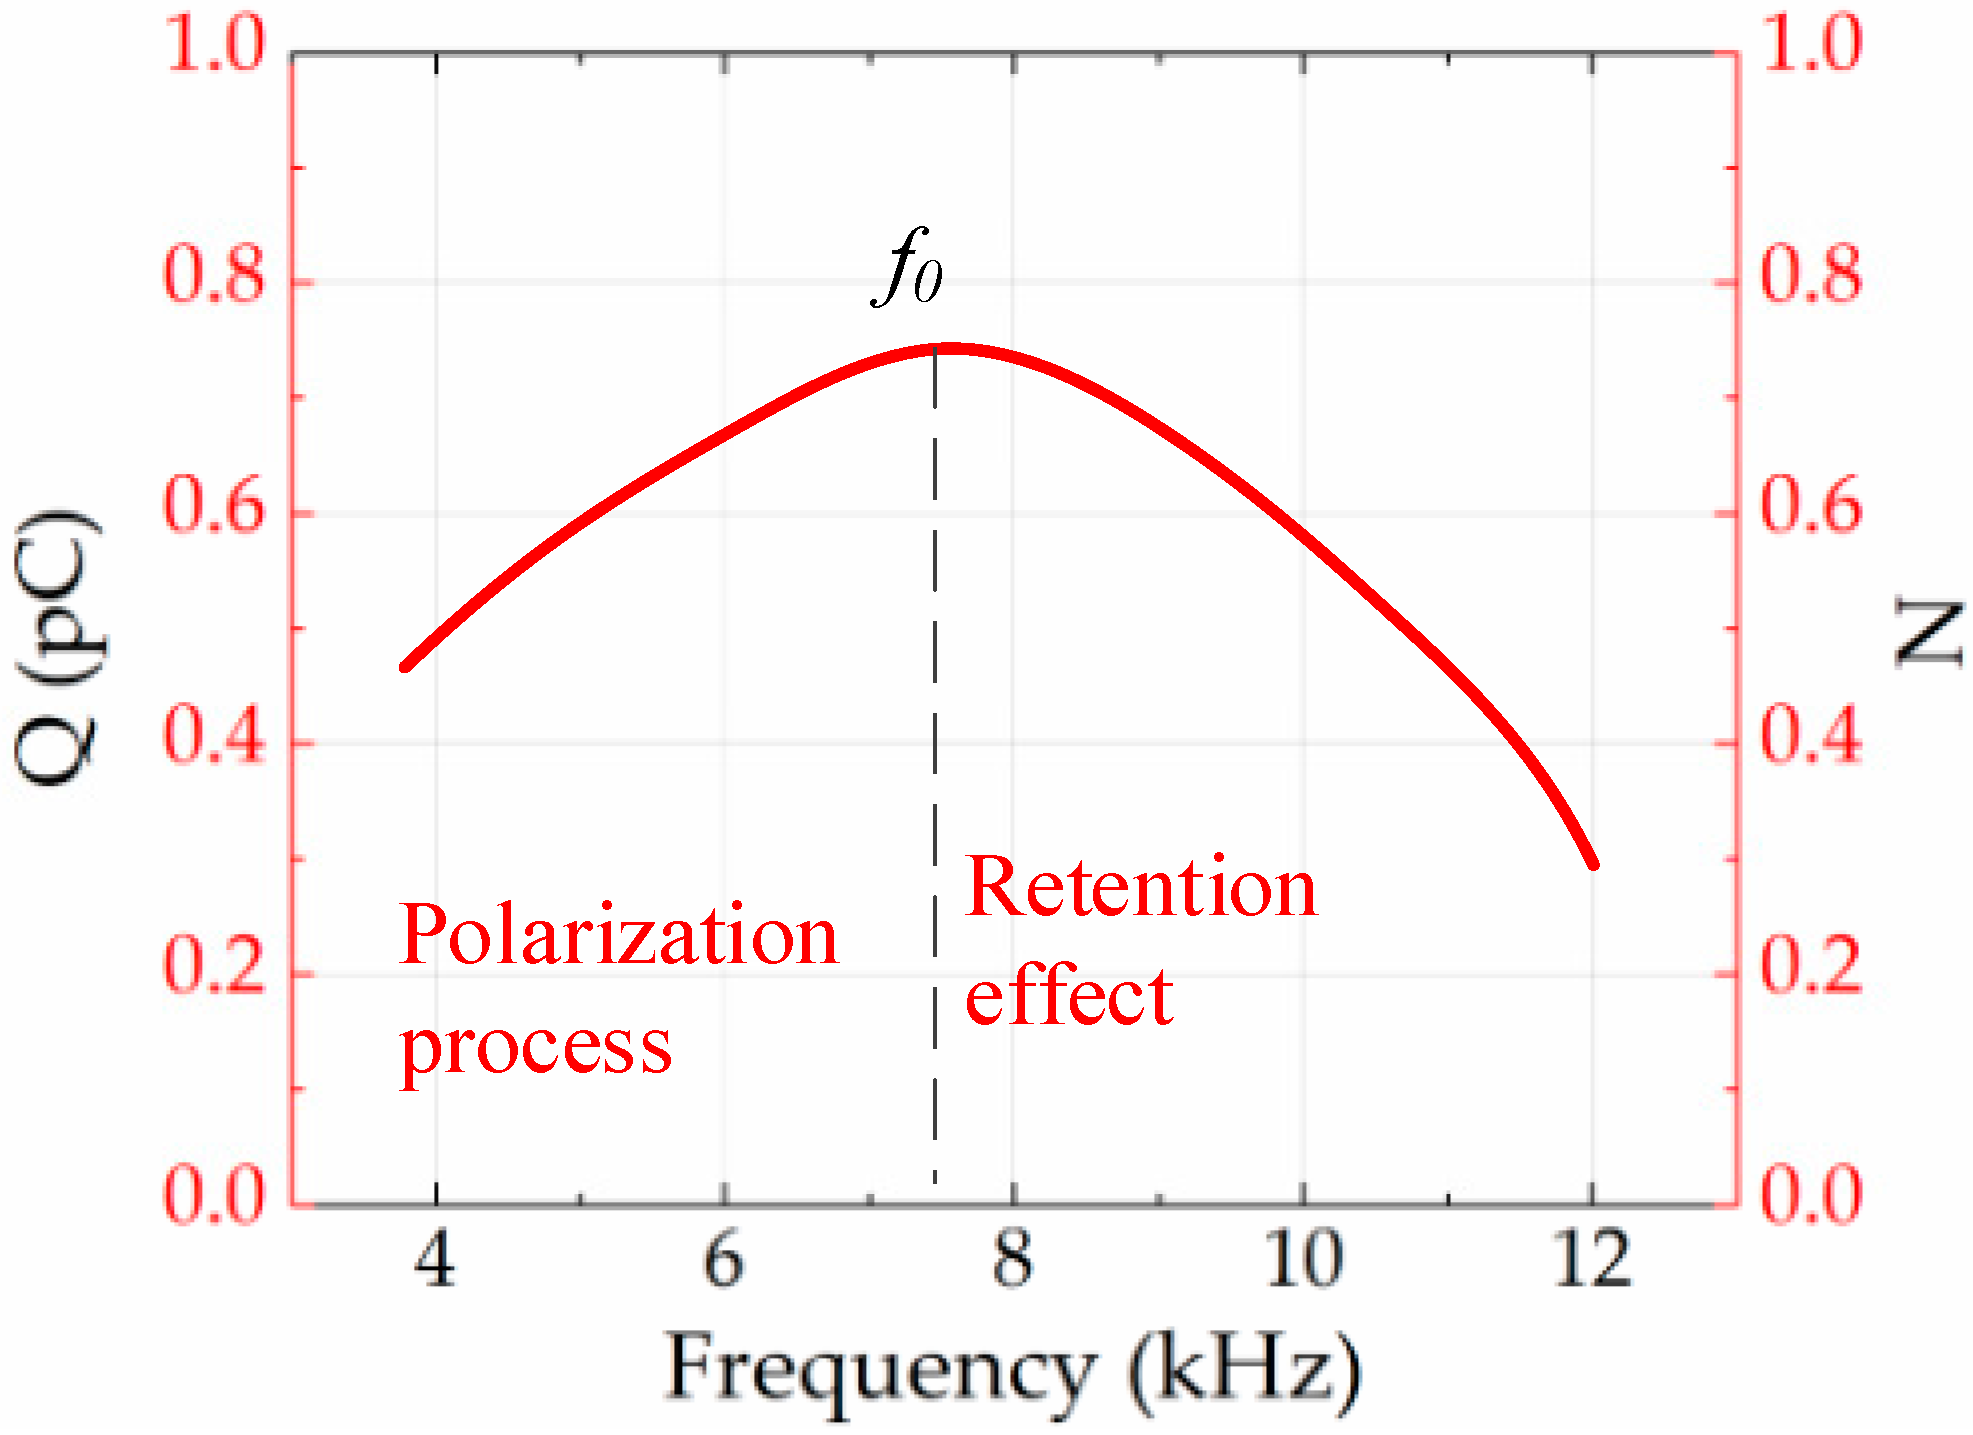
To sum up, as shown in Figure 13, a theoretical frequency (f0) exists. The impact of the polarization effect and retention effect on PD magnitude are approximately equivalent but opposite. Therefore, the maximum PD magnitude was reached at f0.
The theoretical results of frequency-dependent PD are consistent with the test results. When , the polarization process is greater than the retention effect, so that the number and magnitude of PD increase with an increase in frequency. When , the polarization process was not accomplished in the semi-period. Therefore, the retention effect caused only the PD number and magnitude to increase with increasing frequency.
5. Conclusions
In this manuscript, a broadband HFCT was used to detect partial discharges at different frequencies from 4 kHz to 12 kHz. EMD was used for denoising pulses. As a result, the SNR of the data was increased by 4 dB. After further statistical analysis, the phenomena of PD Q-Ф scatter plot and PD N-Ф spectrogram in phase, number, and magnitude were analyzed. The PD phase region was monotone, decreasing to a frequency range of 4 kHz to 12 kHz. The PD number and magnitude first increased and then decreased in the specific frequency range. Air medium polarization process and retention effect determined PD number (N) and magnitude (Q) at different frequency values. Finally, a frequency of 8 kHz was selected in this special case, being a suitable working frequency for detecting insulation defects with high precision of the acquisition of the PDIV values and obtaining the best amplification effect for insulation defects. Regarding the suspension PD model at various working frequencies, the PDIV value was lower and the PD magnitude and number were larger at the same voltage level. Thus, 8 kHz can be used to assess insulation status of HF transformers with the consideration of frequency-dependent effects.
Author Contributions
J.J. and M.Z. conceived and designed the experiments and algorithm; M.Z. performed the experiments; Z.C. and M.C. analyzed the data; H.L. and R.A. provided the insight and technical expertise to improve the quality of this paper; M.Z. and J.J. wrote the paper.
Funding
This research was funded in part by the Fundamental Research Funds for the Central Universities (NOs. XCA17003-04, NS2018027), Natural Science Foundation of Jiangsu Province (BK20170786), the State Key Laboratory of Alternate Electrical Power System with Renewable Energy Sources (Grant No. LAPS17012) and State Grid Zhejiang Electric Power Co. Ltd. (5211DS17001C).
Conflicts of Interest
The authors declare no conflict of interest.
References
- Hammarström, T.J.Å. Partial discharge characteristics within motor insulatioi exposed to multi-level PWM waveforms. IEEE Trans. Dielectr. Electr. Insul. 2018, 25, 559–567. [Google Scholar] [CrossRef]
- Contreras, J.P.; Ramirez, J.M. Multi-Fed Power Electronic Transformer for Use in Modern Distribution Systems. IEEE Trans. Smart Grid 2014, 5, 532–1541. [Google Scholar] [CrossRef]
- Briz, F.; Lopez, M.; Rodriguez, A.; Arias, M. Modular power electronic transformers: Modular multilevel converter versus cascaded H-bridge solutions. IEEE Ind. Electr. Mag. 2016, 10, 6–19. [Google Scholar] [CrossRef]
- Feng, J.; Chu, W.Q.; Zhang, Z.; Zhu, Z.Q. Power Electronic Transformer-Based Railway Traction Systems: Challenges and Opportunities. IEEE J. Emerg. Sel. Top. Power Electr. 2017, 5, 1237–1253. [Google Scholar] [CrossRef]
- Kenzelmann, S.; Rufer, A.; Dujic, D.; Canales, F.; Novaes, Y.R.D. Isolated DC/DC Structure Based on Modular Multilevel Converter. IEEE Trans. Power Electr. 2014, 30, 89–98. [Google Scholar] [CrossRef]
- Jalbrzykowski, S.; Citko, T. Current-Fed Resonant Full-Bridge Boost DC/AC/DC Converter. IEEE Trans. Industr. Electr. 2008, 55, 1198–1205. [Google Scholar] [CrossRef]
- Deng, L. Modeling and Analysis of Parasitic Capacitance of Secondary Winding in High-Frequency High-Voltage Transformer Using Finite-Element Method. IEEE Trans. Appl. Supercond. 2018, 28. [Google Scholar] [CrossRef]
- Liu, C.; Qi, L.; Cui, X.; Shen, Z.; Wei, X. Wideband Mechanism Model and Parameter Extracting for High-Power High-Voltage High-Frequency Transformers. IEEE Trans. Power Electr. 2015, 31, 3444–3455. [Google Scholar] [CrossRef]
- Lüth, T.; Merlin, M.M.C.; Green, T.C.; Hassan, F.; Barker, C.D. High-Frequency Operation of a DC/AC/DC System for HVDC Applications. IEEE Trans. Power Electr. 2014, 29, 4107–4115. [Google Scholar] [CrossRef] [Green Version]
- Negm, T.S.; Refaey, M.; Hossam-Eldin, A.A. Modeling and simulation of internal Partial Discharges in solid dielectrics under variable applied frequencies. In Proceedings of the 2016 Eighteenth International Middle East Power Systems Conference (MEPCON), Cairo, Egypt, 27–29 December 2016; pp. 639–644. [Google Scholar]
- Montanari, G.C.; Seri, P. The effect of inverter characteristics on partial discharge and life behavior of wire insulation. IEEE Electr. Insul. Mag. 2018, 34, 32–39. [Google Scholar] [CrossRef]
- Jiang, J.; Luo, D.; Yu, M.; Ma, G.; Li, C. Optical fiber-triggered solid-state switch applied in power cables damped AC voltages test system. IEEJ Trans. Electr. Electr. Eng. 2018, 13, 580–586. [Google Scholar] [CrossRef]
- Su, C.Q.; Li, C.R. Using very-low-frequency and oscillating-wave tests to improve the reliability of distribution cables. IEEE Electr. Insul. Mag. 2013, 29, 38–45. [Google Scholar] [CrossRef]
- Houtepen, R.; Chmura, L.; Smit, J.J.; Quak, B.; Seitz, P.P.; Gulski, E. Estimation of dielectric loss using damped AC voltages. IEEE Electr. Insul. Mag. 2011, 27, 20–25. [Google Scholar] [CrossRef]
- Florkowska, B.; Roehrich, J.; Zydroi, P.; Florkowski, M. Measurement and analysis of surface partial discharges at semi-square voltage waveforms. IEEE Trans. Dielectr. Electr. Insul. 2011, 18, 990–996. [Google Scholar] [CrossRef]
- Ye, H.F.; Qian, Y.; Dong, Y.; Sheng, G.H.; Jiang, X.C. Development of multi-band ultra-high-frequency sensor for partial discharge monitoring based on the meandering technique. IET Sci. Measurement Technol. 2014, 8, 327–335. [Google Scholar]
- Álvarez, F.; Garnacho, F.; Ortego, J.; Sánchez-Urán, M.Á. Application of HFCT and UHF sensors in on-line partial discharge measurements for insulation diagnosis of high voltage equipment. Sensors 2015, 15, 7360–7387. [Google Scholar] [CrossRef] [PubMed]
- Wu, M.; Cao, H.; Cao, J.; Nguyen, H.-L.; Gomes, J.B.; Krishnaswamy, S.P. An overview of state-of-the-art partial discharge analysis techniques for condition monitoring. IEEE Electr. Insul. Mag. 2015, 31, 22–35. [Google Scholar] [CrossRef]
- Upton, D. Wireless Sensor Network for Radiometric Detection and Assessment of Partial Discharge in High-Voltage Equipment. Radio Sci. 2018, 53, 357–364. [Google Scholar] [CrossRef] [Green Version]
- Zhang, C. Partial Discharge Monitoring on Metal-Enclosed Switchgear with Distributed Non-Contact Sensors. Sensors 2018, 18, 551. [Google Scholar] [CrossRef] [PubMed]
- International Standard IEC 60270. High Voltage Test Techniques—Partial Discharge Measurements, 3rd ed.; International Electrotechnical Commission: Geneva, Switzerland, 2000. [Google Scholar]
- Zhang, X.; Zhang, G.; Li, Y. On the Feasibility of Gap Detection of Power Transformer Partial Discharge UHF Signals: Gap Propagation Characteristics of Electromagnetic Waves. Energies 2017, 10, 1531. [Google Scholar] [CrossRef]
- Álvarez Gómez, F.; Albarracín-Sánchez, R.; Garnacho Vecino, F.; Granizo Arrabé, R. Diagnosis of Insulation Condition of MV Switchgears by Application of Different Partial Discharge Measuring Methods and Sensors. Sensors 2018, 18, 720. [Google Scholar]
- Hu, X.; Siew, W.H.; Judd, M.D.; Peng, X. Transfer function characterization for HFCTs used in partial discharge detection. IEEE Trans. Dielec. Electr. Insul. 2017, 24, 1088–1096. [Google Scholar] [CrossRef]
- Li, S.; Gao, G.; Hu, G. Influences of Traction Load Shock on Artificial Partial Discharge Faults within Traction Transformer—Experimental Test for Pattern Recognition. Energies 2017, 10, 1556. [Google Scholar]
- Bahmani, M.; Vechalapu, A.; Mobarrez, K.M. Flexible HF distribution transformers for inter-connection between MVAC and LVDC connected to DC microgrids: Main challenges. In Proceedings of the 2017 IEEE Second International Conference on DC Microgrids (ICDCM), Nuremburg, Germany, 27–29 June 2017; pp. 53–60. [Google Scholar]
- Albarracín, R.; Robles, G.; Ardila-Rey, J.A.; Cavallini, A.; Passaglia, R. Partial discharges: Keys for condition monitoring and diagnosis of power transformers. Power Transformer Condition Monitoring and Diagnosis. Inst. Eng. Tech. 2018, 2, 39–85. [Google Scholar]
- Godina, R.; Rodrigues, E.; Matias, J. Effect of Loads and Other Key Factors on Oil-Transformer Ageing: Sustainability Benefits and Challenges. Energies 2015, 8, 12147–12188. [Google Scholar] [CrossRef]
- Yang, Q.; Su, P.; Chen, Y. Comparison of Impulse Wave and Sweep Frequency Response Analysis Methods for Diagnosis of Transformer Winding Faults. Energies 2017, 10, 431. [Google Scholar] [CrossRef]
Figure 1.
2-D schematic diagram of a typical high-frequency (HF) transformer.

Figure 2.
Partial discharge test platform for a high-frequency transformer.

Figure 3.
Output characteristic of an iHFCT-54 sensor.

Figure 4.
Typical partial discharge (PD) current and voltage signal under f = 4 kHz and Up-p = 20 kV.
Figure 4.
Typical partial discharge (PD) current and voltage signal under f = 4 kHz and Up-p = 20 kV.

Figure 5.
Process diagram of empirical mode decomposition processing signals.

Figure 6.
Original signal and denoise signal of HFCT.

Figure 7.
The response of the high-frequency current transformer (HFCT) at a PD magnitude of 20 pC.

Figure 8.
Partial discharge inception voltage at different frequencies.

Figure 9.
Typical PD plots at f = 6 kHz.

Figure 10.
PD l Q-Ф Scatter Plot at different frequencies


Figure 11.
PD N-Ф Spectrogram at different frequencies.


Figure 12.
PD number and magnitude at different frequencies in test.

Figure 13.
Theoretical analysis of PD number and magnitude at different frequencies.


Table 1.
The partial discharge (PD) phase region and displacement phase center at different frequencies.
Table 1.
The partial discharge (PD) phase region and displacement phase center at different frequencies.
| Frequency | Positive | Negative | ||
|---|---|---|---|---|
| Phase Region (°) | Phase Center (°) | Phase Region (°) | Phase Center (°) | |
| 4 kHz | (30, 150) | 60 | (200, 340) | 230 |
| 6 kHz | (30, 150) | 55 | (200, 330) | 220 |
| 8 kHz | (50, 150) | 75 | (200, 340) | 250 |
| 10 kHz | (50, 150) | 80 | (200, 300) | 230 |
| 12 kHz | (60, 150) | 110 | (200, 280) | 230 |
Table 2.
Partial discharge characteristic parameters.
| Polarity | Frequency | 4 kHz | 6 kHz | 8 kHz | 10 kHz | 12 kHz |
|---|---|---|---|---|---|---|
| Positive | N | 2042 | 1924 | 3703 | 2839 | 1717 |
| Qave (pC) | 1235 | 1019 | 1216 | 914 | 867 | |
| Negative | N | 2261 | 2634 | 3450 | 2262 | 1241 |
| Qave (pC) | 1235 | 1006 | 1241 | 917 | 886 | |
| Positive and Negative | N | 4303 | 4559 | 6523 | 5101 | 2958 |
| Qall (μC) | 5.3 | 4.6 | 8.0 | 4.7 | 2.6 |
© 2018 by the authors. Licensee MDPI, Basel, Switzerland. This article is an open access article distributed under the terms and conditions of the Creative Commons Attribution (CC BY) license (http://creativecommons.org/licenses/by/4.0/).
Share and Cite
MDPI and ACS Style
Jiang, J.; Zhao, M.; Zhang, C.; Chen, M.; Liu, H.; Albarracín, R. Partial Discharge Analysis in High-Frequency Transformer Based on High-Frequency Current Transducer. Energies 2018, 11, 1997. https://doi.org/10.3390/en11081997
AMA Style
Jiang J, Zhao M, Zhang C, Chen M, Liu H, Albarracín R. Partial Discharge Analysis in High-Frequency Transformer Based on High-Frequency Current Transducer. Energies. 2018; 11(8):1997. https://doi.org/10.3390/en11081997
Chicago/Turabian StyleJiang, Jun, Mingxin Zhao, Chaohai Zhang, Min Chen, Haojun Liu, and Ricardo Albarracín. 2018. "Partial Discharge Analysis in High-Frequency Transformer Based on High-Frequency Current Transducer" Energies 11, no. 8: 1997. https://doi.org/10.3390/en11081997
Note that from the first issue of 2016, this journal uses article numbers instead of page numbers. See further details here.