Distributed Energy Resources Scheduling and Aggregation in the Context of Demand Response Programs


1
GECAD—Research Group on Intelligent Engineering and Computing for Advanced Innovation and Development, 4200-072 Porto, Portugal
2
IPP—Polytechnic Institute of Porto, Rua DR. Antonio Bernardino de Almeida, 431, 4200-072 Porto, Portugal
*
Author to whom correspondence should be addressed.
Energies 2018, 11(8), 1987; https://doi.org/10.3390/en11081987
Submission received: 10 May 2018
/
Revised: 26 July 2018
/
Accepted: 30 July 2018
/
Published: 31 July 2018
(This article belongs to the Special Issue Distributed Energy Resources Management 2018)
Abstract
:Distributed energy resources can contribute to an improved operation of power systems, improving economic and technical efficiency. However, aggregation of resources is needed to make these resources profitable. The present paper proposes a methodology for distributed resources management by a Virtual Power Player (VPP), addressing the resources scheduling, aggregation and remuneration based on the aggregation made. The aggregation is made using K-means algorithm. The innovative aspect motivating the present paper relies on the remuneration definition considering multiple scenarios of operation, by performing a multi-observation clustering. Resources aggregation and remuneration profiles are obtained for 2592 operation scenarios, considering 548 distributed generators, 20,310 consumers, and 10 suppliers.
1. Introduction
The end-consumer’s demand reduction or shed, due to technical or economic issues, in response to price signals or incentives, is commonly defined as Demand Response (DR) [1]. Price signals can be given using Real-Time pricing (RTP) programs, as in [2]. DR resources can be used together with Distributed Generation (DG) successfully, at distribution network levels, in order to contribute to the implementation of the Smart Grid (SG) [3,4]. The high potential of DR is discussed in [5,6,7] for different countries and implementation scenarios, and DG in [8,9].
Despite recent efforts and actual achievements concerning the implement of DR in small-size resources, many DR programs are focused on large-size resources [10]. The full integration of DR programs in the energy markets should be performed using the aggregation of small-size consumers and producers that are usually connected to distribution networks [11]. It is therefore needed to find the most appropriate way to aggregate and remunerate such small-size resources for their participation in electricity markets.
The aggregation of distributed resources can be done under several approaches, which can consider the economic models and entities that perform the aggregation [12,13]. For the specific case of DR resources aggregation [14], one can find the Curtailment Service Provider (CSP), which acts in several current DR implementations [15]. With a wider resource types integration, one can refer to a Virtual Power Player (VPP). A VPP is an entity responsible for the small-size resources management at the level of distribution networks. It performs the resources scheduling, in order to provide the required means to supply the demand and to enable the participation in the electricity markets. It is also responsible for the remuneration of the DG and DR resources [16].
Given the importance of the resources aggregation, adequate methods and tools should be used. Since the aggregation will define the groups of resources and result in the remuneration for each single resource, such task is very critical in the way that it will represent an incentive for the consumers and producers in order to actively participate in the optimal management of the VPP area. Clustering algorithms are used to ensure that the groups are formed considering common characteristics or patterns.
The clustering algorithms can be classified into several types, as hierarchical, partition, fuzzy and many others [17]. The one used in this paper is K-means, a partition clustering algorithm. At each iteration, the algorithm computes the distance between objects (based on each observation-value of objects for a given situation) and the center of each of the groups. The objects change amongst groups based upon the calculated distance, i.e. an object is assigned to a group if the distance to it is the lowest when comparing to all other groups [18,19].
The remuneration of the resources is usually done equally for the resources of the same type [20]. It can be performed individually as shown in [21], in which the payment would be proportional to each individual contribution. In [22], the author proposes a unit commitment mechanism to reduce the cost of using wind generation considering the load and spinning reserve implemented at a certain time in the network. The aggregation and remuneration of the resources is, in most situations, largely related to the resources scheduling, namely in the VPP operation context.
In [23], an evolutionary algorithm is used to perform the scheduling and to obtain the Pareto-front optimal solutions. Reference [24] discusses the resources scheduling and aggregation. In [25], several DR programs are presented, as well as onsite generation (OG) and energy storage (ES). The authors refer to the aggregator as an entity able to aggregate the consumers’ reduction capacity and make them profitable, using OG and ES for load balance. These works discuss and comment on results about resources scheduling, aggregation and remuneration, without extensive analyses and proposal of remuneration methodologies for small-size energy resources. Some of the authors in the present paper showed preliminary results in distributed resources management considering their scheduling, aggregation and remuneration [26]. However, many aspects are detailed and explored further in the present paper, explained detailed in Section 2.
The present paper proposes a methodology to support the VPP, performing the resource’s schedule (optimization algorithms), aggregation (using K-means), and remuneration. After the scheduling, the aggregation and remuneration of distributed resources is made considering K-means algorithm and maximum price per group—all the resources in a given group are paid considering the same tariff, namely, the maximum value of all the resources belonging to the same group, respectively.
Previous research in this field addresses the problem by analyzing distinct operation scenarios one by one; the methodology proposed in this paper advances in considering the whole set of operation scenarios at the same time. Additionally, it combines incentive-based and price-based demand response programs. The proposed methodology is flexible enough in order to be used by several types of aggregators, whether they do or do not have both the consumption and generation resources.
The K-means algorithm allows the consideration of several operation scenarios, determining the groups to be formed on a schedule shape basis. The maximum price per group allows a fair remuneration to less-efficient resources, at the same time that incentives for the ones that are efficient to continue participating.
After this introductory section, Section 2 explains the proposed methodology, including a detailed explanation of its contributions. Then, Section 3 presents the resource scheduling formulation. The case study is presented in Section 4, and Section 5 includes the obtained results. Finally, Section 6 presents the main conclusions of the work.
2. Proposed Methodology
The proposed methodology aims to support the Virtual Power Player (VPP), in optimally scheduling, aggregating and remunerating the resources. The VPP is considered to be an external independent entity and thus, with no interference in technical aspects of the network where it acts. Moreover, it is assumed that the resources are in a contract with this entity, and therefore must respond to DR events when so requested.
2.1. VPP Approach
The VPP is able to optimally use generation and demand response according to distinct types, such as external suppliers, Distributed Generation (DG), Demand Response incentive-based programs (Incentive Demand Response (IDR))—in which the consumers are remunerated proportionally to their contribution in reducing load; and Demand Response price-based programs (Real-Time Pricing (RTP))—in which the consumers are modelled by their elasticity, making changes to their load in response to price signals. The final objective is to support the VPP in the definition of tariffs for DR and DG resources.
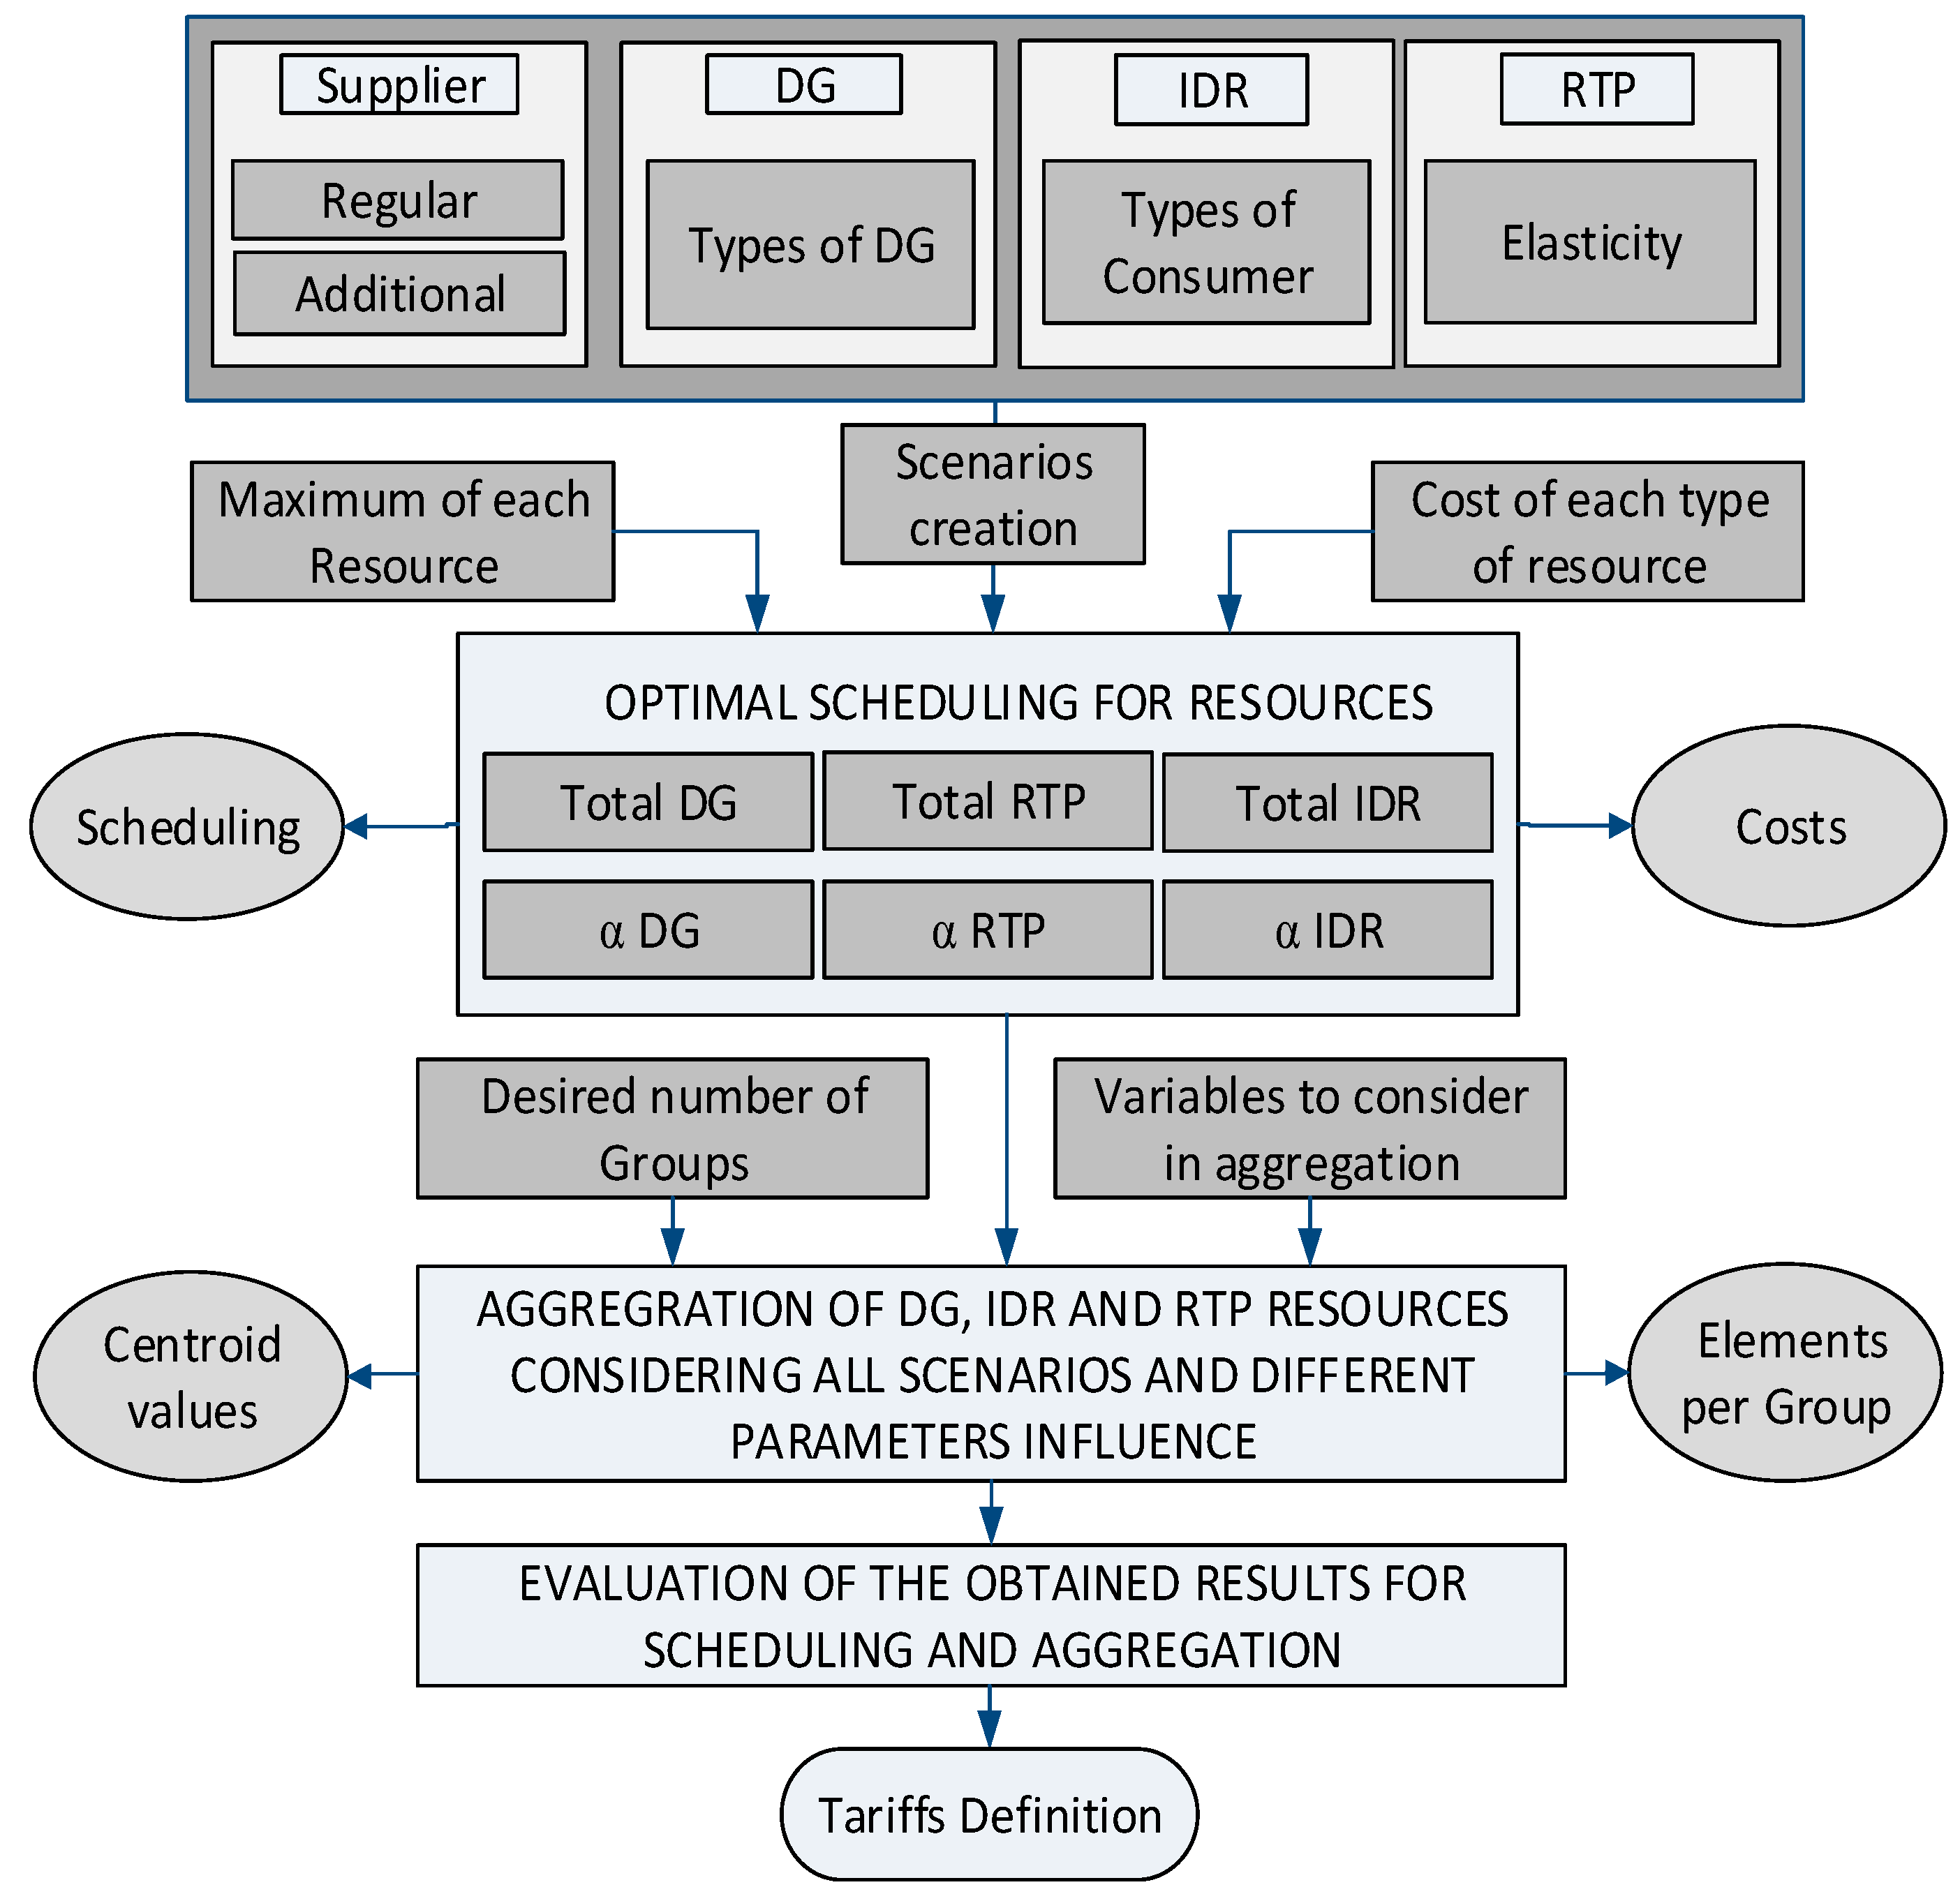
The methodology comprehends four different phases, according to Figure 1: input data definition, scheduling, aggregation and remuneration tariffs definition. The four phases run independently and subsequently.
In the first phase, a set of data is provided as input to the optimization block which runs the second phase. The data includes all of the resources characteristics, including the maximum capacity for DG units, and for the suppliers, and the reduction capacity for the consumers. Also, prices for each resource and loads elasticity are provided.
The methodology is able to cope with the different time scales of the resources operation. For example, if we are dealing with a scenario of 5 min, where the data is available for each second, it is calculated the average values for each period of 5 min. If the available data belongs to 15 min, the same value has been considered for all 3 of the five-minute periods.
In the second phase, the optimal scheduling of resources is performed for each scenario. The scenarios with unfeasible solution in the optimization are discarded so it is not provided to the aggregation phase. The scheduling is performed using MATLAB (2014A, MathWorks, Natick, MA, USA). Also in this phase, several parameters are diversified with the purpose of creating distinct operation scenarios. Those parameters are: regular supplier and distributed generators cost, the maximum reduction allowed for IDR and RTP consumers programs, the total initial load and, finally, the DG, IDR and RTP reduction contributions. As it will be detailed in Section 3, in Equations (15)–(17), it is possible for the VPP to choose an amount of energy obtained from each type of resource, relative to the total scheduling obtained. The scheduling is discussed and analyzed in particular in Section 5.
2.2. Aggregation of Resources
After the scheduling, the aggregation of the resources is performed (third phase) using a partition clustering algorithm; K-means algorithm. This algorithm allows us to define an entry matrix that contains the variables (objects) as rows and different scenarios (values) on the columns enabling the clustering considering all of the scenarios. This allows a better standardized group formation and not concentrated as hierarchical clustering algorithms. The algorithm has as outputs the centroid values of each group and also the group identification for each resource. The centroid value represents the point in the group for which the distance to the rest of the elements in that group is minimum. As for the distance minimization function, several can be considered. In this case, the one used is the squared Euclidean distance, modeled as in Equation (1) [27]
where x is the sample point and c, the centroid value.
The aggregation is made separately for each type of resource (DG, IDR and RTP), and considers all of the implemented scenarios. The aggregation using K-means allows for considering several observations of the variables. In this way, each scenario is considered as an observation of the variables related to each resource.
The resources are clustered according to all scenarios, being obtained the centroid profile, which is the representative profile of all the resources in a group. This centroid profile contains the centroid single values for each scenario. In this phase, the K parameter is part of K-means algorithm in order to set the number of tariff or remuneration groups that will be assigned to the consumers or producers. It is possible to define different K ranges. K = 1 means that all the resources will be in one group, so we start with K = 2. For the highest K, we have the reference of the number of consumer types. The maximum K is limited in the sense that it is not possible in practice to implement a large number of tariffs. In the limit, we could have one tariff for each single consumer/producer. The K parameter has no influence on the scheduling, since it is made a priori.
2.3. Remuneration
After the aggregation, the remuneration process is addressed using the maximum price inside each group-fourth phase. The remuneration is obtained considering the highest energy price in each group and applying it to all the resources in that group. The consumers and producers with lower initial prices will be remunerated at a higher price after the computation of the proposed methodology since the highest price within a group will be applied to all the resources inside the group.
2.4. Tariffs Comparison
With the results obtained as described in the previous sub-sections, it is possible for the VPP to compare the costs for each number of defined clusters, and the costs with the payment by type of resource. The payment by type can have two distinct approaches which will be compared with the payment for each group in different numbers of defined clusters. In the first one, considering the initial price that corresponds to the price established for all the resources of such type, each resource will be paid for the scheduled power, assuming that this schedule will be respected. This approach can somehow be not so realistic in some scenarios, in the sense that all the resources of the same tariff should be scheduled without discrimination. In the second approach, all the resources of the same type will be paid at the maximum capacity available, as it is made for the resources in different clusters.
The present methodology aims at minimizing operation costs, at optimally scheduling resources, and at defining aggregation and remuneration.
The innovative aspects of the proposed methodology, when comparing to the previous works, including in [26], are related with: the consideration of several distinct scheduling scenarios; inclusion of a mathematical formulation that considers the DR programs possibilities; exhaustive discussion regarding the use of clustering algorithms on resource’s aggregation; and finally, the proposal of remuneration models that consider the aggregation of resources according to their use in multiple scenarios. In this way, it is possible to provide the VPP with optimal and practicable solutions to the management of distributed resources, addressing their remuneration. The authors have published work related to the present paper in [27,28,29]. In [27], it is shown a similar work of this paper; however, the focus of the present paper is given to the consideration of multi-parameters in the clustering process, made possible by the use of K-means algorithm instead of the hierarchical clustering. This allows the analysis of the evolution of the group’s centroid across the different scenarios evaluated.
3. Scheduling Formulation
In this section, the resources scheduling is presented.
The objective function of the optimization model is as presented in Equation (2), which targets the minimization of operation costs for the VPP. The optimal scheduling of generation and demand response programs use is obtained. In the implemented objective function, multiple distributed energy resources, as distributed generators and consumers are considered. The connection between the network managed by the VPP and other systems is implemented by considering external suppliers, which can also be useful for the management of the VPP’s network balance. It is important to stress that the external suppliers are divided into regular and additional ones, so the most expensive ones are only activated when really needed. According to the price elasticity of demand, the price signal to be given to each consumer and the expected consumption reduction are obtained.
The resources are scheduled for each scenario context, concerning the restrictions modeled by Equations (3)–(17). DR programs are divided into IDR and RTP programs.
The optimization problem class is quadratic programming, due to the variable multiplication in the objective function, referring to the use of real-time pricing demand response initiatives.
The balance equation is presented in Equation (3). In this equation, the balance between production and demand must be accomplished, i.e., the initial consumption deducted from the reduction verified by IDR and RTP consumers must be equal to the production sum of the DG with suppliers. The equation also includes the non-supplied power (NSP), which refers to the amount of lost load in case the generation is not sufficient to supply the demand.
Equations (4)–(7) are related to the technical limitations of the external suppliers regarding their generation output. Equations (4) and (6) consider the individual limitation of each external supplier, while Equation (5) and (7) limit the total amount bought from external suppliers, for regular and additional type suppliers.
In a similar way to the previous Equations (4)–(7), for distributed generators the same energy limitations are applied considering the generator’s output, whether in individual by Equation (8) or total by Equation (9).
Concerning the participation of consumers in DR events, the constraints modelled are: maximum consumption reduction for each consumer in IDR program, Equation (10); the maximum consumption reduction of the sum between IDR and RTP programs, Equation (11); the maximum cost increase in RTP programs, Equation (12); maximum consumption reduction for each consumer in RTP programs, Equation (13); consumer’s elasticity considering scheduled power and price, especially important in RTP programs, Equation (14) [30]. In the RTP demand response program, the consumer reacts to a given rise in the energy price, with a consumption reduction. This rise in the energy price and consumption reduction of the consumer is limited by Equations (12) and (13), respectively, ensuring that the differences between initial and final energy price/consumption are within a given range of values. This reaction feature of the consumer to changes in the energy price is defined as elasticity, and is modelled by Equation (14). It considers that the consumer has a given elasticity value that represents the responsive capacity of the consumer’s current operation condition to price changes.
In Equations (15)–(17), a usage limitation constraint is implemented to enable control over the contribution of distributed generation and demand response programs. This provides the VPP with an additional tool to manage the resources, considering its operation context and/or other constraints. These three α parameters take values between 0 and 1. These parameters are modelled as presented in Equations (15)—DG, (16)—IDR, and (17)—RTP. In this way, as an example, for αDG equal to 0.6, it will result in a contribution of DG resources to supply the demand in that specific scenario lower or equal to 60%.
4. Case Study
The proposed methodology is applied to a case study concerning a real 30 kV distribution network, supplied by a high-voltage substation (60/30 kV) with 90 MVA of maximum power capacity. There are 937 buses, 20,310 consumers, and 548 distributed generators of several types. The consumers are classified into five distinct types: Domestic (DM), Small Commerce (SC), Medium Commerce (MC), Large Commerce (LC) and Industrial (ID). The data concerning consumers have been obtained by measurements, while for the DG units it has been specified according to DG implementation studies [31].
The data concerning each of the resources included in this case study initially had different time scales. In order to address this issue, for the data given for each second, the average values for each period of 5 minutes have been calculated. For the data given for each 15 min, the same value has been considered for all 3 of the five-minute periods.
The total power demand for the considered network, without any parameters variation, is 62,630 kW. On the side of distributed generation, the resources are classified into seven different types: Wind, Photovoltaic (PV), Co-generation (Combined Heat and Power (CHP)), Biomass, Waste-to-energy (Municipal Solid Waste (MSW)), Fuel cell and Small Hydro.
The VPP is responsible for specifying the important characteristics of each resource, in order to obtain proper schedule, aggregation and remuneration scenarios. Due to space limitations, in the present paper, only limited information is presented; further details can be found in [31].
Several scenarios based on the variation of the parameters of both producers and consumers have been defined according to [27]. However, the choice of these parameters reflects the outcoming results, making this procedure very important. The parameter variation must consider reliable and feasible scenarios, thus its values when assigned need to be coherent with the resources characteristics and scenario conditions.
The way that parameters are combined in order to build the 2592 scenarios is explained in Table 1. In the last column of this table, the set of parameters values is presented for the selected scenario, which affect the scheduling.
The input parameters are the regular supplier and distributed generators cost, the maximum reduction allowed for IDR and RTP consumers programs, the total initial load and, finally, the alpha parameters described before.
The result matrix, obtained from the scheduling optimization, consists of 21,515 lines (variables) per 2592 columns (scenarios); therefore, considerable computational means are required to handle this amount of data.
5. Results
In this section, the results obtained from the optimization, aggregation and remuneration are presented for a selected scenario in Table 1, last column. Section 5.1 presents an extensive analysis of the selected scenario defined by the parameters, showing the main contributions of each type of resource and technology. Section 5.2 concerns the aggregation of resources.
5.1. Selected Scenario—Resource Schedule
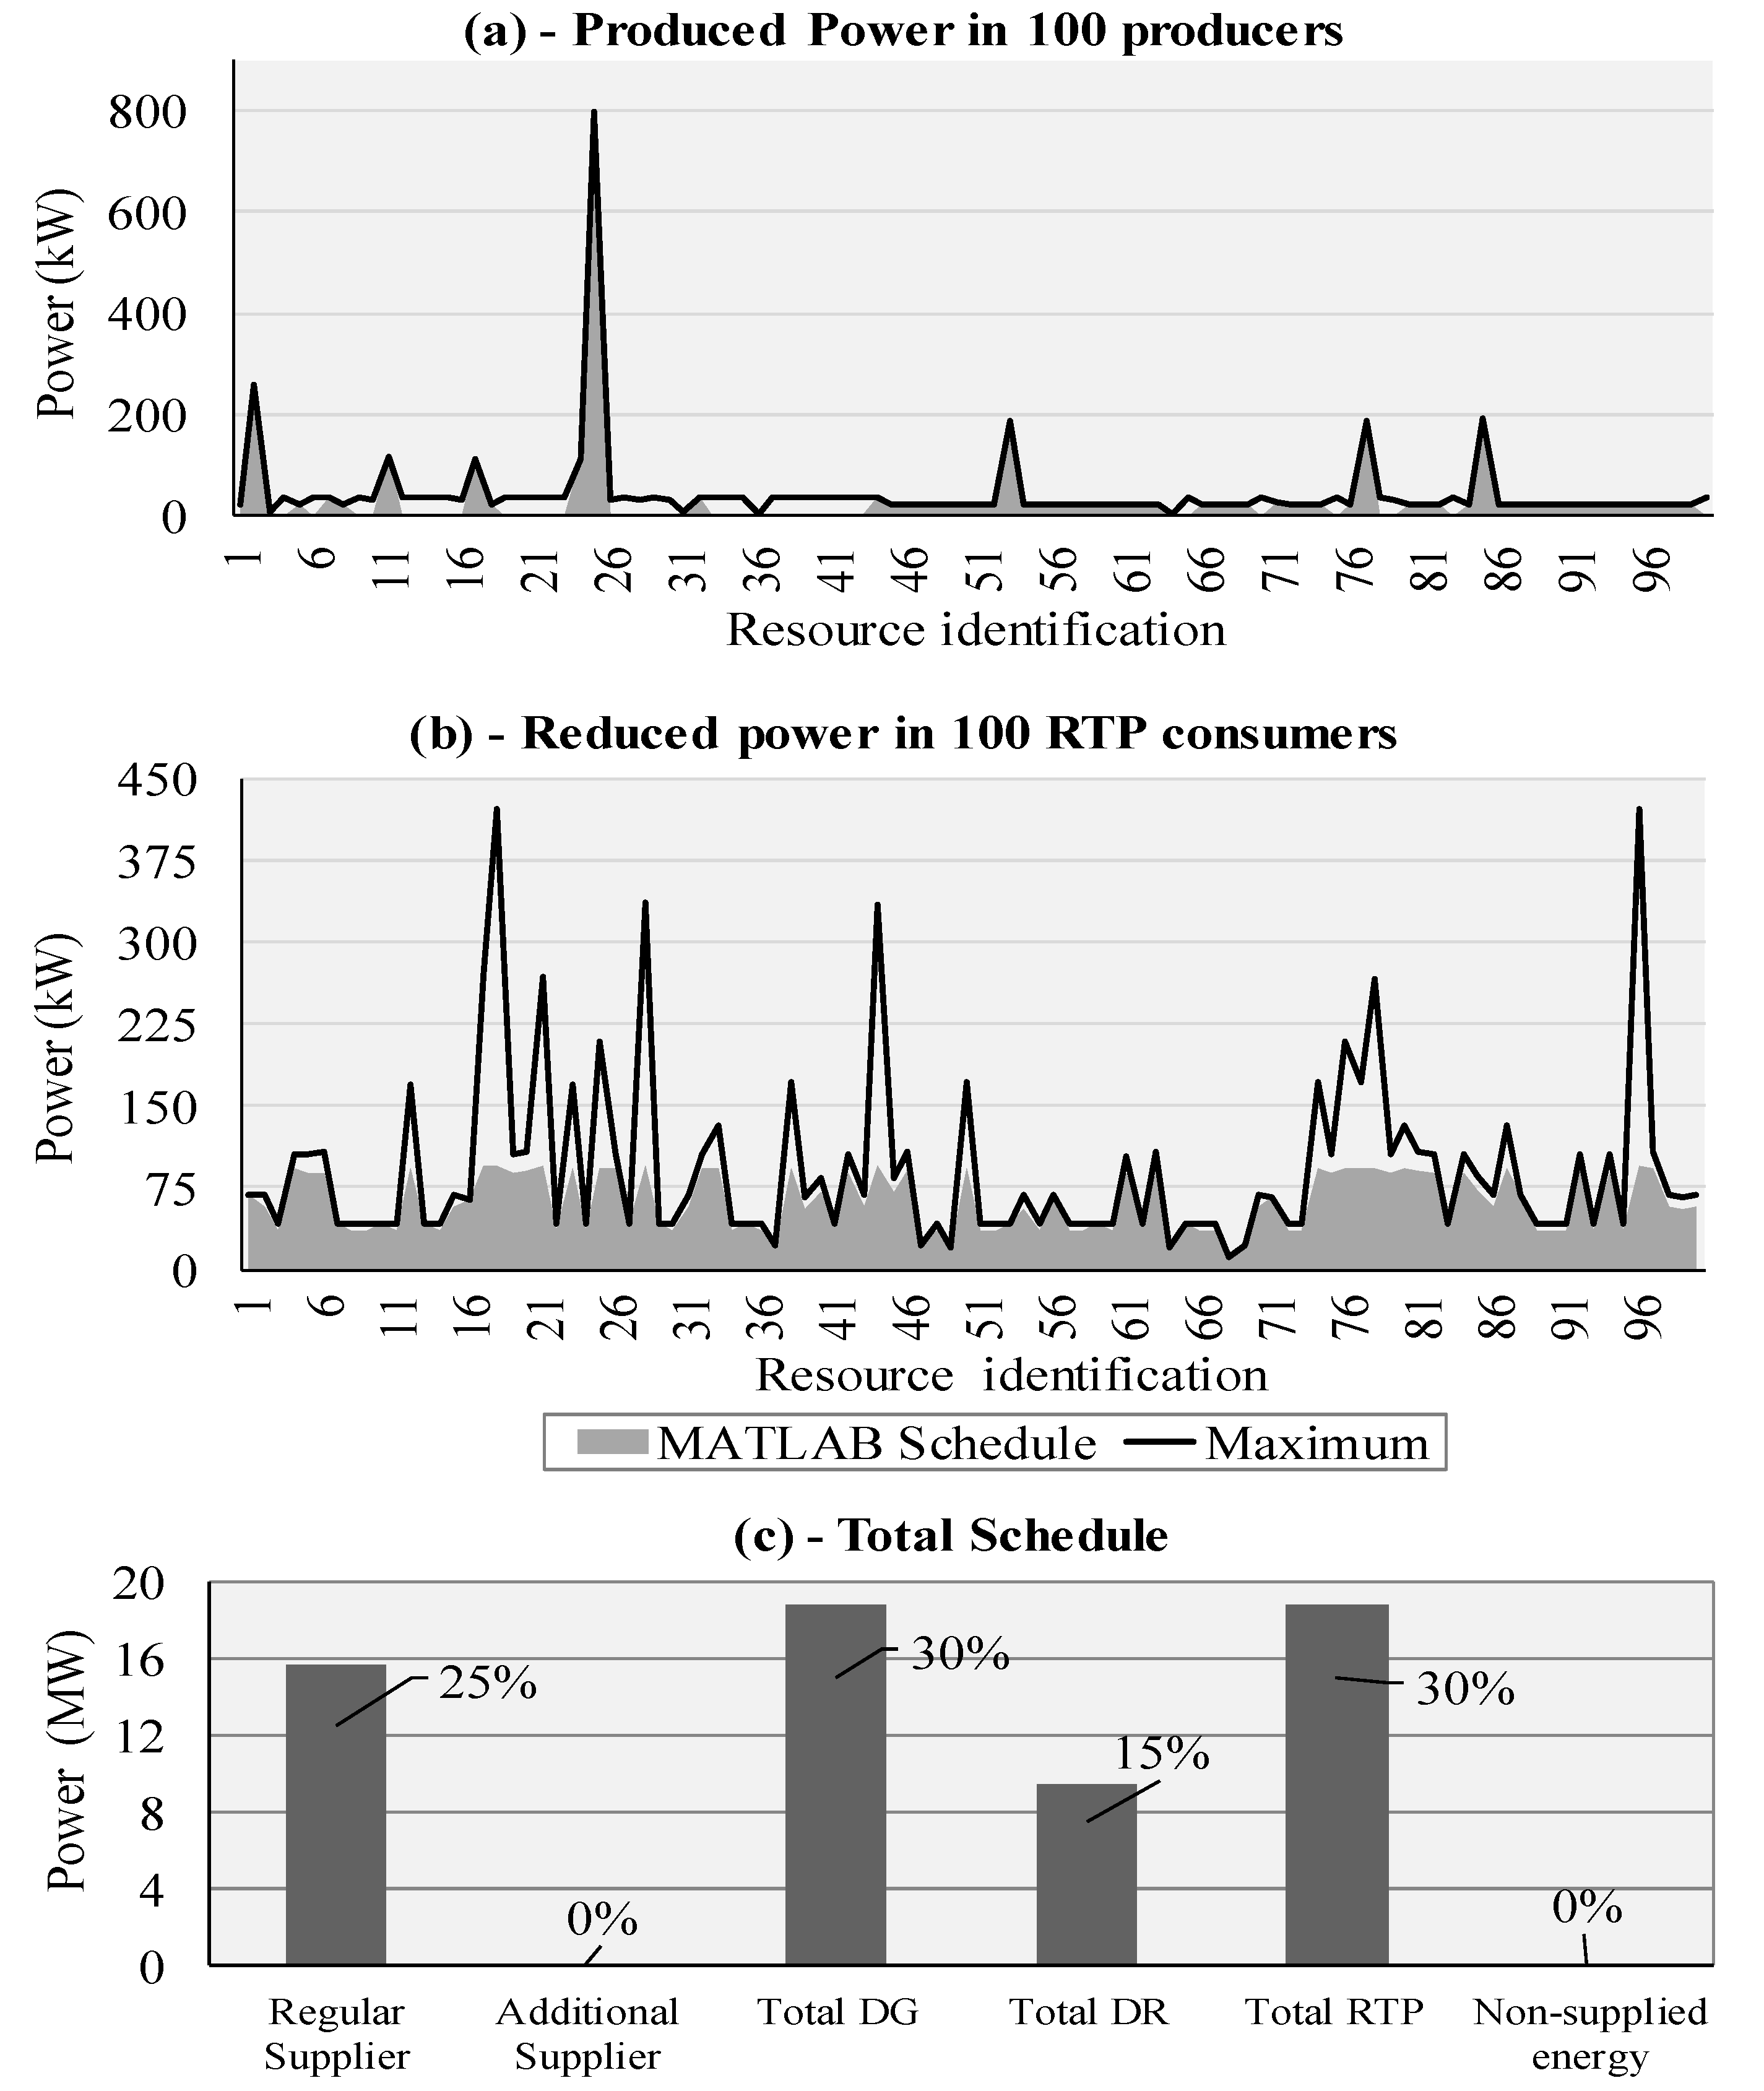
It is important to note that the influence of alpha parameters can be clearly seen in the results. Figure 2a,b demonstrate the optimized power scheduling for distributed producers and real-time-pricing consumers, respectively. Figure 2c presents the production totals and respective percentage of total schedule, to make the analysis simpler and quicker to perform. Due to space limitations and consistent presentation purposes, only 100 resources are presented for each type. Figure 2a presents the scheduling for the first 100 distributed producers, being that some of which are not generating. The black line represents the maximum energy capacity available in that specific moment. Looking at Figure 2c, we can see that the scheduling fulfilled the implemented constraints, namely the alpha parameters, as demonstrated by total DG, IDR and RTP. The RTP consumers, in this scenario, have contributed 30% of the total peak demand (Figure 2c), using in its majority, industrial type consumers, for applying power reductions.
In Figure 2b, the black line represents the maximum power reduction for each RTP consumer, and the grey area is the actual reduced power for each of the RTP consumers that was obtained from the optimization. The authors have discussed the cost function to be applied to the resources payment. In fact, it can impact the scheduling of the resources and consequently the clustering and remuneration. However, due to the small size of the DG units, these usually are paid as fixed price and we want to make an easy remuneration methodology to the resources owners.
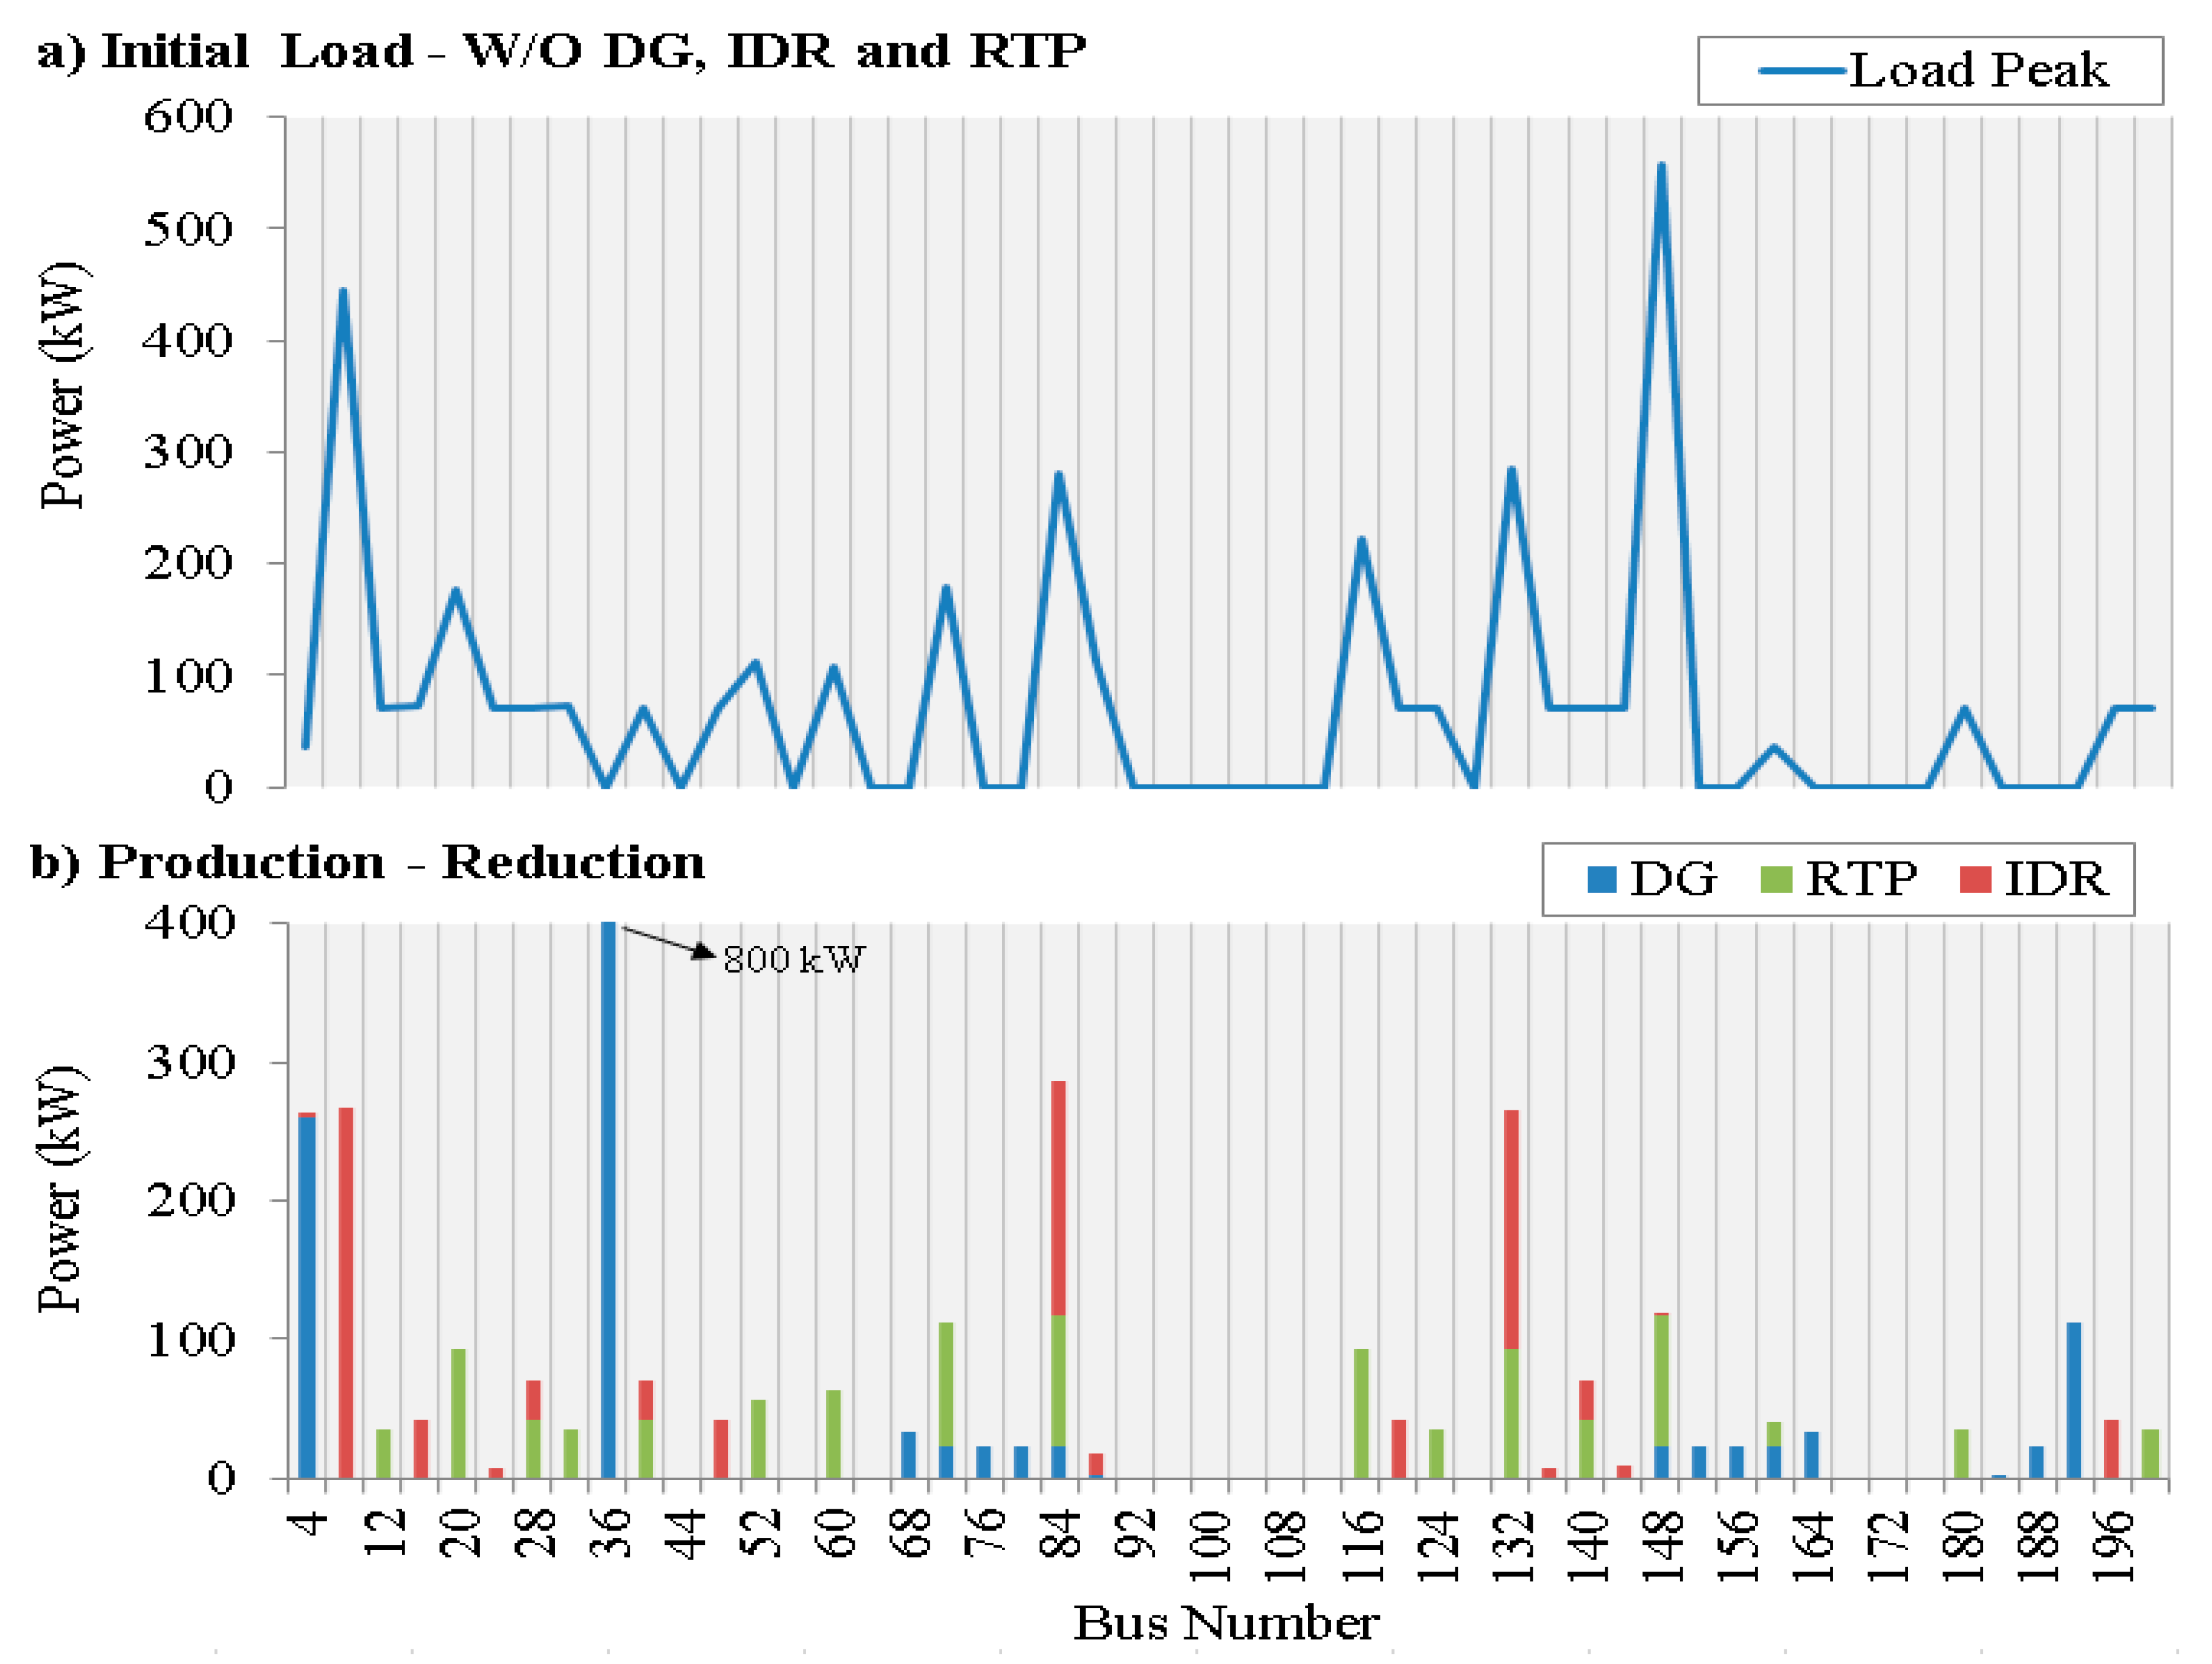
In this scenario, only 25% of the total power delivered was obtained from external suppliers. Figure 3 presents the comparison between consumption and reduction considering 200 different buses. One can see that some buses do not have any production or consumption allocated to them (for example, 92 to 112). Also, Figure 3 shows that most of the buses export excess energy to other locations and do not just consume it on site. For example, one can see that bus number 148 has a significantly larger consumption when comparing with other buses. However, the production level in bus 148 is too low for it to be able to meet the local demand; therefore, others that have excess energy can supply the remaining energy to bus 148 (ex. 36). The objective function value is 2297.1 m.u., where the minus sign symbolizes that in the total operation management, the resources outcome was profitable to the VPP. Table 2 shows the results for the selected scenario, corresponding to the power schedule in each type of distributed generation and consumer.
As demonstrated in Table 2, the distributed generators, IDR and RTP consumers were very used by the scheduling, coming up to more than 50% of their total capacity (DG-74%, IDR-54.7% and RTP-69.2%) supplying a total of 46,972.8 kW, approximately, 46.9 MW of power. The remaining power necessary for the satisfaction of demand is made by the external suppliers, 15,657.6 kW or 15.7 MW.
5.2. All Scenarios—Aggregation and Remuneration
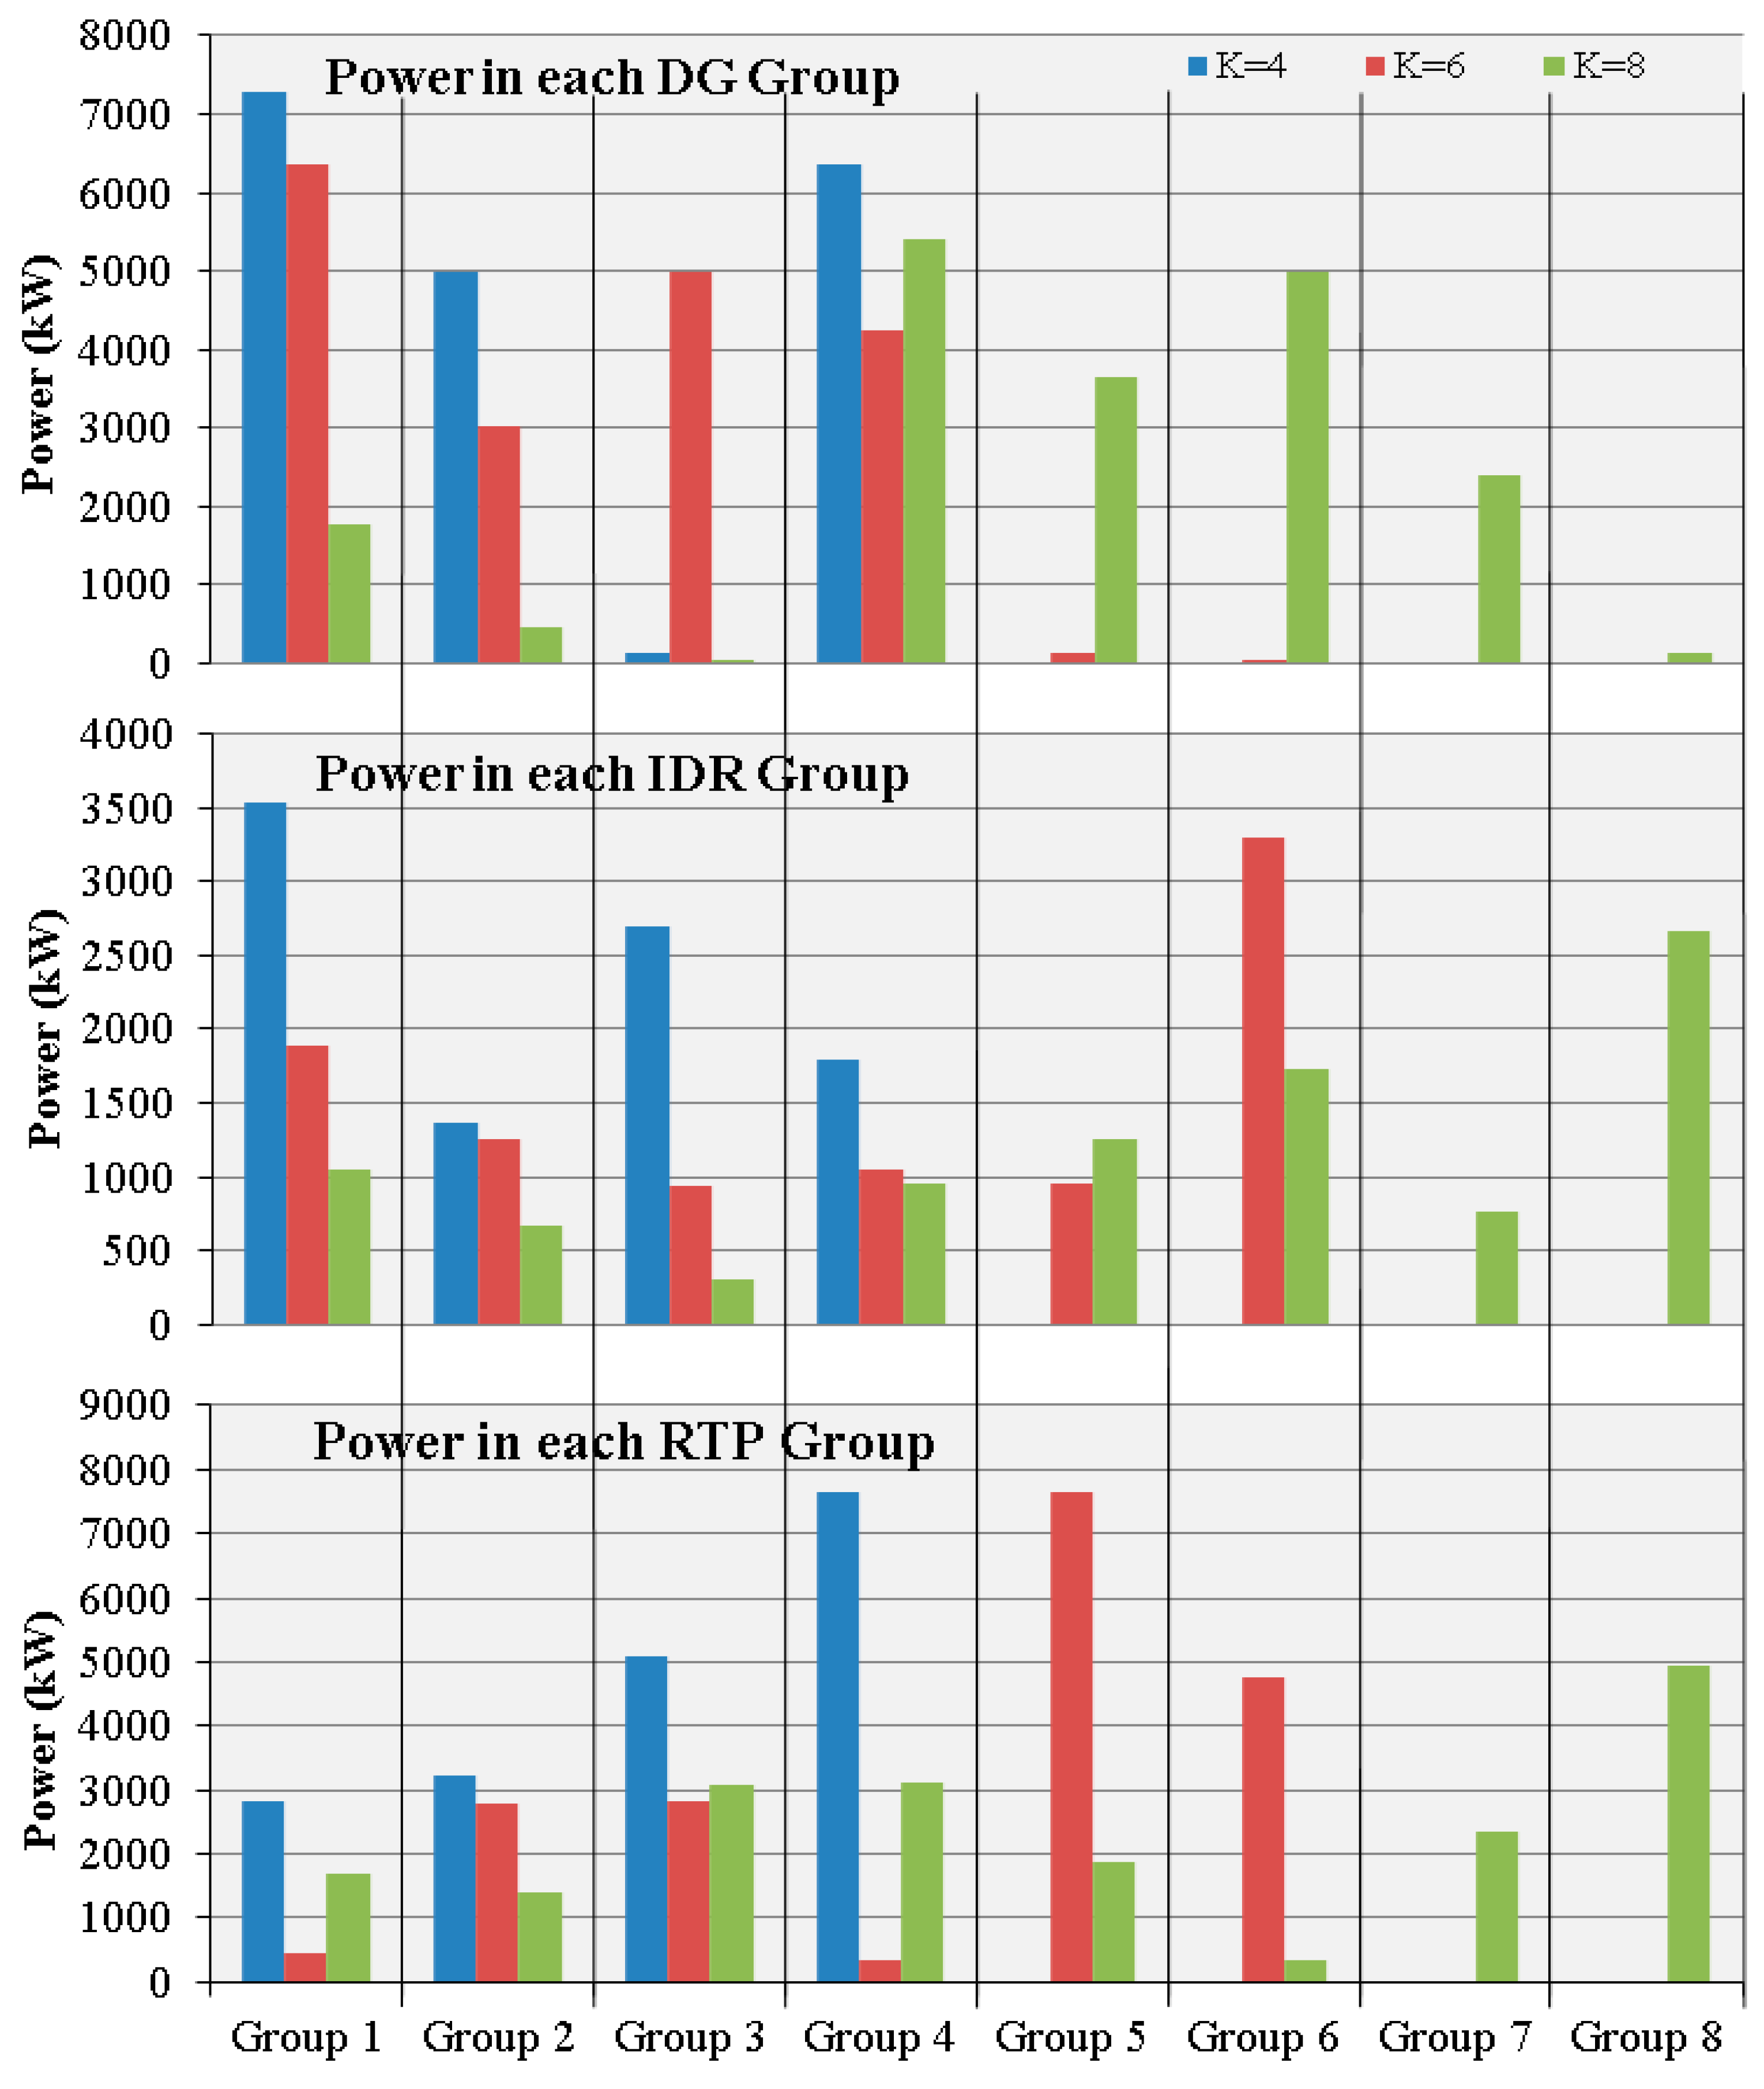
The aggregation was made using the K-means function of MATLAB, and also, considering separated clusters, i.e., the resources were clustered considering the same type of resource to group (DG, IDR and RTP). This function allows for obtaining the centroid value for each group and considering 648 different scenarios, there is the possibility of analysing the variation of the centroid values along all these scenarios. The remuneration was performed considering the indices obtained from the aggregation and with the power scheduled in the selected scenario. Figure 4 presents the total power in each of the groups formed for a total number of clusters equal to 4, 6 and 8. Also, performing a quick analysis, one can see that the power per group decreases, as the total number of groups rises.
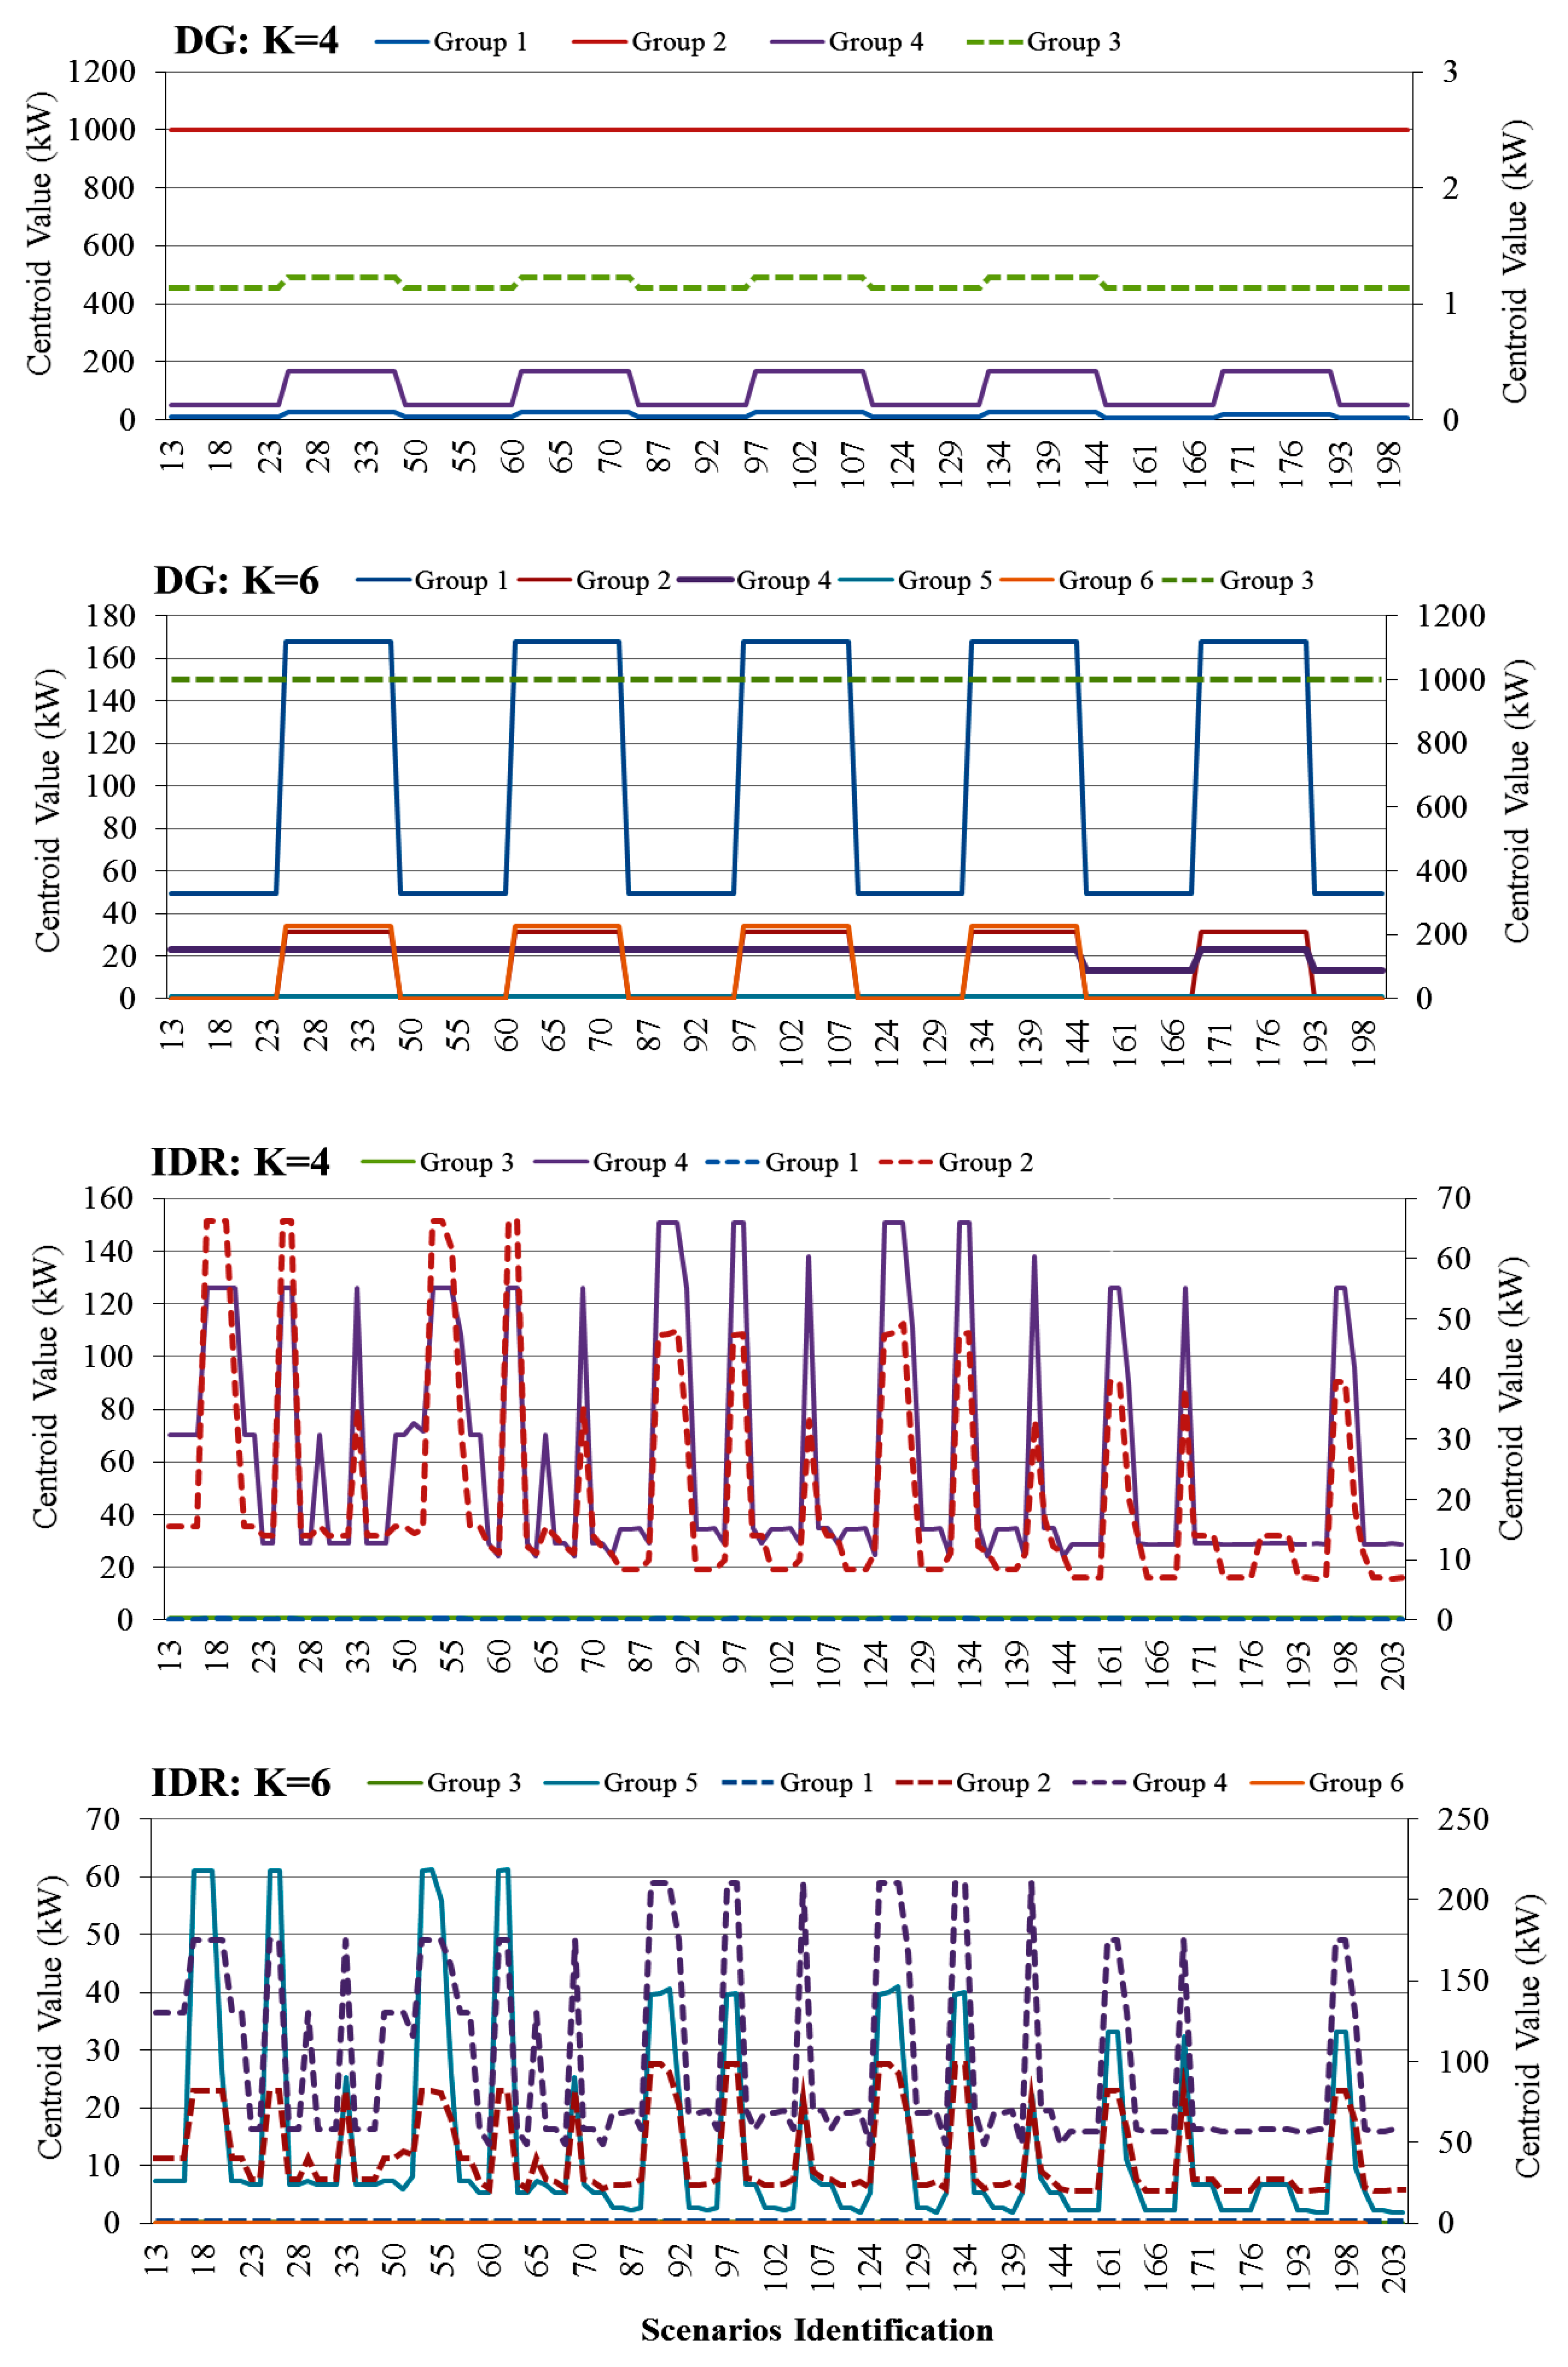
The centroid values, obtained from the K-means algorithm, allows us to estimate a median value of generated/reduced power for each type of resource, making it easier to automatically attribute a group to a new resource. Figure 5 presents the centroid power values for each type of resource. The data series displayed with solid lines are belonging to the left axis and the dashed lines are belonging to the right axis.
Through these values, it is possible to estimate a power behaviour in each of the groups, being that group characterized by that centroid power level. This enables the VPP a quick assignment of new resources to the already existing groups. For example, for DG with K = 4, there is one group that is composed by large producers (1000 kW, Group 2), another that clusters medium resources between 50 and 200 kW of power (Group 4). Finally, the two remaining groups, 1 (5–30 kW) and 3 (~1 kW), consist of medium-and small-size producers, respectively, that are clustered into the same groups for enabling their power negotiation in the energy markets. In this way, due to the rather different scales of values to be presented, if only one y-axis is considered, it would not be possible to see, for example, the curve of group 3; that is why it appears in a secondary y-axis on the right. The same evaluation can be performed for the other representations of the centroid value, being K = 6. After the aggregation is made, the next step will be to remunerate each distributed producer and consumer in demand response programs.
The tariffs definition was made considering the maximum price of the respective group. Table 3 defines the total remuneration to be done in each group and each cluster scenario (K = 4, K = 6 and K = 8). Given that all the resources in a group will be paid at the highest price, most of these will have an increased remuneration price. For example, consumer #101 has an initial price (before aggregation) of 0.1546 m.u./kWh. After aggregation, it was assigned to group 3, in K = 4 clustering scenario, obtaining a final remuneration price of 0.1991 m.u./kWh.
The focus of this method is to find the optimal point between a suitable group power level to be negotiated in the energy markets and a minimization of the costs associated with the energy resources.
In Table 3, in line with the tariffs comparison described in Section 2.4, the total costs for the VPP are presented for the different number of groups under comparison and for the remuneration by type of resource, as in Table 2. According to the initial price defined for each resource of a certain type, the costs are compared for the remuneration of each single resource as scheduled in the scenario, and for the remuneration of all the resources of that type according to the available capacity. In the remuneration of all resources by type, the VPP is paying for the available capacity, which is an approach that can be seen as a fair solution for the participation of resources since, in the event that the VPP is not using the developed methodology, it would accommodate all the available generation from DG and schedule all the DR resources enrolled in the same program.
Using the proposed methodology, considering 8 groups, tariffs are provided resulting in higher costs than simple payment by DG/IDR resource type as single resources, i.e. considering that only the scheduled resources are remunerated. In fact, such higher costs can be advantageous for the VPP since, with the implemented tariff, the actual response from DR/DG resources is more reliable as the resources with same characteristics will be included in the same group and paid at the highest price. Comparing now the same K = 8 costs with the remuneration of all resources available, we can say that if the VPP uses the proposed methodology, the costs will be lower than the ones achieved in a scenario where all the available resources are paid according to the availability. In fact, this approach can lead to an excess of generation in the VPP area, which can be used for selling in the market or integrating in storage means. This comparison shows the interest of the proposed methodology as a whole.
It is important to note that this discussion on the cost comparison is being done for only a selected scenario; it should be replicated by the VPP for each implemented scenario. According to Section 2, the VPP must start by defining the set of scenarios as input for the methodology. This should consider the variability of the available resources by including multiple scenarios. In the aggregation phase, the groups of resources are defined by the clustering method taking into account the complete set of scenarios specified by the VPP. However, the discussion/definition of the better tariff scheme must be done individually for each scenario so the resources scheduled for each group/tariff take into account the obtained optimal scheduling of the resources but that does not necessarily mean that the proposed tariff scheme is always more advantageous than the remuneration by type. The developed methodology provides the means for the VPP to make decisions on tariffs definition, which can be difficult to make in some scenarios.
6. Conclusions
The methodology presented in this paper fits the subject of the remuneration tariffs definition for demand response and distributed generation. The specific focus of the method in this paper is given to an aggregator, a Virtual Power Player that needs to group and remunerate the resources for the operation of its own area or for participation in electricity markets.
The previously published works in the literature address the remuneration of resources by grouping them by consumer’s types or by generator primary source. More recent works include the definition of clusters of resources for a single scenario. Moreover, even in the cases that several scenarios are analyzed, they are analyzed one by one.
The methodology developed in this paper goes forward by performing the aggregation of resources according to a complete set of scenarios. In this way, the obtained groups consider attributes behavior along those operation scenarios. With this methodology, an aggregator having a set of resources, in a large or reduced number, is able to obtain the most advantageous tariffs in a planning phase. Additionally, it combines incentive-based and price-based demand response programs. Finally, by all the consumers in a group paying the same price, the highest initial price, one can expect a more accurate response of the resources, integrating their scheduling, aggregation, and remuneration in a single methodology. This methodology is more advantageous than the ones addressing the operation scenarios one by one.
It has been found that the developed methodology provides the VPP with a remuneration scheme that allows to reduce the payment to the consumers providing DR and DG units when comparing to a basis situation in which all the resources of a certain type would be paid according to its availability, disregarding the optimal scheduling of the resources available in each scenario or set of scenarios. Also, it makes it possible for the VPP to perform the definition of tariffs in different time frames. This aspect is very important in the sense that it is very flexible. Also, it allows the VPP to define a large set of scenarios representing the operation conditions that can occur in the VPP operation context.
The developed methodology will be improved as future work regarding several important aspects. Due to space limitation and the need to define a focused paper subject, such aspects have not been addressed in the present paper. The related future work will include: addressing the network capacity in what concerns cables capacity, power losses, and bus voltages; integrating other resources as electric vehicles and storage means; and addressing the availability and controllability of wind and sun-based power plants.
Author Contributions
Conceptualization, P.F. and Z.V.; Methodology, P.F.; Software, J.S.; Validation, P.F.; Formal Analysis, P.F.; Data Curation, J.S.; Writing—Original Draft Preparation, J.S.; Writing–Review and Editing, P.F.
Funding
This work has received funding from the following projects: SIMOCE Project (ANI | P2020); and from FEDER Funds through the COMPETE program and from National Funds through FCT under the project UID/EEA/00760/2013. This work was also supported by the European Union’s Horizon 2020 Research and Innovation Programme under the Marie Sklodowska-Curie Grant Agreement 641794–DREAM-GO Project.
Conflicts of Interest
The authors declare no conflict of interest.
Nomenclature
| Variables | |
| CIncreaseRTP | Electricity cost increase for RTP |
| OC | Operation costs |
| PaddSupplier | Scheduled power for an additional supplier |
| PDG | Scheduled power for a DG unit |
| PIDR | Scheduled power reduction for IDR resources |
| PNSP | Non-supplied power |
| PReductRTP | Consumption reduction for RTP |
| PregSupplier | Scheduled power for a regular supplier |
| Parameters | |
| αDG | Maximum allowed DG contribution |
| αIDR | Maximum allowed IDR contribution |
| αRTP | Minimum aimed RTP contribution |
| ε | Price elasticity of demand |
| CaddSupplier | Additional supplier cost |
| CDG | Distributed generation cost |
| CIDR | Incentive based Demand Response cost |
| CIncrease MaxRTP | Maximum cost increase in an RTP resource |
| CInitialRTP | Initial electricity cost for RTP resources |
| CNSP | Non supplied power cost |
| CregSupplier | Regular supplier cost |
| Padd MaxSupplier | Maximum power from additional suppliers |
| Padd TotalSupplier | Maximum total power of additional suppliers |
| PInitialLoad | Initial consumption of the consumers |
| PMaxDG | Maximum power schedule in a DG resource |
| PMaxIDR | Maximum power schedule in a IDR resource |
| PMaxRTPDR | Maximum total power schedule in a consumer participating in both IDR and RTP |
| PMinDG | Minimum power schedule in a DG resource |
| PReduct MaxRTP | Maximum power schedule in a RTP resource |
| Preg MaxSupplier | Maximum power from a regular supplier |
| Preg TotalSupplier | Maximum allowed total power from all the regular suppliers |
| PTotal MaxDG | Maximum allowed total power from all the DG units |
| Indexes | |
| C | Maximum number of consumers c |
| P | Maximum number of producers p |
| S | Maximum number of suppliers s |
| K | Number of Clusters i |
| N | Number of Objects j |
References
- MacCormack, J.; Zareipour, H.; Rosehart, W.D. Long-Term Market Equilibrium Model with Strategic, Competitive, and Inflexible Generation. IEEE Trans. Power Syst. 2012, 27, 2291–2292. [Google Scholar] [CrossRef]
- Faria, P.; Vale, Z. Demand response in electrical energy supply: An optimal real time pricing approach. Energy 2011, 36, 5374–5384. [Google Scholar] [CrossRef] [Green Version]
- SEPA. Association for Demand Response & Smart Grid. Available online: http://www.demandresponsesmartgrid.org/ (accessed on 1 May 2018).
- Behboodi, S.; Chassin, D.P.; Crawford, C.; Djilali, N. Renewable resources portfolio optimization in the presence of demand response. Appl. Energy 2016, 162, 139–148. [Google Scholar] [CrossRef]
- Wang, G.; Zhang, Q.; Li, H.; McLellan, B.C.; Chen, S.; Li, Y.; Tian, Y. Study on the promotion impact of demand response on distributed PV penetration by using non-cooperative game theoretical analysis. Appl. Energy 2017, 185, 1869–1878. [Google Scholar] [CrossRef]
- Siano, P.; Sarno, D. Assessing the benefits of residential demand response in a real time distribution energy market. Appl. Energy 2016, 161, 533–551. [Google Scholar] [CrossRef]
- D’hulst, R.; Labeeuw, W.; Beusen, B.; Claessens, S.; Deconinck, G.; Vanthournout, K. Demand response flexibility and flexibility potential of residential smart appliances: Experiences from large pilot test in Belgium. Appl. Energy 2015, 155, 79–90. [Google Scholar] [CrossRef]
- Balkhair, K.S.; Rahman, K.U. Sustainable and economical small-scale and low-head hydropower generation: A promising alternative potential solution for energy generation at local and regional scale. Appl. Energy 2017, 188, 378–391. [Google Scholar] [CrossRef]
- Gonzalez-Salazar, M.A.; Venturini, M.; Poganietz, W.-R.; Finkenrath, M.; Kirsten, T.; Acevedo, H.; Spina, P.R. Development of a technology roadmap for bioenergy exploitation including biofuels, waste-to-energy and power generation & CHP. Appl. Energy 2016, 180, 338–352. [Google Scholar]
- Jessica, S. Explicit Demand Response in Europe—Mapping the Markets 2017. Available online: http://www.smarten.eu/wp-content/uploads/2017/04/SEDC-Explicit-Demand-Response-in-Europe-Mapping-the-Markets-2017.pdf (accessed on 10 April 2017).
- Karangelos, E.; Bouffard, F. Towards Full Integration of Demand-Side Resources in Joint Forward Energy/Reserve Electricity Markets. IEEE Trans. Power Syst. 2012, 27, 280–289. [Google Scholar] [CrossRef]
- Hernandez, L.; Baladron, C.; Aguiar, J.M.; Carro, B.; Sanchez-Esguevillas, A.; Lloret, J.; Chinarro, D.; Gomez-Sanz, J.J.; Cook, D. A multi-agent system architecture for smart grid management and forecasting of energy demand in virtual power plants. IEEE Commun. Mag. 2013, 51, 106–113. [Google Scholar] [CrossRef] [Green Version]
- Palensky, P.; Dietrich, D. Demand Side Management: Demand Response, Intelligent Energy Systems, and Smart Loads. IEEE Trans. Ind. Inform. 2011, 7, 381–388. [Google Scholar] [CrossRef] [Green Version]
- Chassin, D.P.; Rondeau, D. Aggregate modeling of fast-acting demand response and control under real-time pricing. Appl. Energy 2016, 181, 288–298. [Google Scholar] [CrossRef] [Green Version]
- Heffner, G.C.; Goldman, C.A.; Moezzi, M.M. Innovative approaches to verifying demand response of water heater load control. IEEE Trans. Power Deliv. 2006, 21, 388–397. [Google Scholar] [CrossRef]
- Morais, H.; Pinto, T.; Vale, Z.; Praca, I. Multilevel Negotiation in Smart Grids for VPP Management of Distributed Resources. IEEE Intell. Syst. 2012, 27, 8–16. [Google Scholar] [CrossRef] [Green Version]
- Xu, R.; Wunsch, D. Survey of clustering algorithms. IEEE Trans. Neural Netw. 2005, 16, 645–678. [Google Scholar] [CrossRef] [PubMed]
- Ramos, S.; Duarte, J.M.M.; Soares, J.; Vale, Z.; Duarte, F.J. Typical load profiles in the smart grid context—A clustering methods comparison. In Proceedings of the 2012 IEEE Power and Energy Society General Meeting, San Diego, CA, USA, 22–26 July 2012; pp. 1–8. [Google Scholar]
- Duarte, F.J.; Duarte, J.M.M.; Ramos, S.; Fred, A.; Vale, Z. Daily wind power profiles determination using clustering algorithms. In Proceedings of the 2012 IEEE International Conference on Power System Technology (POWERCON), Auckland, New Zealand, 30 October–2 November 2012; pp. 1–6. [Google Scholar]
- Herrero, I.; Rodilla, P.; Batlle, C. Electricity market-clearing prices and investment incentives: The role of pricing rules. Energy Econ. 2015, 47, 42–51. [Google Scholar] [CrossRef]
- Zobaa, A.F.; Bansal, R.C. Handbook of Renewable Energy Technology; World Scientific: Singapore, 2011. [Google Scholar]
- Gupta, R. Economic implications of non-utility-generated wind energy on power utility. Comput. Electr. Eng. 2002, 28, 77–89. [Google Scholar] [CrossRef]
- Salinas, S.; Li, M.; Li, P. Multi-Objective Optimal Energy Consumption Scheduling in Smart Grids. IEEE Trans. Smart Grid 2013, 4, 341–348. [Google Scholar] [CrossRef]
- Vrba, P.; Mark, V.; Siano, P.; Leitão, P.; Zhabelova, G.; Vyatkin, V.; Strasser, T. A Review of Agent and Service-Oriented Concepts Applied to Intelligent Energy Systems. IEEE Trans. Ind. Inform. 2014, 10, 1890–1903. [Google Scholar] [CrossRef] [Green Version]
- Parvania, M.; Fotuhi-Firuzabad, M.; Shahidehpour, M. ISO’s Optimal Strategies for Scheduling the Hourly Demand Response in Day-Ahead Markets. IEEE Trans. Power Syst. 2014, 29, 2636–2645. [Google Scholar] [CrossRef]
- Faria, P.; Vale, Z. Remuneration Structure Definition for Distributed Generation Units and Demand Response Participants Aggregation. In Proceedings of the 2014 IEEE PES General Meeting|Conference & Exposition, National Harbor, MD, USA, 27–31 July 2014; pp. 1–5. [Google Scholar]
- Faria, P.; Spínola, J.; Vale, Z. Aggregation and Remuneration of Electricity Consumers and Producers for the Definition of Demand-Response Programs. IEEE Trans. Ind. Inform. 2016, 12, 952–961. [Google Scholar] [CrossRef]
- Spinola, J.; Faria, P.; Vale, Z. Scheduling and aggregation of distributed generators and consumers participating in demand response programs. In Proceedings of the 2015 IEEE Eindhoven PowerTech, Eindhoven, The Netherlands, 29 June–2 July 2015. [Google Scholar]
- Spínola, J.; Faria, P.; Vale, Z. Remuneration of distributed generation and demand response resources considering scheduling and aggregation. In Proceedings of the 2015 IEEE Power & Energy Society General Meeting, Denver, CO, USA, 26–30 July 2015; pp. 1–5. [Google Scholar]
- Arnold, R.A. Economics; Cengage Learning: Boston, MA, USA, 2008. [Google Scholar]
- Faria, P.; Soares, J.; Vale, Z.; Morais, H.; Sousa, T. Modified Particle Swarm Optimization Applied to Integrated Demand Response and DG Resources Scheduling. IEEE Trans. Smart Grid 2013, 4, 606–616. [Google Scholar] [CrossRef] [Green Version]
Figure 1.
Diagram of the proposed methodology.

Figure 2.
Selected scenario results: (a) produced power in 100 producers; (b) reduced power in 100 Real-Time pricing (RTP) consumers; (c) total schedule.
Figure 2.
Selected scenario results: (a) produced power in 100 producers; (b) reduced power in 100 Real-Time pricing (RTP) consumers; (c) total schedule.

Figure 3.
Production versus Consumption: (a) initial load—W/O Distributed Generation (DG), Incentive Demand Response (IDR) and RTP; (b) production-reduction.
Figure 3.
Production versus Consumption: (a) initial load—W/O Distributed Generation (DG), Incentive Demand Response (IDR) and RTP; (b) production-reduction.

Figure 4.
Power in each group.

Figure 5.
Centroid values of DG and IDR for a total number of clusters of K = 4 and K = 6.


Table 1.
Scenarios Definition.
| Parameter | Parameter Variation | # Scenarios | Selected Scenario | ||
|---|---|---|---|---|---|
| Min | Step | Max | |||
| Regular supplier cost | 0.8 | 0.2 | 1.2 | 3 | 1 |
| Distributed generators cost | 1 | 0.2 | 1.2 | 2 | 1 |
| Total initial load | 1.2 | −0.2 | 0.8 | 3 | 1 |
| Maximum reduction for IDR | 1 | 0.2 | 1.2 | 2 | 1.2 |
| Maximum reduction for RTP | 1 | 0.2 | 1.2 | 2 | 1.2 |
| αDG | 0 | 0.15 | 0.3 | 3 | 0.3 |
| αIDR | 0 | 0.075 | 0.15 | 3 | 0.15 |
| αRTP | 0 | 0.1 | 0.3 | 4 | 0.3 |
| # Scenarios | 2592 | ||||
Table 2.
Selected Scenario Results.
| Resource | Resources Type | Percentage (%) | Power (kW) | Maximum Capacity (kW) | Price (per Type) (m.u./kWh) | Total (kW) |
|---|---|---|---|---|---|---|
| DG | Wind | 31.2 | 5866.09 | 5866.09 | 0.071 | 18,789.13 (25,388.79) 74.0% |
| PV | 2.5 | 461.62 | 7061.28 | 0.150 | ||
| Biomass | 15.0 | 2826.58 | 2826.58 | 0.086 | ||
| Fuel cell | 13.1 | 2457.60 | 2457.60 | 0.028 | ||
| MSW | 0.3 | 53.10 | 53.10 | 0.056 | ||
| Hydro | 1.1 | 214.05 | 214.05 | 0.042 | ||
| CHP | 36.8 | 6910.10 | 6910.10 | 0.001 | ||
| IDR | DM | 14.0 | 1316.51 | 5621.61 | 0.20 | 9394.56 (17,164.46) 54.7% |
| SC | 51.0 | 4789.99 | 4789.99 | 0.16 | ||
| MC | 35.0 | 3288.07 | 6752.85 | 0.19 | ||
| LC | 0.0 | 0.00 | 0.00 | 0.18 | ||
| ID | 0.0 | 0.00 | 0.00 | 0.14 | ||
| RTP | MC | 26.7 | 5025.70 | 6752.85 | 0.20 | 18,789.13 (27,166.63) 69.2% |
| LC | 24.3 | 4568.56 | 6528.29 | 0.19 | ||
| ID | 48.9 | 9194.87 | 13,885.49 | 0.15 |
Table 3.
Remuneration Results.
| Type | # Group | Number of Clusters | ||||||||
|---|---|---|---|---|---|---|---|---|---|---|
| 1 | 2 | 3 | 4 | 5 | 6 | 7 | 8 | Total | ||
| DG | K = 4 | 1053.4 | 5.2 | 19.0 | 611.3 | - | - | - | - | 1689 |
| K = 6 | 611.3 | 426.2 | 5.2 | 292.2 | 19.0 | 2.9 | - | - | 1357 | |
| K = 8 | 1.8 | 65.3 | 0.0 | 517.9 | 254.2 | 5.2 | 161.8 | 19.0 | 1025 | |
| Single DG by type | - | - | - | - | - | - | - | - | 950 | |
| All DGs by type | - | - | - | - | - | - | - | - | 1806 | |
| IDR | K = 4 | 740.7 | 271.3 | 537.4 | 344.4 | - | - | - | - | 1894 |
| K = 6 | 377.2 | 241.9 | 198.4 | 199.9 | 190.0 | 656.7 | - | - | 1864 | |
| K = 8 | 199.9 | 142.1 | 60.0 | 190.0 | 241.9 | 291.5 | 152.1 | 447.7 | 1725 | |
| Single IDR by type | - | - | - | - | - | - | - | - | 1633 | |
| All IDRs by type | - | - | - | - | - | - | - | - | 2645 | |
© 2018 by the authors. Licensee MDPI, Basel, Switzerland. This article is an open access article distributed under the terms and conditions of the Creative Commons Attribution (CC BY) license (http://creativecommons.org/licenses/by/4.0/).
Share and Cite
MDPI and ACS Style
Faria, P.; Spínola, J.; Vale, Z. Distributed Energy Resources Scheduling and Aggregation in the Context of Demand Response Programs. Energies 2018, 11, 1987. https://doi.org/10.3390/en11081987
AMA Style
Faria P, Spínola J, Vale Z. Distributed Energy Resources Scheduling and Aggregation in the Context of Demand Response Programs. Energies. 2018; 11(8):1987. https://doi.org/10.3390/en11081987
Chicago/Turabian StyleFaria, Pedro, João Spínola, and Zita Vale. 2018. "Distributed Energy Resources Scheduling and Aggregation in the Context of Demand Response Programs" Energies 11, no. 8: 1987. https://doi.org/10.3390/en11081987
Note that from the first issue of 2016, this journal uses article numbers instead of page numbers. See further details here.