Impact of Road-Block on Peak-Load of Coupled Traffic and Energy Transportation Networks


1
College of Electrical and Information Engineering, Hunan University, Changsha 410082, China
2
School of Mechanical and Electrical Engineering, Hunan City University, Yiyang 413002, China
3
College of Electrical and Information Engineering, Changsha University of Science &Technology, Changsha 410114, China
4
Department of Electrical and Computer Engineering, Baylor University, Waco, TX 76798-7356, USA
5
State Grid Yiyang Power Supply Company, State Grid, Yiyang 413000, China
*
Author to whom correspondence should be addressed.
Energies 2018, 11(7), 1776; https://doi.org/10.3390/en11071776
Submission received: 19 May 2018
/
Revised: 22 June 2018
/
Accepted: 25 June 2018
/
Published: 6 July 2018
Abstract
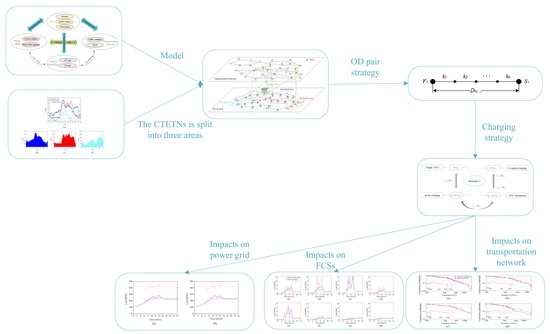
:With electric vehicles (EVs) pouring into infrastructure systems, coupled traffic and energy transportation networks (CTETNs) can be applied to capture the interactions between the power grids and transportation networks. However, most research has focused solely on the impacts of EV penetration on power grids or transportation networks. Therefore, a simulation model was required for the interactions between the two critical infrastructures, as one had yet to be developed. In this paper, we build a framework with four domains and propose a new method to simulate the interactions and the feedback effects among CTETNs. Considered more accurately reflecting a realistic situation, an origin-destination (OD) pair strategy, a charging strategy, and an attack strategy are modeled based on the vehicle flow and power flow. The model is able to analyze the spatial and temporal distribution characteristics of EVs, and measure the impacts on power grids and transportation networks with road-block. The IEEE 33-bus system with geographic information was used as a test system to verify the effectiveness of the model.
1. Introduction
Electrified transportation has introduced new challenges to both power systems and transportation networks. Electric vehicles (EVs), as coupling points of the two systems, are being integrated into infrastructure systems and playing a key role in the interaction. EVs are the nexus between the charging infrastructures, the power grids, and the transportation networks [1]. EVs are defined as a type of interruptible load, thus demand-side management can be performed for EVs to improve the overall reliability of the power system [2,3]. However, overloaded charging may result in undesirable grid congestion or voltage deviations. Quantitative reliability assessment approaches to further study the interactions between the power grid and transportation networks are lacking [4].
Various issues associated with EV injection in terms of the reliability and economy in power grids have been studied for several years, involving innovative energy storage systems [5], battery charging strategies [6], as well as information and communication technologies [7]. Optimized EV charging strategies can benefit EV drivers and power grids [8,9] by decreasing charging cost [10] and enhancing the reliability [11,12] and flexibility [13] of power grids. Beside the effects on the operating cost of power grids [14], the fluctuating energy flow [15] has been studied to better understand the impacts of the EV penetration on power grids.
The research has mostly focused on energy savings and emissions reduction from the transportation network perspectives. The increasing penetration of EVs offers significant economic and environmental benefits, such as the combination of renewable energies [16,17], the integration of smart grids [18], and less dependency on fossil fuels. In some Nordic countries, EV policies and initiatives have been proposed to promote carbon neutrality in the transportation systems [19]. In China, by replacing conventional vehicles with EVs, the benefits for cleaner air were revealed [20]. In Japan, mobile systems were built to realize clean transportation [21].
Multiplex networks, in which the same set of nodes are connected by links that have different connotations, are another class of multilayer networks [22]. Although multiplex networks are derived from social networks [23], the concept of multiple networks is able to efficiently show the interactions among different infrastructures [24]. Each layer of the network can be an actual infrastructure network or a virtual network, such as power grids, transportation networks, or assistant decision systems. The multiplex network structure can create flow congestion [25], improve the robustness of the multiplex systems, and change critical behaviors [26]. Charging strategies and traffic conditions, specifically affected by human beings and real-time demand, increase the randomness and complexity of the transportation network. Complexity theory has provided new insight for exploring the complexity of power systems and their interactions with other systems [27,28]. Therefore, by adopting the complex multiplex network, the inherent topological characteristics of the coupled traffic and energy transportation networks (CTETNs) can be determined to measure the spreading failure mechanisms and describe the impact of failures.
Researchers are beginning to recognize the necessity of developing appropriate tools to analyze the interactions between power grids and transportation networks. The interactions between the two systems cause multiplex networks to be vulnerable to initial failures [29]. In the real world, the initial failures are seldom random but targeted [30]. The most important nodes or branches, determined by innovative metrics [31], are the primary targets. Approaches to improve the robustness of the coupled energy transportation systems have been proposed based on the degree of nodes [32] and efficient edge attacks [33]. Furthermore, studying attacking mechanisms can provide prevention strategies for malicious attacks on the network. Therefore, exploring the impacts of targeted attacks is important, especially when the transportation system and power grid are interconnected. Additionally, determining a method for the electricity authority to cooperate with a transportation agency is essential, while ensuring the operational data of each system remains private so decisions can be made in a distributed manner [34].
To investigate the interactions and feedback effects among the CTETNs, we proposed a new framework composed of power grids, transportation networks, vehicle technologies, as well as information and communication technologies (ICT). In this framework, in terms of the efficiency and accuracy of the proposed methods, including an OD pair strategy, a charging strategy and an attack strategy, we successfully extracted the characteristics of the interactions among the CTETNs with road-block. The simulation results showed that a new peak-load spot suddenly emerged in the power grid, and the vehicle flow transfer was consistent with the local-world dynamics theory in the transportation network.
The rest of this paper is organized as follows: Section 2 outlines a new framework based on the interactions of four domains. Section 3 builds the CTETN model, and the topology of CTETNs is split into three areas according to the daily load-curve. Section 4 analyzes the EV behaviors including OD pair strategy and charging strategy. Section 5 formulates the attack strategy and evaluates the simulated results. Finally, Section 6 concludes the paper.
2. Framework on Interactions of Four Domains
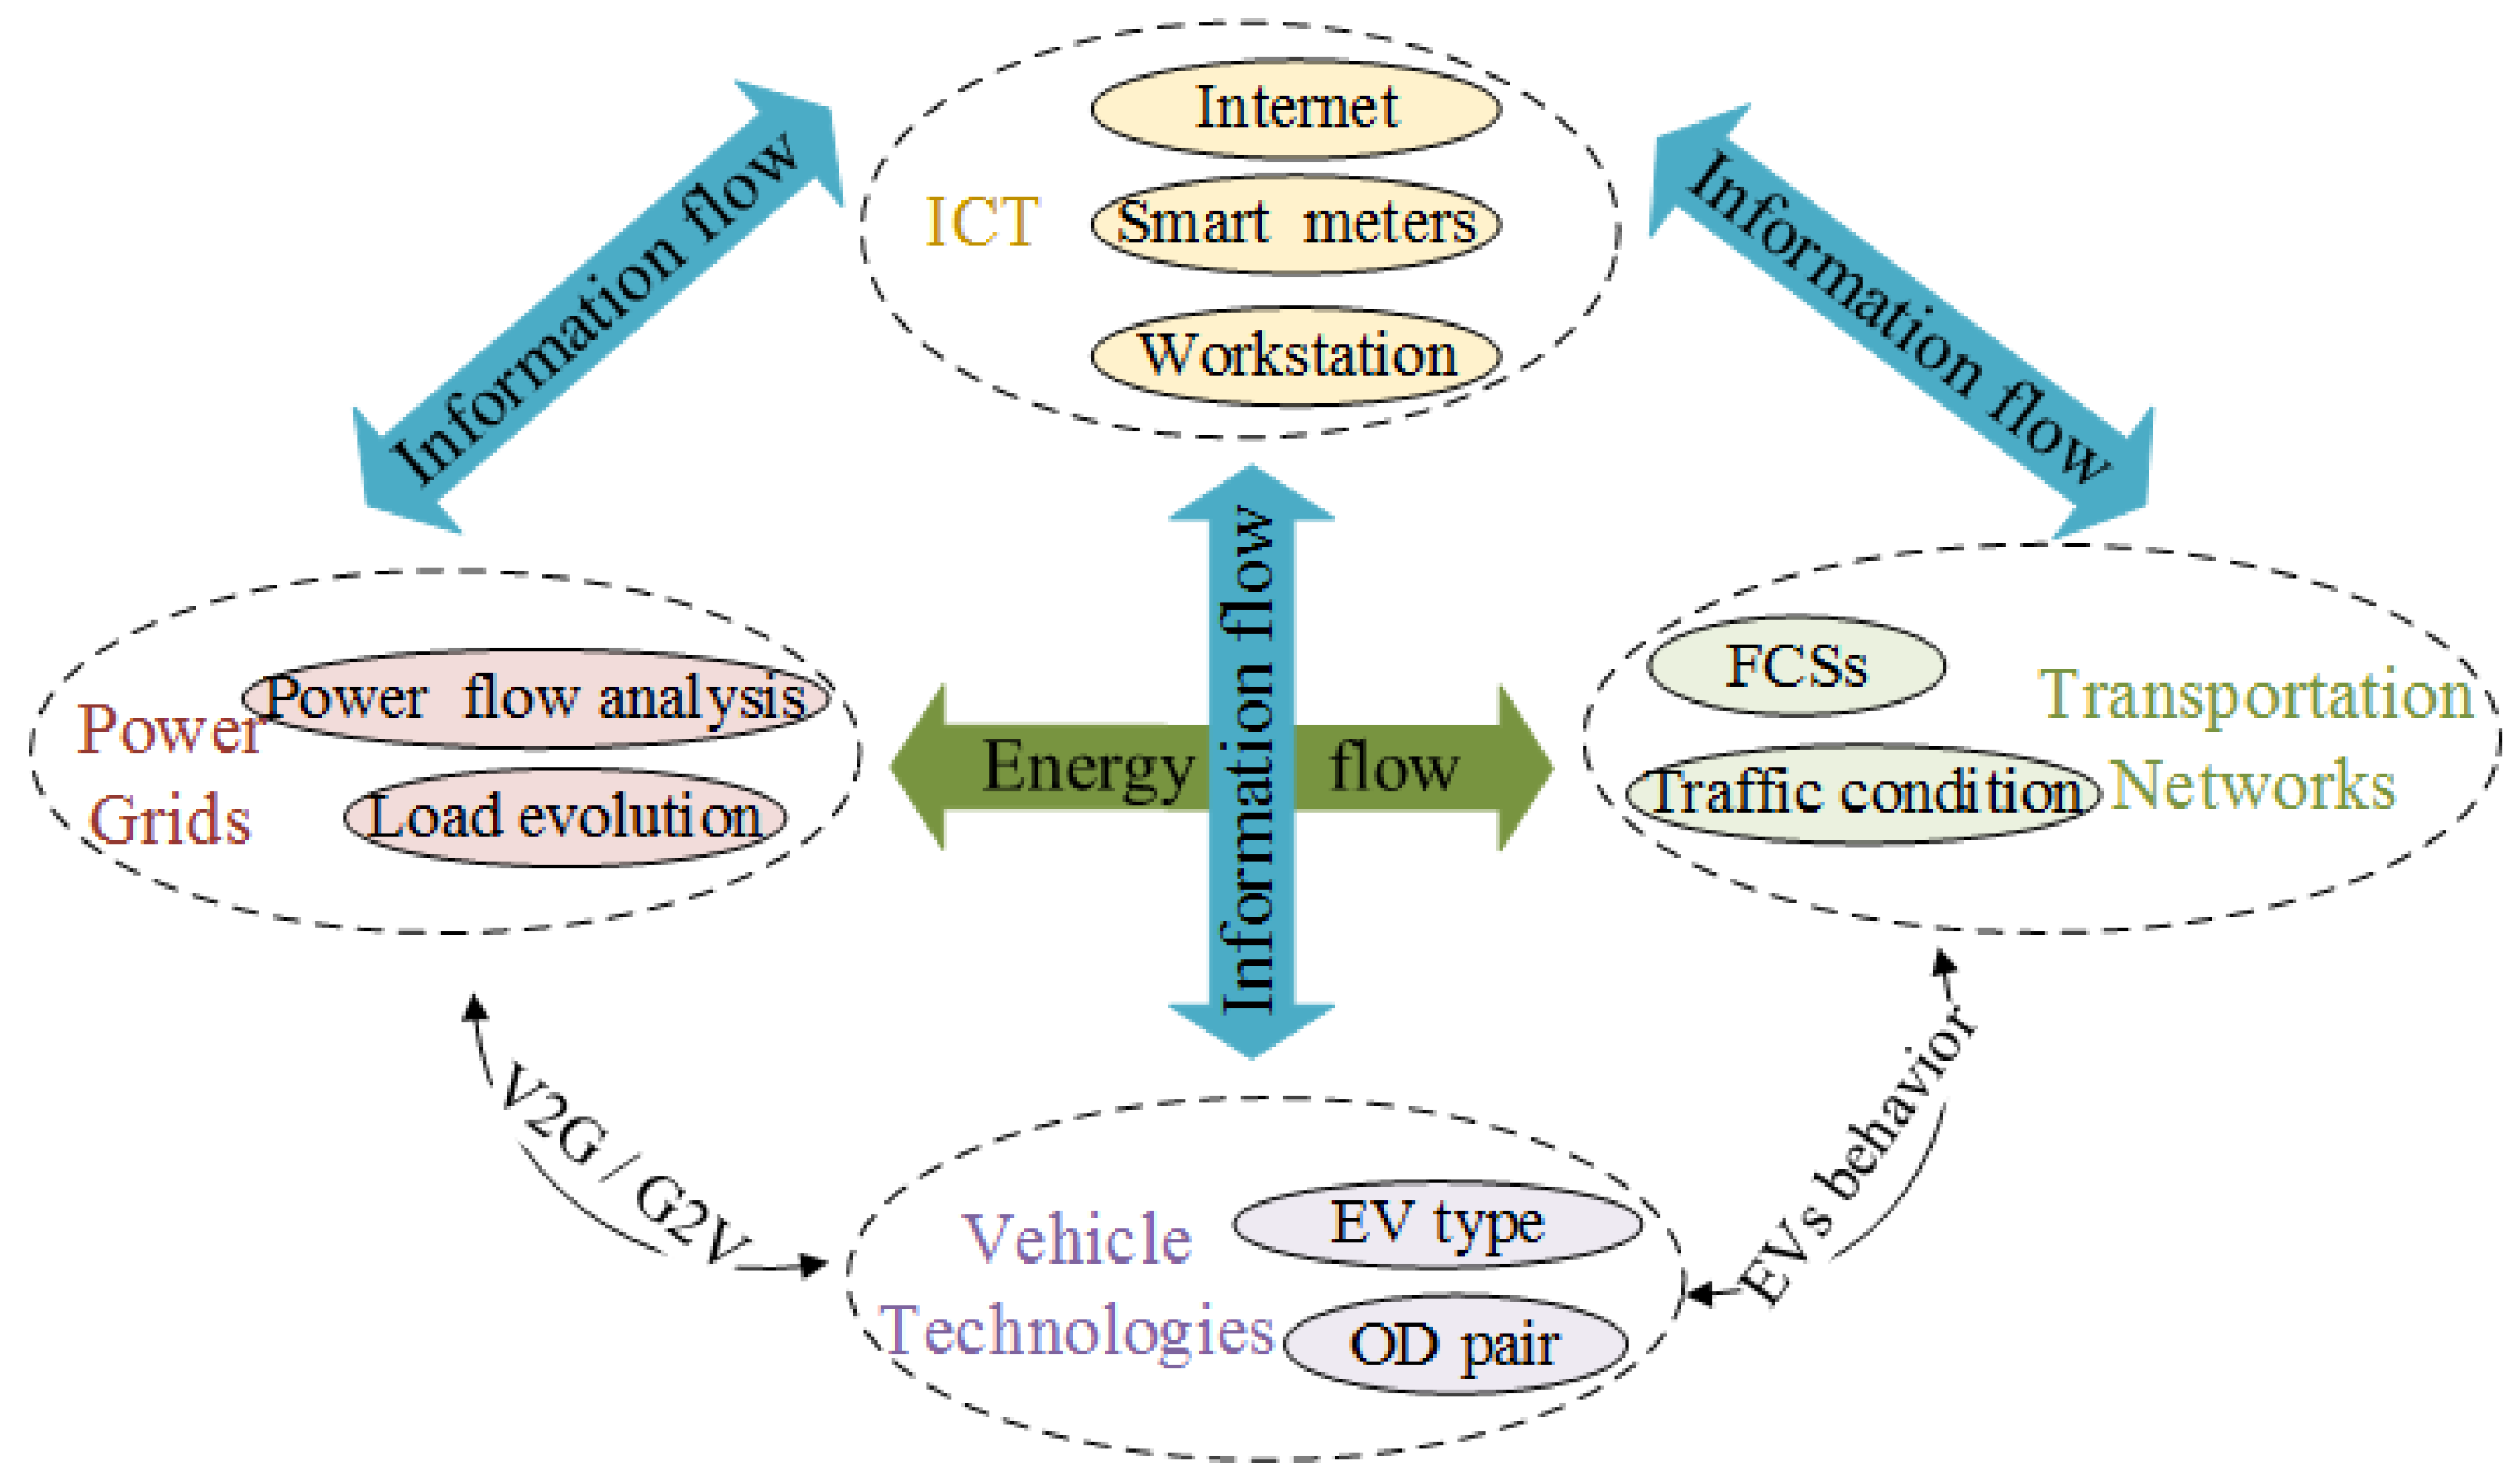
CTETNs are the important for capturing the interactions between power grids and transportation networks. This paper proposes a new framework, as shown in Figure 1, integrated with power grids and transportation networks as well as ICT and vehicle technologies. EVs play an important role in the interaction between power grids and transportation networks. As such, the rapid development of power grids, transportation networks, and vehicle technologies cannot be separated from advancing ICT. Thus, these four domains work together to provide insight into spatial and temporal load evolution and traffic conditions in the field of electrified transportation.
The emerging Machine to Machine (M2M) paradigm is driven by the Internet of Things (IoT), where physical objects are not disconnected from the virtual world but aim at collectively provide contextual services [35,36]. M2M, regarded as ICT, can autonomously measure, transmit, digest, and respond to information [37], which can guarantee energy-efficient communication and a stable supply of energy [35]. Within the proposed framework, ICT properly adapts the communication media to account for active power, node voltage, charging time and power, and traffic conditions, to build the connection with power grids, transportation networks, and vehicle technologies. The vehicle technologies, including the characteristics of the EVs, such as EV type and OD pair, establish contact with the power grid using vehicle to grid (V2G) technology and grid to vehicle (G2V) technology, and then connects to the transportation network using the EV behavior. Furthermore, the topology of the transportation networks and the locations of the fast charging stations (FCSs) affect the EV travel routes, thereby affecting the charging characteristics of EVs. Therefore, energy flows between the power grids and transportation networks.
EV behavior, including OD pair strategy and charging strategy, is complex and random. The EV first determines its origin and destination. If the EV cannot arrive at the destination within the mileage range, the location of the FCSs will change the travel route. The EV must also consider the need of charging for the emergency supply of electricity. Furthermore, the charging time and charging power will affect the operation of the power grid through the V2G/G2V technology, resulting in load evolution and redistribution of power flow.
3. CTETN Model
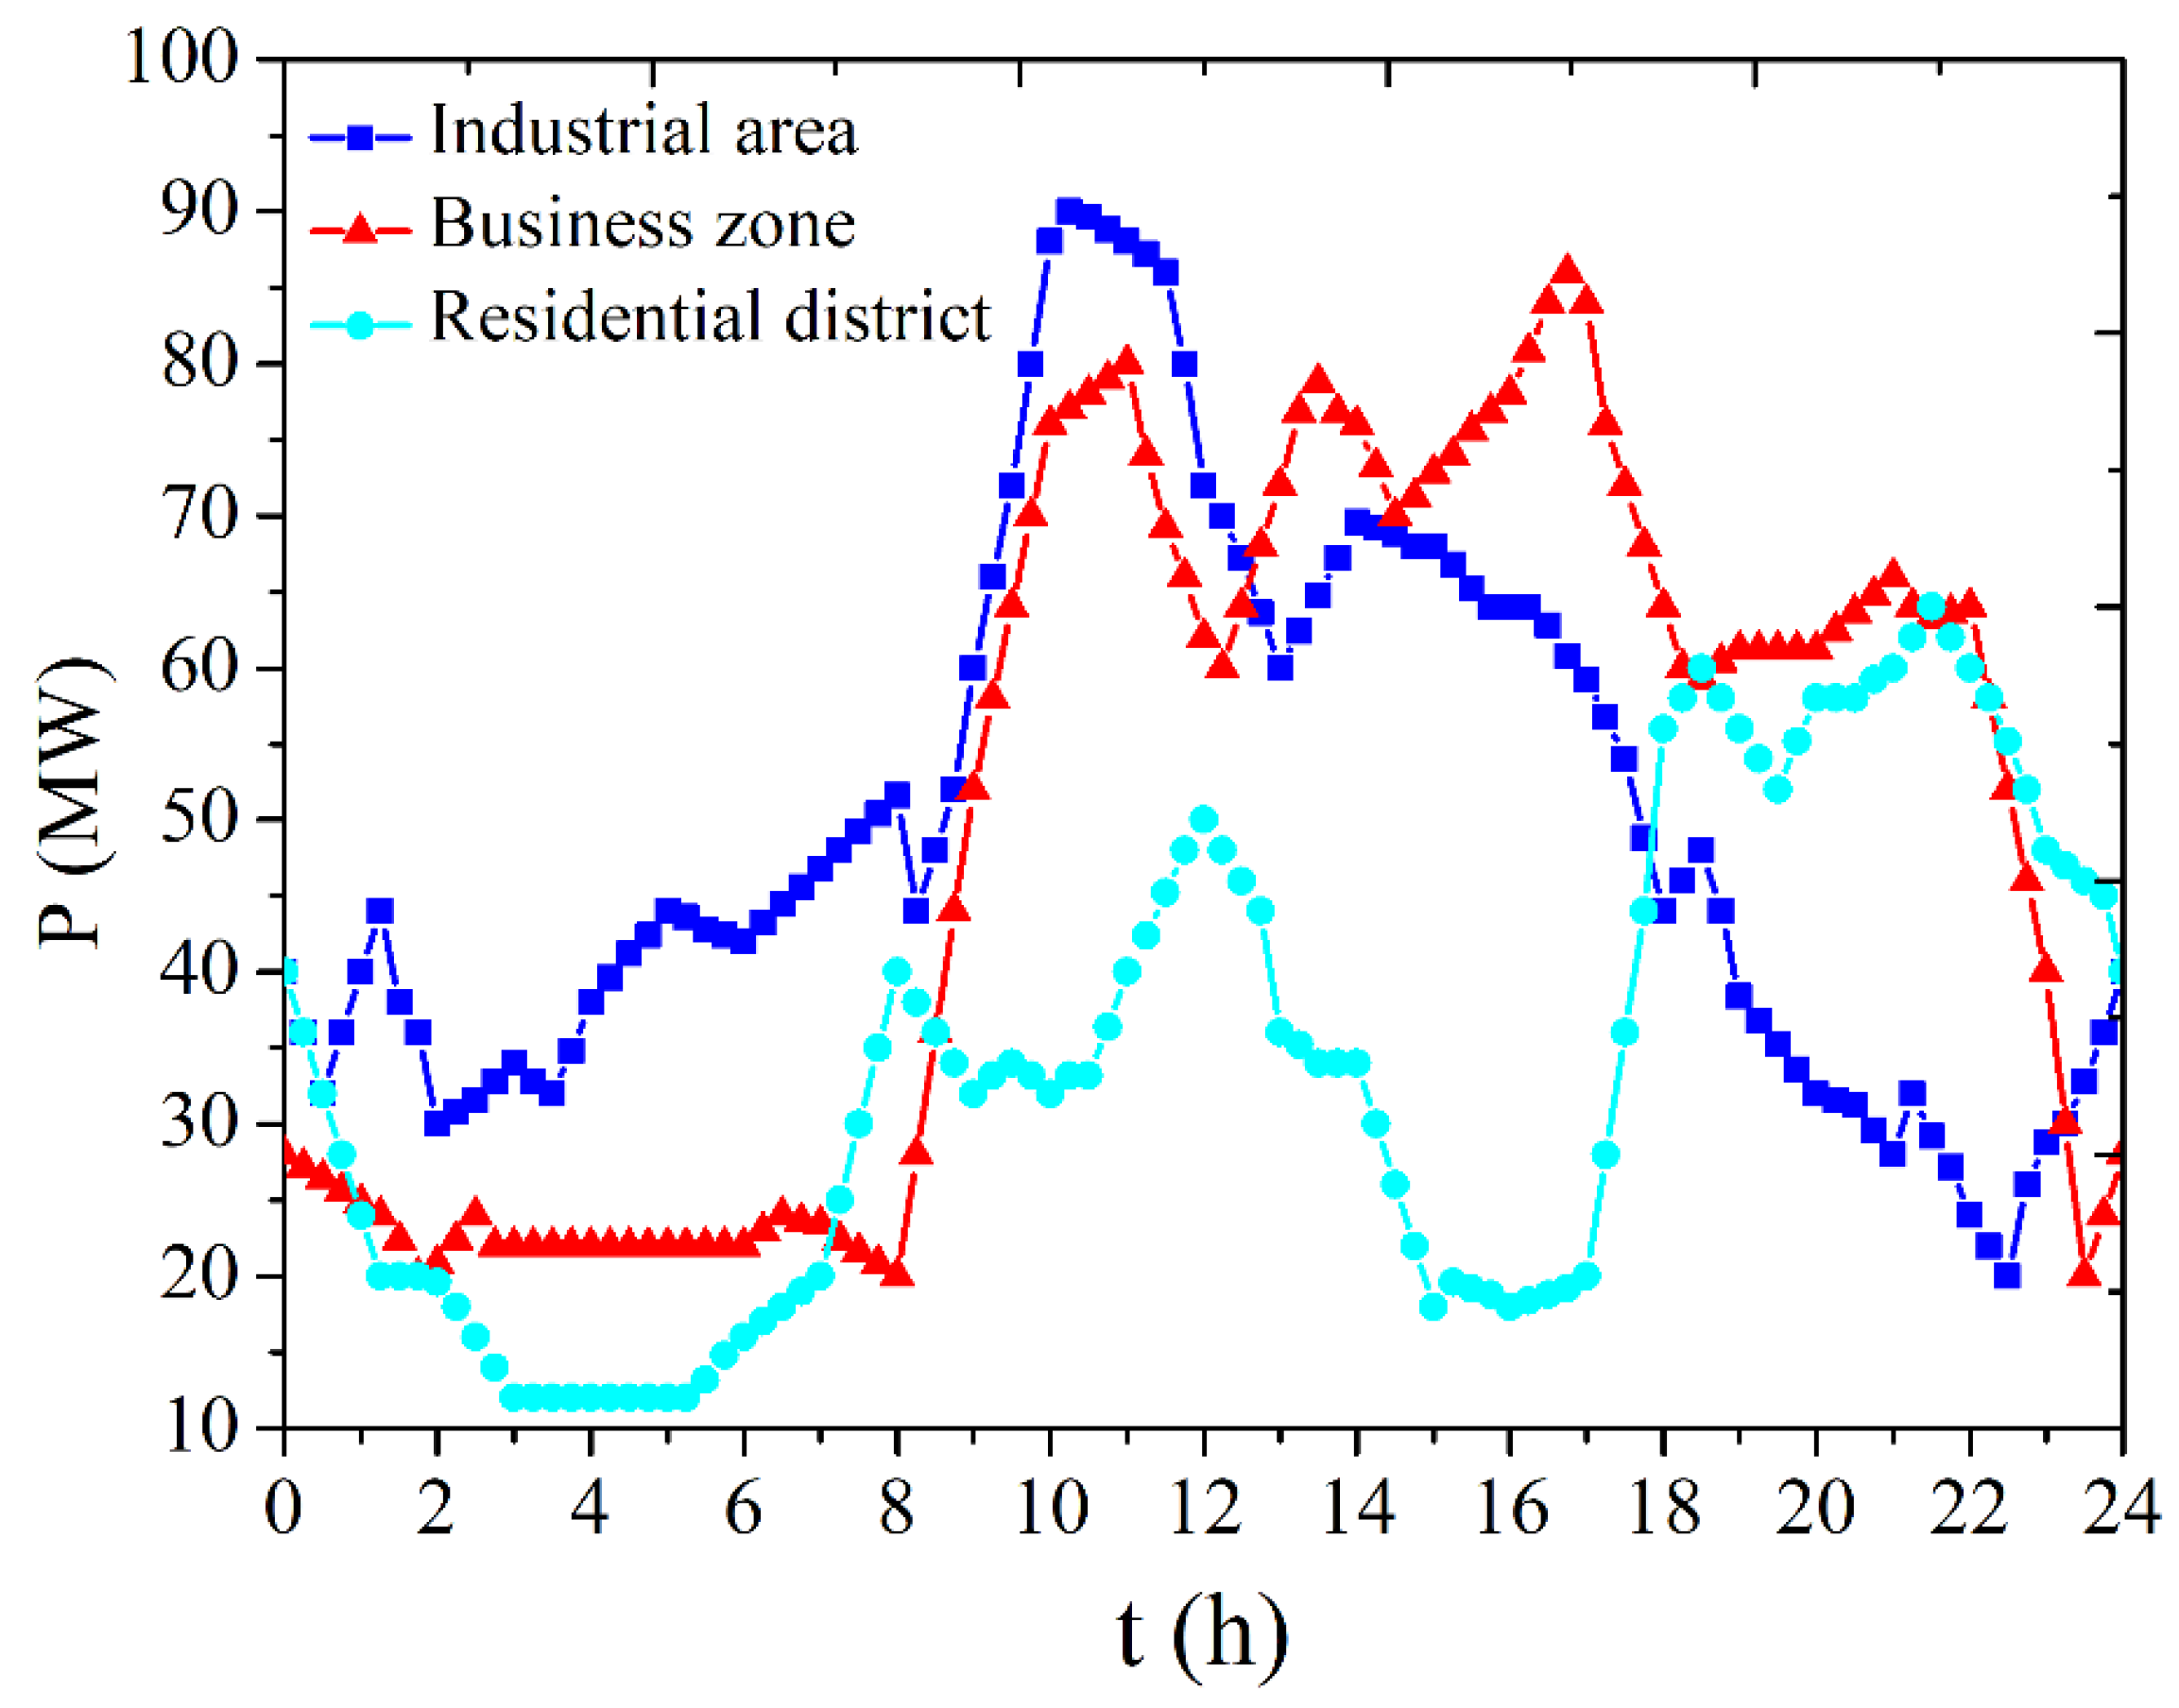
The network, based on the daily measurement of the load curve, is split into three zones: industrial area, business zone and residential district [38] (Figure 2). In the industrial area, the active power is low at night, but high during the day. Notably, the active power rises sharply from 8:00 a.m. In the business zone, the active power is affected by the shop hours: it is low from 10:00 p.m. to 8:00 a.m., but dramatically increases after the shops open. In the residential district, the active power is low when people are out, but high at lunch time and in the evening.
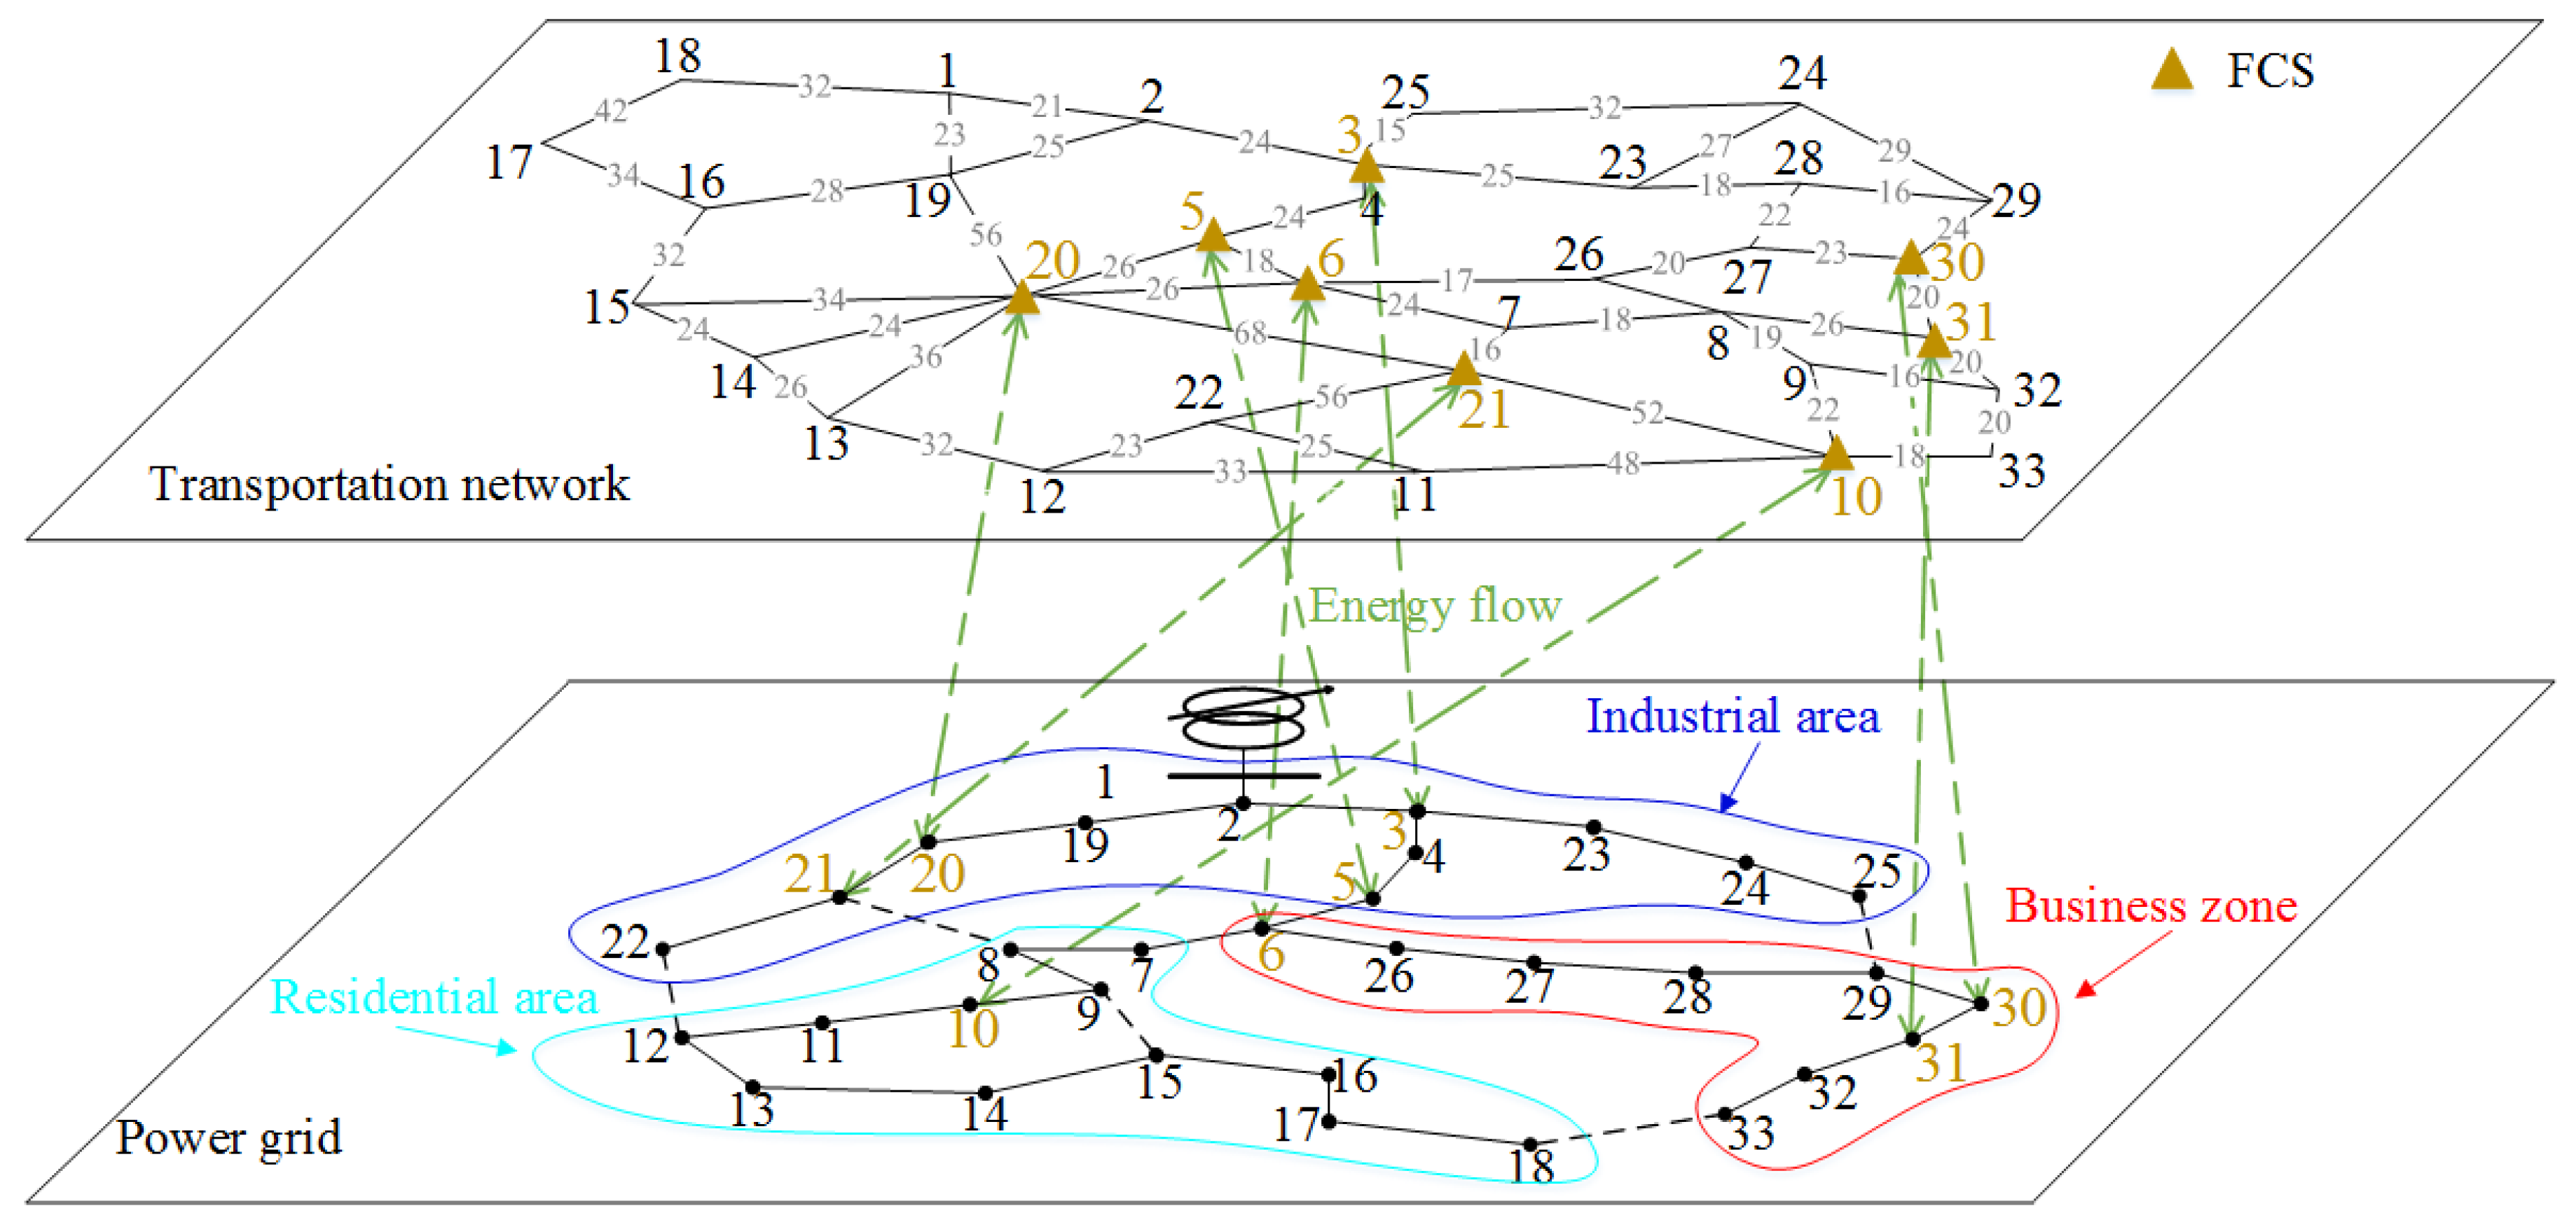
The networks can be represented by the complex network G, which is composed of nodes and edges. The power grid can be represented by a graph GE = [E(N), E(L)], where E(N) represents the set of buses and E(L) represents the set of branches. The transportation network can be abstractly represented by a graph GT = [T(N), T(L)], where T(N) represents the set of nodes and T(L) represents the set of links. We built the CTETNs using the IEEE 33-bus system as shown in Figure 3. The FCSs are the coupling points between the power grid and the transportation network. The energy can be exchanged between the EVs and the power grid when the EVs arrive at the FCS. As shown in the transportation network, the numerical value between two corresponding nodes represents the distance. For example, the distance between node 1 and node 2 is 21 km. The FCSs should be positioned where convenient for EVs. Eight nodes were used as the FCSs, denoted by [39].
4. Analysis of EV Behavior
4.1. OD Pair Strategy of EVs
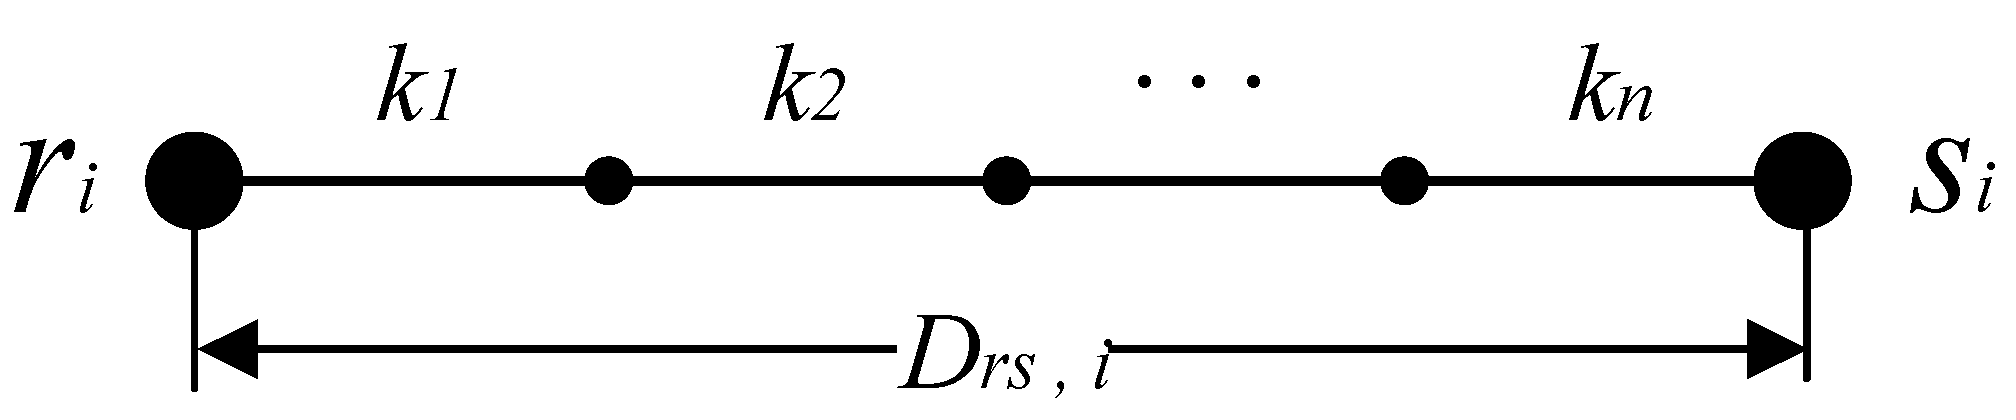
A vehicle driver leaves the origin to the destination and the routing choices of each EV are named an OD pair [40]. Drivers are assumed to be selfish so they tend to travel through the shortest path. Let T(R) and T(S) be the sets of origin nodes and destination nodes. As shown in Figure 4, each OD pair r-s is connected by a set of paths, which are denoted by Krs, , [22]. The length of road ki, , is denoted by dk,i. Thus, the length of an OD pair is defined as the distance from the origin to the destination, and is denoted by Drs as follows:
Four typical EV models were chosen from Table 1: public bus, private car, taxi, and commercial car [41]. The BYD K9 is the public bus model, setting out randomly from the industrial area, business zone, and residential district; 50% of BYD e6 is the private car model, setting out from the residential district; 50% of BYD e6 is the taxi model, setting out from somewhere randomly; and Tesla model S is the commercial car model, setting out from the business zone. The EVs were randomly driven somewhere as destinations to form the OD pairs. Tf is the time for fast-charging and Tr means the time for regular-charging. Considering the charging efficiency, BYD K9 was only charged 50% at the FCS for 0.5 h; BYD e6 was charged 80% at FCSs for 0.25 h; and the Tesla model S was charged 100% at the FCS for 1 h.
4.2. EV Charging Strategy
Currently, there are two charging approaches: fast-charging and regular-charging. Fast-charging means charging with high current and high power [42], typically requiring less than two hours’ charging to provide sufficient energy for emergencies. Regular-charging refers requires more time to charge with low current, which can prolong the battery life. In addition, to extend the possible range of commutes and eliminate range anxiety for the next trip, an EV uses regular-charging when it arrives at the destination. We define MI as the mileage range of the EV. For each EV, if Drs > MI, it needs fast-charging, and an FCS with the shortest travel path is chosen. Otherwise, if Drs < MI, the EV does not need fast-charging. Notably, when the EVi is traveling, by comparing its OD path with the travel path, the road location of the EVi can be determined at time t.
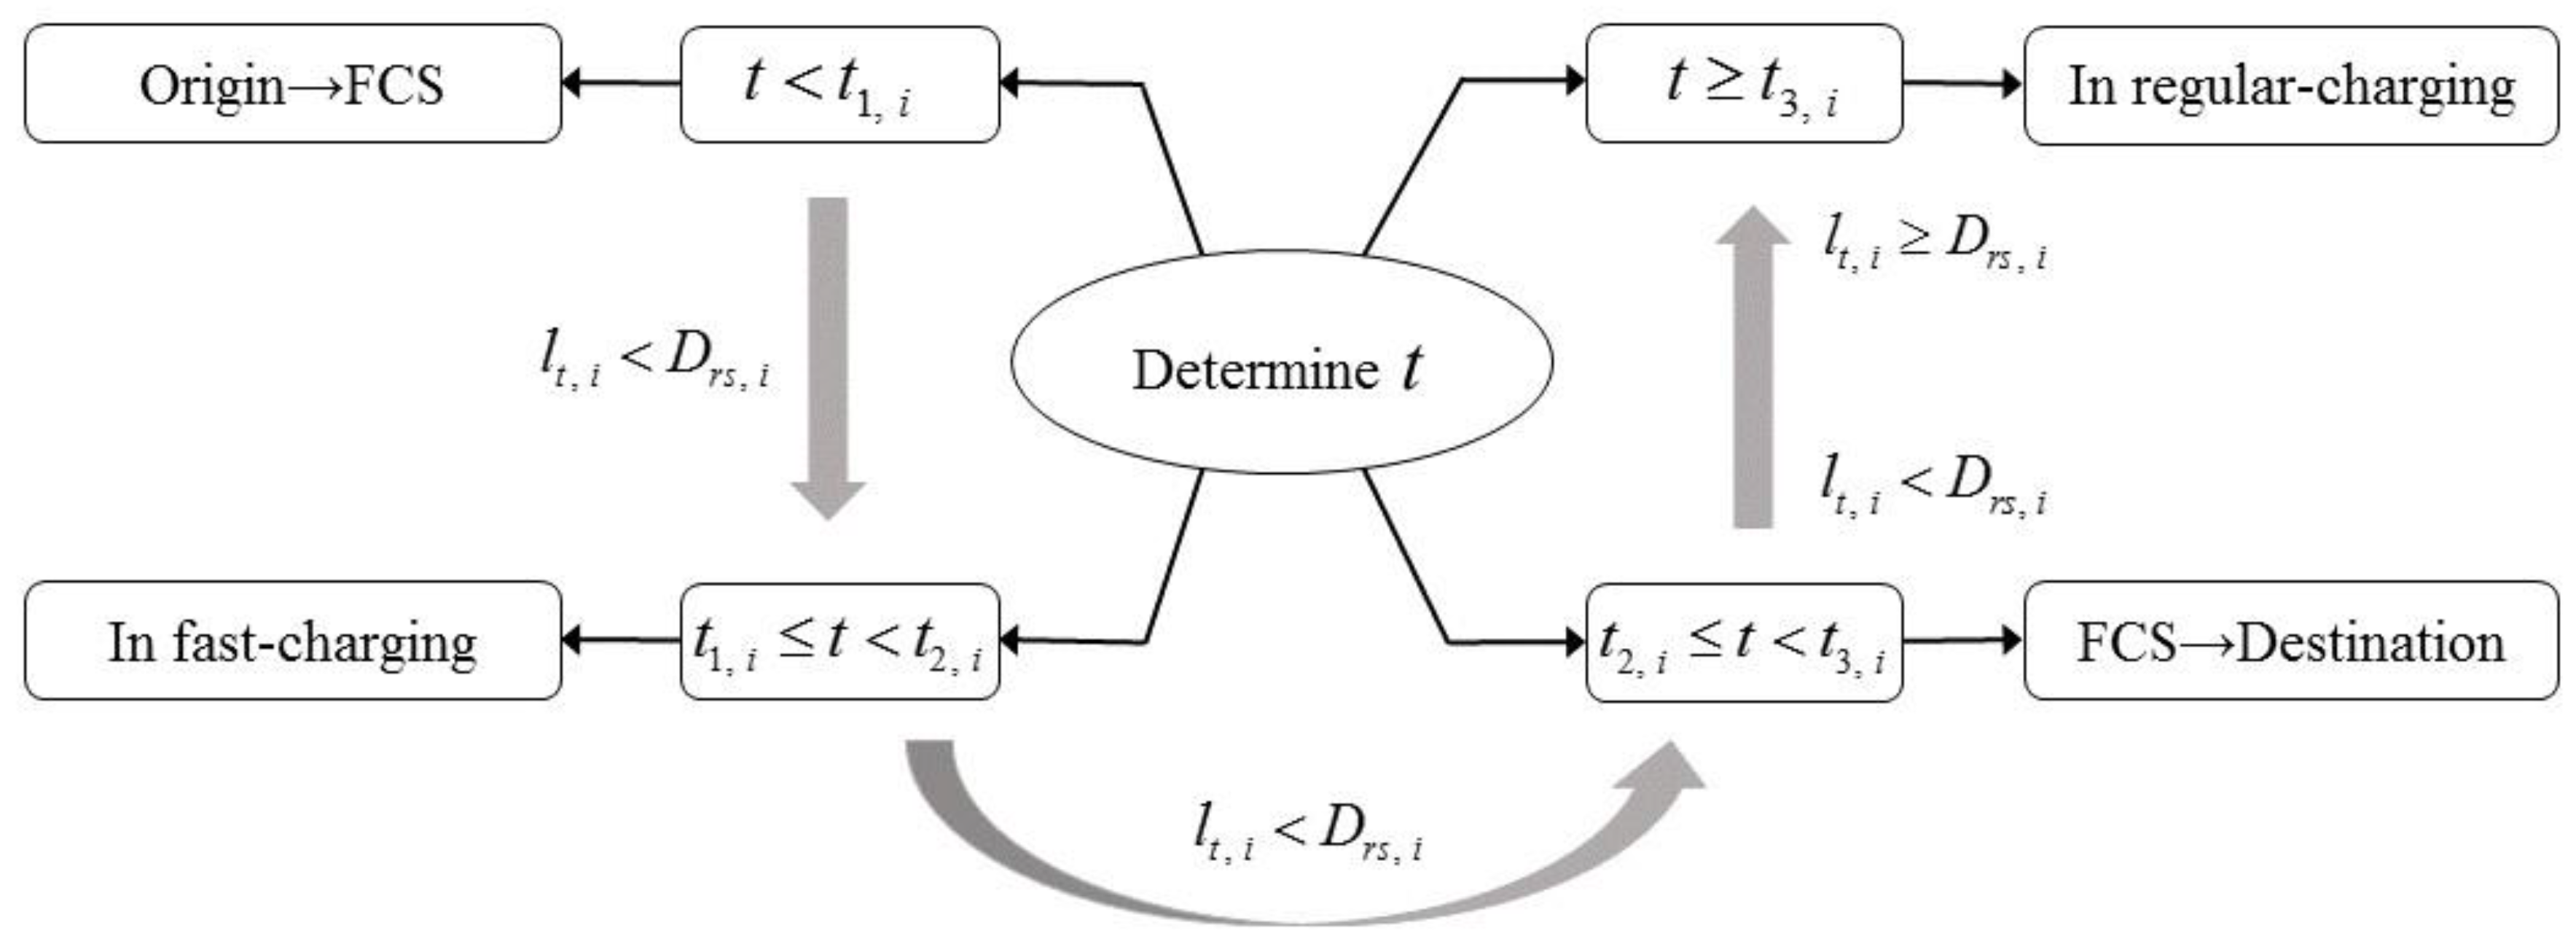
For every fast-charging EVi, its travel time is divided as follows:
where v is 30 km/h in this paper for simplification, d1,i represents the distance from the origin to the FCS, t1,i represents the time from the origin to the FCS, tf,i represents the time required for fast-charging, t2,i represents the time from the origin to finishing fast-charging, d2,i represents the distance from the FCS to the destination, and t3,i represents the time from the origin to the destination.
At time t, the travel path is defined as the multiplication of speed and time, which is denoted by lt,i as follows:
The detailed process is described in Figure 5. For every regular-charging EVi, if lt,i < Drs,i, EVi is in the process of driving; otherwise, the EV has already arrived at the destination and is in regular-charging mode. Drs,i represents the distance of EVi from the origin to destination. Similarly, for the fast-charging EVs, when the vehicle is driving, its location at time t can be determined. If t < t1,i, the EVi is driving from the origin to the FCS. If t1,i < t < t2,i, the EVi is in fast-charging mode. If t2,i < t < t3,i, the EVi is driving from the FCS to the destination. If t > t3,i, the EVi has already arrived at the destination and is in regular-charging mode.
5. Case Study
For the case study, 10,000 EVs were used, including BYD K9, BYD e6, and Tesla model S. For each EV, if it drove from the origin at 8:00 a.m., it would arrive at the destination before 2:00 p.m., so the time scale ranged from 8:00 a.m. to 2:00 p.m. The time interval used was 15 min, for a total of 24 time intervals per day, i.e., the first time interval was 8:00–8:15 a.m., the second time interval was 8:15–8:30 a.m., and so on, until the 24th time interval from 1:45 to 2:00 p.m.
When the EV formed the OD pair, the drive route was determined, and the spatial and temporal distribution characteristics of EV were also determined. Thus, the difference in the OD pair lead to a difference in the results. For the accuracy of the simulation results, we supposed that each EV forms 100 OD pairs. The simulation was performed 100 times and the results were averaged. Furthermore, to simplify the simulation, we assumed that the capacity of power grid was large enough to hold the charging EVs.
5.1. Attack Strategy
The EVs formed the OD pair according to the proposed method, and the route of every EV was determined according to the shortest path algorithm. Then, the number of EVs passing through each road was calculated. This paper defines the traffic flow from the macro level, and this number was set to the flow level. The road (6, 26), as shown in Figure 3, with the maximum traffic flow, was assumed to be the initial road-block in the simulation. Due to the road-block, the Krs,i of each EV was updated. The load fluctuation and the traffic condition at every time interval would also be different.
5.2. Impacts on Power Grids
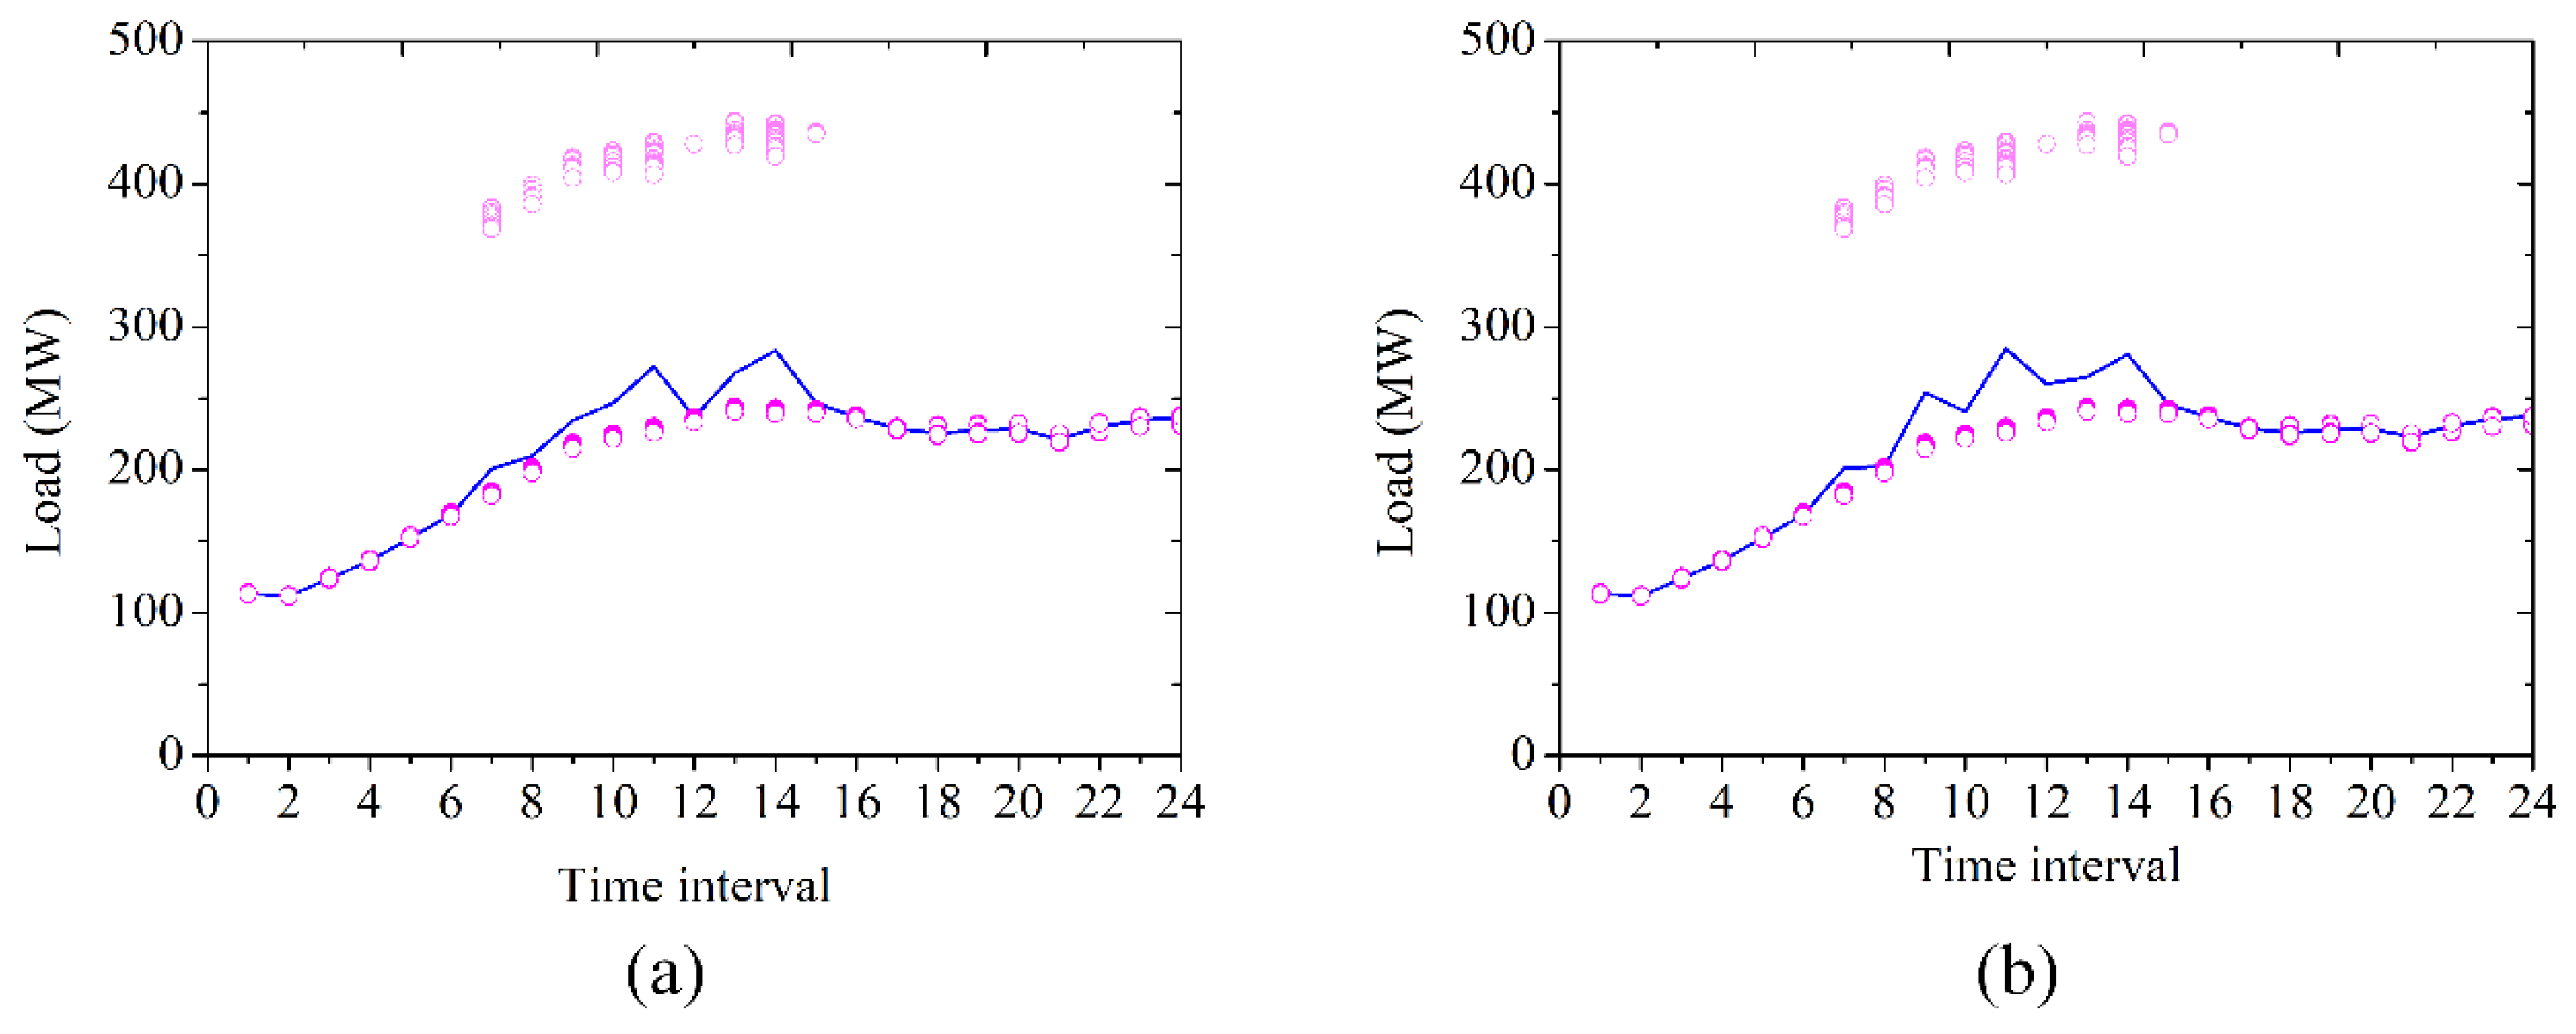
The load characteristics of the power grid are illustrated in Figure 6. The dots represent the 100 simulation results and the line represents the average value. Two peak-load spots without road-block are visible, appearing at the 11th and 14th time intervals, with loads of 272.13 and 283.42 MW, respectively. However, three peak-load spots with road-block are present, appearing at the 9th, 11th and 14th time intervals, with peak-load demands of 253.99, 284.80 and 281.00 MW, respectively. Obviously, a new peak-load spot emerged due to the road-block.
The EVs started regular-charging once arrived at the destination, which resulted in increasing load. When a large number of EVs pour into the FCSs, EVs need fast-charging, resulting in a sharp increase in the load and emerging peak-load spots. Furthermore, with road-block, the peak-load spot in the 11th time interval increased with more fast-charging EVs, and the peak-load spot in the 14th time interval remained almost unchanged.
The ninth time interval, where a new peak-load spot emerged, was used as an example to analyze the impacts on the power grid. For example, consider EVa with MI = 120, r = 14, s = 30, and r-s = (14, 30). Initially, Krs = {(14, 20), (20, 6), (6, 26), (26, 27), (27, 30)}, Drs = 110 km, thus Drs < MI. However, the set of paths through the OD pair changed under road-block to K’rs = {(14, 20), (20, 6), (6, 7), (7, 8), (8, 26), (26, 27), and (27, 30)}, D’rs = 135 km, thus D’rs > MI. Due to the increased Drs, the EVa needed fast-charging at the #6 FCS (at Bus 6).
As another example, EVb already needed to go to the #5 FCS at the 14th time interval without road-block. However, the EV chose the #6 FCS for fast-charging at the ninth time interval for the shortest path under road-block. Thus, the electricity load at the 14th time interval was transferred to the ninth time interval. Besides, at the ninth time interval, the electricity load increased by about 45.79% due to the road-block, which caused the peak-load spot. Similarly, at the 11th time interval, the electricity load increased by about 29.96%, which led to the sharp load increase. However, at the 14th time interval, the electricity load only increased by 5.7%, which was transferred out to other time intervals.
5.3. Impacts on FCSs
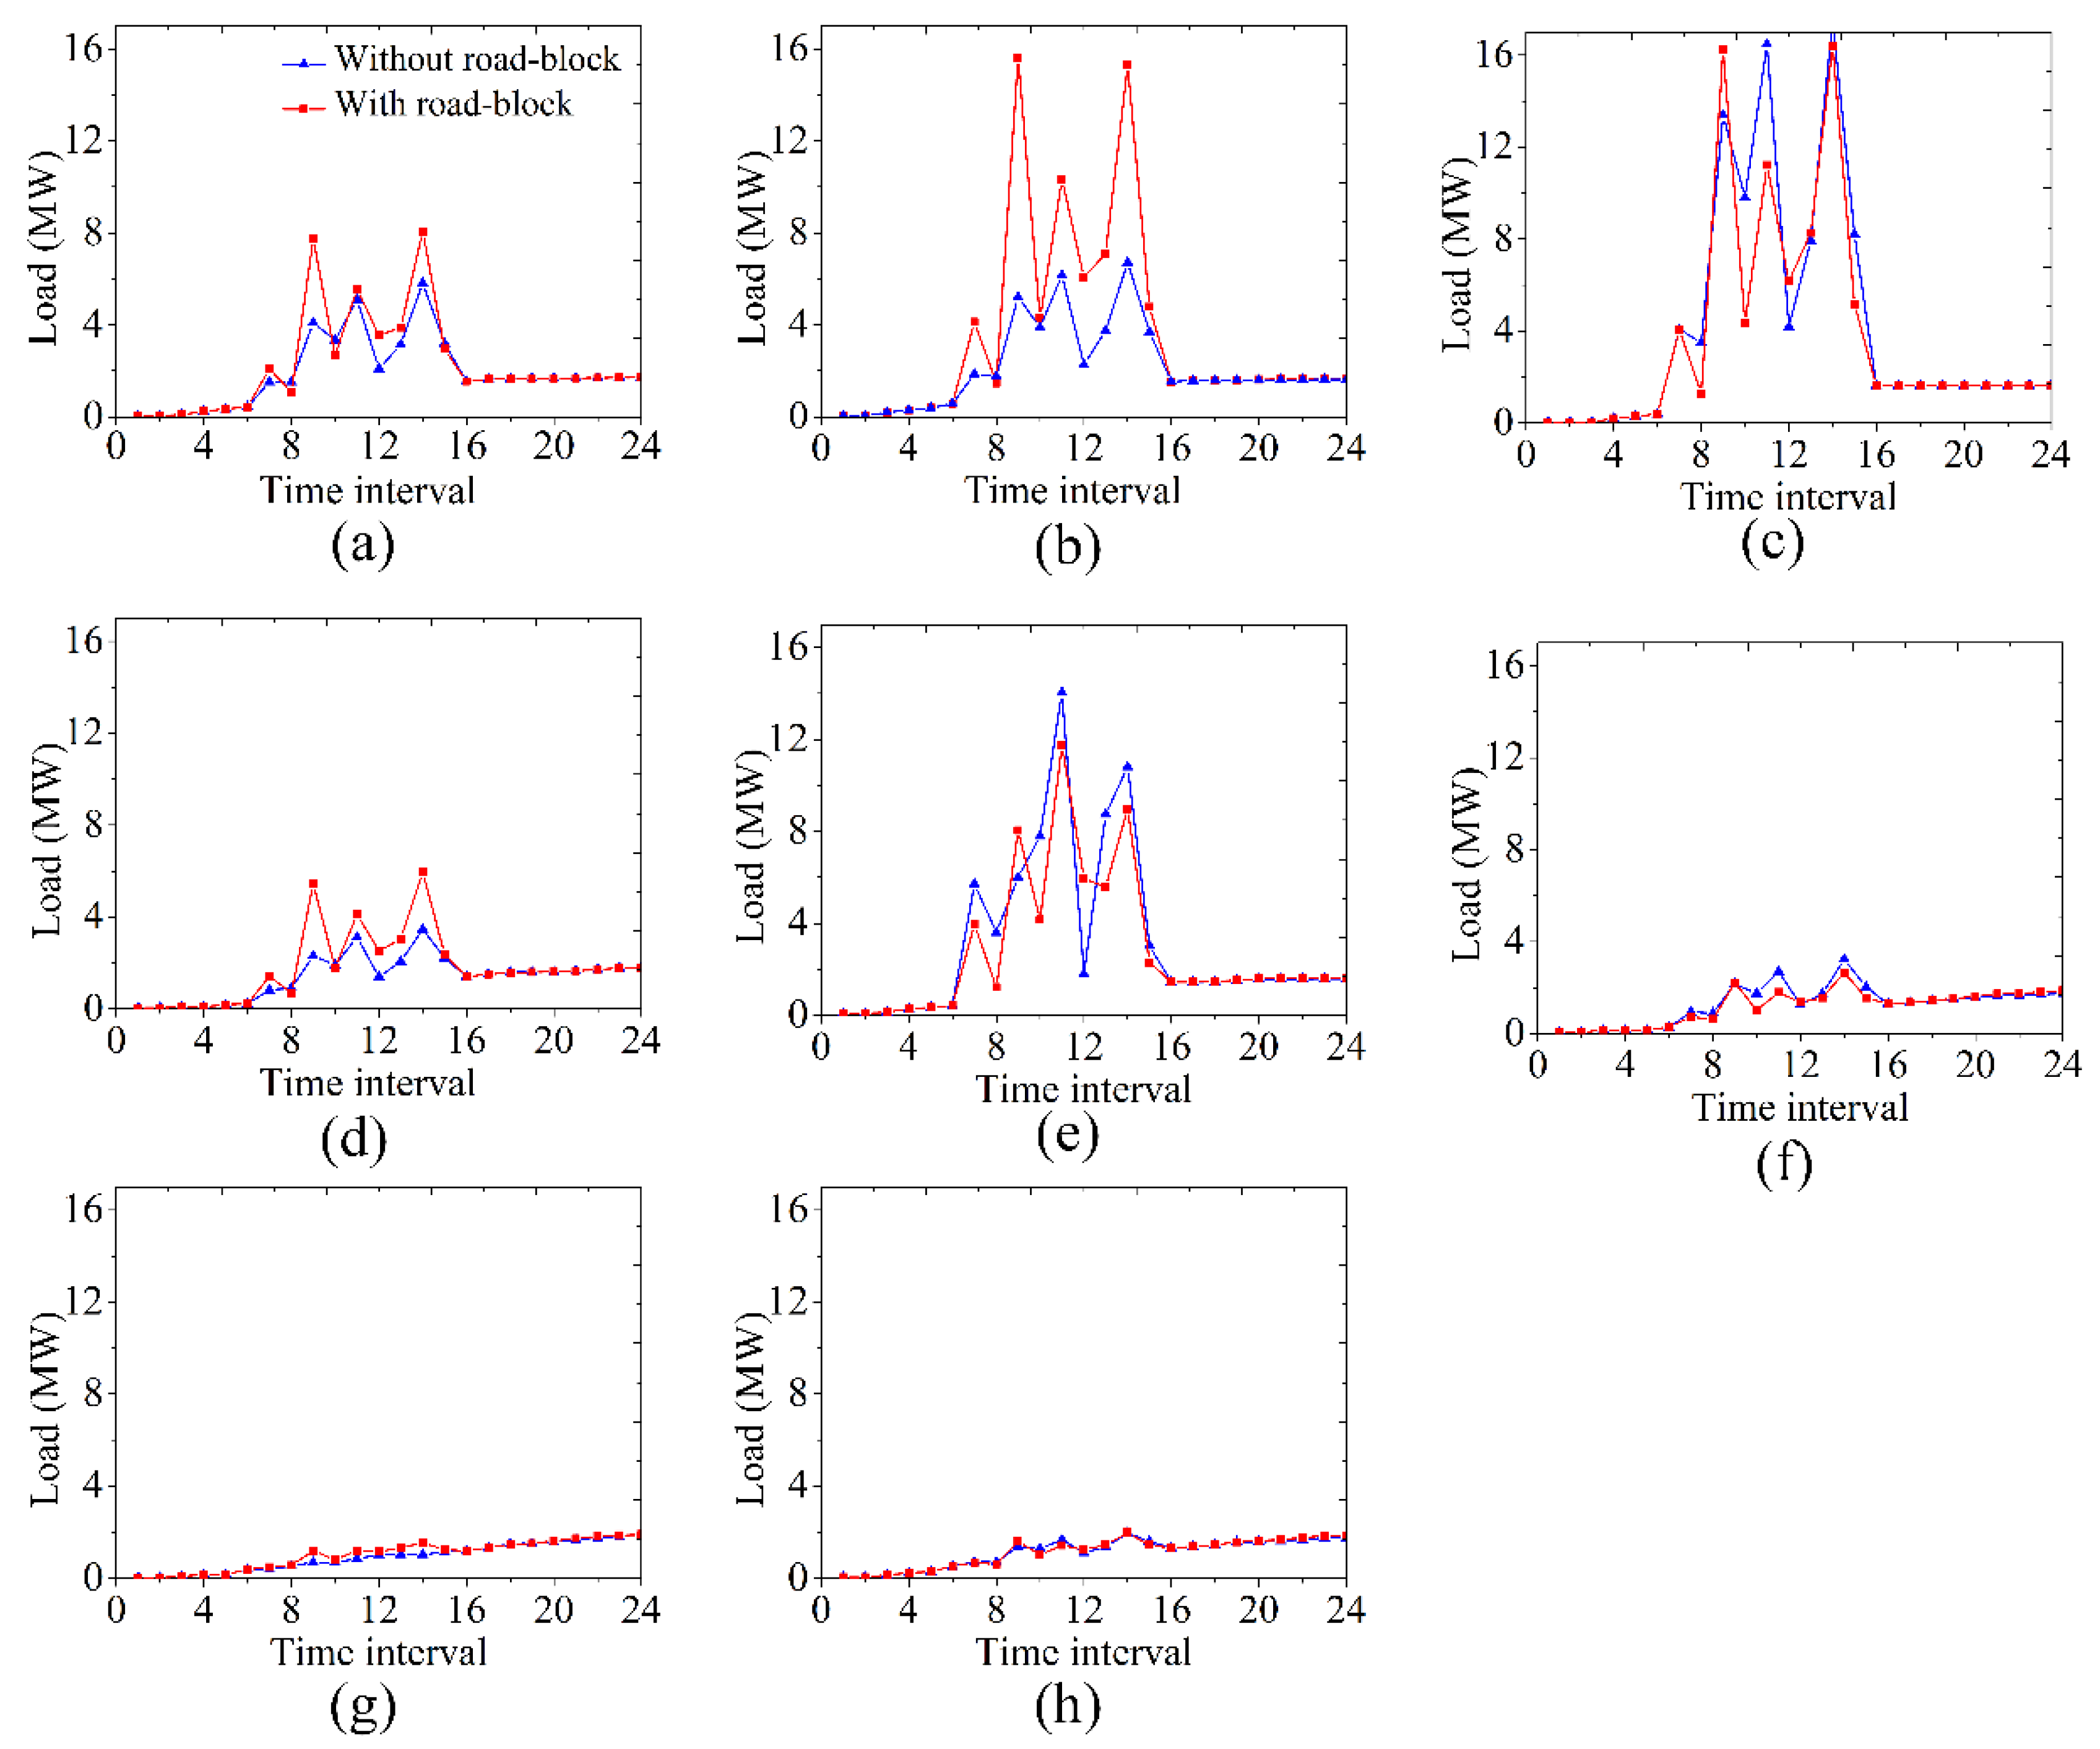
The number of fast-charging EVs was initially about 1045 and increased to around 1458 with road-block. The load characteristics of FCSs were also different, as shown in Figure 7. The blue line represents the increased load without road-block and the red line represents the increased load with road-block. The load of the #6 FCS around the road-block increased sharply, and the load of #5 and #21 FCS in the middle of transportation network also increased. However, the load characteristics of the FCSs at the margin of the transportation network barely increased.
Comparing the increased electricity load of FCS at every time interval, we obtained the following conclusion: the demand at an FCS around the road-block was more strongly influenced. Especially at the ninth time interval, the load of #6 FCS increased to 15.62 MW with the road-block, whereas the load was 6.17 MW without the road-block. However, the demand at the FCSs at the margin of transportation network barely increased.
5.4. Impacts on Transportation Networks
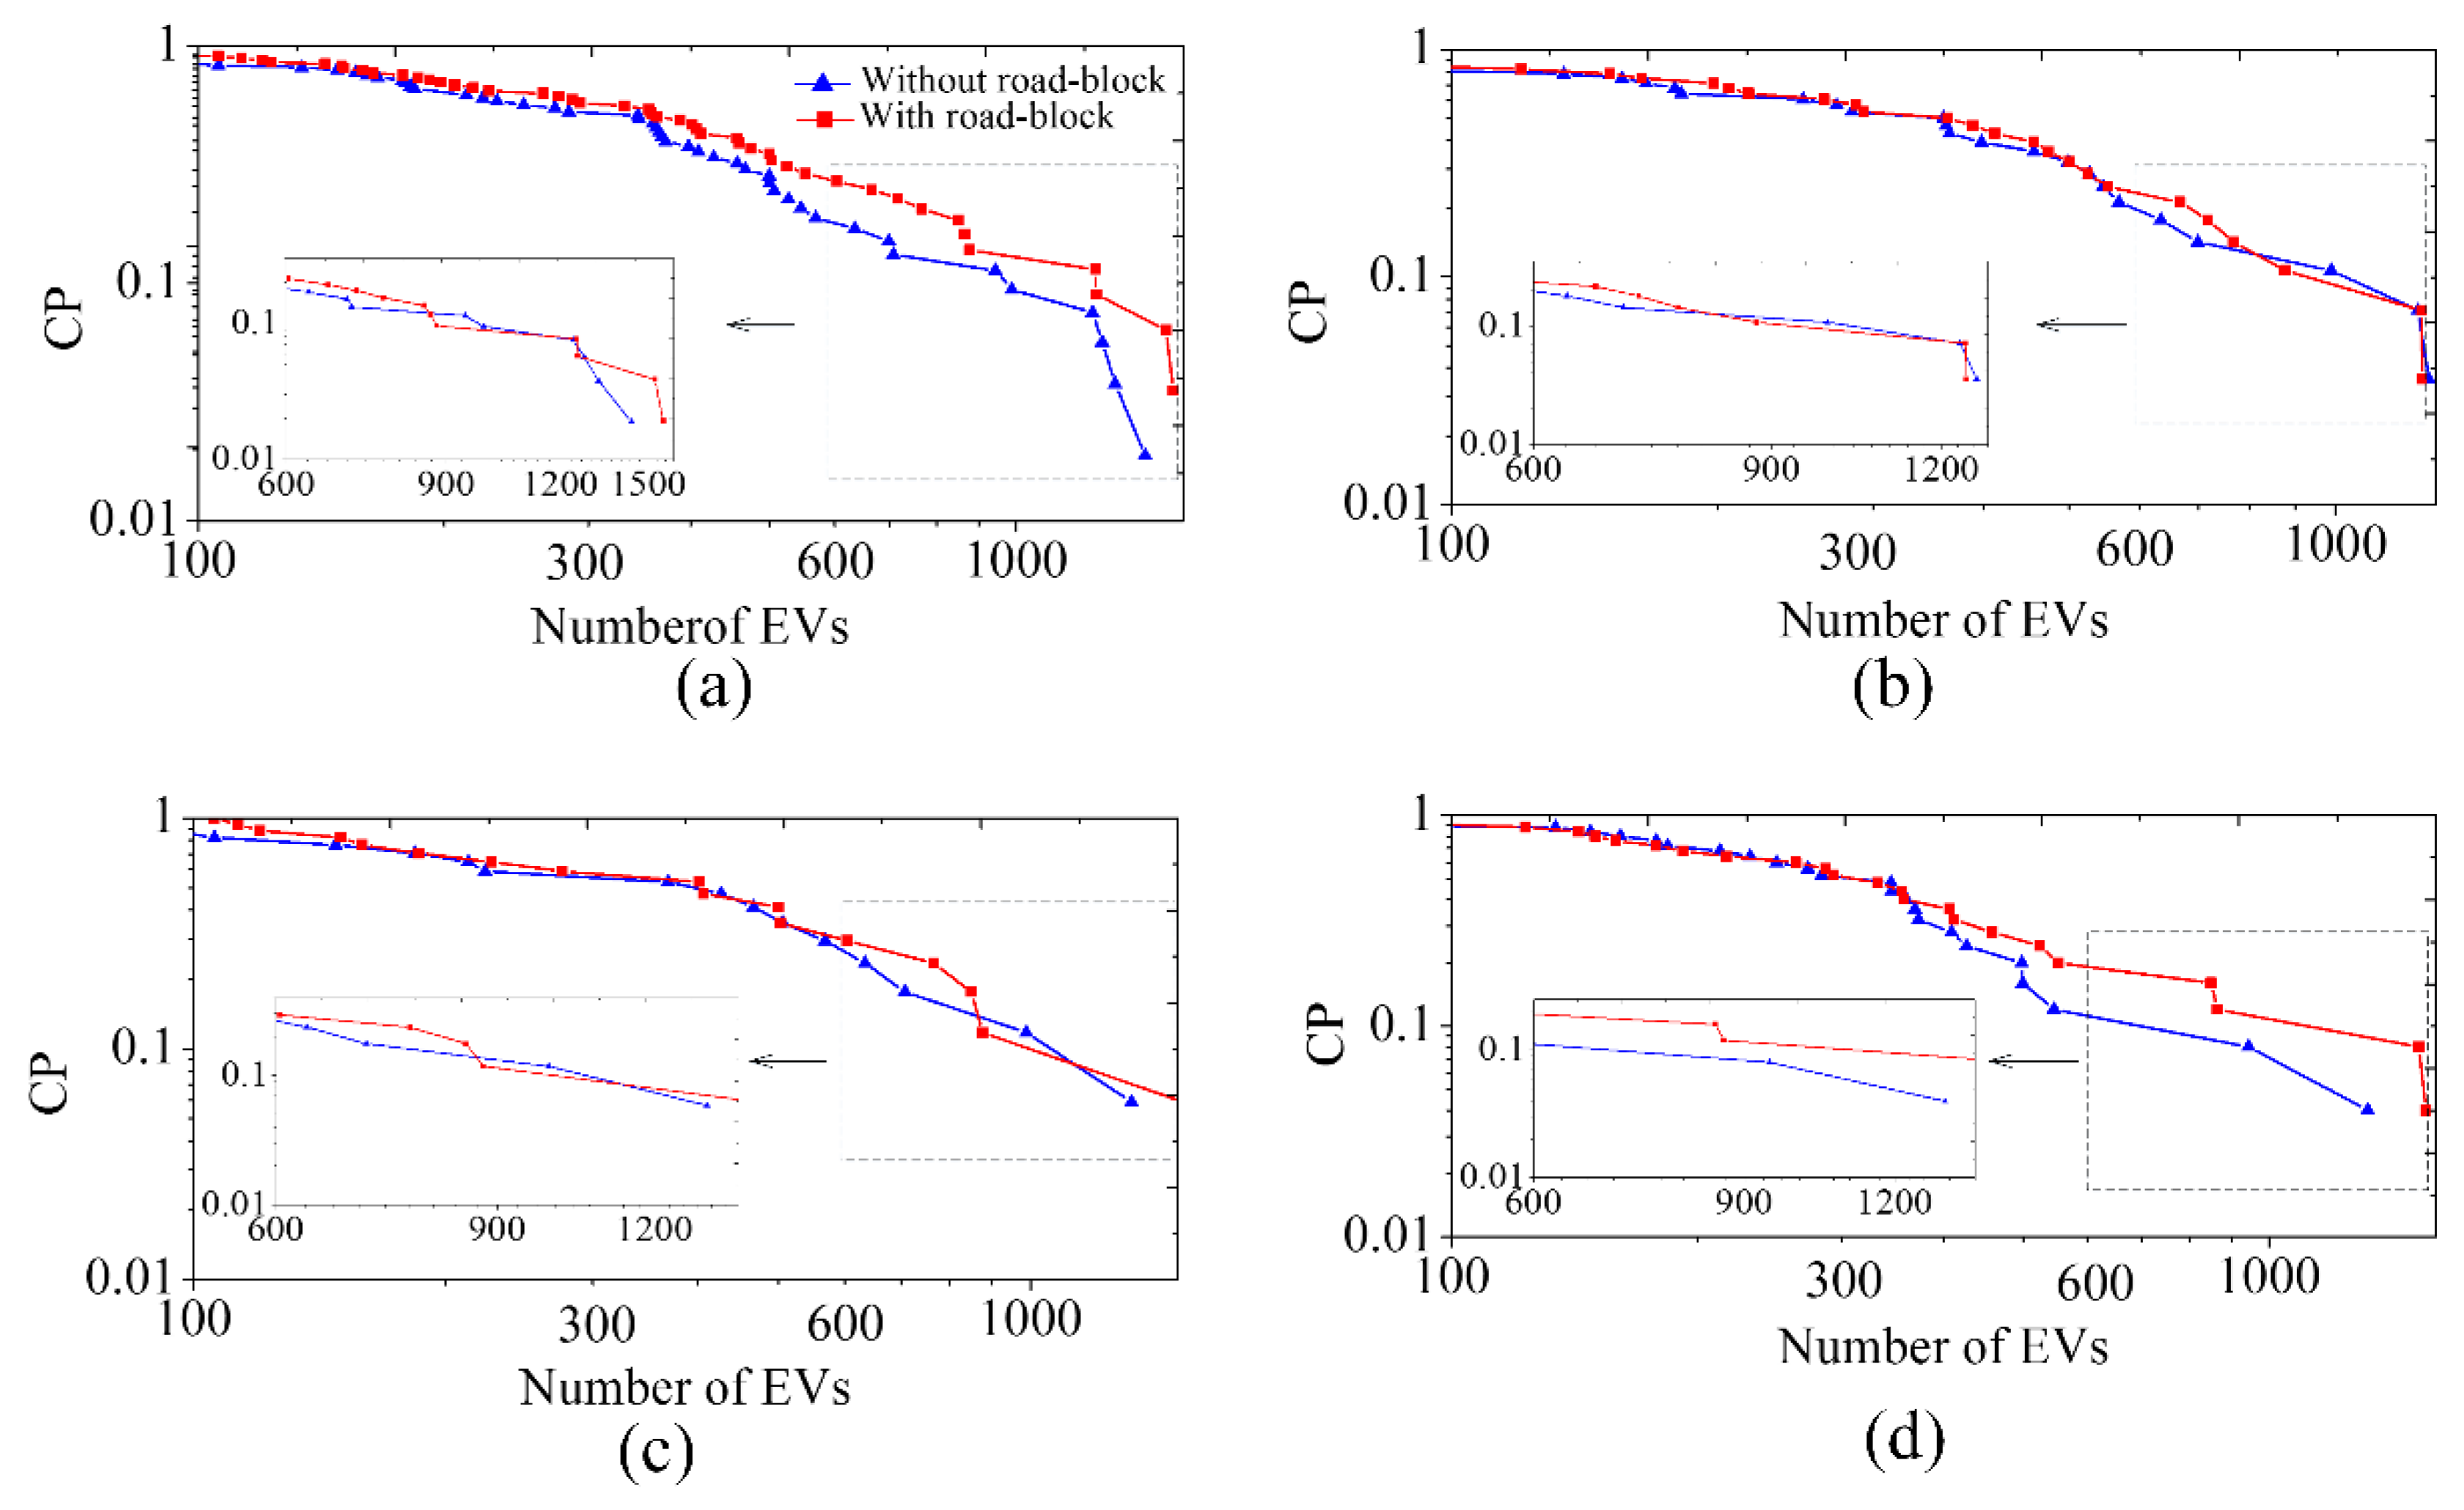
Figure 8 shows the power tail of the road traffic condition in the transportation network. The OD pairs of the EVs were determined, so the number of EVs passing through each road were also determined. By viewing these numbers as an array, the numbers were sorted, and then the cumulative probability (CP) of the EVs on the road was calculated. Additionally, the travel routing would be different once the road-block occurred. Thus, by comparing the cumulative distribution function (CDF) of EVs, the change in congestion situation with road-block could be reflected to some degree.
In Figure 8, the blue line represents the traffic condition without road-block and the red line represents the traffic condition with road-block. To highlight the difference, the subgraph depicts the CDF of EVs from 600 EVs. In Figure 8a, the blue line and red line are close to each other, almost overlapping, which demonstrates that the road traffic condition only changed a little with road-block in the transportation networks. In Figure 8b,c, as with Figure 8a, the blue line and the red line almost overlap, showing that the traffic flow barely changed in the industrial area and business zone. In Figure 8d, the blue line and red line are far from each other from 400, demonstrating that the residential district was considerably influenced due to of the road block (6, 26).
In general, the more consistent the red and blue lines, the more alike the traffic conditions. Otherwise, there was a greater transfer of vehicle flow with road-block. The overall road traffic condition of the entire transportation network barely changed, but the residential district was affected.
The EVs, initially planning to drive on road (6, 26), instead drove through the local roads when the maximum vehicle flow road was blocked, i.e., (6, 26). From Figure 2, node 6 was adjacent to node 7, and node 26 was adjacent to node 8, so road (7, 8) was the most likely choice, and we defined road (7, 8) as a “neighboring-road”. Such phenomenon can be explained by local-world dynamics. In the local world, the internal relationship is very close, and a relatively weak connection still exists between the local area and outside, which is consistent with the law of communication [43]. Therefore, some EVs chose a detour and preferred to transfer to the local area. Finally, the transportation systems would capture the localization effect of the vehicle flow during the evolutions.
6. Conclusions
The interactions between the power grid and transportation network are becoming closer due to the popularization of EVs. Furthermore, EVs behavior, including routing choice and charging strategy, make the interactions increasingly complex. Thus, we proposed a new framework with four domains to explore the interactions of CTETNs. In this paper, the topology of CTETNs based on the IEEE 33-bus system was used as the test system. Considering the OD pair strategy, charging strategy, and attack strategy modeled on vehicle flow and power flow, a new method and its simulation model provided more realistic results compared with the previous studies in this area. The method can be used to model the spatial and temporal distribution characteristics of EVs for CTETNs impact analysis, providing more accurate evaluation results. Under road-block, a new peak-load spot in the power grid suddenly emerged at the ninth time interval. However, in the transportation network, the vehicle flow drastically changed in the residential district by transferring to local roads, especially to the neighboring roads.
To simplify the simulation, we assumed that the capacity of the power grid and FCSs were large enough to hold the charging EVs. However, in reality, the capacity is usually limited. Future work should improve upon the proposed method for real life application, considering the queuing time of the fast-changing EVs and potential for localised overloads, which could provide suggestions for the operation of the CTETNs and measure the validity of the FCSs.
Author Contributions
X.Y. and Y.L. conceived and designed the experiments; X.Y. performed the experiments; Y.C. (Ye Cai) and Z.J. analyzed the data; Y.C. (Yijia Cao) and K.Y.L. contributed reagents/materials/analysis tools; Xian Yang wrote the paper.
Acknowledgments
This work was supported in part by the National Natural Science Foundation of China (NSFC) under Grant 51607011 and 51520105011, and in part by the Key S&T Special Project of Hunan Province of China under Grant 2015GK1002.
Conflicts of Interest
The authors declare no conflicts of interest.
References
- Farid, M.A. Symmetrica: Test case for transportation electrification research. Infrastruct. Complex. 2015, 2, 1–10. [Google Scholar] [CrossRef]
- Falahati, B.; Fu, Y.; Darabi, Z. Reliability assessment of power systems considering the large-scale PHEV integration. In Proceedings of the Vehicle Power and Propulsion Conference (VPPC), Chicago, IL, USA, 6–9 September 2011. [Google Scholar]
- Green, R.C.; Wang, L.; Alam, M. Evaluating the impact of plug-in hybrid electric vehicles on composite power system reliability. In Proceedings of the North American Power Symposium (NAPS), Boston, MA, USA, 4–6 August 2011. [Google Scholar]
- Hou, K.; Xu, X.D.; Jia, H.J.; Yu, X.D.; Jiang, T.; Zhang, K.; Shu, B. A reliability assessment approach for integrated transportation and electrical power systems incorporating electric vehicles. IEEE Trans. Smart Grid 2018, 9, 88–100. [Google Scholar] [CrossRef]
- Hannan, M.A.; Hoque, M.M.; Mohamed, A.; Ayob, A. Review of energy storage systems for electric vehicle applications: Issues and challenges. Renew. Sustain. Energy Rev. 2017, 69, 771–789. [Google Scholar] [CrossRef]
- Tang, L.; Rizzoni, G.; Cordoba-Arenas, A. Battery life extending charging strategy for plug-in hybrid electric vehicles and battery electric vehicles. IFAC-PapersOnLine 2016, 49, 70–76. [Google Scholar] [CrossRef]
- Fallah, Y.P.; Khandani, M.K. Context and network aware communication strategies for connected vehicle safety applications. IEEE Intell. Transp. Syst. Mag. 2016, 8, 92–101. [Google Scholar] [CrossRef]
- Wirasingha, S.G.; Emdai, A. Classification and review of control strategies for plug-in hybrid electric vehicles. IEEE Trans. Veh. Technol. 2011, 60, 111–122. [Google Scholar] [CrossRef]
- Lopes, J.A.P.; Soares, F.; Almeida, P.M.R. Integration of electric vehicles in the electric power systems. Proc. IEEE 2011, 99, 168–183. [Google Scholar] [CrossRef]
- Verzijlbergh, R.A.; Grond, M.O.W.; Lukszo, Z.; Slootweg, J.G.; Ilic, M.D. Network impacts and cost savings of controlled EV charging. IEEE Trans. Smart Grid 2012, 3, 1203–1212. [Google Scholar] [CrossRef]
- Wang, Z.; Yang, R.; Wang, L.; Tan, J. Reliability assessment of integrated residential distribution and PHEV systems using Monte Carlo simulation. In Proceedings of the IEEE Power and Energy Society (PES) General Meeting, Vancouver, BC, Canada, 21–25 July 2013. [Google Scholar]
- Xiong, Y.; Jayaweera, D. Reliability based strategic integration of plug-in hybrid electric vehicles in power systems. In Proceedings of the IEEE Probabilistic Methods Applied to Power System (PMAPS), Durham, UK, 7–10 July 2014. [Google Scholar]
- Monteiro, V.; Carmo, J.P.; Pinto, J.G.; Afonso, J.L. A flexible infrastructure for dynamic power control of electric vehicle battery chargers. IEEE. Trans. Veh. Technol. 2016, 65, 4535–4547. [Google Scholar] [CrossRef]
- Green, R.C., II; Wang, L.; Alam, M. The impact of plug-in hybrid electric vehicles on distribution networks: A review and outlook. Renew. Sustain. Energy Rev. 2011, 15, 544–553. [Google Scholar] [CrossRef]
- Galus, M.D.; Fauci, R.L.; Andersson, G. Investigating PHEV wind balancing capabilities using heuristics and model predictive control. In Proceedings of the IEEE Power and Energy Society (PES) General Meeting, Providence, RI, USA, 25–29 July 2010. [Google Scholar]
- Saber, A.Y.; Venayagamoorthy, G.K. Plug-in vehicles and renewable energy sources for cost and emission reductions. IEEE Trans. Ind. Electron. 2011, 58, 1229–1238. [Google Scholar] [CrossRef]
- Gao, S.; Chau, K.T.; Liu, C.; Wu, D.; Chan, C.C. Integrated energy management of plug-in electric vehicles in power grid with renewables. IEEE Trans. Veh. Technol. 2014, 63, 3019–3027. [Google Scholar] [CrossRef]
- Kennel, F.; Görges, D.; Liu, S. Energy management for smart grids with electric vehicles based on hierarchical MPC. IEEE Trans. Ind. Inf. 2013, 9, 1528–1537. [Google Scholar] [CrossRef]
- Wu, Q.W.; Moller, J.G.; Ostergaard, J.; Nielsen, A.H. Policies and initiatives for carbon neutrality in Nordic heating and transport systems. J. Energy Power Eng. 2013, 7, 1745–1753. [Google Scholar]
- Li, C.B.; Cao, Y.J.; Zhang, M.; Wang, J.H.; Liu, J.G.; Shi, H.Q.; Geng, Y.H. Hidden benefits of electric vehicles for addressing climate change. Sci. Rep. 2015, 5, 9213. [Google Scholar] [CrossRef] [PubMed]
- Masayoshi, W. Research and development of electric vehicles for clean transportation. J. Environ. Sci. 2009, 21, 745–749. [Google Scholar]
- Jacopo, I.; Ginestra, B. Extracting information from multiplex networks. Chaos Interdiscip. J. Nonlinear Sci. 2016, 26. [Google Scholar] [CrossRef]
- Fienberg, S.E.; Meyer, M.M.; Wasserman, S.S. Statistical analysis of multiple sociometric relations. J. Am. Stat. Assoc. 1985, 80, 51–67. [Google Scholar] [CrossRef]
- Cai, Y.; Cao, Y.J.; Li, Y.; Huang, T.; Zhou, B. Cascading failure analysis considering interaction between power grids and communication networks. IEEE Trans. Smart Grid 2016, 7, 530–538. [Google Scholar] [CrossRef]
- Albert, S.; Sergio, G.; Alex, A. Congestion induced by the structure of multiplex networks. Phys. Rev. Lett. 2016, 116. [Google Scholar] [CrossRef]
- Cellai, D.; López, E.; Zhou, J.; Gleeson, J.P.; Bianconi, G. Percolation in multiplex networks with overlap. Phys. Rev. E 2013, 88. [Google Scholar] [CrossRef] [PubMed] [Green Version]
- Fan, W.L.; Liu, Z.G.; Hu, P.; Mei, S.W. Cascading failure model in power grids using the complex network theory. IET Gener. Trans. Distrib. 2016, 10, 3940–3949. [Google Scholar]
- Sorrentino, F.; Pecora, L.M.; Hagerstrom, A.M.; Murphy, T.E.; Roy, R. Complete characterization of the stability of cluster synchronization in complex dynamical networks. Sci. Adv. 2016, 2. [Google Scholar] [CrossRef] [PubMed]
- Wei, W.; Mei, S.W.; Wu, L.; Wang, J.H.; Fang, Y.J. Robust operation of distribution networks coupled with urban transportation infrastructures. IEEE Trans. Power Syst. 2017, 32, 2118–2130. [Google Scholar] [CrossRef]
- Dong, G.G.; Gao, J.X.; Du, R.J.; Tian, L.X.; Stanley, H.E.; Havlin, S. Robustness of network of networks under targeted attack. Phys. Rev. E 2013, 87. [Google Scholar] [CrossRef] [PubMed] [Green Version]
- Rueda, D.F.; Calle, E. Using interdependency matrices to mitigate targeted attacks on interdependent networks: A case study involving a power grid and backbone telecommunications networks. Int. J. Crit. Infrastruct. Prot. 2017, 16, 3–12. [Google Scholar] [CrossRef]
- Huang, X.Q.; Gao, J.X.; Buldyrev, S.B.; Havlin, S.; Stanley, H.E. Robustness of interdependent networks under targeted attack. Phys. Rev. E 2011, 83. [Google Scholar] [CrossRef] [PubMed] [Green Version]
- Wang, J.W.; Rong, L.L. Robustness of the western United States power grid under edge attack strategies due to cascading failures. Saf. Sci. 2011, 49, 807–812. [Google Scholar] [CrossRef]
- Wei, W.; Mei, S.W.; Wu, L.; Shahidehpour, M.; Fang, Y.J. Optimal traffic-power flow in urban electrified transportation networks. IEEE Trans. Smart Grid 2017, 8, 84–95. [Google Scholar] [CrossRef]
- Tsiropoulou, E.E.; Mitsis, G.; Papavassiliou, S. Interest-aware energy collection & resource management in machine to machine communications. Ad Hoc Netw. 2018, 68, 48–57. [Google Scholar]
- Tsiropoulou, E.E.; Paruchuri, S.T.; Baras, J.S. Interest, energy and physical-aware coalition formation and resource allocation in smart IoT applications. In Proceedings of the 51st Annual Conference on Information Sciences and Systems (CISS), Baltimore, MD, USA, 22–24 March 2017. [Google Scholar]
- Lin, C.R.; Gerla, M. Adaptive clustering for mobile wireless networks. IEEE J. Sel. Areas Commun. 1997, 15, 1265–1275. [Google Scholar] [CrossRef] [Green Version]
- Xu, G.J.; Liu, Y.S.; Li, T.Y.; Hu, X.Q.; Bao, Z.M.; Xiong, X.C.; Zhou, N.C. Study on the impact of electric vehicles charging load integrated into distribution network based on analytic hierarchy process and probabilistic simulation. Power Syst. Prot. Control 2012, 40, 38–45. [Google Scholar]
- Liu, B.L.; Huang, X.L.; Li, J.; Qian, X.; Chen, J. Multi-objective planning of distribution network containing distributed generation and electric vehicle charging stations. Power Syst. Technol. 2015, 39, 450–456. [Google Scholar]
- Beak, S.; Kim, H.; Lim, Y. Multiple-vehicle origin-destination matrix estimation from traffic counts using genetic algorithm. J. Transp. Eng. 2004, 130, 339–347. [Google Scholar] [CrossRef]
- EU Merge Project. Deliverable 2.1: Modelling Electric Storage Devices for Electric Vehicles. 2010. Available online: www.ev-merge.eu/ (accessed on 15 December 2015).
- Qin, N.; Gusrialdi, A.; Brooker, R.P.; T-Raissi, A. Numerical analysis of electric bus fast charging strategies for demand charge reduction. Transp. Res. Part A 2016, 94, 386–396. [Google Scholar] [CrossRef]
- Sun, S.W.; Liu, Z.X.; Chen, Z.Q.; Yuan, Z.Z. Relations between structural properties and synchronizability on local world dynamical networks. Prog. Nat. Sci. 2007, 17, 956–961. [Google Scholar]
Figure 1.
Framework on the interaction of coupled traffic and energy transportation networks (CTETNs).
Figure 1.
Framework on the interaction of coupled traffic and energy transportation networks (CTETNs).

Figure 2.
Daily load-curve of the divided areas.

Figure 3.
Topology of CTETNs.

Figure 4.
Schematic of an origin-destination (OD) pair.

Figure 5.
The decision diagram for fast-charging EVs.

Figure 6.
The load characteristics (a) without road-block and (b) with road-block.

Figure 7.
The load characteristics of FCS at (a–d) #5, #6, #20, #21 FCS, respectively; and at (e–h) #3, #10, #30, #31 FCS, respectively.
Figure 7.
The load characteristics of FCS at (a–d) #5, #6, #20, #21 FCS, respectively; and at (e–h) #3, #10, #30, #31 FCS, respectively.

Figure 8.
Cumulative distribution function (CDF) of EVs (a) in the transportation networks, (b) in the industrial area, (c) in the business zone, and (d) in the residential district.
Figure 8.
Cumulative distribution function (CDF) of EVs (a) in the transportation networks, (b) in the industrial area, (c) in the business zone, and (d) in the residential district.


Table 1.
Electric vehicle (EV) parameters.
| EV Type | Capacity (kw·h) | Range (km) | Tf | Tr | Model | Ratio |
|---|---|---|---|---|---|---|
| BYD K9 | 324 | 250 | 0.5 h (50%) | 6 h | Public bus | 31% |
| BYD e6 | 57 | 120 | 0.25 h (80%) | 10 h | Private car/taxi | 23%/23% |
| Tesla mode S | 85 | 480 | 1 h | 10 h | Commercial car | 23% |
© 2018 by the authors. Licensee MDPI, Basel, Switzerland. This article is an open access article distributed under the terms and conditions of the Creative Commons Attribution (CC BY) license (http://creativecommons.org/licenses/by/4.0/).
Share and Cite
MDPI and ACS Style
Yang, X.; Li, Y.; Cai, Y.; Cao, Y.; Lee, K.Y.; Jia, Z. Impact of Road-Block on Peak-Load of Coupled Traffic and Energy Transportation Networks. Energies 2018, 11, 1776. https://doi.org/10.3390/en11071776
AMA Style
Yang X, Li Y, Cai Y, Cao Y, Lee KY, Jia Z. Impact of Road-Block on Peak-Load of Coupled Traffic and Energy Transportation Networks. Energies. 2018; 11(7):1776. https://doi.org/10.3390/en11071776
Chicago/Turabian StyleYang, Xian, Yong Li, Ye Cai, Yijia Cao, Kwang Y. Lee, and Zhijian Jia. 2018. "Impact of Road-Block on Peak-Load of Coupled Traffic and Energy Transportation Networks" Energies 11, no. 7: 1776. https://doi.org/10.3390/en11071776
Note that from the first issue of 2016, this journal uses article numbers instead of page numbers. See further details here.