Modelling the Small Throw Fault Effect on the Stability of a Mining Roadway and Its Verification by In Situ Investigation


1
Faculty of Mining and Geoengineering, AGH University of Science and Technology, 30-059 Kraków, Poland
2
Tytan sp. z O.O. Mining Company, 41-400 Mysłowice, Poland
*
Author to whom correspondence should be addressed.
Energies 2017, 10(12), 2082; https://doi.org/10.3390/en10122082
Submission received: 7 September 2017
/
Revised: 27 November 2017
/
Accepted: 30 November 2017
/
Published: 7 December 2017
(This article belongs to the Section L: Energy Sources)
Abstract
:The small throw fault zones cause serious problems for mining engineers. The knowledge about the range of fractured zone around the roadway and about roadway’s contour deformations helps a lot with the right support design or its reinforcement. The paper presents the results of numerical analysis of the effect of a small throw fault zone on the convergence of the mining roadway and the extent of the fracturing induced around the roadway. The computations were performed on a dozen physical models featuring various parameters of rock mass and support for the purpose to select the settings that reflects most suitably the behavior of tectonically disturbed and undisturbed rocks around the roadway. Finally, the results of the calculations were verified by comparing them with in situ convergence measurements carried out in the maingate D-2 in the “Borynia-Zofiówka-Jastrzębie” coal mine. Based on the results of measurements it may be concluded that the rock mass displacements around a roadway section within a fault zone during a year were four times in average greater than in the section tectonically unaffected. The results of numerical calculations show that extent of the yielding zone in the roof reaches two times the throw of the fault, in the floor 3 times the throw, and horizontally approx. 1.5 to 1.8 times the width of modelled fault zone. Only a few elasto-plastic models or models with joints between the rock beds can be recommended for predicting the performance of a roadway which is within a fault zone. It is possible, using these models, to design the roadway support of sufficient load bearing capacity at the tectonically disturbed section.
1. Introduction
The diverse geological structure of the Upper Silesian Coal Basin and its mining history result in frequent changes of rock mass stability conditions along mining galleries [1]. One of the instability factors is previously undetected small throw fault zones (a series of small dislocations along the roadway) within which the roadway is prone to convergence, deformation of the support, and a collapse in the worst circumstances.
The effect of faults or fault zones on underground workings is recognized, qualitatively well-known and researched [2,3,4,5,6,7,8,9]. However, quantitative evaluations of this effect are scarce and, in particular, the stand-up time of the roadway. The next possible step following the earlier reported research [10], would be an attempt at numerical modelling of the effect of the fault on the mining roadway to enable its quantitative evaluation, i.e., the extent of fracturing zones and characteristics of the rock mass deformation. This information is indispensable for the proper support design or a decision on additional reinforcement such as rock bolts.
In this paper is presented a numerical analysis of an effect of a small throw fault zone on the magnitude of convergence of the mining roadway, and on the extent of the fracturing zone forming around the roadway due to convergence. The computation was performed on a dozen rock mass models of various parameters of rock and support, to determine the model best representing the behavior of the tectonically disturbed rock around the opening. The results were compared with the sections of the roadway where the faults were not present. Although there are some works which employed numerical modelling [2,5,6,7,8,9] the authors didn’t study the alternative way of modelling, which could produce significantly different results.
Instead, the results of the numerical analyses were ultimately verified by convergence measurements purposely carried out in maingate D-2 in the Borynia-Zofiówka-Jastrzębie coal mine. Two convergence stations were installed outside and in the fault zone, and the measurements carried out over 15 months. There are few works which compare the results of modelling with underground observations [2,7,9].
2. Weakening of Rock in a Fault Zone
In the areas that underwent strong tectonics the mining roadways commonly intersect with minor faults. A weakness zone is associated with each fault and its extent depends on the cohesion of the rock, intensity of rock mass tectonic deformation, dip angle and throw magnitude of the fault. In the article [11] it can be found that the weakness zone is 1 m wide, while Kidybiński states [3] that around 2 to 7 m throw faults, the zone of significant weakening is 1 m, yet the deterioration reaches up to 5 m on both sides of the fault plane. Similar observations are brought up by Nieć [4] who reports more than twofold reduction of uniaxial compressive strength (UCS) of sandstone within 4 m zone along Kłodnicki Fault of 5 m throw, and within 5 m zone along Bytomski Fault of 12 m throw.
Shen et al. [5] demonstrates from numerical models that the extent of rock weakening along fault (distance from the fault plane) is numerically two to four times the fault’s throw. Su et al. [6] suggests, that the largest dislocations related to the roadways sections being inside the fault zone are six meters. Yao et al. [9], in the course of research, determined the minimum of the fault throw as low as 2 m that is significant for the stability of a mining roadway. If the fault throw is larger than 2 m the roadway should be designed and supported considering the fault effect. Yao et al. [9] states also that in a case of throw smaller than 2 m the roadway can be designed and supported as if for tectonically unaffected areas—i.e., disregarding the fault effect; this is because the changes of stress around the opening are negligible and the rock mass is in an undisturbed condition. However, the researchers point out the necessity of additional supports of the roadways within fault zones e.g., cable bolts, rock grouting [7,8], or reinforced yokes of the clamps of steel support frames to withstand large loads, possibly of a dynamic character [12]. Still, it needs to be reminded that most of the researches were carried out in geological conditions entirely different to those known in the Upper Silesian Coal Basin.
Polish standards of mine roadway support design [13,14], based on works by Zorychta, provide an empirical relationship between the extent of the fault zone, fault throw (hu), and dip angle of the fault plane (Equation (1)):
Therefore, considering the typical dip 60° and 5 m throw the affected fault zone becomes 6.45 m, while for 4 m throw it is 4.1 m. The extent of the zone varies significantly together with shallow fault dipping. However, other researches indicate large differences in the assessment of the fault related extent of the rock deterioration around the roadway.
3. Research in the Mine
3.1. Geological Conditions in the Area
The analysis of the fault’s impact on the stability of the opening was carried out for maingate D-2 for longwall in the “Borynia-Zofiówka-Jastrzębie” mine in coal seam 412. The mine is located in the south of Poland, 15 km away from the border with Czech Republic. The coal seam belongs to the Dolnorudzkie beds of 230–340 m thick series of Carboniferous strata. In terms of its lithology Dolnorudzkie beds comprise claystones (30%—uniaxial compressive strength (UCS) = 14.3–77.4 MPa), mudstones (14%—UCS = 30.7–79.3 MPa, conglomerates (1%—UCS = 32.0–85.2 MPa), sandstones (49%—UCS = 25.4–178.9 MPa) and coals (6%—UCS = 5.8–13.0 MPa). Usually 5÷10 coal seams from this series of beds are subject to exploitation.
The studied opening belongs to block “D” of the mine, which is outlined by the position of the high throw faults (35 m and 50 m), and the protection pillar for the Main Conveyer Trunk. Fault density coefficient, defined as a ratio between the total length of the faults and the area encompassing the faults, amounts to 80–220 m/ha. It is a typical geological situation at the stone coal mines in Upper Silesian Coal Basin. Except for the major faults which are mainly borders of mining fields, there are many of small throw faults that intersect the driven headings.
Maingate D-2 is located at an average depth 1000 m. The sidewall of the roadway is in its full height formed in a coal bed which is 4.1 m thick (locally interlayered with 0.05–0.40 m of claystone) and dips at several degrees (varied 2–22°/E, NE, NEE sometimes SEE). The roof is within an overlying 1.5 m thick bed of coaly shale, then 8.5 m of sandstone, while the floor exposes the top of 8.3 m thick bed of claystone, interlayered with 0.5 m coal. The other two coal seams lie next to the seam 412 are: seam 411/3 in a vertical distance of 13÷20 m above, and seam 413/2—8÷13 m below. The position of the strata around the roadway was drawn based on technical documentation [15].
3.2. The Maingate D-2 Support
The roadway was entirely supported with ŁPC Bor 12/4/V32 type steel yielding support. This is a steel yielding support, consisting of four arched elements, jointed with two clamps each, made of V shape section steel type S480W, which is characterized by heightened mechanical properties (Table 1). The maximum width of the frame (at the floor) is 6.5 m, and the height—4.225 m. The arches were spaced at 0.6 m. Maingate D-2 was completed in December 2014.
3.3. The In Situ Measurement Methodology
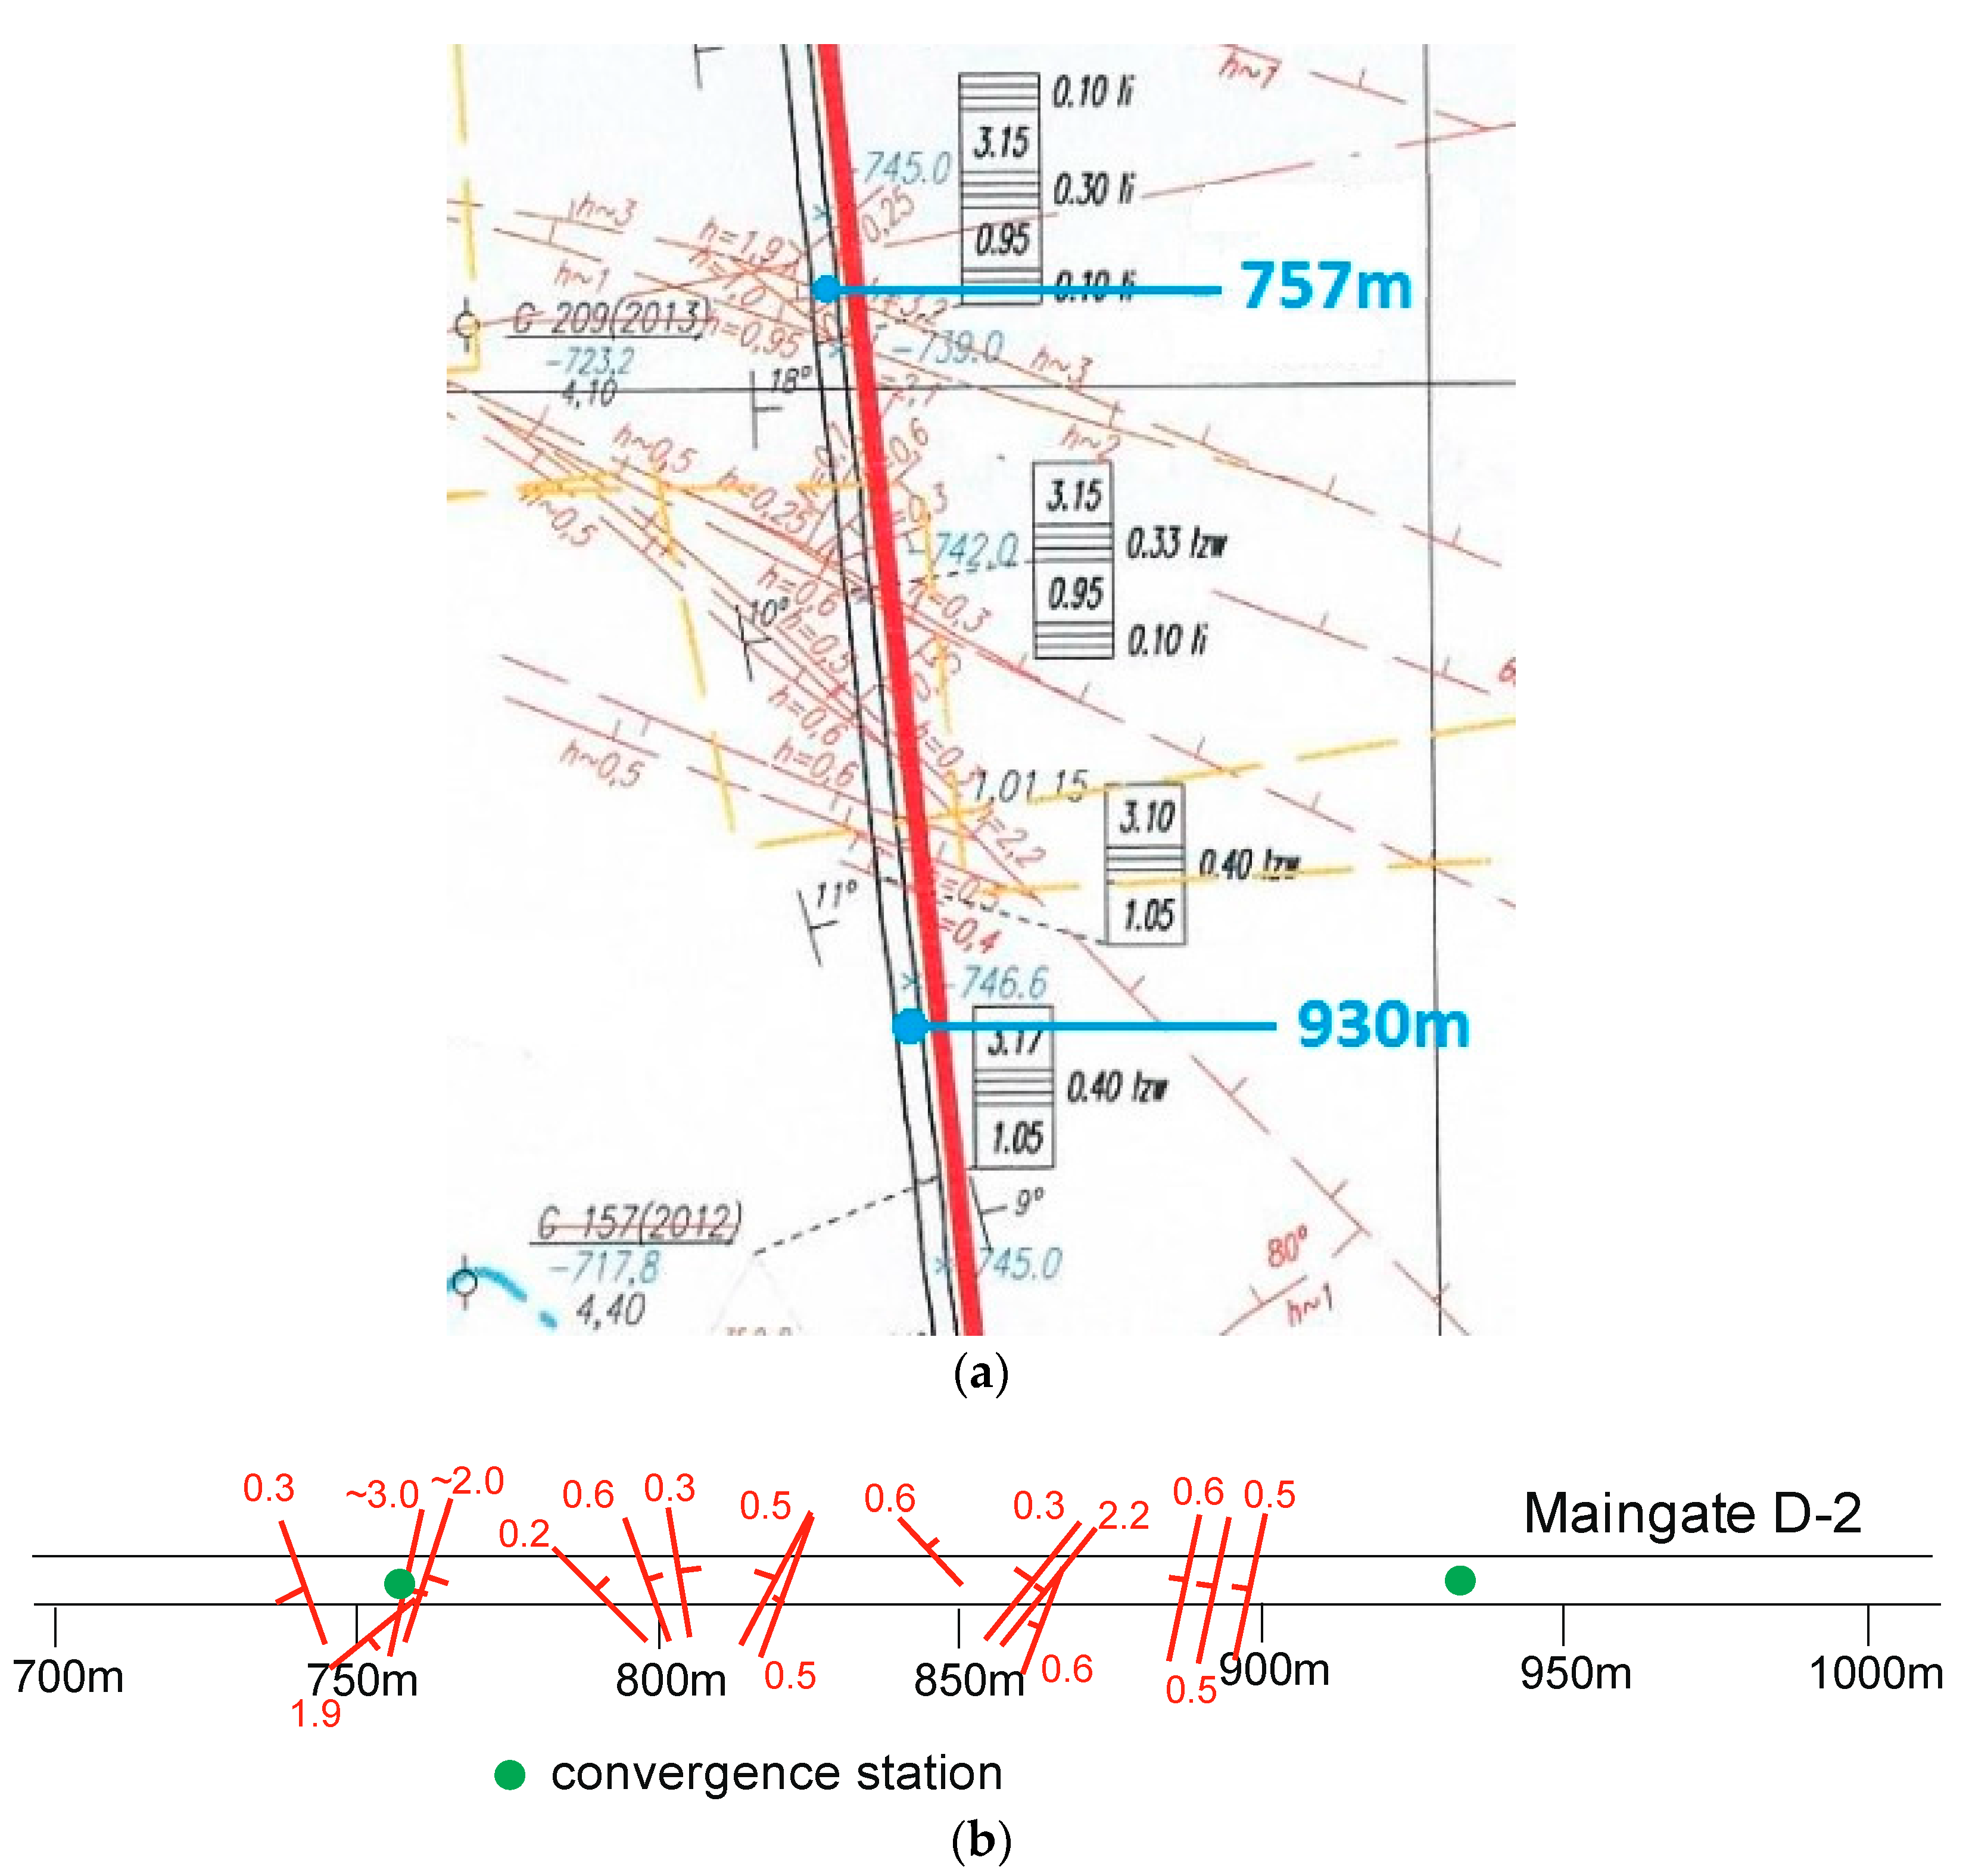
In this paper are presented the convergence measurement results from two monitoring stations (Figure 1): at chainage ch. 930 m where there were no faults found or mining related effects, and at chainage ch. 757 m where the roadway intersected a series of faults of a relatively small throw ranging from 0.3 to 3 m over 12 m section (Figure 1). Convergence measurements were carried out until July 2016 i.e., until the closing longwall excavation started showing up in the results.
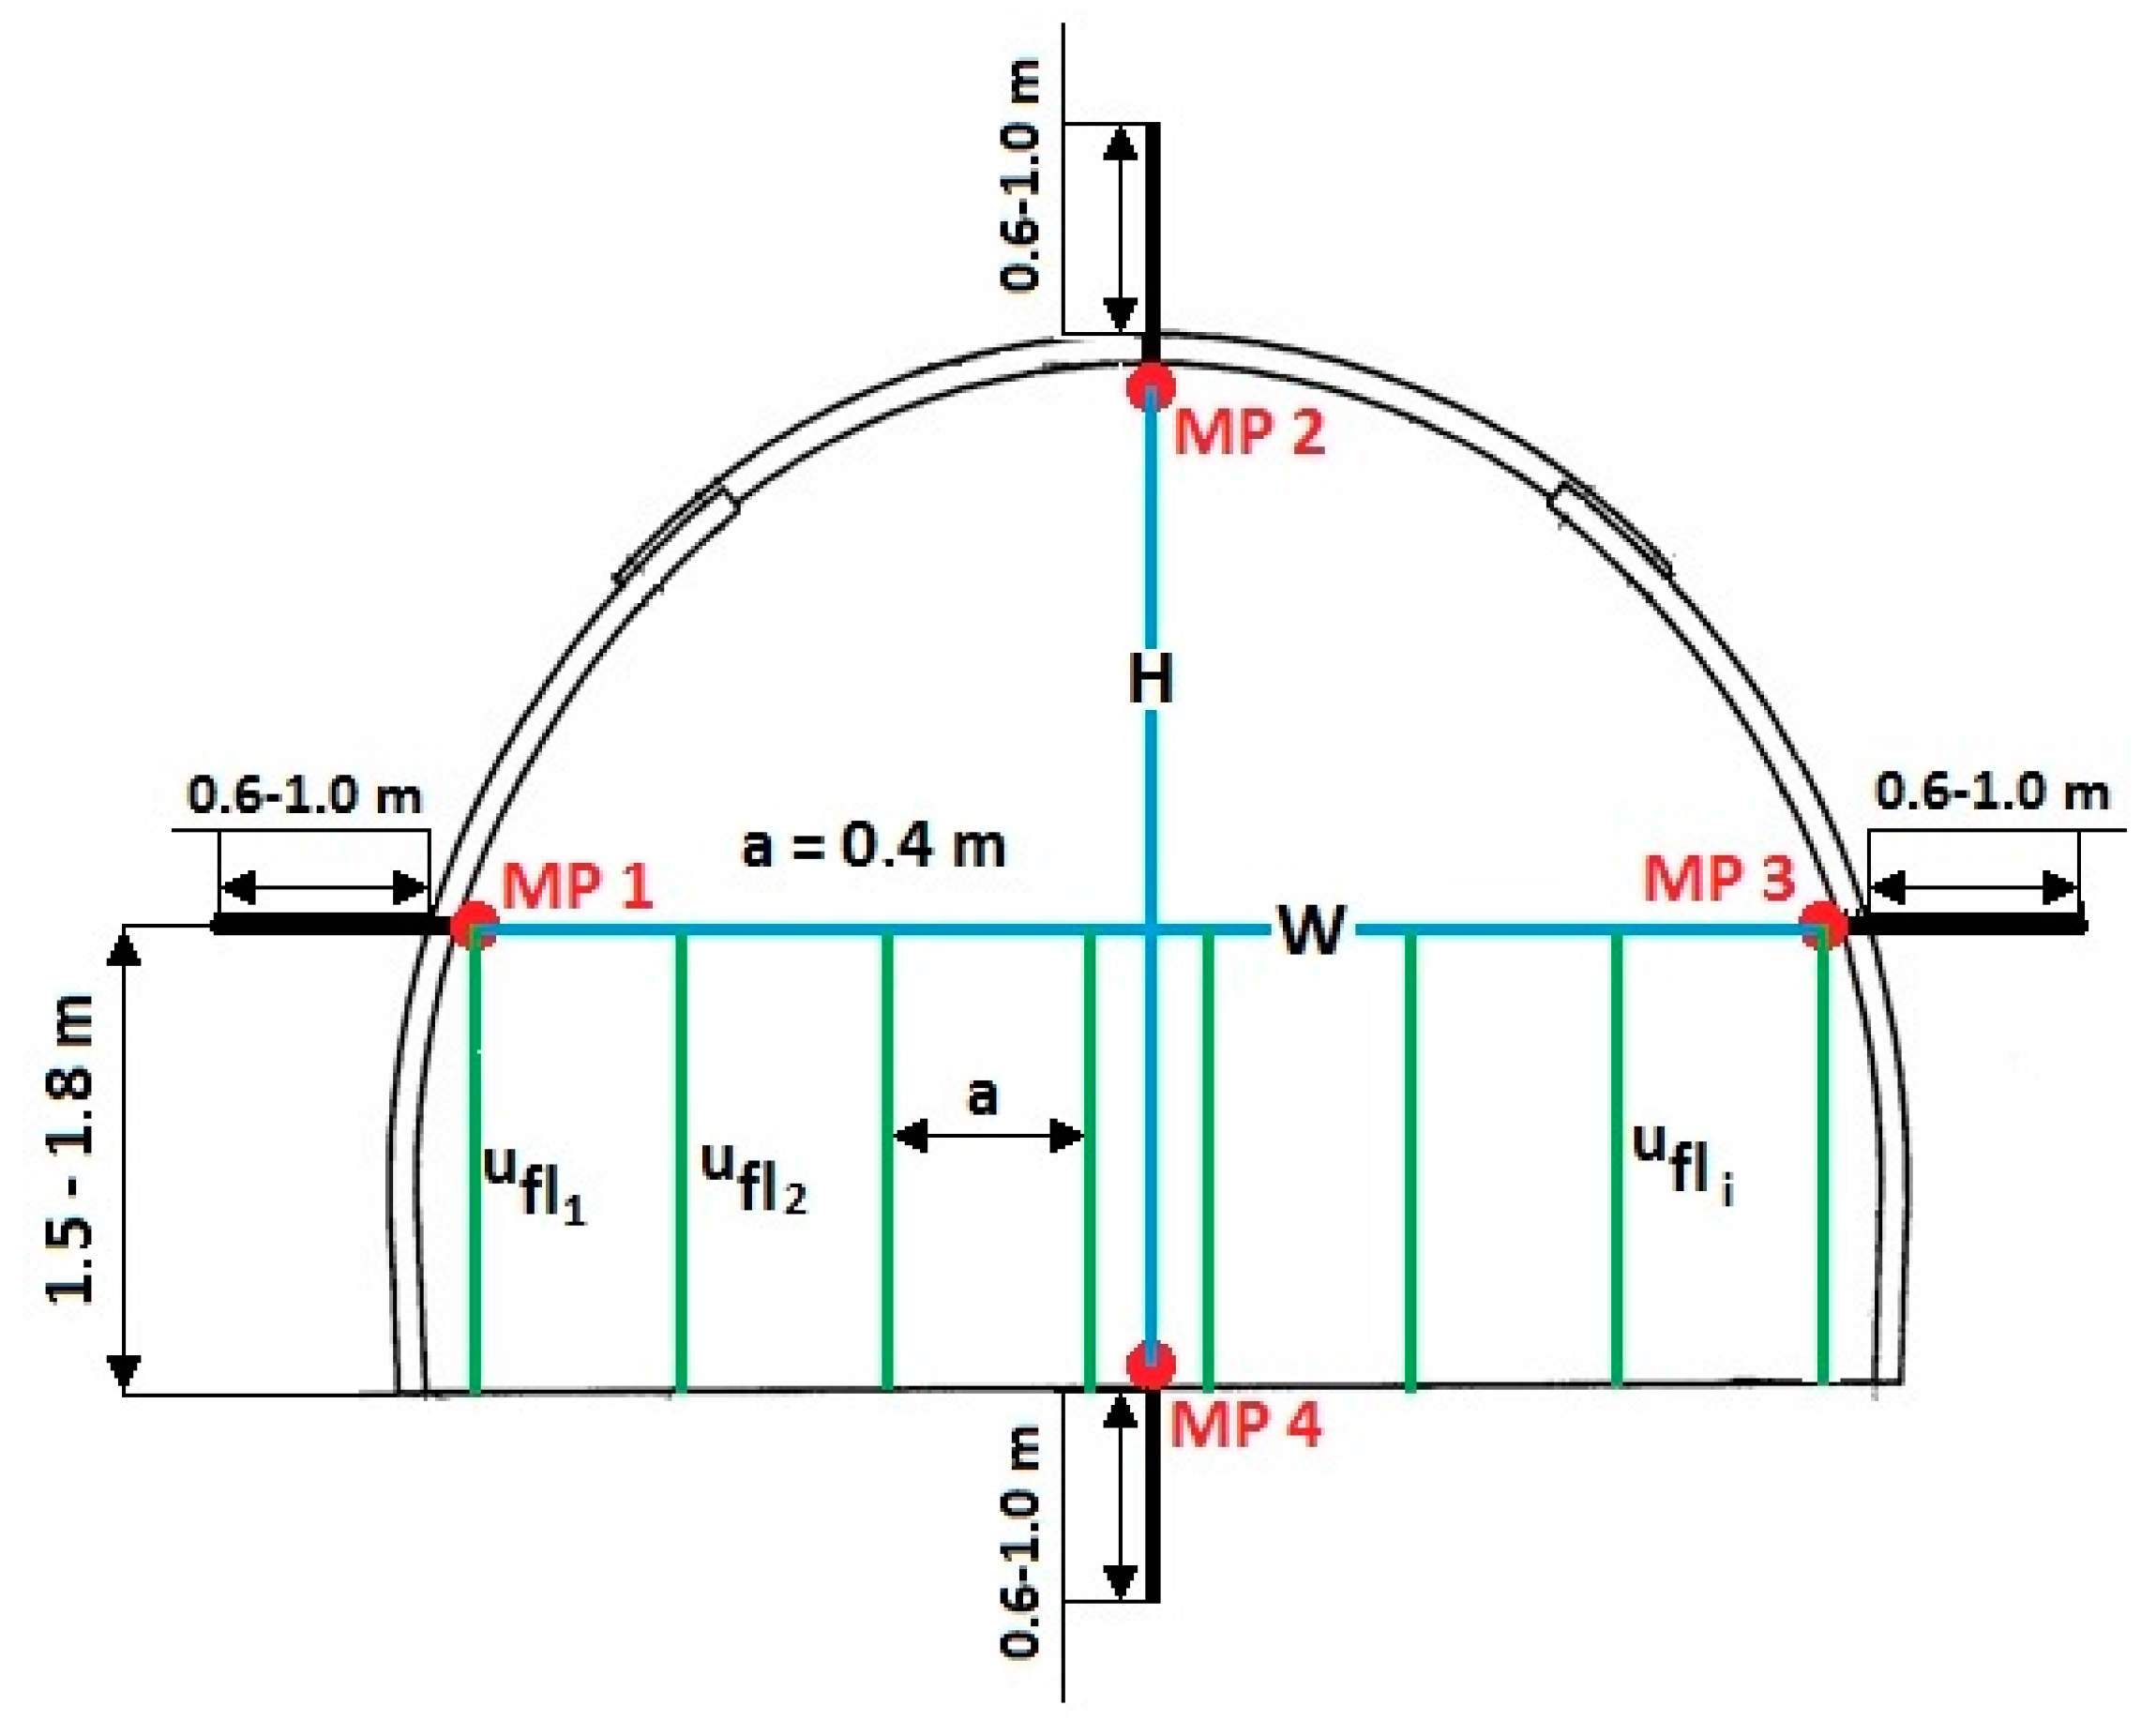
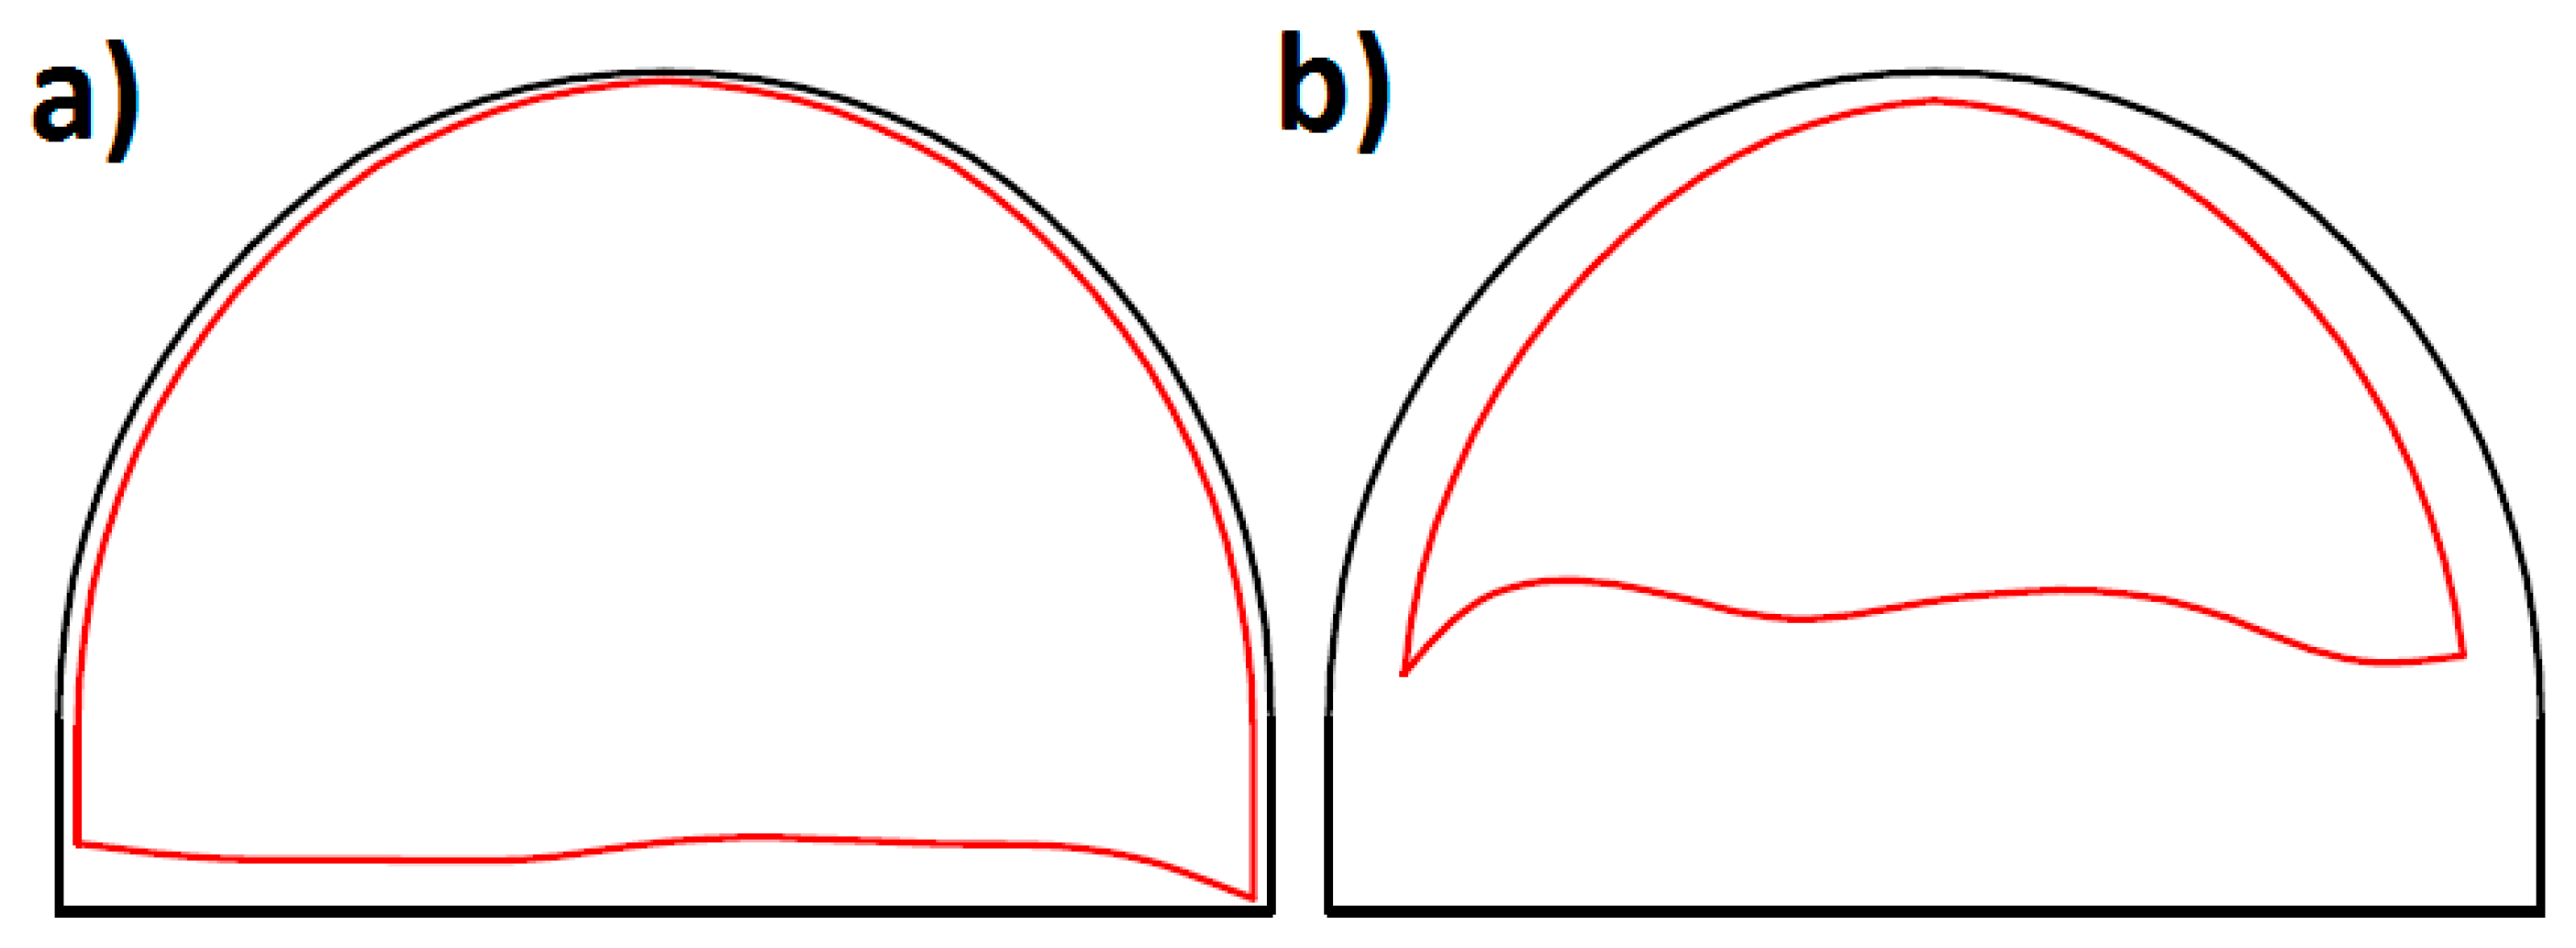
The convergence of the maingate D-2 was investigated by a series of in situ measurements to determine: change of the height of the opening H, change of the width W, and change of the floor heave ufl (Figure 2). The values were calculated with reference to the design dimensions of the opening.
The aim of the measurement was to show the difference of rock mass behavior when the roadway is located within the zone of faults with small throws comparing to the section of Maingate D-2 unaffected by the faults. The results of the underground measurements became the verification of the further numerical calculation studies.
3.4. Results of Convergence Measurements
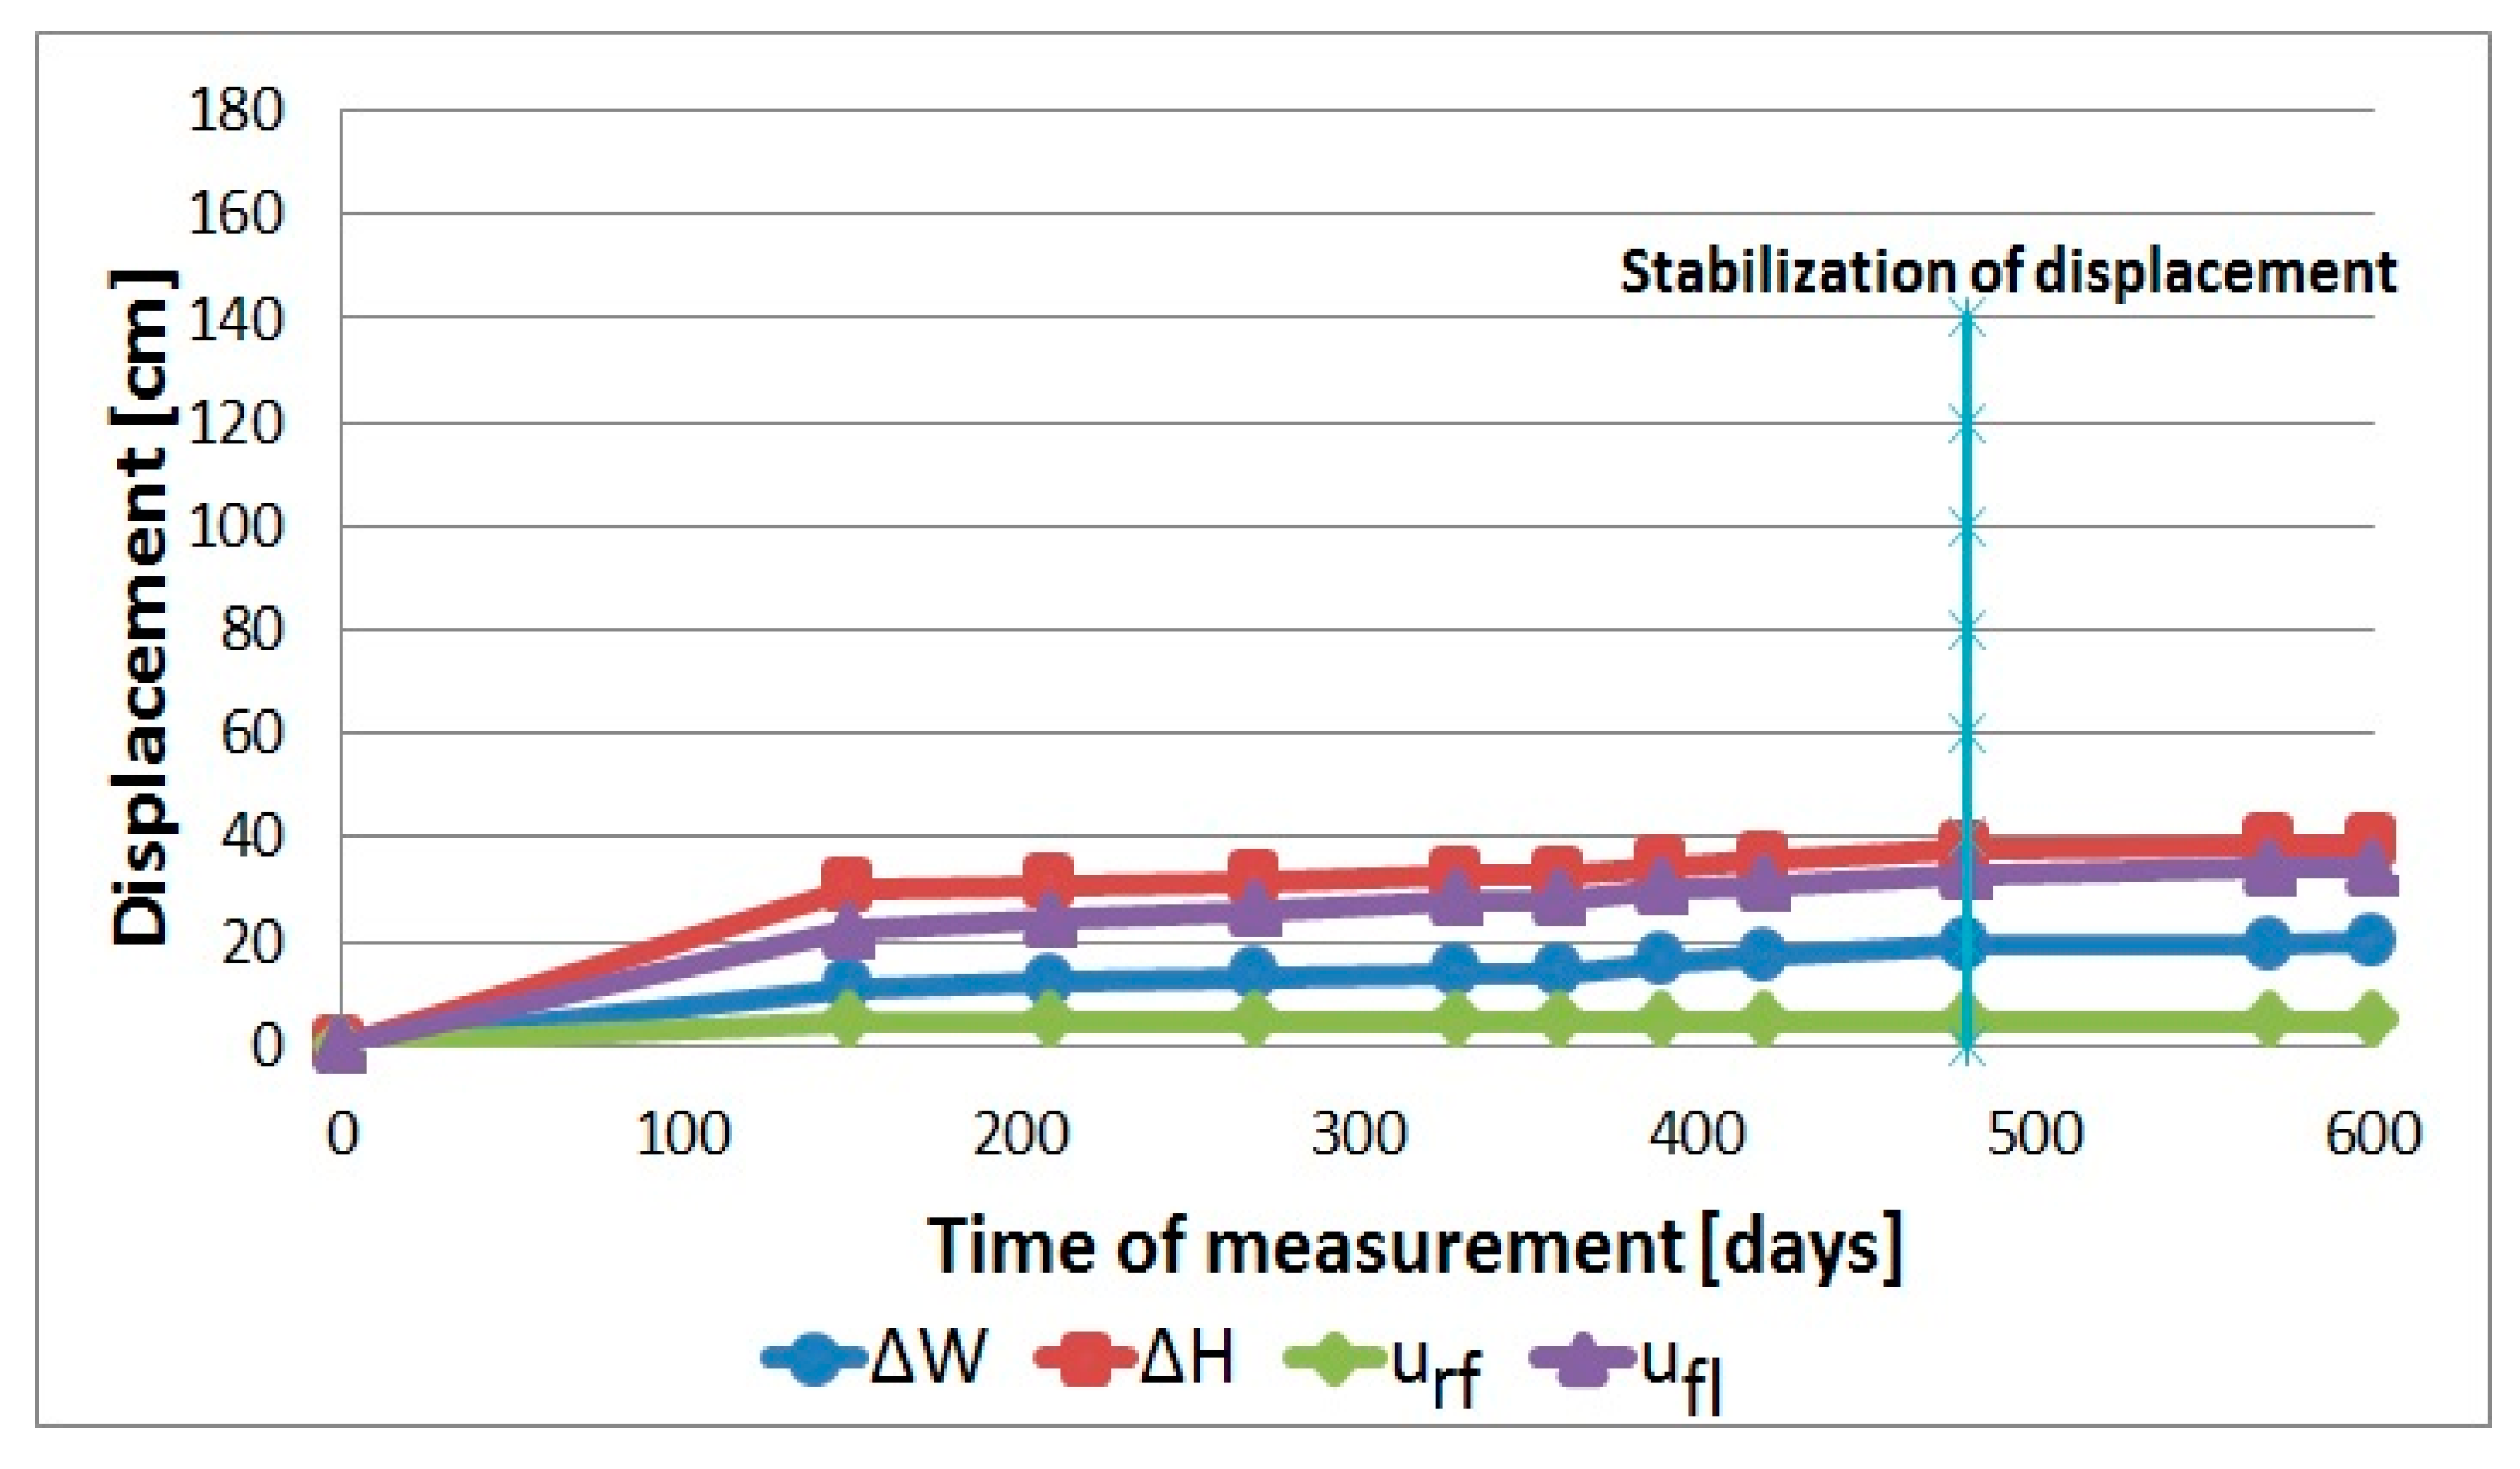
Analysis of the convergence monitoring shows that in the 19 months since the completion of the roadway D-2, at the ch. 930 m station, the height of the opening decreased 38.5 cm (ΔH—Figure 3) and measured 3.84 m, which is 91% of the initial (nominal) dimension. Apparently, the heave of the floor was the cause of the change of the opening height. The width of the roadway within the same period decreased 20 cm (ΔW) and measured 5.9 m i.e., 96.7% of the initial (nominal) width 6.10 m. The cross-sectional area of the roadway decreased by 2.9 m2 i.e., 13% of the initial figure [10]. The convergence development versus time is presented on Figure 3.
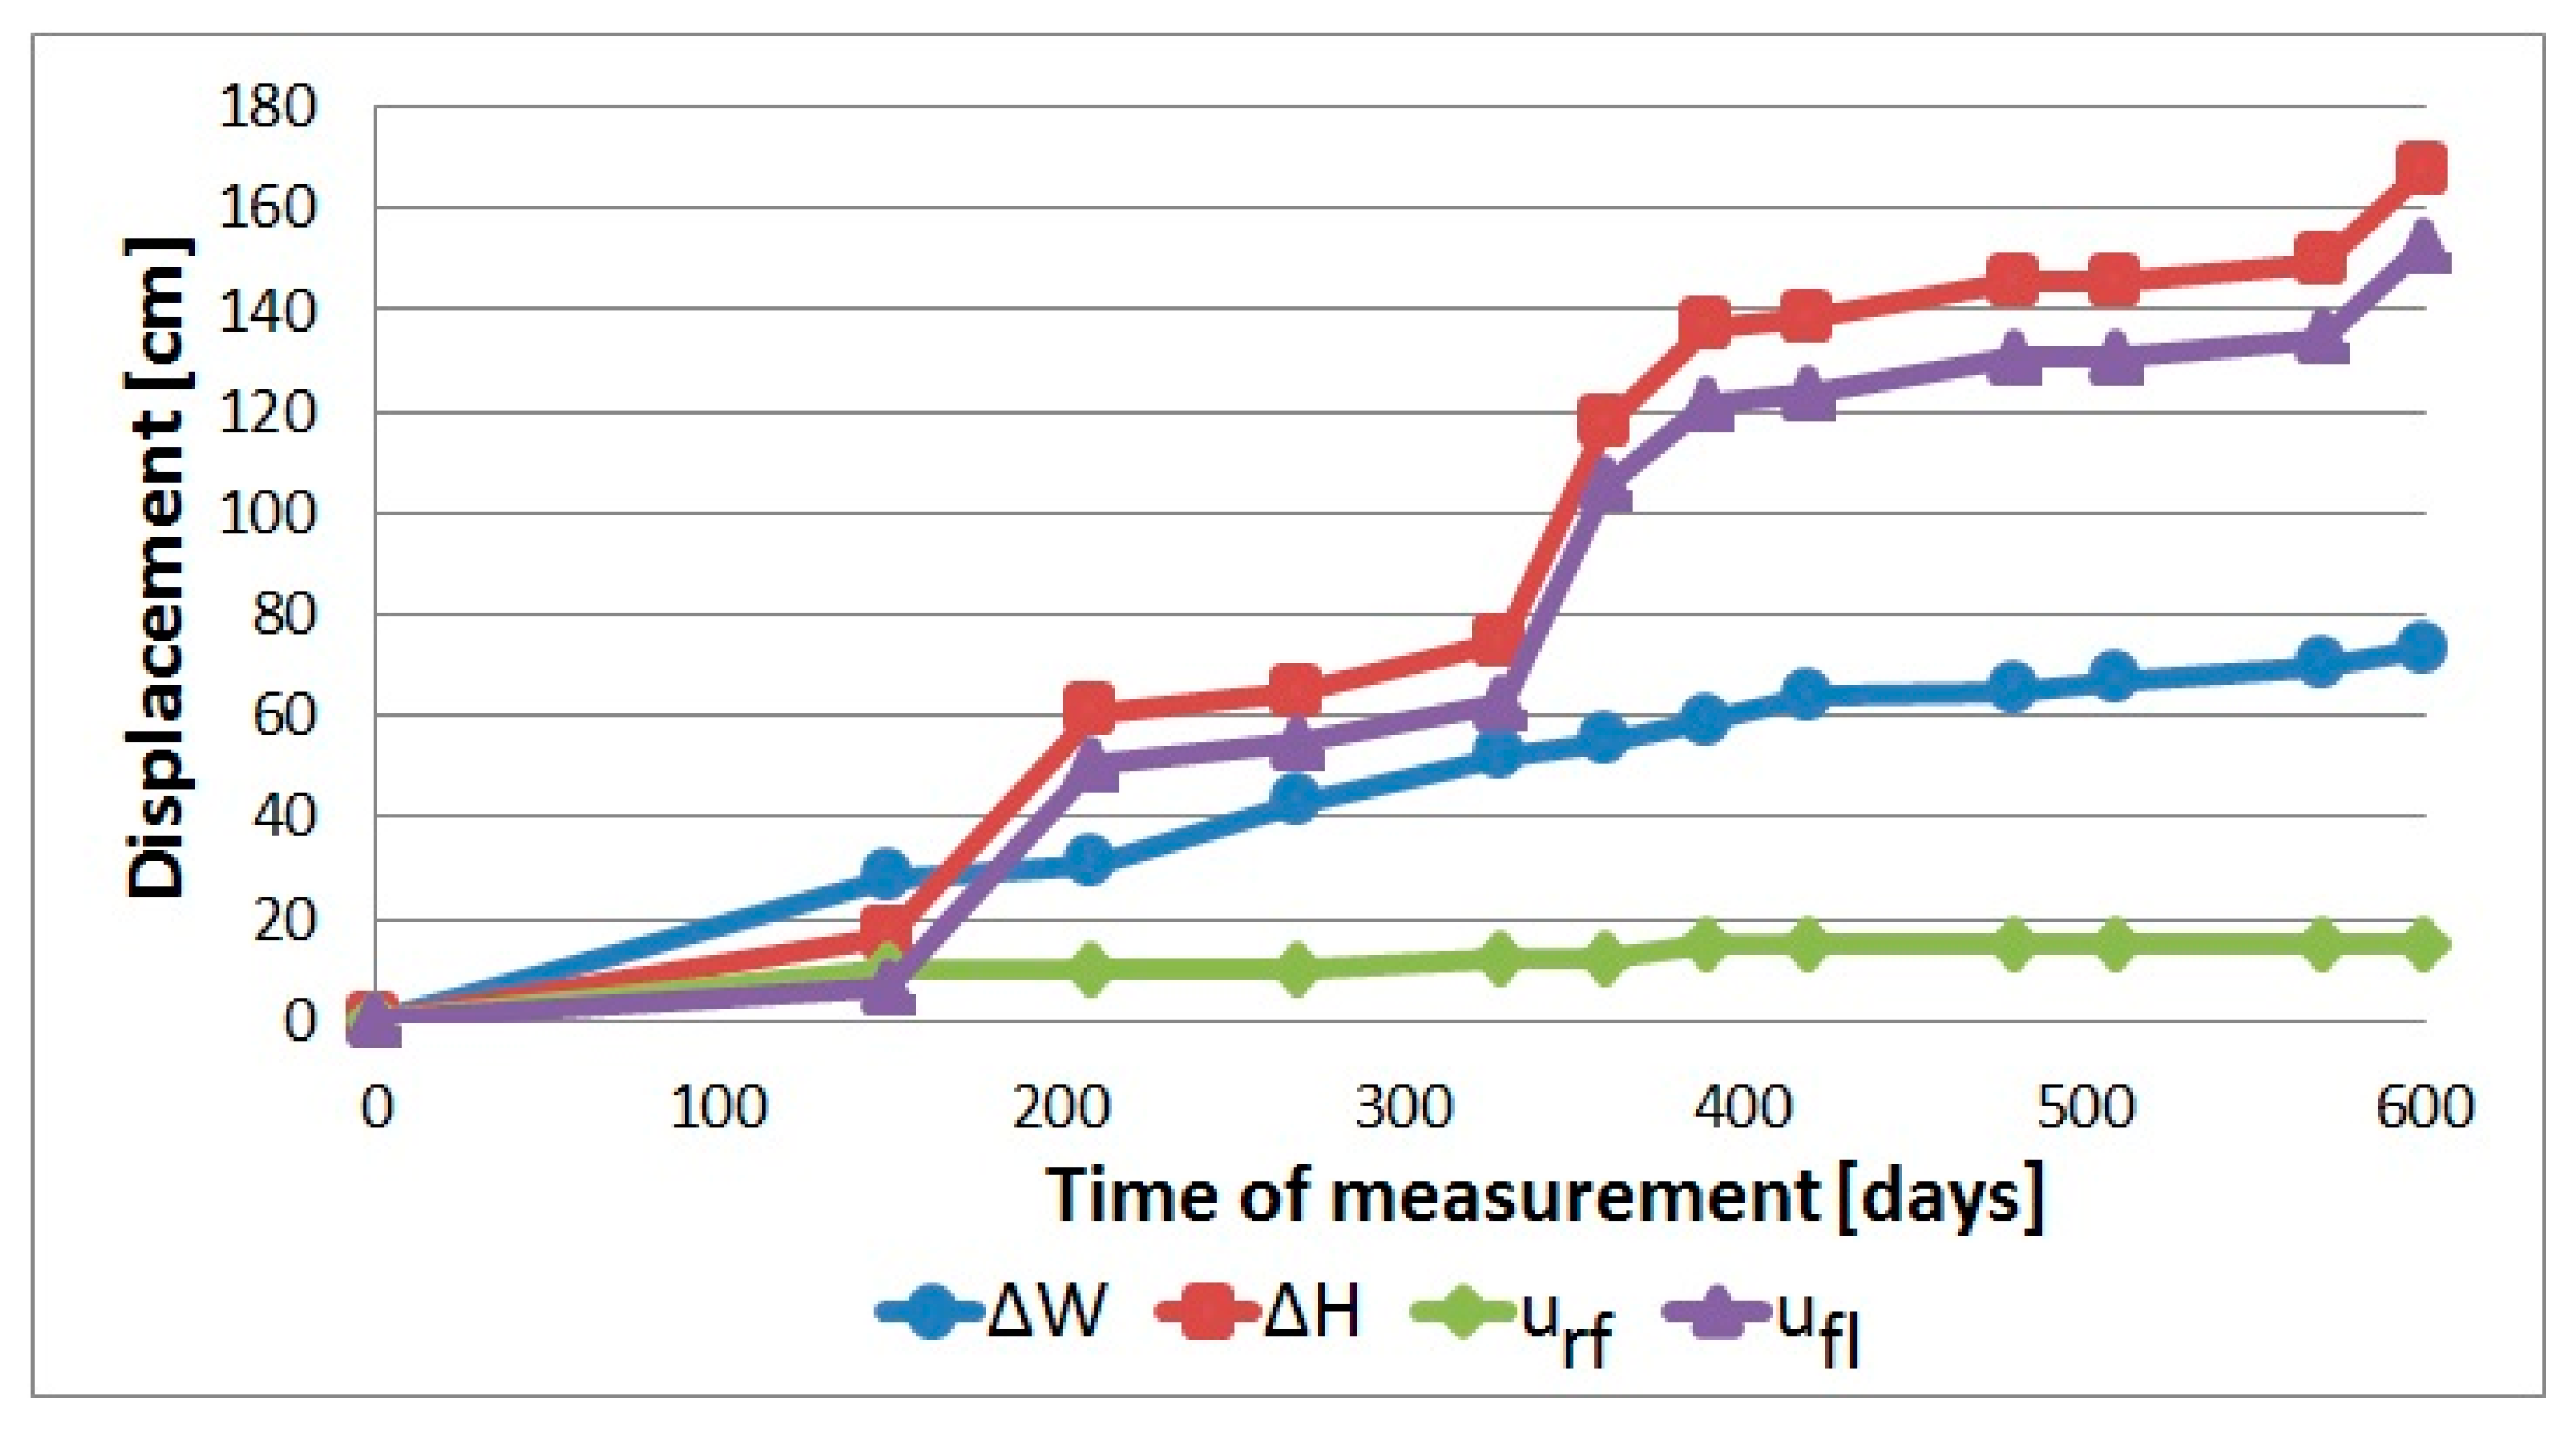
In contrast, the convergence of the roadway at station ch. 757 m located within fault zone shows much higher magnitudes. The height of the opening within 19 months decreased 1.7 m mainly due to the floor heave. Horizontal, inward movement of the sidewalls amounted to 0.73 m, i.e., 12% of the initial width of the roadway (Figure 4). Based on the measured convergence, the reduction of the cross-sectional area could be calculated as 46% of the initial value [10]. To maintain the maingate D-2 operational the floor had to be brushed three times: by 80, 60, and 70 cm which is included in the record and the convergence results corrected accordingly (Figure 4).
It may be noted that within the Maingate D-2 section beyond the tectonic deformation, apparently the stress condition stabilized approx. after 11 months since completion of the roadway (Figure 3). Such a behavior is typical for the Carboniferous rock mass and is proved by the other underground research in Poland [16]. In the case of the roadway section in the fault zone, small deformation of the rock mass around the opening continued even after 600 days (approx. 20 months) (Figure 4). It can be also concluded that the change of the height and width of the opening within the fault zone was respectively 4.5 and 3.5 greater comparing to the section tectonically unaffected.
Generally, at both monitoring stations the floor heave contributed mainly to the vertical convergence, while the downward movement of the roof recorded was from several to over a dozen centimeters. The contribution of floor heave to the total displacement is due to the fact that there is no support in the floor and its strength is relatively low, so it is the only place where the high stresses can be released. The floor heave is caused by large horizontal stresses [17], that arises within the fault zone. The summary of in situ measurements are presented in Table 2.
Figure 5 graphically depicts changes of cross sectional areas at both monitoring stations. It demonstrates that in the tectonically undisturbed section as well as in fault affected section the floor heave contributed mainly to the vertical convergence of the roadway D-2. This kind of behavior of the rock mass around openings is regarded typical for Carboniferous formation [18], particularly where the underlying rock is closely stratified and of a low strength [2,19].
4. Numerical Evaluation of the Stability of the Opening
4.1. Assumptions of the Models
A numerical study was carried out using Phase 2 computer program that utilizes the finite elements analysis (FEA) method. The analysis was carried out as for a plane state of strain. The position of the geological layers and their mechanical parameters, juxtaposed with parameters corresponding with Hoek-Brown failure criterion are presented in Table 3. Mechanical parameters of the rock types were based on laboratory testing carried out by the authors, and on technical documentation of the roadway [15]. The position of the strata on the model were inferred from the geological log of an exploratory core holes in a close vicinity of both monitoring stations in the maingate D-2.
The opening location at an average depth of 1000 m and related to it geostatic stress condition were assumed. Discretization of the model was in the form of three node triangle mesh—each triangle constituting a single element. In the vicinity of the opening the mesh element density has been increased. The further change of the mesh element density didn’t affect the results of numerical calculations. The boundary condition of the model excluded horizontal movement of the nodes on the vertical boundaries and vertical movement of the nodes on horizontal boundaries. The roadway support was a steel frame arches 4.225 m high and 6.5 m span at the foot, made of V shape section steel type S480W with yield limit—480 MPa and tensile strength—650 MPa (standard ŁPC Bor 12/4/V32 type support ). The arches were spaced at 0.6 m. For the model purpose, the support was represented as Reinforced Concrete and by selection Reinforcement option only. This option allows to consider, in contrary to Standard Beam, the spacing of the individual supports.
4.2. Section of the Roadway Unaffected by the Fault
A model of rock mass for the section of the roadway tectonically unaffected was outlined within 60 × 60 m plane (Figure 6). The total number of nodes and elements for the model amounted to 6785 and 13,122. The computation was carried out on 13 different numerical models to produce a series of strain-stress characteristics in the surrounding of the roadway, as well as the extent of rock failure zones (Table 4). Nine of the models represented rock mass of elasto-plastic properties, strengthened or weakened, or perfect elasto-plastic properties, while four of the models assumed elastic behavior of the rock. In the elasto-plastic model no. 3, and in elastic model no. 12, Young modulus of the rock strata was empirically estimated assuming that Geological Strength Index is equal to Rock Mass Rating - GSI = RMR [20], whereas for other models it was determined through laboratory testing. The joint type interbed contact has been used in three models no. 7, 8 and 9 (Table 4). In the model no. 7 the contact between all beds was assumed as Phase 2 default setting for normal and shear stiffness, i.e., kn = 100,000 MPa/m and ks = 50,000 MPa/m ( case 1). In the model no. 8 the contact type joint was applied to the contact between coal, sandstone and shale where kn = 220,000 MPa/m and ks = 110,000 MPa/m, while for other gangue rocks kn = 880,000 MPa/m and ks = 440,000 MPa/m (case 2).
In the case of model no. 9, the joint type contacts were given the ability of slide due to yield effect along the contact plane and governed by Coulomb-Mohr criterion (case 3). In this model, for contacts coal-gangue rocks the tensile strength was assumed 0.2 MPa, cohesion 2 MPa, and the angle of internal friction 33°, while for contacts between gangue rocks the tensile strength 0.2 MPa, cohesion 2 MPa, and the angle of internal friction 35°. For both situations, the residual values of tensile strength and cohesion were assumed to be zero. Furthermore, for both situations, a reduction of the angle of internal friction to 28° and 30° was specified as suggested by Jie et al. [2].
Table 5 presents a compilation of the results of calculated total displacements along the contour of the opening. Displacement of the roof Δurf and floor—Δufl are juxtaposed with the values of vertical ΔH and horizontal ΔW convergence. The final results of underground measurements are presented in Table 5 as well. The coefficient of conformity between the measured and modelled displacement is also provided as an average of all four abovementioned values.
Analysis of the obtained results shows that in all elastic models the coefficient of conformity between modelled and measured values appears significantly lower than in the elasto-plastic models. Generated displacements are generally very low (Figure 7), and even decreasing Young modulus and increasing deformability of the rocks did not change the output values towards closer to the deformations measured in the maingate D-2.
For this reason, the elastic model of rock mass was decided as not applicable for estimation of stress-strain condition around workings in Carboniferous formation. The results further confirmed that the elastic models can be used for homogenous or quasi-homogenous rock mass while good results for stratified rock mass can be achieved from elasto-plastic models [18].
Models, in which the steel yielding support was assumed with sliding, showed larger inward movement of the crown and sidewalls of the working (Table 4) in comparison with other models. It showed that models with the yielding support (frames with sliding ability) are not suitable for this purpose.
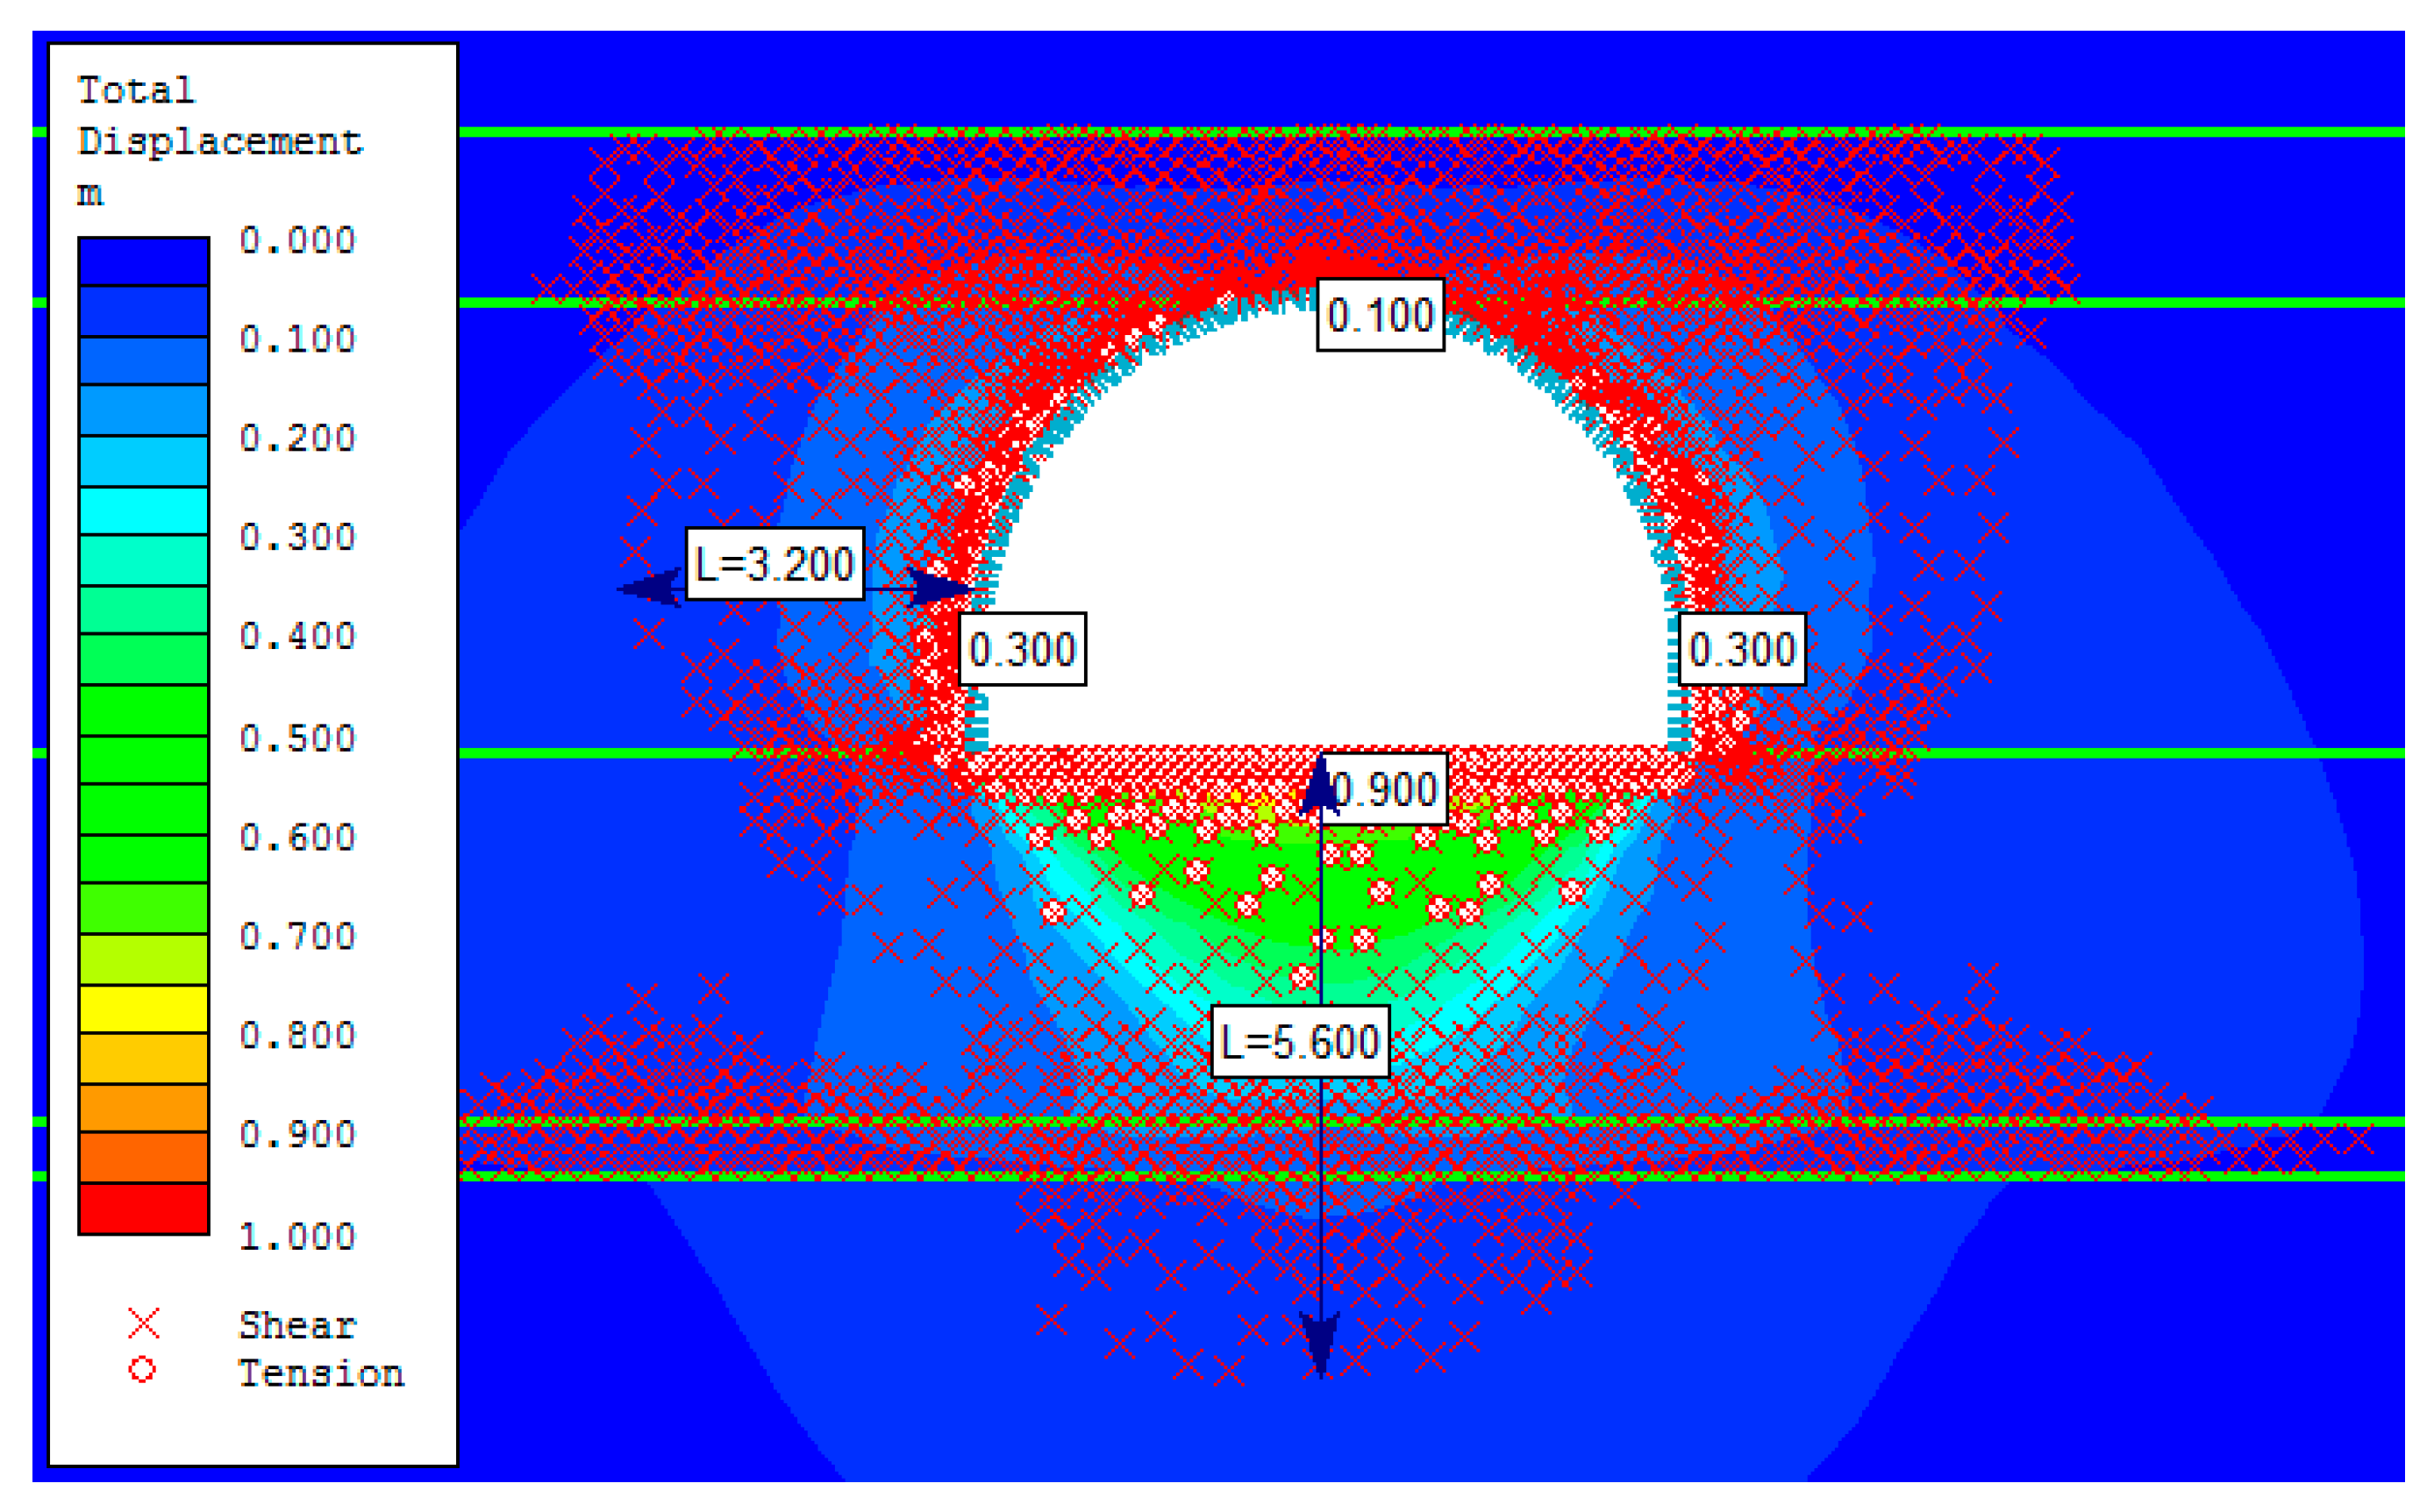
An interesting conclusion was suggested by the analysis of the models where Young modulus for the rock mass was empirically estimated. Despite the evident difference between the behavior of a rock sample and rock mass it is commonly recommended a reduction of mechanical parameters for rock mass [20,21,22], researches prove such a reduction for sedimentary rock, that are typically low anyway, is not well substantiated. In the case of maingate D-2, both models where estimated Young modulus for a rock mass was applied, the results were largely discrepant from the in situ measurements. The elastic model (no. 12) generated results even lower than for the model based on laboratory derived Young modulus and on yielding support. The elasto-plastic model (model no. 3) showed results certainly too high, exceeding twice the underground measurements on average, that can be expressed as coefficient of conformity 38% between predicted and measured values. The chart of total displacements and mechanism of failure is presented on Figure 8. The zone of failure is formed in the floor of the opening due to tension and shearing. Its extent is 5.6 m. In the sidewalls the failure is caused by shear stress and reaches 3.2 m deep. In the crown, the yielded elements zone appears in the entire 1.5 m thick layer of coaly shale. However, such an extensive failure zone does not exist in reality.
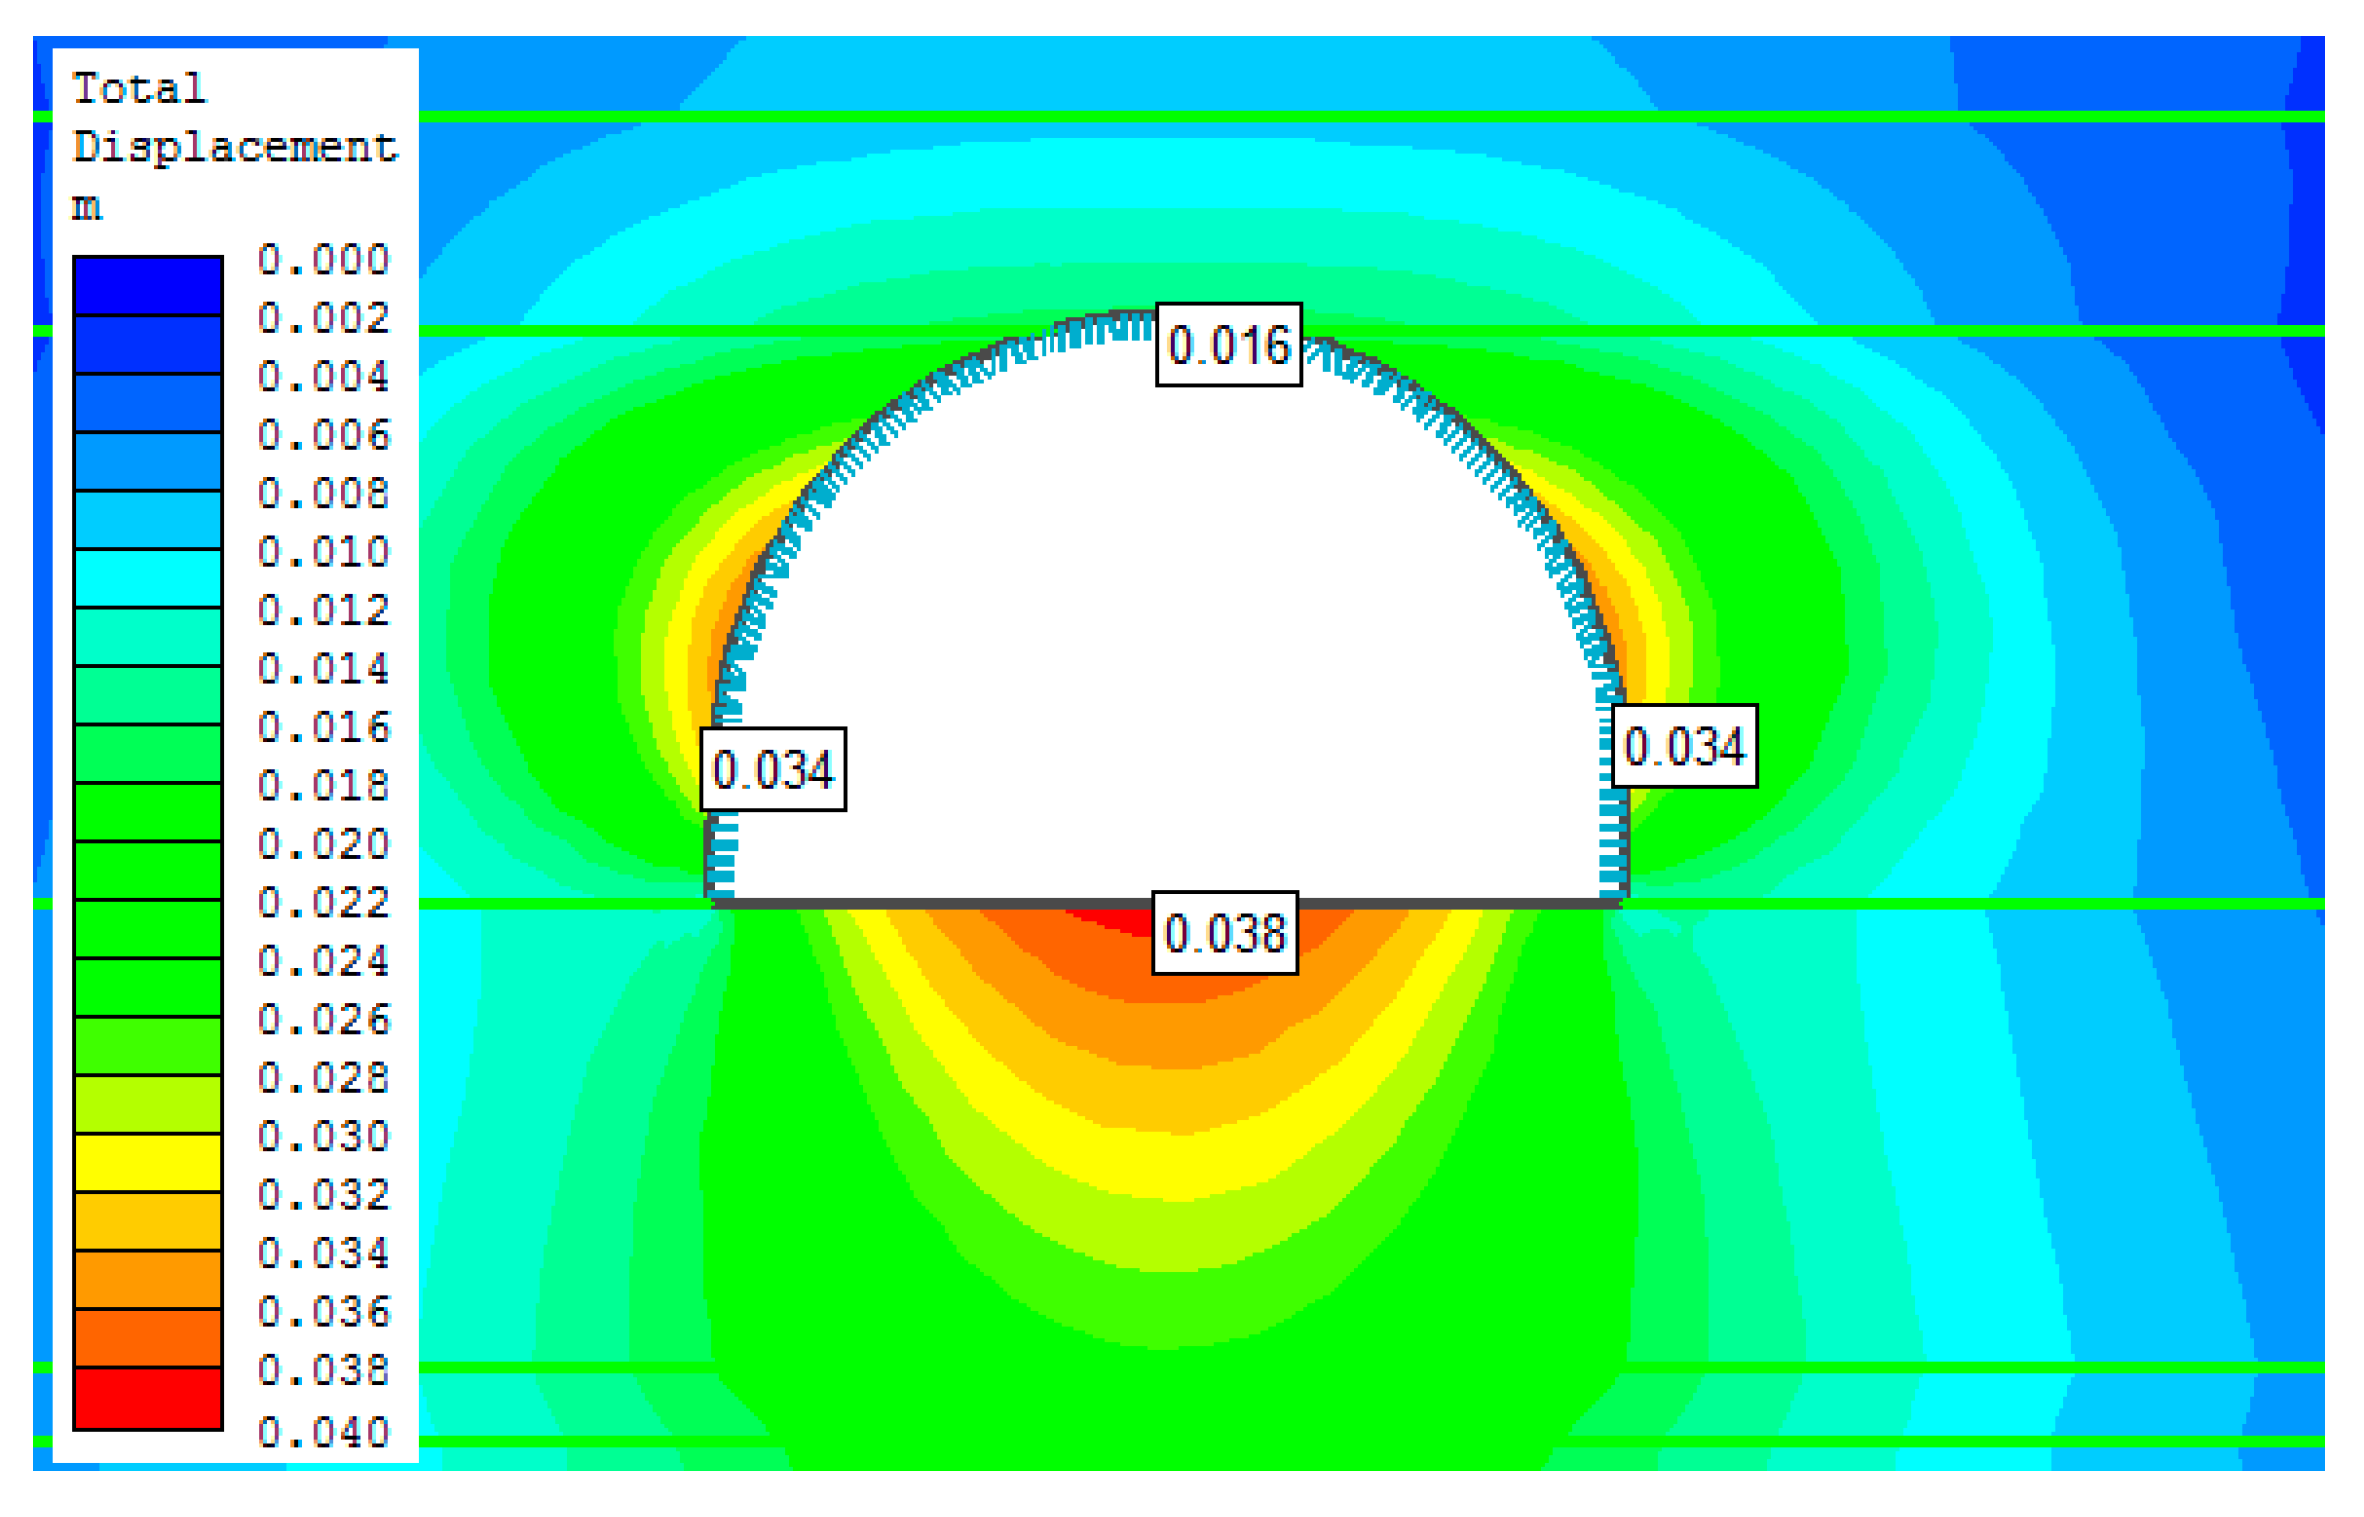
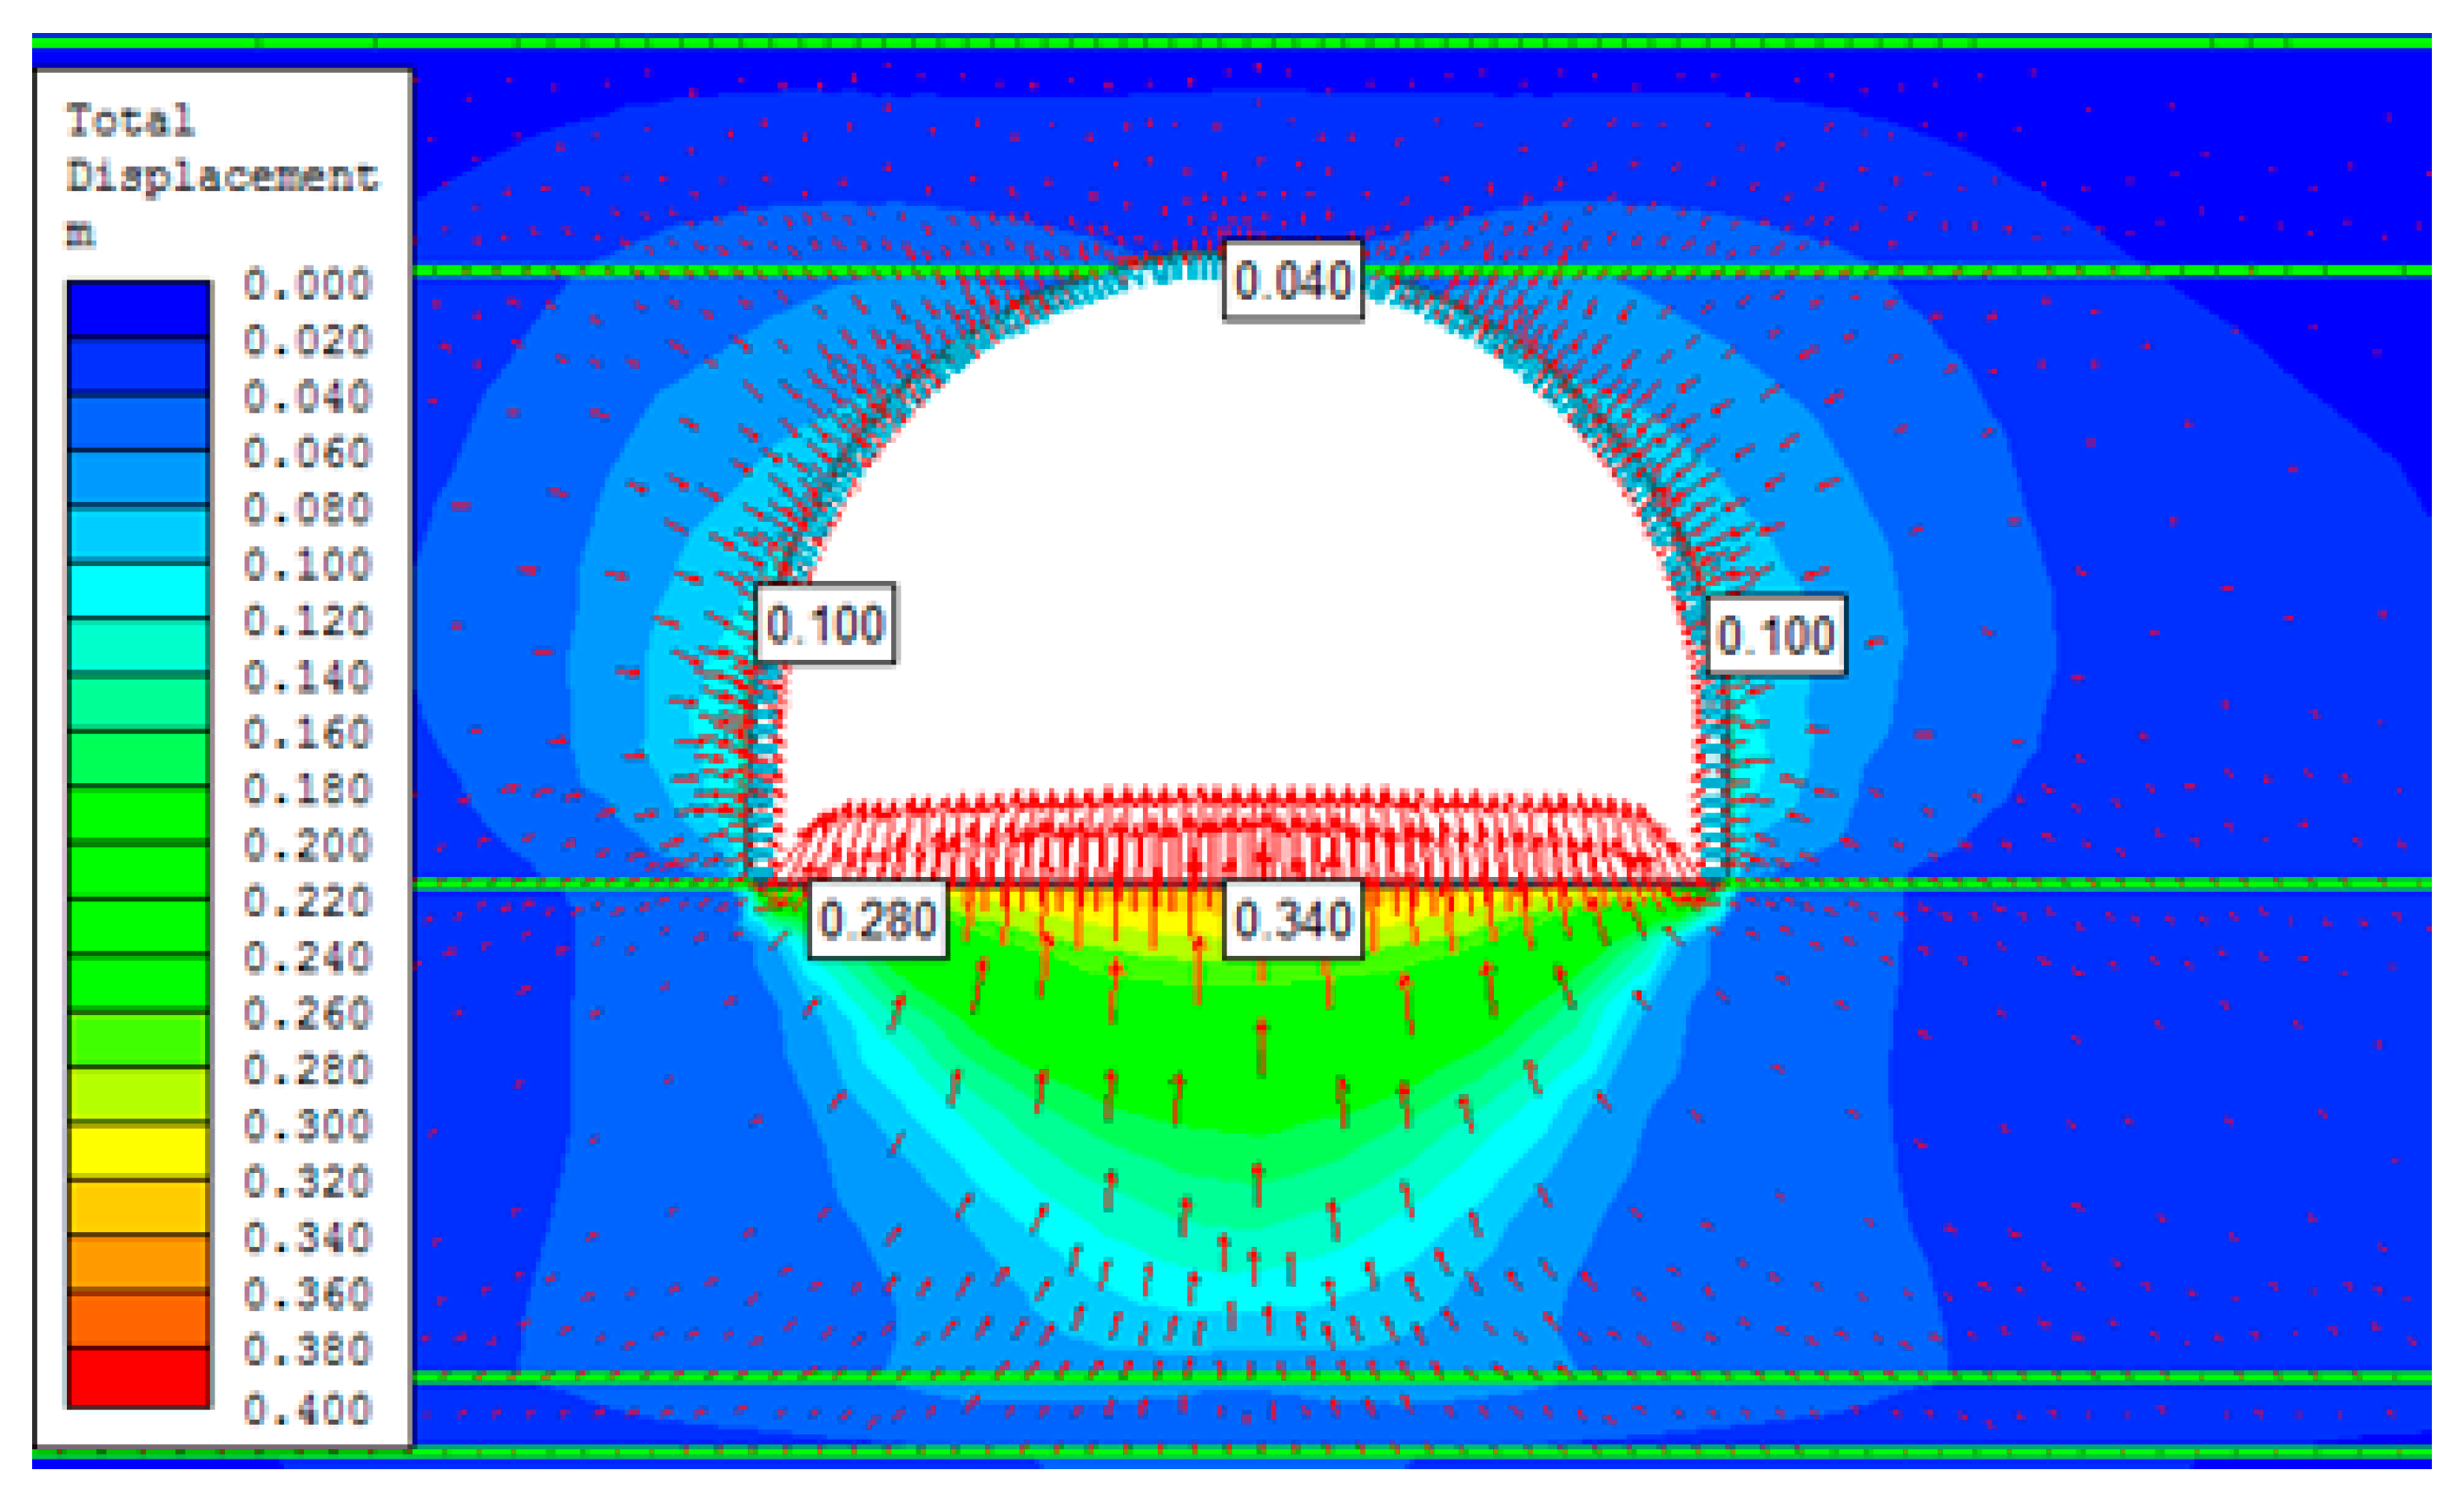
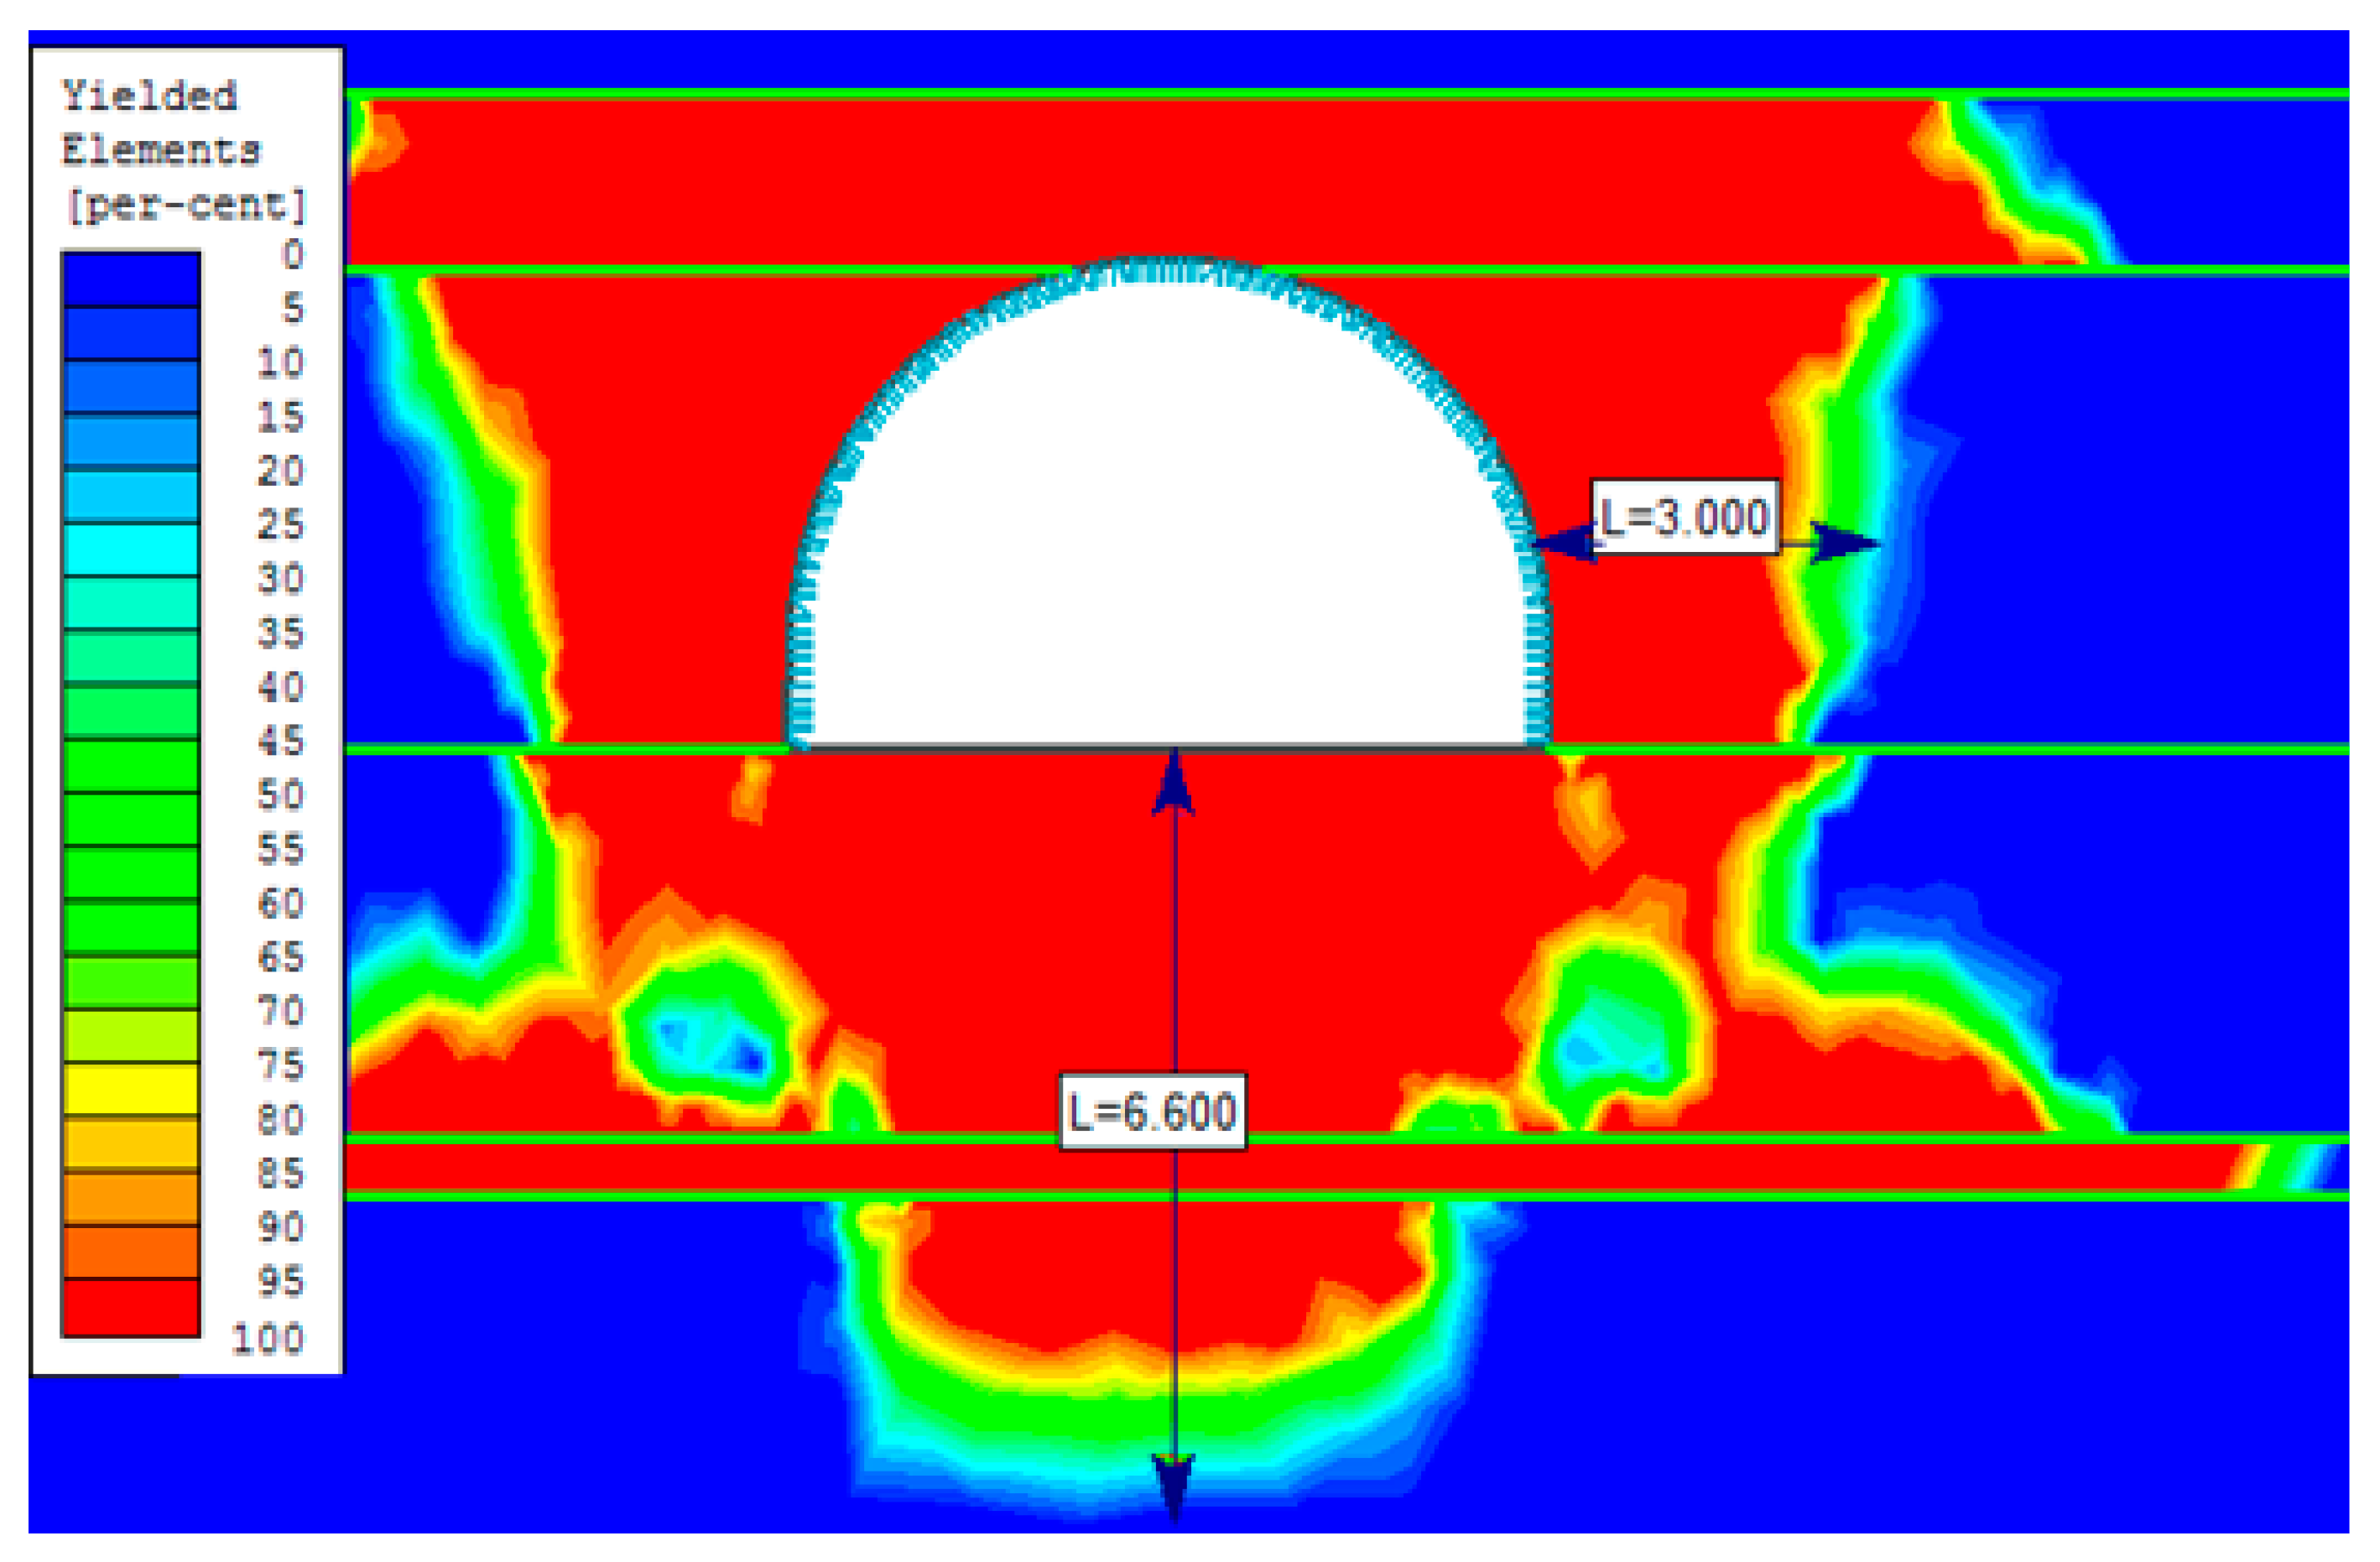
Almost entire conformity between generated and measured values was achieved for elasto-plastic model no. 1 (coefficient of conformity 96.9%—Table 4). The chart of total displacement generated from this model is presented on Figure 9. Movement of the floor appears nearly uniform on the full width of the opening and reaches approx. 34 cm, which is consistent with in situ measurements in the mine. The chart of yielded elements around the opening is shown on Figure 10. It is worth pointing out that it is almost identical with the one generated from model no. 3 (compare with Figure 7) in which the Young’s modulus of the rock mass was estimated empirically. The downward extent of the yield zone appears, reaching 5.8 m from the floor, whereas in the crown it spreads over the overlying layer of coaly shale and shows a clear boundary on the above layer of the strong sandstone. Towards the sidewalls the yield zone is 3 m deep. Therefore, it can be concluded that change of the Young’s modulus, which indicates the ratio between stress and strain, strongly affects total displacements. However, it does not significantly affect the extent of yield zone around the opening.
Satisfactory results were obtained from elasto-plastic models no. 7 and 8 that utilized the joint type contact between layers. It can be noted that in models no. 7 and 8 the selected parameters of normal and tangential stiffness of joint type contact did not significantly alter the convergence comparing to model no. 1. It appears different in the case of model no. 9 where the joint type contacts were given the ability of slide due to yield effect along the contact plane. However, introduction of these settings to the model no. 9 resulted in the least conformity between generated and measured convergence (i.e., approx. 38% against approx. 88% for models no. 7 and 8).
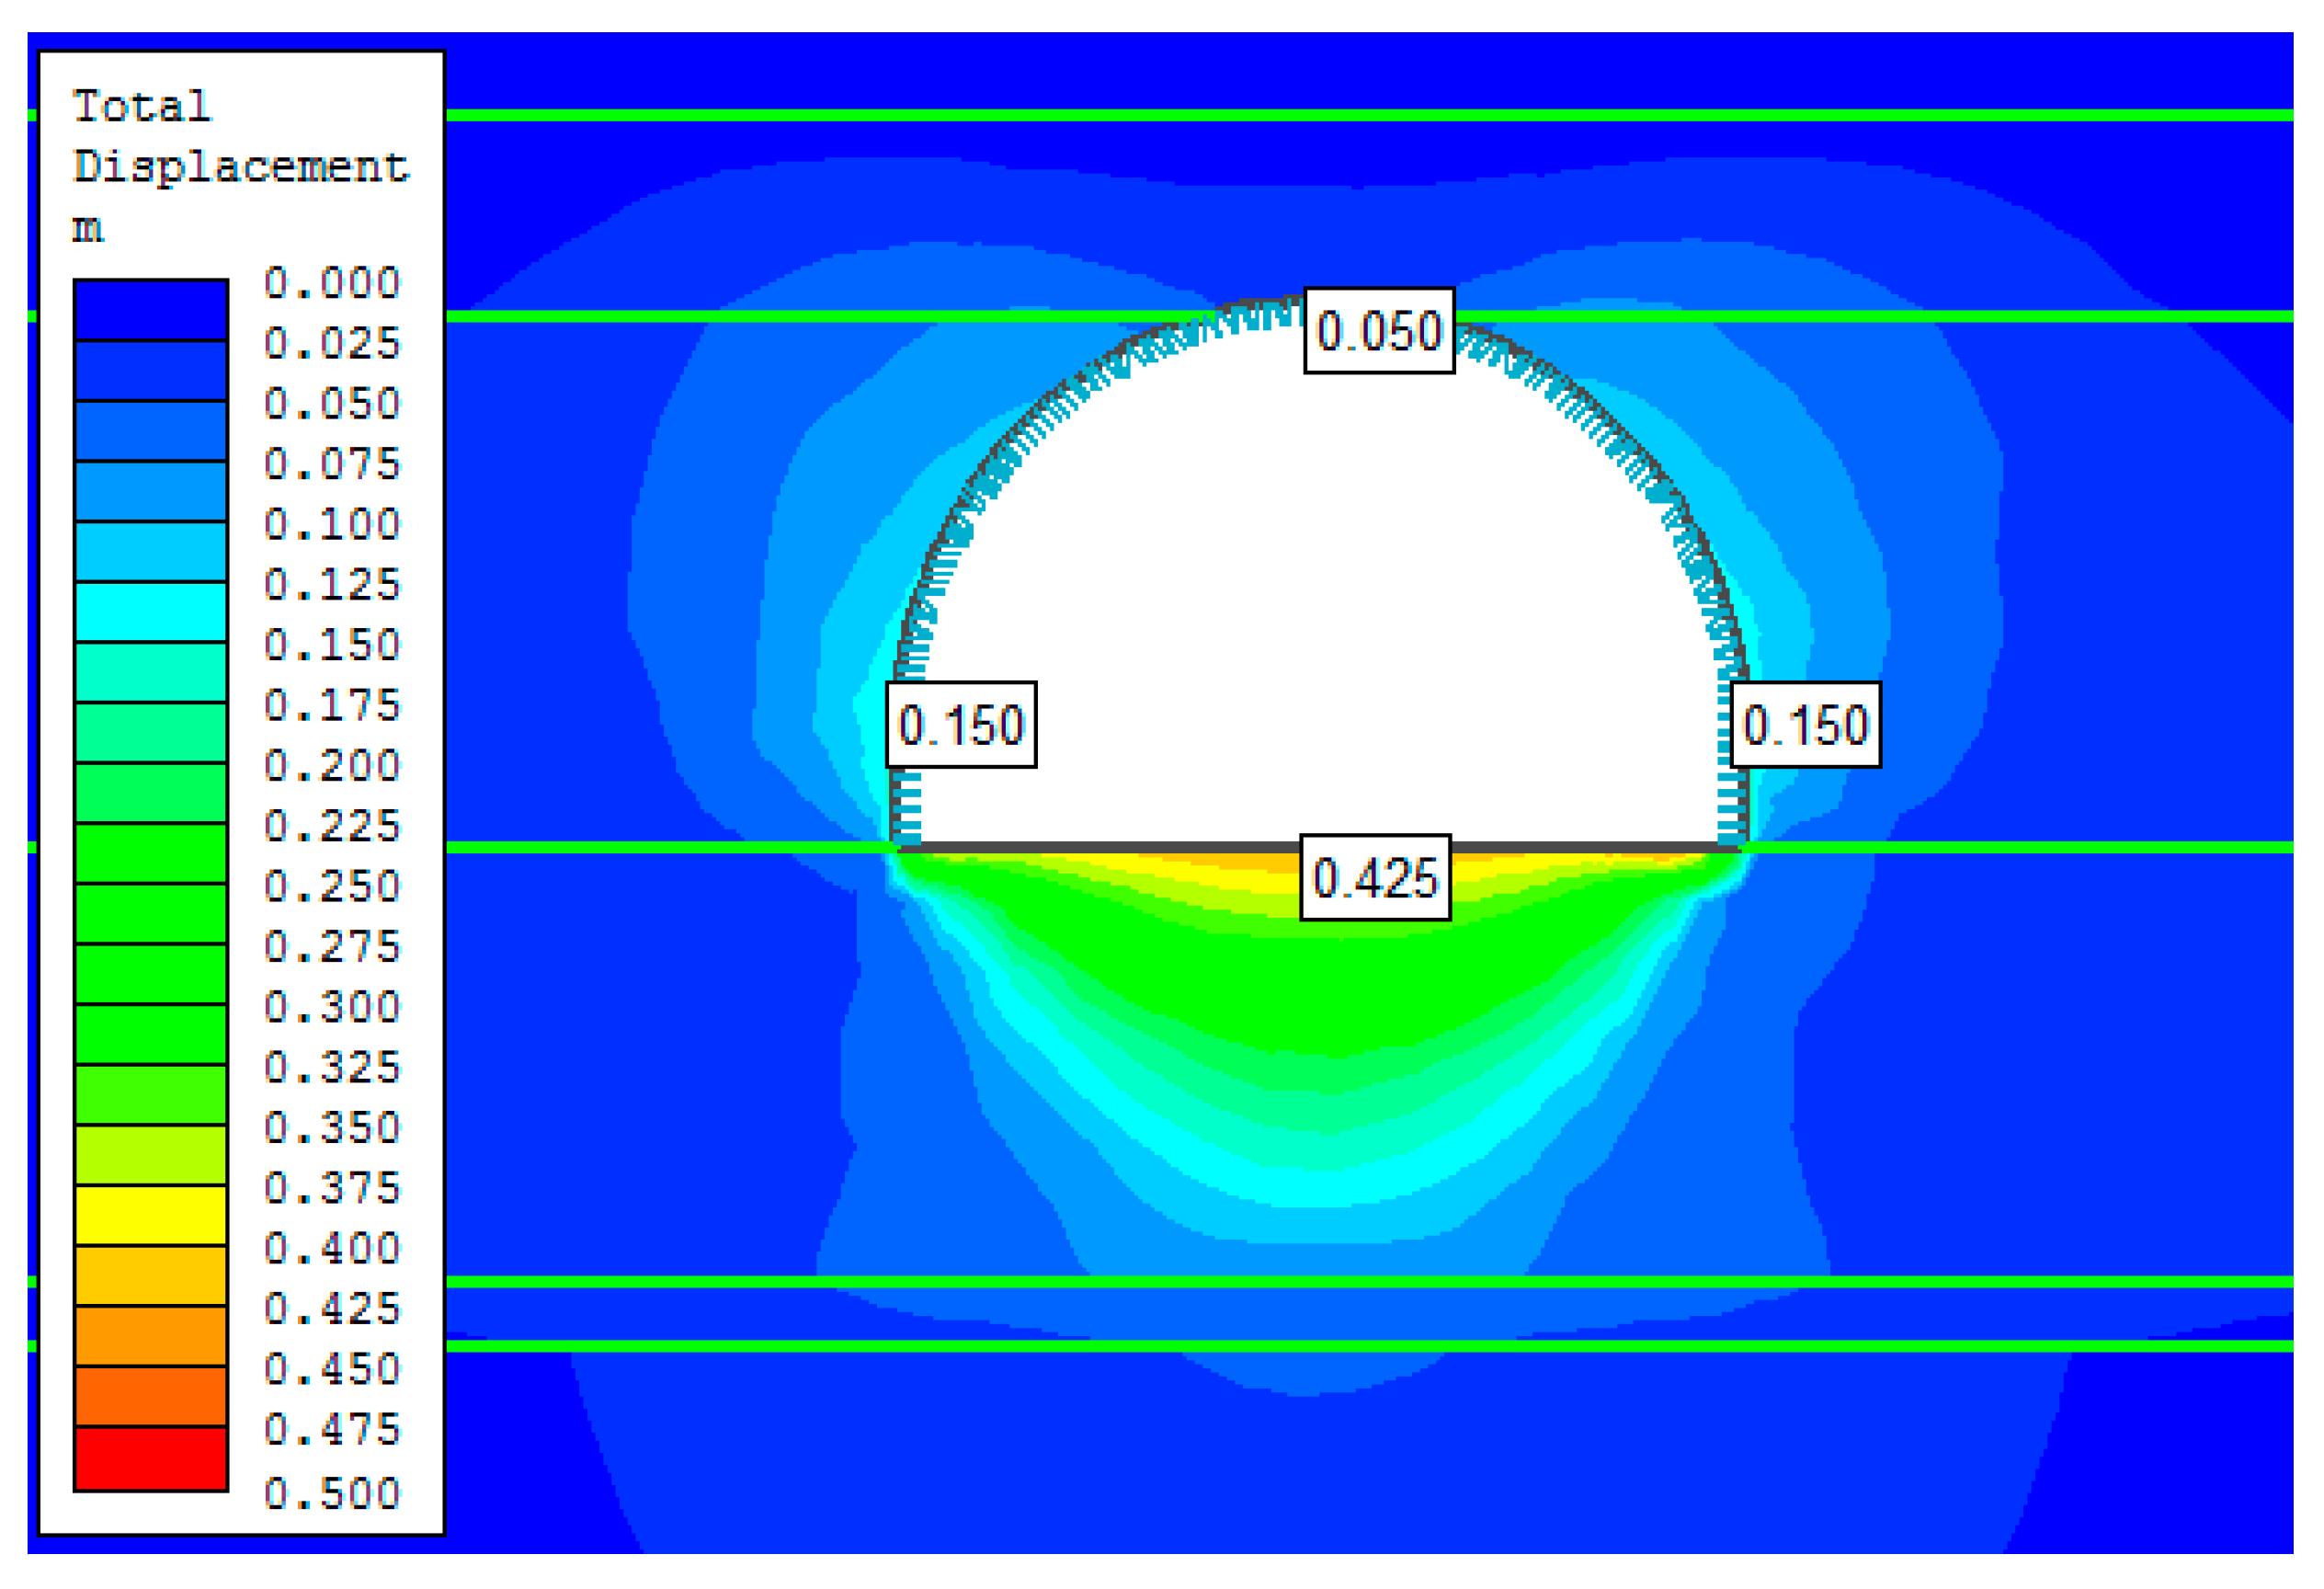
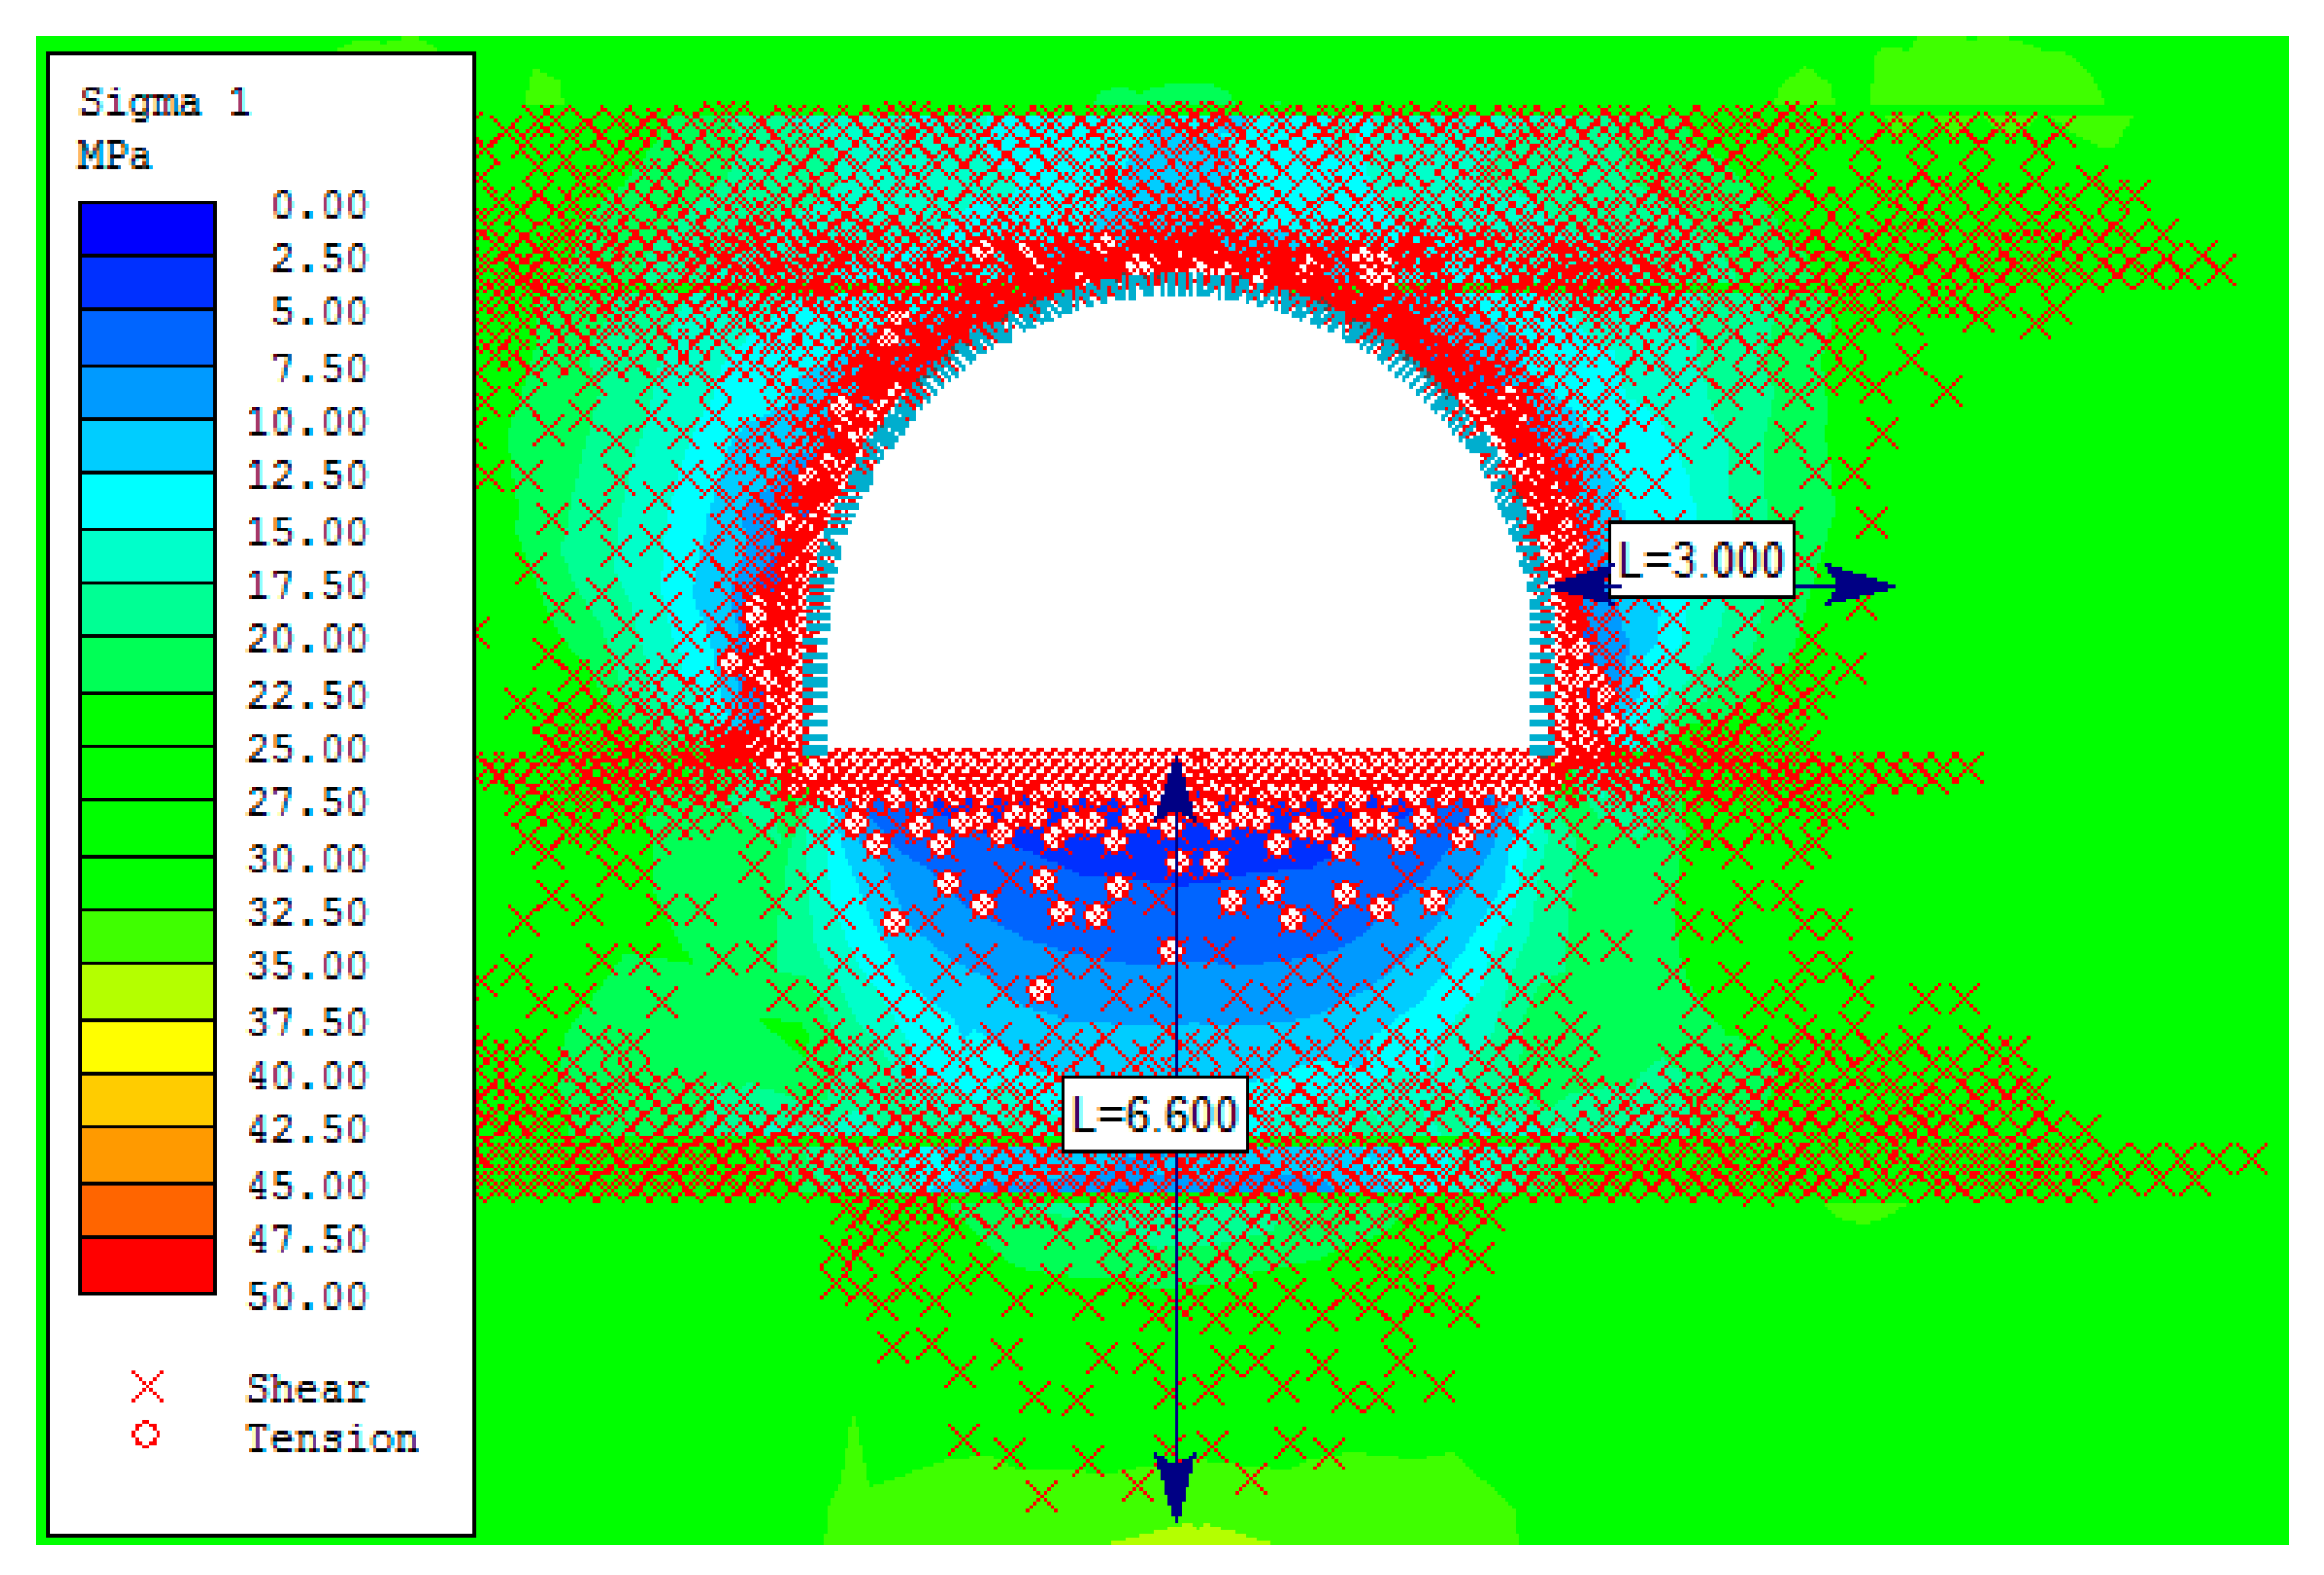
The most satisfactory results were obtained from model no. 6 with 20% post-failure strength weakening of the rock mass. Considering that the roadway needs to be maintained and used over a period of time, model no. 6 may prove to be the most one suitable for predicting the behavior of the opening under given conditions. It has been demonstrated that even after 450 days from completion of the opening the deformation of the rock mass may continue. The chart of total displacement is shown on Figure 11, and the chart of stress distribution around the opening on Figure 12. Due to weakening of post-failure parameters of about 20% the yield zone below the floor increases from 5.8 to 6.6 m comparing to equivalent model yet without weakening of the rock mass (compare to Figure 7), whereas the decreasing of post-failure parameters does not affect the zone of yield above the roof and beyond the sidewalls. Directly at the contour of the opening the destruction of the rock is due to tension, where the depth of the tension zone is from approx. 80 cm in the crown and sidewalls to approx. 1.5 m below the floor.
4.3. Section of the Roadway within the Fault Zone
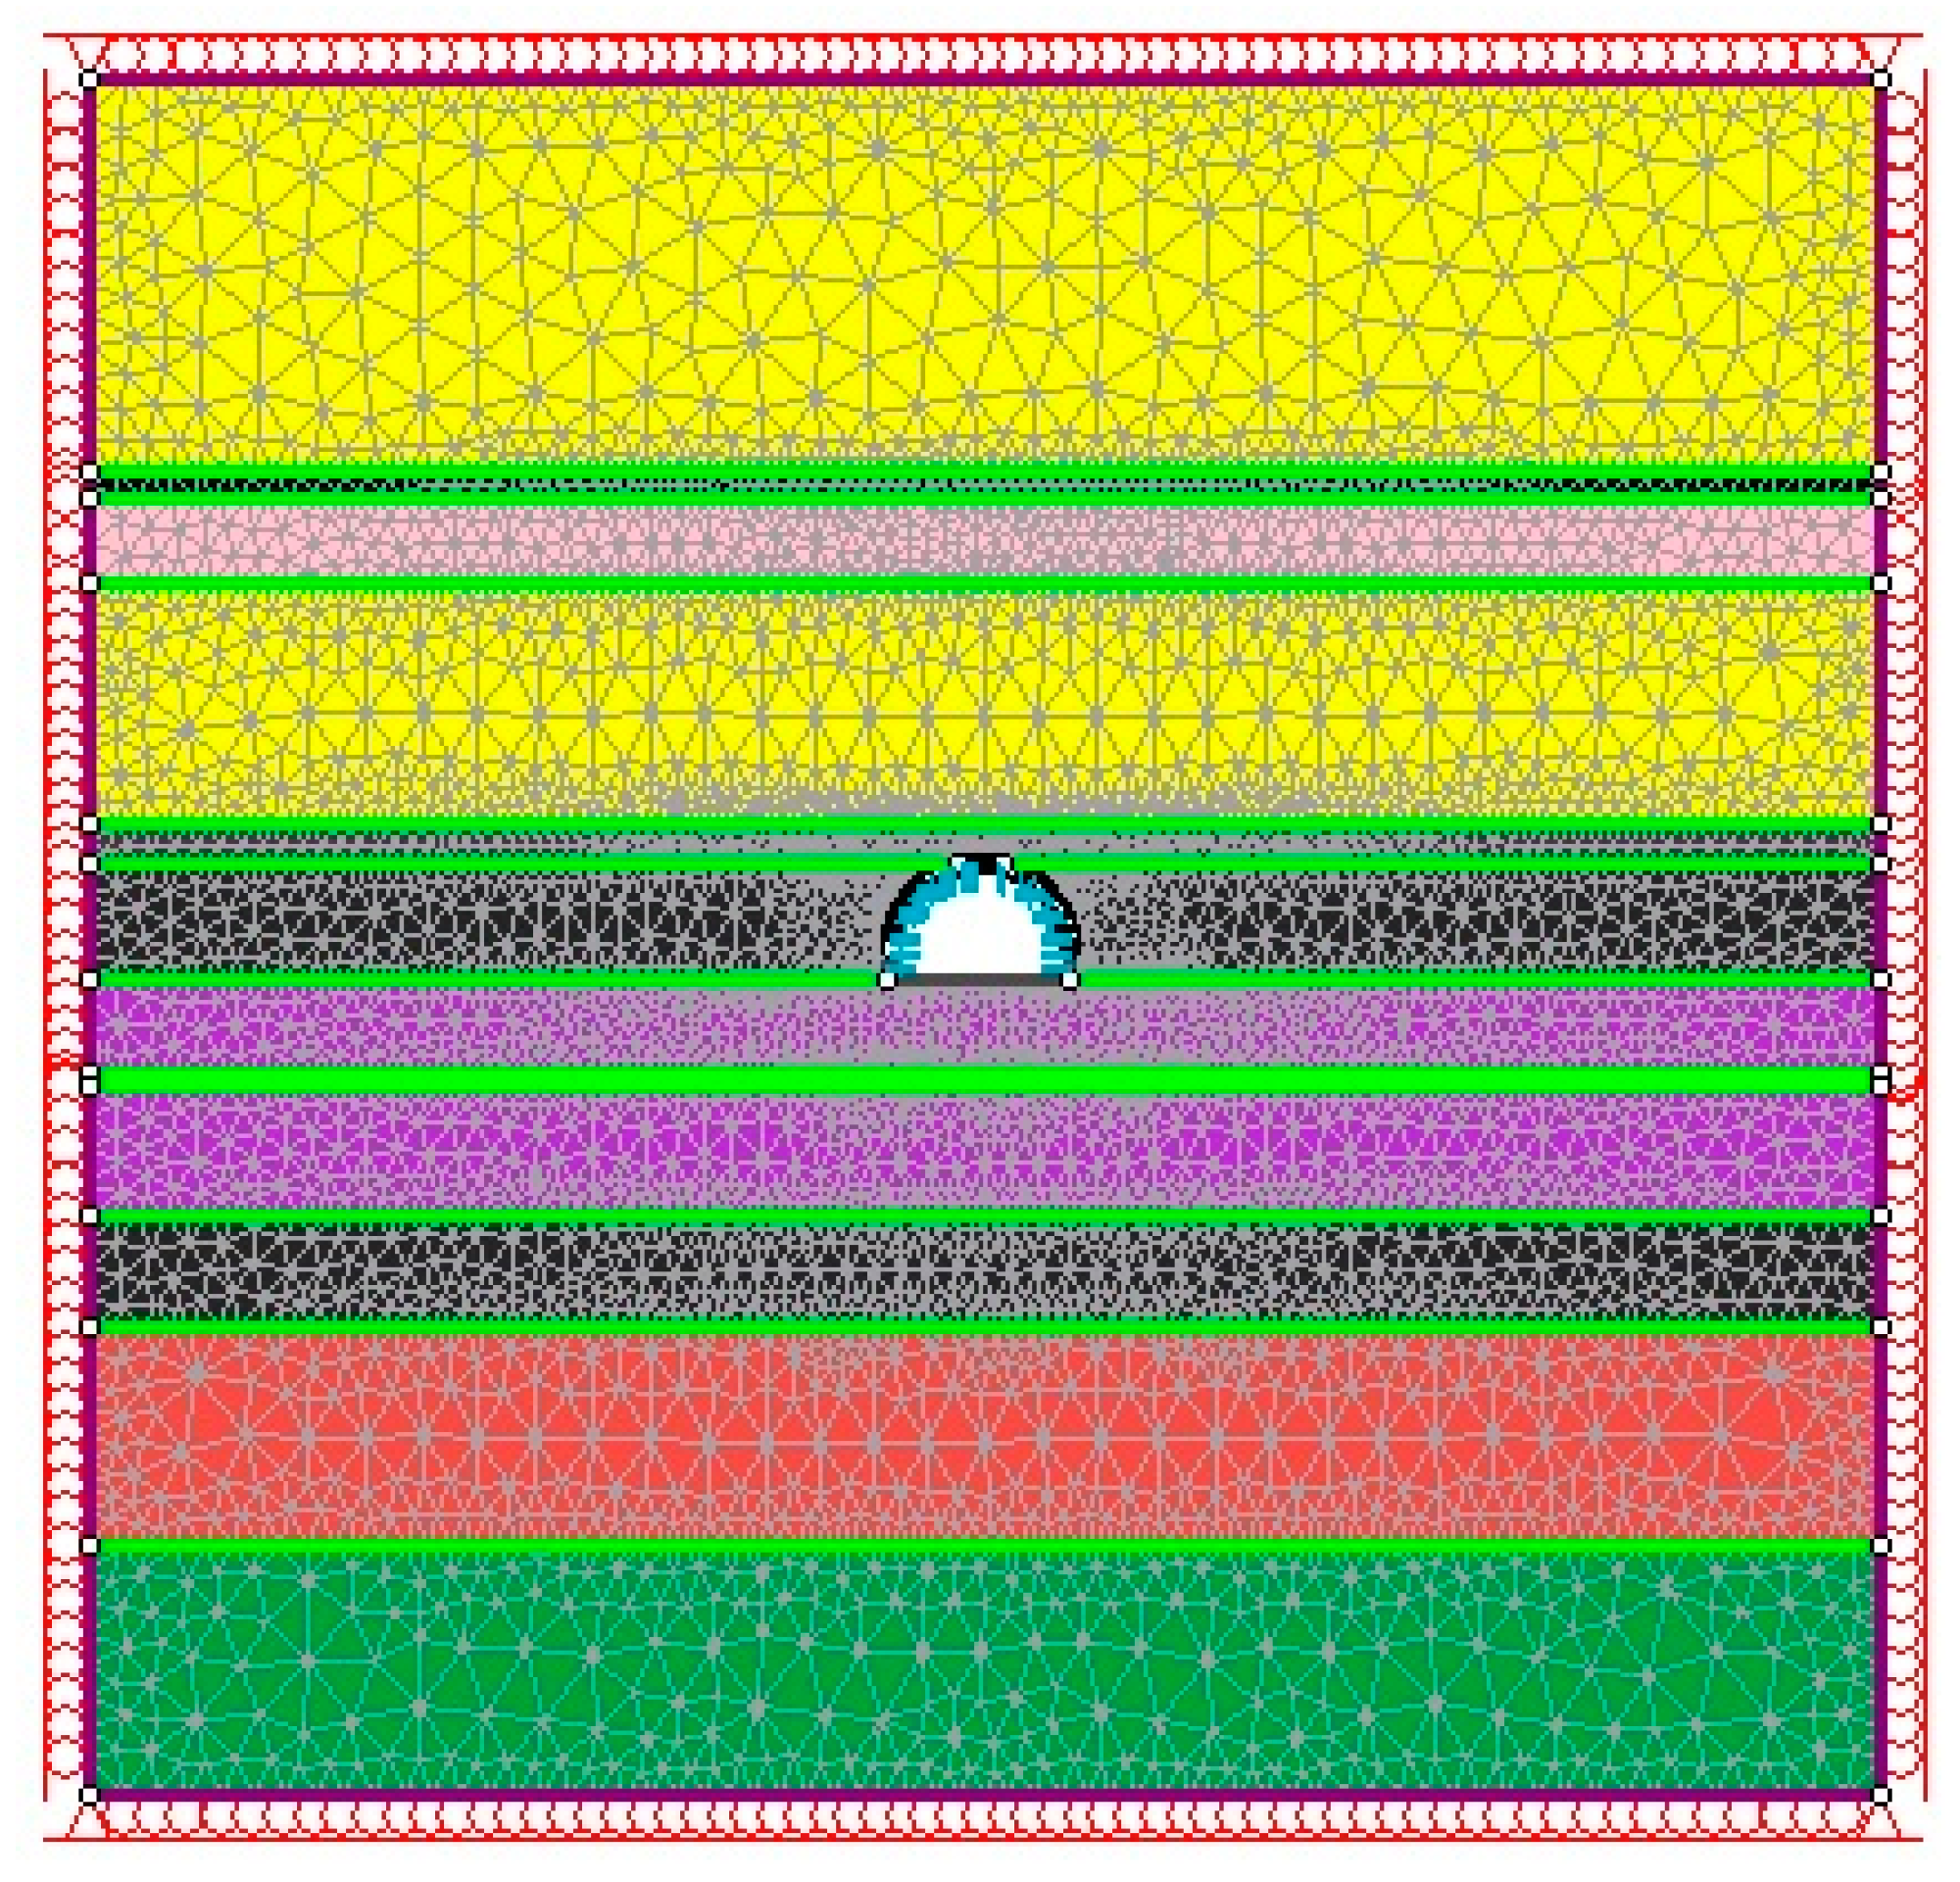
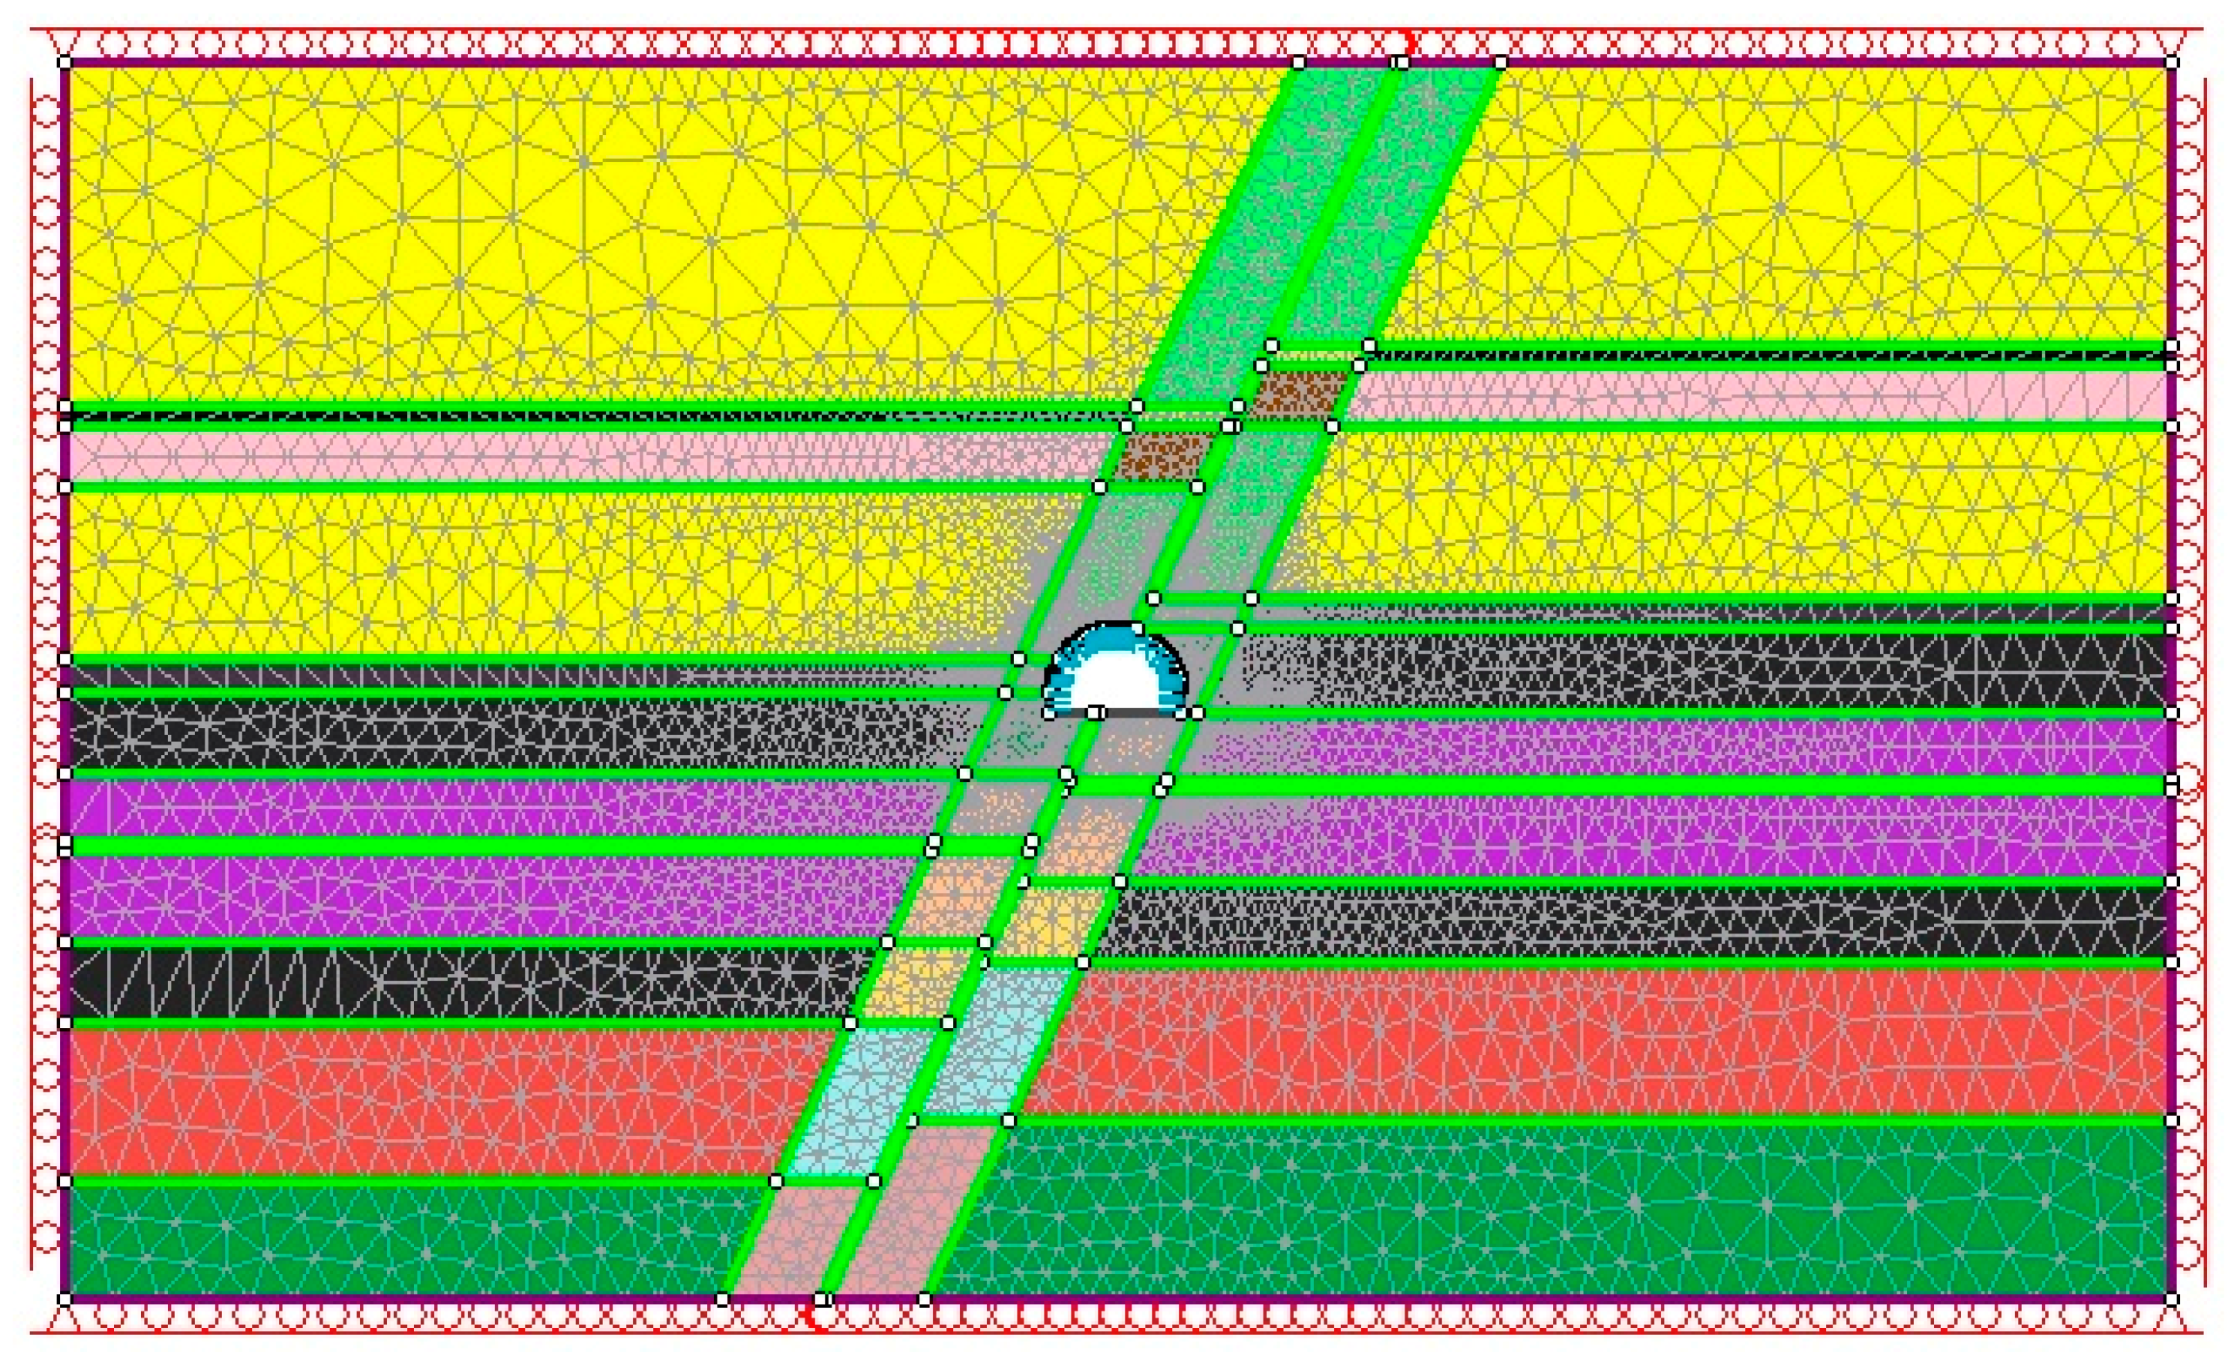
For the section intersecting fault zone dimensions of the rock mass model were: height 60 m, width 100 m (Figure 13). The total number of nodes and elements for the model in this case amounted to 7042 and 13,803, but the mesh density and the size of elements next to the roadway were the same, so the discretization didn’t influence the results of the calculations. The fault is represented in the model as a zone of lower mechanical parameters. The extent of the zone is assumed to be 5 m on both: the footwall and hanging wall side, based on experience discussed in Chapter 2 [2,3,5,9]. For all models, it is assumed also that the compressive strength UCS within tectonically disturbed zone is 50% smaller compared to the unaffected section. The fault plane is modelled as a 30 cm thick band of tectonic breccia, as observed in the Maingate D-2, and featuring ca. 10 times lower mechanical parameters than intact rocks in this area.
The 2-D geological model depicts dislocation of the strata consistently with 3 m throw of the fault, its slip direction and magnitude. The fault plane dip is assumed to be 65° after geological documentation of the area (Figure 13). The change of the fault angle parallel to the roadway axis hasn’t been considered in 2-D model.
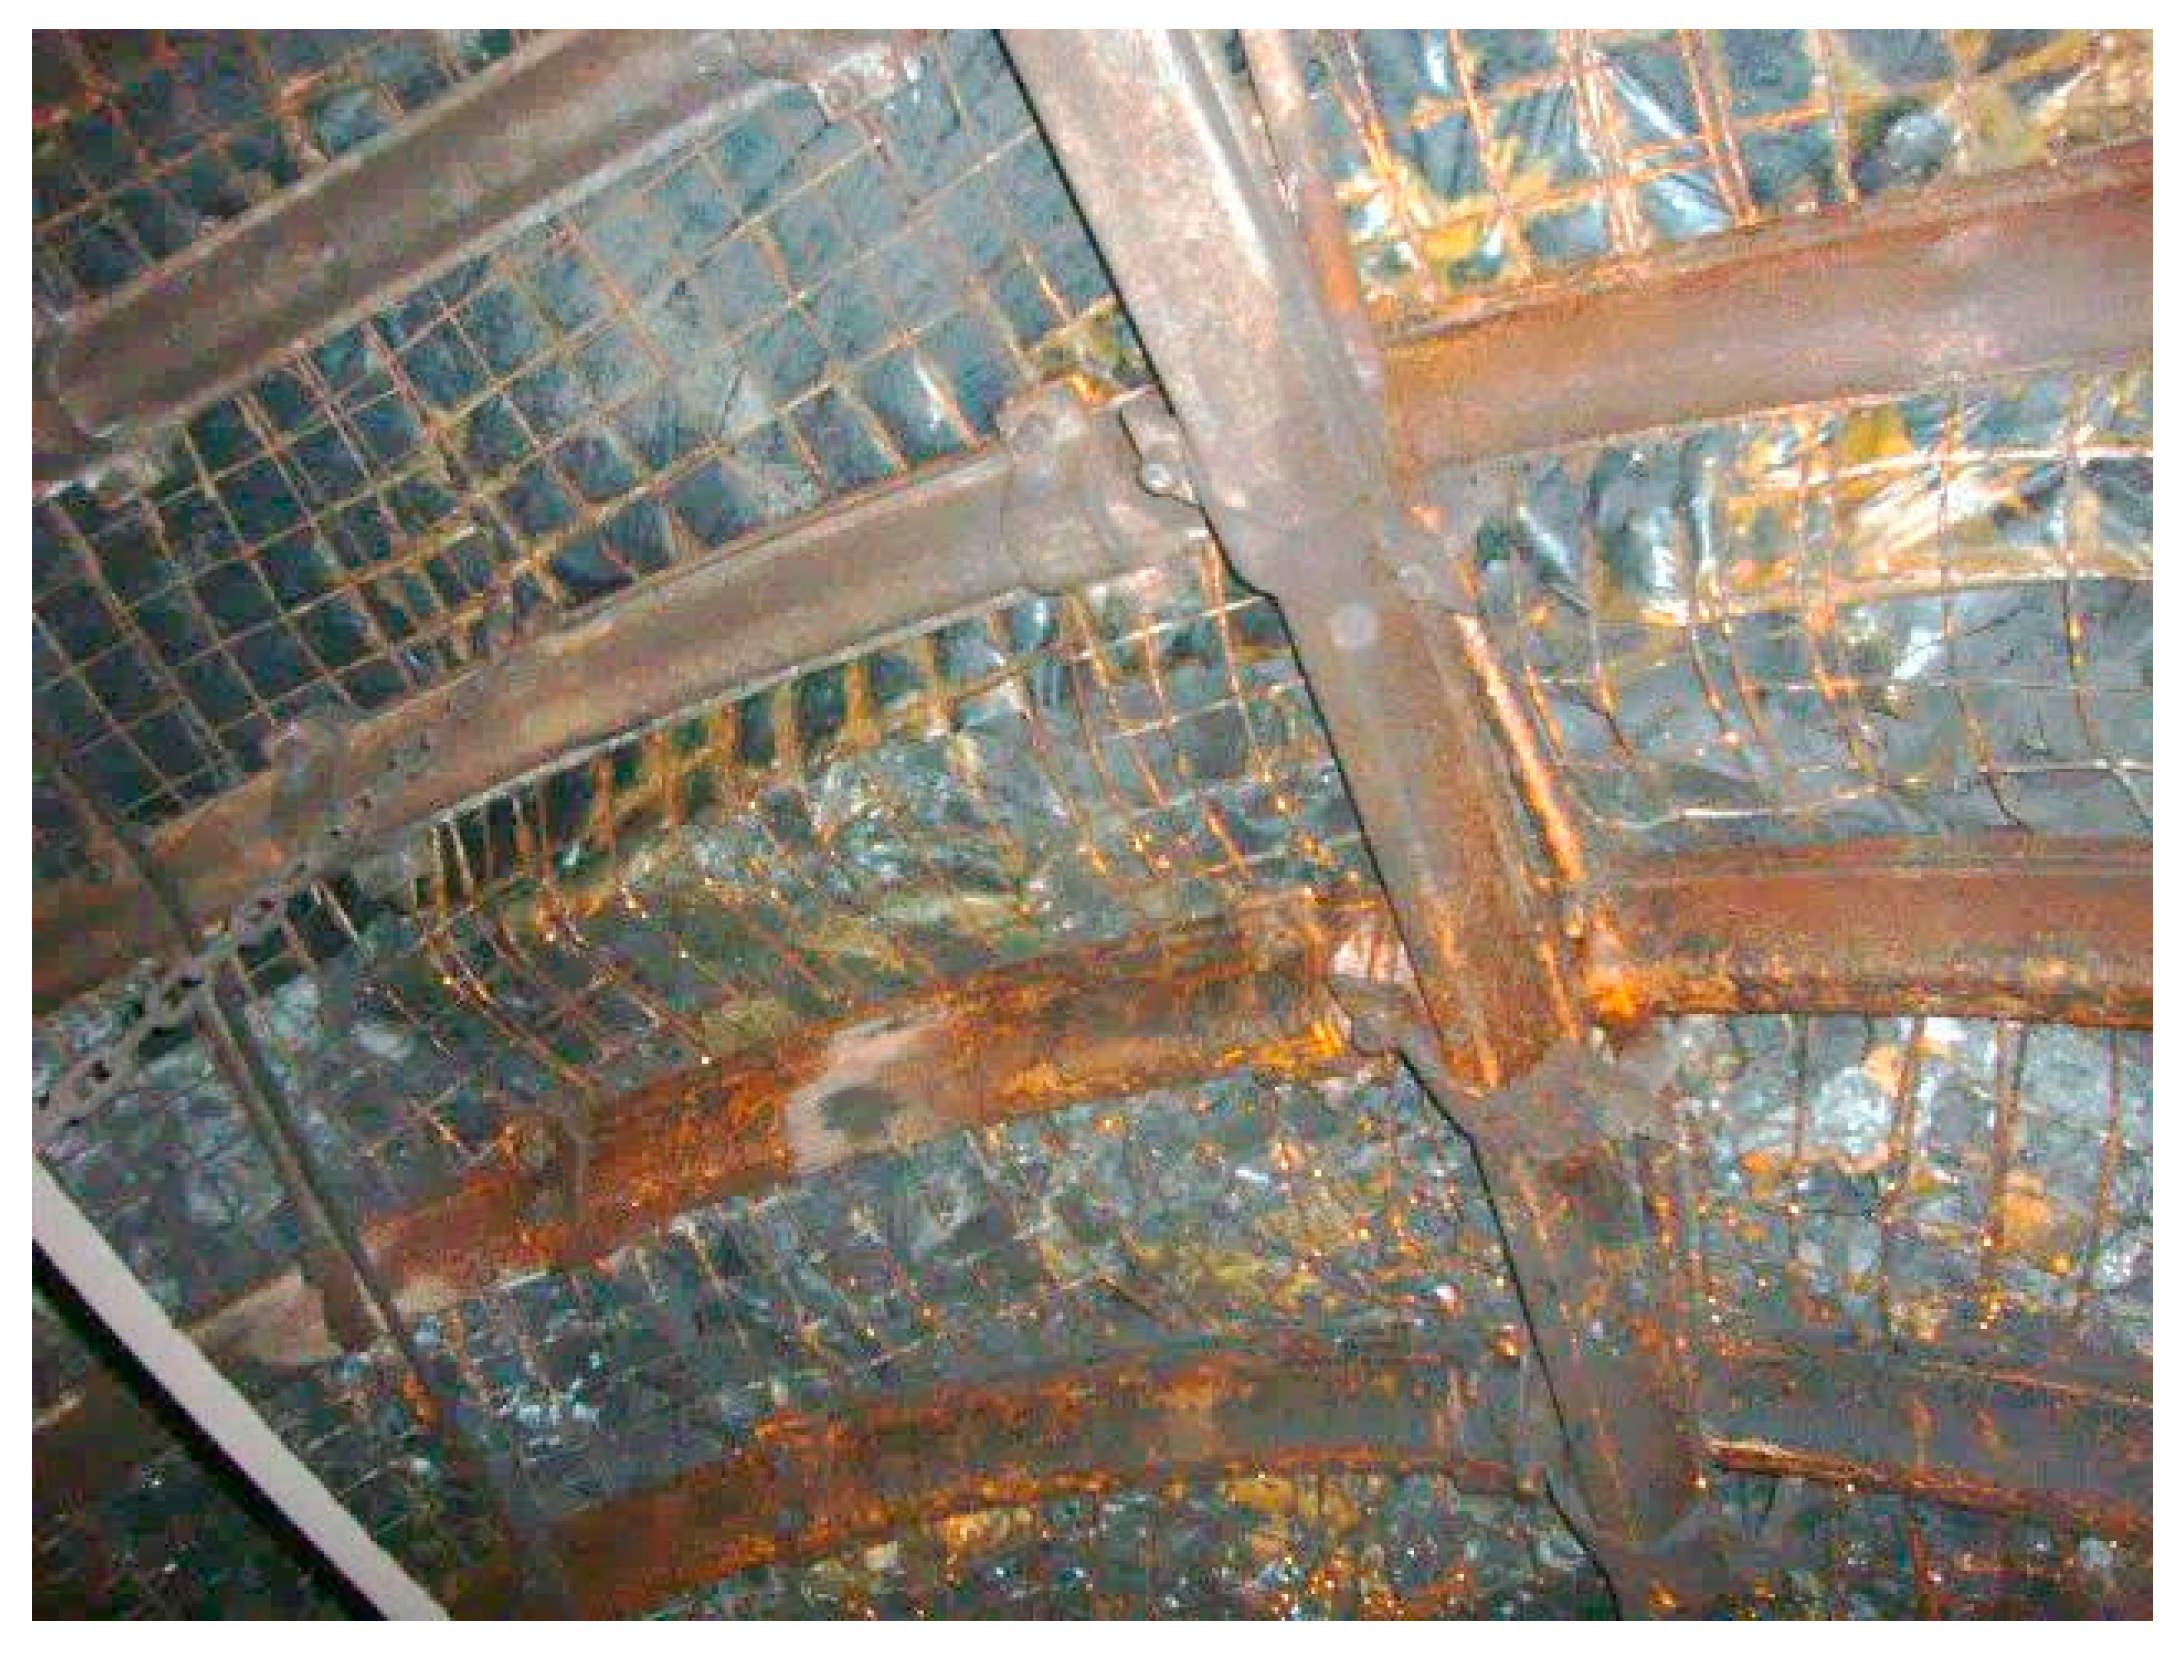
When modelling the fault effect on the stability of the roadway the authors utilized the experience from modelling of the section beyond the fault zone. For this purpose, eight numerical models were elaborated excluding elastic models. In all models, the elasto-plastic rock mass was assumed. A minor leakage was found during site visits from the fault fracture in the maingate D-2. The leakage causes corrosion of many roof arches of the support (Figure 14).
On that section, the observed movements on roof arches joints and roof-sidewall arches clamps were not bigger than several millimeters. Based on these observations it was specified, that for the stiffened support structure, half of the models did not feature the ability of clamp movement, whereas in the second half this option is enabled and is set as 0.5% of the support cross section contour, i.e., movement approx. 7 cm along the joint (models no. 1, 4, 6 and 8).
The features of all physical models designed to analyze the effect of the fault on deformation of the roadway are compiled in Table 6. Normal stiffness kn and shear stiffness ks are provided in cases where contact types played a role in the model. In this case (models no. 5–8) the stiffness considered the inter-bed contacts inside the damage zone is assumed dozen hundred times lower than for intact rock beds as in the models studied for the roadway section beyond the fault zone. It was assumed that normal to shear stiffness ratio is equal 3:1 that is suggested as optimal [23], therefore the normal and shear stiffness for models no. 5 and 6 amount to kn = 150 MPa/m, ks = 50 MPa/m (case 4) and for models no. 7 and 8 amount to kn = 300 MPa/m, ks = 100 MPa/m (case 5). Parameters of the contact for all models are given in Table 6. The applied higher values of contact stiffness are typical for Carboniferous sandstone [23], which is present in the roof of the roadway being analyzed.
The comparison of the results generated from the models and in situ measurements in the mine is presented in Table 7. Generally, after the exclusion of several of the models on the first stage of the investigation, the generated results are largely consistent with in situ measurements despite that the obtained horizontal convergence values were too high up to 70% (model no. 4). In the case of vertical deformations and upheaval of the floor the modelled and factual values differed not more than 26%, and most often the difference was not bigger than 10%. All results from models no. 1 and 2 (except movement of the roof in model no. 1) show only a dozen or so percent difference to the measurements on monitoring stations (Table 7). Settings of the elasto-plastic model with 20% post-failure strength weakening for the section affected by the fault (models no. 3 and 4) produced values most consistent with in situ measurements at monitoring stations. Exceptionally good conformity is shown in model no. 3 in which the support is assumed without movement along joints.
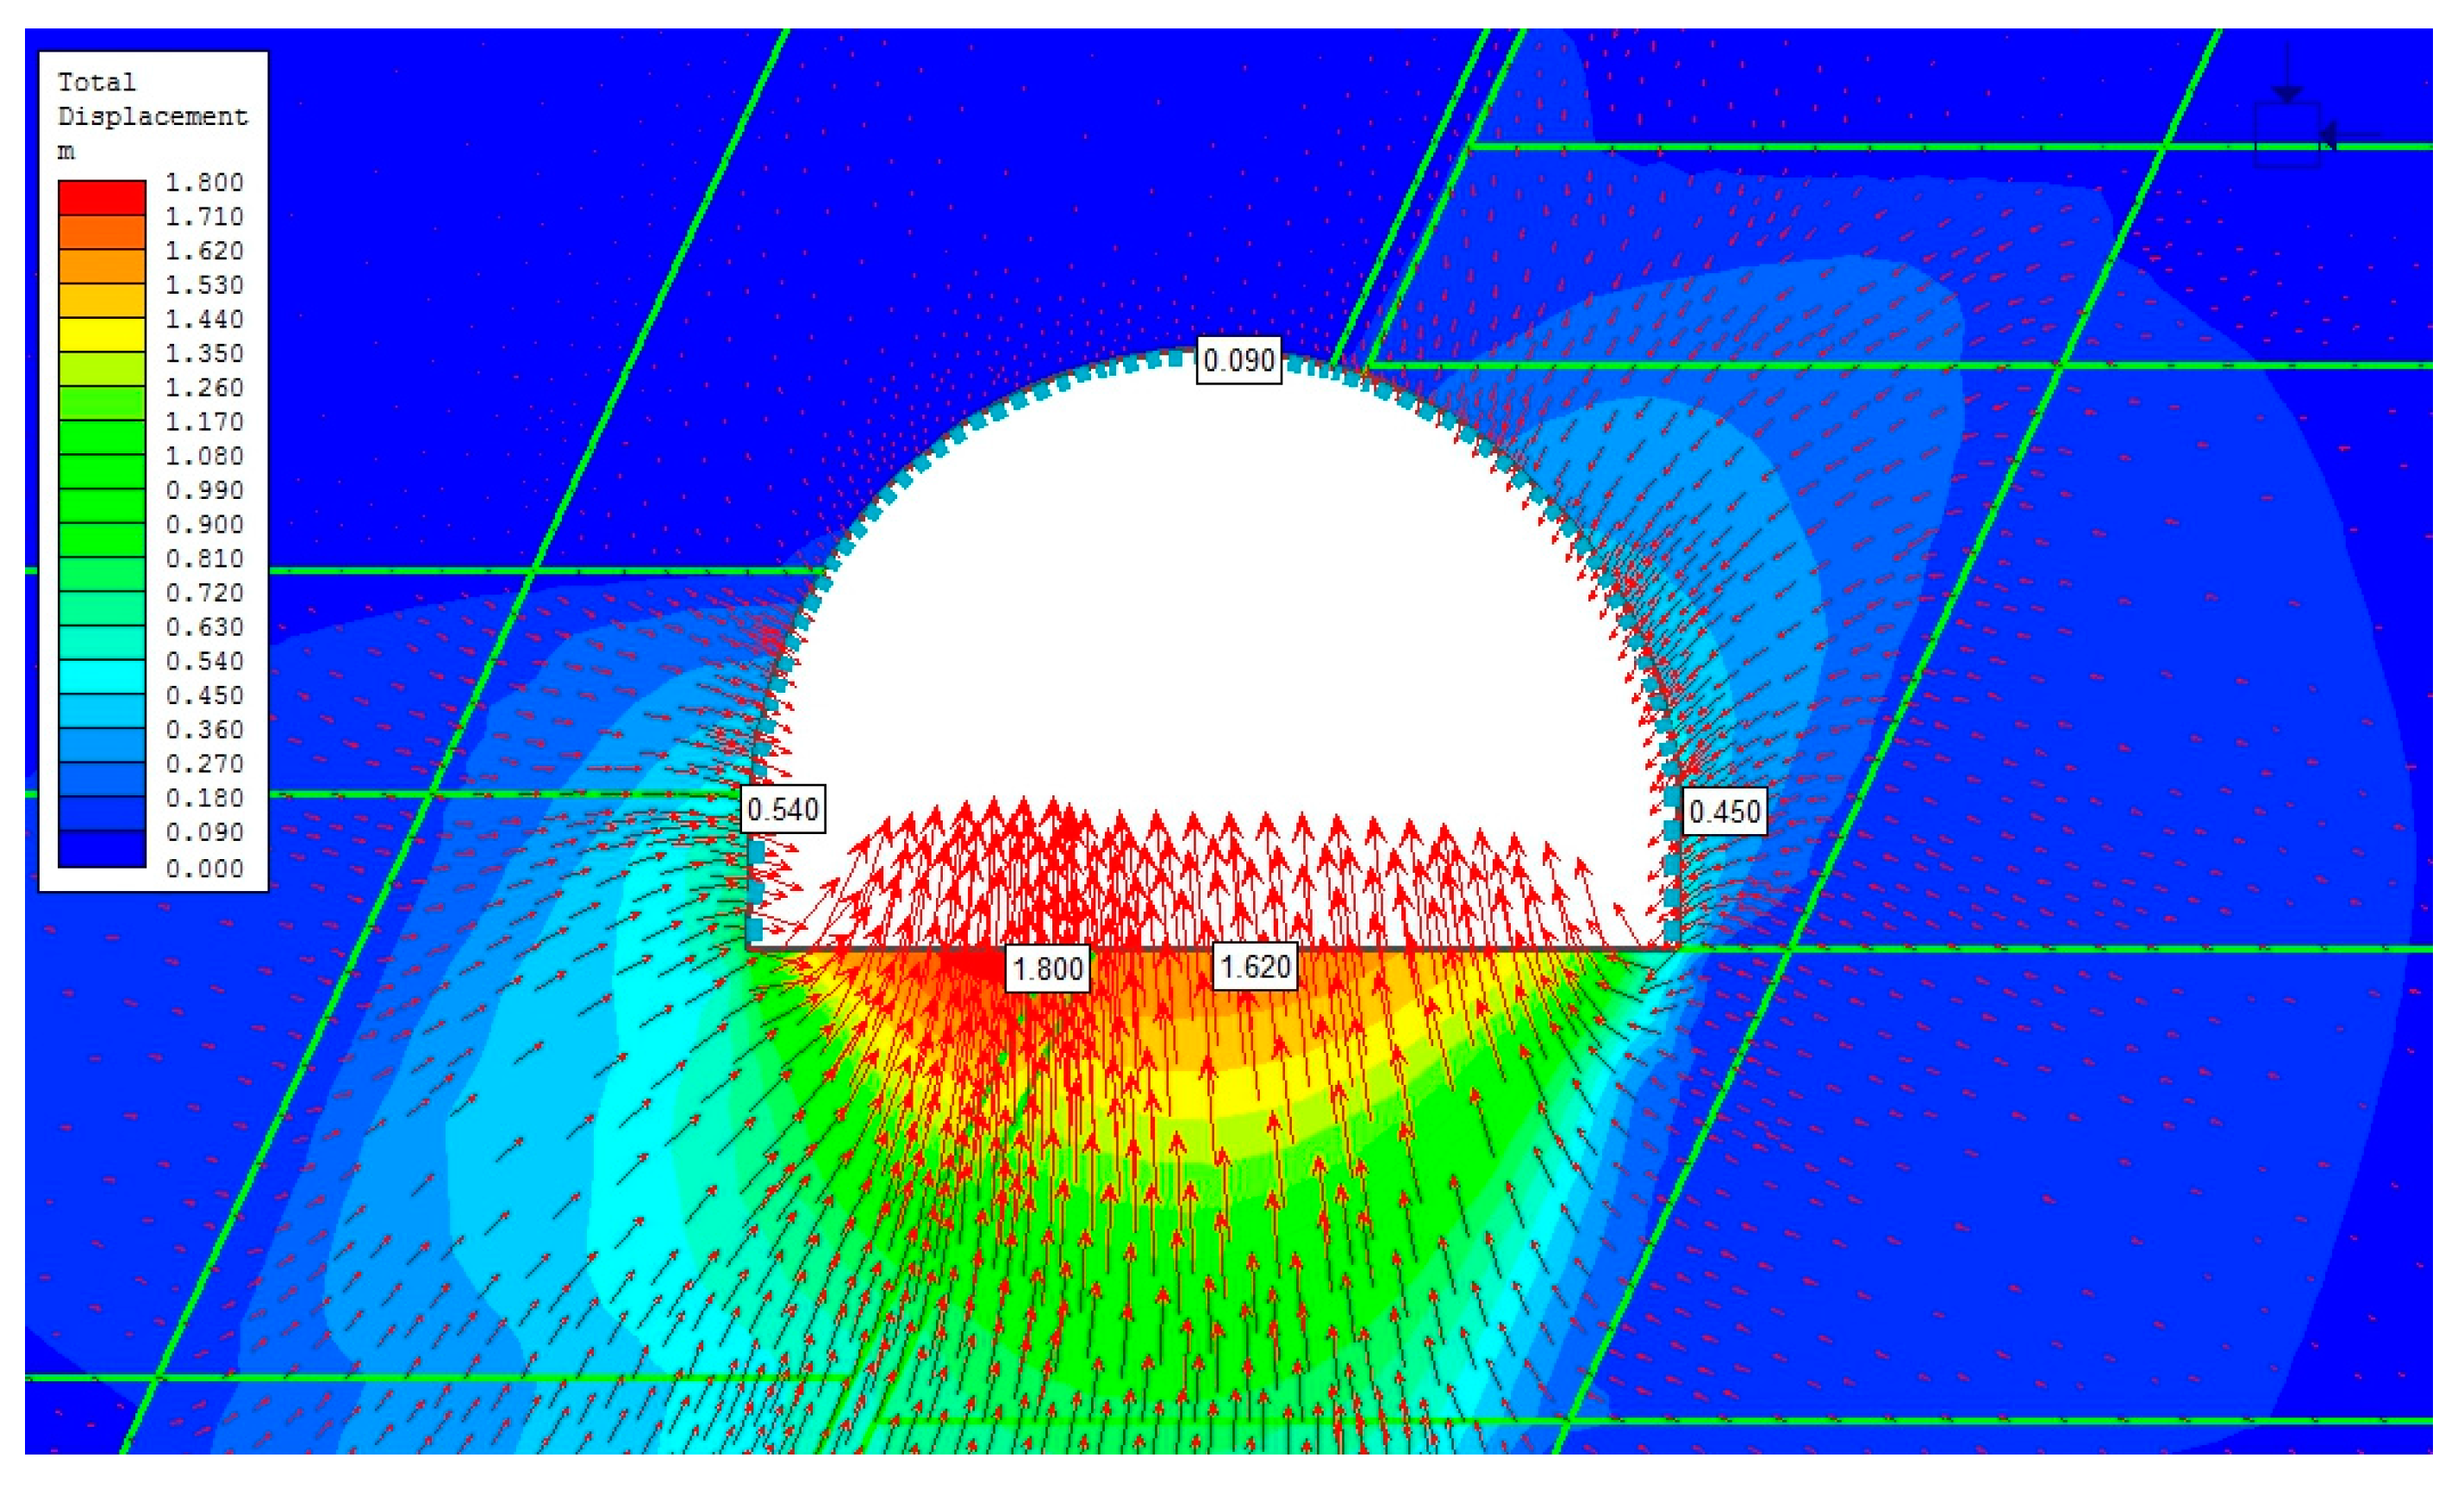
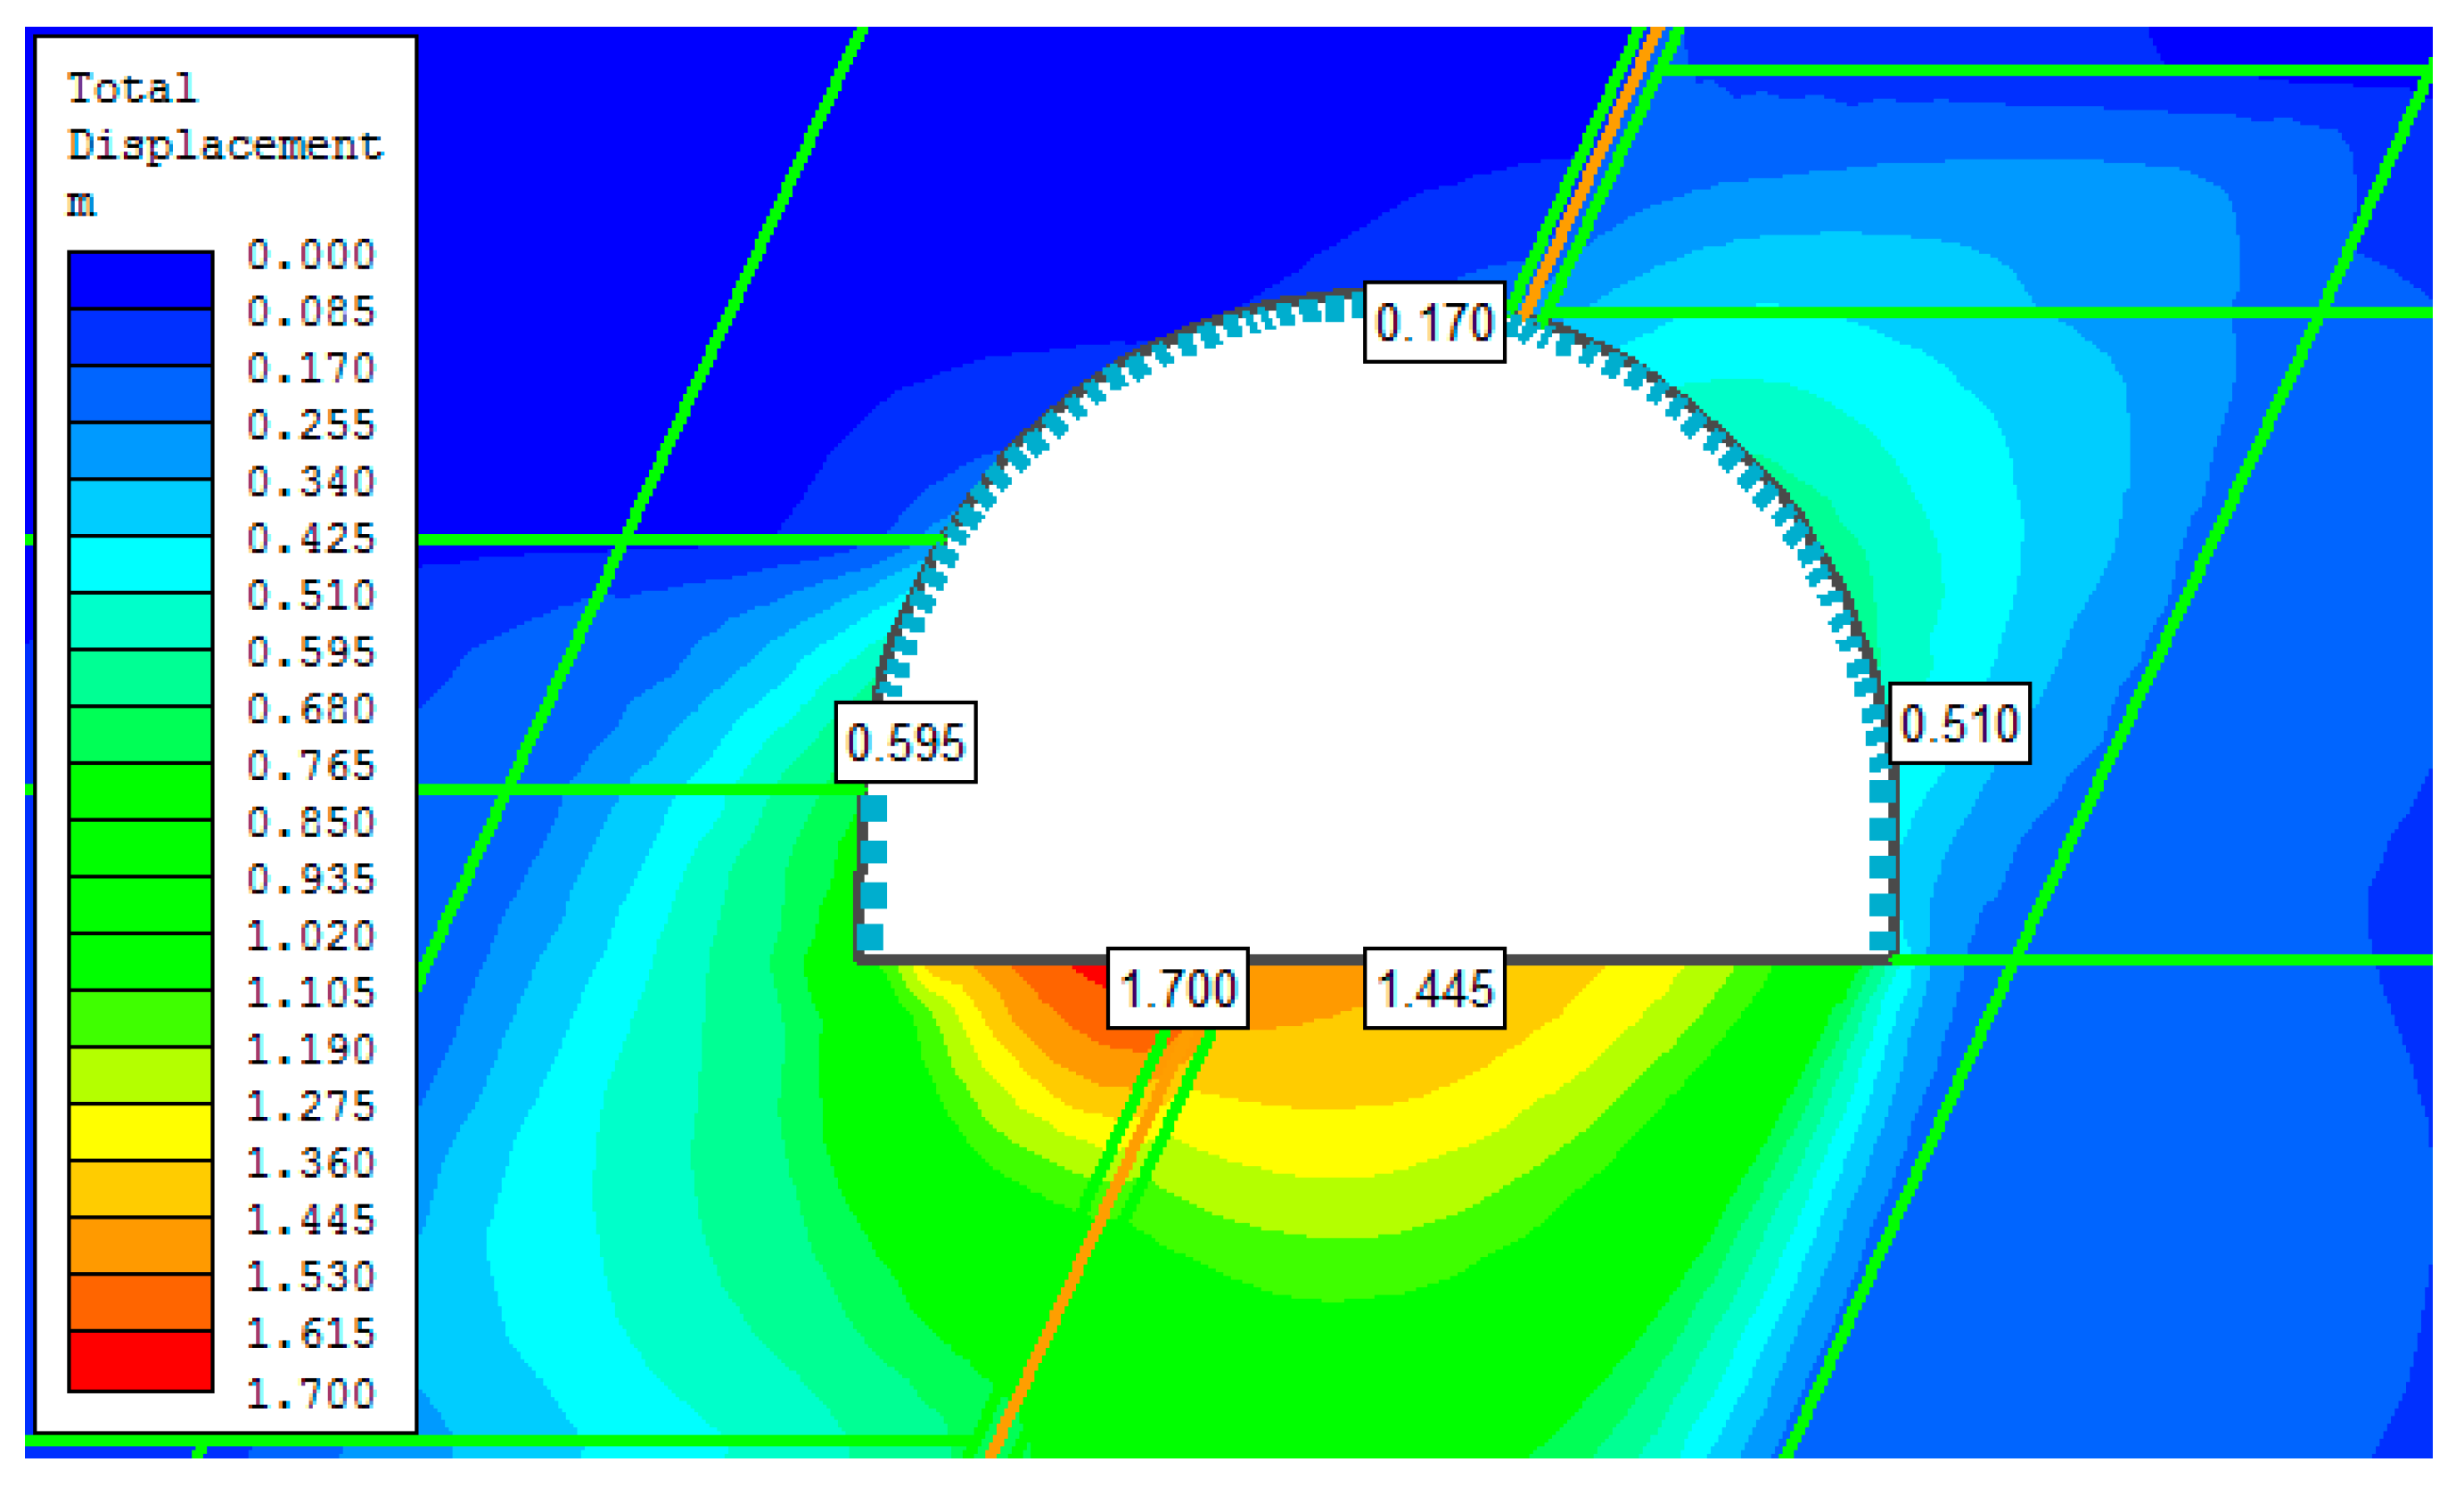
Charts of total displacements of the opening contour generated from model no. 3 and model no. 4 are presented on Figure 15 and Figure 16 respectively. The charts show qualitatively very similar deformation around maingate D-2 and characteristic asymmetrical movement of the contour in relation to the fault plane. Quantitatively, the deformation of the rock mass is better reproduced by model no. 3.
Based on the analysis of the obtained results it can be concluded that in the models set with the ability of slip on joints (clamps) the calculated movements of the roof are characterized by highest conformity with the in situ measurement, while the calculated change of the width of the opening—the lowest. On the other hand, in the models set with stiff support structure, the deformations of the roof were underestimated by up to 50%, yet most accurate as to the change of the width of the opening. The reason behind these observations may be the different than assumed (geostatic) distribution of stress around the roadway. However, the geostatic stress was not investigated prior to modelling.
Further investigation included the aspect of contact character between fault and rock beds [2,24,25]. For that purpose, in the models no. 5, 6, 7 and 8 the contact type joint was selected. These models achieved the highest conformity coefficient between generated and measured in situ values; approx. 10% higher than the models without joint type contacts. However, models of twofold higher stiffness parameters between layers (models no. 7 and 8) were characterized by much better, than models no. 5 and 6, fit of the generated and in situ measured deformation of the floor (Table 7).
Figure 17 and Figure 18 depict the distribution of displacements around the opening generated from models no. 7 and 8. A significant difference (yet small in terms of absolute value—around 8 cm) can be noted in displacement of hanging wall of the fault that is bigger in model no. 8, in which the support was set with option of arch sliding (Figure 17). Qualitatively, the deformation around maingate D-2 in both models does not differ, except for the above detail. However, in terms of magnitude, it needs to be pointed out that in the model no. 8, the increase of deformation in the roof of 8 cm resulted in a decrease of the floor upheaval by 9 cm.
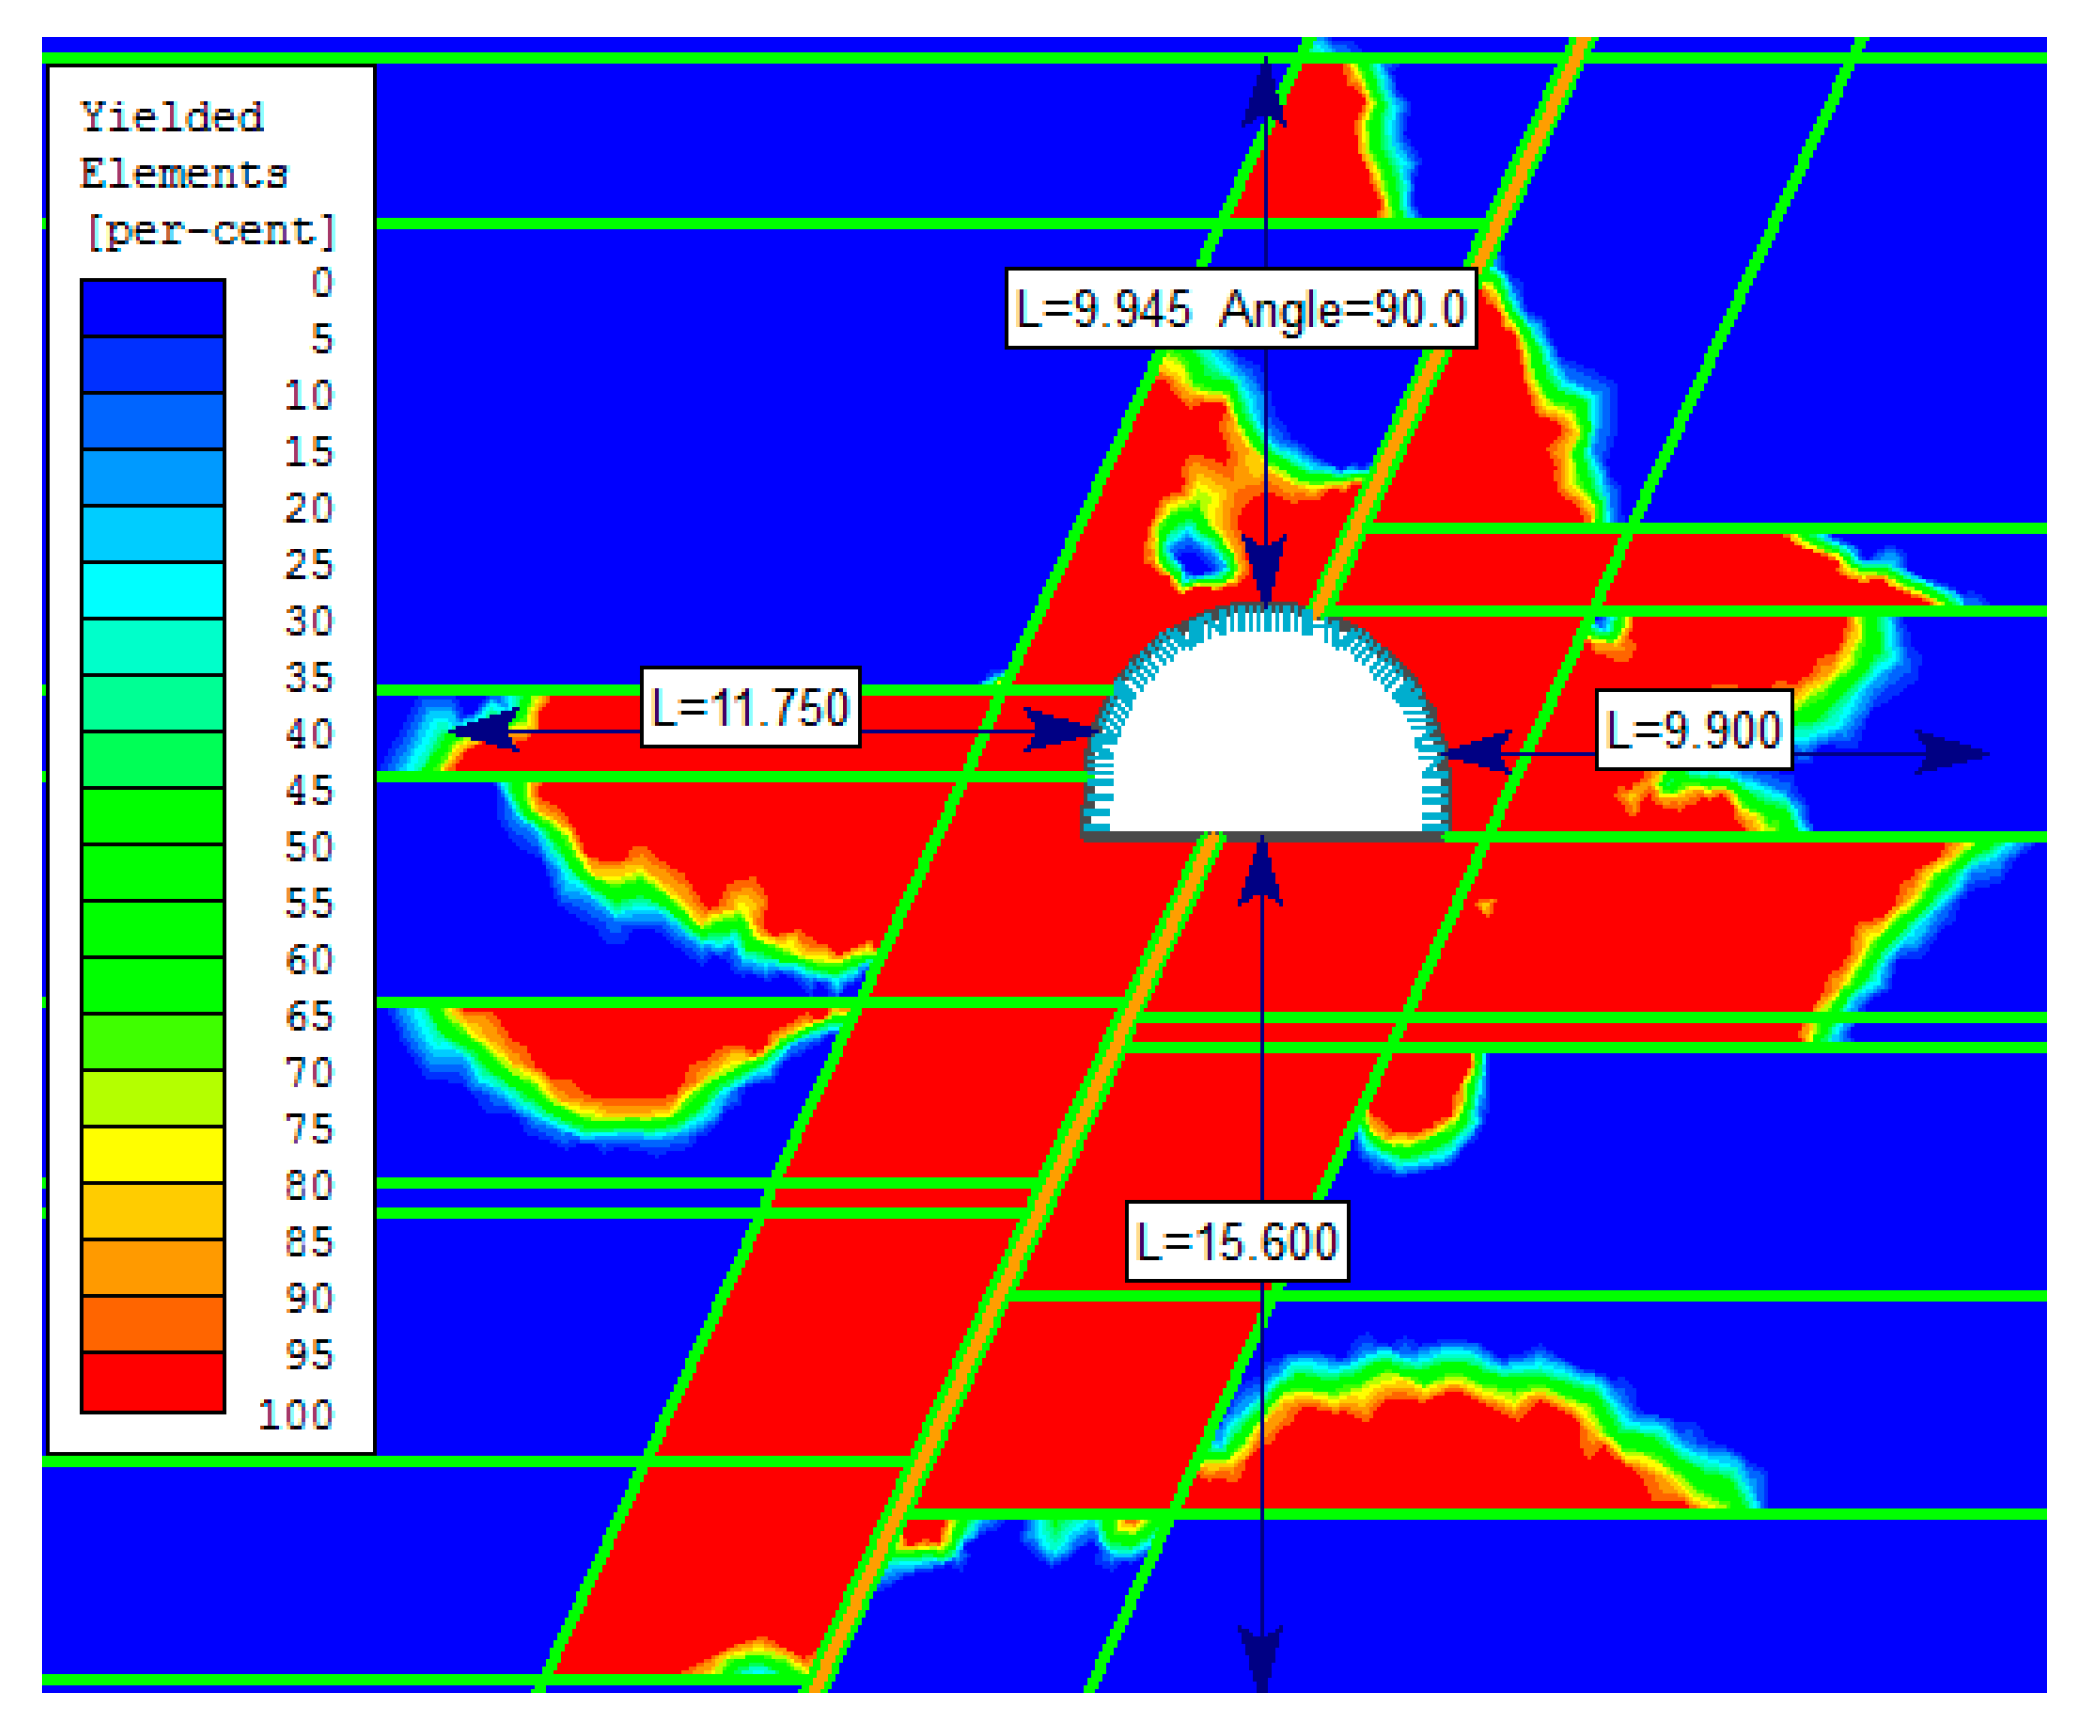
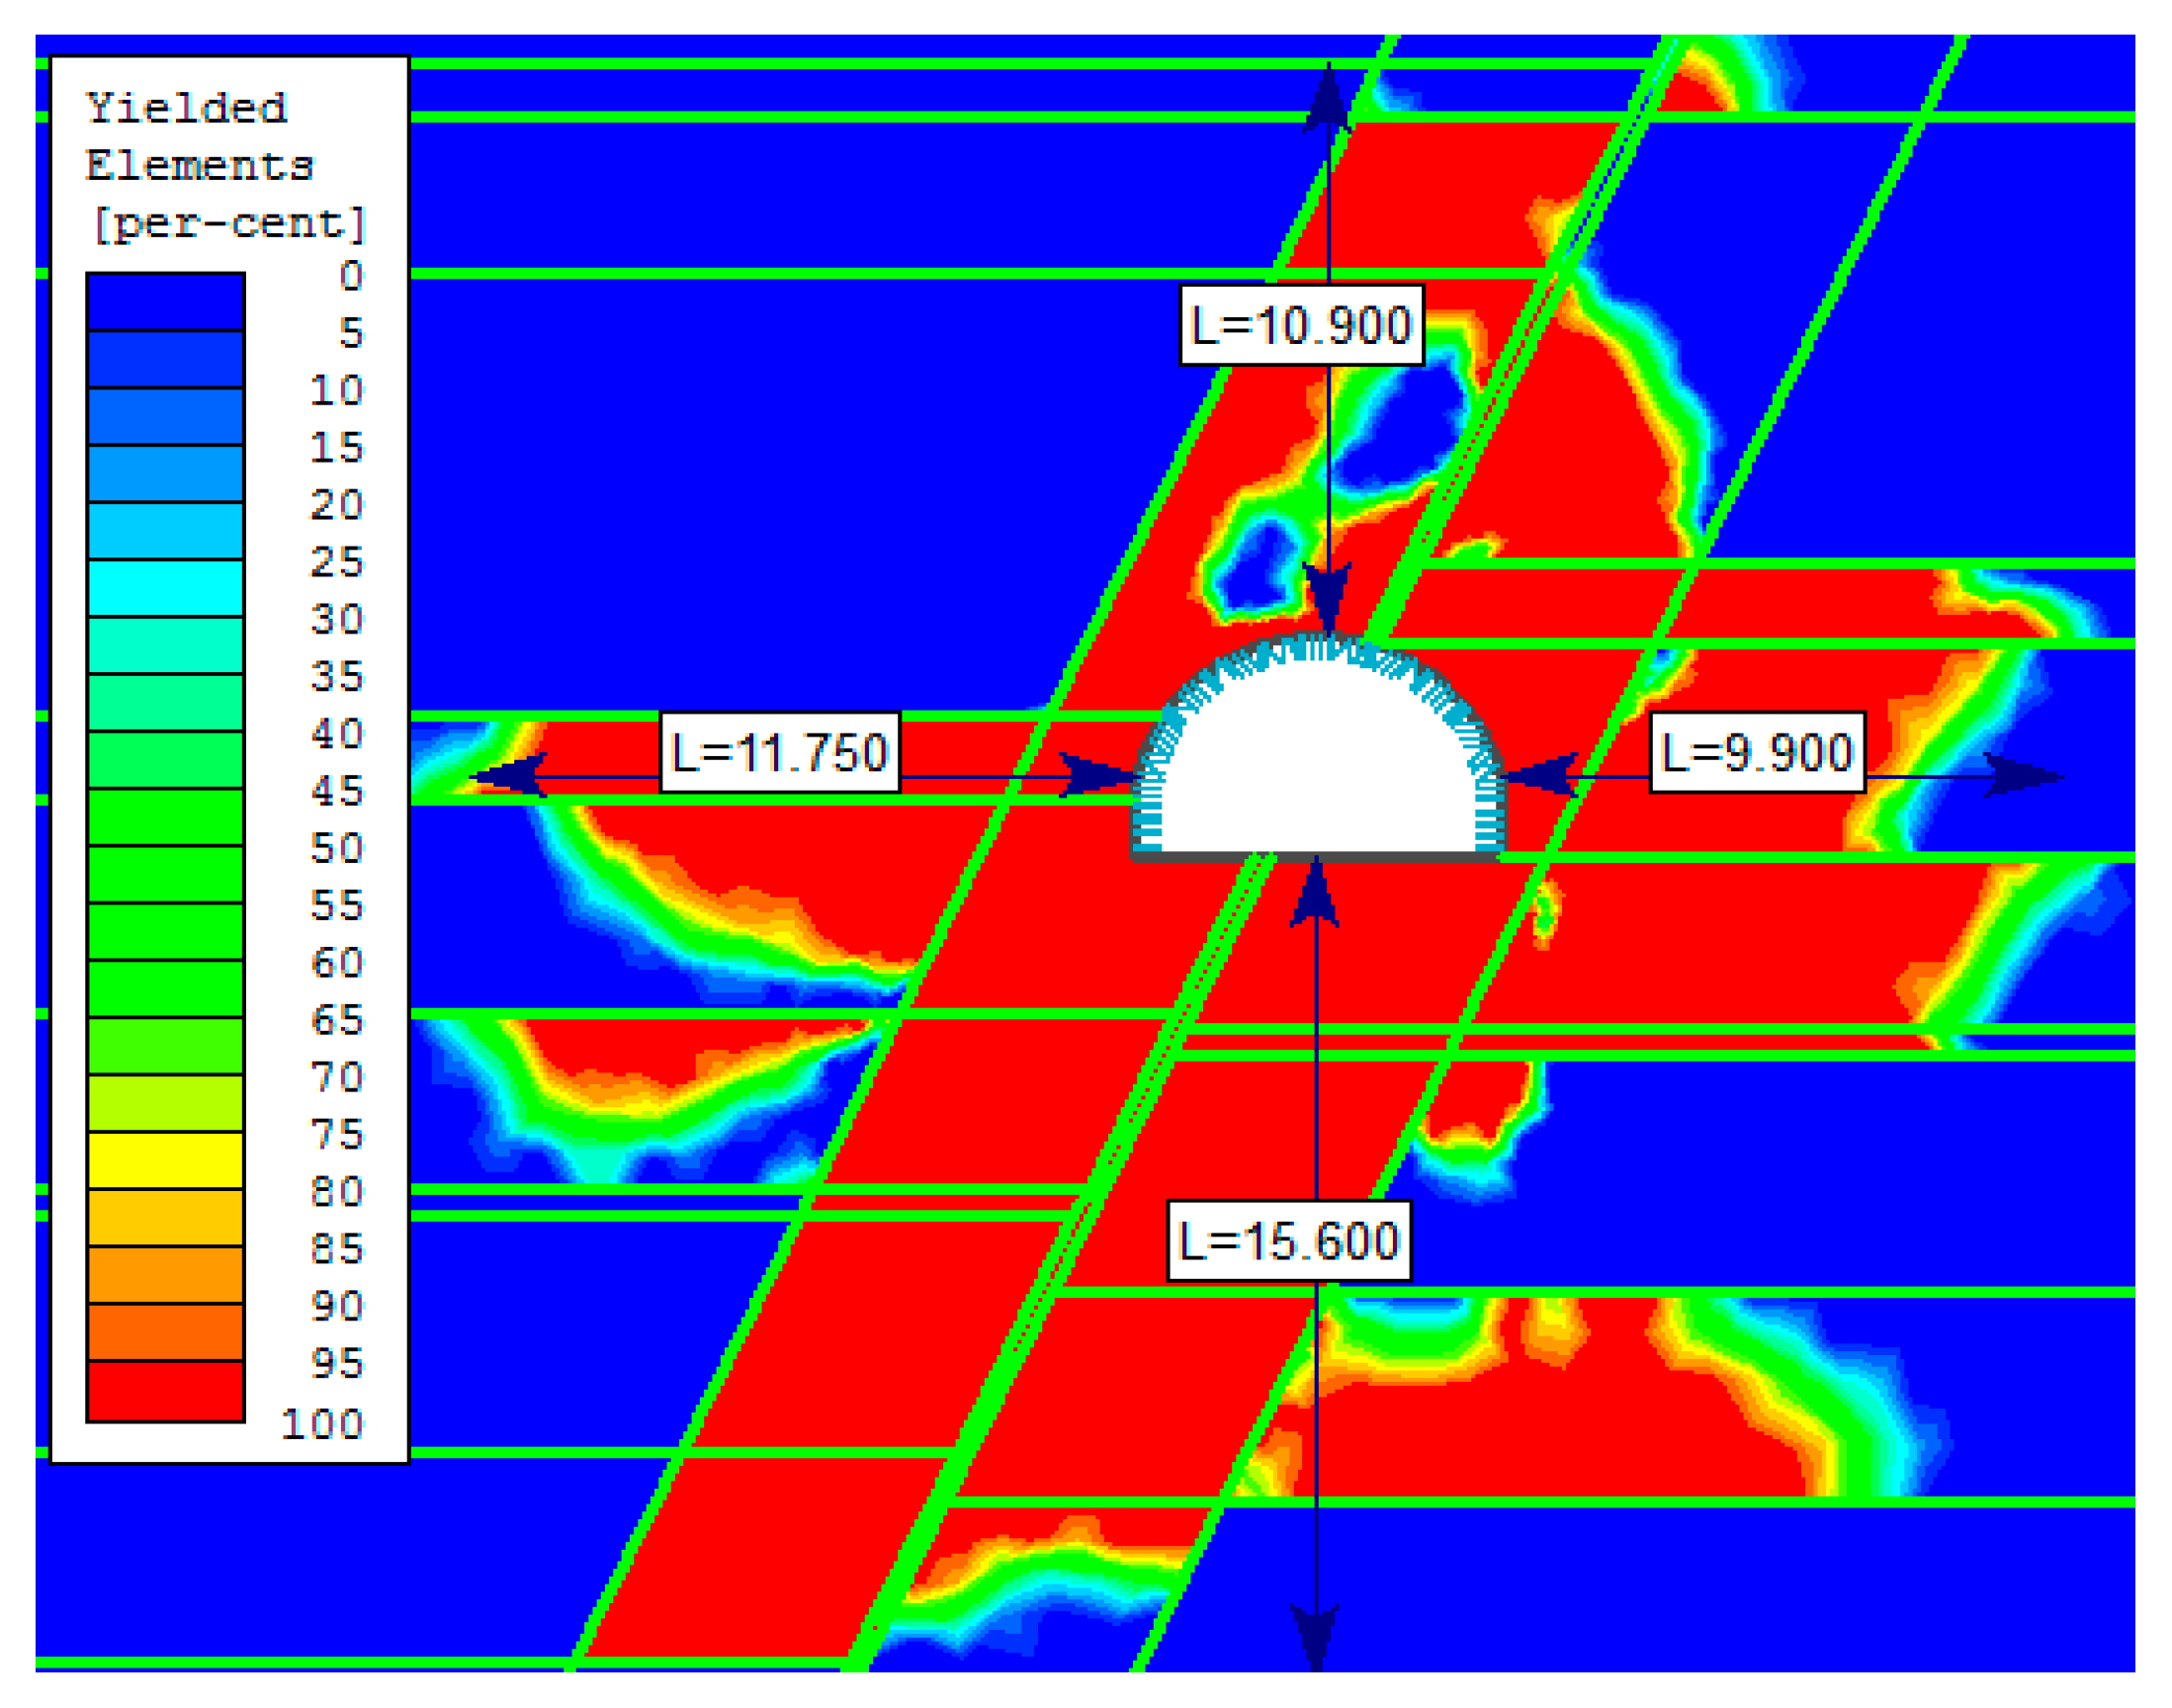
By comparing the stress condition around the analyzed maingate D-2 within and beyond the fault section it can be noted that the destruction zone in the floor is 2.5 times deeper in the fault affected section than beyond it (Figure 9, Figure 19 and Figure 20). In the case of the sidewalls the destruction is 3.5 times deeper in average, while in the roof this zone is up to 6 to 7 times larger.
In the applied numerical models, the destruction zone mainly coincides with the area of strength parameters reduced to reflect fracturing caused by the fault. Introduction of joint type contact into the model (Figure 19) affects the extent of the zone only in the roof of the roadway i.e., reduces its downward movement approx. by 10% comparing to model without joint contact (Figure 20).
5. Discussion
In this paper are presented the results of convergence measurements of the mining roadway in which the alignment is within and outside the fault zone. The measurements were carried out over a period of a dozen months to show the dynamics and magnitude of changes of the deformation, and with the purpose of analyzing the impact of tectonically affected zone on the stability of the opening.
Based on the numerical analysis it is possible to achieve very high agreement between convergence values generated by the models and measured in situ. Based on experience, the difference between modelled and factual values is of around 20%, hence acceptable and valid, from rock mechanics point of view, for prediction of deformations of mining roadways. Although it seems that 3D modelling of small fault zones should give more accurate results, it is limited by the unknown spatial orientation of the fault planes and their true length. For this reason, the fault is modeled as a straight inclined plane [9].
It should be underlined that modelling the rock mass with fault zones is extremely difficult and entails the necessity of other additional assumptions to the model concerning this zone. There are some phenomena on the contact between the rocks and the fault plane which are known qualitatively but not quantitatively. The first problem is how much the mechanical parameters of rocks within the fault zone should be reduced due to these phenomena. It is reasonable to relate the reduction to fault throw, so for the set of small throw zones, as a rule of thumb, we decided to reduce the initial values by 50%, but for the high throw fault and very small rock pieces of breccia—probably more.
Introduction of joint type contact between rock beds may lead to a better fit of numerical output and factual deformation values. However, due to difficulties in the estimation of the mechanical parameters of the contacts, the final effect may be the opposite, what is demonstrated by the numerical calculations. Yet in the case of fault zones around mining roadways this type of physical models may still be the best methodology option, even though it is a 2D modelling [2]. It is interesting that for example Jie et al. [2] uses also the model with joints, described separately for the successive rock beds, but assumes very high stiffness, close to intact rocks contact (several GPa/m). The model built by Yao team [9] had the normal stiffness on the fault plane of 1.5 GPa/m and shear stiffness of 0.5 GPa/m. It seems to be too high, but both authors didn’t explain this assumption.
Undoubtedly, the other numerical analyses and underground research from various countries would be very valuable for the calibration and verification of the fault zone influence on the mining openings. Also, a long-lasting in situ measurements carried out next to the fault zone in the openings would be a source of meaningful information. An inclusion in the model of the initial stress condition in the rock mass would be advantageous for the estimation of the deformation around the opening, too. Yet in the case reported in this paper this information was not available.
The last problem is influence of rheological and frictional slip properties on fault mechanics. However, for the short-time existing openings as e.g., gates it can be considered as of marginal importance.
In our opinion, such studies should focus on resolving mining problems. A large damage zone forming around a roadway imposes very high capacity of the rock bolt system or even use of reinforced concrete and rock mass injections—a common occurrence in mines e.g., in Poland and China. The examination of various physical numerical models of a small throw fault zones and their effect on mining roadway brought a new light on the problem and opened prospects for further studies.
6. Conclusions
The results of the study can be summarized as follows:
- The modelling of fault zones should be preceded by initial analysis of various physical models of the tectonically unaffected section, then a selection of the models that better reflect the rock mass condition in the investigated area.
- In the case of the roadway section within a fault zone the extent of yielding of rock in the sidewalls is 3.5 times in average greater than in the section tectonically unaffected. In the instance of an investigated fault zone, which intersected the roadway at 65°, the extent of rock yielding in the roof reached two times the throw of the fault, in the floor 3 times the throw, and horizontally approx. 1.5 to 1.8 times the width of modelled fault zone. Noticeably, the extent of yielded rock mass in the fault section is asymmetrical and this asymmetry changes together with the fault throw and its inclination.
- All numerical models of deformations around mining roadway should be verified by in situ measurements in purpose to determine the applicability of physical model to existing geological and mining conditions and for the calibration of the models.
- The numerical analysis of the stability of the maingate D-2 pointed the selection of the adequate physical models and opened further prospects for modelling of mining roadways in faulted areas. However, the cases of mining roadways driven within the complicated set of the small throw faults of various positions and dips should be studied only with the help of 3D software packages.
Author Contributions
Małkowski Piotr conceived and designed the experiments; Ostrowski Łukasz and Bachanek Piotr preformed numerical and mining research; Małkowski Piotr and Ostrowski Łukasz analayzed the numerical and mining results; Bachanek Piotr analayzed the numerical results; Małkowski Piotr wrote the paper.
Conflicts of Interest
The authors declare no conflict of interest.
References
- Bukowska, M. The exploitation depth and bump hazard in the mines of the Upper Silesian Coal Basin. In Deep Mining Challenges, International Mining Forum 2009; CRC Press: London, UK, 2009; pp. 23–32. [Google Scholar] [CrossRef]
- Gao, J.; Zhao, W.; Lu, Y.; Zhai, J.; Yang, G. Control Mechanism and Countermeasures for the Stability of Roadway Surrounding Rock in Fault Fracture Zone. China Univ. Min. Technol. 2014, 19, 10685–10698. [Google Scholar]
- Kidybiński, A. Podstawy Geotechniki Kopalnianej; Wydawnictwo Śląsk: Katowice, Poland, 1982. (In Polish) [Google Scholar]
- Nieć, M. Geologia Kopalniana; Wydawnictwo Geologiczne: Warszawa, Poland, 1990. (In Polish) [Google Scholar]
- Shen, H.C.; Cheng, Y.F.; Wang, J.Y. Finite element study on the effects of faults on the ground stress field. Pet. Geol. Oilfield Dev. Daqing 2007, 4, 34–37. [Google Scholar]
- Su, Y.; Zhang, M.; Zhang, Z. The Influence of Large Fault on Tunnels in Underground Mines. Electron. J. Geotech. Eng. 2017, 22, 3397–3402. [Google Scholar]
- Wang, H.; Jiang, Y.; Xue, S.; Mao, L.; Lin, Z.; Deng, D.; Zhang, D. Influence of fault slip on mining-induced pressure and optimization of roadway support design in fault-influenced zone. J. Rock Mech. Geotech. Eng. 2016, 8, 660–671. [Google Scholar] [CrossRef]
- Yan, S.; Bai, J.; Li, W.; Chen, J.; Li, L. Deformation mechanism and stability control of roadway along a fault subjected to mining. Int. J. Min. Sci. Technol. 2012, 22, 559–565. [Google Scholar] [CrossRef]
- Yao, Q.; Li, X.; Pan, F.; Wang, T.; Wang, G. Deformation and Failure Mechanism of Roadway Sensitive to Stress Disturbance and Its Zonal Support Technology. Shock Vib. 2016, 2016, 1812768. [Google Scholar] [CrossRef]
- Małkowski, P.; Ostrowski, Ł.; Bachanek, P. The impact of the low throw fault on the stability of roadways in a hard coal mine. Stud. Geotech. Mech. 2017, 39, 63–72. [Google Scholar] [CrossRef]
- Xi, X.; Guo, Q.; Liu, T.; Yan, Z. Comprehensive Monitoring and Stability Assessment of Roadway with Water Gushing in a Fault Zone. Electron. J. Geotech. Eng. 2015, 20, 3895–3901. [Google Scholar]
- Brodny, J. Analysis of operation of new construction of the frictional joint with the resistance wedge. Arch. Min. Sci. 2012, 57, 209–227. [Google Scholar]
- Central Mining Institute. Simplified Principles of Standing Support Designing for the Headings Driven in Hard Coal Mines; Series Instructions No. 15; Central Mining Institute: Katowice, Poland, 2001. (In Polish) [Google Scholar]
- Silesian Technical University. The Principles of Standing Support Designing for the Headings Driven in Hard Coal Mines, 2nd ed.; Corrected; Institute for the Exploitation of Deposits, Silesian TU: Gliwice, Poland, 2000. (In Polish) [Google Scholar]
- Borynia,-Zofiówka-Jastrzębie Hard Coal Mine. Technical Documentation of Maingate D-2, Unpublished work. 2014. (In Polish)
- Małkowski, P.; Niedbalski, Z.; Majcherczyk, T. Investigations of Hard Coal Mine Roadways Stability in Stratified Rock. In Proceedings of the 8th International Symposium on Ground Support in Mining and Underground Construction: Ground Support 2016, Lulea, Sweden, 12–14 September 2016. [Google Scholar]
- Yu, W.; Wang, W.; Chen, X.; Du, S. Field investigations of high stress soft surrounding rocks and deformation control. Int. J. Rock Mech. Min. Sci. 2015, 7, 421–433. [Google Scholar] [CrossRef]
- Prusek, S. Empirical-statistical model of gateroads deformation. Arch. Min. Sci. 2010, 55, 295–312. [Google Scholar]
- Małkowski, P. The impact of the physical model selection and rock mass stratification on the results of numerical calculations of the state of rock mass deformation around the roadways. Tunn. Undergr. Space Technol. 2015, 50, 365–375. [Google Scholar] [CrossRef]
- Hoek, E.; Diederichs, M.S. Empirical estimation of rock mass modulus. Int. J. Rock Mech. Min. Sci. 2006, 43, 203–215. [Google Scholar] [CrossRef]
- Bieniawski, Z.T. Determining rock mass deformability: Experience from cases histories. Int. J. Rock Mech. Min. Sci. 1978, 15, 237–247. [Google Scholar] [CrossRef]
- Dinc, O.S.; Sonmez, H.; Tunusluoglu, C.; Kasapoglu, K.E. A new general empirical approach for the prediction of rock mass strength of soft to hard rock masses. Int. J. Rock Mech. Min. Sci. 2011, 48, 650–665. [Google Scholar] [CrossRef]
- Małkowski, P. Behavior of joint in sandstones during the shear test. Acta Geodyn. Geomater. 2015, 12, 399–410. [Google Scholar]
- Pilecki, Z. Modelowanie numeryczne pola naprężenia w górotworze naruszonym wielopokładową eksploatacją węgla kamiennego w warunkach silnego zagrożenia sejsmicznego. Zeszyty Naukowe Instytutu Gospodarki Surowcami Mineralnymi i Energią PAN 2011, 80, 93–102. (In Polish) [Google Scholar]
- Prusek, S.; Walentek, A. Ocena zmian zachodzących w górotworze w bezpośrednim otoczeniu ściany. Wiadomości Górnicze 2015, 12, 610–622. (In Polish) [Google Scholar]
Figure 1.
Faults position and the convergence stations in Maingate D-2; (a) The map of Maingate D-2 (b) The convergence stations layout.
Figure 1.
Faults position and the convergence stations in Maingate D-2; (a) The map of Maingate D-2 (b) The convergence stations layout.

Figure 2.
Scheme of convergence measurement station and the measurement methodology in D-2 Maingate.
Figure 2.
Scheme of convergence measurement station and the measurement methodology in D-2 Maingate.

Figure 3.
Maingate D-2 convergence—station at chainage 930 m (ΔW—roadway width change, ΔH—roadway height change, urf—roof displacement, ufl—floor heaving).
Figure 3.
Maingate D-2 convergence—station at chainage 930 m (ΔW—roadway width change, ΔH—roadway height change, urf—roof displacement, ufl—floor heaving).

Figure 4.
Maingate D-2 convergence—station at chainage 757 m (ΔW—roadway width change, ΔH—roadway height change, urf—roof displacement, ufl—floor heaving).
Figure 4.
Maingate D-2 convergence—station at chainage 757 m (ΔW—roadway width change, ΔH—roadway height change, urf—roof displacement, ufl—floor heaving).

Figure 5.
Maingate D-2 convergence: (a) station at ch. 930 m; (b) station at ch. 757 m.

Figure 6.
Model plane of the roadway beyond the fault effect.

Figure 7.
Elastic model no. 10—map of total displacements.

Figure 8.
Model elasto-plastic with interpreted Young modulus—map of total displacement and failure mechanism around the opening.
Figure 8.
Model elasto-plastic with interpreted Young modulus—map of total displacement and failure mechanism around the opening.

Figure 9.
Model no. 1—elasto-plastic—map of total displacements.

Figure 10.
Model no. 1—elasto plastic—yielded rock mass elements.

Figure 11.
Model no. 6 elasto-plastic with 20% post-failure strength weakening of the rock mass—map of total displacements around the opening.
Figure 11.
Model no. 6 elasto-plastic with 20% post-failure strength weakening of the rock mass—map of total displacements around the opening.

Figure 12.
Model no. 6 elasto-plastic with 20% post-failure strength weakening of the rock mass—map of stress distribution around the opening.
Figure 12.
Model no. 6 elasto-plastic with 20% post-failure strength weakening of the rock mass—map of stress distribution around the opening.

Figure 13.
Model planes of the roadway intersecting fault zone.

Figure 14.
View on the roof of the roadway at the monitoring station at chainage 757 m.

Figure 15.
Model no. 3—Maingate D-2 in the fault zone—map of total displacement.

Figure 16.
Model no. 4—Maingate D-2 in the fault zone—map of total displacement.

Figure 17.
Model no. 7—Maingate D-2 in the fault zone—joint type rock mass and rigid arch support—the map of total displacement.
Figure 17.
Model no. 7—Maingate D-2 in the fault zone—joint type rock mass and rigid arch support—the map of total displacement.

Figure 18.
Model no. 8—Maingate D-2 in the fault zone—joint type rock mass and yielding arch support—the map of total displacement.
Figure 18.
Model no. 8—Maingate D-2 in the fault zone—joint type rock mass and yielding arch support—the map of total displacement.

Figure 19.
Model no. 7—Fault zone, joint type contact, rigid support—map of yielded rock mass elements around the roadway.
Figure 19.
Model no. 7—Fault zone, joint type contact, rigid support—map of yielded rock mass elements around the roadway.

Figure 20.
Model no. 3—Fault zone, yielding support—map of yielded rock mass elements around the roadway
Figure 20.
Model no. 3—Fault zone, yielding support—map of yielded rock mass elements around the roadway


Table 1.
Parameters of steel yielding support.
| Spacing | V-Shape Height | V-Shape Cross Section Area | V-Shape Moment of Inertia | Steel Young Modulus | Steel Poisson Ratio | Steel Yield Limit | Steel Tensile Strength |
|---|---|---|---|---|---|---|---|
| [m] | [m] | [m2] | [m4] | [GPa] | [-] | [MPa] | [MPa] |
| 0.6 | 0.171 | 0.004083 | 8.38 × 10⁻⁶ | 210 | 0.3 | 480 | 650 |
Table 2.
Results of convergence measurements in Maingate D-2 [10].
Table 2.
Results of convergence measurements in Maingate D-2 [10].
| Mointoring Station Chainage | Measured Results | ||||||||
|---|---|---|---|---|---|---|---|---|---|
| Change of Width of the Roadway | Change of Height of the Roadway | Floor Heave | Change of the Roadway Cross-Section | ||||||
| ΔW [cm] | ΔW [%] | ΔH [cm] | ΔH [%] | ufl min [cm] | ufl max [cm] | ufl av [cm] | ΔA [m2] | ΔA [%] | |
| 930 m | 20 | 3.3 | 38.5 | 9.1 | 5.7 | 35.1 | 25.8 | 2.87 | 13.3 |
| 757 m | 73 | 12.0 | 167.5 | 39.6 | 118 | 180.5 | 148.1 | 11.67 | 54.2 |
Table 3.
Rock mass parameters in the numerical model.
| Stratum | Rock Type | Thickness | Specific Weight | UCS | Young Modulus (Lab. Test) | Young Modulus (Rock Mass) | Poisson Ratio | Hoek Brown Failure Criteria | |
|---|---|---|---|---|---|---|---|---|---|
| h [m] | γ [kN/m3] | Rc [MPa] | Ei [GPa] | Em [GPa] | ν [-] | ms | s | ||
| Fault | Breccia | 0.3 | 20 | 8.0 | 0.75 | - | 0.35 | 0.240 | 0.00008 |
| Roof | Sandstone | 16.9 | 25.32 | 80.8 | 10.78 | 6.24 | 0.29 | 2.851 | 0.0039 |
| Coal bed 411/3 | 1.0 | 13.02 | 10.2 | 1.57 | 0.90 | 0.30 | 1.729 | 0.0008 | |
| Mudstone | 3.0 | 25.01 | 41.2 | 6.98 | 1.67 | 0.32 | 0.937 | 0.0031 | |
| Sandstone | 8.5 | 25.32 | 80.8 | 10.78 | 6.24 | 0.29 | 2.851 | 0.0039 | |
| Coaly shale | 1.5 | 24.43 | 33.8 | 5.62 | 0.80 | 0.35 | 0.475 | 0.0004 | |
| Sidewall | Coal bed 412 | 4.1 | 12.81 | 12.4 | 1.86 | 0.90 | 0.3 | 1.729 | 0.0008 |
| Floor | Claystone | 3.3 | 24.97 | 50.3 | 4.55 | 1.60 | 0.28 | 0.906 | 0.00011 |
| Coal | 0.5 | 12.50 | 8.1 | 2.02 | 0.90 | 0.3 | 1.233 | 0.0002 | |
| Claystone | 4.5 | 26.33 | 61.3 | 8.19 | 1.60 | 0.31 | 0.906 | 0.00011 | |
| Coal bed 413 | 4 | 12.48 | 11.9 | 1.69 | 0.90 | 0.3 | 1.729 | 0.0008 | |
| Mudstone | 7.7 | 26.33 | 61.3 | 8.19 | 5.8 | 0.31 | 2.677 | 0.0094 | |
| Claystone | 6 | 26.73 | 50.2 | 6.23 | 1.67 | 0.29 | 0.937 | 0.0031 | |
Table 4.
Physical models of the rock mass—section beyond the fault zone.
| No. | Physical Model (Isotropic) | Young Modulus E | Post-Failure Strength Change | Support | Support Frame Slide Possible | Contact between Strata |
|---|---|---|---|---|---|---|
| 1 | Elasto-plastic | Laboratory | - | Yes, steel yielding support | No | material boundary |
| 2 | Elasto-plastic | Laboratory | - | Yes, steel yielding support | Yes; 0.5% | material boundary |
| 3 | Elasto-plastic | Rock mass | - | Yes, steel yielding support | No | material boundary |
| 4 | Elasto-plastic | Laboratory | - | No | - | material boundary |
| 5 | Elasto-plastic | Laboratory | +20% | Yes, steel yielding support | No | material boundary |
| 6 | Elasto-plastic | Laboratory | −20% | Yes, steel yielding support | No | material boundary |
| 7 | Elasto-plastic | Laboratory | - | Yes, steel yielding support | No | joint type case 1 |
| 8 | Elasto-plastic | Laboratory | - | Yes, steel yielding support | No | joint type case 2 |
| 9 | Elasto-plastic | Laboratory | - | Yes, steel yielding support | No | joint type case 3 |
| 10 | Elastic | Laboratory | - | Yes, steel yielding support | No | material boundary |
| 11 | Elastic | Laboratory | - | Yes, steel yielding support | Yes; 0.5% | material boundary |
| 12 | Elastic | Rock mass | - | Yes, steel yielding support | No | material boundary |
| 13 | Elastic | Laboratory | - | No | - | material boundary |
Table 5.
Physical models of the rock mass—section beyond the fault zone.
| Model | Δurf [cm] | Δufl [cm] | ΔH [cm] | ΔW [cm] | Conformity |
|---|---|---|---|---|---|
| 1 | 4 | 34 | 38 | 20 | 96.90% |
| 2 | 20 | 32 | 52 | 48 | 43.78% |
| 3 | 10 | 90 | 100 | 60 | 38.22% |
| 4 | 32.5 | 40 | 72.5 | 50 | 31.29% |
| 5 | 3 | 22.5 | 25.5 | 21 | 73.52% |
| 6 | 5 | 40 | 45 | 30 | 80.70% |
| 7 | 4 | 32 | 36 | 24 | 89.13% |
| 8 | 4 | 38 | 42 | 24 | 87.01% |
| 9 | 25 | 45 | 70 | 35 | 38.29% |
| 10 | 1.6 | 3.8 | 5.4 | 6.8 | 23.69% |
| 11 | 2 | 4.3 | 8.6 | 48 | 9.86% |
| 12 | 4 | 9.5 | 13.5 | 12 | 52.97% |
| 13 | 2 | 4.3 | 6.3 | 8.6 | 29.11% |
| Measured values | 4.5 | 34 | 38.5 | 20 | - |
Bold—conformity up to 20% between the value from a model and the measurement.
Table 6.
Physical models for the roadway section inside the fault zone.
| Model No. | Isotropic Model | Young Modulus E | Post-Failure Strength Change | Support | Support Frame Slide Possible | Contact of the Beds on Fault Plane |
|---|---|---|---|---|---|---|
| 1 | Elasto-plastic | Laboratory | - | Yes, steel yielding support | Yes; 0.5% | material boundary |
| 2 | Elasto-plastic | Laboratory | - | Yes, steel yielding support | No | material boundary |
| 3 | Elasto-plastic | Laboratory | –20% | Yes, steel yielding support | No | material boundary |
| 4 | Elasto-plastic | Laboratory | –20% | Yes, steel yielding support | Yes; 0.5% | material boundary |
| 5 | Elasto-plastic | Laboratory | –20% | Yes, steel yielding support | No | joint type case 4 |
| 6 | Elasto-plastic | Laboratory | –20% | Yes, steel yielding support | Yes; 0.5% | joint type case 4 |
| 7 | Elasto-plastic | Laboratory | –20% | Yes, steel yielding support | No | joint type case 5 |
| 8 | Elasto-plastic | Laboratory | –20% | Yes, steel yielding support | Yes; 0.5% | joint type case 5 |
Table 7.
Total deformations of the roadway generated by the models in comparison with in situ measurements.
Table 7.
Total deformations of the roadway generated by the models in comparison with in situ measurements.
| Model | Δufl Max | Δufl | Δurf | ΔH Δurf + Δufl | ΔW | Average Conformity | ||
|---|---|---|---|---|---|---|---|---|
| Left | Right | L + R | ||||||
| [cm] | [-] | |||||||
| 1 | 133 | 119 | 14 | 133 | 63 | 42 | 105 | 75.42% |
| 2 | 142.5 | 127.5 | 7.5 | 135 | 45 | 37.5 | 82.5 | 75.01% |
| 3 | 180 | 162 | 9 | 171 | 54 | 45 | 99 | 72.60% |
| 4 | 170 | 153 | 17 | 170 | 76.5 | 51 | 127.5 | 76.45% |
| 5 | 161.5 | 144.5 | 8.5 | 153 | 42.5 | 42.5 | 85 | 81.25% |
| 6 | 152 | 136 | 16 | 152 | 64 | 48 | 112 | 78.46% |
| 7 | 171 | 153 | 9 | 162 | 36 | 45 | 81 | 85.85% |
| 8 | 170 | 144.5 | 17 | 161.5 | 59.5 | 51 | 110.5 | 81.20% |
| Measured values | 180 | 152 | 15 | 168 | - | 73 | - | |
Bold—conformity up to 20% between the value from a model and the measurement.
© 2017 by the authors. Licensee MDPI, Basel, Switzerland. This article is an open access article distributed under the terms and conditions of the Creative Commons Attribution (CC BY) license (http://creativecommons.org/licenses/by/4.0/).
Share and Cite
MDPI and ACS Style
Piotr, M.; Łukasz, O.; Piotr, B. Modelling the Small Throw Fault Effect on the Stability of a Mining Roadway and Its Verification by In Situ Investigation. Energies 2017, 10, 2082. https://doi.org/10.3390/en10122082
AMA Style
Piotr M, Łukasz O, Piotr B. Modelling the Small Throw Fault Effect on the Stability of a Mining Roadway and Its Verification by In Situ Investigation. Energies. 2017; 10(12):2082. https://doi.org/10.3390/en10122082
Chicago/Turabian StylePiotr, Małkowski, Ostrowski Łukasz, and Bachanek Piotr. 2017. "Modelling the Small Throw Fault Effect on the Stability of a Mining Roadway and Its Verification by In Situ Investigation" Energies 10, no. 12: 2082. https://doi.org/10.3390/en10122082
Note that from the first issue of 2016, this journal uses article numbers instead of page numbers. See further details here.