How Wood Fuels’ Quality Relates to the Standards: A Class-Modelling Approach
by
 , , ,
, , ,
Michela Zanetti
1,* ,
,
Corrado Costa
2,*,
Rosa Greco
1,
Stefano Grigolato
1 ,
,
Giovanna Ottaviani Aalmo
3 and
Raffaele Cavalli
1 1
Università degli Studi di Padova, Department of Land, Environment, Agriculture and Forestry, Laboratorio Analisi BioCombustibili, Viale dell’Università 16, 35020 Legnaro, Padova, Italy
2
Consiglio per la ricerca in agricoltura e l’analisi dell’economia agraria (CREA), Centro di Ricerca per l’Ingegneria e le Trasformazioni Agro-alimentari (CREA-IT), Via della Pascolare 16, 00015 Monterotondo Scalo, Rome, Italy
3
Norwegian Institute of Bioeconomy Research, Pb 115, NO-1431 Ås, Norway
*
Authors to whom correspondence should be addressed.
Energies 2017, 10(10), 1455; https://doi.org/10.3390/en10101455
Submission received: 21 July 2017
/
Revised: 14 September 2017
/
Accepted: 18 September 2017
/
Published: 21 September 2017
(This article belongs to the Section L: Energy Sources)
Abstract
:The quality requirements of wood biofuels are regulated by a series of harmonized international standards. These standards define the technical parameter limits that influence the quality of solid biomass as a fuel. In 2014 the European reference standard for solid biofuel was replaced by the International ISO standard. In the case of wood chips, the main difference between the European and International standards is the definition of particle size distribution classes. In this context, this study analyses the quality of wood chips and its variation over the years according to the “former” (EN 14691-4) and “in force” (ISO 17225-4) standards. A Soft Independent Modelling of Class Analogy (SIMCA) model was built to predict the best quality of wood chips and to clarify the relationship between quality and standard parameters, time and changes in the standard regulations. The results show that, compared to the EN standards, classification with the ISO standards increases the samples belonging to the best quality classes and decreases the not classified samples. Furthermore, all the SIMCA models have a high sensitivity (>90%), reflect the differences introduced to the quality standards and are therefore suitable for monitoring the quality of wood chips and their changes.
1. Introduction
In a context where energy demand is increasing fast and the availability of fossil resources is decreasing [1,2], solid biofuels represent a sustainable energy source. The production and use of solid biofuels, and particularly woody biomass, can help reduce the production of greenhouse gases (GHG) thanks to their close-to-neutral carbon emissions [3,4]. Furthermore, they can be stored and used when needed [5]. Depending on the biomass preparation process, different types of solid wood-based biofuel are available: firewood, wood chips, pellets, briquettes and charcoal. Compared to pellets and briquettes, wood chips and firewood are a minimally processed material, so their production chain has less impact on the environment than other fuels [6,7]. In the case of wood chips, the environmental impact of their production depends on the harvesting system used and is related to machine productivity and site characteristics [8,9,10]. Even if wood chips are a minimal processed fuel, they have the benefit of being standardized in terms of size. In fact, wood chips have a defined particle size produced by mechanical treatment. They are sub-rectangular in shape, 5 to 50 mm long and their thickness is lower than the other dimensions [11].
However, as for other biofuels, wood chip quality needs to be assessed according to the standards in force and their final use in domestic or industrial appliances [12]. In the case of domestic (or non-industrial use), the quality requirements for solid biofuels are regulated by a series of specific harmonized international standards [13]. The standards define the limits of technical parameters that, in the case of wood chips, are: biomass origin, bulk density, moisture content, ash content, particle size distribution and calorific value. The biomass origin (Table 1—Classification of origin and sources of solid biofuels in [14,15]) is strictly related to quality of the final product [16]: wood coming from forests or plantations differs with respect to wood from chemically treated products. In the latter case, to define a quality class, an element analysis is also mandatory. The physical characteristics of wood chips, ash content, bulk density, moisture content, calorific power, and particle size distribution are used to assess the quality of wood chips as solid biofuel [17,18,19,20,21,22]. The ash content and calorific power are mainly related to the raw material characteristics and origin whereas moisture content and particle size distribution can be affected by the chipping and storage/drying processes [19,23,24,25,26,27,28].
Four quality classes are defined by the standard in force for non-industrial use: A1, A2, B1 and B2. The highest quality corresponds to the A1 class which is principally characterized by the lowest moisture content and lowest amount of ashes [29,30]. The worst quality class is the B where the only restrictions indicated by the standard concern the amount of ash (<3%), particle size distribution and elements content. The difference between B1 and B2 is related to the biomass origin: among others, B2 class includes not chemically treated used wood and chemically treated or not wood residues; B1 includes only not chemically treated wood residues.
From 2011 until 2014, the reference standard for wood chips for non-industrial use was EN 14691-4 [29]. In 2014, the EN standard was replaced by the ISO standard ISO 17225-4 [30]. The main difference between the two standards regards the wood chips particle size distribution. In the ISO standard, the percentage is less than that required by the EN standard, and the percentage of fines fraction (≤3.15 mm) associated to the main fraction is higher. The percentage and size of overlenghts also differ in the two standards. Furthermore, in the ISO standard there are only three particle size classes (P16S, P31S and P45S) instead of four (Table 1—Particle size of wood chips, EN 14961-4:2011; Table 1—Particle size of graded wood chips, ISO 17225-4:2014) [29,30]. For the other physical parameters included in the standards, there are no changes in the limits set by the ISO one with the exception of the calorific value where the minimum value has to be stated.
The biomass origin has also undergone some changes. The origin of ISO classes A1 and A2 includes coniferous and blends logging residues and not just logging residues of stored broadleaves as defined in the EN standard. In the ISO B2 class origin, “Forest, plantation and other virgin wood” has been added and “Chemically untreated used wood” has replaced the more general “Used wood” (Table 2—Specification of graded wood chips, ISO 17225-4:2014; Table 2—Specification of wood chips for non-industrial use, EN 14961-4:2011) [29,30].
Based on the ISO standard, in 2015 Biomassplus quality certification [31] was developed in Italy. Biomassplus certification guarantees the absolute best quality of solid biofuel other than pellets. Indeed, the best quality of pellets is already assured by the existing certification ENplus, in force since 2010 (http://www.enplus-pellets.eu). Biomassplus certification includes control of the quality characteristics of the product, as laid down in ISO 17225 standards, ensures the traceability and legality of the product and assesses the environmental sustainability of woody biofuel throughout the production cycle [32]. Furthermore, the Biomassplus certification scheme, in addition to quality classes defined by the standard, may provide a class “plus”, called A1+ for some extraordinary quality products, with more restrictive limits than those of the standard [32]. Compared to A1, A1+ includes only wood chips with a moisture content ≤10% instead of ≤25%, a net calorific value ≥16 MJ kg−1 and a reduced percentage of fines fraction (≤6% for P16S class, ≤5% for P31S and P45S classes instead of ≤15% and ≤10%, respectively). Even if Biomassplus certification was developed in Italy, it has also been adopted by biomass exporters in other countries since it is based on International ISO standards. Then, in the light of the foregoing considerations, the main difference between European and International standards lies in the dimensional classification of wood chips: the European standard is much stricter than the international one; while, compared to the ISO standard, Biomassplus certification imposes more restrictive limits for the moisture content, the content of fines and the net calorific value.
In Italy, the quantification of wood chips quality is required to obtain the tax benefits related to combustion system efficiency and wood fuel quality (according to the Italian Ministerial Decree—D.M. 28 December 2012).
This study proposes a composite indicator for wood fuels’ quality assessment. For this purpose we adopt the stochastic approach Soft Independent Modeling of Class Analogy (SIMCA) [33,34]. SIMCA is a multivariate statistical class-modelling method for supervised data classification. To avoid overfitting, the method requires a training set consisting of samples with a set of variables and their class membership. The term soft refers to the classifier that can identify samples as belonging to multiple classes and not necessarily producing a sample classification in non-overlapping classes. As a method of classification, SIMCA gained widespread use especially in applied statistical fields such as spectroscopic and chemometrics data analysis [35,36,37,38,39,40]. The proposed method has the advantage of considering all the variables in a multivariate way. The method does not aim to substitute the standard evaluation, but to support it with a method that provides an immediate metric score with a visual impact.
In this context, the goal of this research is to answer the follow question: does the quality of wood chips change: (i) over the years and (ii) according to the evolution of the standards’ rules? In order to achieve this, the quality of wood chips and its variation over the years have been evaluated according to the “former” EN 14691-4 [29] and “in force” ISO 17225-4 [30] standards. A SIMCA model has been built to predict the best quality of wood chips and to understand how the quality parameters affect it over the years and with the standard regulation changes. As stated by Forina et al. [38] multivariate class-modelling techniques answer the general question if an object O, stated as class N, really belongs to class N. This is a typical question in multivariate quality control. On the contrary, classification techniques allocate objects to one of the classes in the problem. Class-modelling approaches determine the “prediction probability” with a classification threshold for each modelled class N. By using a class-modelling approach, it is possible to attribute each object not only to one or more classes but also to none (i.e., the object is an outlier).
2. Materials and Methods
2.1. Physical Characterization of Wood Chips
In this study, 305 wood chips samples analyzed by the Biofuel Analysis Laboratory of University of Padua were used. The laboratory is specialized in the analysis of solid biofuel coming from biofuel production companies. The samples came from different Italian regions and were sampled following the EN 14778:2011 [41] standard. Based on Table 1—Classification of origin and sources of solid biofuels [14,15], the producers stated that 77% were from “Forest, plantation and other virgin wood”, 6% from “By-products and residues from wood processing industry—Chemically untreated wood residues”, 0.6% from “Used wood”. The origin of 16.4% samples was unknown. Among the 235 wood chips samples from the “Forest, plantation and other virgin wood”, 38.7% were coniferous, 17.4% broad-leaf, 23.4% blends, 1.3% vineyard pruning residues and 2.6% olive pruning residues. For 16.6% of samples the producers did not specify if they were from coniferous or broad-leaf or blends (level of specification not required by the standards). Wood chips were collected and analyzed over four years, from 2013 to 2016. This justifies the use of methods included in European standards until the entry into force of the International ones (2015–2016). In addition to sample origin, the standard classification includes the following physical parameters: moisture content, bulk density, particle size distribution, ash content and net calorific value.
Table 1 lists the standard methodologies for determining the physical properties of wood chips.
The methodologies reported in EN 14474-1 [42] and ISO 18134-1 [43] to measure the moisture content (MC) on a wet basis are the same. Three subsamples of each wood chips sample were put in a ventilated oven at 105 ± 2 °C. Once they reached a constant weight, without exceeding the 24 h, they were removed. The methodologies for the measurement of bulk density (BD), ash content (A) and high heating value as received (HHVar) reported in the EN and ISO standards are also equal. The bulk density was measured using a steel container with a filling volume of 50 L. The average final net weight of three samples referred to the volume of a cubic meter provided the bulk density values. To measure the ash content and high heating value, wood chips samples were ground with a laboratory cutting mill to reduce the particle size to a nominal top size of 1 mm. The ash content was evaluated using three samples of minimum 1 g of ground wood chips. The samples were weighed before and after their complete combustion at 550 °C until they reached constant weight. The final ash content values are the average of the three measures on a dry basis.
Lastly, a C-200 calorimeter (IKA, Wilmington, NC, USA) was used to measure the high heating value of wood chips as received (HHVar). The high heating value is the average of three repetitions. The high heating value on dry basis and ash free (HHVdaf) is calculated as specified in the standard [50].
As previously mentioned, the main difference between the EN and ISO standards is the particle size classification (Table 2). To measure the particle size distribution, 8 L of wood chips samples were sieved at moisture content below 20 w% wet basis to avoid the fine particles from adhering together or losing moisture during the testing. Six circular sieves with round perforated holes in a metal plate from 3.15 mm to 63 mm, in accordance with ISO 3310-2 [51], were used in the particle size determination following EN 15149-1 [34]; five circular sieves with round perforated holes were used for ISO 17827-1 [35] particle size determination since the 8 mm sieve is no longer necessary to calculate the ISO particle size distribution class. The determination of particle size classes was made in accordance with both EN and ISO standards (Table 1—Particle size of wood chips, EN 14961-4:2011; Table 1—Particle size of graded wood chips, ISO 17225-4:2014) [29,30].
To verify if an increase of quality depends on standards, all the samples classified using EN standards were re-classified calculating the particle size distribution according to the new ISO standards [47].
Since this study is focused on the best quality of wood chips only the physical characterization has been taken into account, as required for the quality classes of type A described in the EN and ISO standards (EN 14961-4:2011; ISO 17225-4:2014) [25,26], and in the Handbook for Biomassplus certification [31].
2.2. Statistical Analysis
In order to assess the quality of wood chips and its variation over the years according to the “former” EN 14691-4 [29] and the “in force” ISO 17225-4 [30] standards, three SIMCA models were built to predict the best quality of wood chips and to understand how the quality parameters affect it over the years and with the standard regulation changes.
Among the analyzed variables, seven were chosen to perform the class-modelling approach and the consequent SIMCA quality index (Table 2). Moisture content, bulk density, particle size distribution, ash content and high heating value as received are all mandatory quality parameters for the wood chips attribution to a quality class. The content of fines is included in the determination of particle size distribution and it was taken into account because it becomes a discriminant parameter in the Biomassplus certification [31]. The high heating value on dry basis and ash free has been considered because it allows the comparison between samples since it does not depend on moisture content as the high heating value as received does.
Table 3 and Table 4 show the descriptive statistics of variables used in the SIMCA models (Table 2) and the linear correlations between them (Table 4). It is important to emphasize that SIMCA is not sensitive to the linear correlations of variables. As expected, the results in Table 4 show that there is a positive linear correlation (r = 0.64) between BD and MC and a negative linear correlation (r = −0.98) between the HHVar and MC. In fact, the moisture content of wood affects positively its bulk density and negatively its net calorific power. The negative linear correlation (r = −0.64) between BD and HHVar could be due to the negative effect of MC on HHVar.
SIMCA, computed with the software V-Parvus 2010 (University of Genova, free available at http://www.parvus.unige.it), is a collection of Principal Component Analysis (PCA) models (NIPALS algorithm), one for each class of dataset (one in this case), after a separate category autoscaling. SIMCA cross validates the PCA model of each class (training set), splitting the data (evaluation set) into four contiguous groups (cross validation groups). In this case, the modified model with expanded range was used substituting the one first introduced by Wold and Sjöström [33]. The unweighted augmented SIMCA distance was considered in building the models. For each class, the number of significant components of the inner space was estimated considering six Principal Components (PC) (lowest noise found). For each class, a critical square distance based on the F-distribution was calculated using a confidence interval (95%). The class boundary was determined according to the confidence interval. An observation is attributed to the model class when its residual distance from the model has a value below the statistical limit for the class. SIMCA allows both the modelling and classification analysis. In the classification phase, all the observations should be attributed to one of the pre-defined classes. The efficiency was evaluated by classification (training set) and prediction (evaluation set) matrices, which reported the percentage of correct classification for each considered class. SIMCA also expressed the statistical parameters indicating the modelling efficiency. Unknown objects could be either classified into the class or recognized as outliers. The modelling efficiency was indicated by sensitivity. This is the measure of how well the model correctly identifies the cases really belonging to the class. The modelling power for each variable, which represents the influence of that variable in defining of the model, was expressed.
In order to express a metric index for each wood chips sample, square SIMCA distances were linearized converting the values into a logarithmic scale and then translating them by adding a certain value in order to have all positive values.
Each of the three SIMCA models was built on a training dataset consisting of 66.67% (one third) of the best quality wood chips samples belonging to EN (A1), ISO (A1) or Biomassplus (A1+) samples. The rest of the best quality samples together with all the other samples were used to test the models. This partitioning was optimally chosen using the Euclidean distances based on the Kennard and Stone algorithm [52] that selects objects without an a priori knowledge of a regression model.
3. Results and Discussion
3.1. Changes of Wood Chips Quality over the Years and According to the Standards
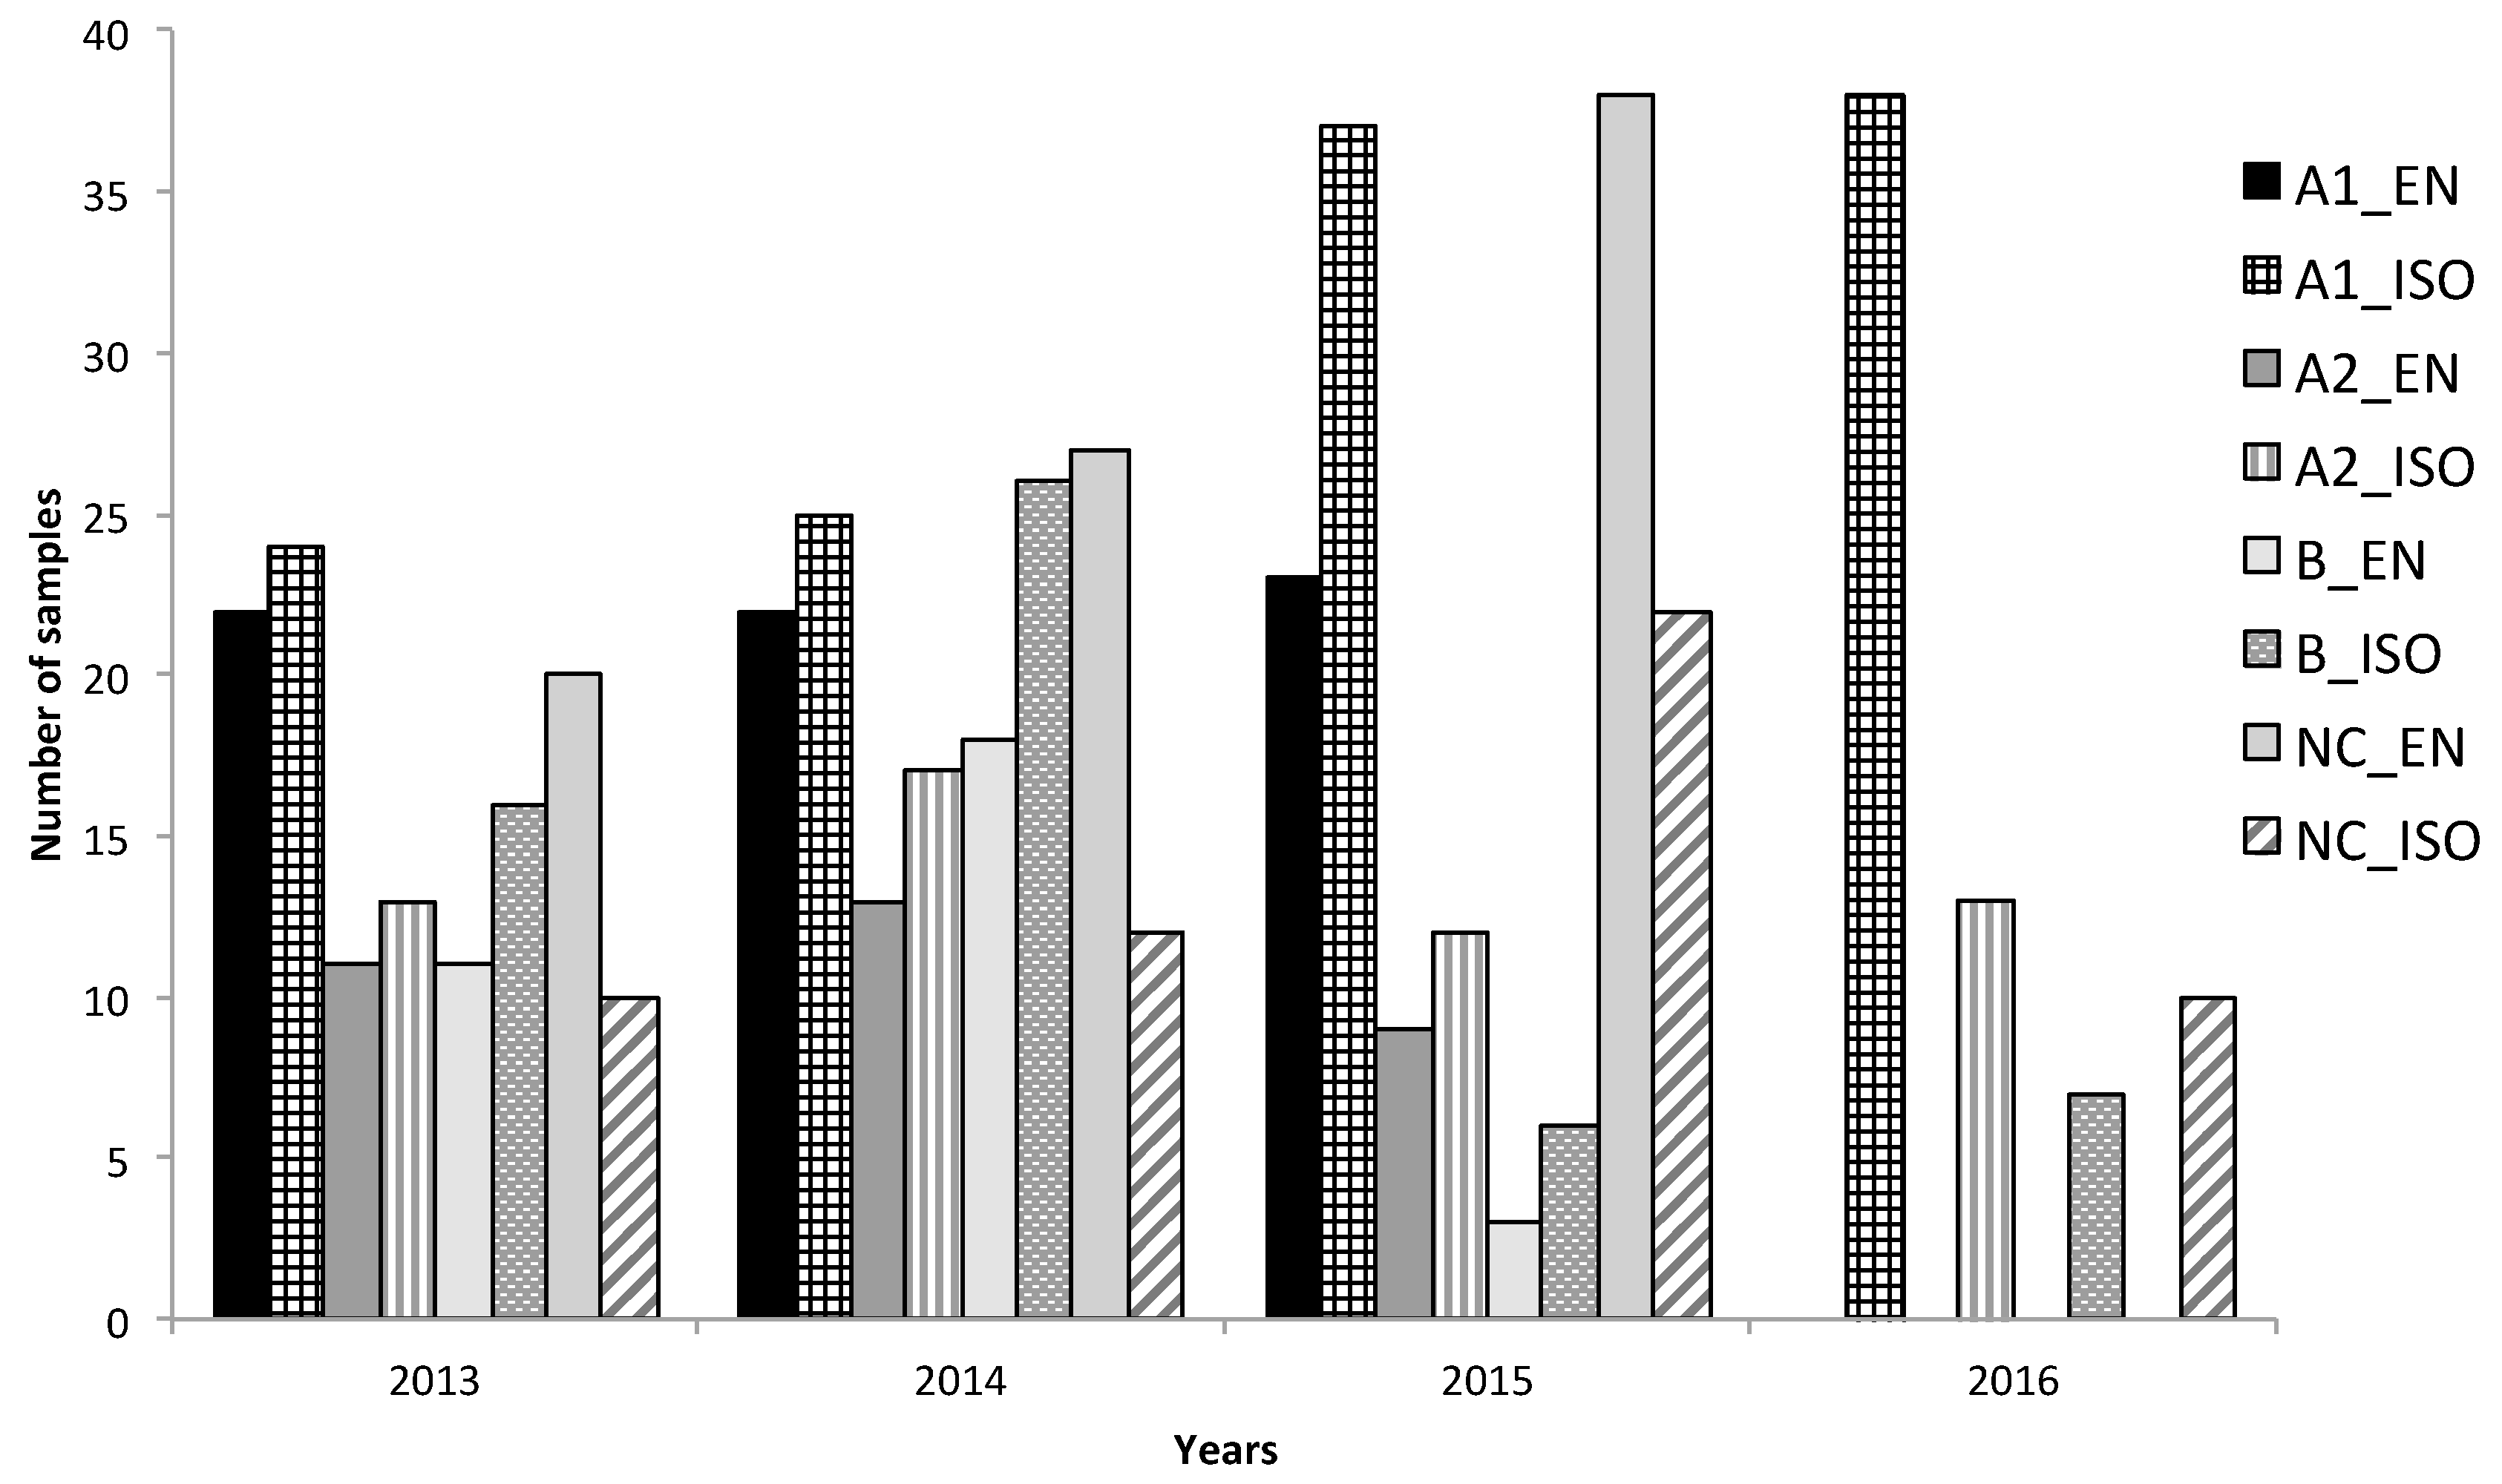
When comparing the EN and ISO standards from 2013 to 2015 (Figure 1), the slight increase in the number of samples belonging to classes A1, A2 and B and the decrease in number of samples classified as not classified (NC) are related to the classification according to the new ISO standard. The EN samples were classified NC principally because of their particle size distribution (P). In the ISO standard, the percentage of the main fraction should be at least 60 w%, instead of 75% as prescribed in the EN standard, and the percentage of fines fraction (≤3.15 mm) associated to the main fraction is higher. The percentage and size of overlengths also differ in the two standards [29,30]. This means that the samples classified NC by the EN standard, because they did not belong to any of the P classes, are instead classified by ISO standard requirements.
The number of wood chips samples belonging to the ISO quality class A1 increased by 61% in 2015 with respect to the EN classification. This is because 42% of NC EN samples became classified with ISO standard and 4 additional samples were only classified according to it.
In 2016, only the ISO classification in force was used to classify the wood chips. A total of 68 samples were analyzed and 56% belonged to the best quality class (A1). In 2015, 31.5% of A1 samples according to the EN classification became 48% when classified with the ISO standard.
In general, the ISO classification increases the number of wood chips samples belonging to quality classes A1, A2 and B1 and decreases the number of not classified (NC) samples, compared to the EN standards.
In its standard applications, χ2 tests if observations are classified into mutually exclusive classes, and there is a theory, or null hypothesis, which gives the probability that any observation falls into the corresponding class. The purpose of the test is to evaluate how likely the probability is between the observations and the null hypothesis. Table 5 shows the changes in wood chips quality according to the standards. In Table 5 only samples belonging to B1 quality class have been taken into account. 17 samples classified as “B”, from a physico-mechanical point of view, were not considered because of their unknown origin, as the origin is a discriminating characteristic as to whether the sample belongs to class B1 or B2.
The Chi-Square (χ2) test finds significant changes (p < 0.05) in the years for quality classes defined according to the EN standard: compared to 2013, in 2014 the number of B1 quality samples is significantly higher than the expected average value while it is significantly lower in 2015. The number of NC samples is higher than the expected average value in 2015.
Concerning the ISO quality classes, the probability of χ2 (P χ2) is >0.05, this means that there are no significant differences between the measured and predicted values. As a consequence, the ISO classification seems to better express the quality of the wood chips samples.
3.2. Multivariate SIMCA models
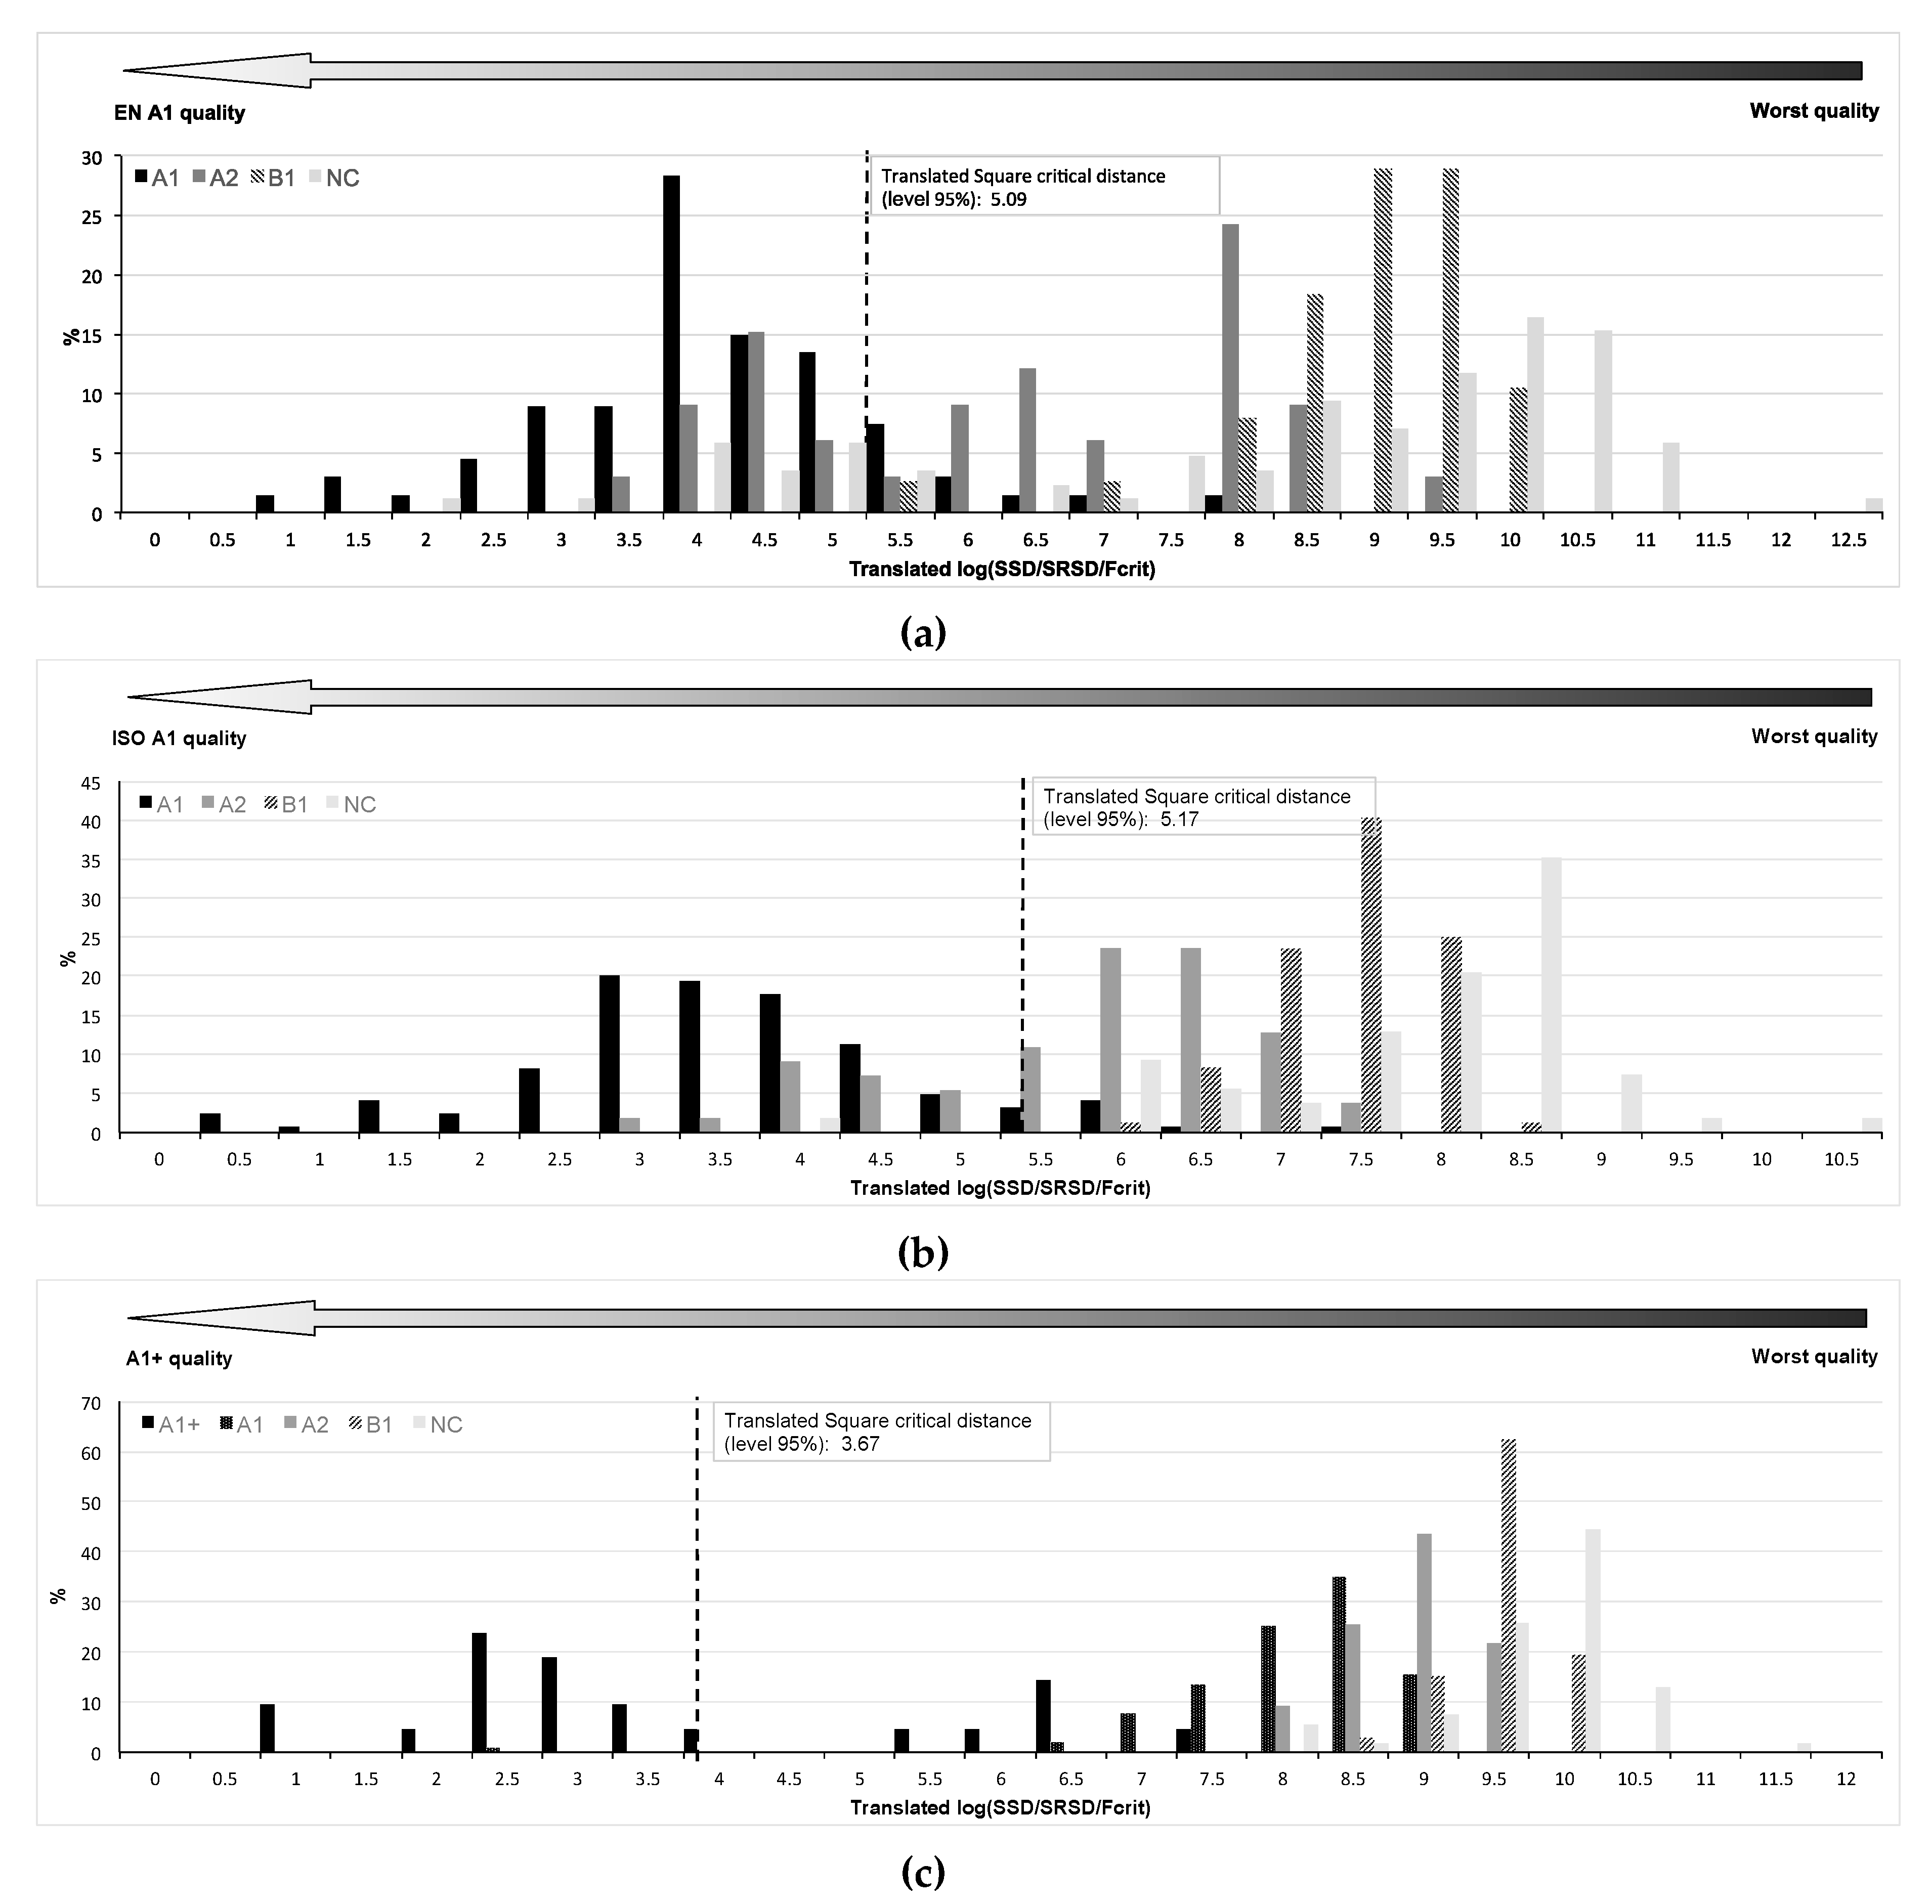
The results of the three SIMCA models built with the EN, ISO and Biomassplus wood chips samples are shown in Figure 2. This figure exhibits the adimensional logarithmic translated square critical distance of each observation for each EN, ISO and Biomassplus A1 quality score grouped into histograms. Observations below the translated square critical distance (dashed lines) represent those belonging to the top quality class for each EN, ISO and Biomassplus A1 quality score. In this way the x axis represents a quality axis, from left (proximal to zero; best quality) to right (worst quality).
The results of the statistical analysis state that the total explained variance of the seven SIMCA model principal components is 99.99% in the EN and Biomassplus models and 99.54% in the ISO model.
The logarithmic translated square critical distance, based on the F-distribution, is an adimensional value. For the three SIMCA models, it shows three different values: 5.09 in the EN model, 5.17 in the ISO model and 3.67 in the Biomassplus one. This value identifies the class-limit of the model: below it the distance value of an observation is enclosed in the model (those values could not be compared among different models), whilst a sample with a higher distance value is excluded [53]. The differences between the translated square critical distances were related to the different limits set by the standards. The lowest distance of Biomassplus model is due to the fact that only A1+ samples have a translated square critical distance <3.67. However, it should be recalled that the Biomassplus certification attests to the absolute best quality of solid biofuel samples where the limits of the quality parameters are the strictest, with the highest modelling power (Figure 3), and consequently the model is the most exclusive. EN and ISO models also include some A2 samples among the best quality samples, while the worst quality samples (B1) or NC samples are excluded in all the models.
Sensitivities were high (>90%) for all 3 models: 0.93 for EN, 0.96 for ISO and 0.93 for Biomassplus.
Based on the results shown in Figure 2, the percentage of EN A1 included by the model is 88%, the percentage of ISO A1 is 91% and that of Biomassplus A1+ is 67%. The samples not included in the model do not belong to 95% confidence interval for which the model was built. The model built on EN A1 also included 33% of EN A2 samples, 0% EN B1 and 18% EN NC; the model built on ISO A1 also included 29% of ISO A2, 3% of ISO B1 and 6% of ISO NC, and the one built on Biomassplus A1+ also included 1% of A1 and 0% of A2, B1 and NC.
The different modelling powers of the seven parameters considered in the models are reported in Figure 3.
The modelling power represents the contribution (i.e., the importance) of each quality parameter, with the other parameters, to the place of a wood chips sample along the x-axis (Figure 2). The quality parameter with higher modelling power score better explains the position of each wood chips sample. No modelling power scores are below 0.87 (adimensional scale); this means that all the variables contribute highly to the model definition. The parameters that best explain the highest quality of wood chips samples are A, F, BD and P and this is reflected in the weight that they have in the classifying of wood chips for non-industrial use and the performances related to their use. These quality parameters were mainly responsible for the exclusion of samples from the SIMCA models. HHVar, MC and HHVdaf are among the lower modelling power scores. The HHVar and MC are strictly correlated (Table 3) [54,55]. Since the ISO standard in force does not set a limit value for HHVar (Table 1), it is expected that its modelling power is lower than the EN and Biomassplus HHVar powers, where the lower limit of 16 MJ kg−1 is indicated by the standards. With the HHVar, the ISO MC has the lowest modelling power. The ISO classification counted 288 samples of which 54 (19.44%) were non-classifiable (NC). Among the reasons for non-classification, only one sample was rejected because of the high moisture content together with a high ash percentage and an abnormal particle size distribution. In general, the moisture content of analyzed samples satisfied the standard requirements for use in domestic appliances, while the main causes for rejection are a high ash content and an abnormal particle size distribution. The EN classification counted 217 samples of which 85 (39.17%) were non-classifiable (NC). The main causes for non-classification were slightly different because there was a greater influence of the particle size distribution parameter (P) in the EN classification than in the ISO classification.
4. Conclusions
The goal of this research was to analyze and model the changes in quality of wood chips for use in domestic appliances over the years and according to the evolution of standardization rules. The quality of 305 commercial wood chips samples was characterized from 2013 until 2016. In 2015 the new International standardization rules (ISO) entered into force and replaced the European standards (EN). The quality classification of wood chips has changed according to the new ISO classification. The first results showed that the ISO classification results in an increase of samples belonging to quality classes A1, A2 and B1 and fewer NC samples with respect to the EN one.
In particular, the study highlights how the ISO classification maintains a quality assessment on the same level as the previous norm for the parameters strictly related to the energy content of the wood chips (such as moisture content, ash percentage, heating values), while being more tolerant in terms of particle size classification (P). This means that introduction of the ISO classification favors the demand for quality by end users being met in terms of particle size distribution classification offered by the wood chips producers. Considering the difficulty of managing a feedstock that is sometimes very uneven from the same origin and strongly related to the machine type and chipping system.
The sensitivities of all three multivariate SIMCA models were high (>90%), which means a high performance in modelling the wood chip quality. All the parameters included in the models have a modelling power >0.85 but the parameter with the highest modelling power in the three models is the ash content. The models can be used to monitor the quality of wood chips and they reflect the changes to the quality standards: the differences between the translated square critical distances of each model are related to the different limits set by the standards. The lowest distance of Biomassplus model is due to the fact that only A1+ samples have a translated square critical distance <3.67. EN and ISO models also include some A2 samples among the best quality samples, while the worst quality samples B1 or NC samples are excluded.
In practice the successful application of the quality parameters modelling can open up the prospect of using previous results of wood chips analysis based on specific norms (in this case ISO standard norms) to predict rapidly and in advance the quality of wood chips samples based on the most significant quality parameters, as the ash content, the bulk density, the fines content and the particle size distribution. The SIMCA models allow to do a preliminary screening of the quality of the wood chips reducing the cost and time of the wood chips analysis. This approach could be improved expanding the sample dataset and including also indications on the mechanical processes and devices used to reduce the wood into wood chips.
Acknowledgments
Some activities in this study were funded by the Italian Ministry of University and Scientific Research (MIUR), as part of the project “Ambi.tec.Fil.Legno” (PON03PE_00024_1) and by the project AGROENER (D.D. n. 26329) funded by the Italian Ministry of Agriculture (MiPAAF).
Author Contributions
Michela Zanetti contributed to data collection, results interpretation and wrote the paper; Corrado Costa and Giovanna Ottaviani Aalmo analyzed the data; Rosa Greco performed the experiments and contributed to data collection; Stefano Grigolato contributed to data analysis; Raffaele Cavalli revised the manuscript.
Conflicts of Interest
The authors declare no conflict of interest.
References
- International Energy Agency (IEA). CO2 Emissions from Fuel Combustion. 2016 Edition. Available online: http://www.iea.org/publications/freepublications/publication/KeyCO2EmissionsTrends.pdf (accessed on 18 July 2017).
- Bentley, R.W.; Mannan, S.A.; Wheeler, S.J. Assessing the date of the global oil peak: The need to use 2P reserves. Energy Policy 2007, 35, 6364–6382. [Google Scholar] [CrossRef]
- Pierobon, F.; Zanetti, M.; Grigolato, S.; Sgarbossa, A.; Anfodillo, T.; Cavalli, R. Life Cycle Environmental Impact of Firewood Production—A Case Study in Italy. Appl. Energy 2015, 150, 185–195. [Google Scholar] [CrossRef]
- Bacenetti, J.; Bergante, S.; Facciotto, G.; Fiala, M. Woody Biofuel Production from Short Rotation Coppice in Italy: Environmental-impact Assessment of Different Species and Crop Management. Biomass Bioenergy 2016, 94, 209–219. [Google Scholar] [CrossRef]
- Dunnet, A.J.; Shah, N. Prospects for bioenergy. J. Biobased Mater. Bioenergy 2007, 1, 289–300. [Google Scholar] [CrossRef]
- Murphy, F.; Devlin, G.; Kevin McDonnell, K. Forest Biomass Supply Chains in Ireland: A Life Cycle Assessment of GHG Emissions and Primary Energy Balances. Appl. Energy 2014, 116, 1–8. [Google Scholar] [CrossRef]
- Thornley, P.; Gilbert, P.; Shackley, S.; Hammond, J. Maximizing the Greenhouse Gas Reductions from Biomass: The Role of Life Cycle Assessment. Biomass Bioenergy 2015, 81, 35–43. [Google Scholar] [CrossRef]
- Proto, A.R.; Bacenetti, J.; Macrì, G.; Zimbalatti, G. Roundwood and Bioenergy Production from Forestry: Environmental Impact Assessment Considering Different Logging Systems. J. Clean. Prod. 2017, 165, 1485–1498. [Google Scholar] [CrossRef]
- Morrison, B.; Goden, J.S. Life Cycle Assessment of Co-firing Coal and Wood Pellets in the Southeastern United States. J. Clean. Prod. 2017, 150, 188–196. [Google Scholar] [CrossRef]
- Lovarelli, D.; Bacenetti, J. Bridging the Gap Between Reliable Data Collection and the Environmental Impact for Mechanised Field Operations. Biosyst. Eng. 2017, 160, 109–123. [Google Scholar] [CrossRef]
- EN ISO 16559:2014. Solid Biofuels—Terminology, Definitions and Descriptions; ISO: Geneva, Switzerland, 2014.
- Kuptz, D.; Hartmann, H. The Effect of Raw Material and Machine Setting on Chipping Performance and Fuel Quality—A German Case Study. Int. J. For. Eng. 2015, 26, 60–70. [Google Scholar] [CrossRef]
- Sgarbossa, A.; Costa, C.; Menesatti, P.; Antonucci, F.; Pallottino, F.; Zanetti, M.; Grigolato, S.; Cavalli, R. Colorimetric Patterns of Wood Pellets and Their Relations with Quality and Energy Parameters. Fuel 2014, 137, 70–76. [Google Scholar] [CrossRef]
- EN 14961-1:2010. Solid Biofuels. Fuel Specifications and Classes. Part 1: General Requirements; CEN: Brussels, Belgium, 2010.
- EN ISO 17225-1:2014. Solid Biofuel. Fuel Specifications and Classes. Part 1: General Requirements; ISO: Geneva, Switzerland, 2014.
- Duca, D.; Pizzi, A.; Mancini, M.; Rossini, G.; Mengarelli, C.; Ilari, A.; Lucesoli, G.; Toscano, G.; Pedretti, E.F. Fast Measurement by Infrared Spectroscopy as Support to Woody Biofuels Quality Determination. J. Agric. Eng. 2016, 47, 17–21. [Google Scholar] [CrossRef]
- Lehtikangas, P. Quality Properties of Pelletised Sawdust, Logging Residues and Bark. Biomass Bioenergy 2001, 20, 351–360. [Google Scholar] [CrossRef]
- Dias, J.; Costa, M.; Azevedo, J.L.T. Test of Small Domestic Boiler Using Different Pellets. Biomass Bioenergy 2004, 27, 531–539. [Google Scholar] [CrossRef]
- Jirjis, R. Effects of Particle Size and Pile Height on Storage and Fuel Quality of Comminuted Salix viminalis. Biomass Bioenergy 2005, 28, 193–201. [Google Scholar] [CrossRef]
- Werkelin, J.; Skrifvars, B.J.; Zevenhoven, M.; Holmbom, B.; Hupa, M. Chemical Forms of Ash-forming Elements in Woody Biomass Fuels. Fuel 2010, 89, 481–493. [Google Scholar] [CrossRef]
- Saidur, R.; Abdelaziz, E.A.; Demirbaş, A.; Hossain, M.S.; Mekhilef, S. A Review on Biomass as a Fuel for Boilers. Renew. Sustain. Energy Rev. 2011, 15, 2262–2289. [Google Scholar] [CrossRef]
- Spinelli, R.; Nati, C.; Sozzi, L.; Magagnotti, N.; Picchi, G. Physical Characterization of Commercial Woodchips on the Italian Energy Market. Fuel 2011, 90, 2198–2202. [Google Scholar] [CrossRef]
- Abdallah, R.; Auchet, S.; Méausoone, P.J. Experimental Study about the Effects of Disc Chipper Settings on the Distribution of Wood Chip Size. Biomass Bioenergy 2011, 35, 843–852. [Google Scholar] [CrossRef]
- Serrano, C.; Portero, H.; Monedero, E. Pine Chips Combustion in a 50 kW Domestic Biomass Boiler. Fuel 2013, 111, 564–573. [Google Scholar] [CrossRef]
- Cerasino, L.; La Porta, N. Allocation of Five Macroelements and Quality of Fuels Derived from Norway Spruce Wood Obtained by Thinning Operations. Biomass Bioenergy 2014, 70, 553–556. [Google Scholar] [CrossRef]
- Fournel, S.; Palacios, J.H.; Morissette, R.; Villeneuve, J.; Godbout, S.; Heitz, M.; Savoie, P. Influence of Biomass Properties on Technical and Environmental Performance of a Multi-fuel Boiler During on-farm Combustion of Energy Crops. Appl. Energy 2015, 141, 247–259. [Google Scholar] [CrossRef]
- Manzone, M. Energy Consumption and CO2 Analysis of Different Types of Chippers Used in Wood Biomass Plantations. Appl. Energy 2015, 156, 686–692. [Google Scholar] [CrossRef]
- Krzyzaniak, M.; Stolarski, M.J.; Niksa, D.; Tworkowski, J.; Szczukowski, S. Effect of Storage Methods on Willow Chips Quality. Biomass Bioenergy 2016, 92, 61–69. [Google Scholar] [CrossRef]
- EN 14691-4:2011. Solid Biofuels. Fuel Specifications and Classes. Part 4: Wood Chips Non-Industrial Use; CEN: Brussels, Belgium, 2011.
- EN ISO 17225-4:2014. Fuel Specifications and Classes. Part 4: Graded Wood Chips; ISO: Geneva, Switzerland, 2014.
- Associazione Italiana Energie agroforestali (AIEL); Ente Nazionale Meccanizzazione Agricola (ENAMA). Manuale per la Certificazione di Qualità dei Biocombustibili Legnosi. Parte Speciale per la Certificazione del Cippato. 2015. Available online: http://www.enama.it/fileGallery/36/files/Handbook%20CIPPATO.pdf (accessed on 4 July 2017).
- Negrin, M. Qualità, tracciabilità e sostenibilità, i pilastri della certificazione Biomassplus per cippato, legna da ardere e bricchette. Agriforenergy 2015, 3, 27–29. [Google Scholar]
- Wold, S.; Sjöström, M. SIMCA, a method for analysing chemical data in terms of similarity and analogy. In Chenometrics: Theory and Application; Kowalsky, B.R., Ed.; American Chemical Society: Washington, DC, USA, 1977; p. 243. [Google Scholar]
- Vanden Branden, K.; Hubert, M. Robust Classification in High Dimensions Based on the SIMCA Method. Chemometr. Intell. Lab. Syst. 2005, 79, 10–21. [Google Scholar] [CrossRef]
- Casale, M.; Armanino, C.; Casolino, C.; Forina, M. Combining Information from Headspace Mass Spectrometry and Visible Spectroscopy in the Classification of the Ligurian Olive Oils. Anal. Chim. Acta 2007, 589, 89–95. [Google Scholar] [CrossRef] [PubMed]
- Hall, G.J.; Kenny, J.E. Estuarine Water Classification Using EEM Spectroscopy and PARAFAC SIMCA. Anal. Chim. Acta 2007, 581, 118–124. [Google Scholar] [CrossRef] [PubMed]
- Forina, M.; Oliveri, P.; Casale, M.; Lanteri, S. Multivariate Range Modeling, a New Technique for Multivariate Class Modeling: The Uncertainty of the Estimates of Sensitivity and Specificity. Anal. Chim. Acta 2008, 622, 85–93. [Google Scholar] [CrossRef] [PubMed]
- Forina, M.; Oliveri, P.; Lanteri, S.; Casale, M. Class-modeling Techniques, Classic and New, for Old and New Problems. Chemometr. Intell. Lab. Syst. 2008, 93, 132–148. [Google Scholar] [CrossRef]
- Aguzzi, J.; Costa, C.; Antonucci, F.; Company, J.B.; Menesatti, P.; Sarda, F. Influence of Diel Behaviour in the Morphology of Decapod Natantia. Biol. J. Linn. Soc. 2009, 96, 517–532. [Google Scholar] [CrossRef]
- Menesatti, P.; Antonucci, F.; Pallottino, F.; Bucarelli, F.M.; Costa, C. Spectrophotometric Qualification of Italian Pasta Produced by Traditional or Industrial Production Parameters. Food Bioprocess Tech. 2014, 7, 1364–1370. [Google Scholar] [CrossRef]
- EN 14778:2011. Solid Biofuel. Sampling; CEN: Brussels, Belgium, 2011.
- EN 14474-1:2009. Solid Biofuels. Determination of Moisture Content. Oven Dry Method. Part 1: Total Moisture—Reference Method; CEN: Brussels, Belgium, 2009.
- EN ISO 18134-1:2015. Solid Biofuels. Determination of Moisture Content. Oven Dry Method. Part 1: Total Moisture—Reference Method; ISO: Geneva, Switzerland, 2015.
- EN 15103:2010. Solid Biofuels. Determination of Bulk Density; CEN: Brussels, Belgium, 2010.
- EN ISO 17828:2015. Solid Biofuels. Determination of Bulk Density; ISO: Geneva, Switzerland, 2015.
- EN 15149-1: 2011. Solid Biofuels. Determination of Particle Size Distribution. Part 1: Oscillating Screen Method Using Sieve Apertures of 1 mm and above; CEN: Brussels, Belgium, 2011.
- EN ISO 17827-1:2016. Solid Biofuels. Determination of Particle Size Distribution for Uncompressed Fuels. Part 1: Oscillating Screen Method Using Sieves with Apertures of 3.15 mm and above; ISO: Geneva, Switzerland, 2016.
- EN 14775:2010. Solid Biofuels. Determination of Ash Content; CEN: Brussels, Belgium, 2010.
- EN ISO 18122:2015. Solid Biofuels. Determination of Ash Content; ISO: Geneva, Switzerland, 2015.
- EN 14918:2009. Solid Biofuels. Determination of Calorific Value; CEN: Brussels, Belgium, 2009.
- EN ISO 3310-2: 2013. Test Sieves. Technical Requirements and Testing. Part 2: Test Sieves of Perforated Metal Plate; ISO: Geneva, Switzerland, 2013.
- Kennard, R.W.; Stone, L.A. Computer Aided Design of Experiments. Technometrics 1969, 11, 137–148. [Google Scholar] [CrossRef]
- Sgarbossa, A.; Costa, C.; Menesatti, P.; Antonucci, F.; Pallottino, F.; Zanetti, M.; Grigolato, S.; Cavalli, R. A Multivariate SIMCA Index as Discriminant in Wood Pellet Quality Sssessment. Renew. Energy 2015, 76, 258–263. [Google Scholar] [CrossRef]
- Demirbaş, A. Biomass Resource Facilities and Biomass Conversion Processing for Fuels and Chemicals. Energy Convers. Manag. 2001, 42, 1357–1378. [Google Scholar] [CrossRef]
- McKendry, P. Energy Production from Biomass (part 1): Overview of Biomass. Bioresour. Technol. 2002, 83, 37–46. [Google Scholar] [CrossRef]
Figure 1.
Changes in wood chips quality with the entry in force of the ISO classification over the years of analysis.
Figure 1.
Changes in wood chips quality with the entry in force of the ISO classification over the years of analysis.

Figure 2.
Percentage of wood chips samples showing different logarithmic translated square SIMCA distances from the 66.67% of the best quality sample used to build the model (A1 or A1+; black), the other wood chips samples and the 33.33% used as external test. The dashed line is the logarithmic translated square critical distance. (a) above: EN A1; (b) in the middle: ISO A1; (c) below: A1+.

Figure 3.
Variables included in the EN, ISO and Biomassplus models ordered by their corresponding modelling power (A: Ashes, F: Fines, BD: Bulk Density, P: Particle size distribution, HHVdaf: High Heating Value dry basis and ash free, MC: Moisture Content, HHVar: High Heating Value as received).
Figure 3.
Variables included in the EN, ISO and Biomassplus models ordered by their corresponding modelling power (A: Ashes, F: Fines, BD: Bulk Density, P: Particle size distribution, HHVdaf: High Heating Value dry basis and ash free, MC: Moisture Content, HHVar: High Heating Value as received).


Table 1.
Standard methodologies used to assess physical characteristics of wood chips (NA = Not Applicable).
Table 1.
Standard methodologies used to assess physical characteristics of wood chips (NA = Not Applicable).
| Wood Chips Properties | Standards | |
|---|---|---|
| European | International | |
| Moisture content (MC) | EN 14474-1 [42] | ISO 18134-1 [43] |
| Bulk density (BD) | EN 15103 [44] | ISO 17828 [45] |
| Particle size distribution (P) | EN 15149-1 [46] | ISO 17827-1 [47] |
| Ash content (A) | EN 14775 [48] | ISO 18122 [49] |
| High Heating Value as received (HHVar) | EN 14918 [50] | NA |
| High heating Value dry basis ash free (HHVdaf) | EN 14918 [50] | NA |
Table 2.
Variables used in the SIMCA models and limit values set by standards.
| Variable | Abbreviation | Unit | Limit Value for EN 14961-4 | Limit Values for ISO 17225-4 and Biomassplus (A1+) | |||||
|---|---|---|---|---|---|---|---|---|---|
| A1 | A2 | B | A1 | A2 | B | A1+ | |||
| Moisture Content | MC | % | ≤10 | ≤35 | * | ≤10 | ≤35 | ** | ≤10 |
| ≤25 | ≤25 | ||||||||
| Bulk Density | BD | kg m−3 | ≥150 ≥200 | ≥150 ≥200 | * | ≥150 ≥200 | ≥150 ≥200 | ** | ≥150 ≥200 ≥250 |
| Particle size distribution class | P | mm | P16A P16B P31, 5 P45 | P16A P16B P31, 5 P45 | P16A P16B P31, 5 P45 | P16S P31S P45S | P16S P31S P45S | P16S P31S P45S | P16S P31S P45S |
| Fines a | F | % | 12 to 8 | 12 to 8 | 12 to 8 | 15 to 10 | 15 to 10 | 15 to 10 | 6 to 5 |
| Ash on dry basis | A | % | ≤1.0 | ≤1.5 | ≤ 3.0 | ≤1.0 | ≤1.5 | ≤3.0 | ≤1.0 |
| High Heating Value as received | HHVar | MJ kg−1 | ≥13.0 | ≥11.0 | * | *** | *** | *** | ≥16.0 |
| High Heating Value b dry basis and ash free | HHVdaf | MJ kg−1 | * | * | * | * | * | * | * |
* To be specified; ** Maximum value to be stated; *** Minimum value to be stated; a Fines content is included in the determination of particle size distribution classes; b Not mandatory.
Table 3.
Descriptive statistics of quality parameters (HHVar: High Heating Value as received; HHVdaf: High Heating Value dry basis ash free; Fines: F; Moisture Content: MC; Bulk Density: BD; Ash on dry basis: A).
Table 3.
Descriptive statistics of quality parameters (HHVar: High Heating Value as received; HHVdaf: High Heating Value dry basis ash free; Fines: F; Moisture Content: MC; Bulk Density: BD; Ash on dry basis: A).
| Statistical Parameter | HHVar (MJ kg−1) | HHVdaf (MJ kg−1) | F (%) | MC (%) | BD (kg mc−1) | A (%) |
|---|---|---|---|---|---|---|
| mean | 13.66 | 19.89 | 5.31 | 23.33 | 237 | 1.30 |
| stdev | 2.63 | 0.60 | 5.56 | 12.22 | 49.46 | 1.70 |
| max | 20.09 | 23.91 | 49.40 | 65.45 | 430 | 23.07 |
| min | 4.88 | 17.90 | 0.05 | 2.68 | 100 | 0.10 |
Table 4.
Linear correlations r between quality parameters (HHVar: High Heating Value as received; HHVdaf: High Heating Value dry basis ash free; Fines: F; Moisture Content: MC; Bulk Density: BD; Ash on dry basis: A).
Table 4.
Linear correlations r between quality parameters (HHVar: High Heating Value as received; HHVdaf: High Heating Value dry basis ash free; Fines: F; Moisture Content: MC; Bulk Density: BD; Ash on dry basis: A).
| Quality Parameters | HHVar (MJ kg−1) | HHVdaf (MJ kg−1) | F (%) | MC (%) | BD (kg m−3) | A (%) |
|---|---|---|---|---|---|---|
| HHVar (MJ kg−1) | 1.00 | 0.15 | −0.21 | −0.98 | −0.64 | −0.26 |
| HHVdaf (MJ kg−1) | 0.15 | 1.00 | −0.18 | 0.02 | −0.08 | −0.41 |
| F (%) | −0.21 | −0.18 | 1.00 | 0.18 | 0.20 | 0.40 |
| MC (%) | −0.98 | 0.02 | 0.18 | 1.00 | 0.64 | 0.20 |
| BD (kg m−3) | −0.64 | −0.08 | 0.20 | 0.64 | 1.00 | 0.19 |
| Ash (%) | −0.26 | −0.41 | 0.40 | 0.20 | 0.19 | 1.00 |
Table 5.
Differences between observed and expected quality of wood chips over the years and according to the standards (χ2 = Chi square; P= probability). Bold values, in the Freeman-Tuckey transforms, represent comparisons (between observed and expected) significantly above/below the χ2 probabilities thresholds.
| Standard | Year | Samples | Quality Classes | Total | χ2 Values and Probabilities Threshold | ||||
|---|---|---|---|---|---|---|---|---|---|
| A1 | A2 | B1 | NC | ||||||
| EN 14961-4 | 2013 | Observed | 22 | 11 | 11 | 20 | 64 | ||
| Expected | 19.76 | 9.73 | 9.44 | 25.07 | - | ||||
| Freeman-Tukey transforms | 0.540 | 0.462 | 0.556 | −1.009 | - | ||||
| 2014 | Observed | 22 | 13 | 18 | 27 | 80 | |||
| Expected | 24.70 | 12.17 | 11.80 | 31.34 | - | 15.018 | |||
| Freeman-Tukey transforms | −0.504 | 0.300 | 1.660 | −0.753 | - | P(χ20.05,6) = | 0.020 | ||
| 2015 | Observed | 23 | 9 | 3 | 38 | 73 | |||
| Expected | 22.54 | 11.10 | 10.76 | 28.59 | - | ||||
| Freeman-Tukey transforms | 0.147 | −0.576 | −2.906 | 1.668 | - | ||||
| Total | 217 | ||||||||
| ISO 17225-4 | 2013 | Observed | 24 | 13 | 16 | 10 | 63 | ||
| Expected | 27.13 | 12.03 | 12.03 | 11.81 | - | ||||
| Freeman-Tukey transforms | −0.565 | 0.338 | 1.114 | −0.467 | - | ||||
| 2014 | Observed | 25 | 17 | 26 | 12 | 80 | |||
| Expected | 34.44 | 15.28 | 15.28 | 15.00 | - | ||||
| Freeman-Tukey transforms | −1.681 | 0.485 | 2.414 | −0.741 | - | ||||
| 2015 | Observed | 37 | 12 | 6 | 22 | 77 | |||
| Expected | 33.15 | 14.70 | 14.70 | 14.44 | - | 12.934 | |||
| Freeman-Tukey transforms | 0.688 | −0.665 | −2.639 | 1.821 | - | P(χ20.05,9) = | 0.166 | ||
| 2016 | Observed | 38 | 13 | 7 | 10 | 68 | |||
| Expected | 29.28 | 12.99 | 12.99 | 12.75 | - | ||||
| Freeman-Tukey transforms | 1.542 | 0.071 | −1.802 | −0.732 | - | ||||
| Total | 288 | ||||||||
© 2017 by the authors. Licensee MDPI, Basel, Switzerland. This article is an open access article distributed under the terms and conditions of the Creative Commons Attribution (CC BY) license (http://creativecommons.org/licenses/by/4.0/).
Share and Cite
MDPI and ACS Style
Zanetti, M.; Costa, C.; Greco, R.; Grigolato, S.; Ottaviani Aalmo, G.; Cavalli, R. How Wood Fuels’ Quality Relates to the Standards: A Class-Modelling Approach. Energies 2017, 10, 1455. https://doi.org/10.3390/en10101455
AMA Style
Zanetti M, Costa C, Greco R, Grigolato S, Ottaviani Aalmo G, Cavalli R. How Wood Fuels’ Quality Relates to the Standards: A Class-Modelling Approach. Energies. 2017; 10(10):1455. https://doi.org/10.3390/en10101455
Chicago/Turabian StyleZanetti, Michela, Corrado Costa, Rosa Greco, Stefano Grigolato, Giovanna Ottaviani Aalmo, and Raffaele Cavalli. 2017. "How Wood Fuels’ Quality Relates to the Standards: A Class-Modelling Approach" Energies 10, no. 10: 1455. https://doi.org/10.3390/en10101455
Note that from the first issue of 2016, this journal uses article numbers instead of page numbers. See further details here.