Design and Dynamic Modelling of PV-Battery Hybrid Systems for Custom Electromagnetic Transient Simulation


Department of Electrical Engineering, Chonnam National University, Gwangju 61186, Korea
*
Author to whom correspondence should be addressed.
Electronics 2020, 9(10), 1651; https://doi.org/10.3390/electronics9101651
Submission received: 1 September 2020
/
Revised: 3 October 2020
/
Accepted: 4 October 2020
/
Published: 11 October 2020
(This article belongs to the Special Issue Active Regional Energy Systems and Microgrids)
Abstract
:Battery energy storage systems (BESS) can alleviate the unstable effects of intermittent renewable energy systems, such as solar and wind power systems. In addition, a BESS can level the load of the existing utility grid. The penetration rate of this type of system is expected to increase in the future power grid, i.e., the microgrid. In this paper, a modeling technique is proposed that allows users to customize the photovoltaic (PV) battery hybrid systems. A dynamic power system computer-aided design/electromagnetic transients including DC system (PSCAD/EMTDC) model of a PV battery hybrid system is presented in this paper. Dynamic modeling of PV arrays, BESS, maximum power point tracking (MPPT) algorithms, and bidirectional converters are provided as well. The PV model, battery model, and MPPT control model are designed using a user-defined model (UDM) for custom electromagnetic transient simulation. A control method for stabilizing the output of the PV battery hybrid system is proposed. Finally, a PSCAD/EMTDC simulation is conducted to verify the effectiveness of the operating algorithm.
1. Introduction
A photovoltaic (PV) generation system is a type of technology that uses solar cells to convert solar energy into electrical energy. Due to its abundant resources, easy exploitation, cleanliness, and renewable properties, PV generation is developing more and more rapidly as a renewable energy source. When the PV generation systems are interconnected to a distribution system, the existing passive grid is changed to an active grid. In an active grid, electrical energy can flow in both directions, so the demand side can also contribute to electricity generation [1,2]. This can achieve substantial technical and economic benefits for both utility companies and customers. Loss reduction, voltage improvement, and frequency control are a few examples of accomplishing this goal. The technical impact of PV systems can be assessed through power system studies such as steady-state or dynamic analysis [3]. Steady states are basic investigations that can evaluate the flow of power and fault currents when PV is interconnected to the system. These studies are important for determining a reasonable location for and the generation capacity of a solar power plant [4,5]. Further, dynamic studies are needed to evaluate the overall grid continuity and to design powerful control systems [6,7,8].
However, the disadvantage of PV generation is that it occurs intermittently depending on the weather conditions. Therefore, energy storage elements are needed to obtain stable and reliable output from the PV generation system and to improve the steady-state and dynamic behavior of power generation systems [9]. A battery energy storage system (BESS) can be integrated into a PV generation system to form a more stable PV battery hybrid system. BESS can alleviate the unstable effects of intermittent renewable energy. The system can also level load fluctuations in the existing utility grid. The PV battery hybrid system consists of a PV array, battery, power electronic converter, controller, and utility grid [10].
Three basic types of battery models have been reported in the literature: those based on experiments, electrochemistry, and electrical circuits. Experimental and electrochemical models are not suitable for representing the cell dynamic for estimating the state of charge (SOC) of a battery pack. However, electrical circuit-based models can be useful for indicating the electrical characteristics of a battery. The simplest electrical model consists of an ideal voltage source connected in series with the internal resistance [11]. However, this model does not consider the battery SOC. There is another model based on the so-called Warburg impedance and open-circuit voltage connected in series with parallel RC circuits [12]. Shepherd developed an equation that directly describes the electrochemical behavior of a battery, and this model applies to both discharge and charge [13]. A modified version of the Shepherd model is used in [14]—this modification consists of using a polarization voltage instead of a polarization resistance to eliminate algebraic loop problems. This model represents the voltage behavior using only the battery SOC as a state variable.
In a recent study, various control strategies were proposed for the management of PV battery hybrid systems. Several approaches to the development of fuzzy logic energy management strategies have been described [15]. Many studies have examined the management of renewable energy systems. Most of these studies have focused on hybrid PV/wind/battery systems where wind energy is a source other than PV [16,17,18]. In these hybrid systems, PV and wind energy complement each other, and the role of the battery is less important than that of the PV/wind. Some studies have modeled PV battery hybrid systems and proposed control techniques [19,20,21]. These studies have focused on modeling PV battery hybrid systems.
However, in this paper, a modeling technique is proposed that allows users to customize the PV battery hybrid systems as a simulation of electromagnetic transient. The simulation of electromagnetic transient is widely used for testing control and protections for analyzing power system in modern power systems [22,23]. Simulation tools or methods for electromagnetic transients fall under the category of EMTP (Electromagnetic Transient Program) type tools. These tools are designed to study power system at a very high level of precision by attempting to reproduce real time domain waveforms of state variable at any location in the power system. Electromagnetic analysis technology is also used for defect detection for sub-surface by the magnetic flux leakage (MFL) method [24]. It is the proposed technique that allow users to develop an optimal model by modifying and upgrading the characteristics of the system model.
This paper describes in detail the model of a PV battery hybrid system developed through user customization. The PV generator is connected to the utility grid through a converter and a DC/AC inverter. Further, the battery is connected to a common DC bus through a bidirectional DC/DC converter. Detailed models of PV systems, BESS, and control systems are implemented in a power system computer-aided design/electromagnetic transients including DC system (PSCAD/EMTDC). PV models and battery models are implemented with Fortran code using the user-defined model (UDM) from PSCAD/EMTDC [25]. The PV model has developed a UDM model that allows the output characteristics to be determined by the PV parameters. The battery model has developed a model that determines the charge and discharge characteristic of the battery based on the extracted parameters from the discharge characteristic curve. In addition, a converter and inverter control method is developed using UDM. The PV model, battery model, and MPPT control model are designed for custom electromagnetic transient simulation. The effectiveness of the operation of the PV battery hybrid system is verified through simulation.
2. Modeling of PV and Battery Characteristics
This paper proposes a development technique for a battery and PV model. It is a technique that allows users to develop an optimal model by modifying and supplementing the characteristics of the model. The PV and battery model is developed using UDM from PSCAD. The output characteristics of the PV and battery are expressed mathematically and programmed using Fortran code.
2.1. PV Array Modeling
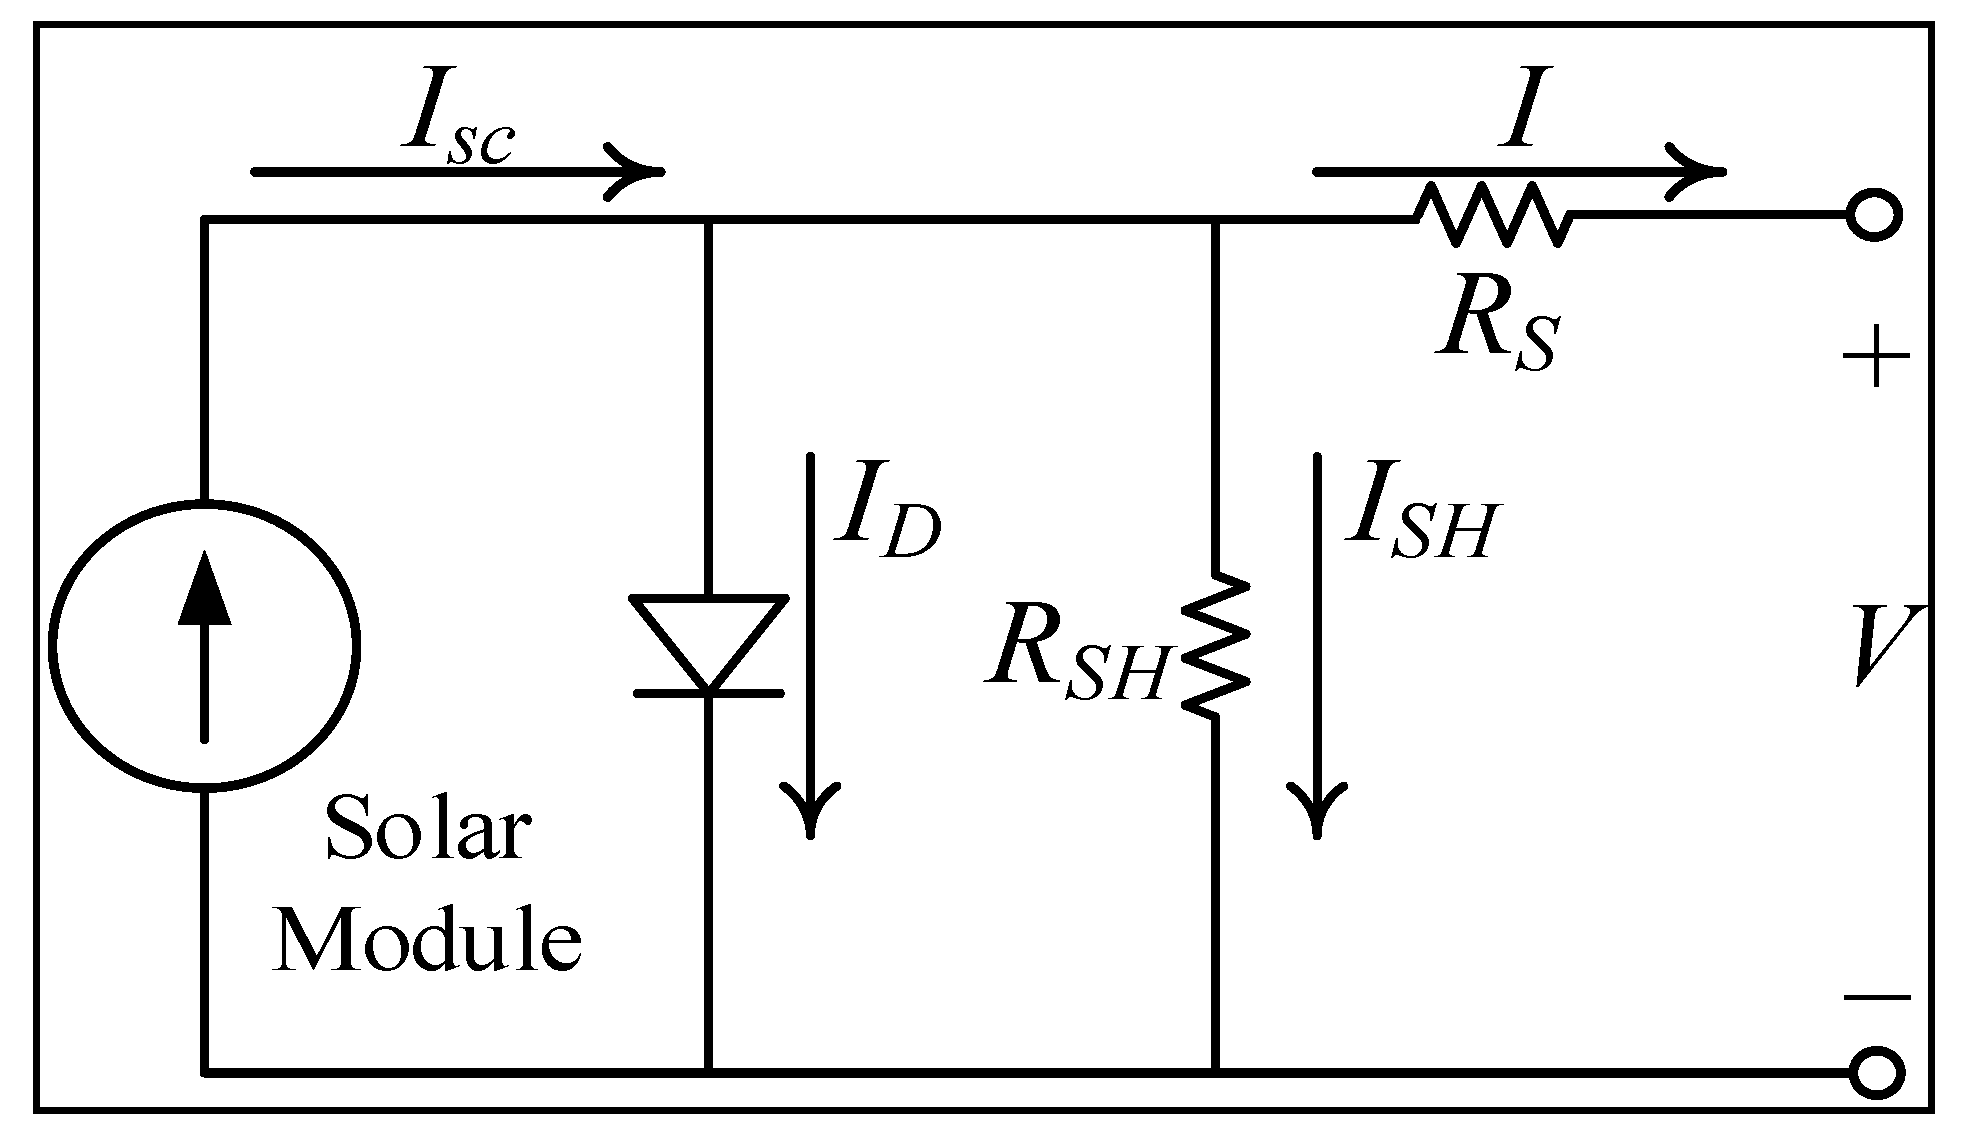
The basic operating principle of a PV array is the photoelectric effect of a semiconductor PN junction. The physical phenomenon of the PV module can be represented by an equivalent electrical circuit, as shown in Figure 1. The load current is expressed by Equation (1) [26].
where,
: Output terminal current
: Short-circuit Current (A)
: Intrinsic shunt resistance ()
: Intrinsic series resistance ()
: Diode saturation current (A)
: Terminal voltage of a module (V)
: Ideal constant of diode
: Boltzmann constant (1.38e−23(J/K))
: Cell temperature (K)
: Electron Charge (1.6 × 10⁻¹⁹ (°C))
: The number of cells in series in a module
The current source can be obtained by solar radiation quantity and temperature.
where,
: Solar radiation quantity
: Temperature (°C)
The characteristics of the PV module are non-linear and each curve only has one maximum power point. In addition, the output current of the PV module is mainly affected by the irradiation variation, while the output voltage of the PV module is mainly affected by the temperature variation. However, because the variable range of output power at different temperatures is small, irradiation variation is a major factor in the output power of the PV array.
PSCAD/EMTDC is an industry-standard simulation tool for studying the transient behavior of electrical devices and networks. The graphical user interface allows users to graphically organize circuits and run simulations. It also allows users to analyze results and manage data in a fully integrated graphical environment [25].
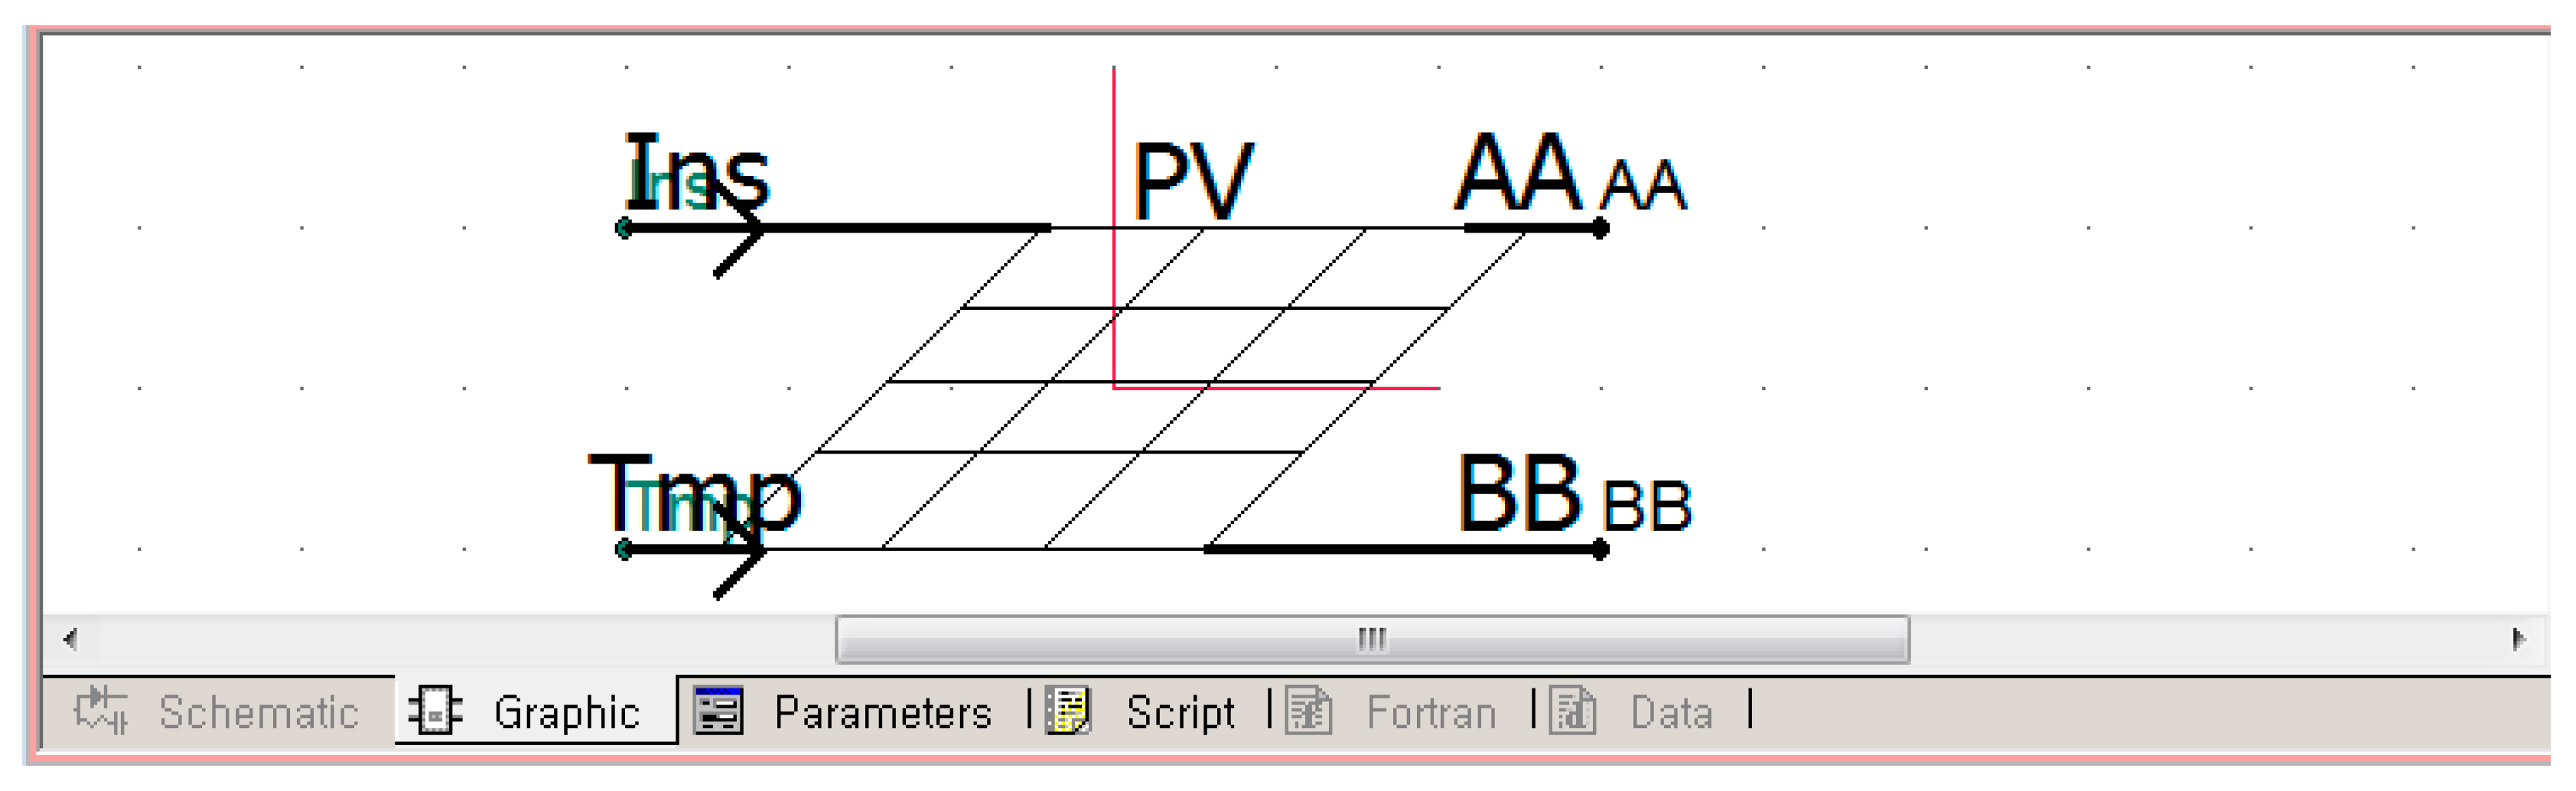
The user-friendly interface allows the user to enter the required parameters of the component. User-defined components can be created using the component wizard as a function of PSCAD. Figure 2 shows the components of the PV array model created using the component wizard.
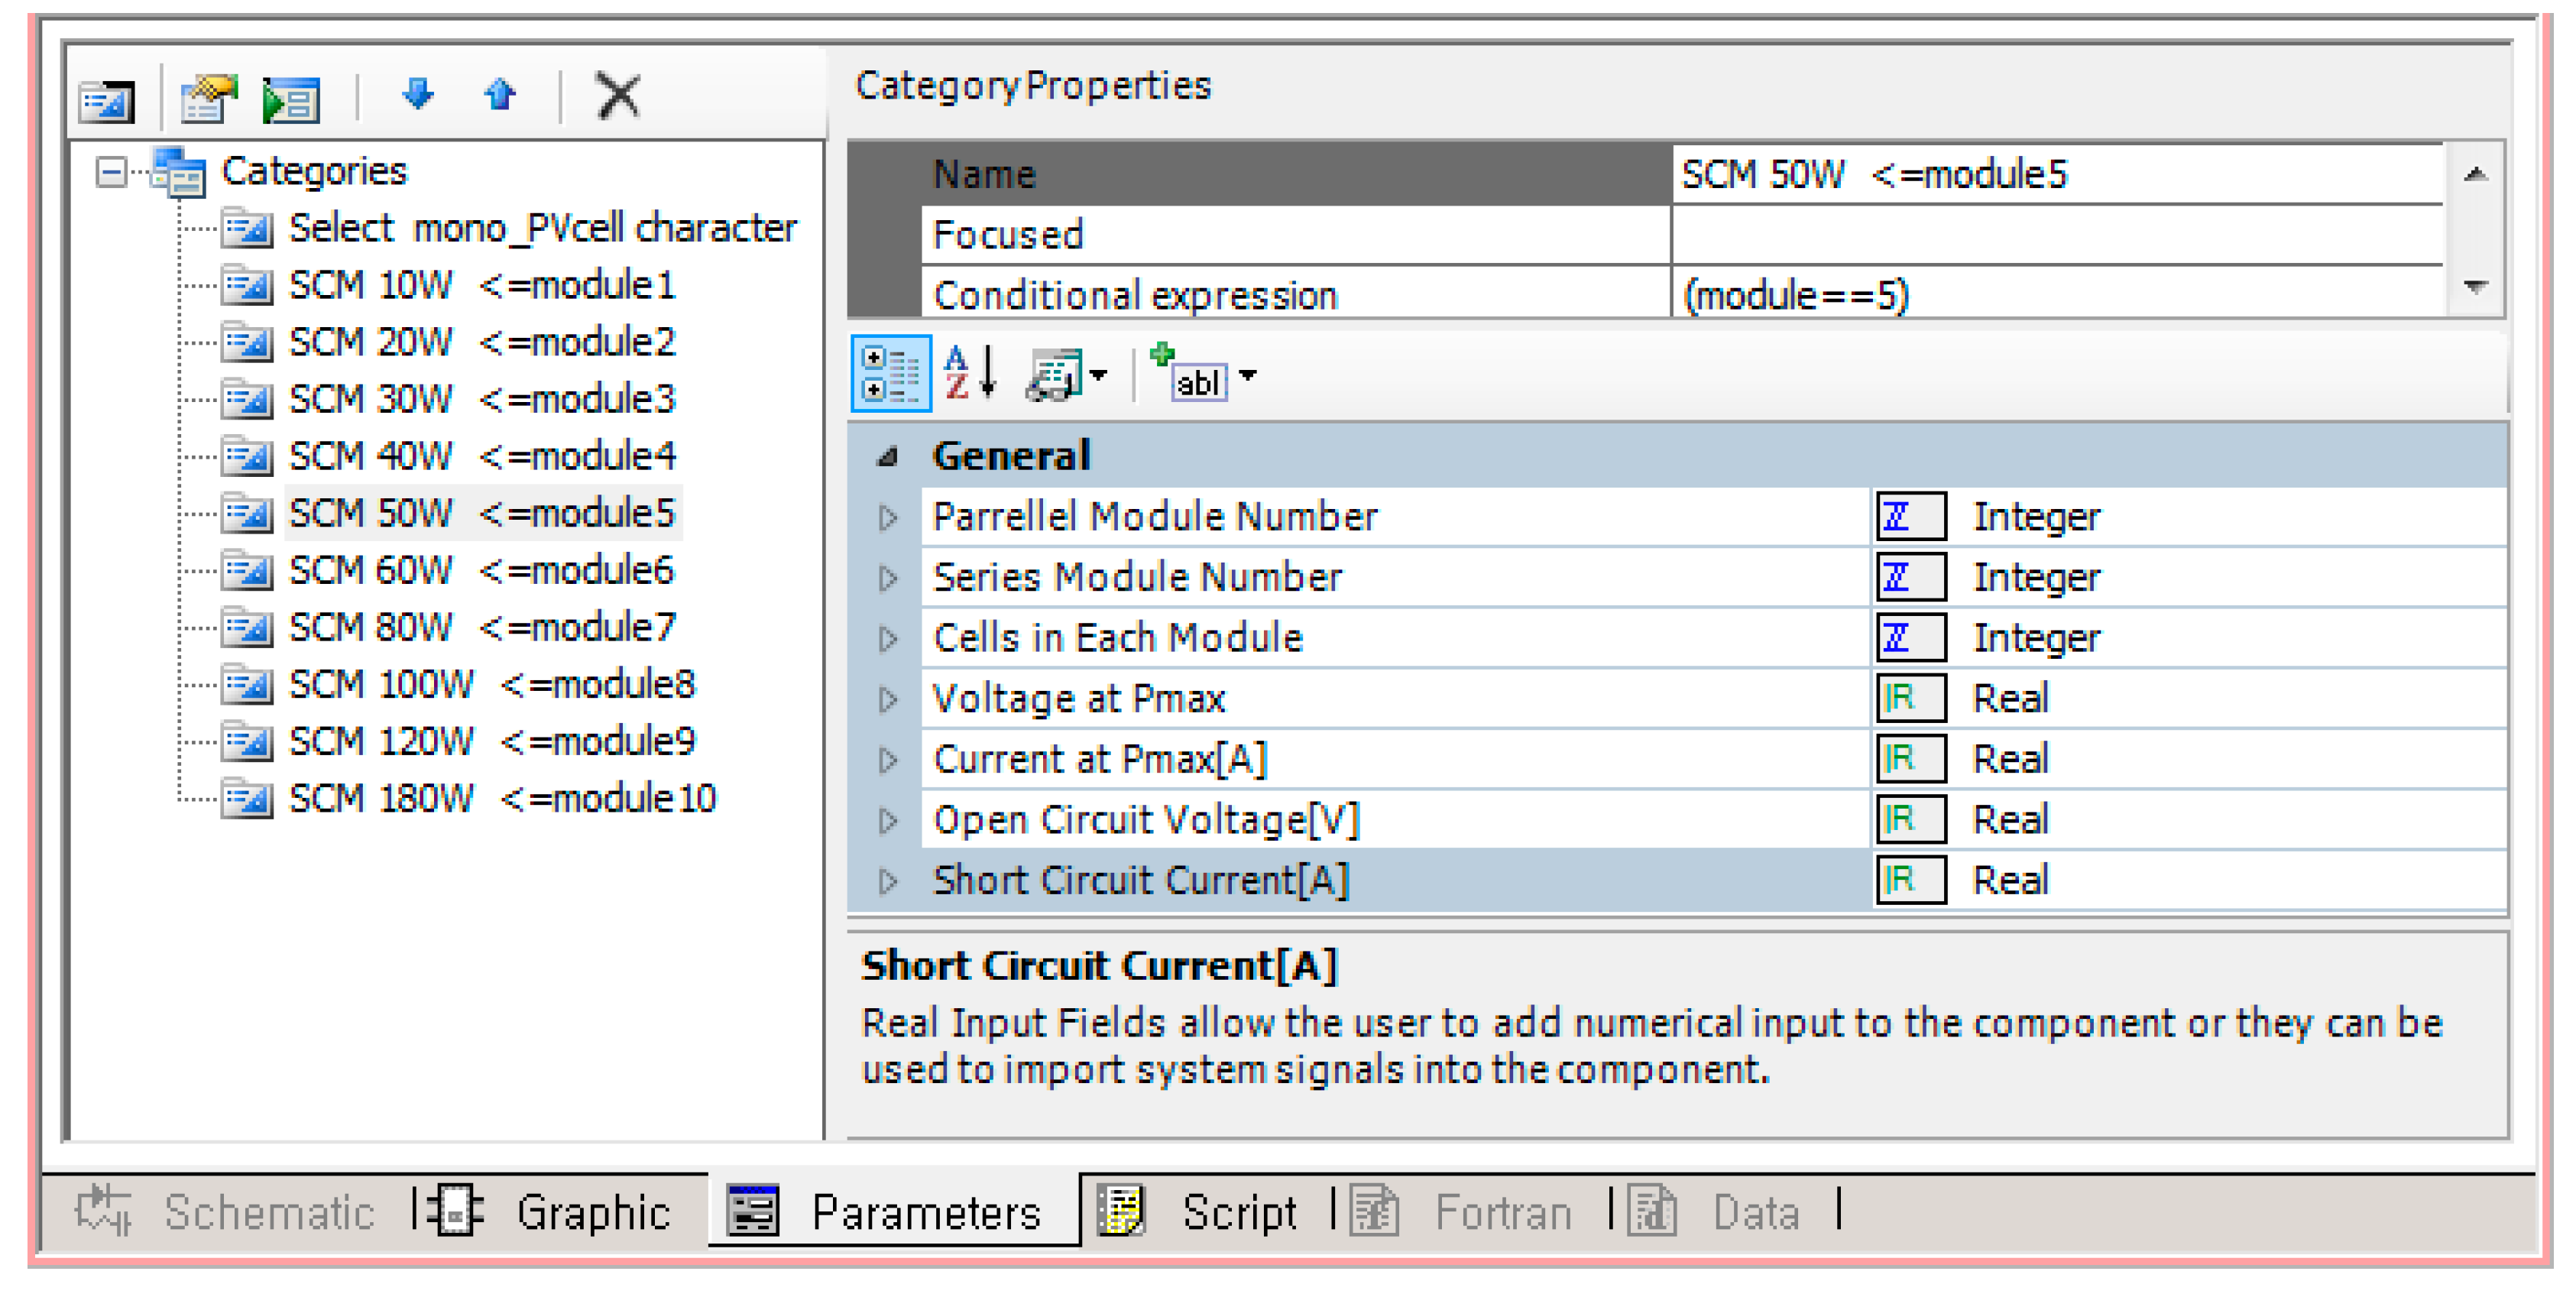
Figure 3 shows the creation of an input window where the user can enter the characteristics of the PV array model. The user can enter the required parameters in the input parameter window as shown in Figure 3.
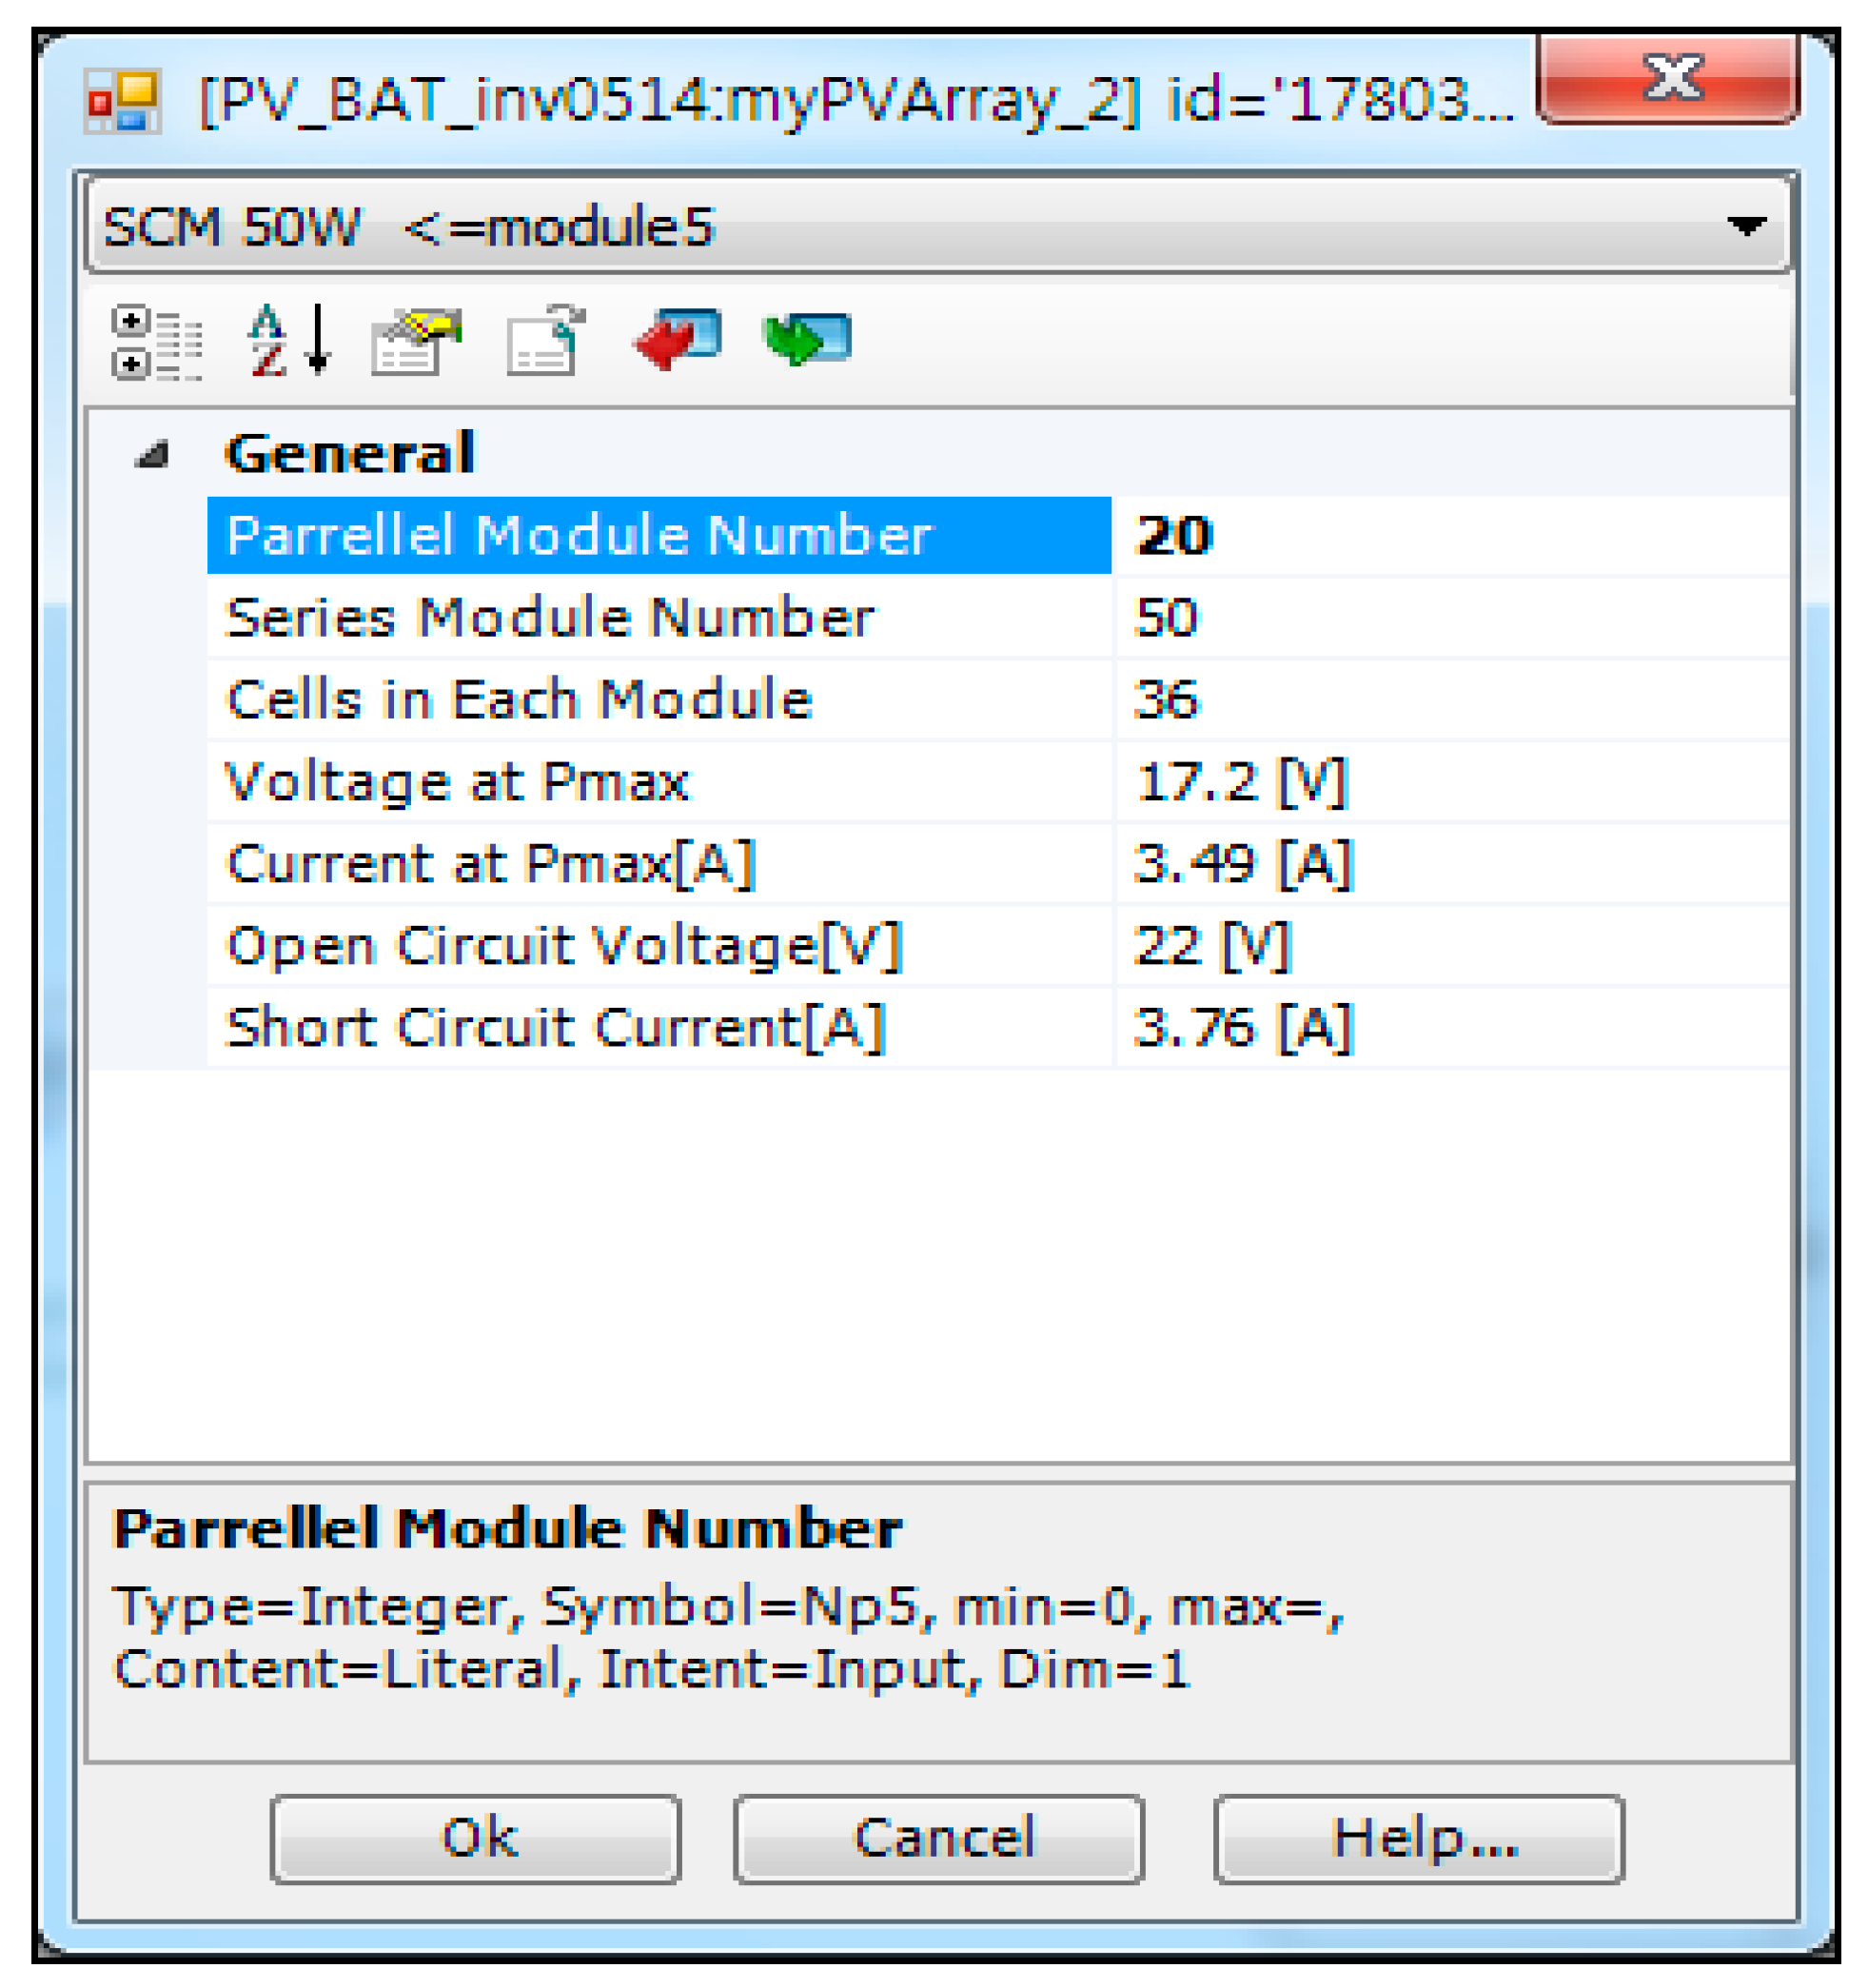
The key essential parameters used for PV array are shown in Figure 4 along with the data used in this paper.
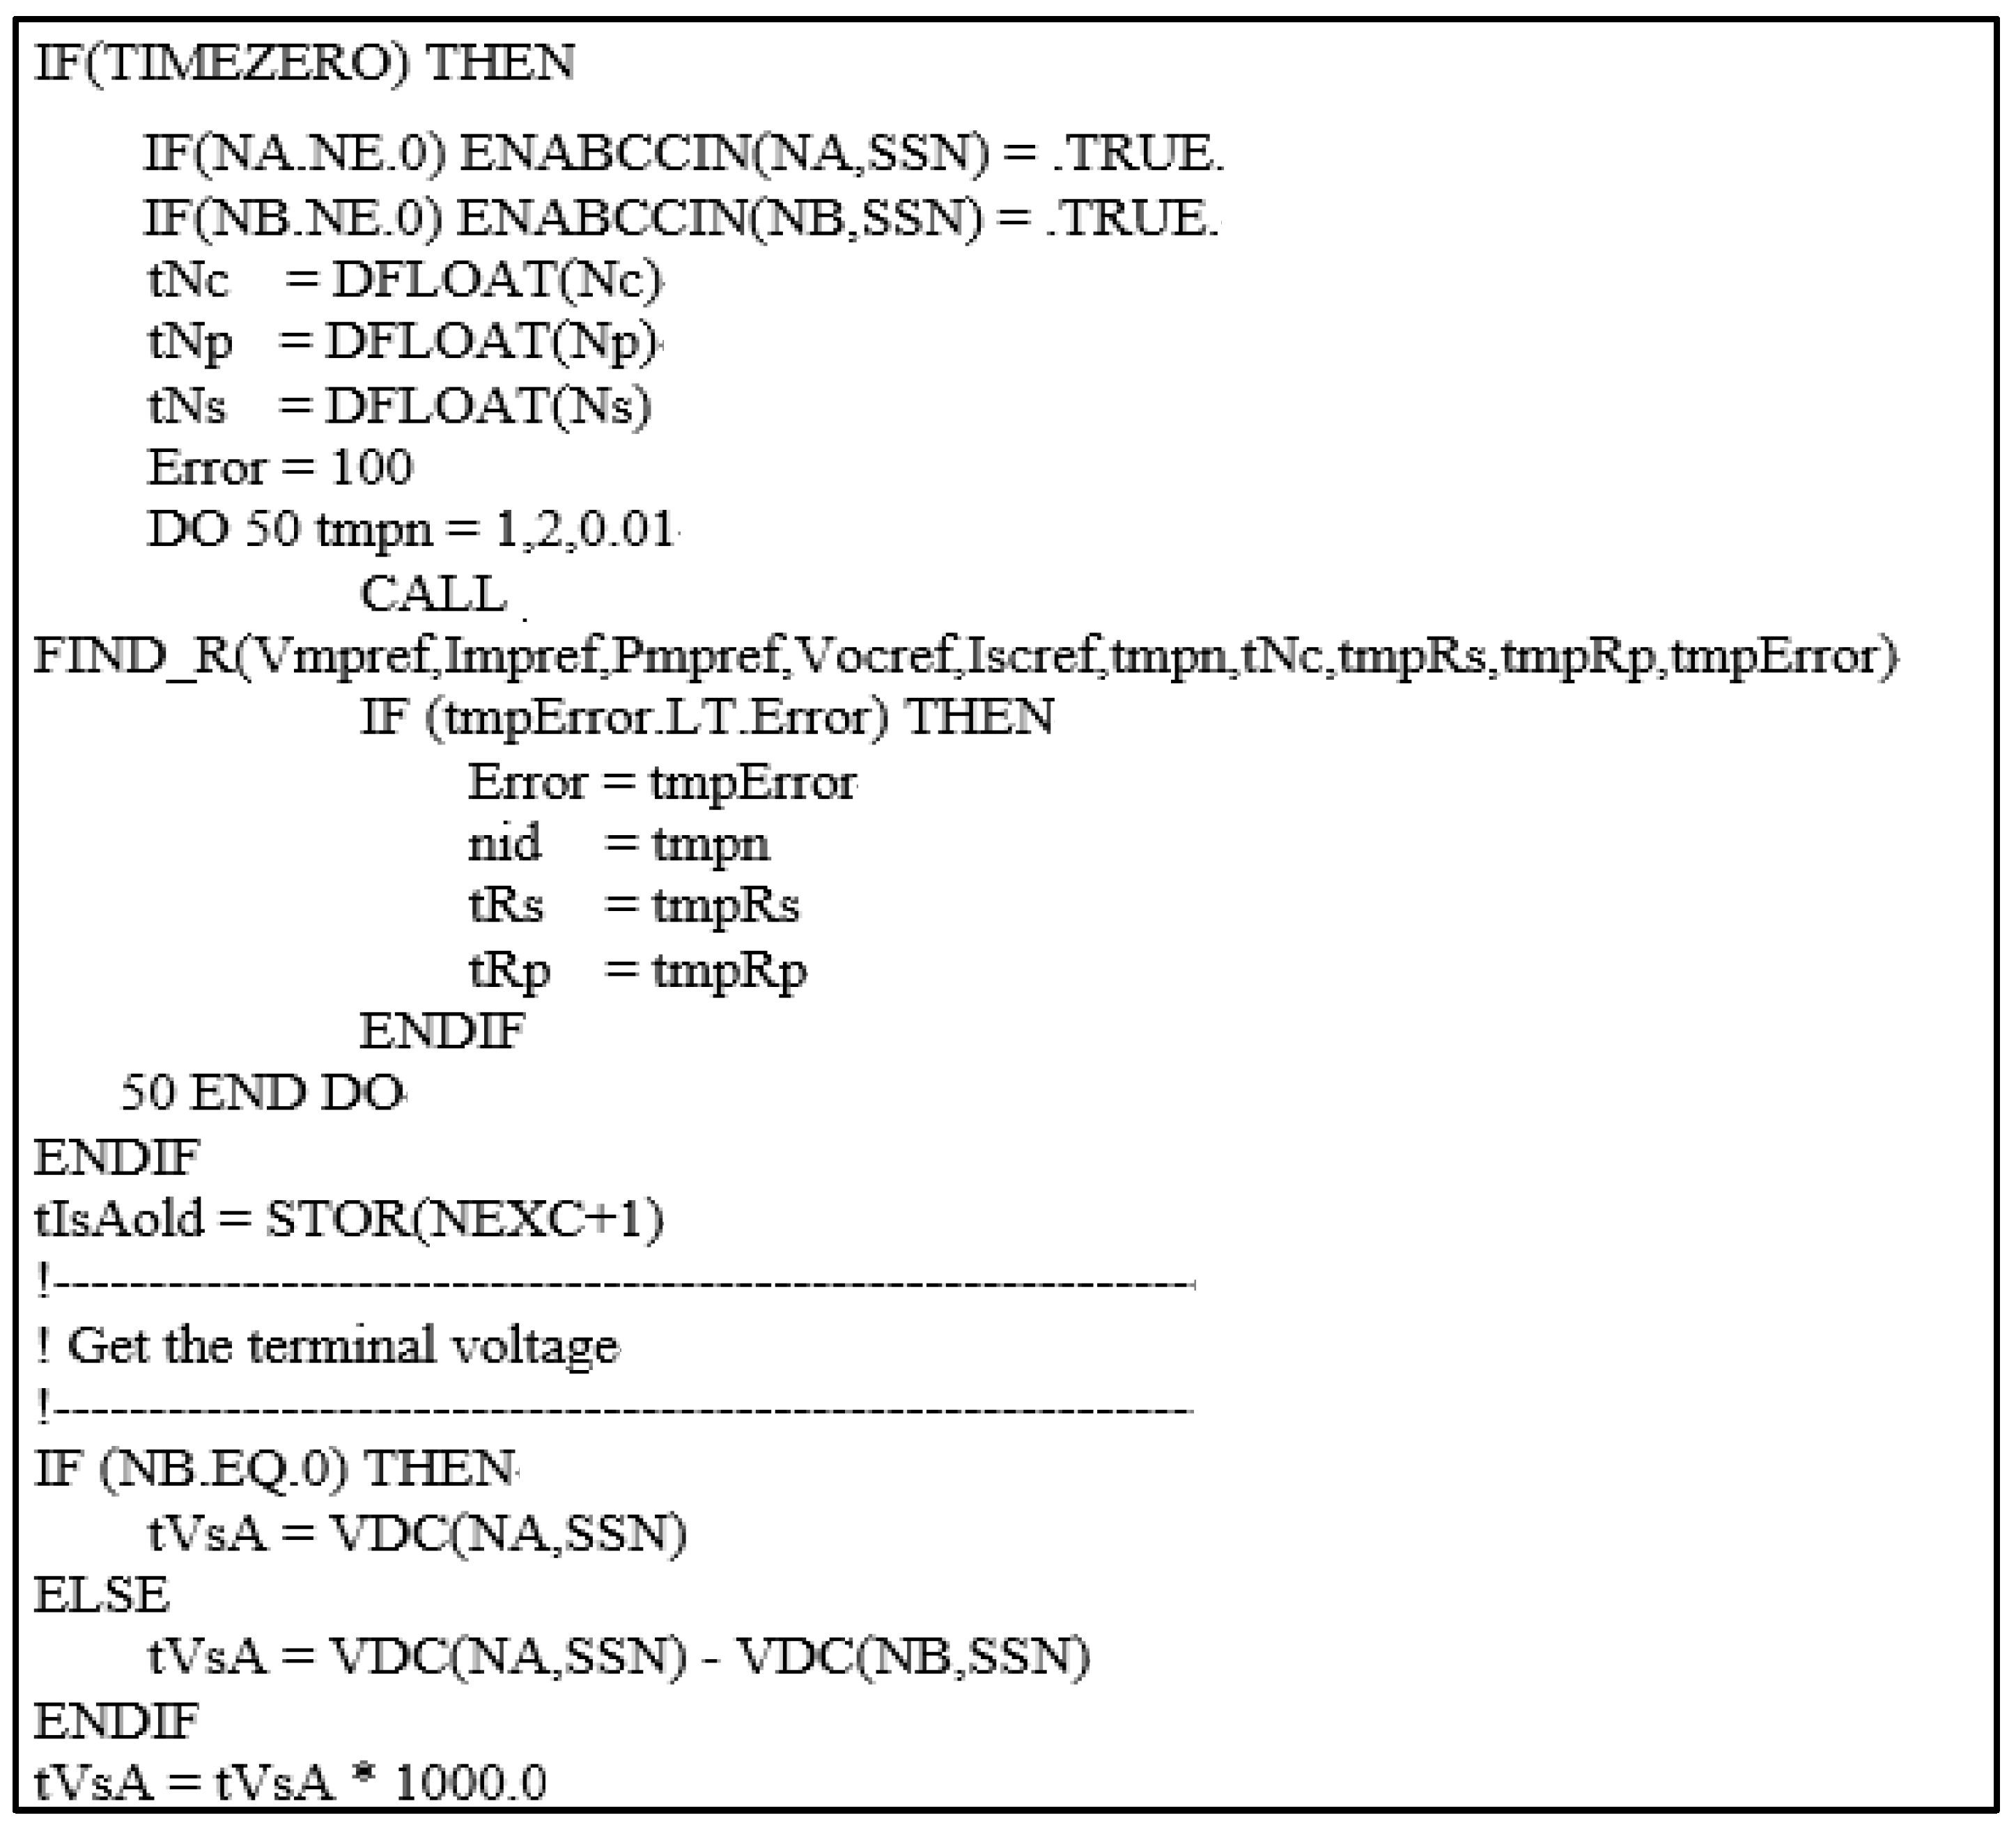
The main function is represented using the Fortran language in UDM with reference to PSCAD, as shown in Figure 5 and Figure 6. Figure 5 shows the Fortran code employed to determine the terminal voltage of the PV array using the ‘VDC’, an internal function of PSCAD.
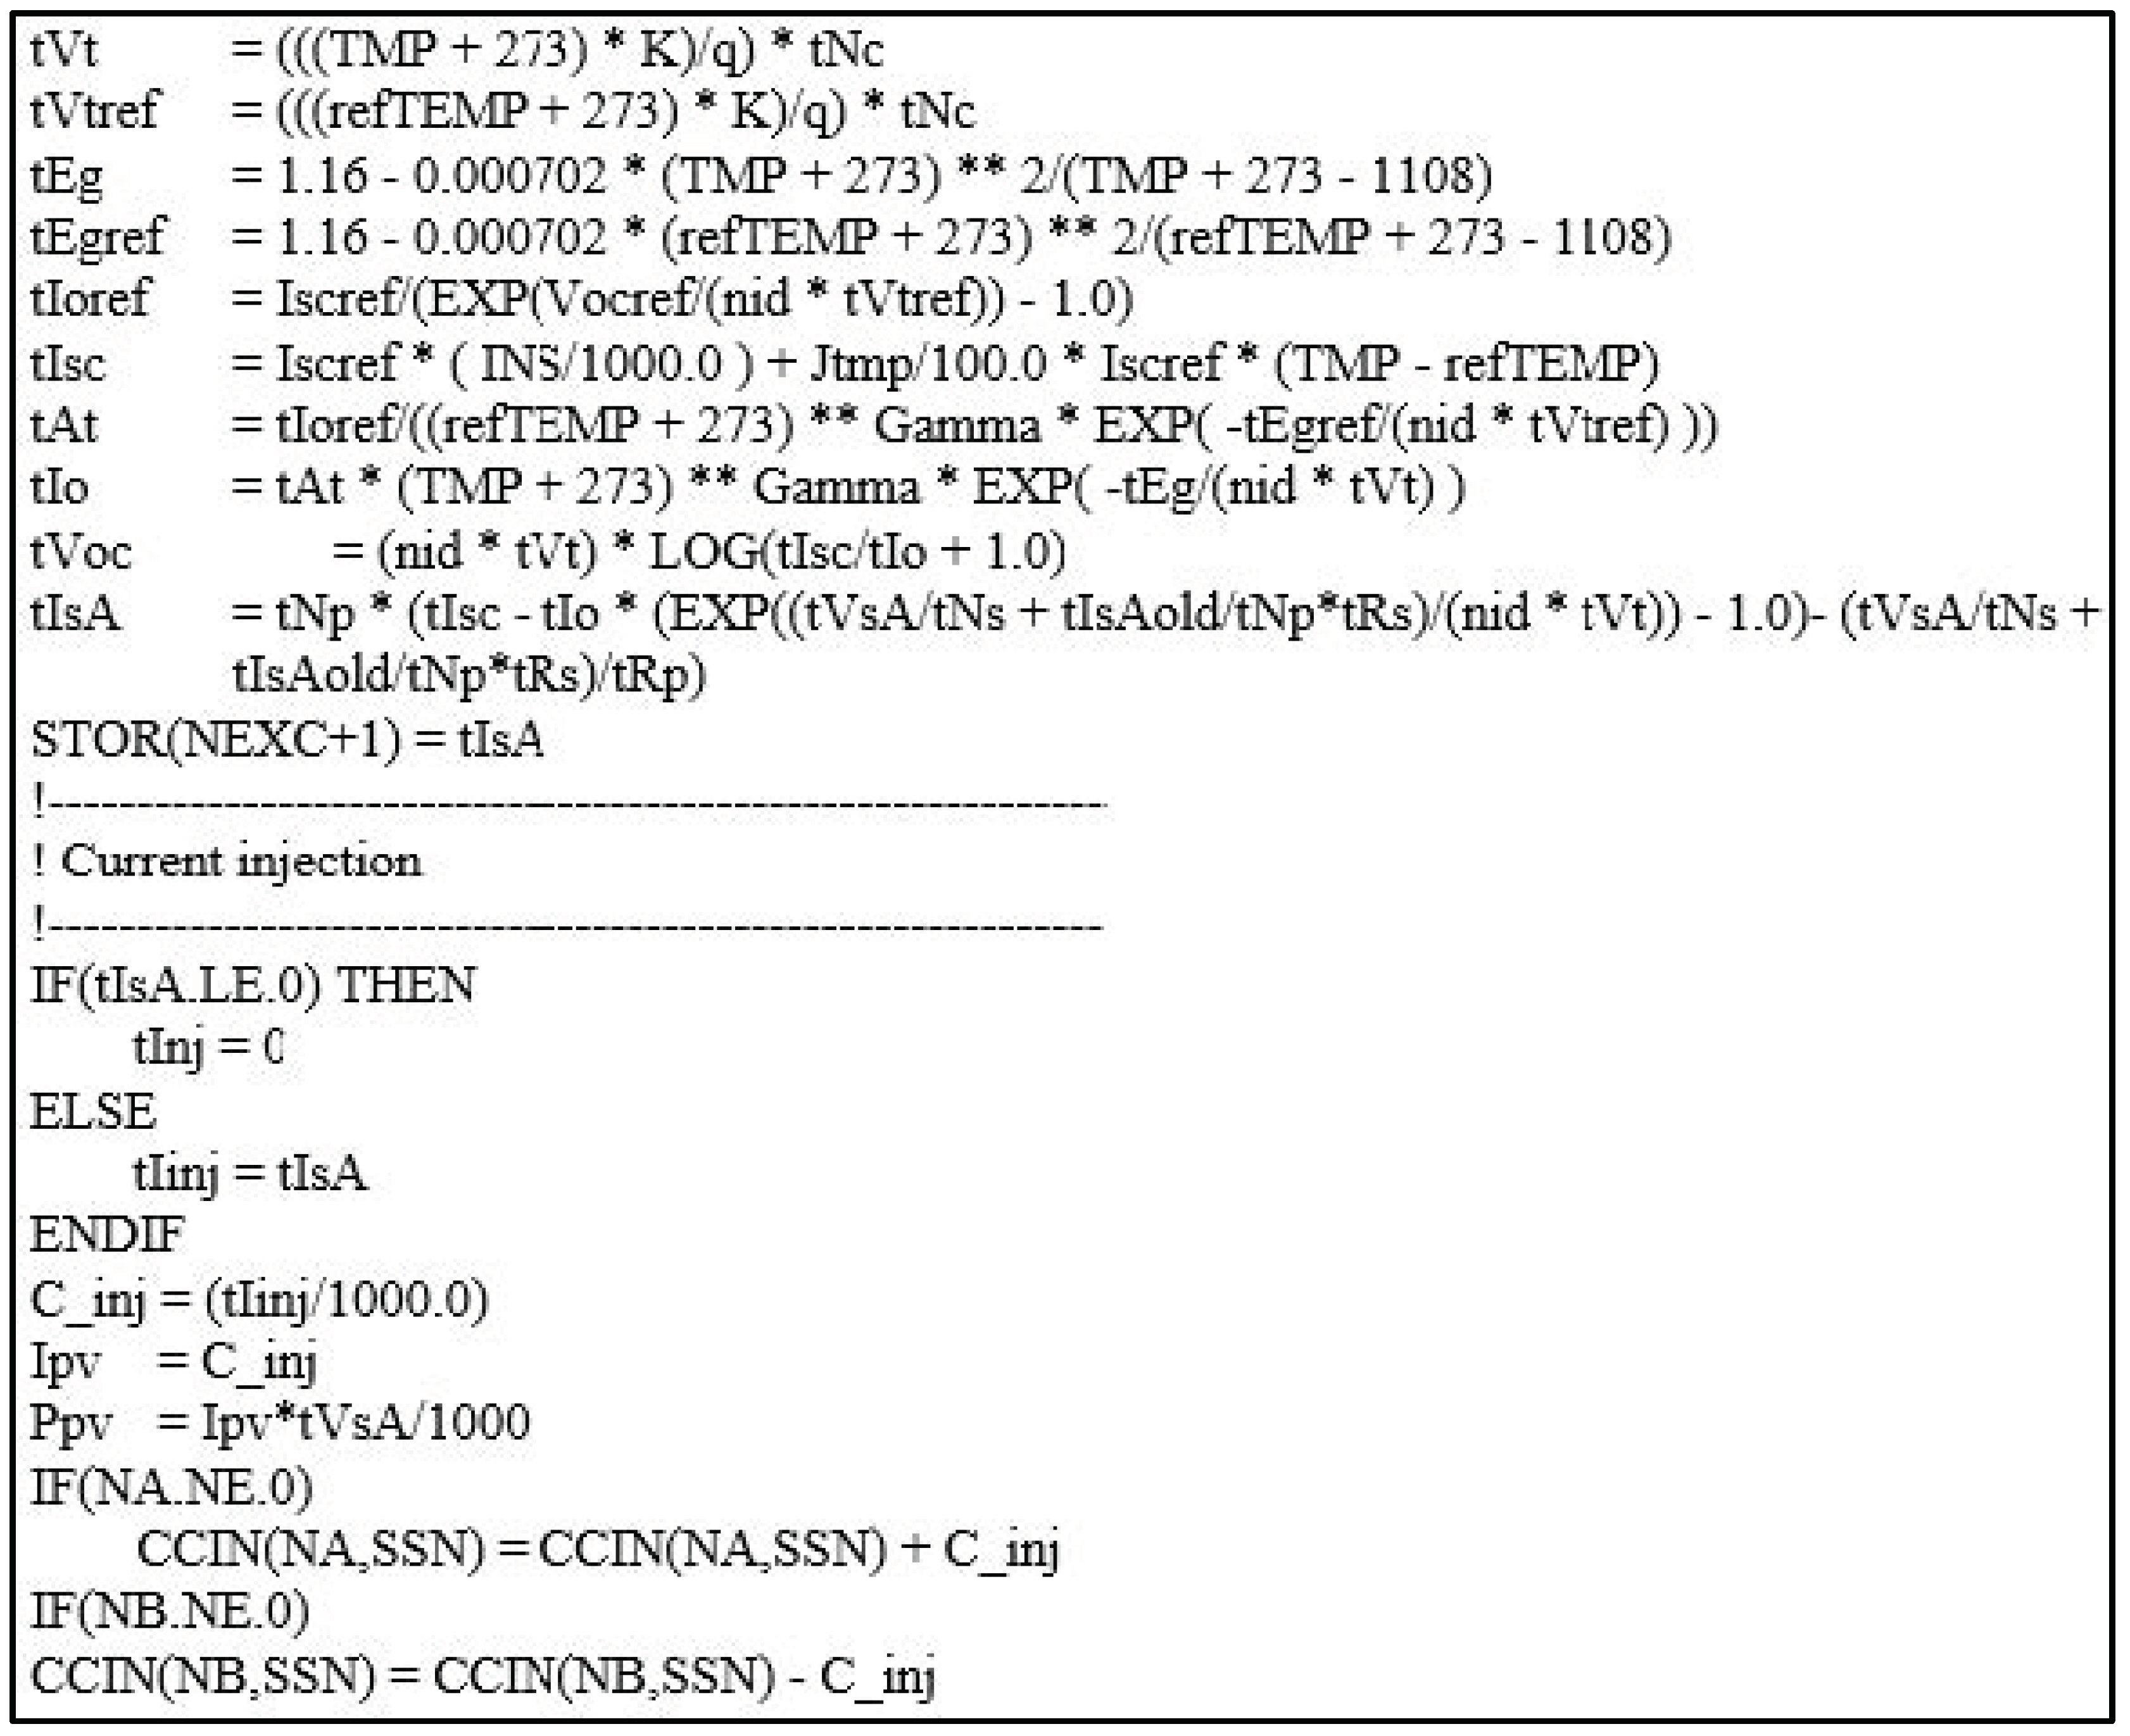
As shown in Figure 6, the magnitude of the output current is determined by using the characteristic variable and constant variable of the PV array model. In this part, the model of the PV module can be determined by reflecting the characteristics of PV module. If the user wants to change the characteristics of the PV module, the user can modify this part to reflect the desired characteristics of the PV module. In addition, Figure 6 shows the Fortran code employed to determine the terminal current of the PV array using the ‘CCIN’, an internal function of PSCAD.
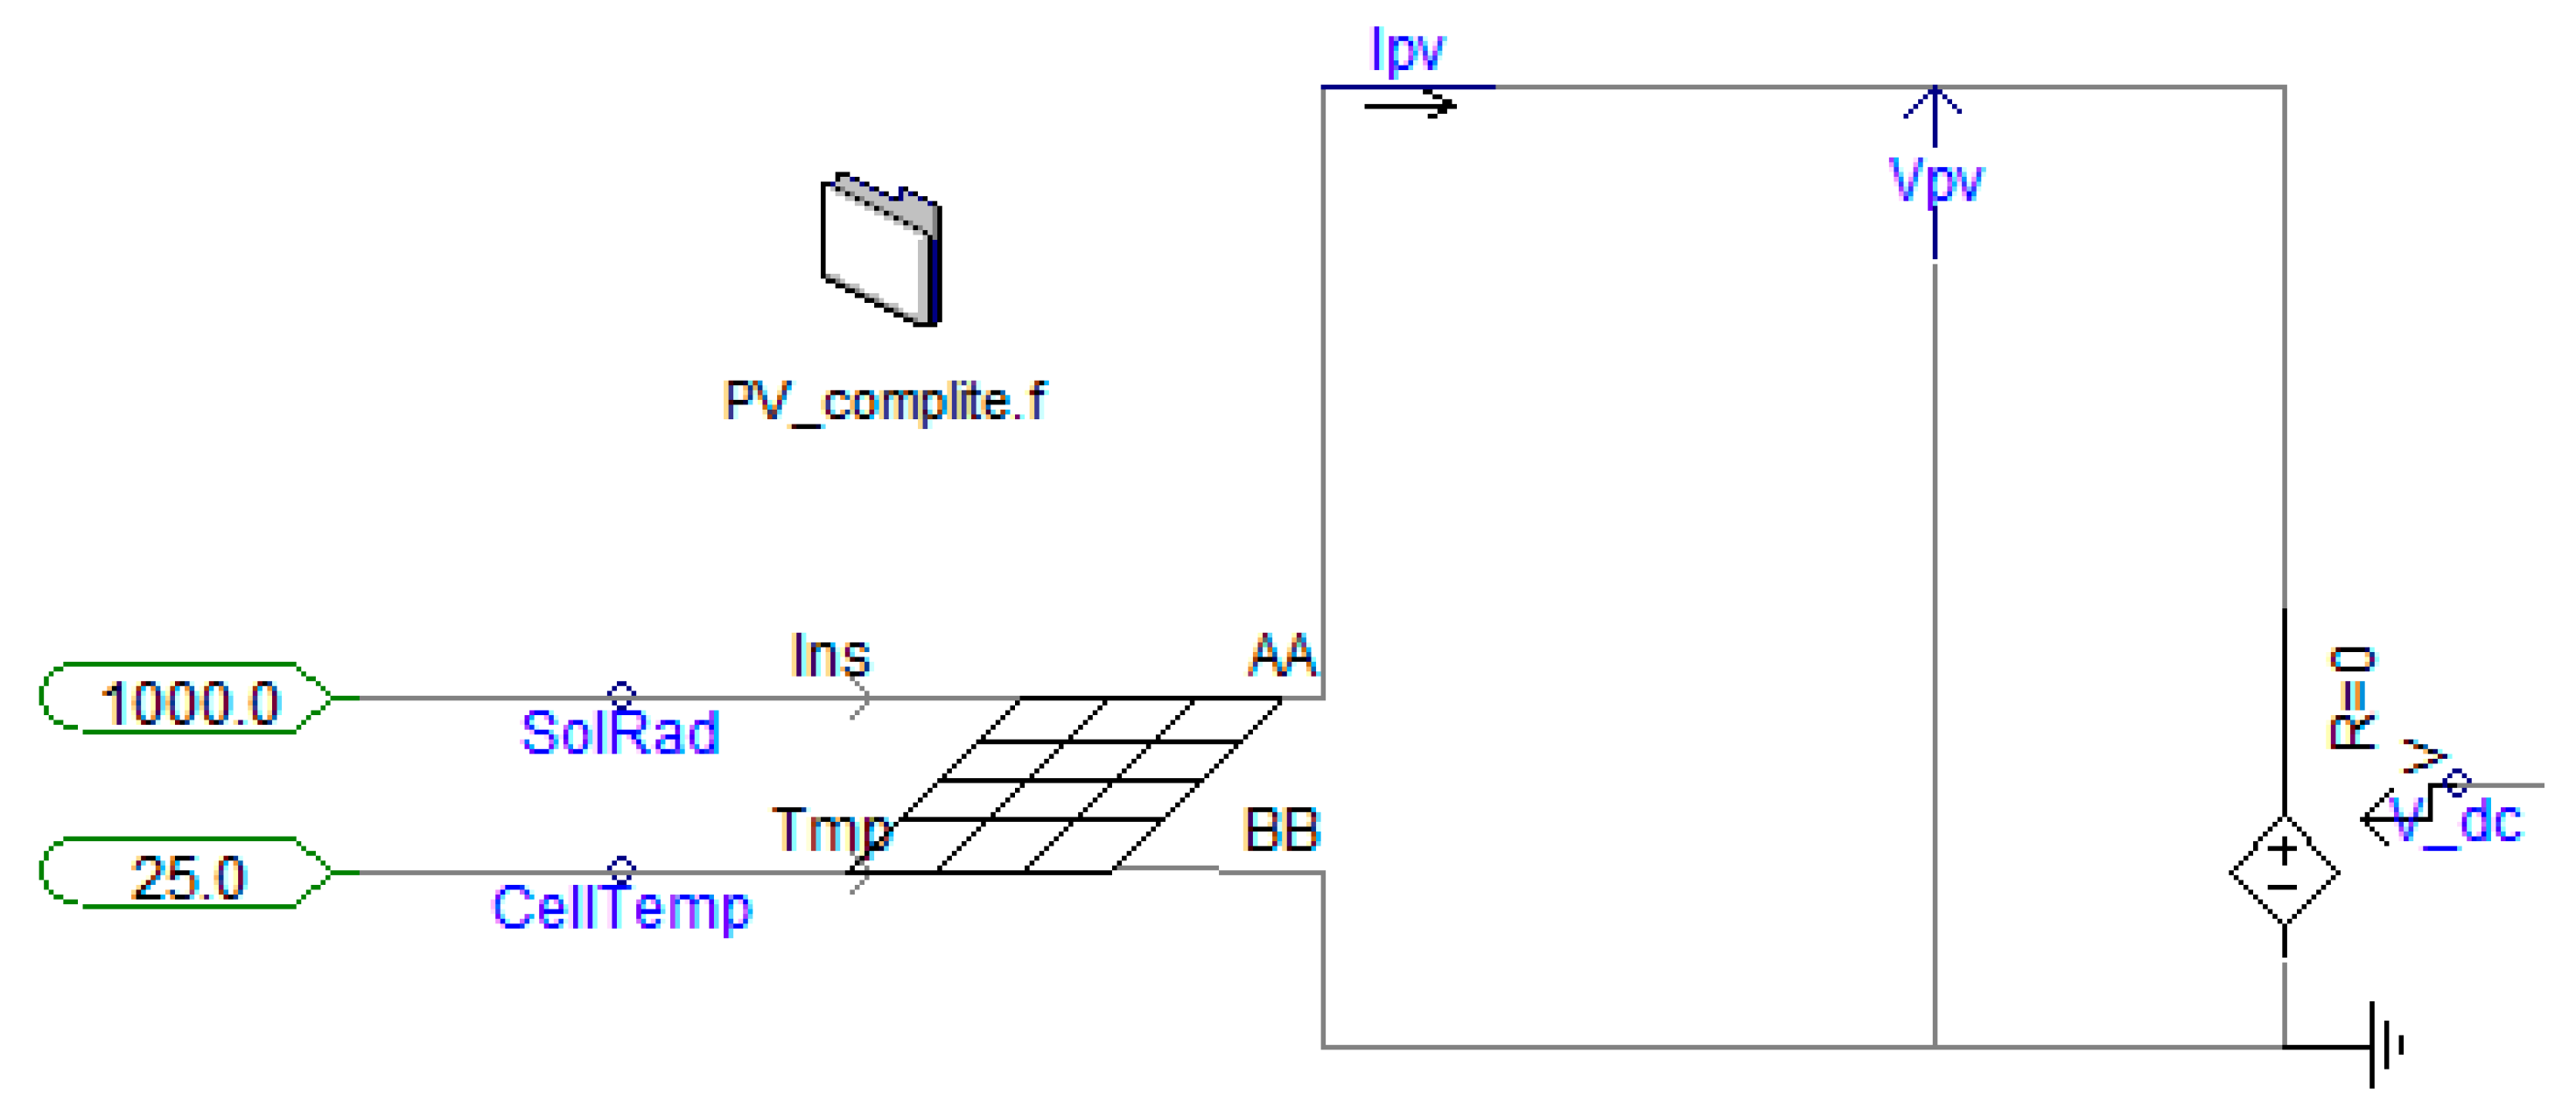
Figure 7 is designed as a test circuit to verify the performance of the PV array model.
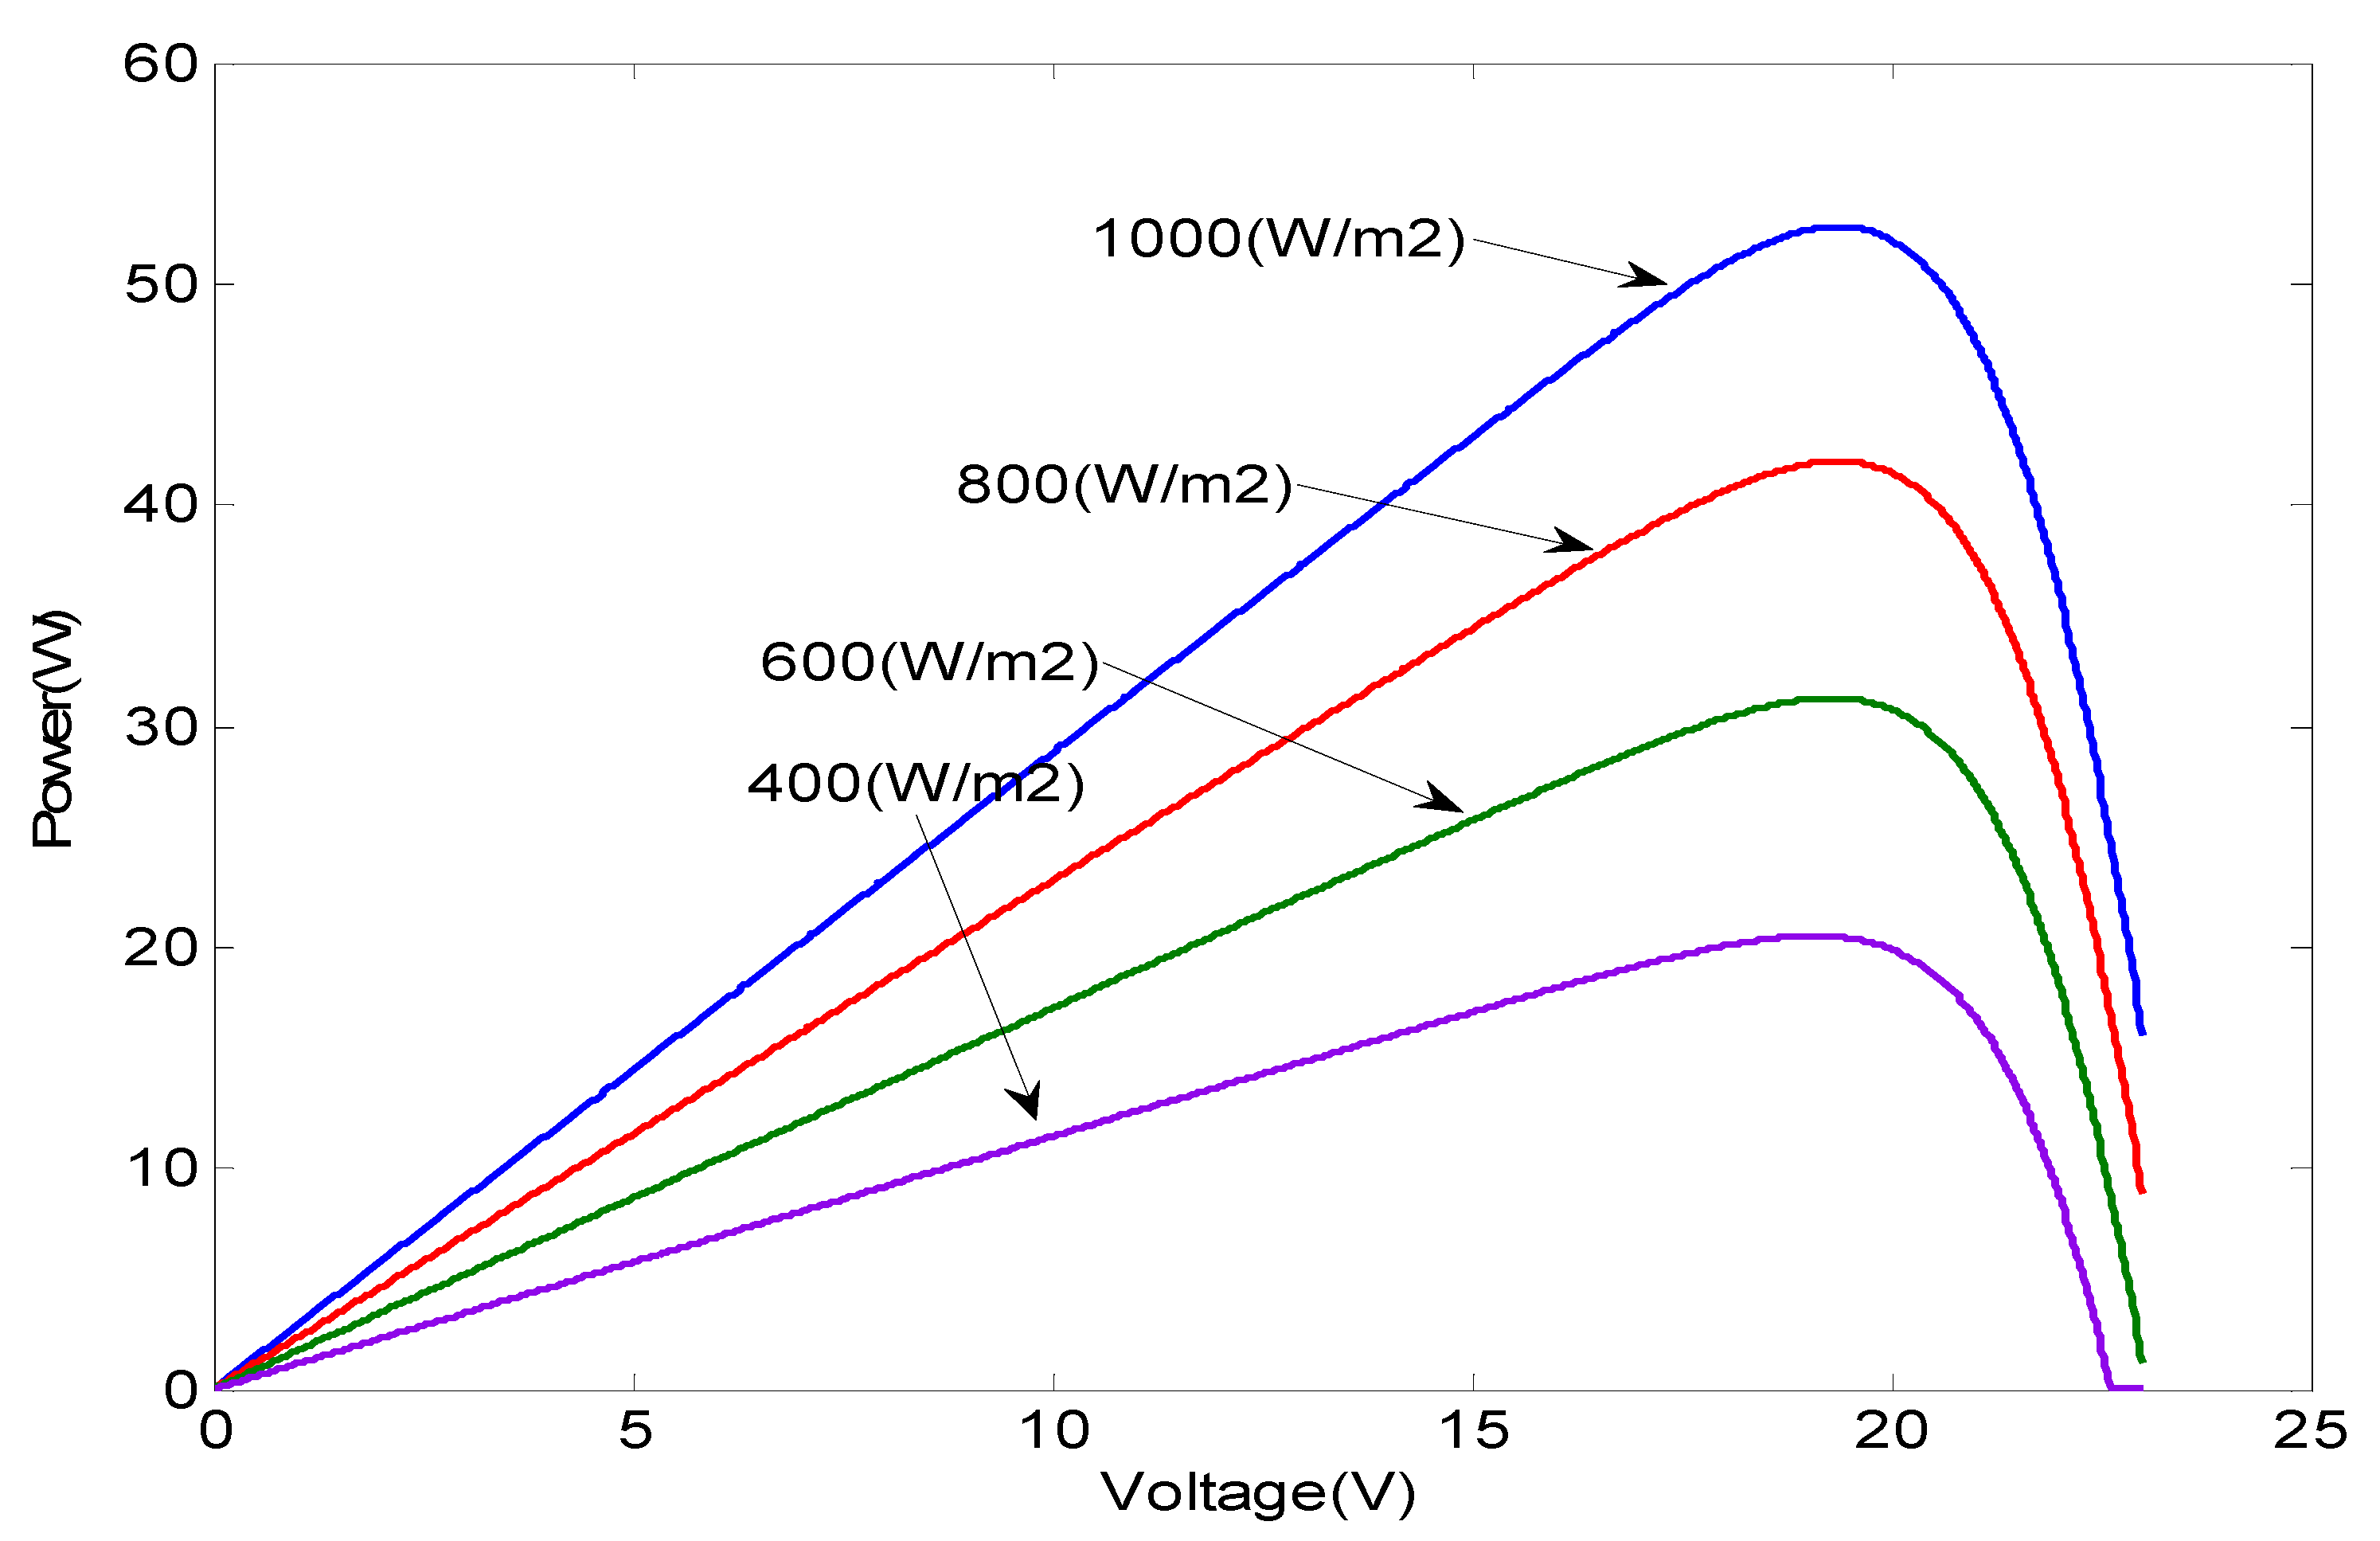
Figure 8 shows the output characteristics of the PV array as a function of insolation from the test circuit. The simulation results are found to be identical to the actual output characteristics of the PV array output.
2.2. Battery Modeling
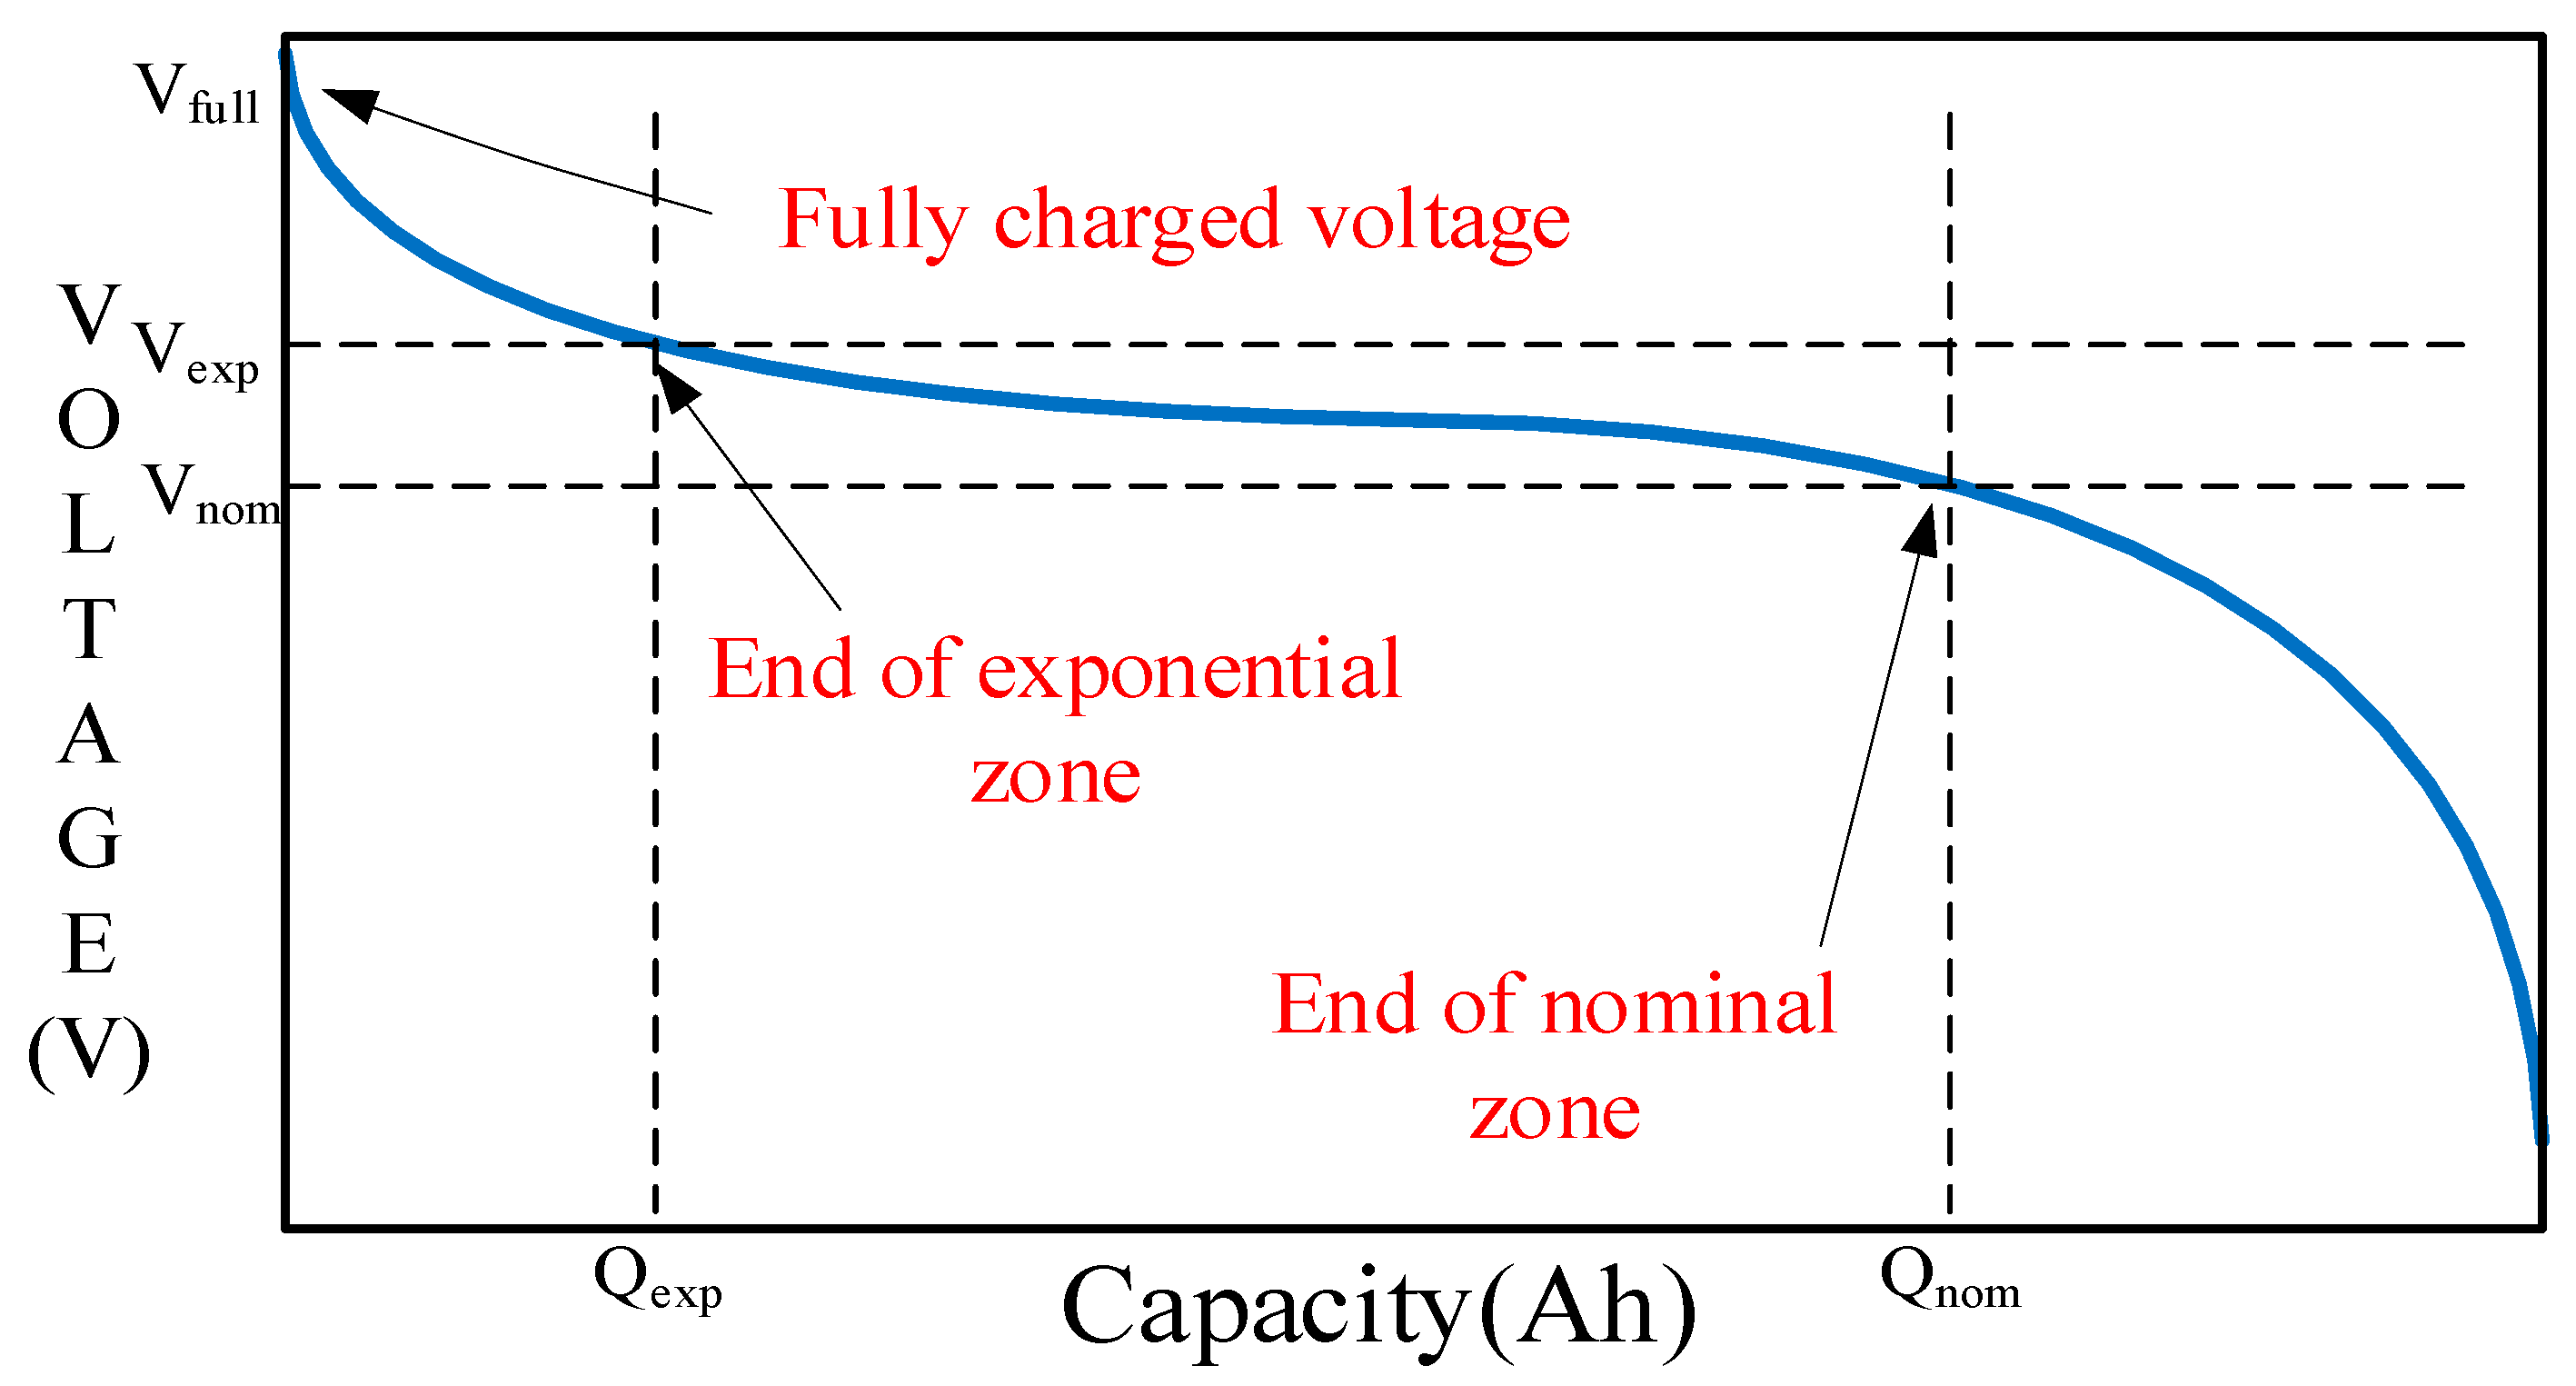
Figure 9 shows the typical discharge characteristics of a nickel–metal hydride (Ni-MH) battery cell.
The conventional discharge model is similar to the Shepherd model, but it can accurately represent the voltage dynamics when the current variation and the open-circuit voltage (OCV) are considered as functions of the state of charge (SOC) [13]. To better represent OCV behavior, terms related to polarization voltage are added. In addition, the term related to polarization resistance has been slightly modified. The obtained battery voltage is given by [27]:
where,
: Battery constant voltage (V)
: Polarization constant (V/Ah) or polarization resistance (: Battery capacity (Ah)
: Actual battery charge (Ah)
: Internal resistance ()
: Battery current (A)
: Filtered current (A)
: Exponential zone voltage (V)
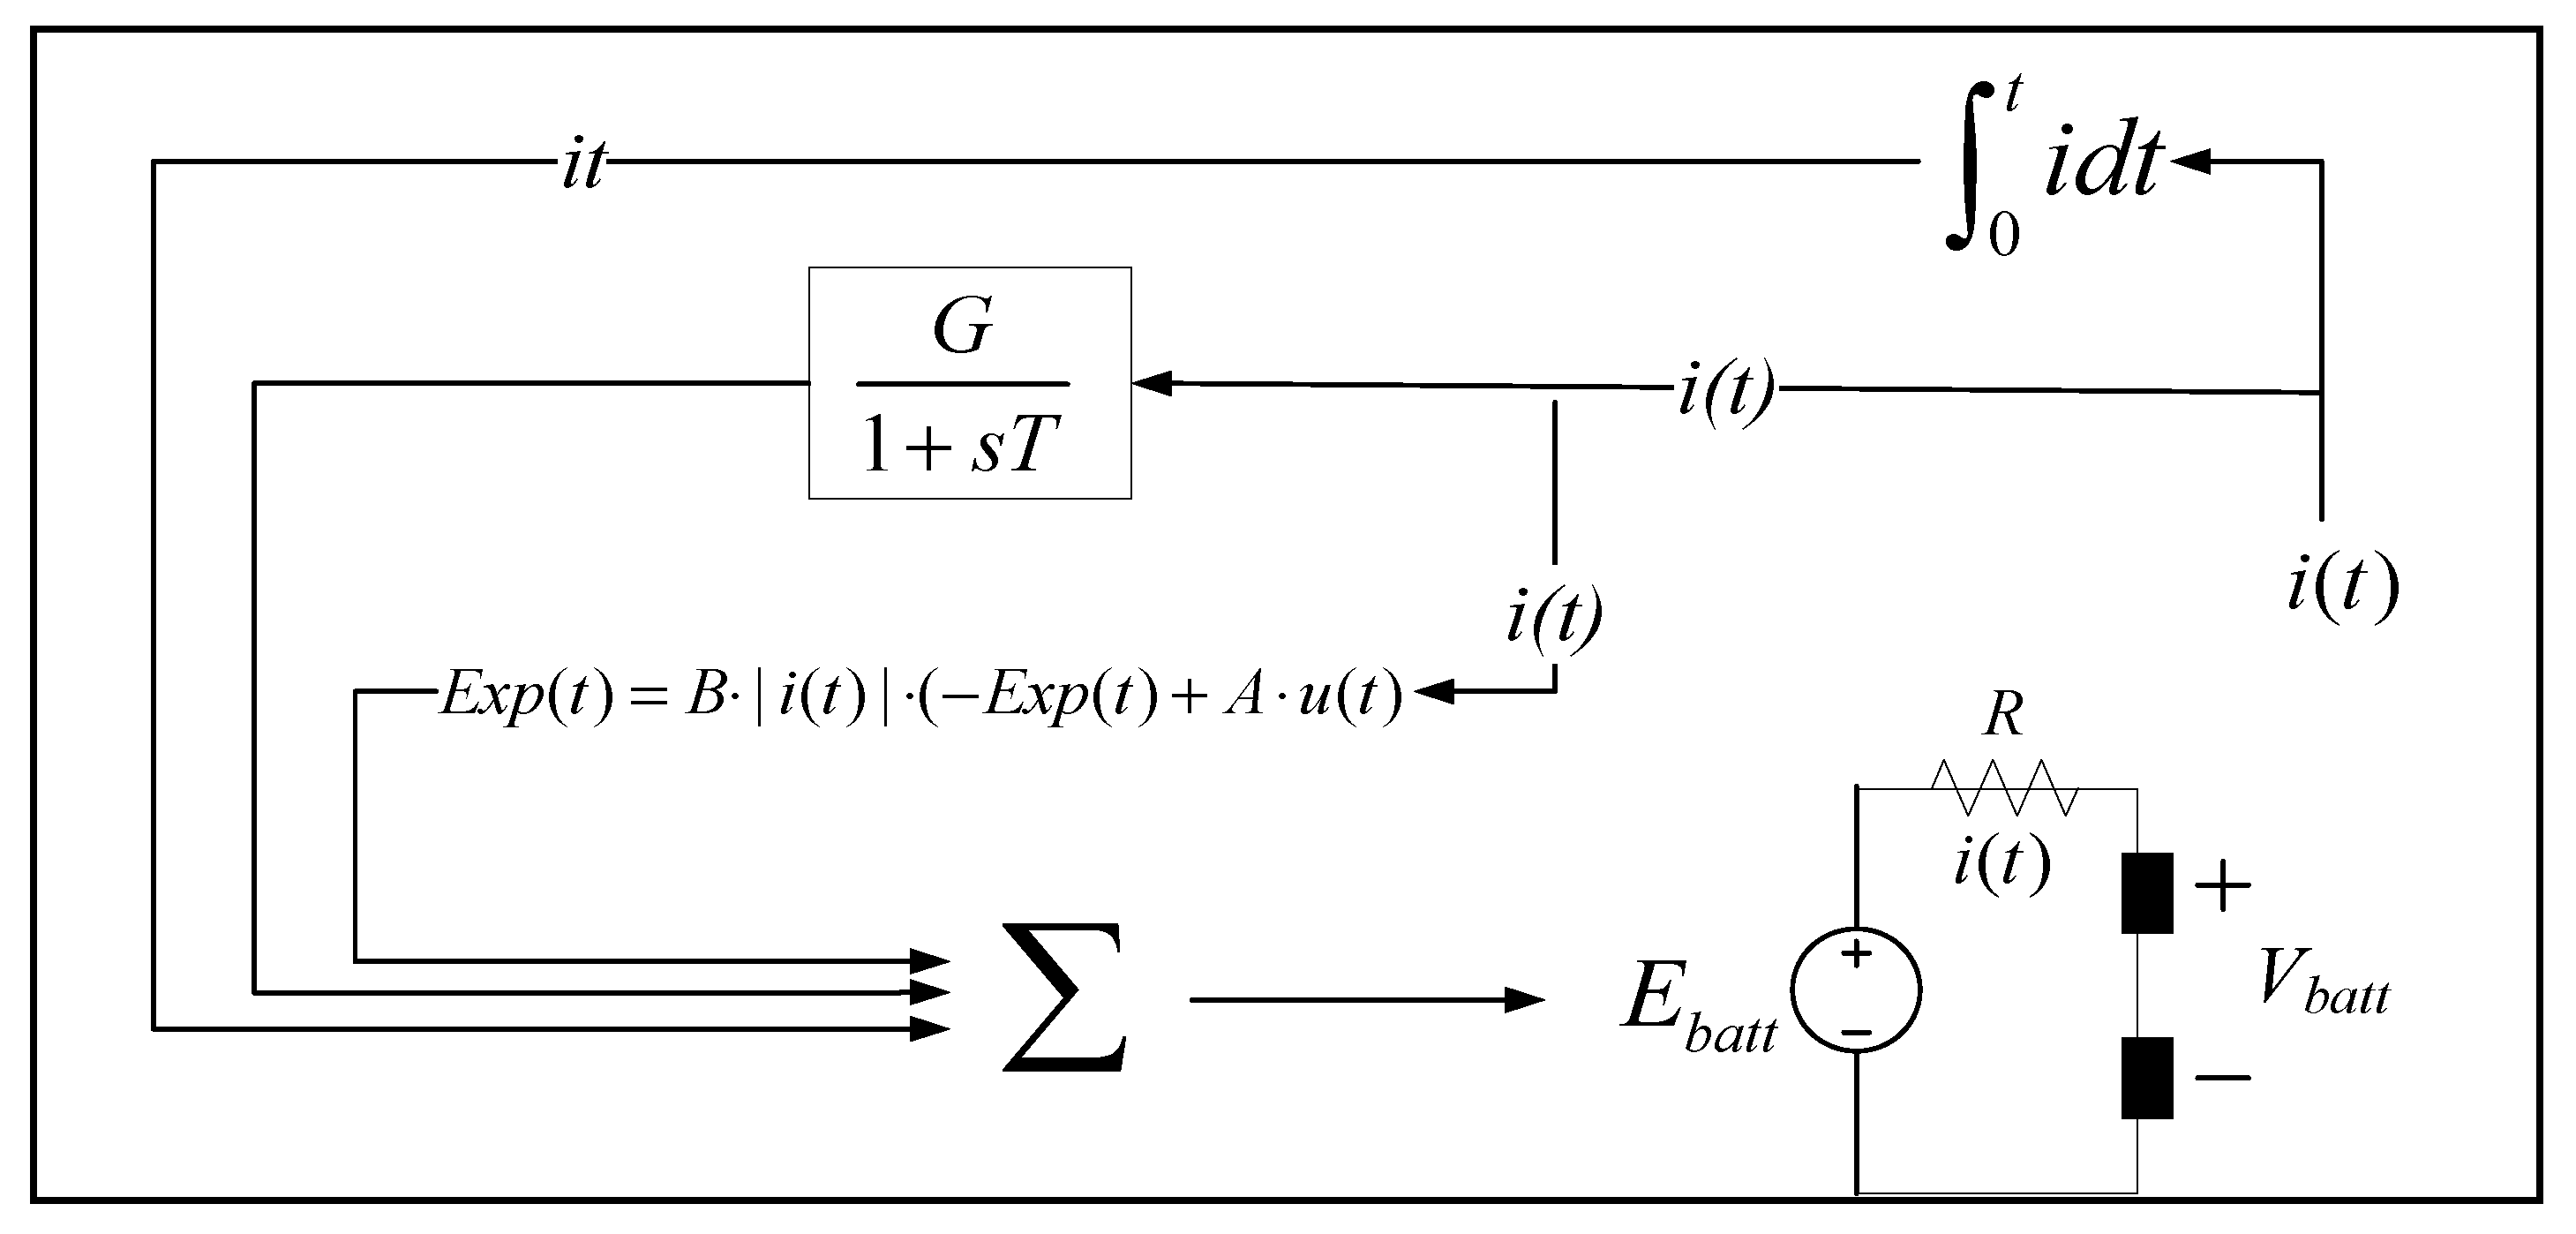
The exponential area of Equation (3) is valid for Ni-MH batteries. Hysteresis occurs between charging and discharging regardless of the SOC of the battery: this only occurs in the exponential domain. This phenomenon can be represented by a nonlinear dynamic system [27]:
where,
B: Exponential zone time constant inverse (Ah−1)
: Battery current (A)
: Exponential zone amplitude (V)
: Charge and discharge mode
The exponential voltage depends on the charge or discharge mode. A complete discharge model system is shown in Figure 10.
The battery charge characteristics of the existing model are as follows. The charging behavior, particularly the end of charge (EOC) characteristics, differs and depends on the type of battery. The Ni-MH type has special action in EOC. When the battery reaches the full charge voltage, the voltage slowly decreases with the current amplitude. This is very important for modeling because the battery charger monitors the charge stop value. This behavior is expressed by modifying the charge polarization resistance. When the battery is fully charged (), the voltage begins to drop. At this point, the charger continues to overcharge the battery () and the voltage decreases. This phenomenon can be manifested by reducing the polarization resistance when the battery is overcharged using the absolute value of the charge ():
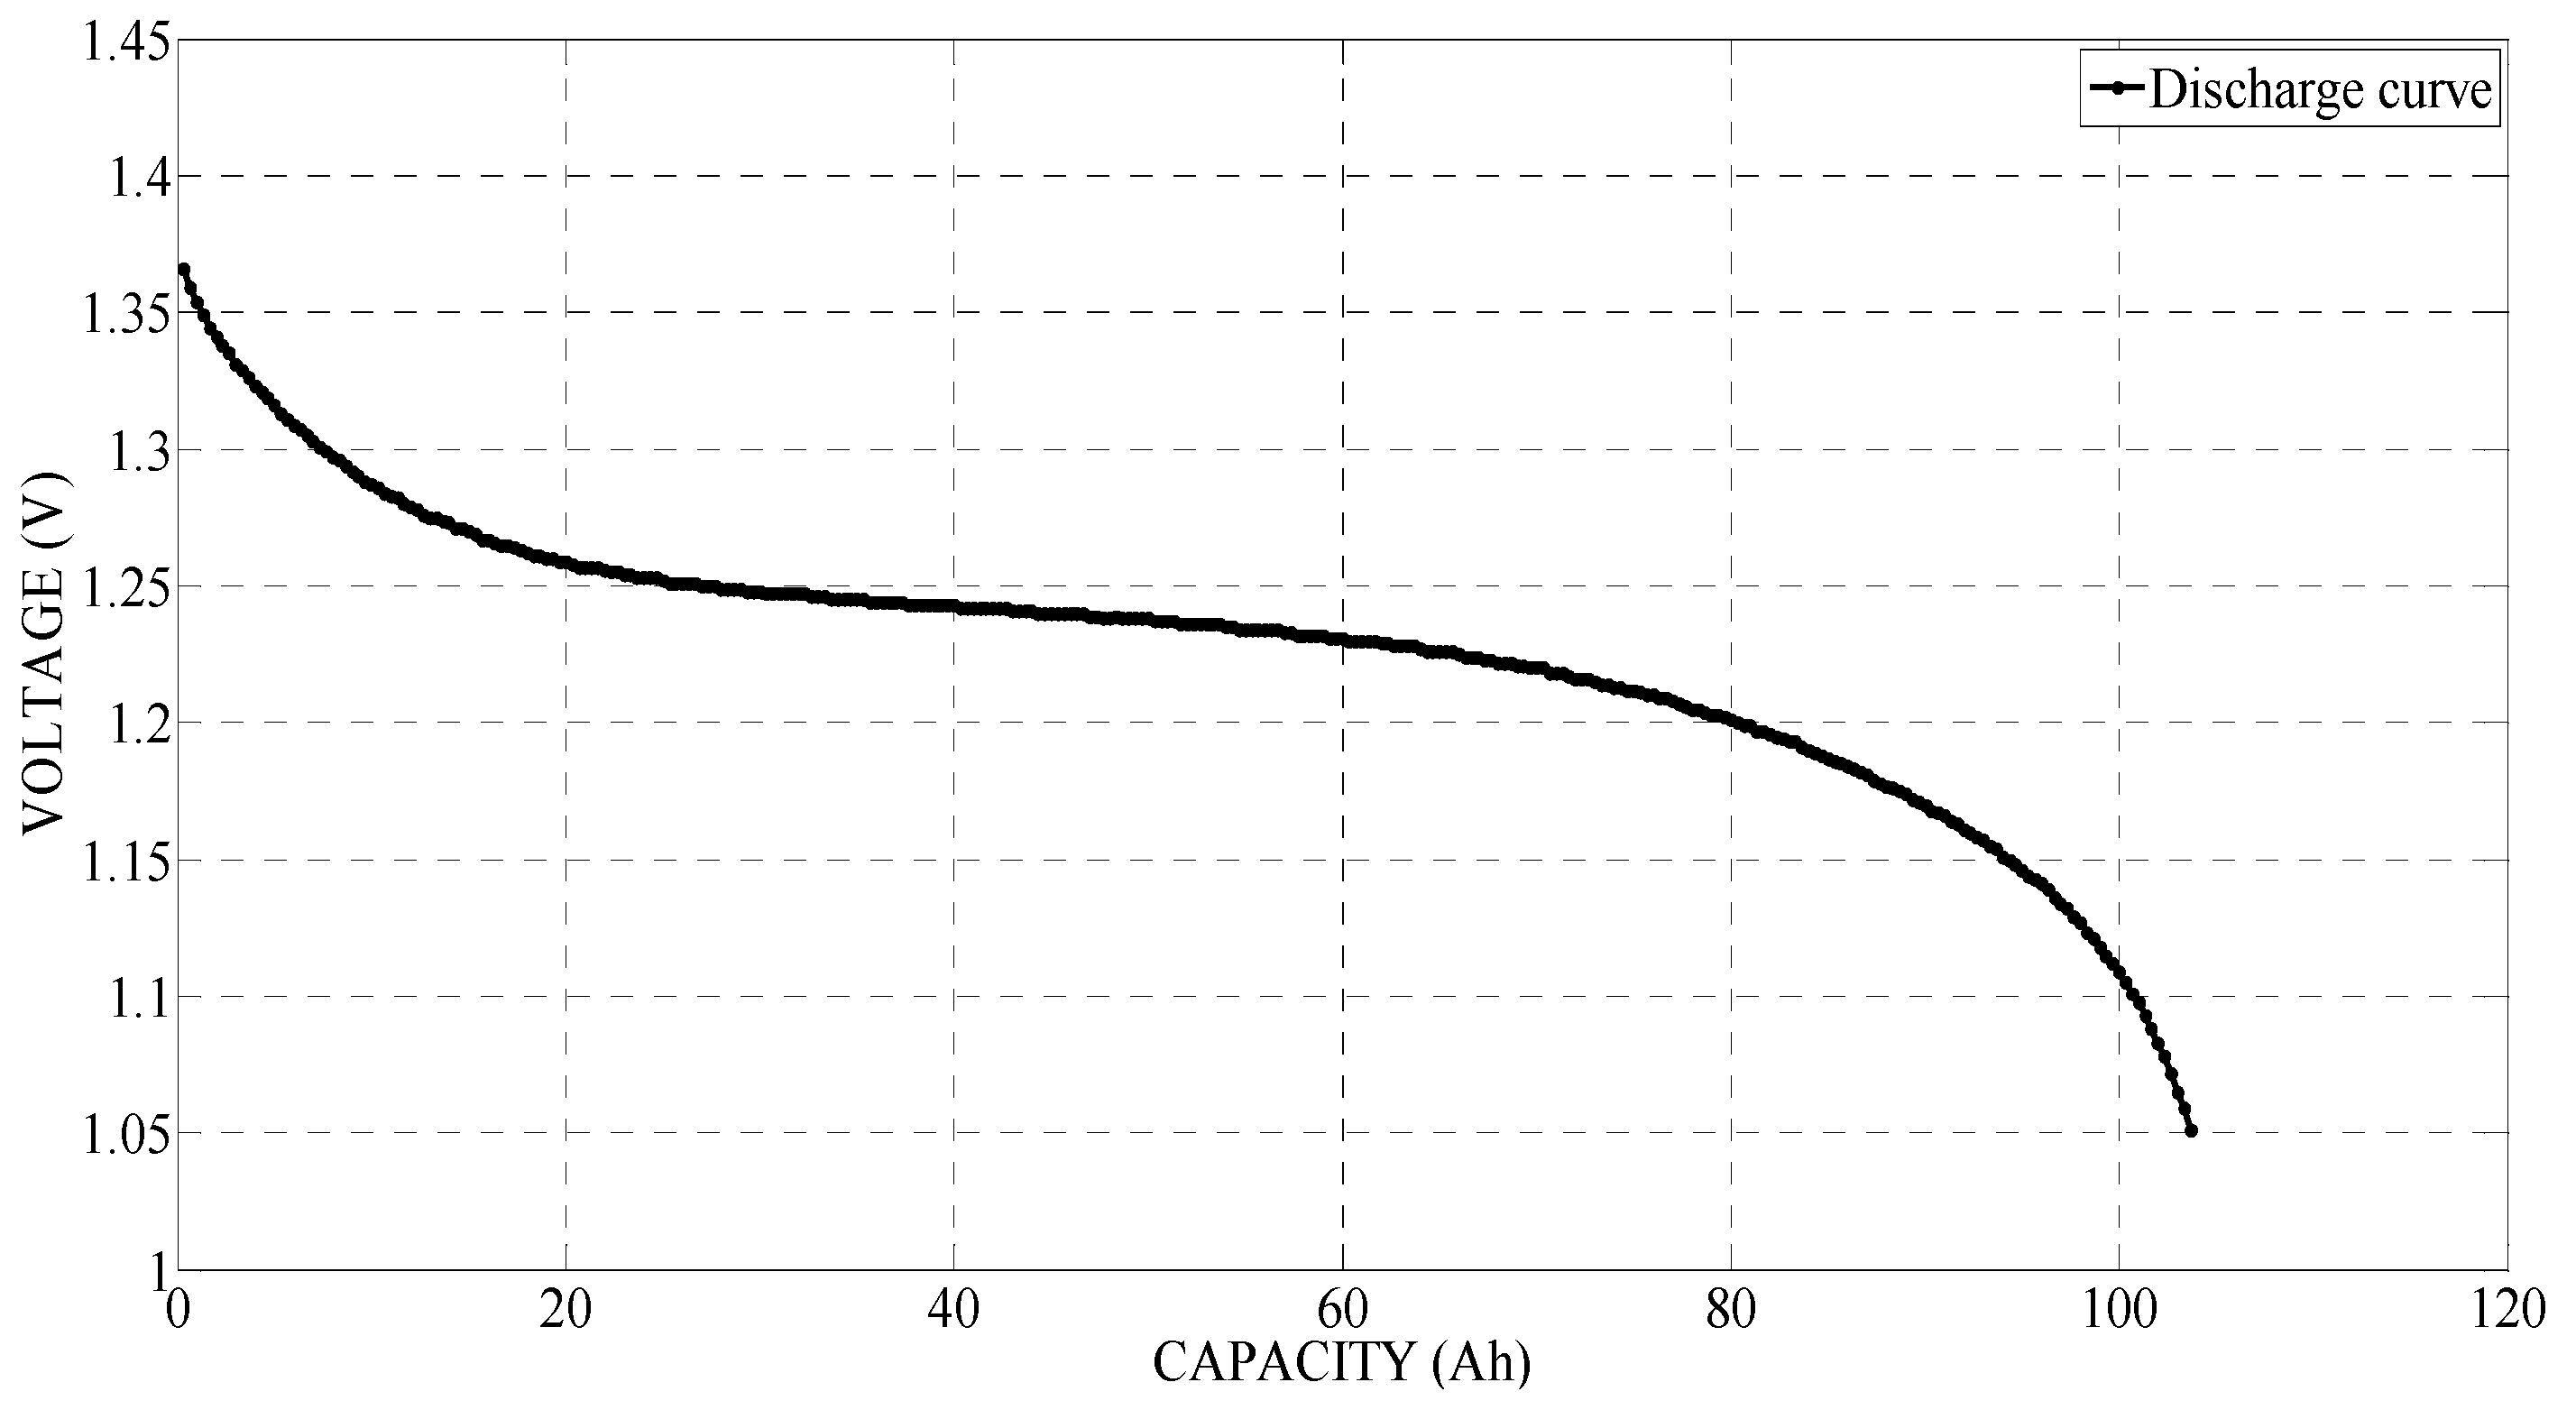
The battery model can accurately represent the behavior of the battery using well-determined parameters. An important feature of the battery model is the extraction of parameters from the manufacturer’s discharge curve. Figure 11 shows the real discharge characteristics of a 1.2 V 100 Ah Ni-MH battery cell (GMH 100) [28]. The real discharge curve shows the discharge test data from the actual manufacturer. The discharge curve shows the voltage characteristics during discharging with a constant current of 20 A (0.2 C rate).
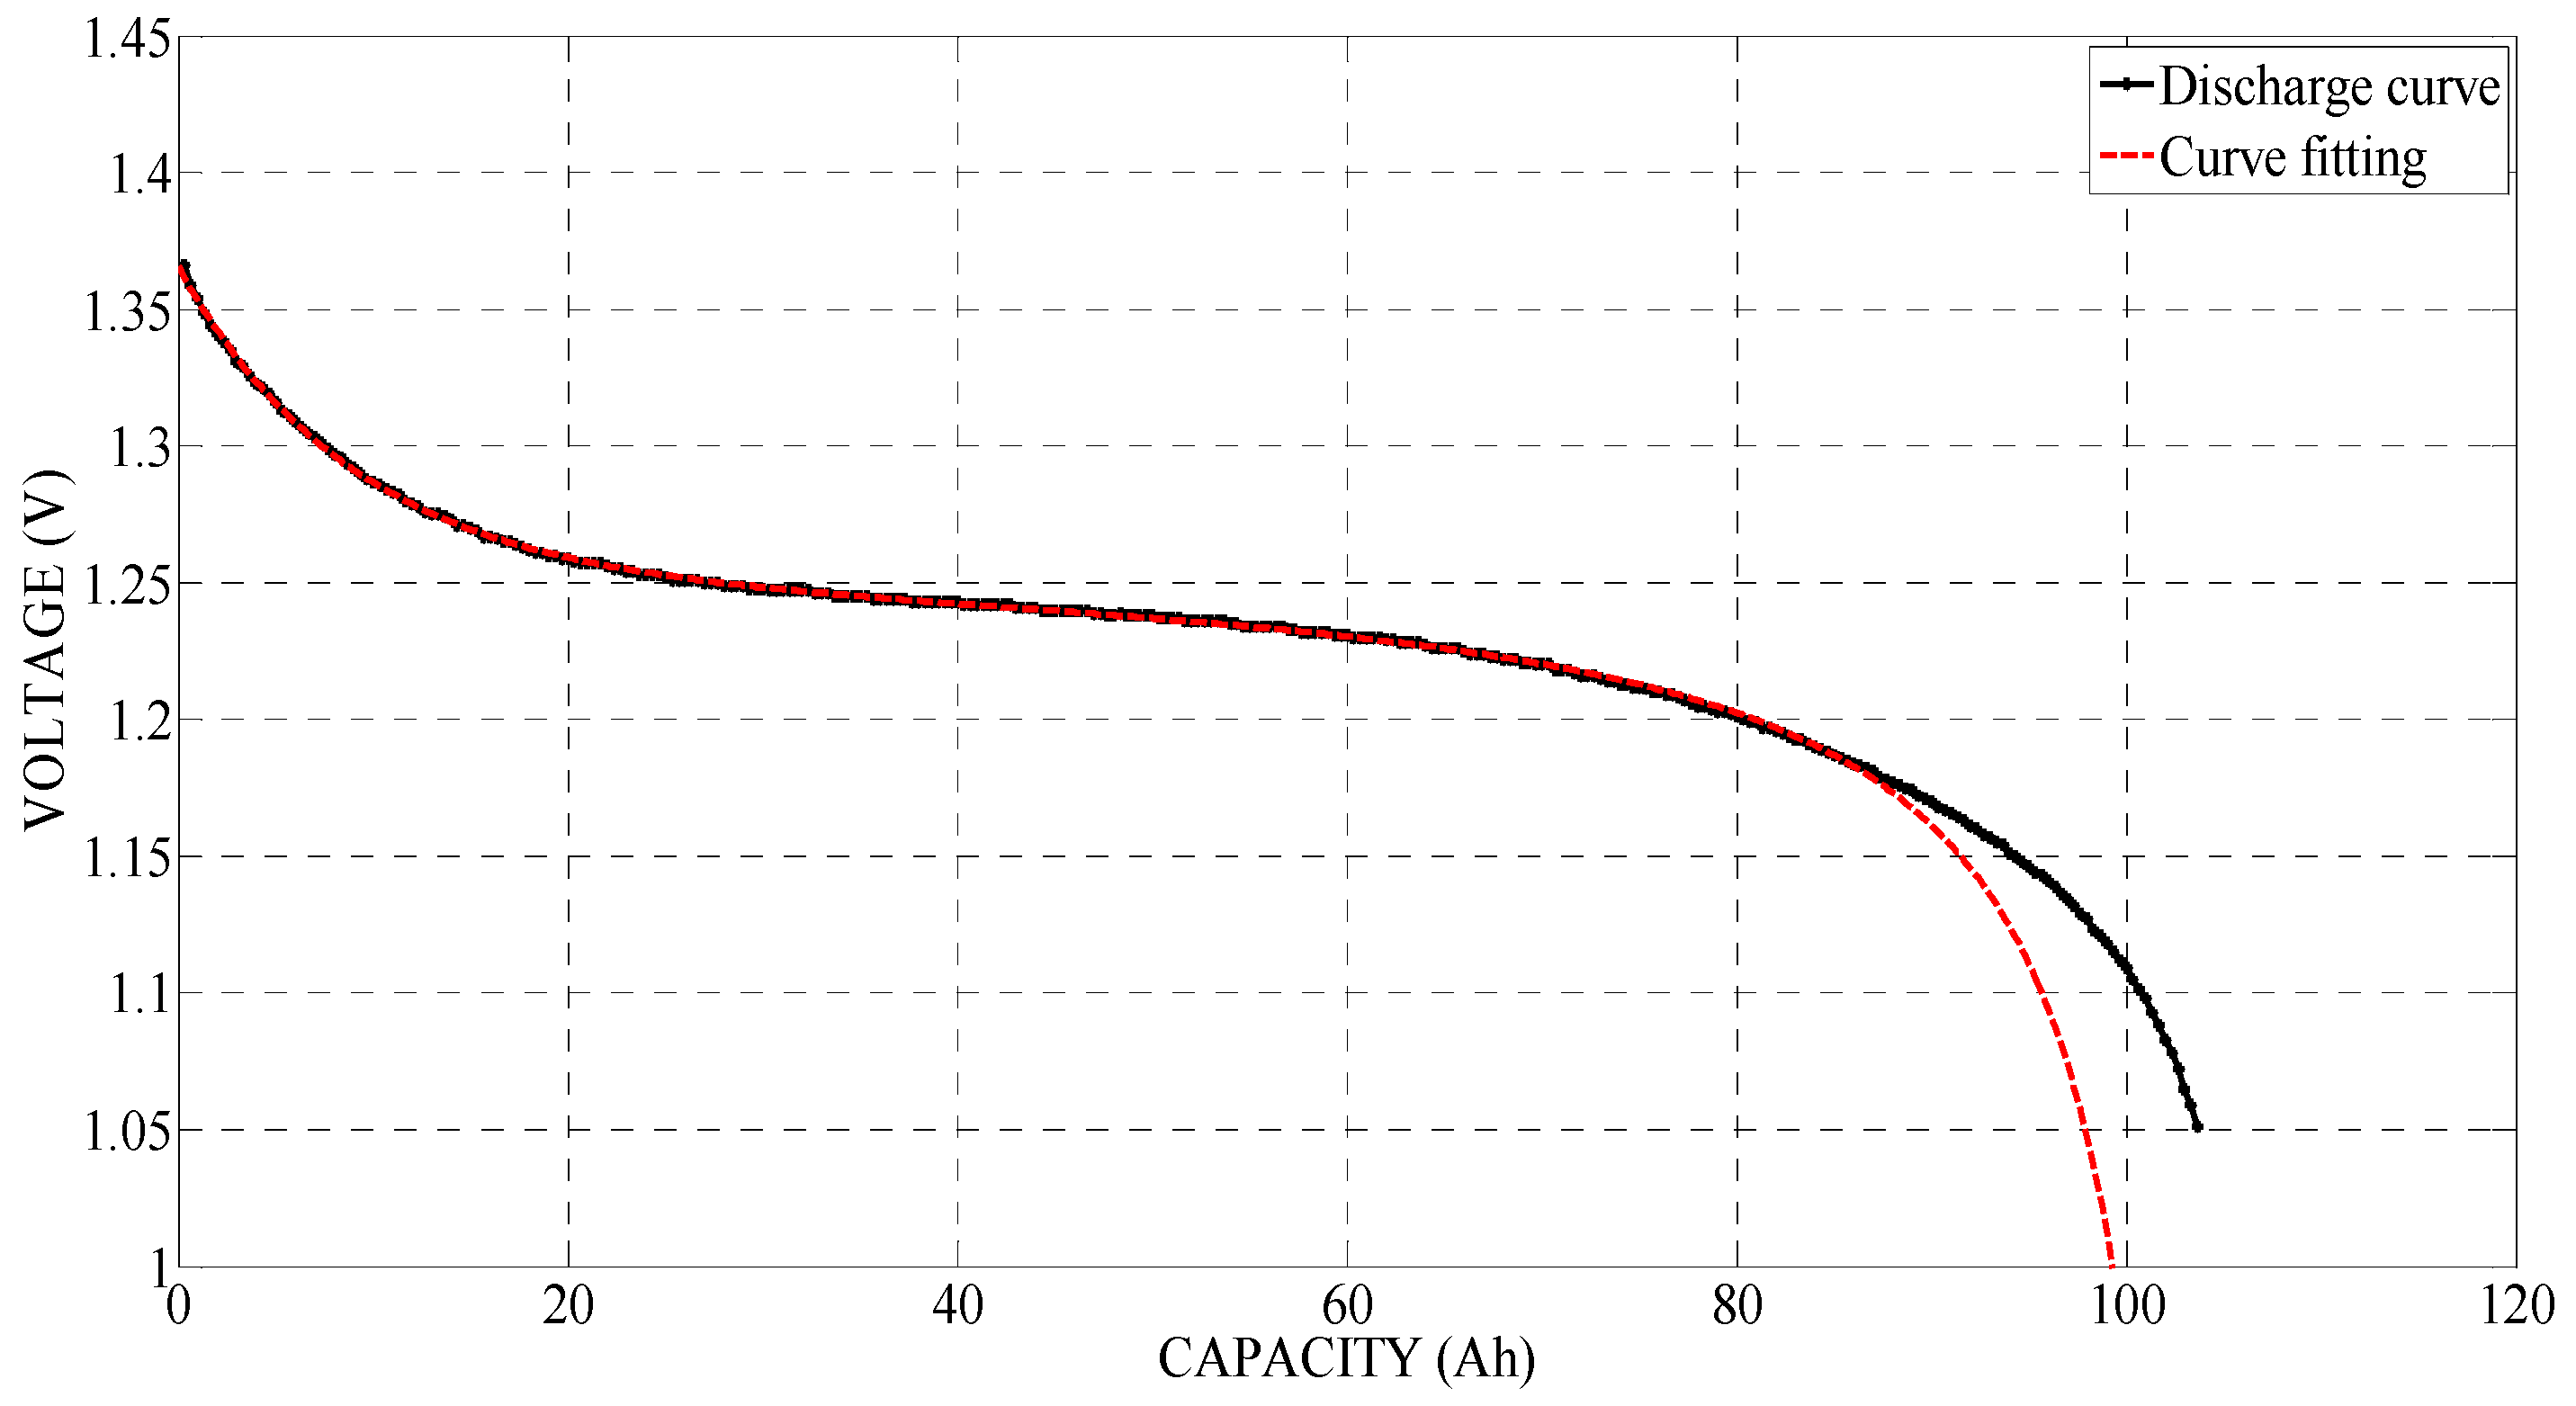
The parameters are extracted from 0.2 C data using the curve fitting function of MATLAB, and they are listed in Table 1 [29]. Figure 12 shows a comparison of the original data and the extracted parameter data [30].
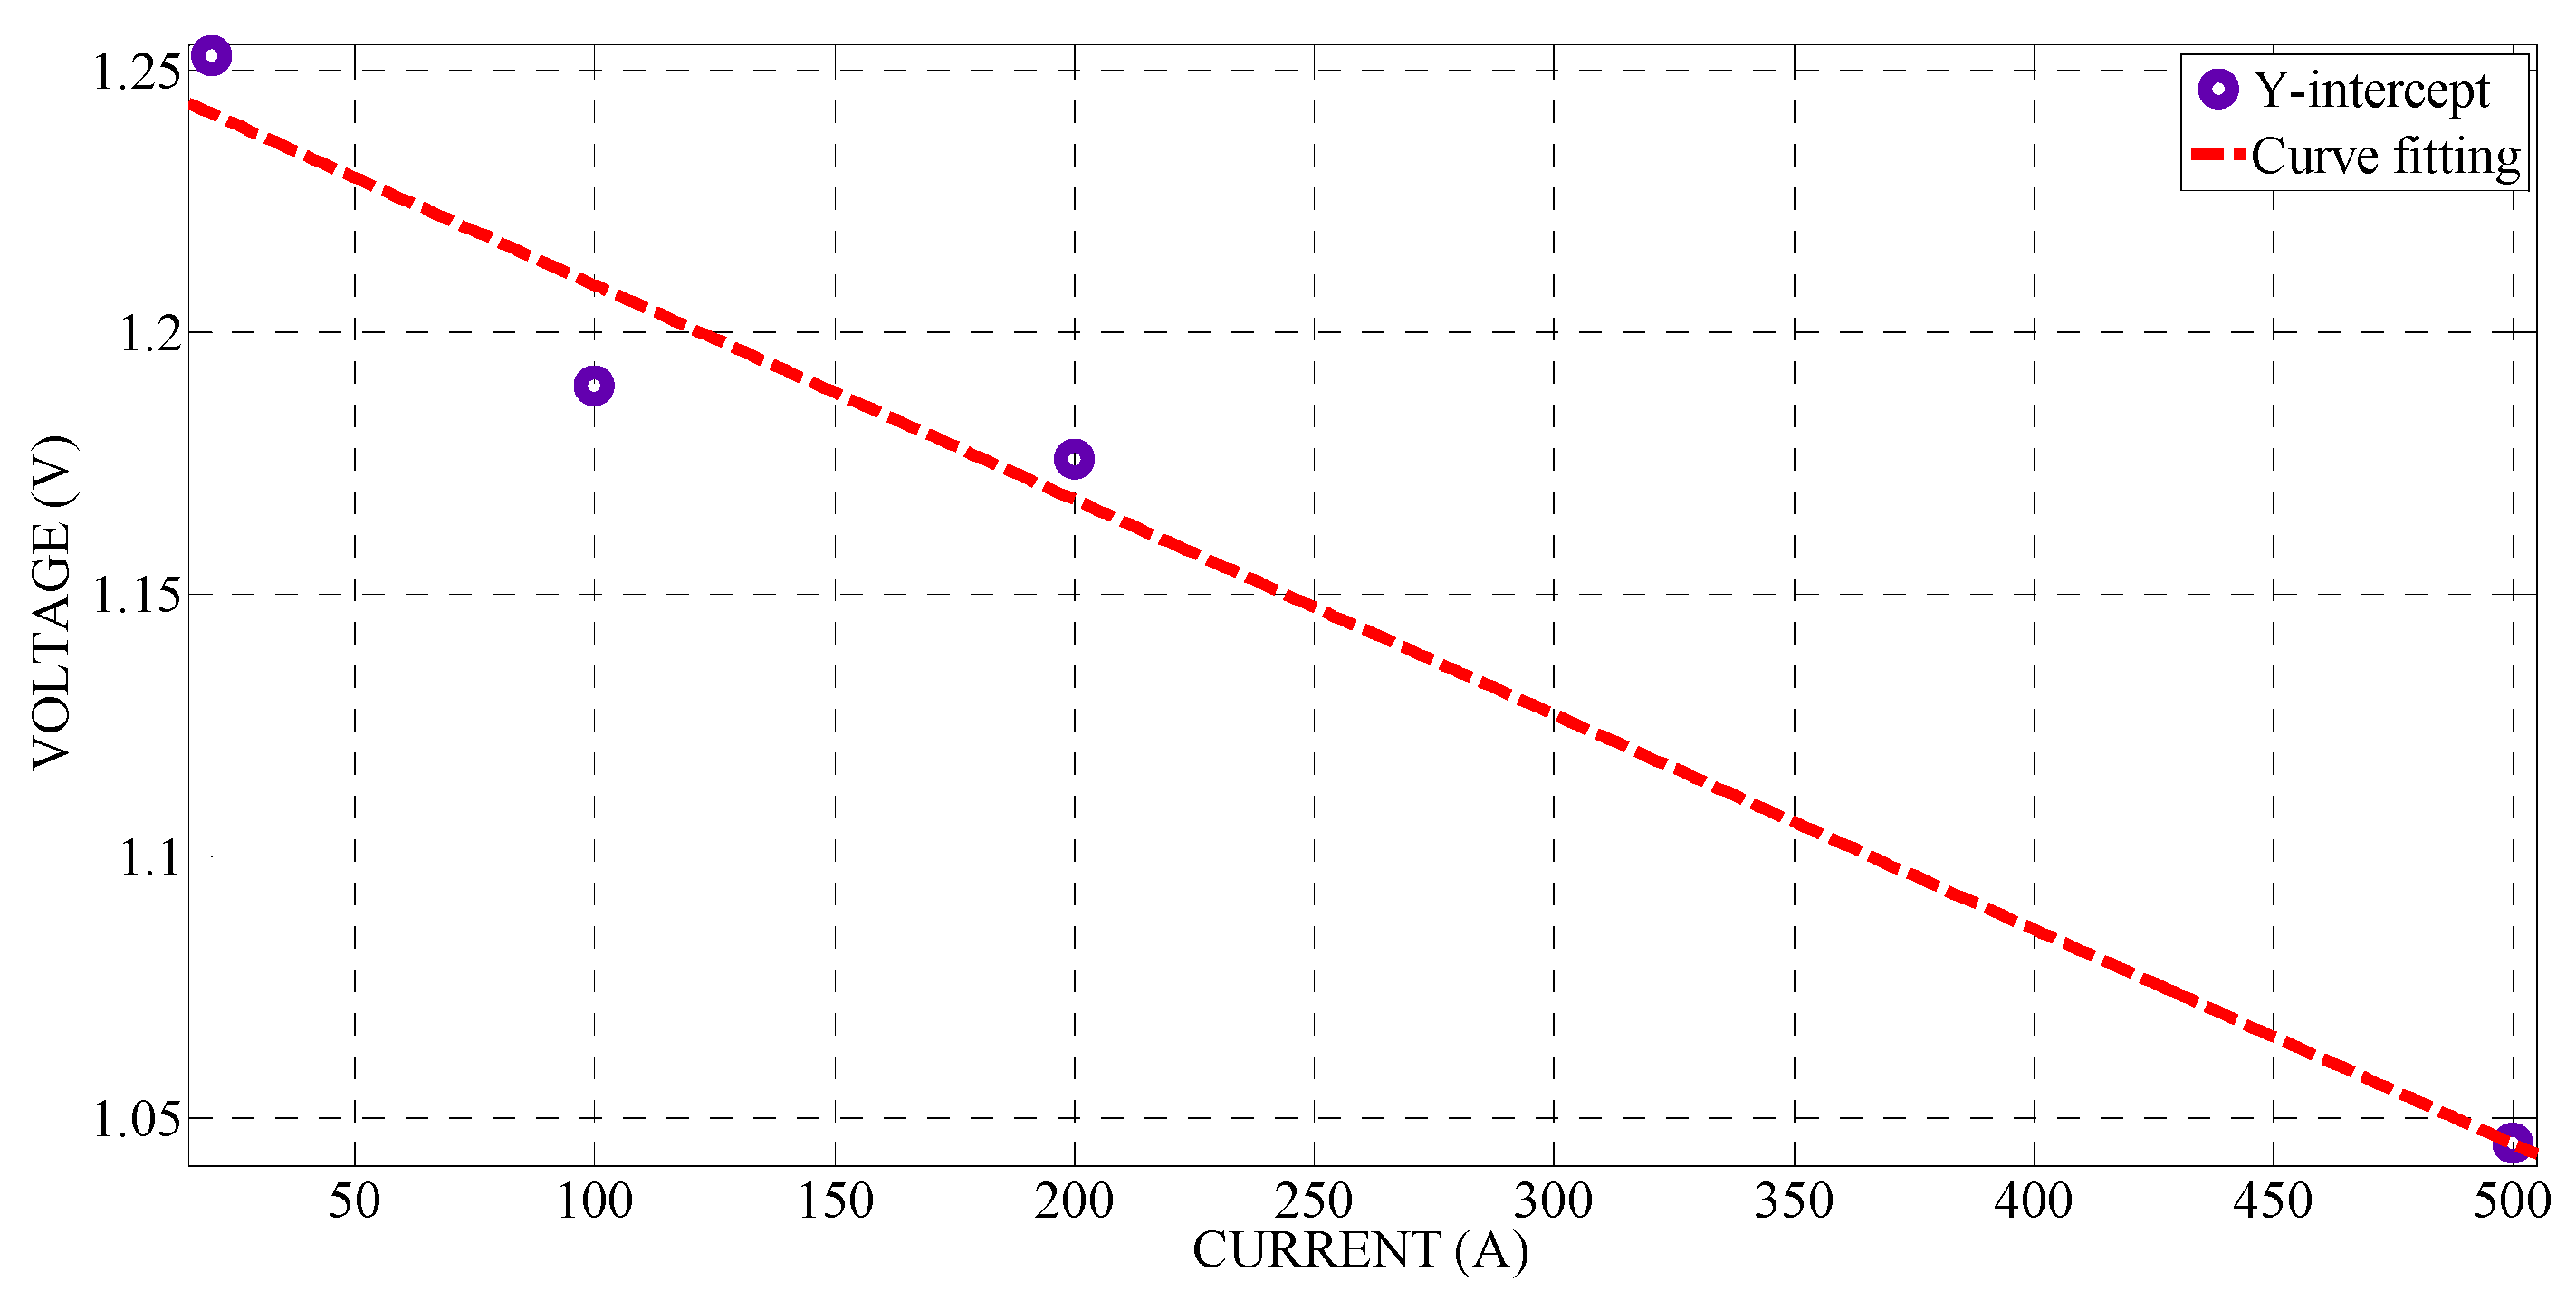
However, the obtained parameters did not fit the other discharge curves (1, 2, and 5 C curves). Analyzing the results of the obtained parameters showed that the curve shape was similar, but the y-intercept was different. The parameters () related to the y-intercept were recalculated. These two parameters were calculated using the relationship between current and y-intercept as shown in Equation (6).
The two parameters are again derived using the curve fitting of MATLAB, with the results presented in Table 2 and Figure 13.
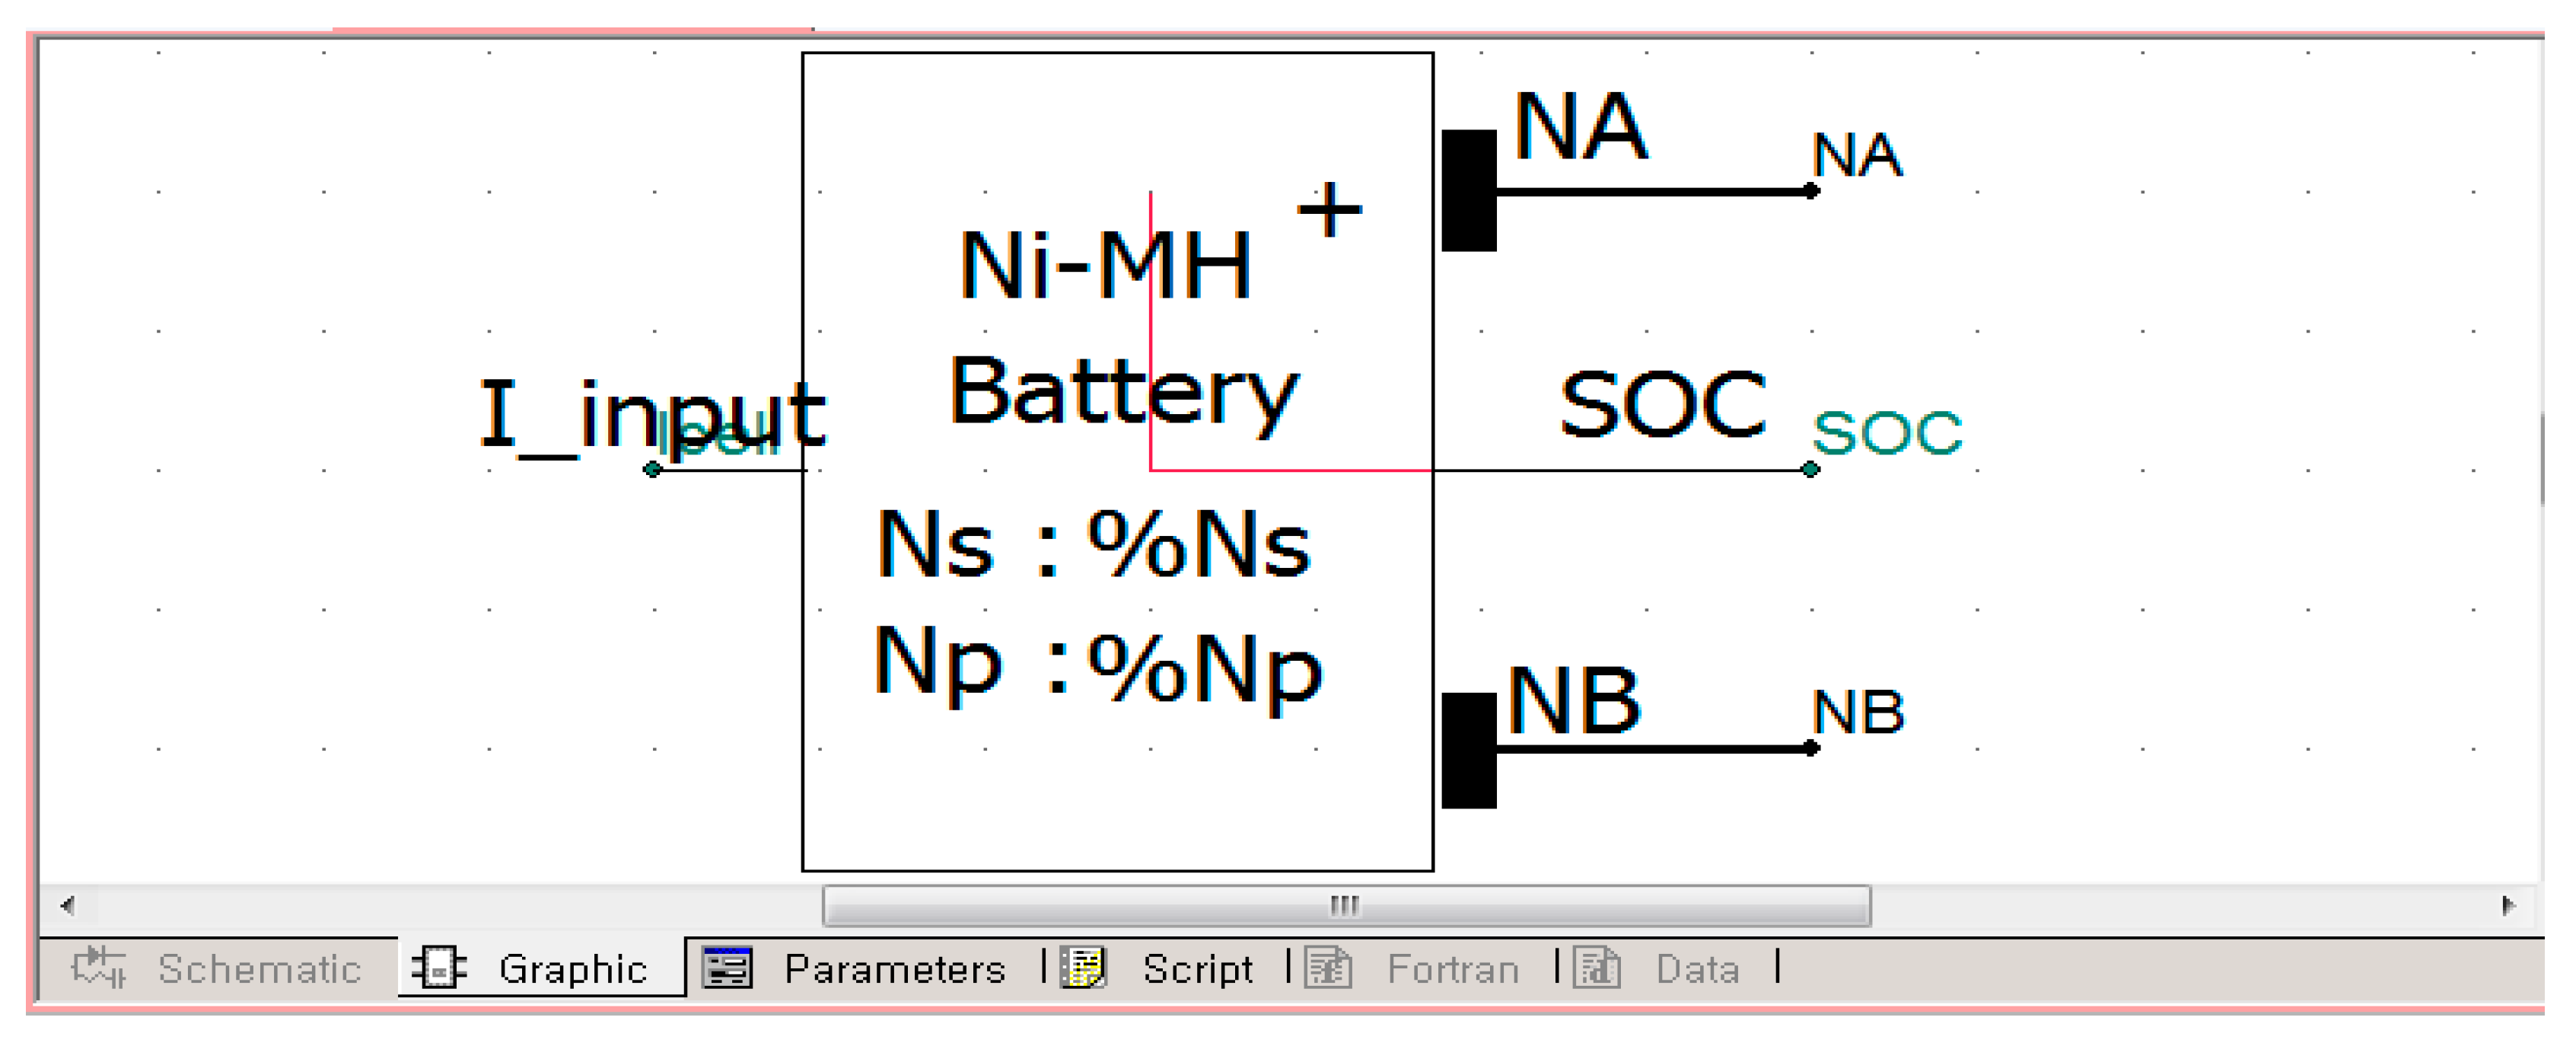
Figure 14 shows the components of a battery model created using the component wizard.
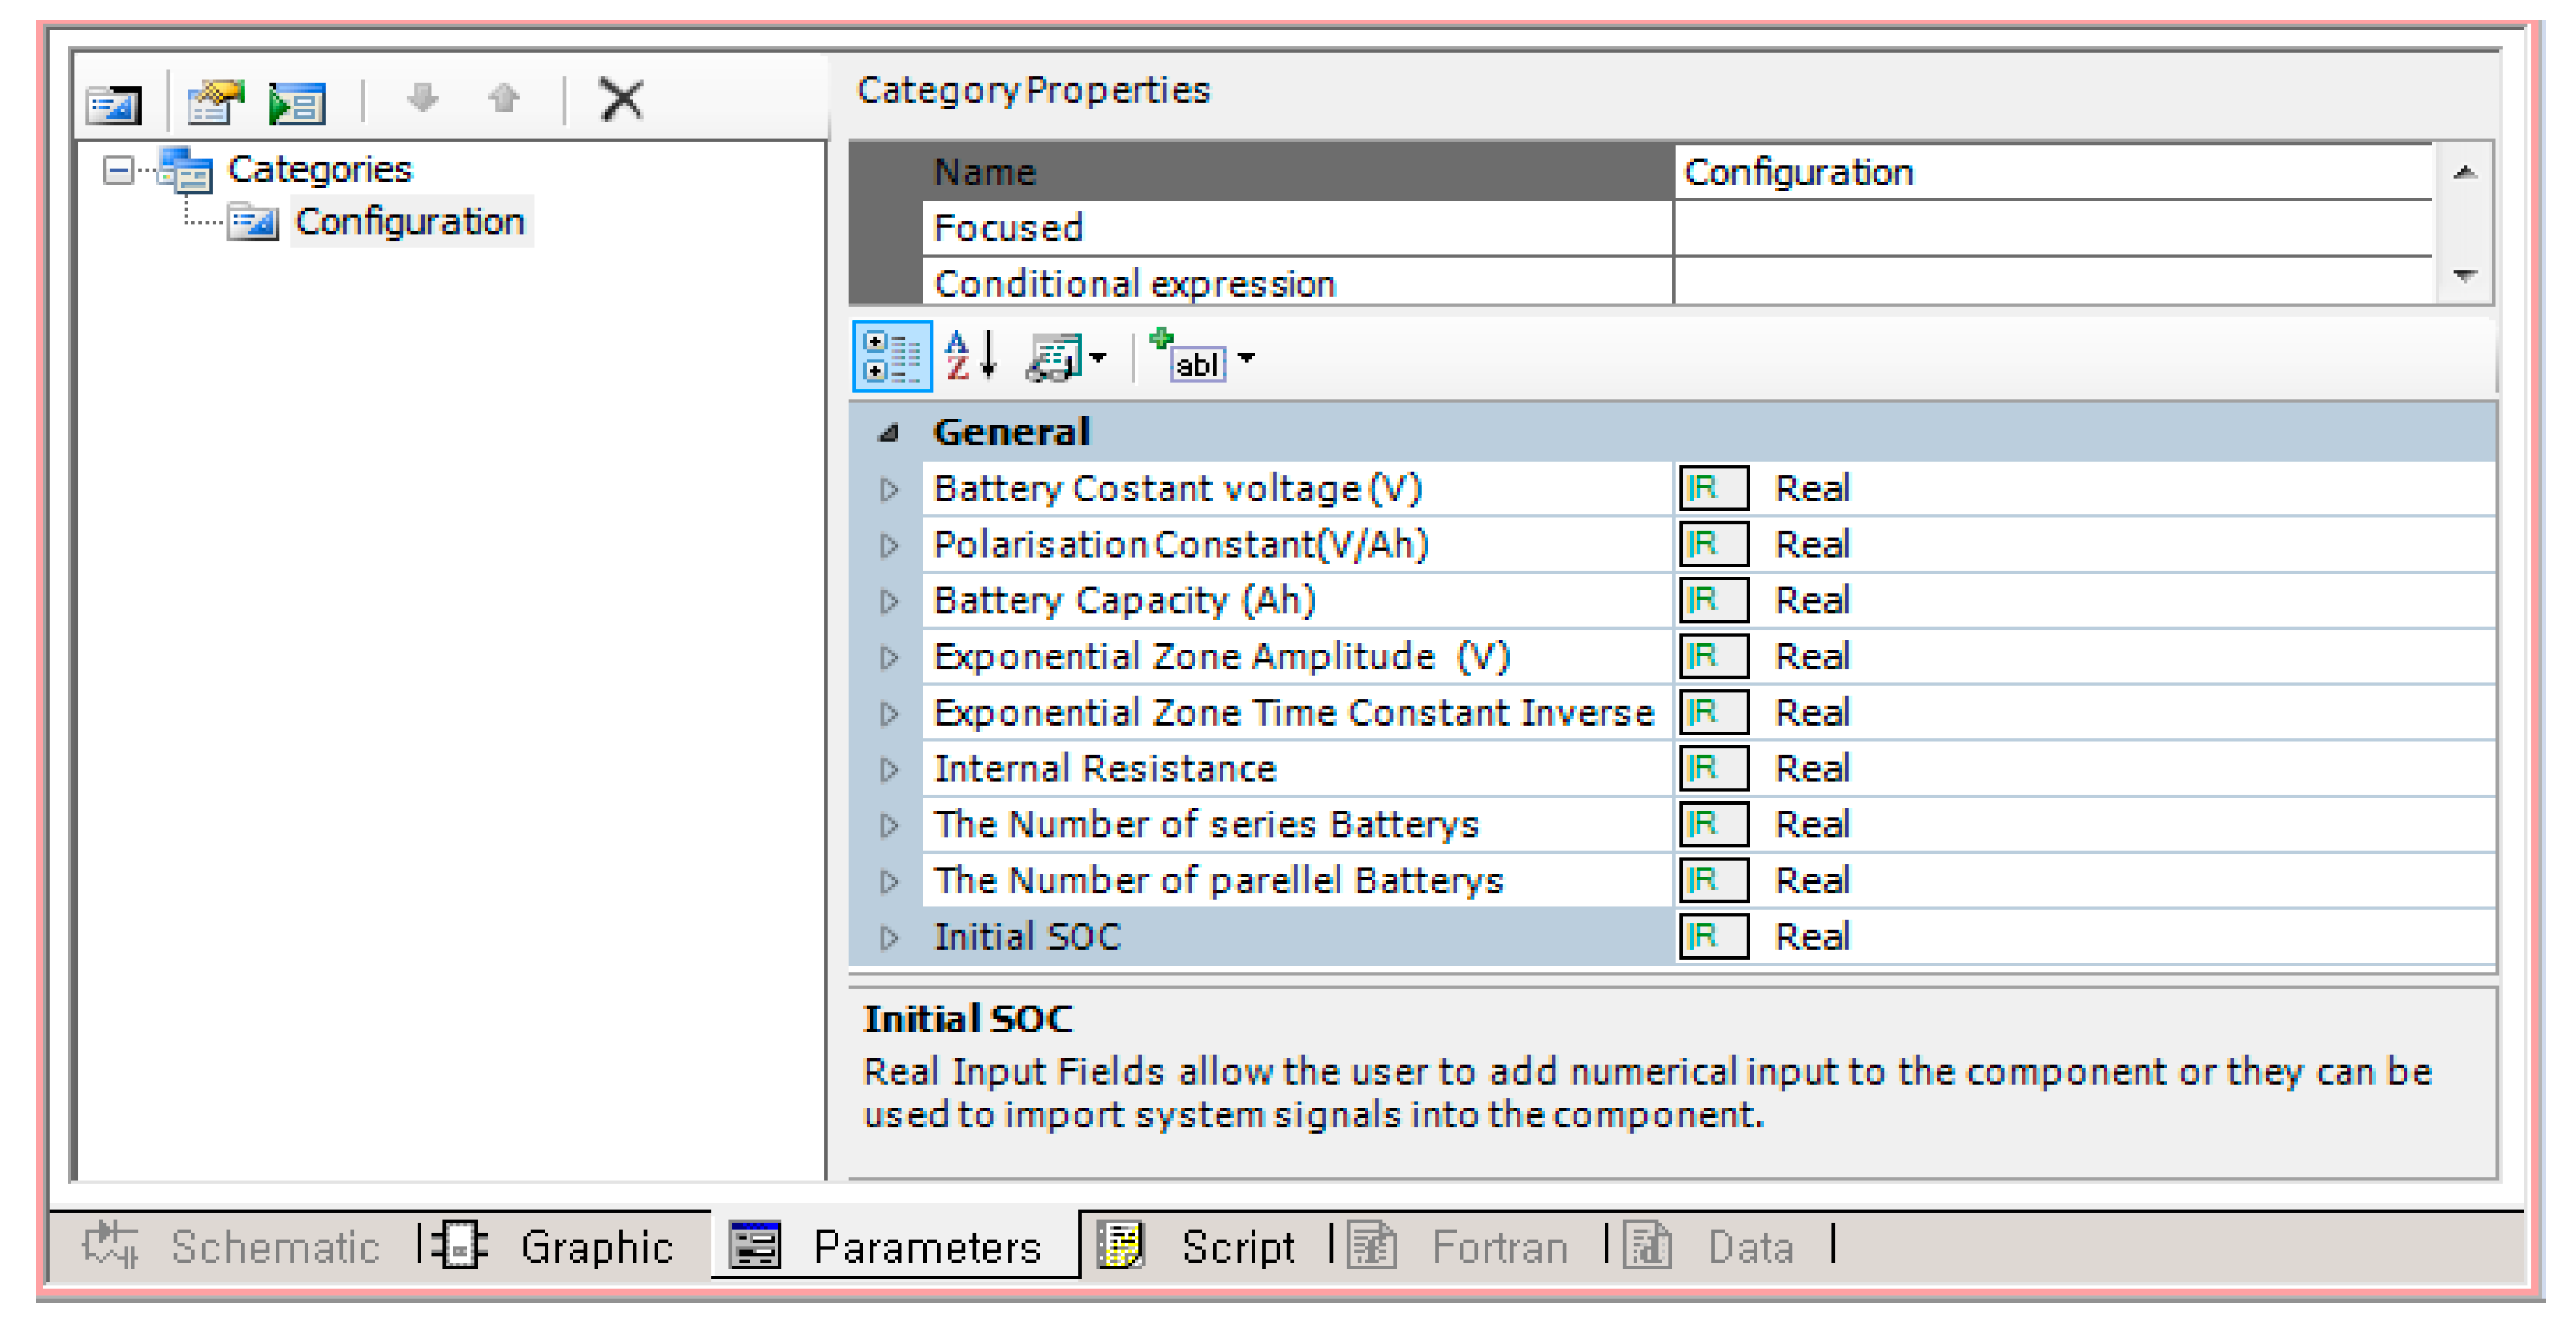
Figure 15 shows the creation of an input window where the user can enter the characteristics of the Ni-MH battery model.
The obtained parameters from curve fitting are entered as the required parameters, as shown in Figure 16.
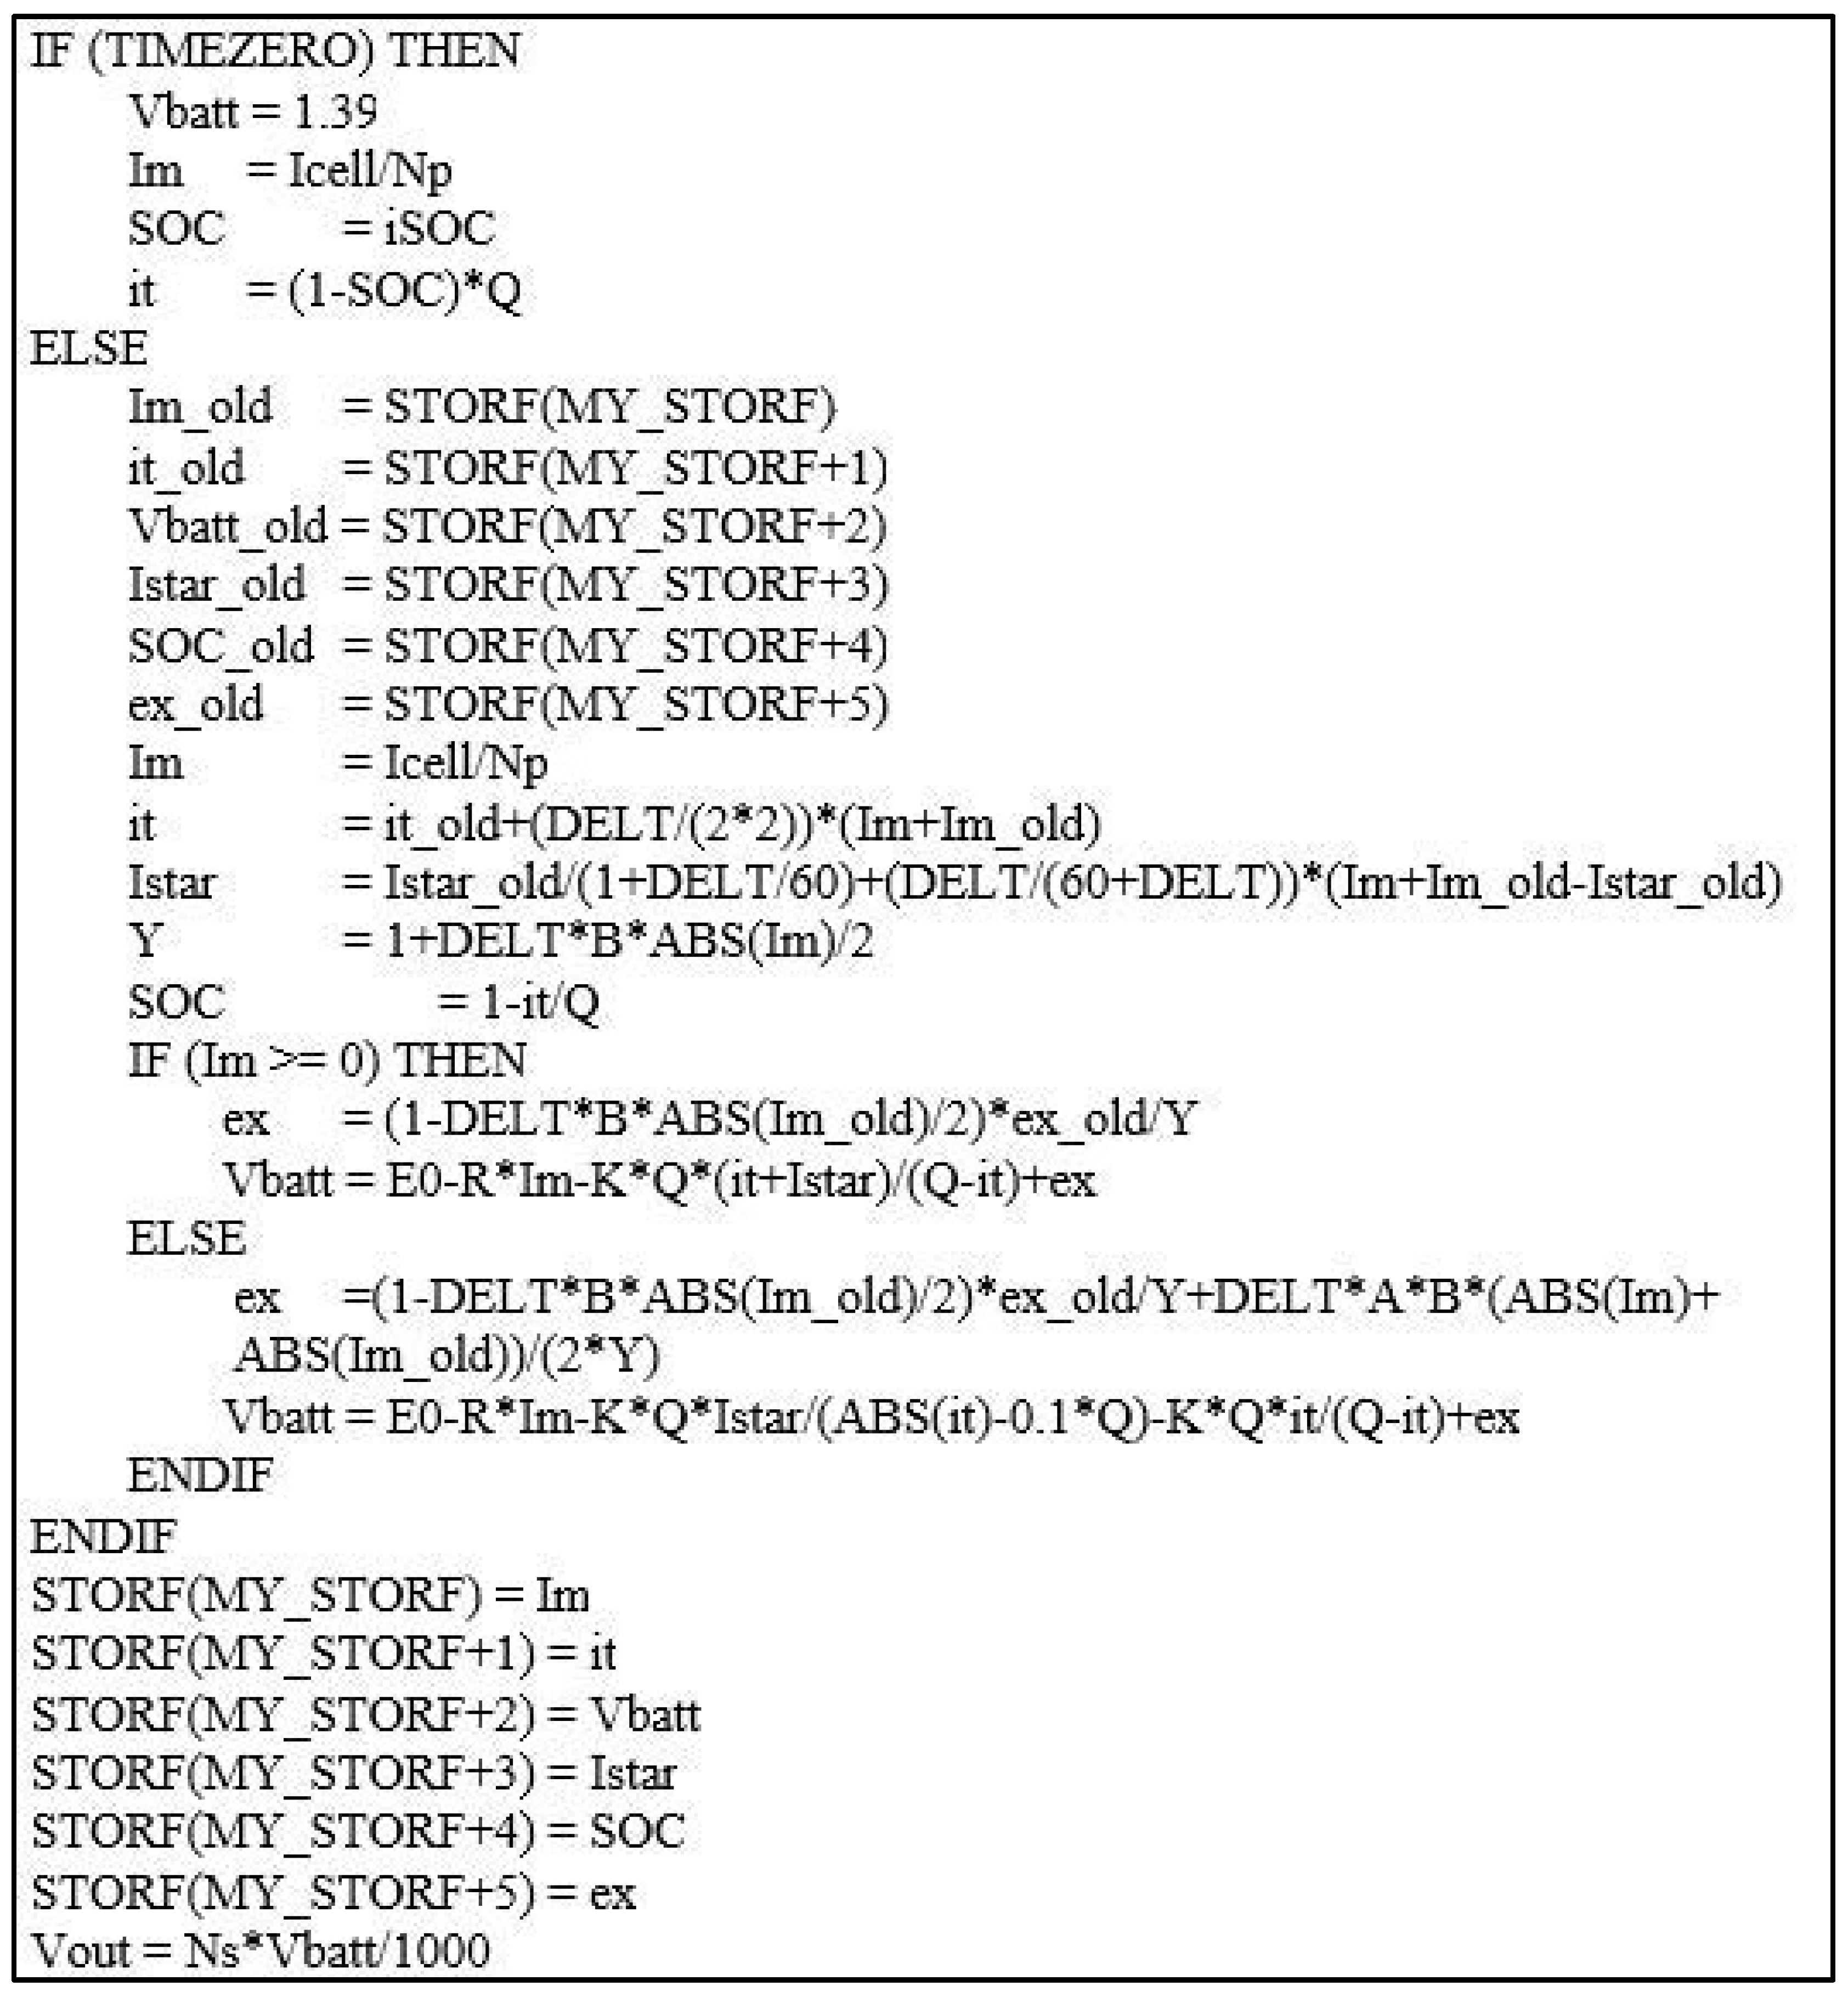
As shown in Figure 17, the battery model is implemented using the Fortran language in UDM of PSCAD. The user can then visualize the discharge curve with the obtained parameters and compare them with the manufacturer’s discharge curve. In Figure 17, the initial state of the battery model is defined. The magnitude of the output voltage is determined using the characteristic variable of the battery model. In this part, the model of the Ni-MH battery can be determined by reflecting the characteristics of the battery. If the user wants to change the characteristics of the battery, the user can modify this part to reflect the desired characteristics of the battery.
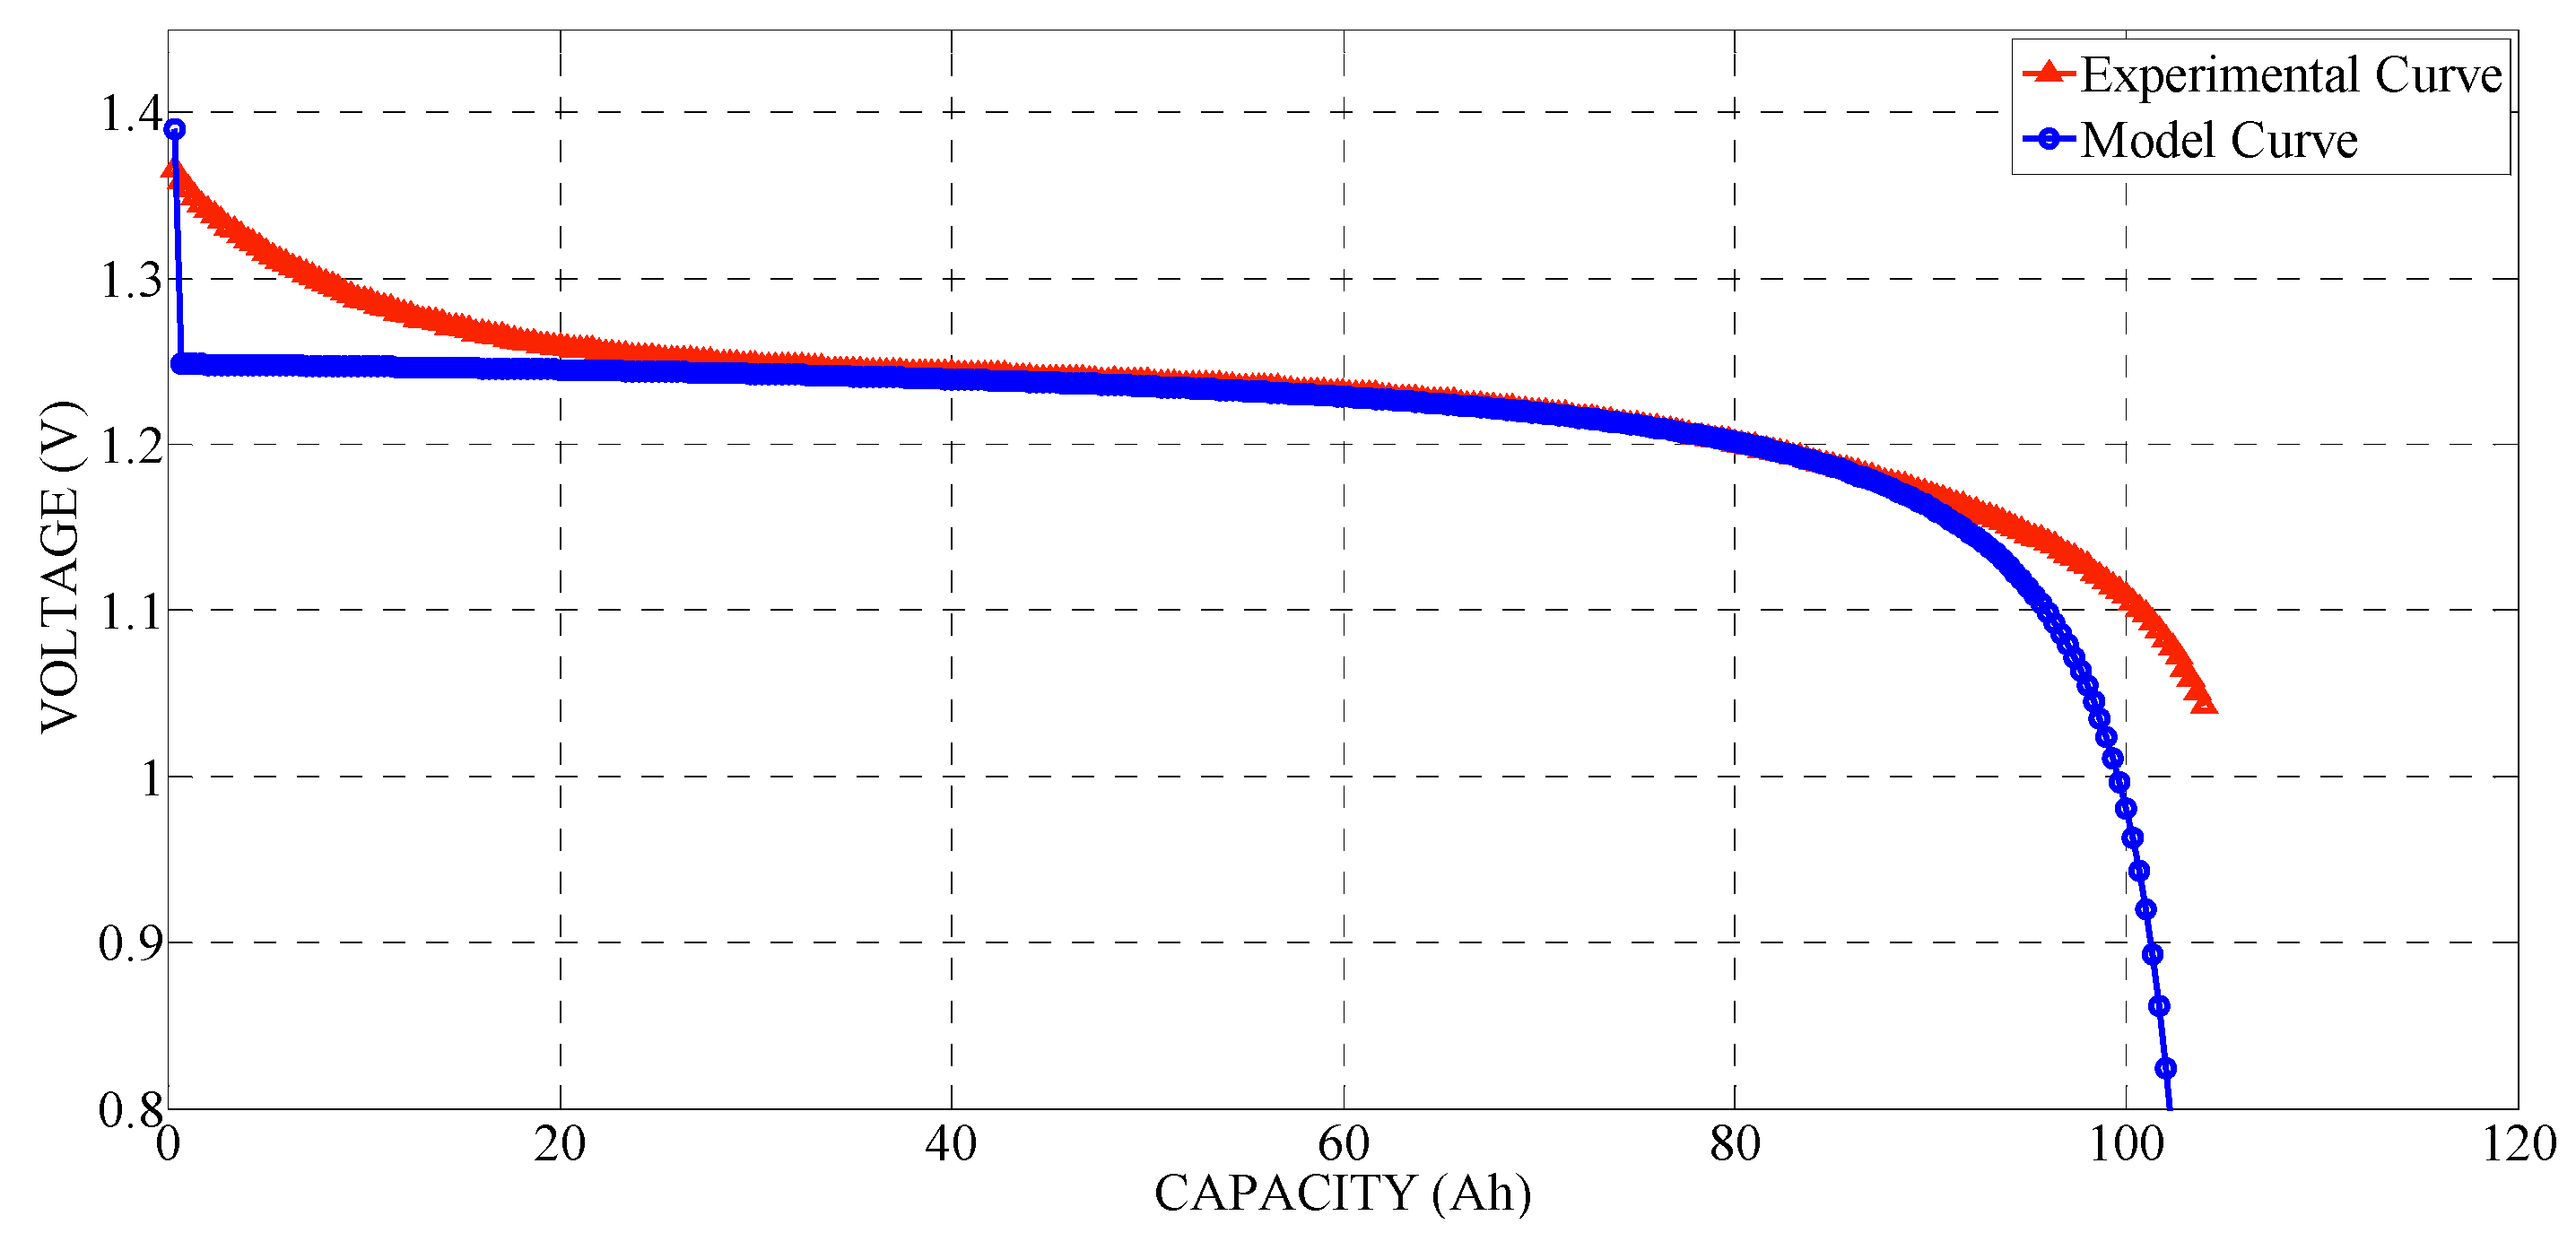
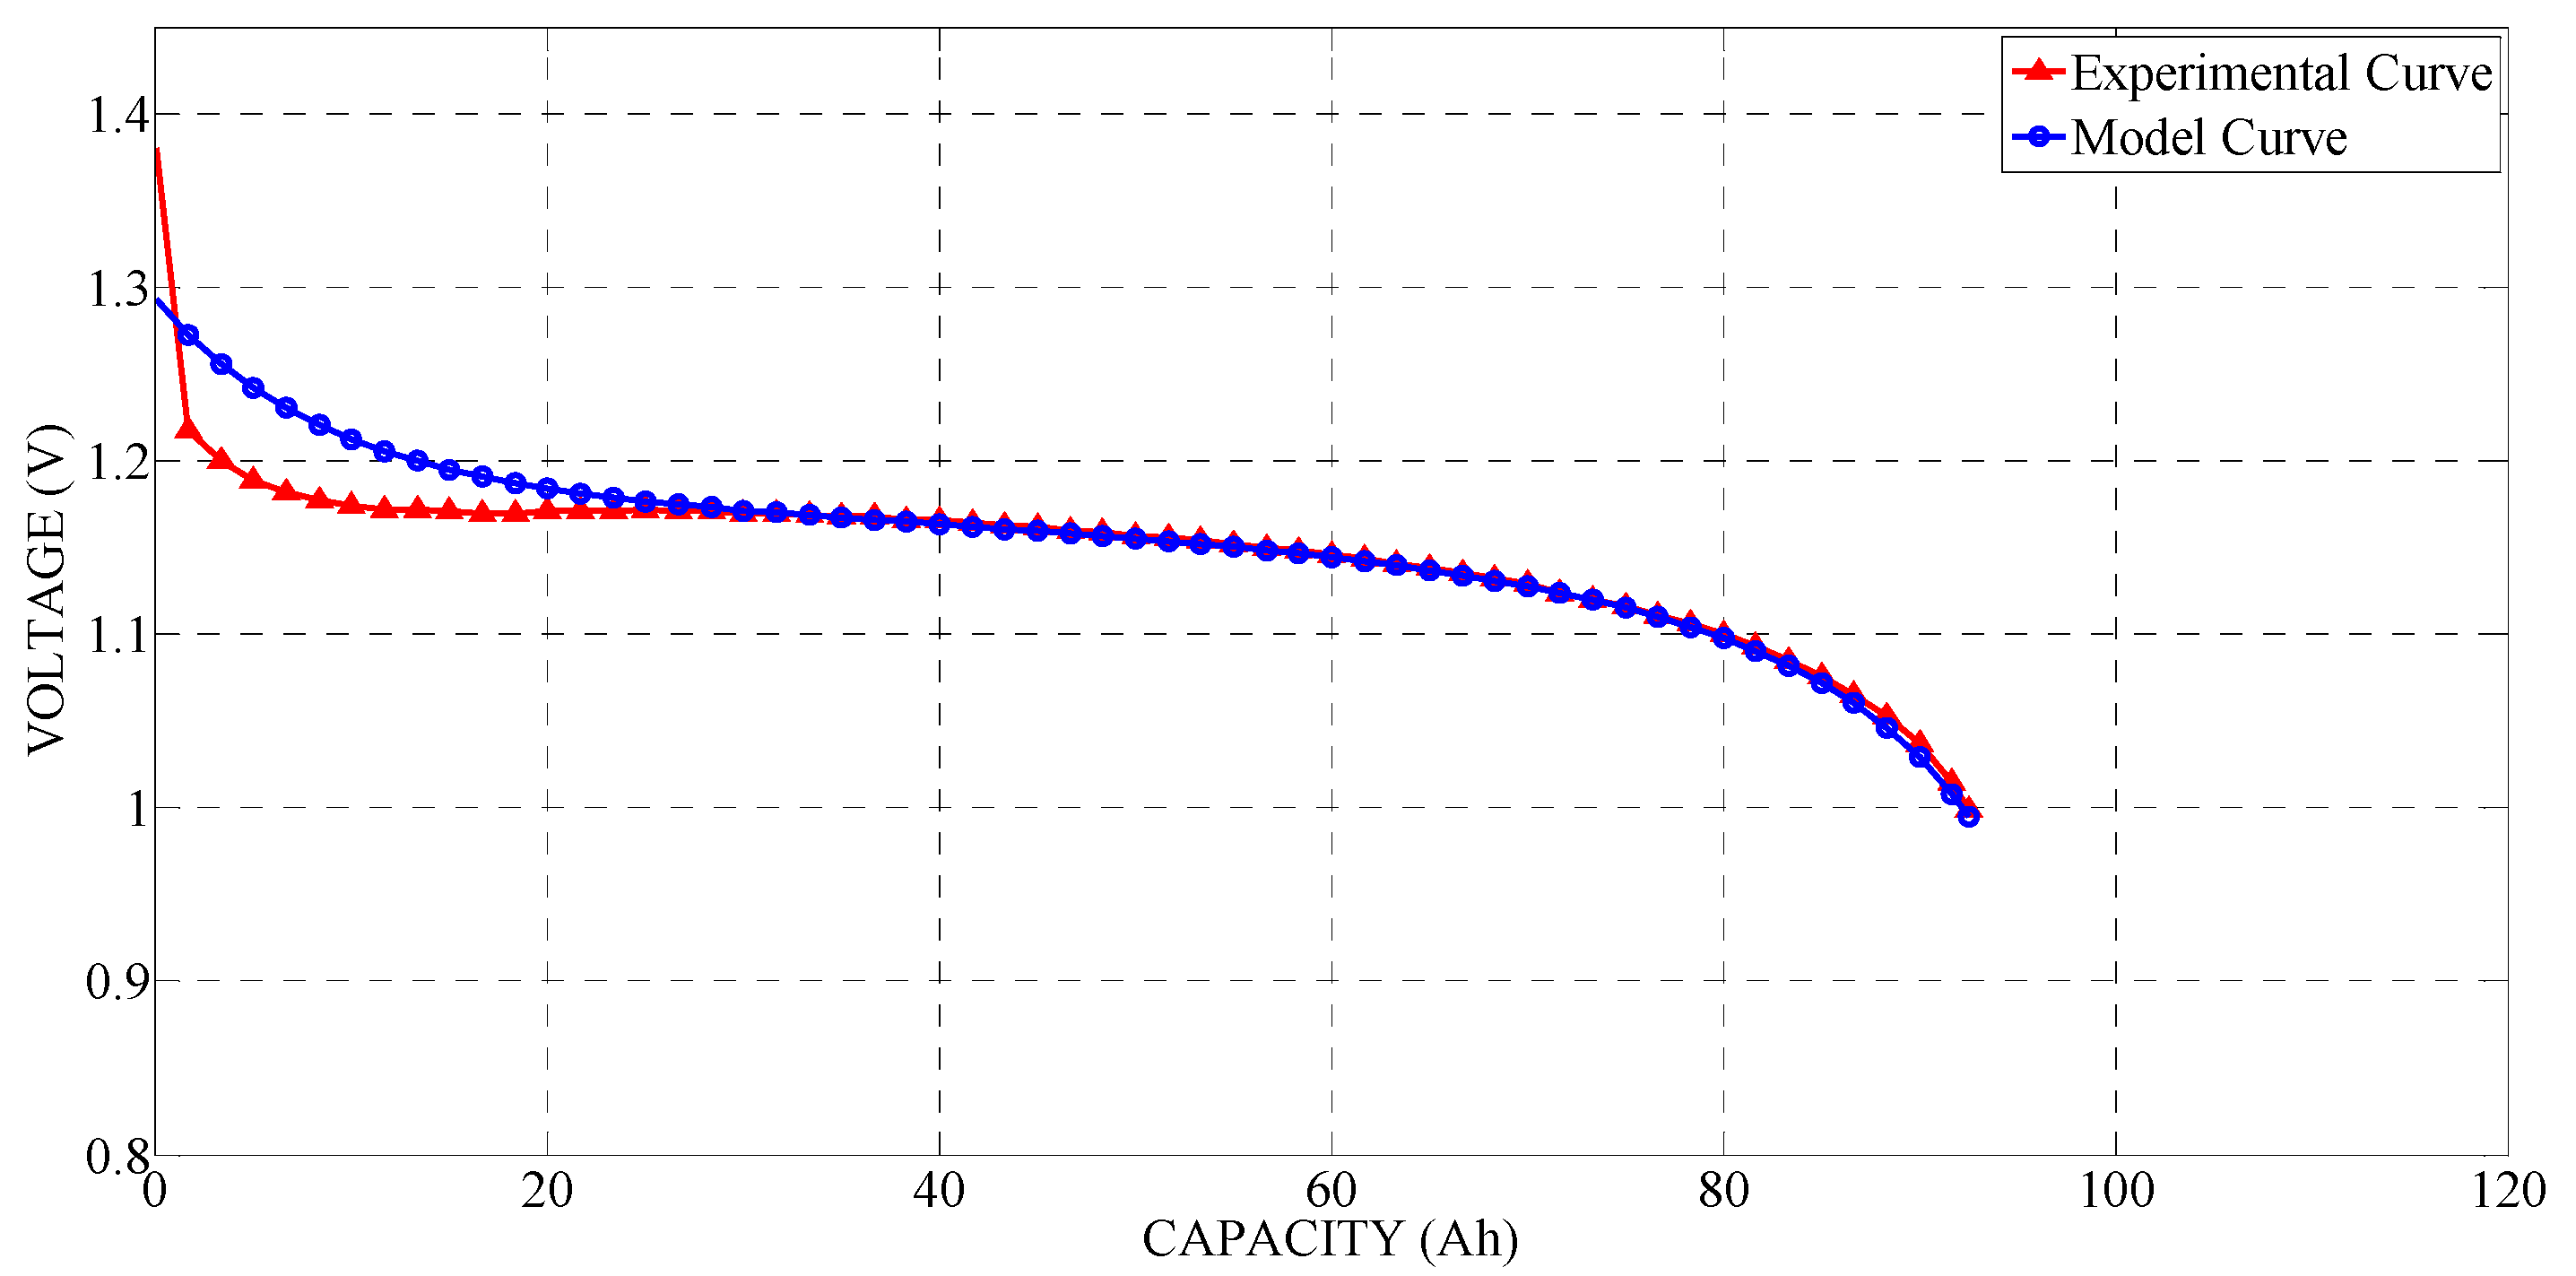
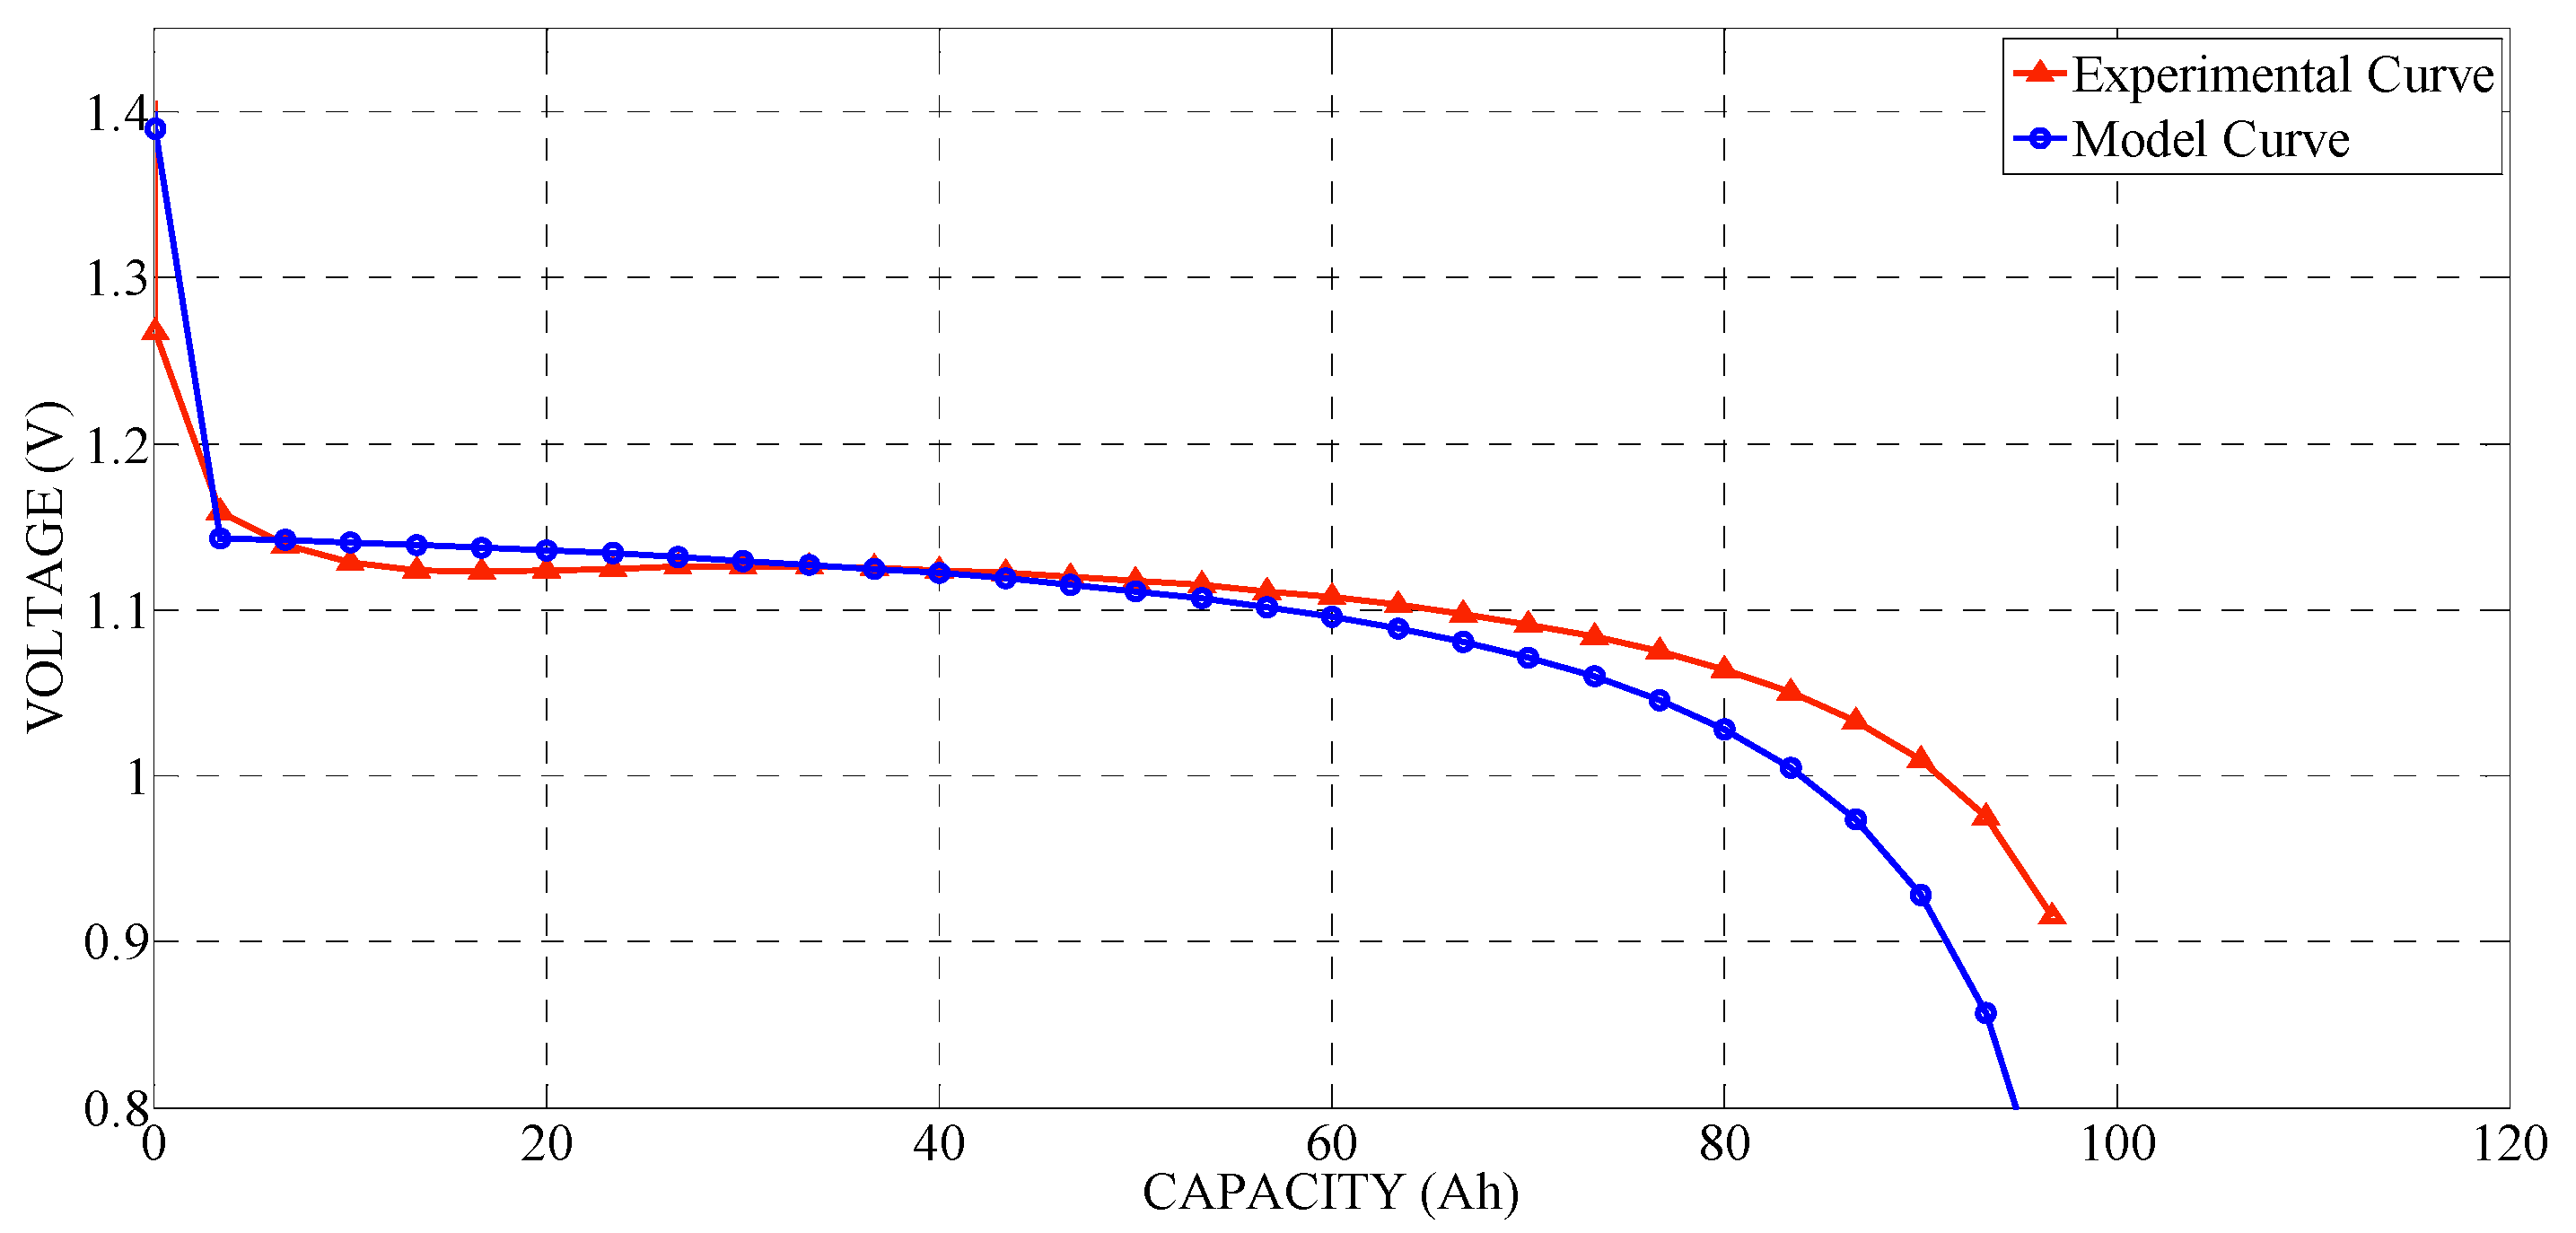
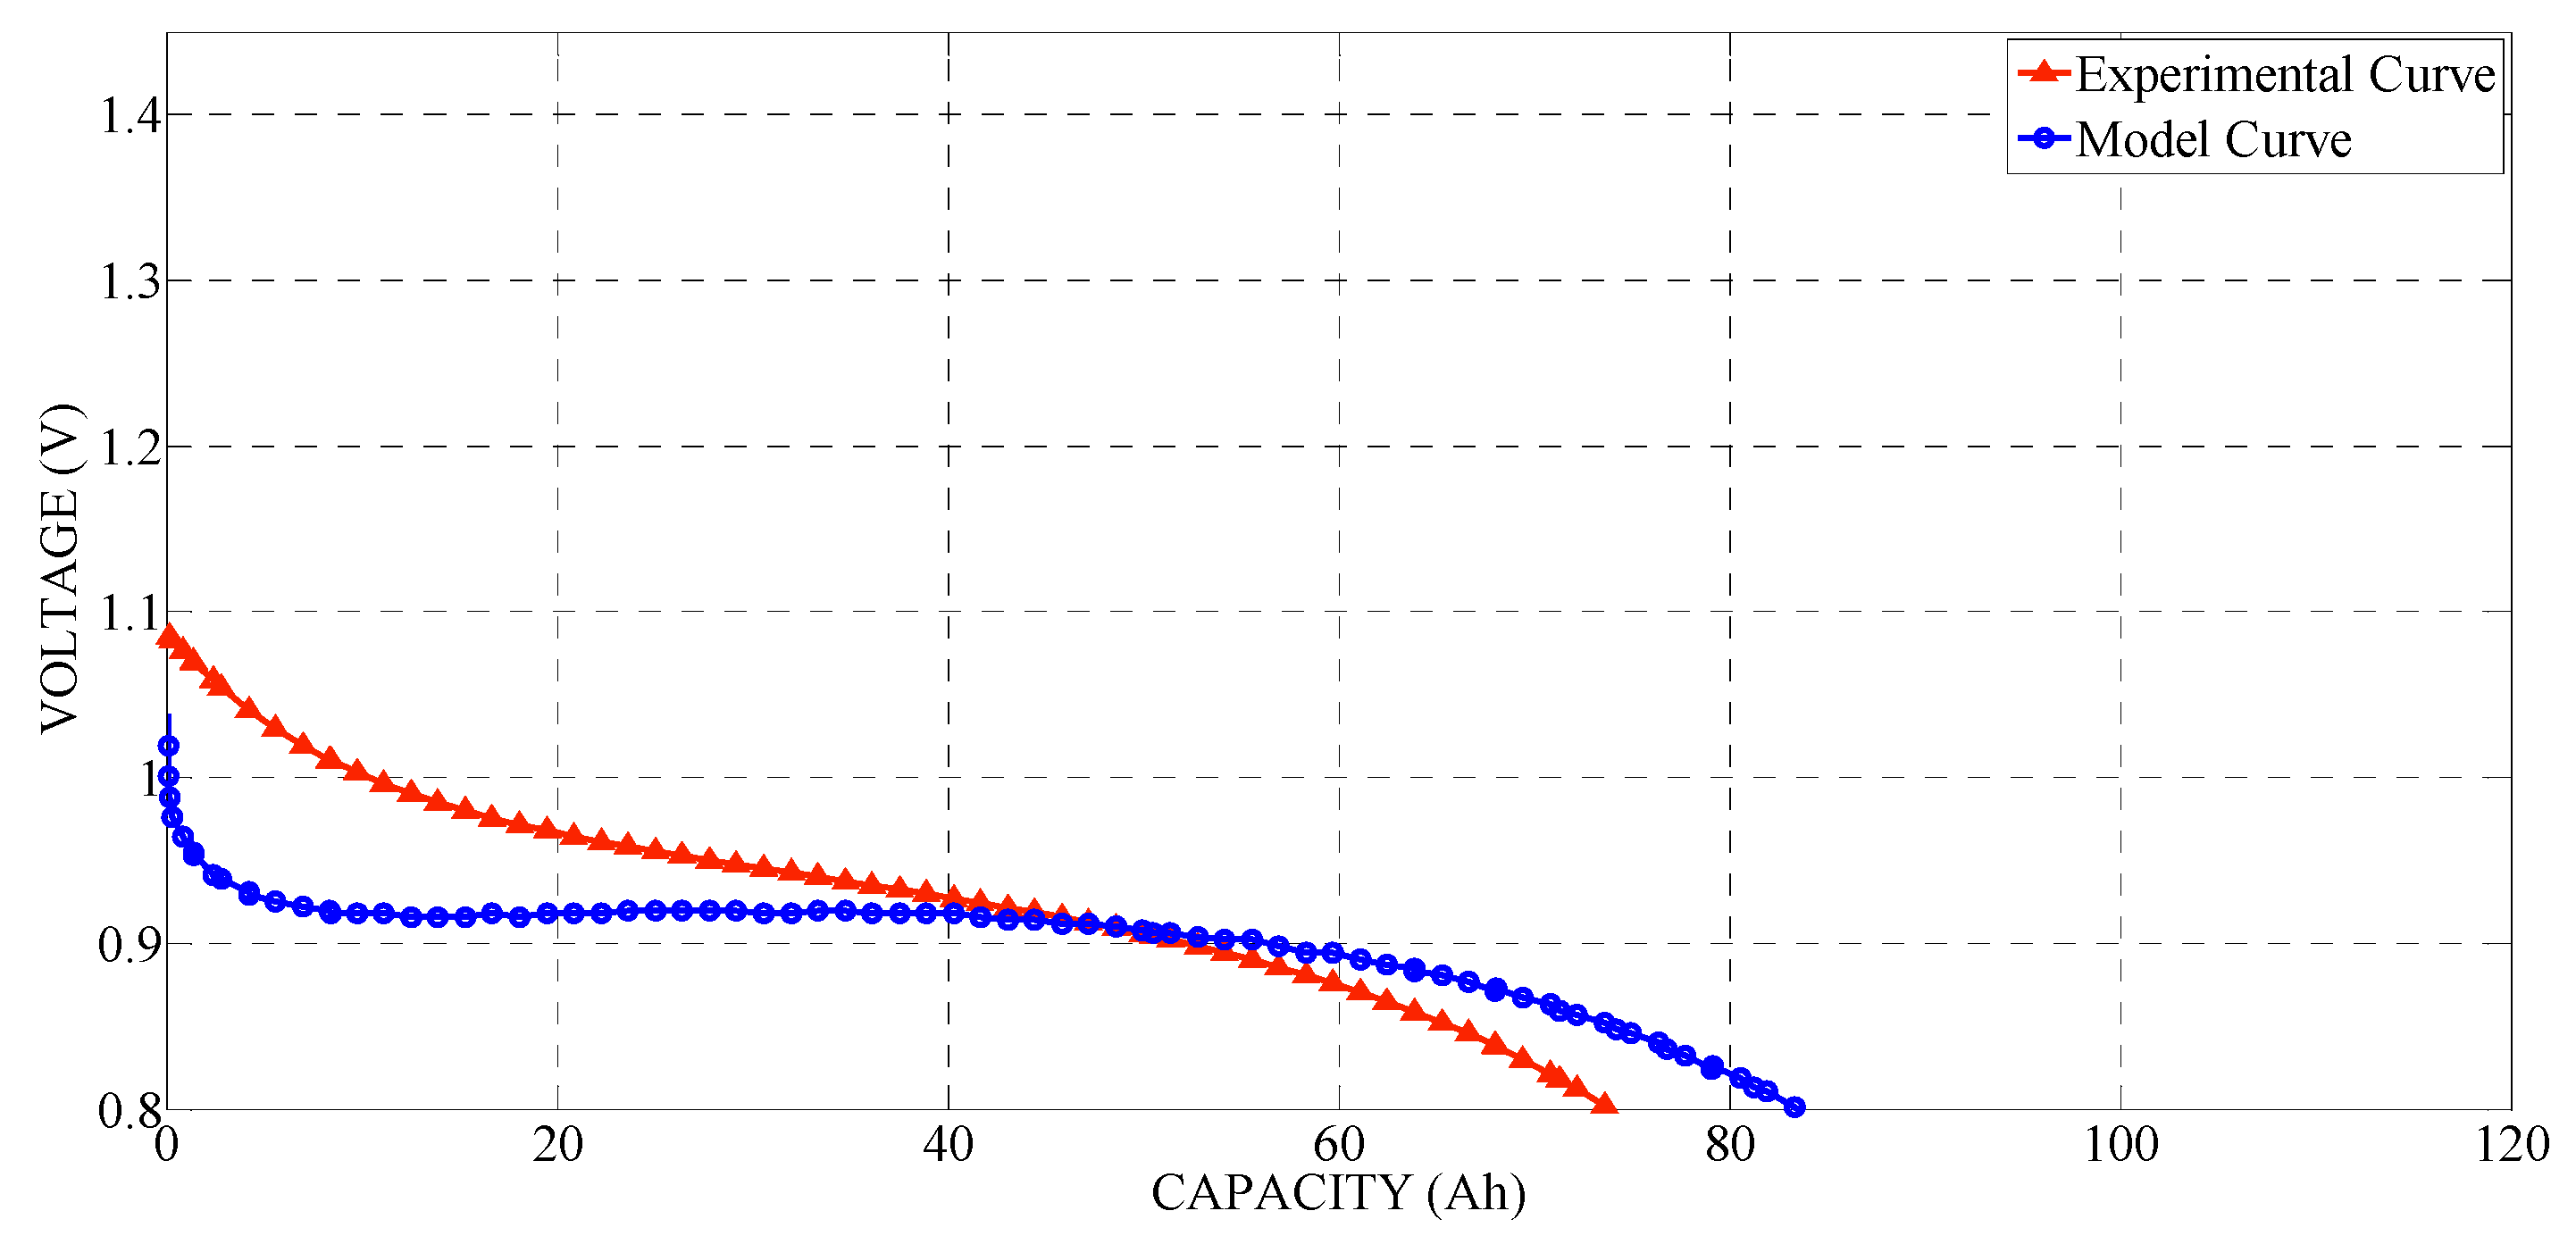
Figure 18, Figure 19, Figure 20 and Figure 21 show the results of the battery discharge simulation: 0.2, 1, 2, and 5 C. The profile of the experimental data is compared to that of the model data. The experimental data are the actual battery discharge data measured by the manufacturer through the Ni-MH battery discharge experiment. Regardless of the discharge current, the results indicate that the obtained parameters can correctly represent the Ni-MH battery model. Therefore, it can be seen that the battery model is almost the same as the actual model characteristics.
3. PV Battery Hybrid Systems
The control method of the converter and inverter is developed using UDM from PSCAD. The converter control technique applied the MPPT technique to maximize the output of the PV system. The inverter control technology is applied to control the output of the PV battery hybrid system. It is developed so that the user can easily modify the control technique of the converter and inverter. Therefore, it is possible to check the performance by applying various techniques and can be used for new technique development.
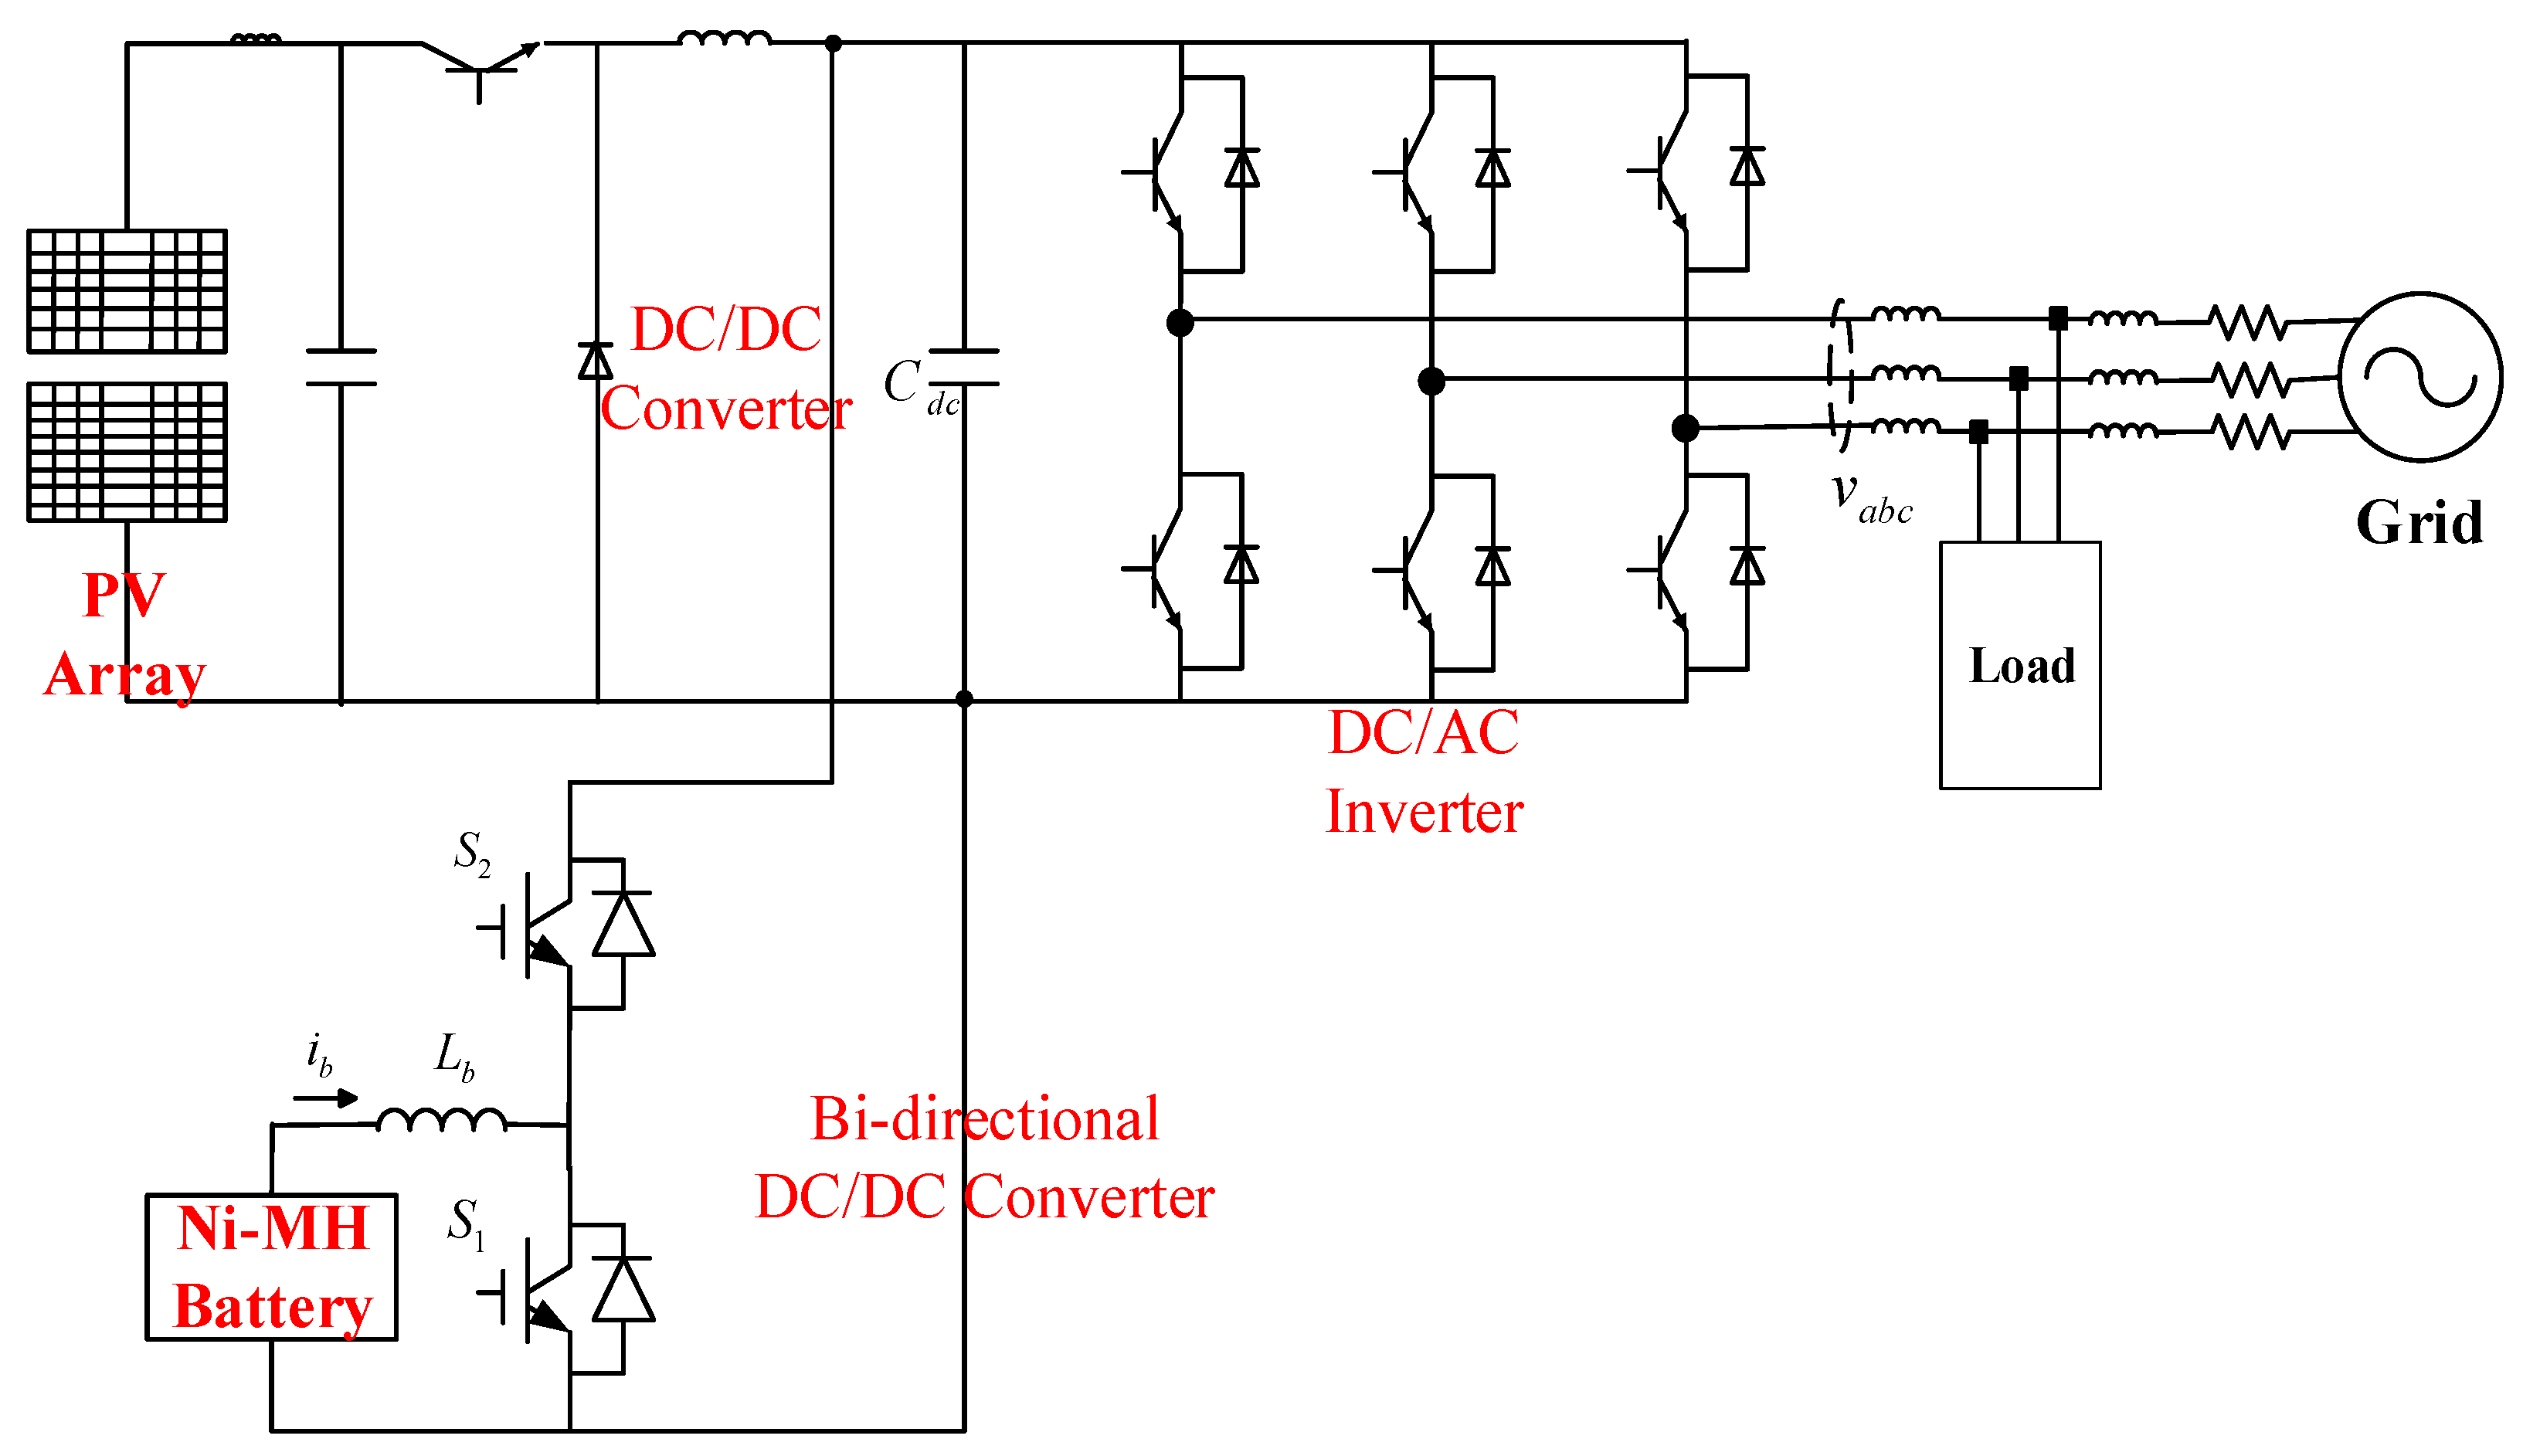
Figure 22 shows the configuration of a PV battery hybrid system. The PV array and the battery are each connected to a common DC bus through a DC/DC converter. Then, they are interconnected to the AC grid through a common DC/AC inverter. BESS can balance between PV generation and load demands through charging and discharging. The PV system is intended to maximize PV generation output. The BESS is used to control the DC link voltage. The inverter aims to control the system output. The PV system, BESS, and inverter each have independent control objects, and the whole system works safely through the control of each of its parts.
3.1. PV Generation System
When the PV source is interconnected to the grid, it is necessary to convert the DC power into AC power using electronics. Further, to improve the efficiency of the PV power generation system, it is also necessary to control the PV array to generate maximum power in a specific environment. For the PV system, maximum power point tracking (MPPT) is realized by controlling the DC/DC converter.
MPPT aims to operate the PV generation at the maximum power point using a control algorithm. Many MPPT algorithms can be used, including the constant voltage tracking method, perturbation and observation (P&O) method, INC-CON method, and variable step size method. Of these methods, the P&O method is selected because it does not require more reliable measurements than the other methods.
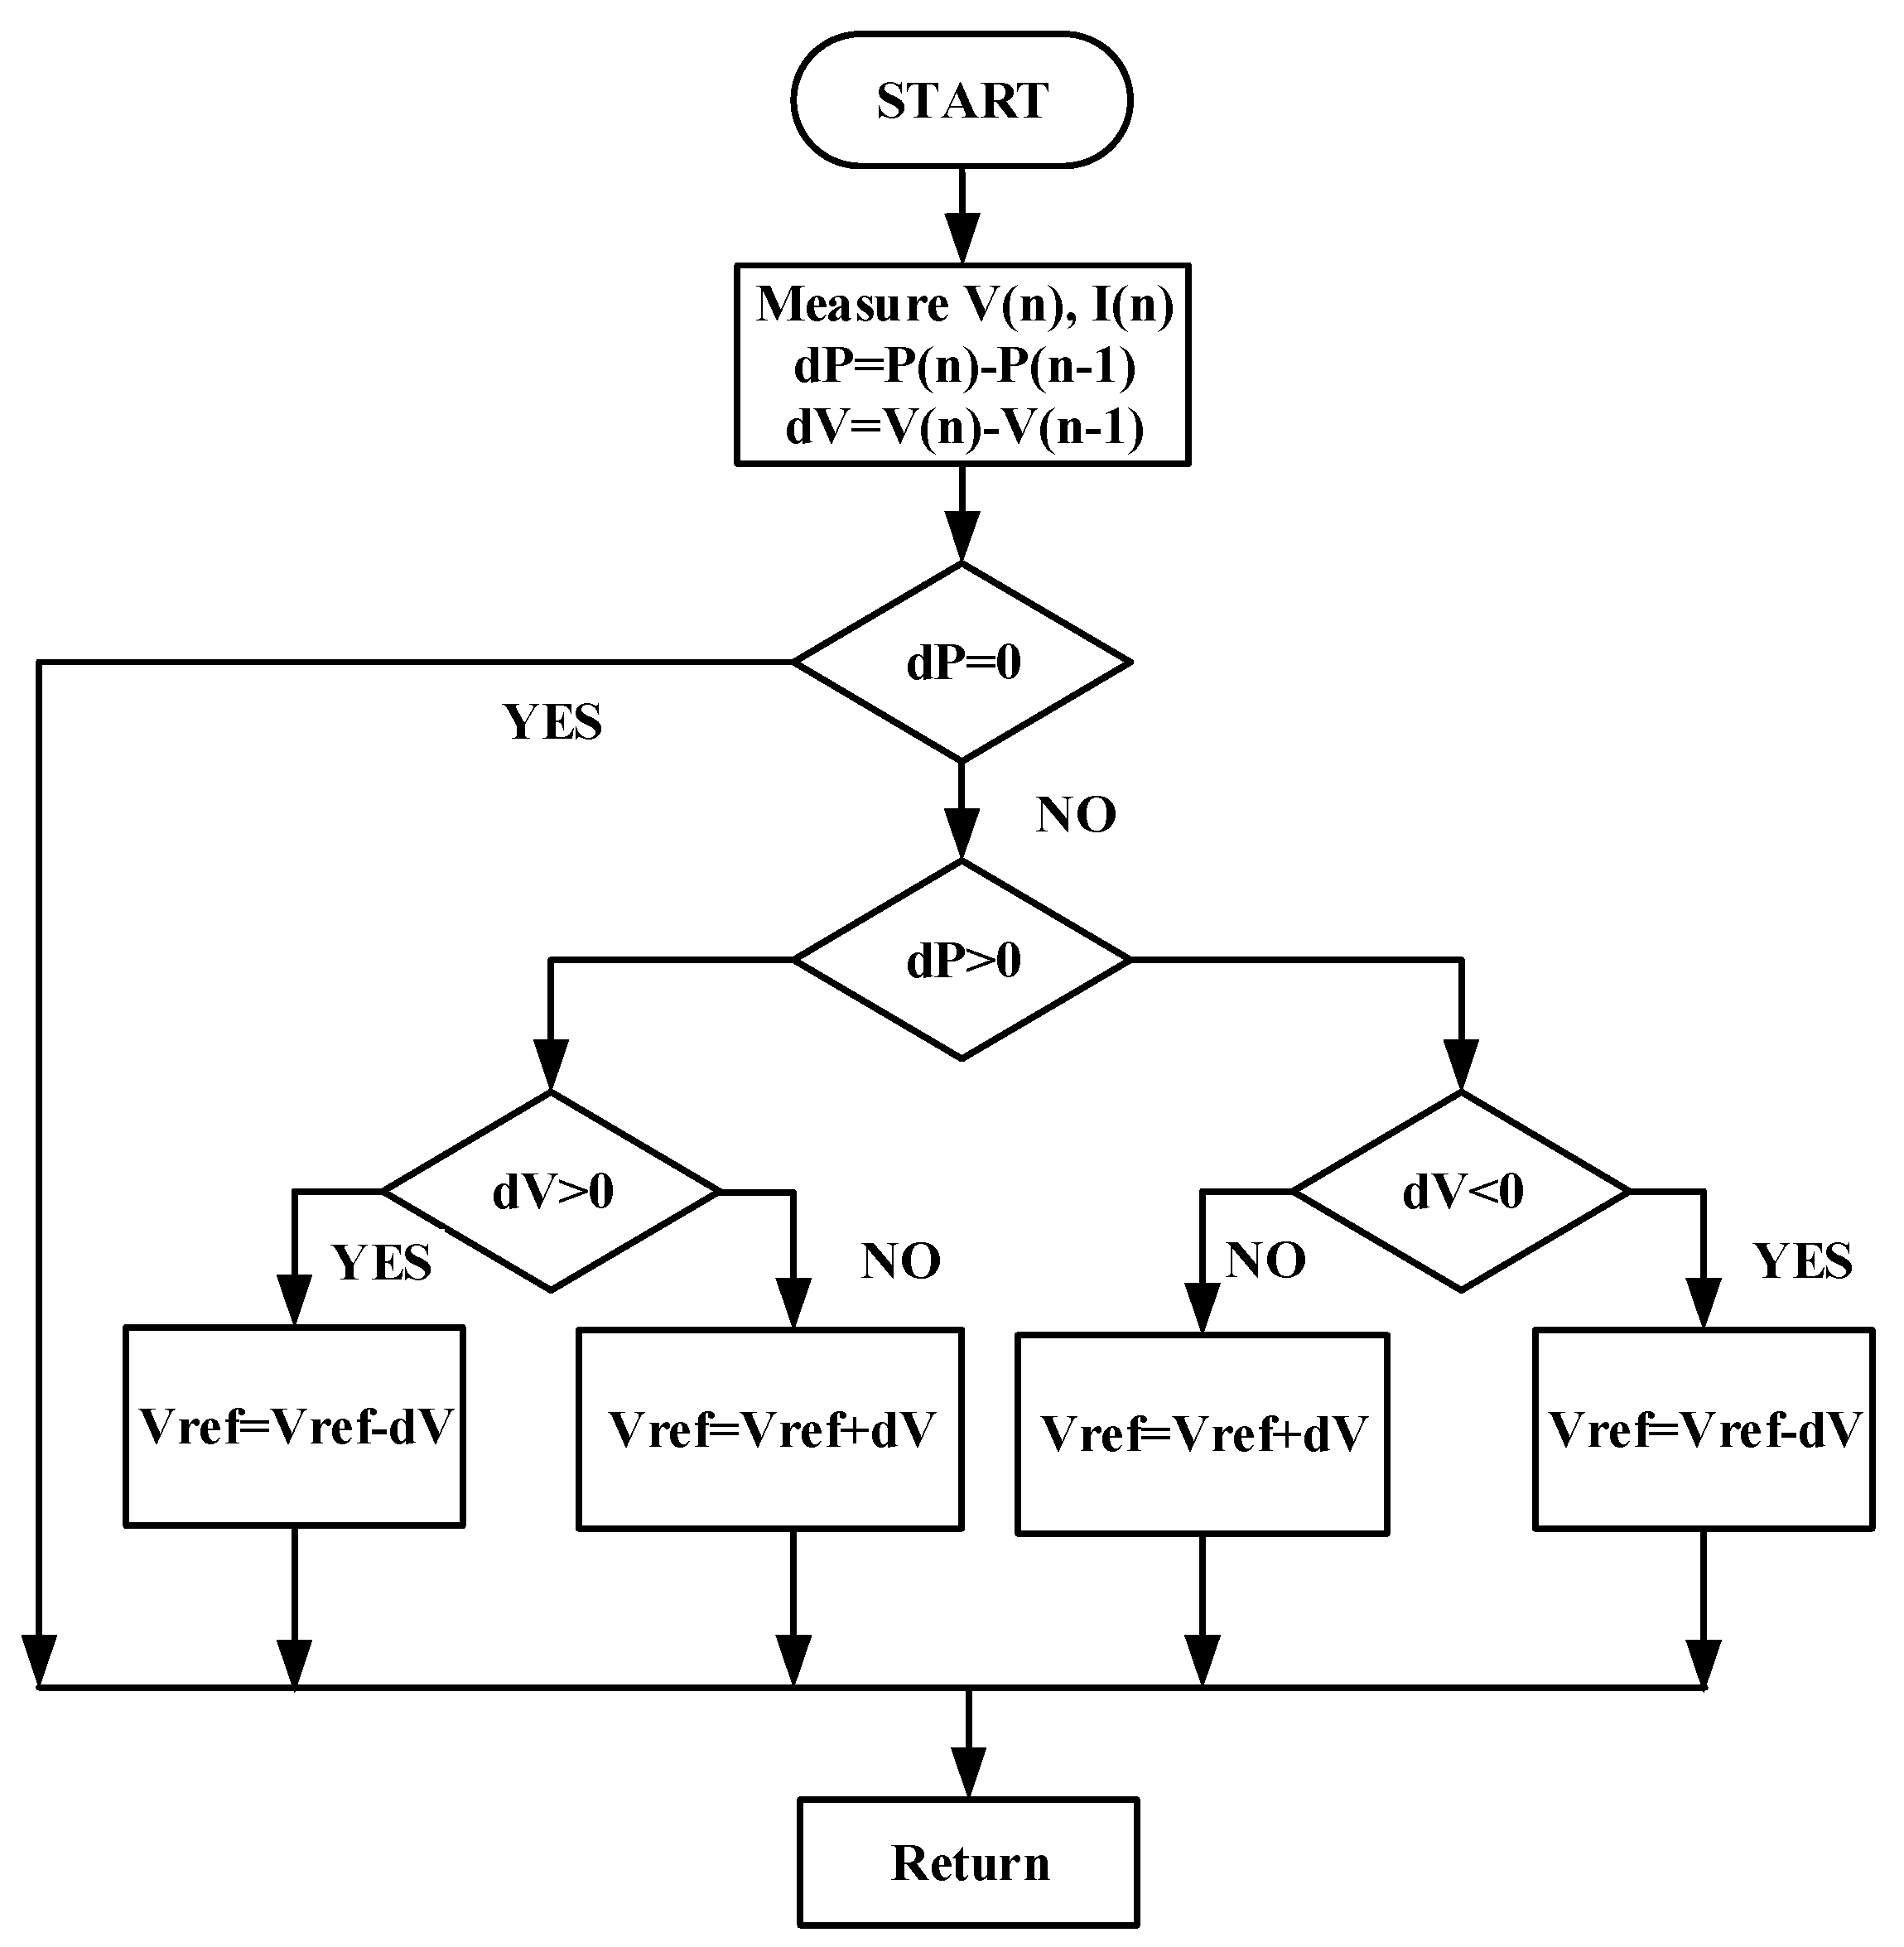
The P&O algorithm works by continuously measuring the terminal voltage and current of the PV array, then adding a small disturbance to constantly disturb the voltage, and observing the change in output power to determine the next control signal. If the power increases, the fluctuation continues in the same direction in the next step: otherwise, the fluctuation direction is reversed as shown in Figure 23. For the P&O algorithm, large perturbations can be used to quickly track the maximum power point, but the resulting accuracy is low. Conversely, using small perturbations increase the accuracy of the algorithm, but it takes a long time to track the maximum power point. In the characteristic curve of the PV generation, the power increment and the voltage increment have the following relationship [31]:
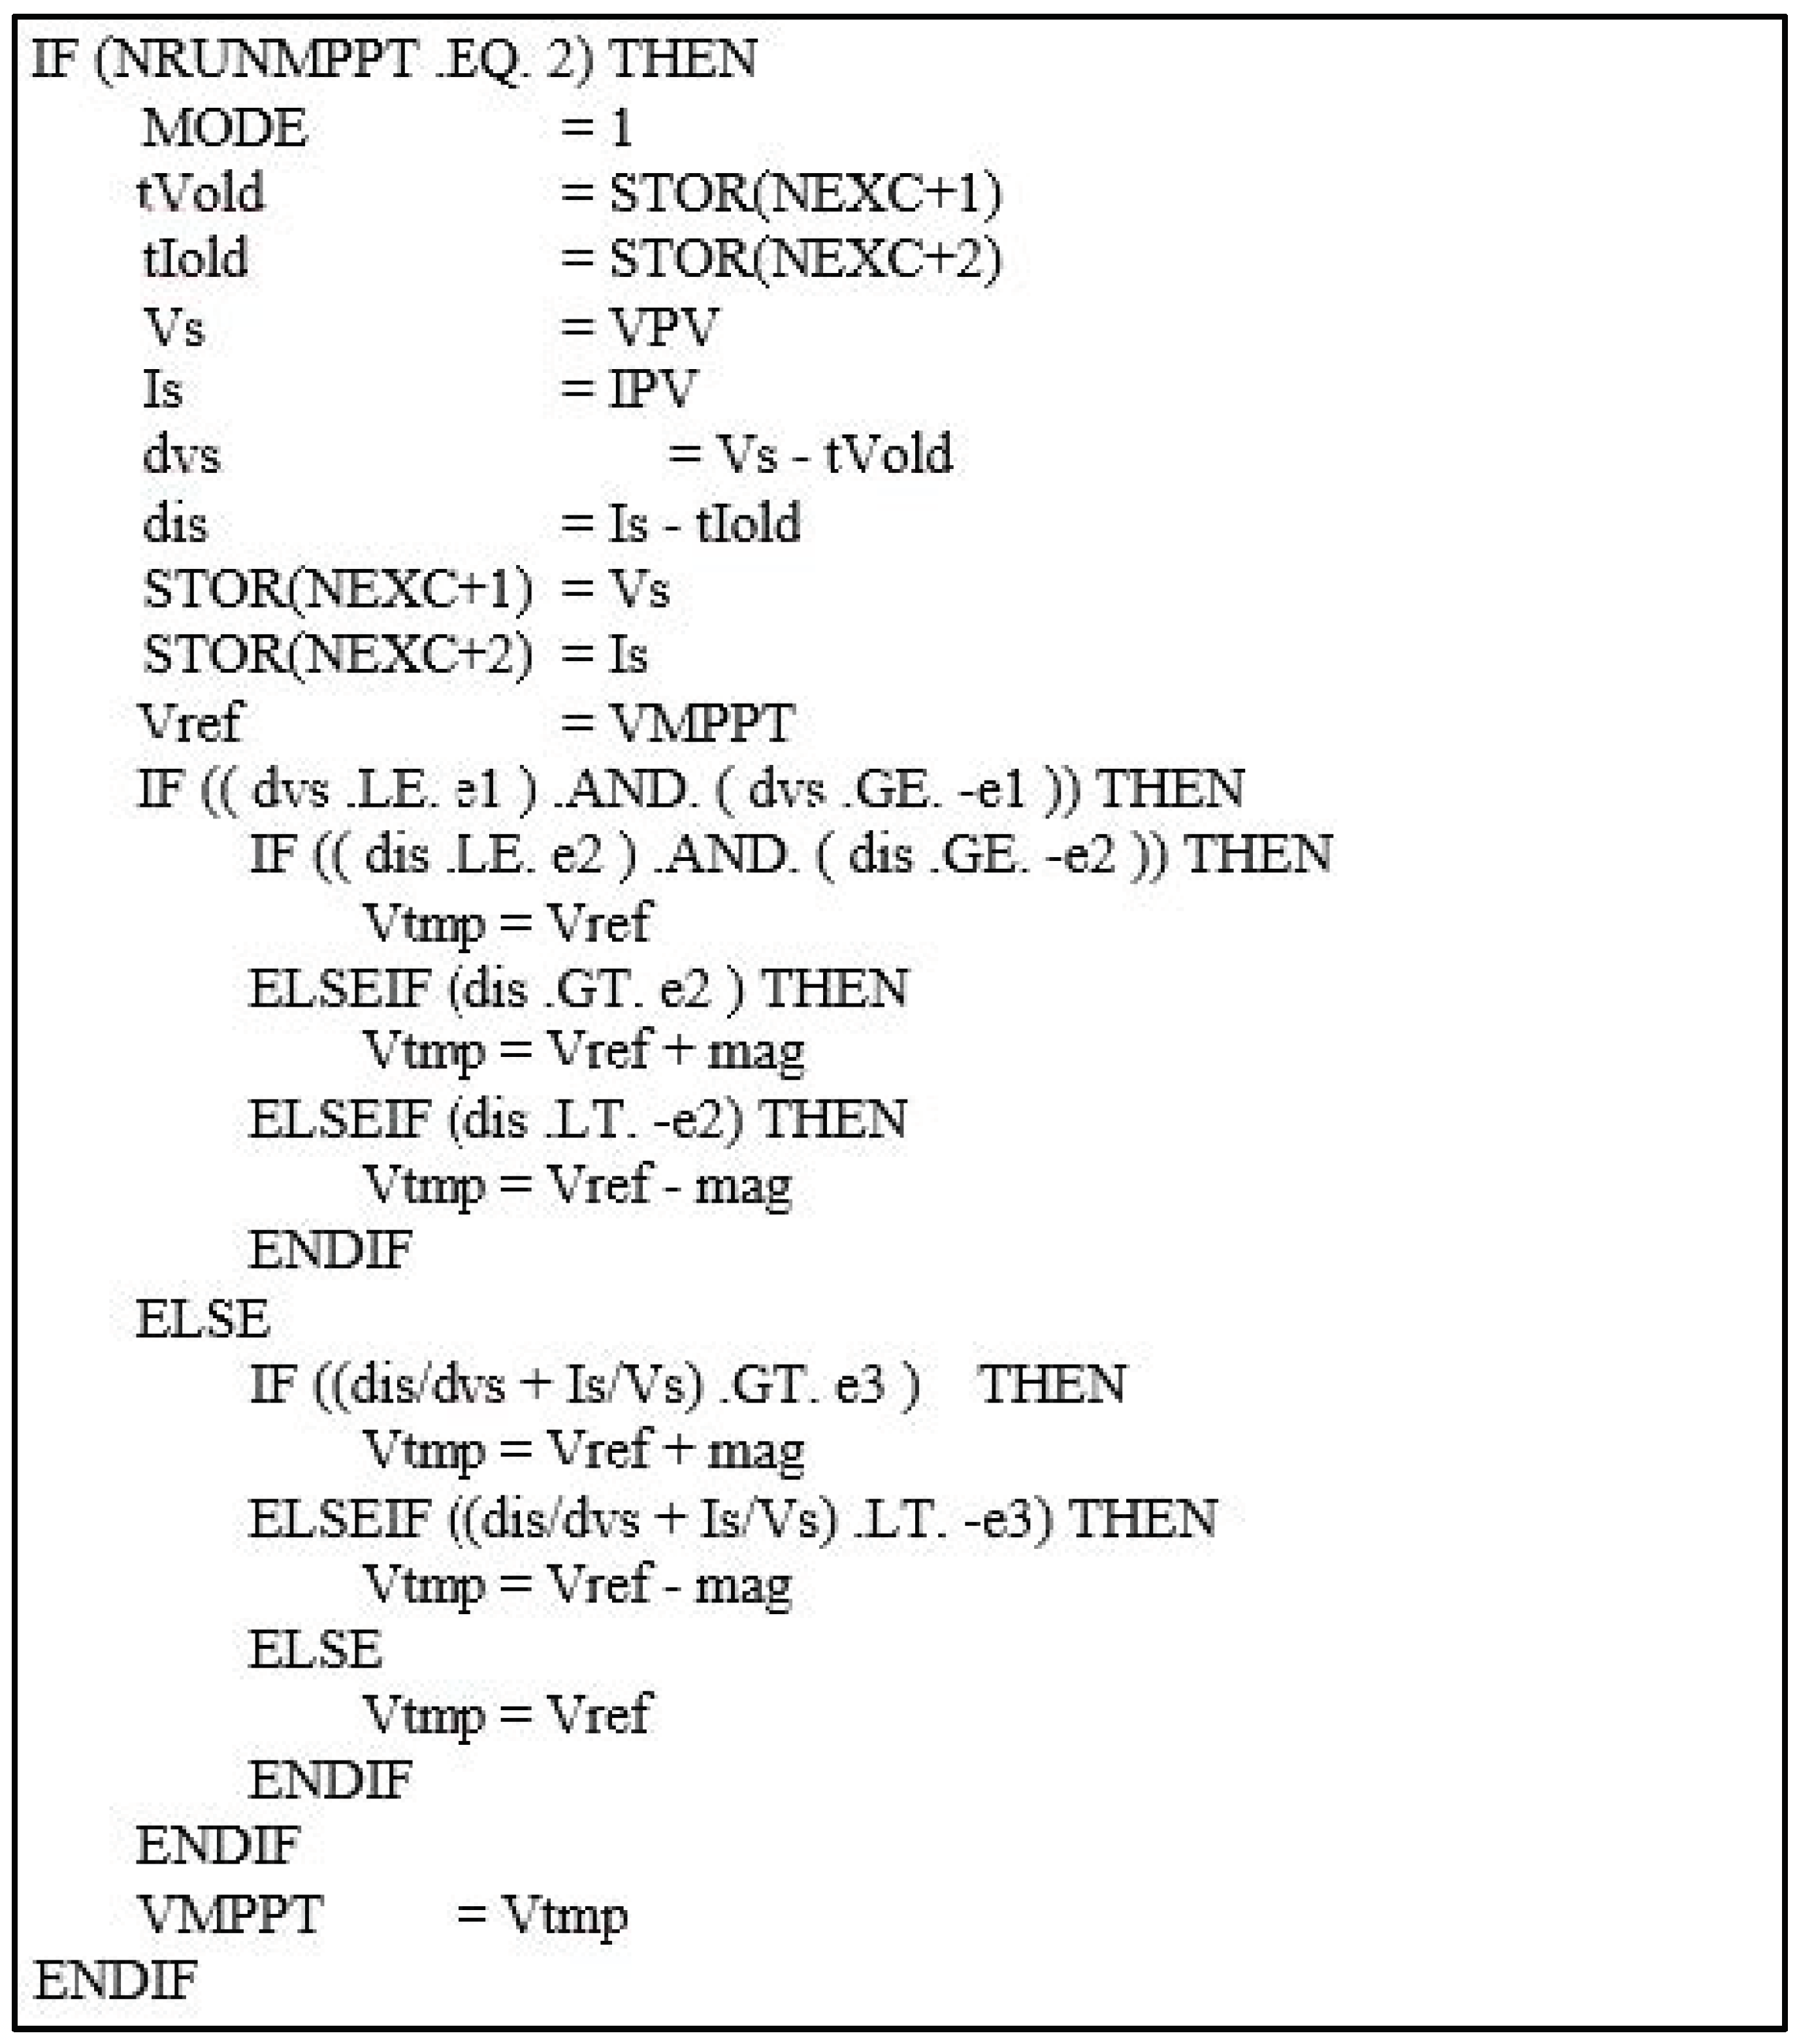
As shown in Figure 24, the MPPT algorithm is implemented in the Fortran language in the UDM of PSCAD. In this part, the MPPT algorithm code is shown while excluding the initialization part and the variable definition part. If this part is modified with the other algorithm, it is possible to verify the other algorithm.
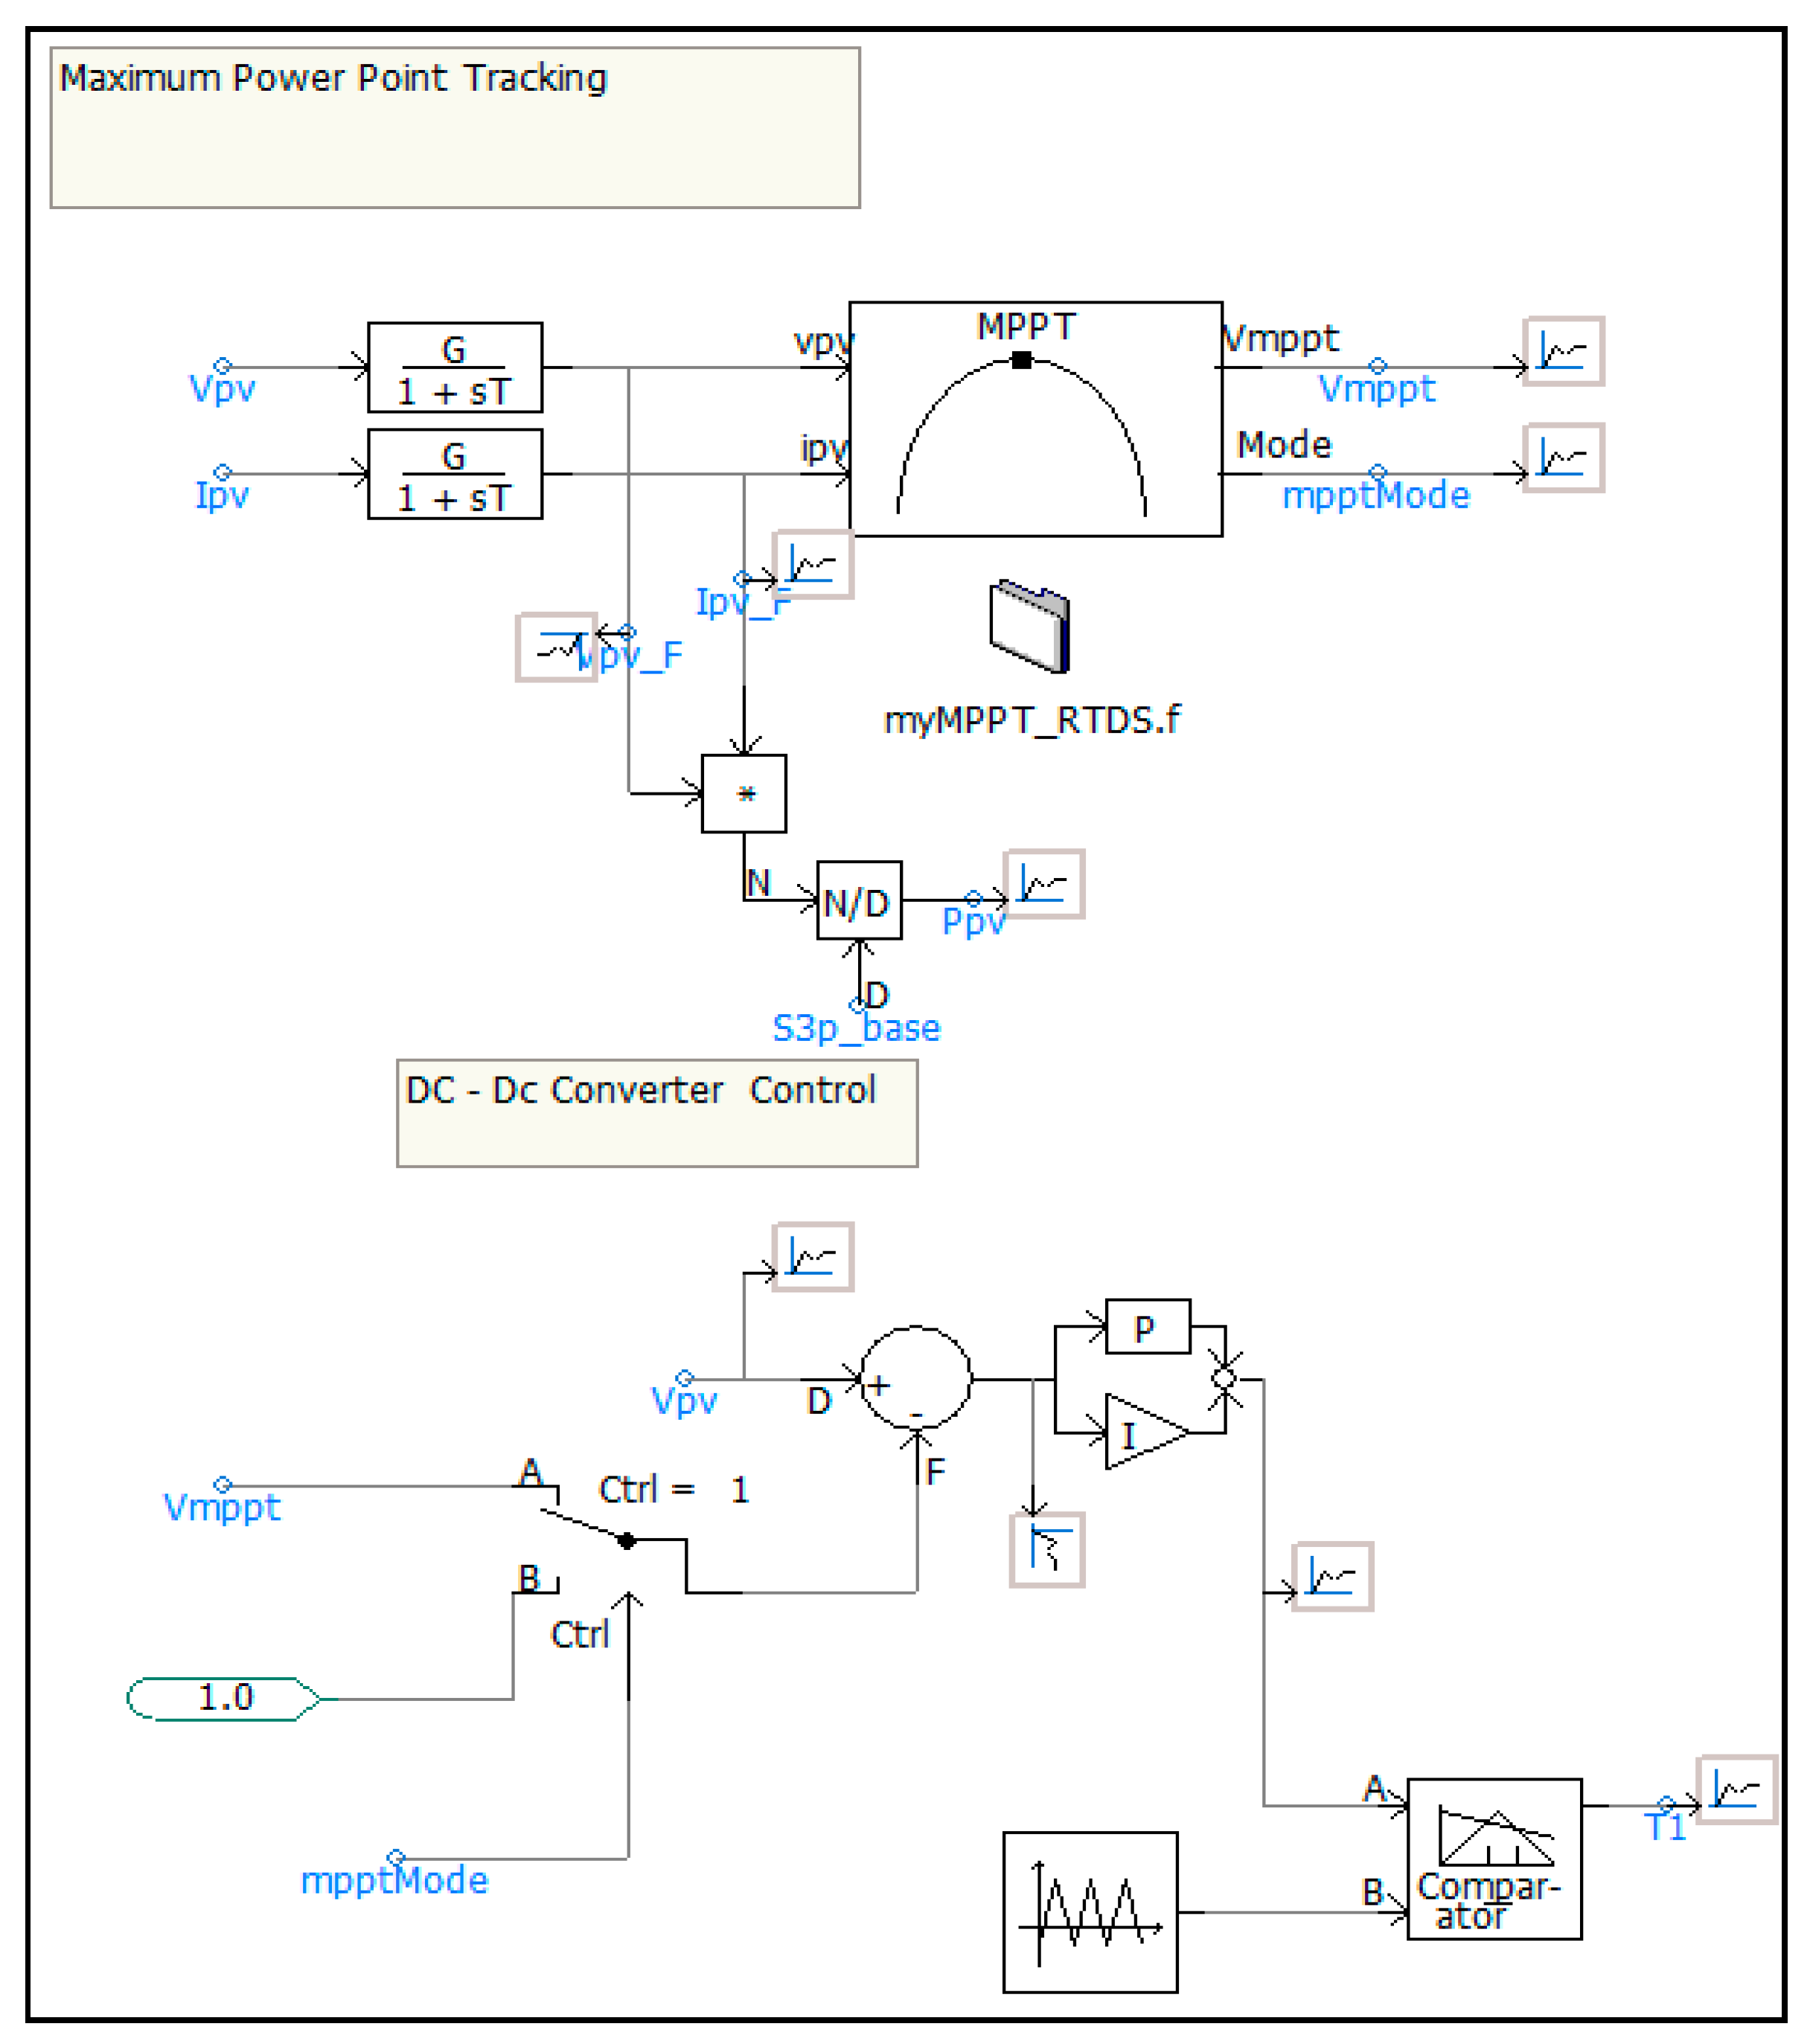
For PV generation systems, a buck chopper circuit is used as a DC/DC converter. Due to the high output voltage of the PV cell series, a buck circuit can be used to convert a high voltage PV array. Capacitors are commonly connected between the PV array and the buck circuit, and these are used to reduce high-frequency harmonics. Figure 25 shows the configuration of the buck circuit and its control system.
The duty cycle D can be adjusted to control the PV generation to operate it at its maximum power point. Control schemes include PI control. Figure 26 shows the DC/DC converter control scheme in PSCAD.
3.2. Battery Energy Storage System
The BESS consists of a battery, a bidirectional DC/DC converter, and a control system. The system can work in two directions. The battery can be charged to store additional energy, and it can also release energy into the grid. In this paper, the BESS is connected to the DC bus through a bidirectional DC/DC converter in PSCAD, as shown in Figure 27. The battery acts as a power source to meet the load demands that cannot be fully met by the PV system, particularly during solar fluctuations. The battery is designed to complement the PV system output.
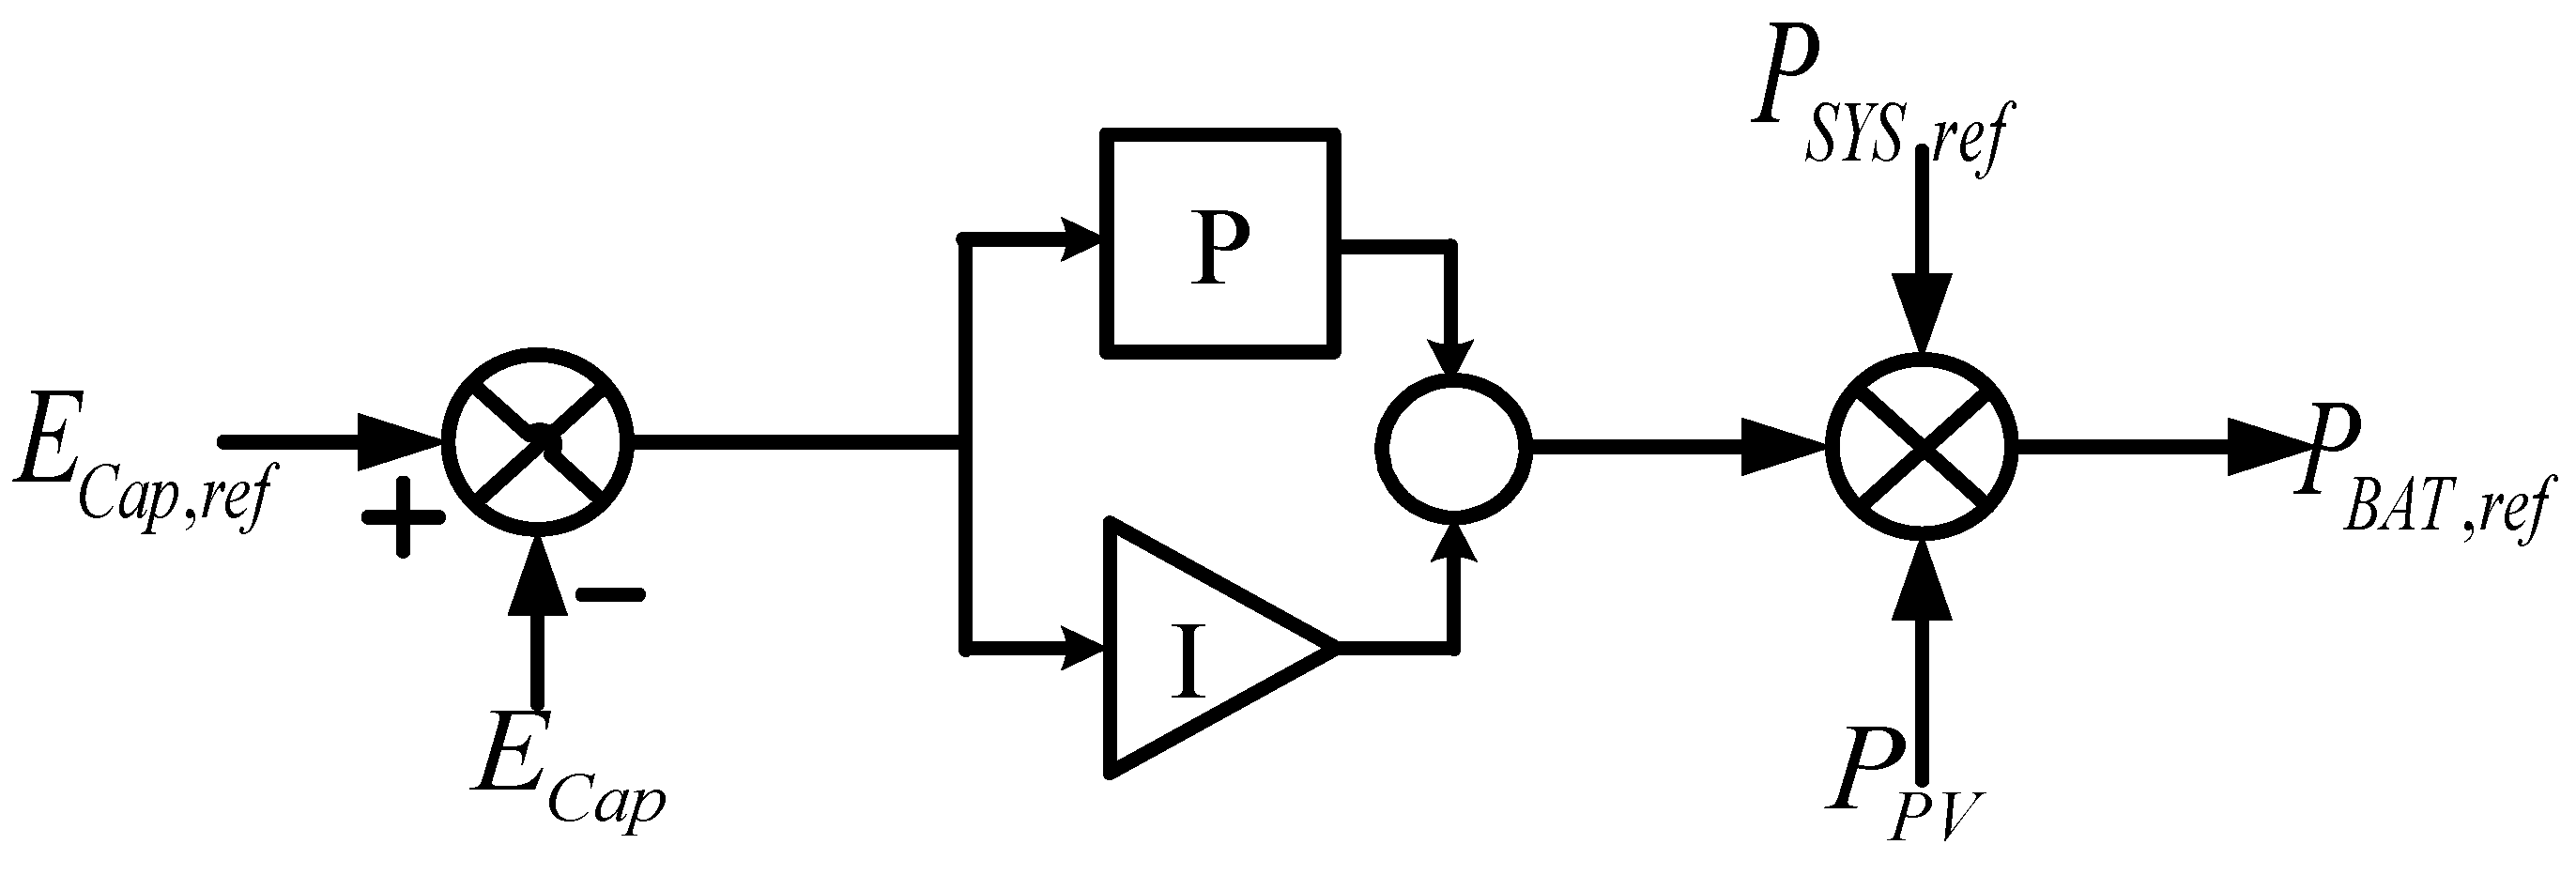
The main purpose of the battery converter is to control the DC link voltage. As shown in Figure 28, the factors that determine the reference value () for this controller are the DC link voltage (), grid power (), and PV power ().
The mode of operation for the BESS is determined by the calculated reference ().
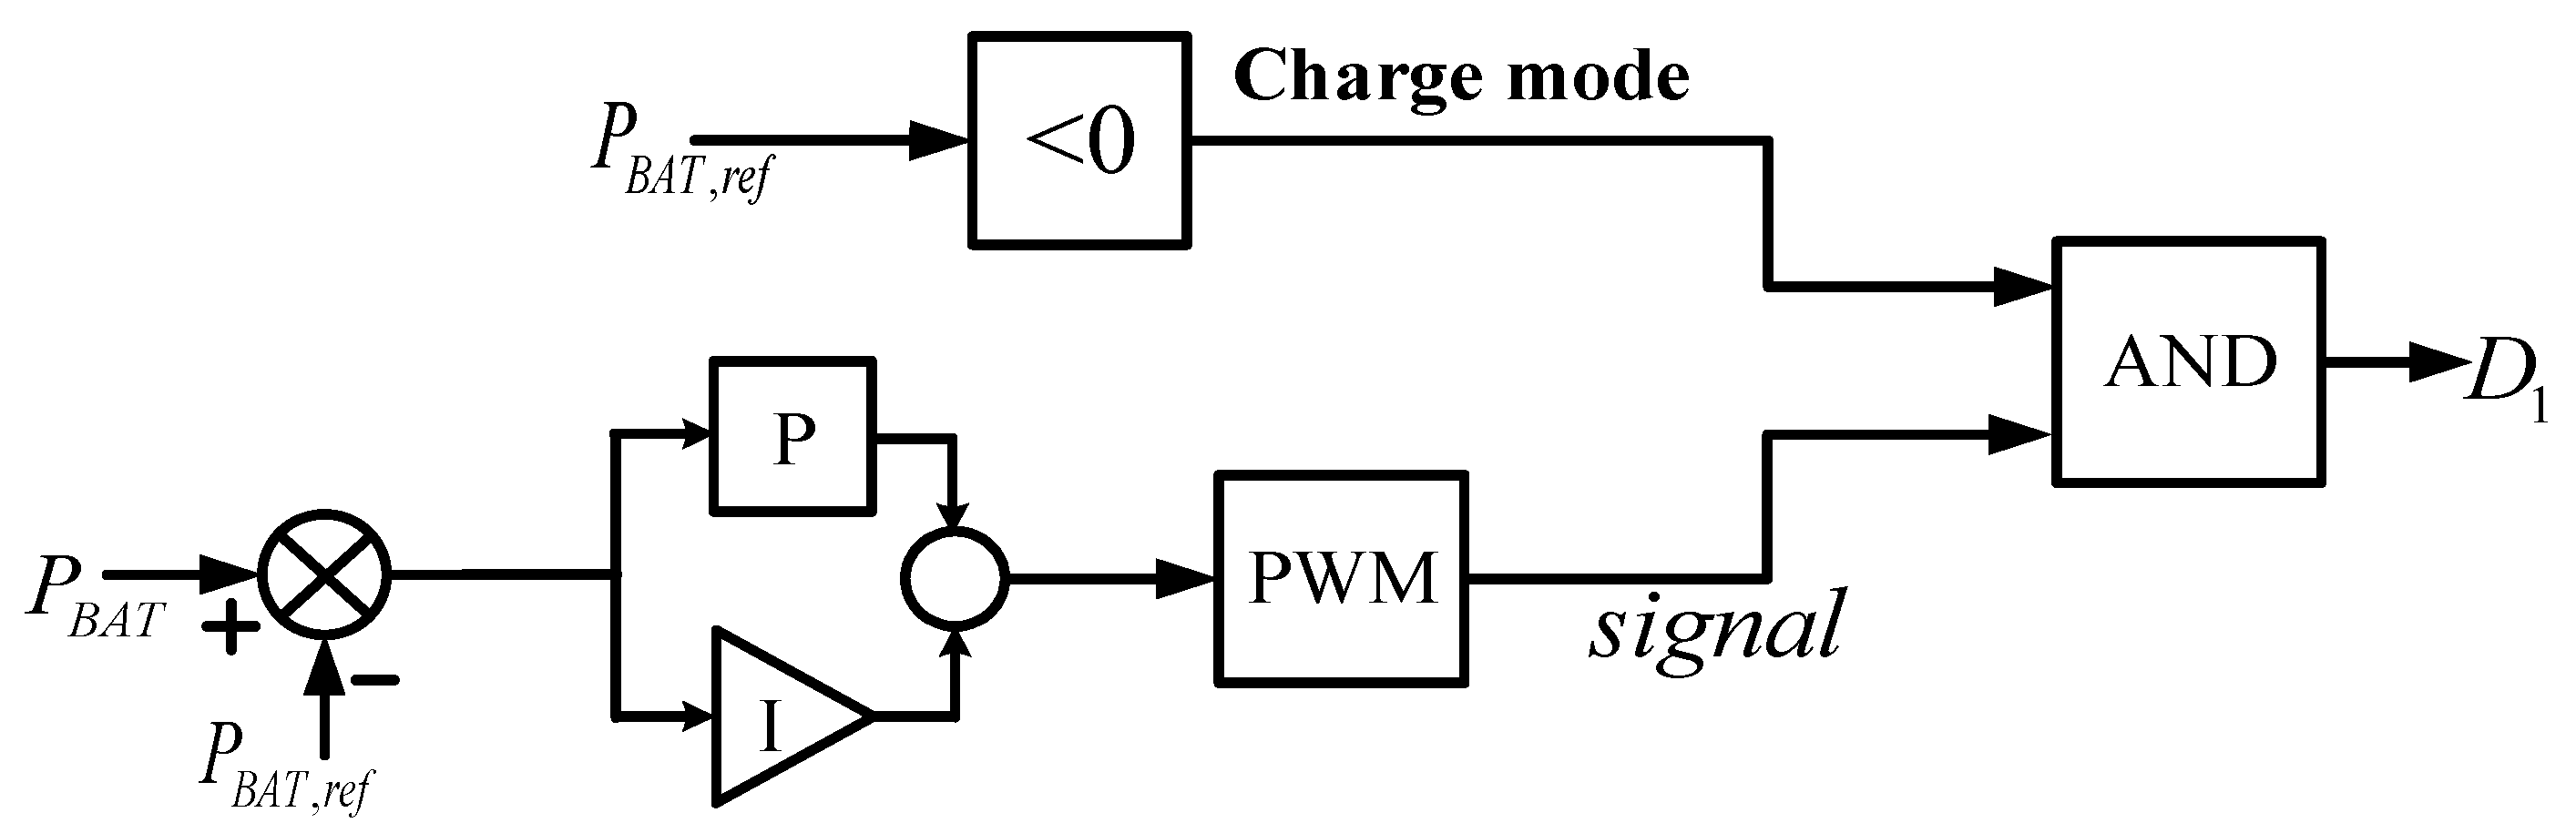
Charge mode: If the reference value () is negative, switch D1 is activated and the converter acts as a boost circuit. Figure 29 shows how to control the charge mode of a bidirectional converter.
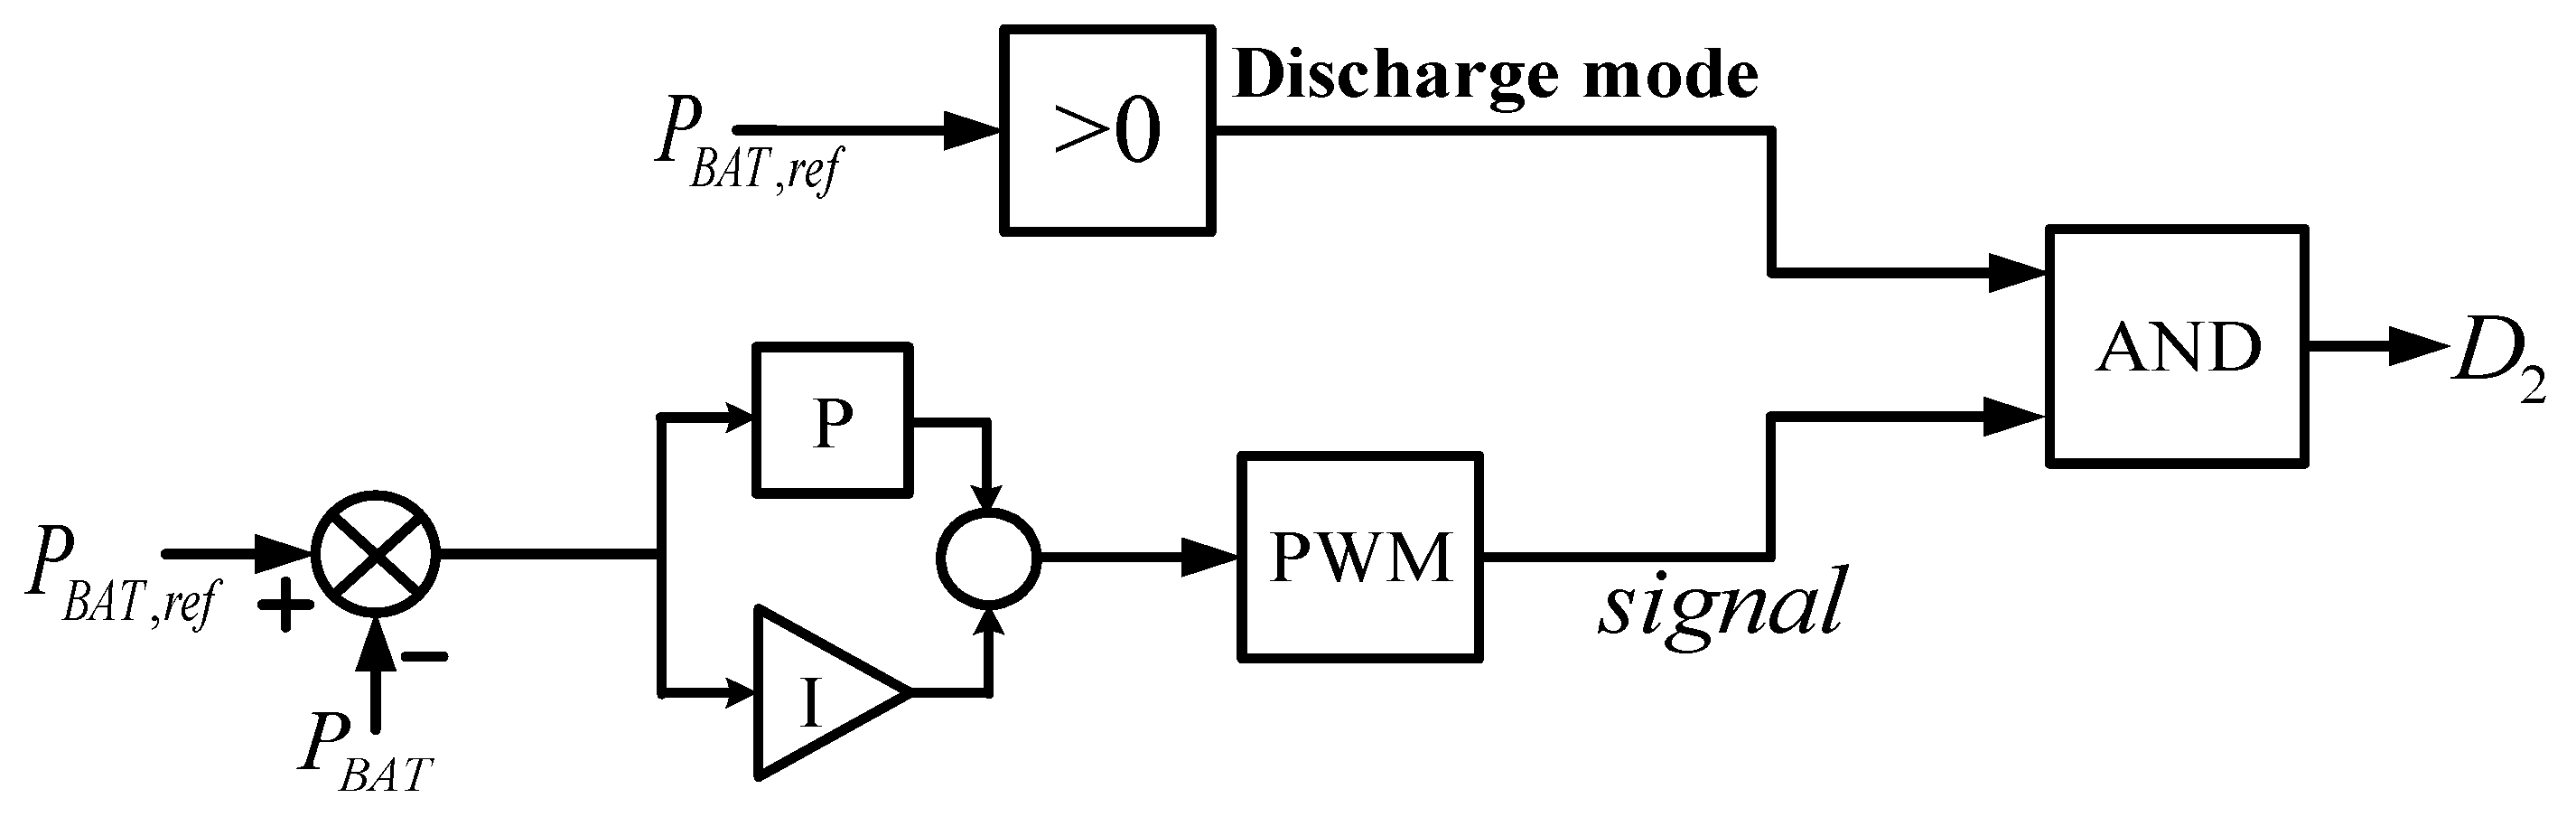
Discharge mode: When the reference value () is positive, switch D2 is activated and the converter operates as a buck circuit. Figure 30 shows the discharge mode of a bidirectional converter.
The charge and discharge control scheme is modeled by PSCAD in Figure 31.
3.3. Control of Grid-Connected Inverter
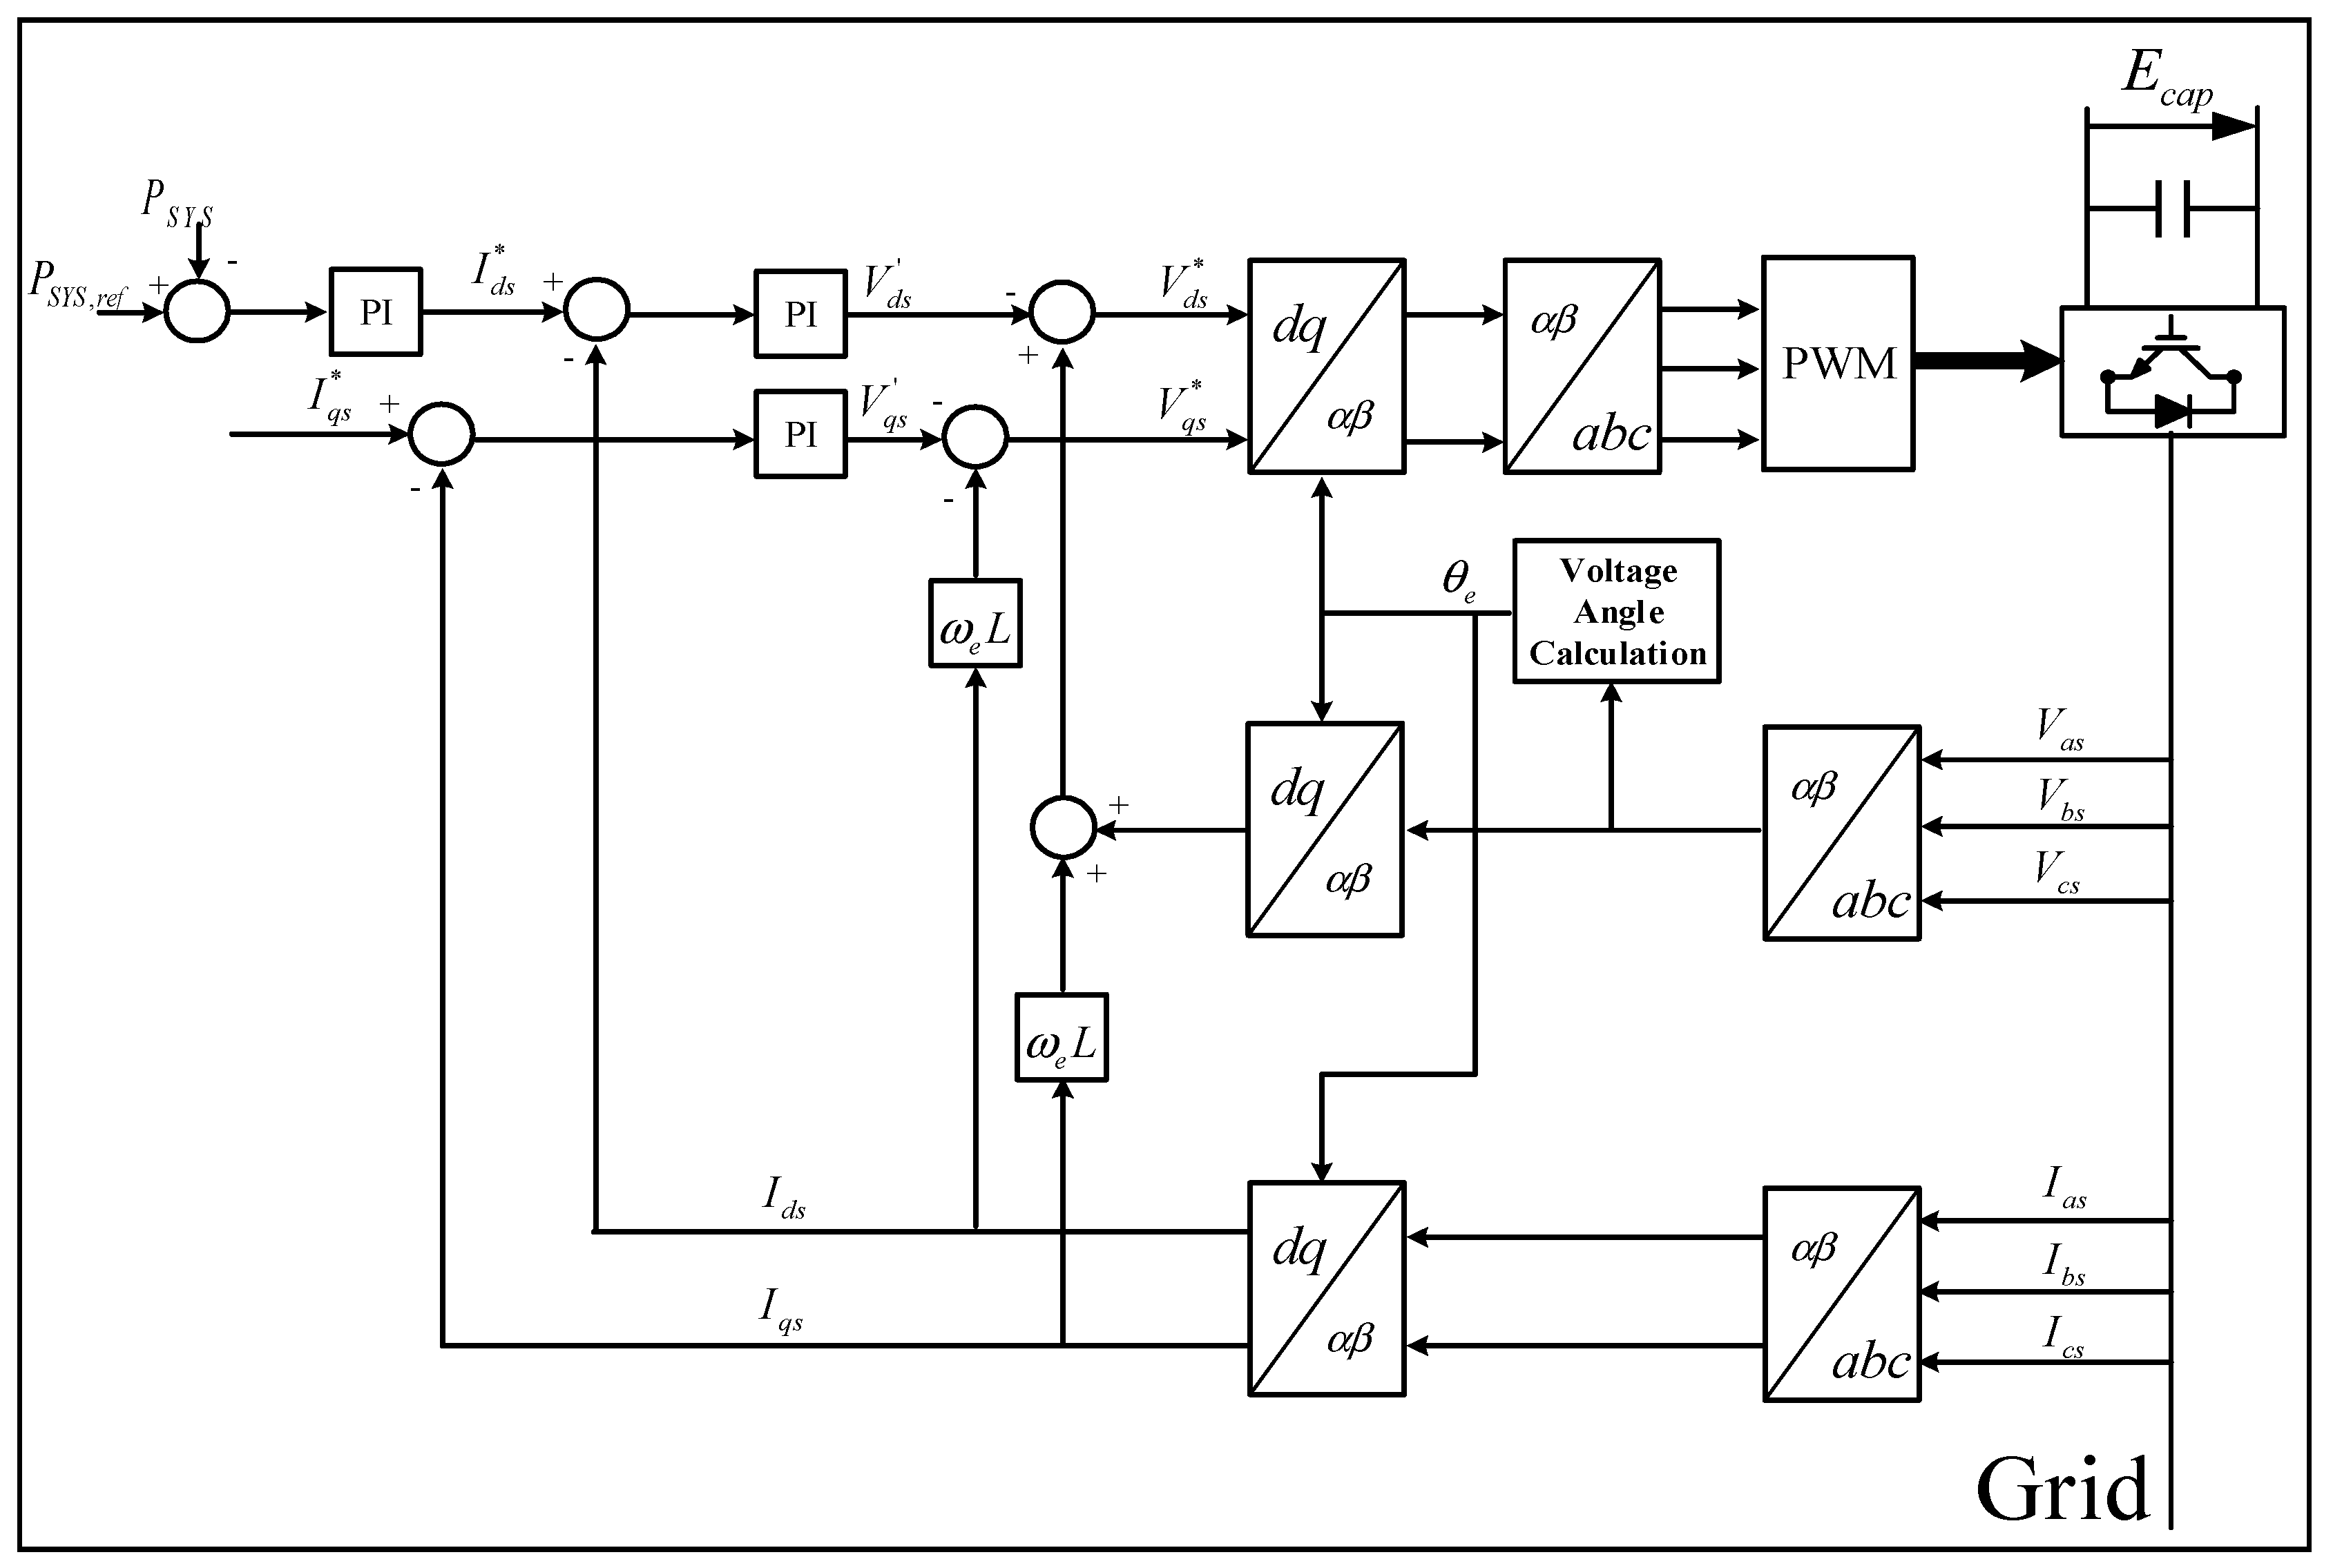
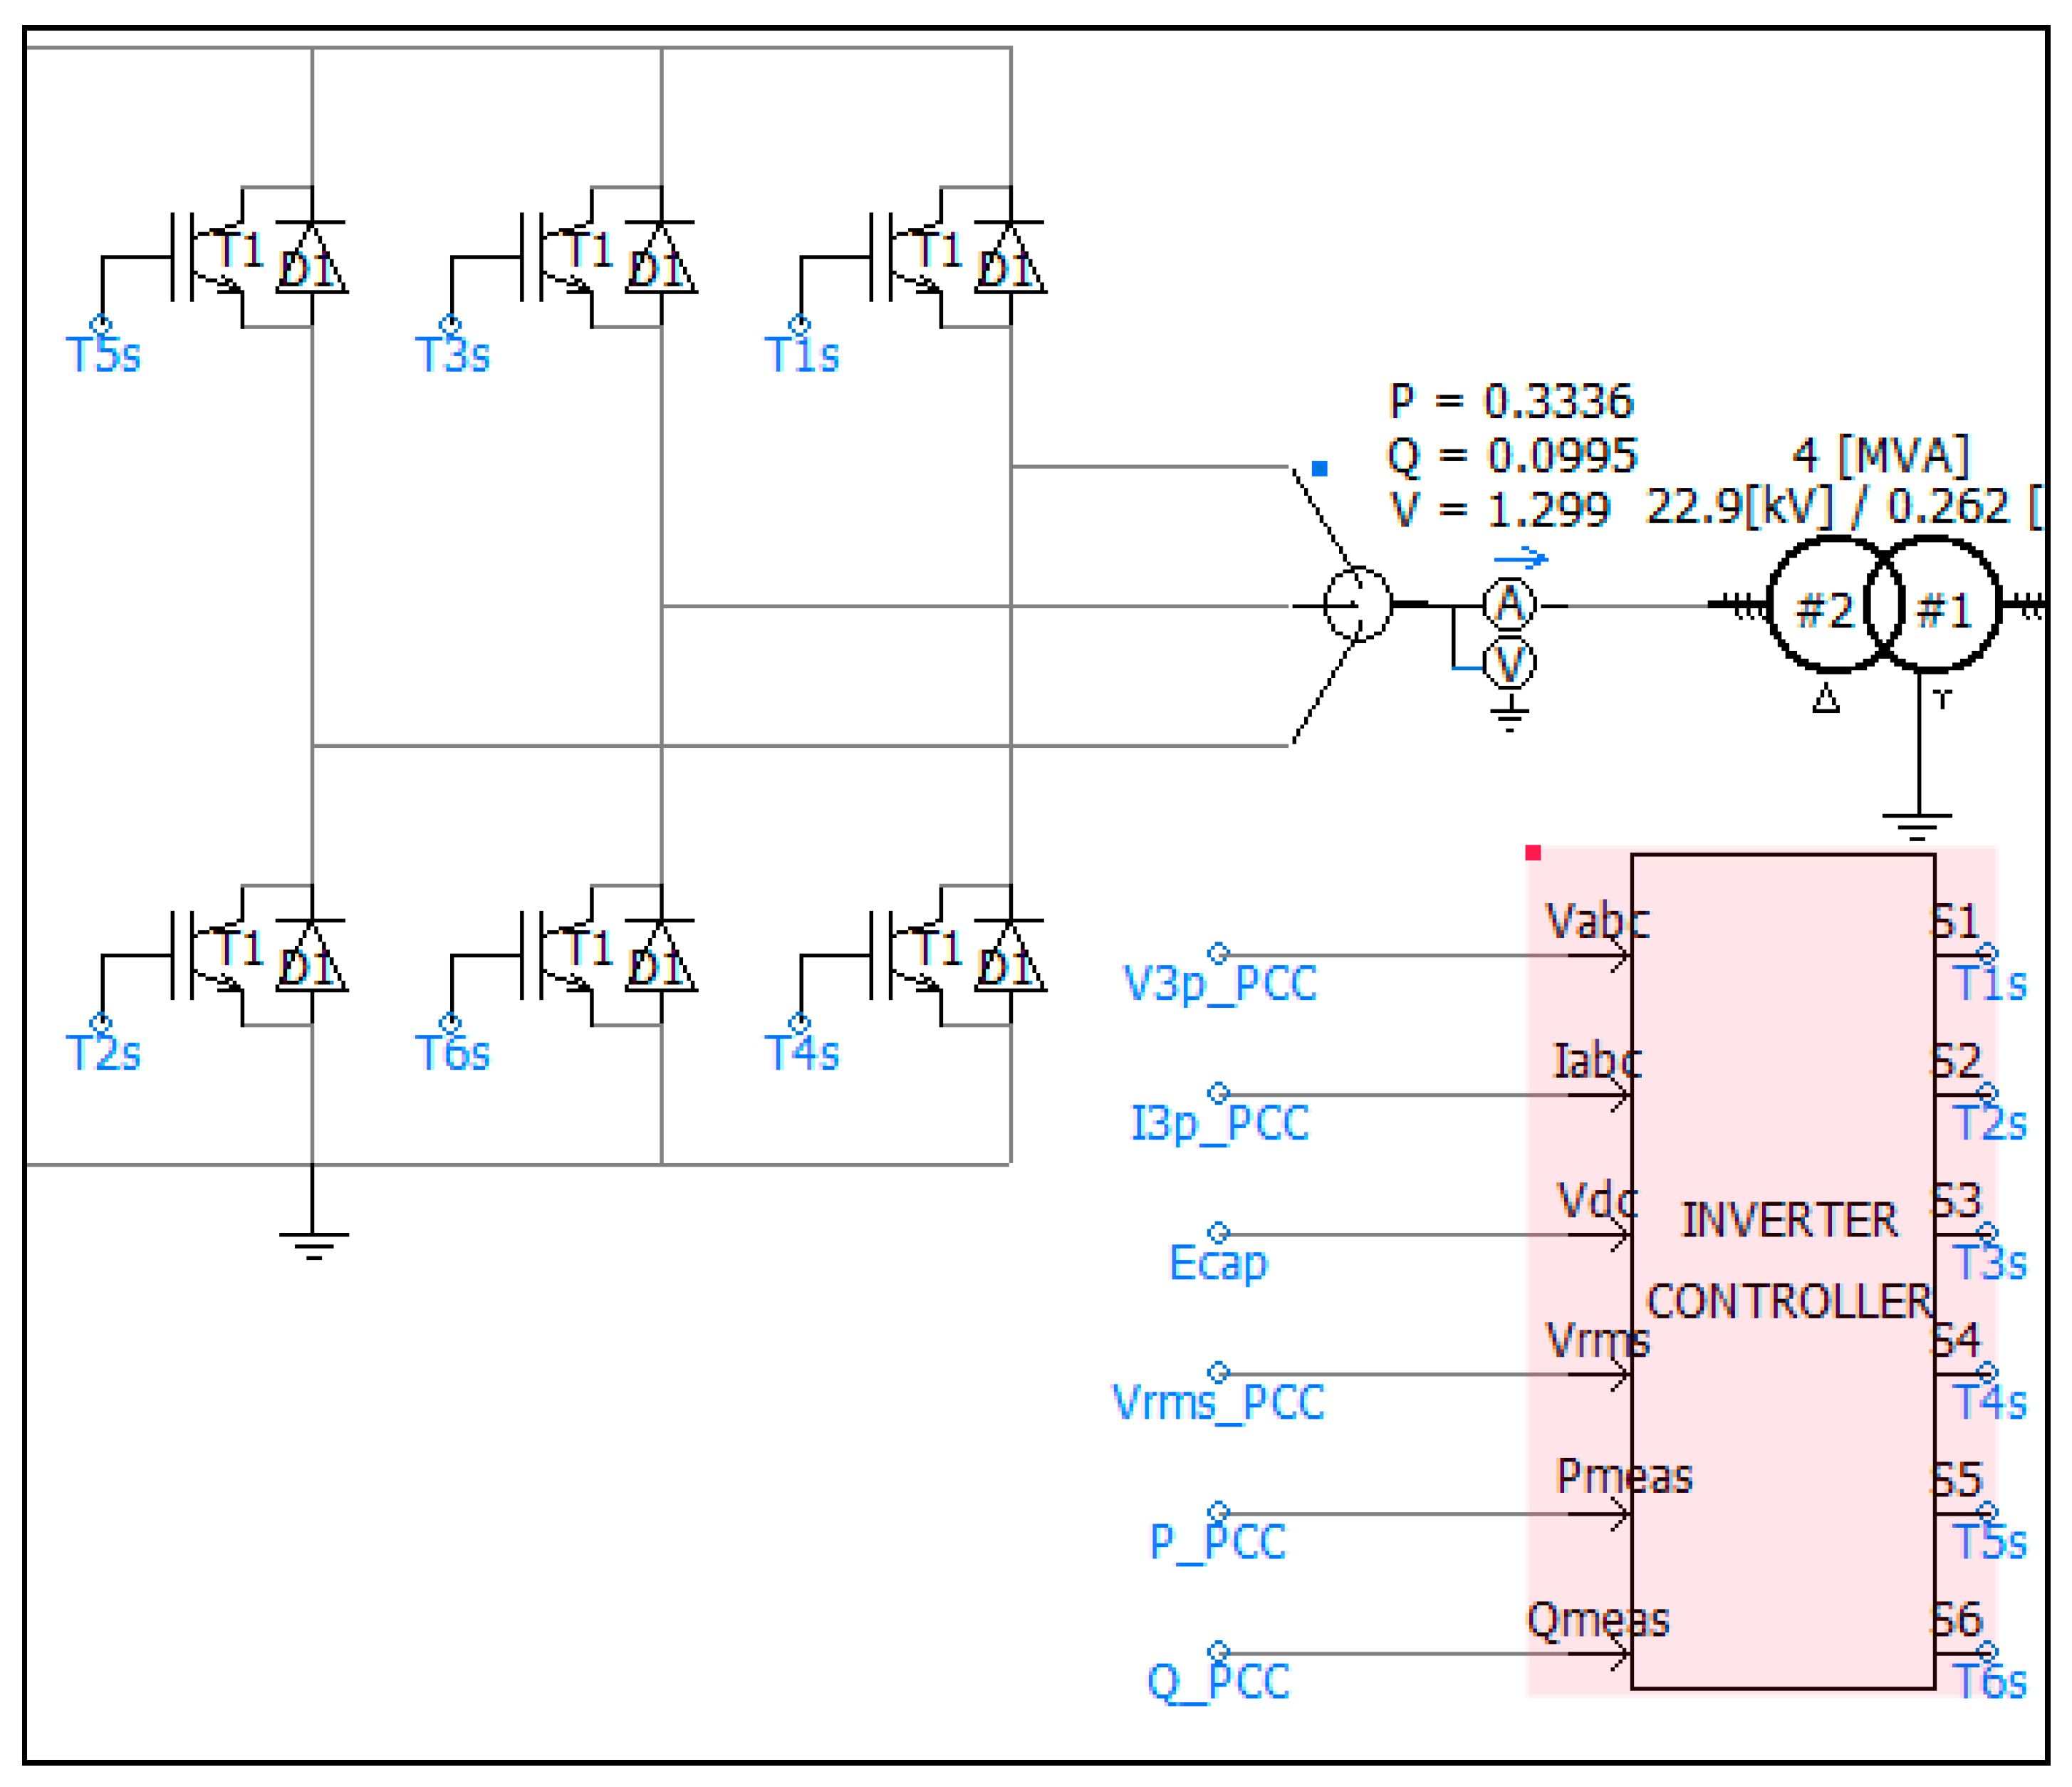
The PV array and the battery are connected to the AC grid via a common DC/AC inverter. The purpose of the inverter is to control the system output power regardless of the output of the PV generation. A vector control scheme with a reference frame along the grid voltage vector position is used to independently control the active and reactive power flowing between the grid and the inverter. The converter is regulated by a direct axis current used to regulate the actual power (system output power) and a quadrature axis current used to regulate the reactive power. Figure 32 shows a control diagram of the inverter.
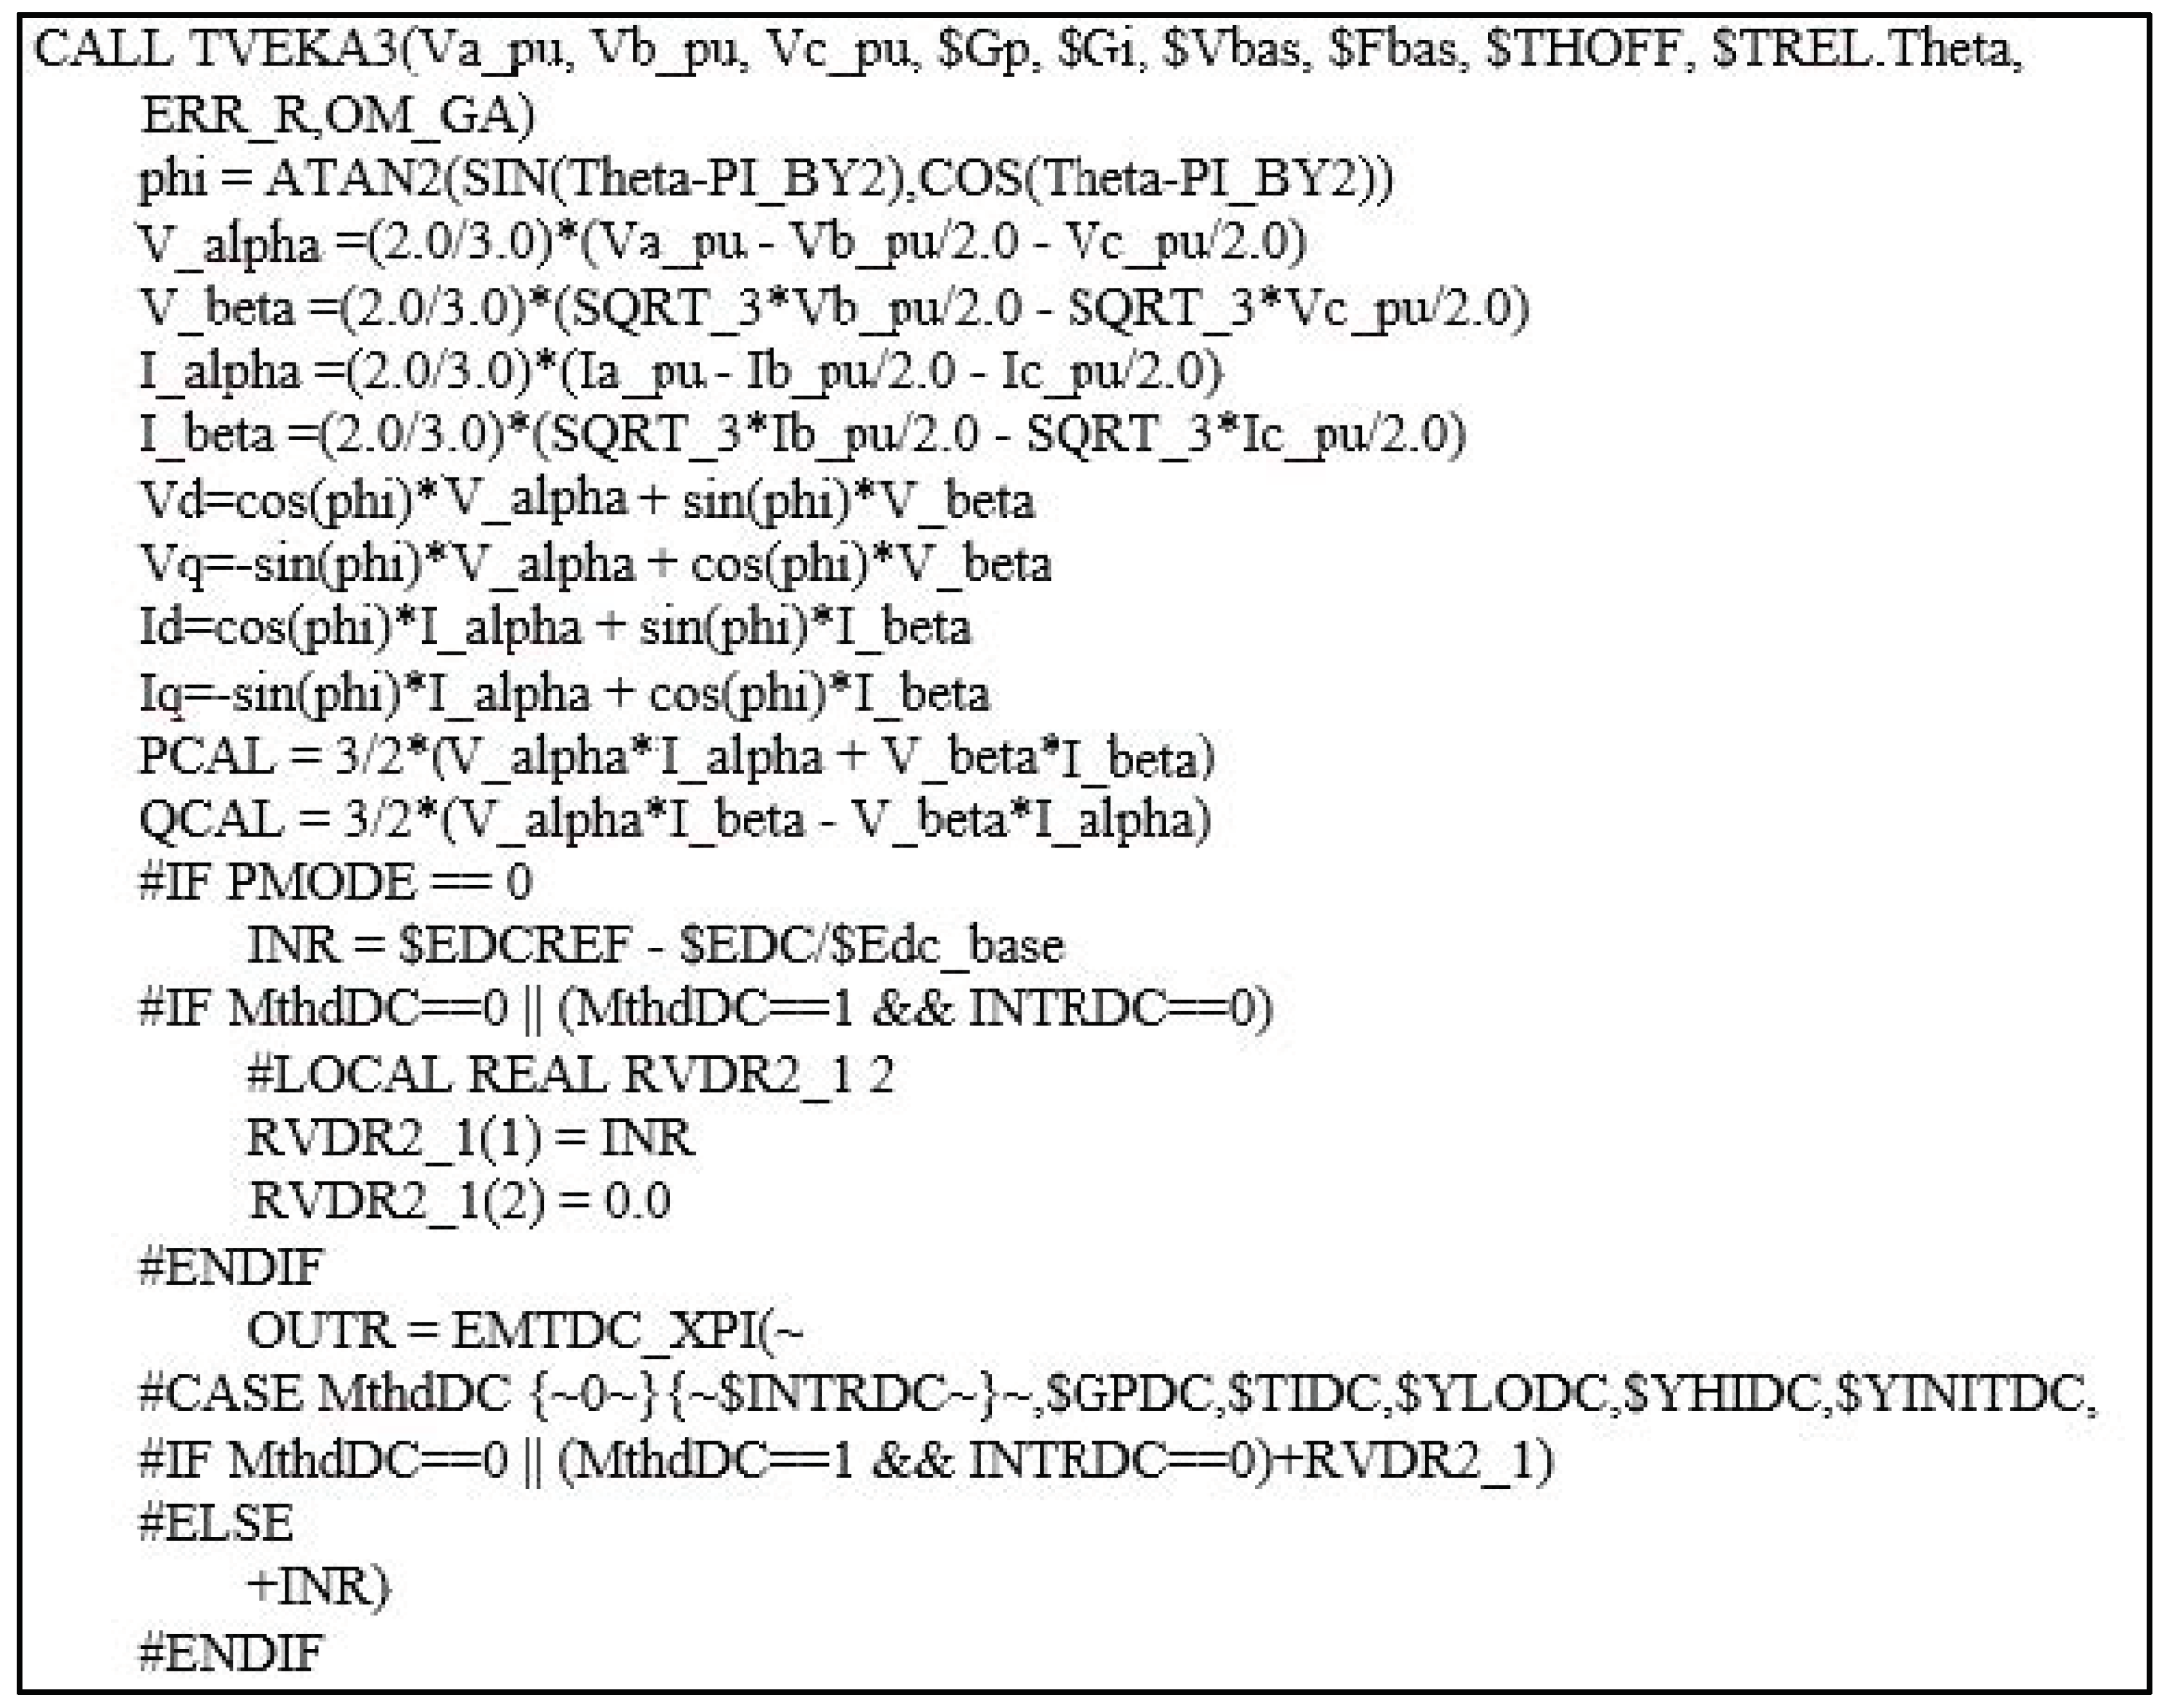
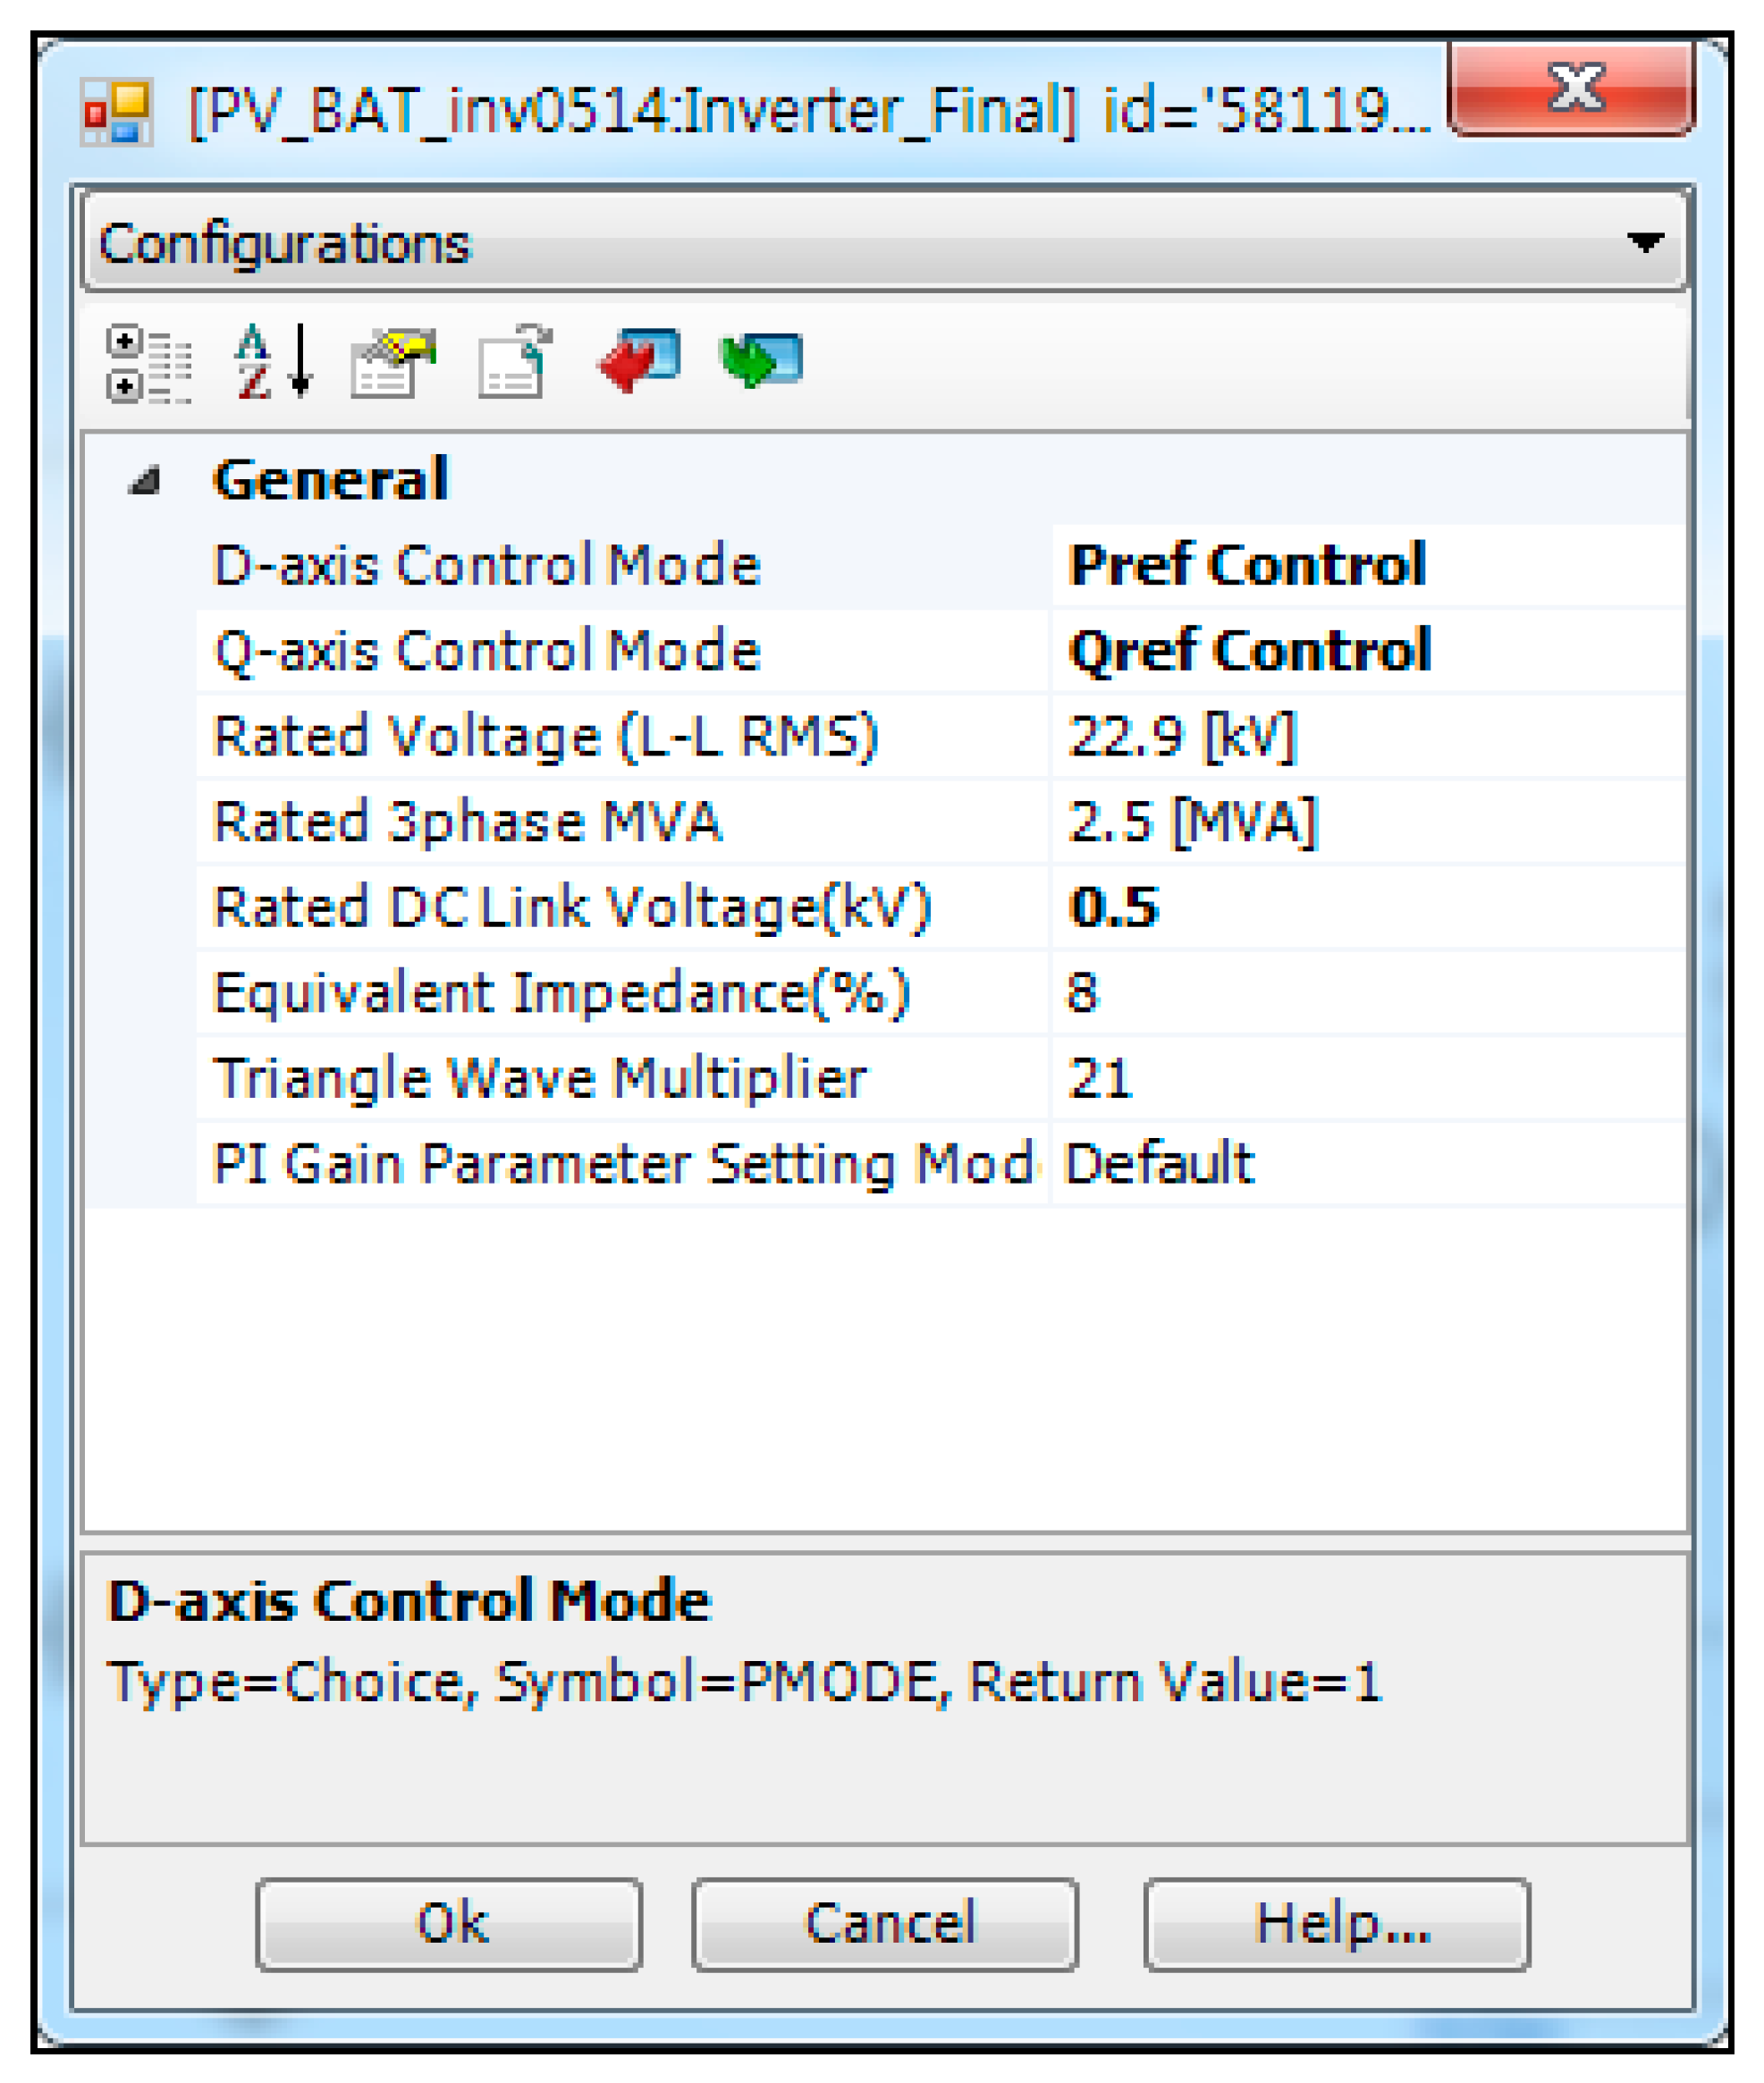
The controller of the inverter is modeled using the UDM of PSCAD. A portion of the Fortran code is shown in Figure 33. The program is configured to determine the output voltage and the current using the internal function of PSCAD. The required parameters for the inverter are entered as shown in Figure 34.
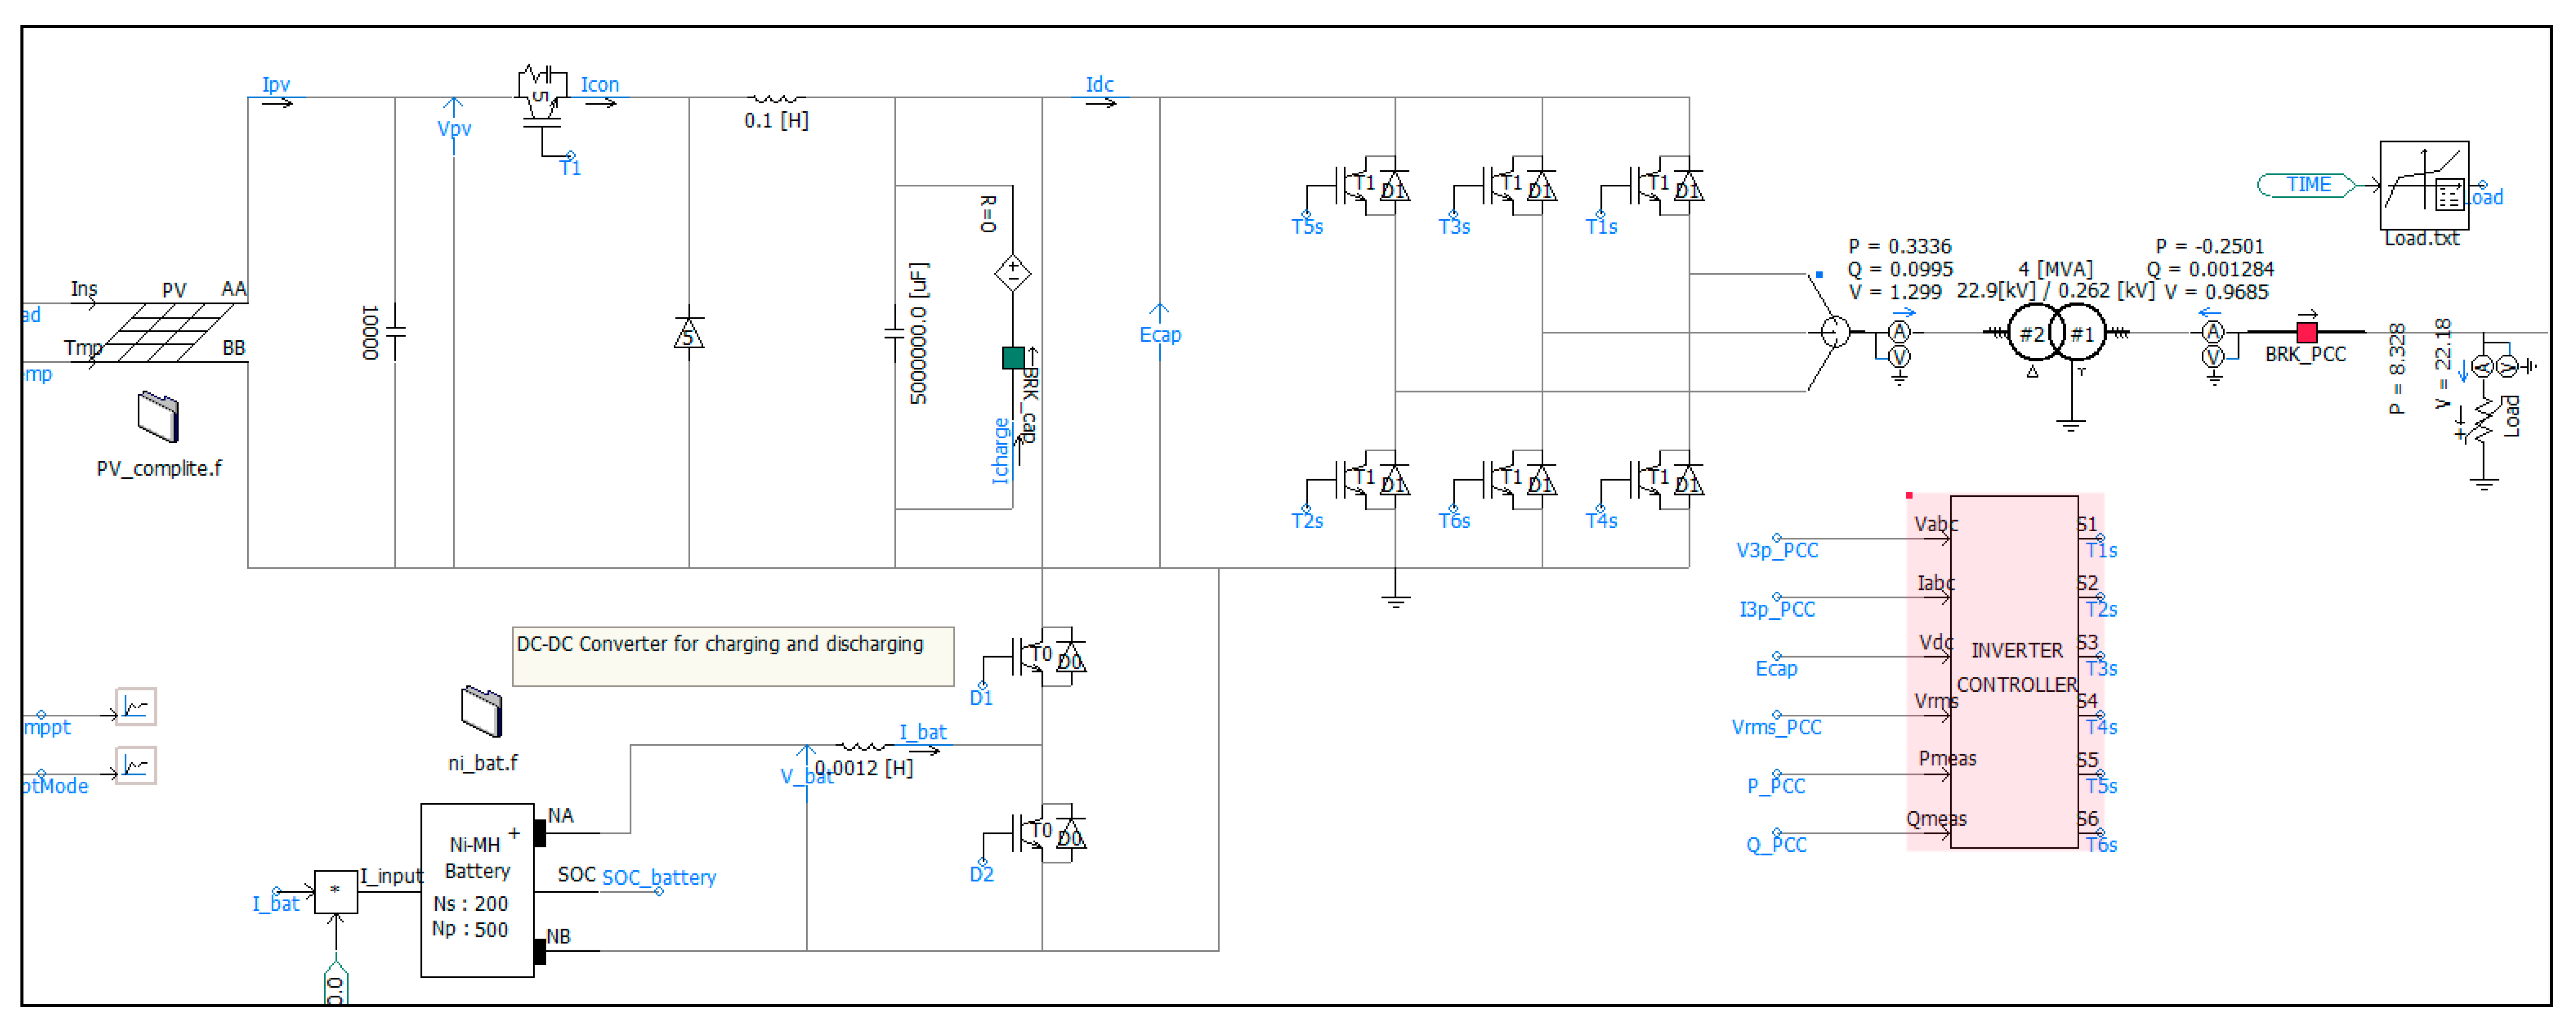
Figure 35 shows the DC/AC inverter modeled by PSCAD.
4. Case Studies
In this paper, the PV battery hybrid system is simulated in various situations to evaluate the system performance. Figure 36 shows a PV battery hybrid system modeled by PSCAD. The simulation settings are shown in Table 3.
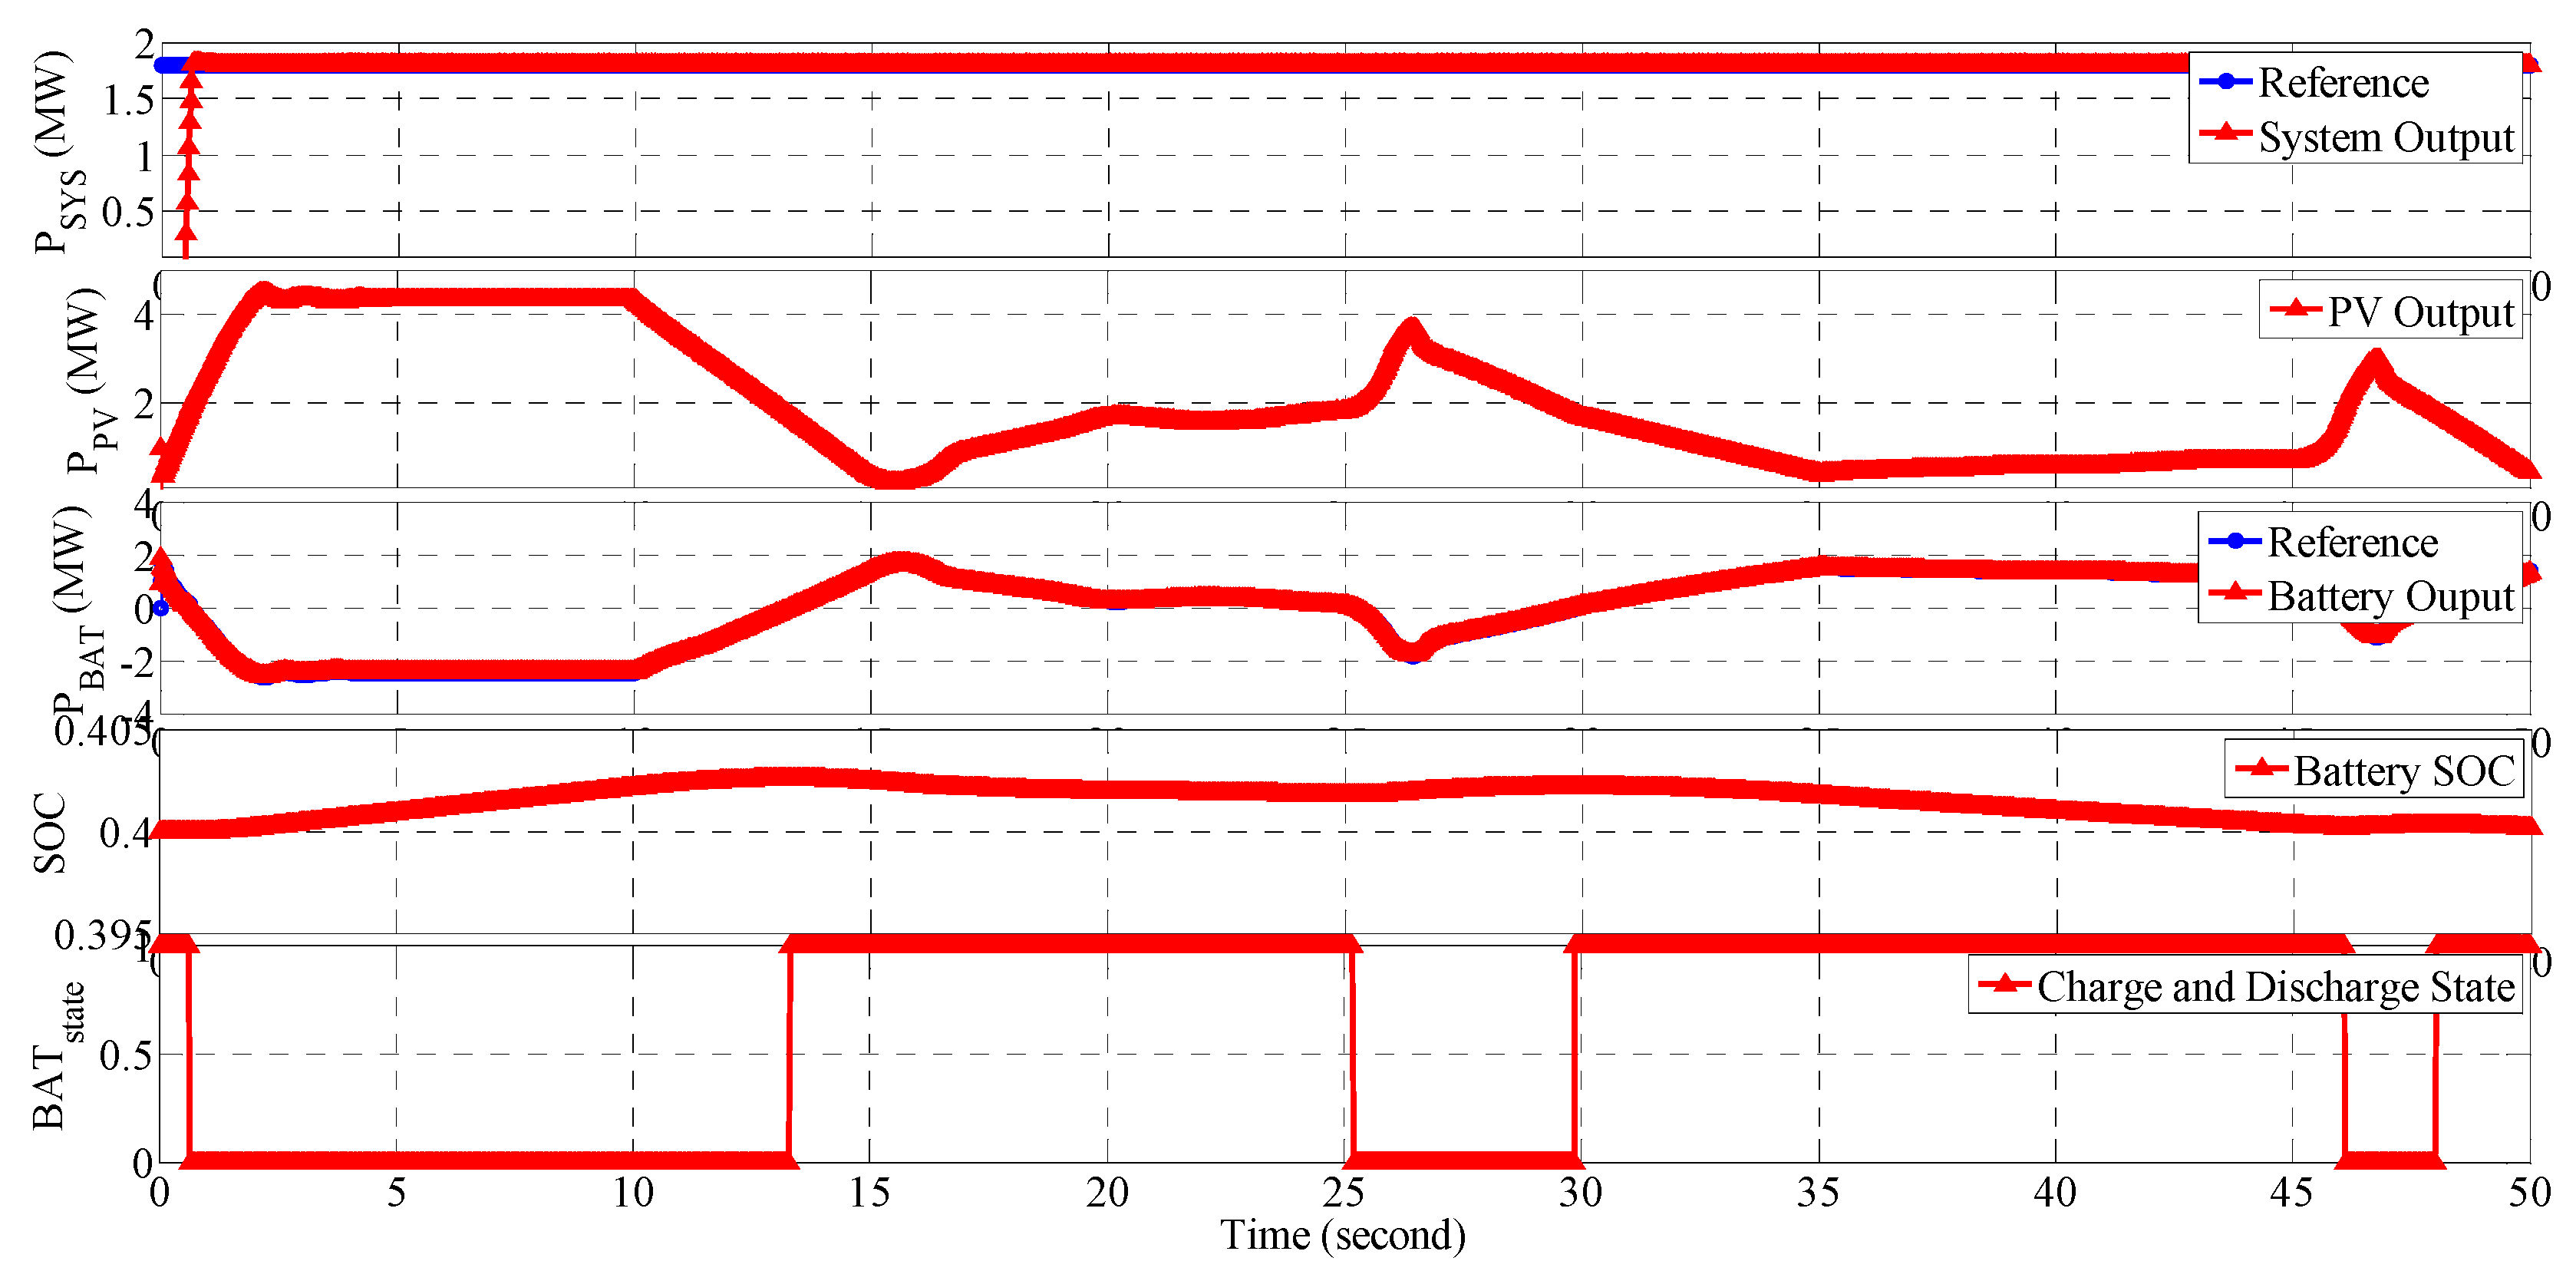
In case 1, the power output to the grid is fixed. Figure 37 shows the system output, PV generation power, battery charge and discharge power, battery SOC, and battery state (charge = 0, discharge = 1). The system output of the inverter is maintained in a stable manner because the battery compensates for the fluctuation of the PV generation power. When the PV power exceeds the inverter power reference, the battery operates in charge mode; otherwise, it operates in discharge mode.
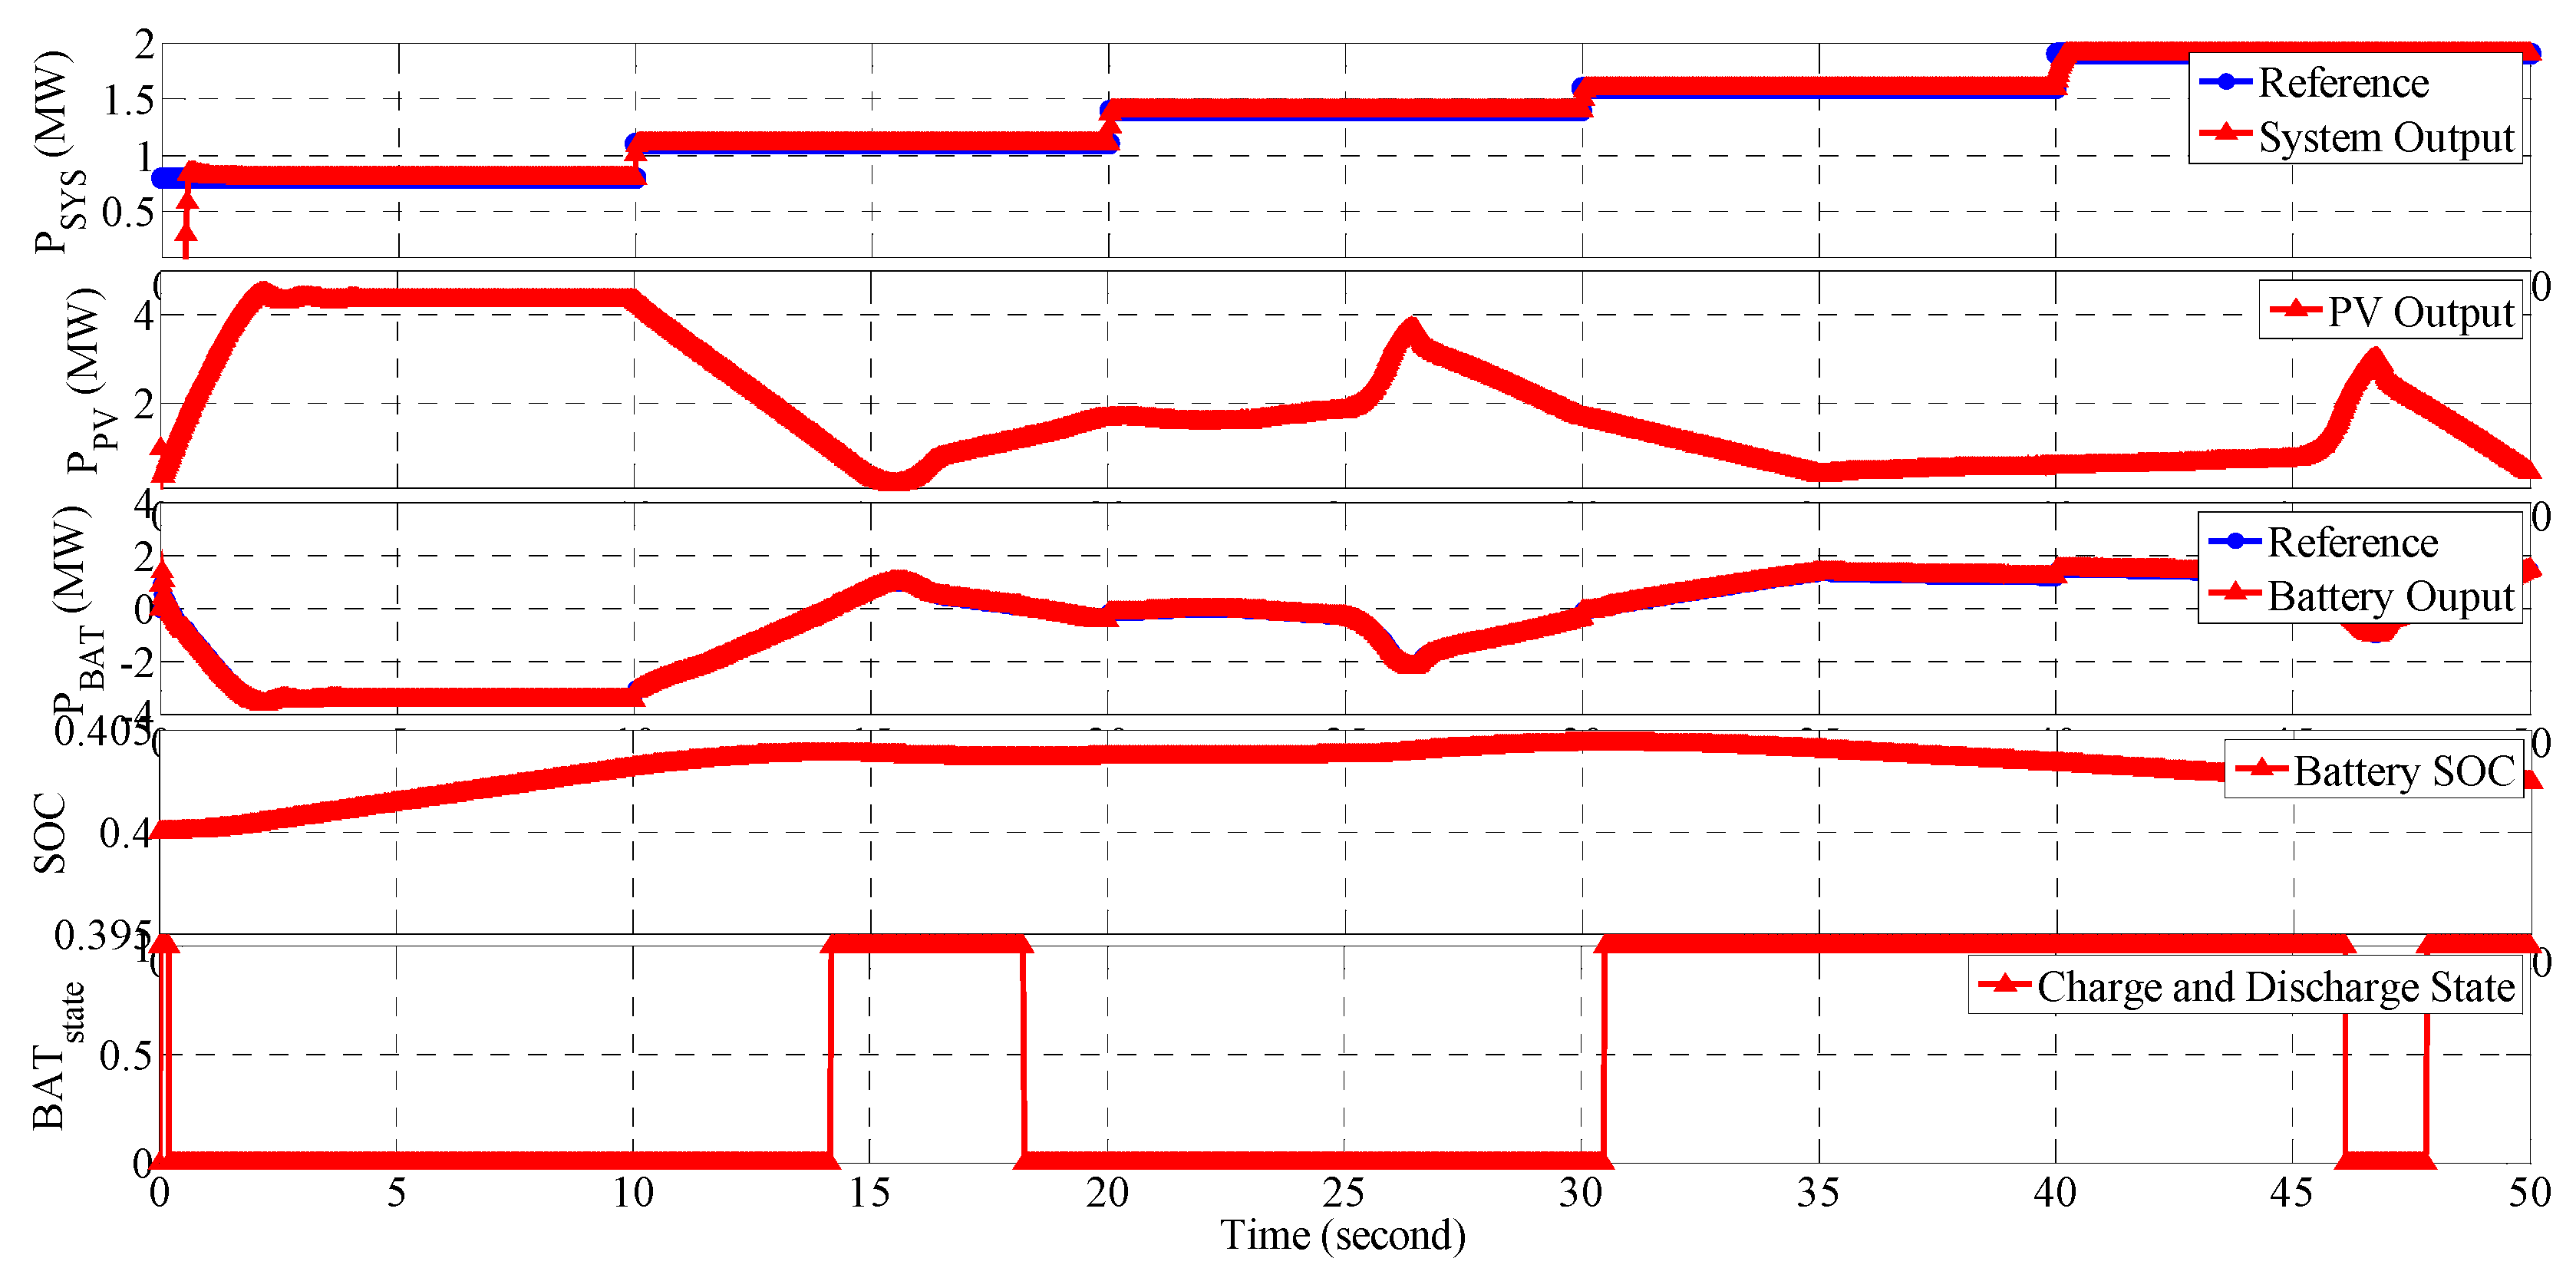
In case 2, the system output reference changes every 10 s. Figure 38 shows the system output, PV generation power, battery charge and discharge power, battery SOC, and battery status. Hybrid systems have been proven to work well with various system output references. This example demonstrates that hybrid systems can contribute to grid power control under various conditions.
Through case 1 and case 2 simulations, it is confirmed that the control of the converter and inverter is being performed stably. The converter of the PV array is controlled to maximize the output of the PV array, and the converter of battery controls the charging and discharging of the battery. Through this control, it is confirmed that the inverter controls the system output stably.
5. Conclusions
In this paper, a simulation model of a PV battery hybrid system is developed by PSCAD/EMTDC. Each system component is modeled and simulated using PSCAD customization. The modeling schemes of PV models, battery models, and power conversion systems have been described in detail. The PV model is made into a model that can receive the characteristics of a photovoltaic cell and determine the output of the photovoltaic cell. The battery model is developed to reflect the discharge characteristics of the battery, and the parameters are extracted from the experimental data of the battery discharge. Using the DC/DC converter, PV generation uses the MPPT algorithm and BESS uses the charge and discharge algorithm. The results confirm that the entire system can be stabilized through charging and discharging.
The proposed PV battery hybrid system allows the user to change or modify the properties of the PV or the battery. This means that new PV or battery characteristics can be easily applied. In addition, the user can modify the Fortran code to immediately apply the converter and inverter algorithm. This allows users to develop system operating algorithms and simulate various cases without the need for a lot of modification.
In this paper, a development technique of the PV battery hybrid system model is proposed. When the development model is applied to an actual system, it is difficult to modify or improve. Therefore, an optimal model can be developed using the proposed technique. In addition, various case analysis can be performed before applying the development model to the actual system.
Author Contributions
S.-I.G. prepared the manuscript and implemented the theory and simulations. J.-H.C. supervised the study. All authors have read and agreed to the published version of the manuscript.
Funding
This research was supported by Korea Electric Power Corporation (Grant number: R18XA04).
Conflicts of Interest
The authors declare no conflict of interest.
References
- Leão, R.P.S.; Barroso, G.C.; Sampaio, R.F.; Almada, J.B.; Lima, C.F.P.; Rego, M.C.O.; Antunes, F.L.M. The future of low voltage networks: Moving from passive to active. Int. J. Electr. Power Energy Syst. 2011, 33, 1506–1512. [Google Scholar] [CrossRef]
- Koohi-Kamali, S.; Rahim, N.A.; Mokhlis, H.; Tyagi, V.V. Photovoltaic electricity generator dynamic modeling methods for smart grid applications: A review. Renew. Sustain. Energy Rev. 2016, 57, 131–172. [Google Scholar] [CrossRef]
- Koohi-Kamali, S.; Rahim, N.A.; Mokhlis, H.J.E.C. Smart power management algorithm in microgrid consisting of photovoltaic, diesel, and battery storage plants considering variations in sunlight, temperature, and load. Energy Convers. Manag. 2014, 84, 562–582. [Google Scholar] [CrossRef]
- Lee, A.H.; Kang, H.Y.; Lin, C.Y.; Shen, K.C. An integrated decision-making model for the location of a PV solar plant. Sustainability 2015, 7, 13522–13541. [Google Scholar] [CrossRef] [Green Version]
- Ozdemir, S.; Sahin, G. Multi-criteria decision-making in the location selection for a solar PV power plant using AHP. Measurement 2018, 129, 218–226. [Google Scholar] [CrossRef]
- Li, X.; Hui, D.; Lai, X. Battery energy storage station (BESS)-based smoothing control of photovoltaic (PV) and wind power generation fluctuations. IEEE Trans. Sustain. Energy 2013, 4, 464–473. [Google Scholar] [CrossRef]
- Sechilariu, M.; Wang, B.; Locment, F. Building-integrated microgrid: Advanced local energy management for forthcoming smart power grid communication. Energy Build. 2013, 59, 236–243. [Google Scholar] [CrossRef]
- Batista, N.C.; Melício, R.; Matias, J.C.O.; Catalão, J.P.S. Photovoltaic and wind energy systems monitoring and building/home energy management using ZigBee devices within a smart grid. Energy 2013, 49, 306–315. [Google Scholar] [CrossRef]
- Carbone, R. Grid-connected photovoltaic systems with energy storage. In Proceedings of the IEEE International Conference on Clean Electrical Power, Coimbatore, India, 19–20 January 2009; pp. 760–767. [Google Scholar]
- Fakham, H.; Lu, D.; Francois, B. Power control design of a battery charger in a hybrid active PV generator for load-following applications. IEEE Trans. Ind. Electron. 2010, 58, 85–94. [Google Scholar] [CrossRef]
- Dürr, M.; Cruden, A.; Gair, S.; McDonald, J.R. Dynamic model of a lead acid battery for use in a domestic fuel cell system. J. Power Sources 2006, 161, 1400–1411. [Google Scholar] [CrossRef]
- Kuhn, E.; Forgez, C.; Lagonotte, P.; Friedrich, G. Modelling Ni-MH battery using Cauer and Foster structures. J. Power Sources 2006, 158, 1490–1497. [Google Scholar] [CrossRef]
- Shepherd, C.M. Design of primary and secondary cells: II. An equation describing battery discharge. J. Electrochem. Soc. 1965, 112, 657. [Google Scholar] [CrossRef]
- Tremblay, O.; Dessaint, L.A.; Dekkiche, A.I. A generic battery model for the dynamic simulation of hybrid electric vehicles. In Proceedings of the 2007 IEEE Vehicle Power and Propulsion Conference, Arlington, TX, USA, 9–12 September 2007; pp. 284–289. [Google Scholar]
- Ben Salah, C.; Ouali, M. Energy management of a hybrid photovoltaic system. Int. J. Energy Res. 2012, 36, 130–138. [Google Scholar] [CrossRef]
- KIM, S.; JEON, J.; CHO, C.; AHN, J. Control design and performance analysis of a grid interactive wind/PV/BESS Hybrid System. In Proceedings of the International Conference on Electricity Distribution, CIRED, Vienna, Austria, 21–24 May 2007; pp. 21–24. [Google Scholar]
- Kim, S.K.; Kim, E.S.; Ahn, J.B. Modeling and control of a grid-connected wind/PV hybrid generation system. In Proceedings of the IEEE/PES Transmission and Distribution Conference and Exhibition 2006, Dallas, TX, USA, 21–24 May 2006; pp. 1202–1207. [Google Scholar]
- Kim, S.K.; Jeon, J.H.; Cho, C.H.; Ahn, J.B.; Kwon, S.H. Dynamic modeling and control of a grid-connected hybrid generation system with versatile power transfer. IEEE Trans. Ind. Electron. 2008, 55, 1677–1688. [Google Scholar] [CrossRef]
- Li, C.H.; Zhu, X.J.; Cao, G.Y.; Sui, S.; Hu, M.R. Dynamic modeling and sizing optimization of stand-alone photovoltaic power systems using hybrid energy storage technology. Renew. Energy 2009, 34, 815–826. [Google Scholar] [CrossRef]
- Roncero-Sánchez, P.; Parreño Torres, A.; Vázquez, J. Control scheme of a concentration photovoltaic plant with a hybrid energy storage system connected to the grid. Energies 2018, 11, 301. [Google Scholar] [CrossRef] [Green Version]
- Go, S.I. A Study on Operation Algorithm of PV Battery Hybrid Systems. Master’s Thesis, Chonnam National University, Gwangju, Korea, 2012. [Google Scholar]
- Mahseredjian, J.; Dinavahi, V.; Martinez, J.A. An overview of simulation tools for electromagnetic transients in power systems. In Proceedings of the 2007 IEEE Power Engineering Society General Meeting, Tampa, FL, USA, 24–28 June 2007; pp. 1–6. [Google Scholar]
- Mahseredjian, J.; Dinavahi, V.; Martinez, J.A. Simulation tools for electromagnetic transients in power systems: Overview and challenges. IEEE Trans. Power Deliv. 2009, 24, 1657–1669. [Google Scholar] [CrossRef]
- Wilson, J.W.; Tian, G.Y. Pulsed electromagnetic methods for defect detection and characterisation. NDT E Int. 2007, 40, 275–283. [Google Scholar] [CrossRef]
- PSCAD/EMTDC User’s Manual, 4th ed.; Manitoba HVDC Research Centre: Manitoba, ON, Canada, 2004.
- Yu, G.J.; Jung, Y.S.; Choi, J.Y.; Kim, G.S. A novel two-mode MPPT control algorithm based on comparative study of existing algorithms. Sol. Energy 2004, 76, 455–463. [Google Scholar] [CrossRef]
- Tremblay, O.; Dessaint, L.A. Experimental validation of a battery dynamic model for EV applications. World Electr. Veh. J. 2009, 3, 289–298. [Google Scholar] [CrossRef] [Green Version]
- Available online: https://www.gbattery.com/board/news?bbs_section=view&Ctg=&page=10&idx=3&keyfield=&key=&Ctg= (accessed on 14 March 2012).
- Beucher, O.; Weeks, M. Introduction to MATLAB & SIMULINK (A Project Approach); Infinity Science Press: Hingham, MA, USA, 2008. [Google Scholar]
- Go, S.I.; Ahn, S.J.; Hyun, D.S.; Song, L.G.; Choi, J.H. Validation of a Ni-MH Battery Dynamic Model for Grid-Connected Photovoltaic System with Battery. In Proceedings of the International of Conference on Electrical Engineering 2012, Hong Kong, 14–16 March 2012. [Google Scholar]
- Esram, T.; Chapman, P.L. Comparison of photovoltaic array maximum power point tracking techniques. IEEE Trans. Energy Convers. 2007, 22, 439–449. [Google Scholar] [CrossRef] [Green Version]
Figure 1.
Photovoltaic (PV) module equivalent electrical circuit.

Figure 2.
The component of the PV array model.

Figure 3.
Creation of PV array parameter input window.

Figure 4.
PV array parameter input.

Figure 5.
Fortran code for the terminal voltage and initialization of the PV model.

Figure 6.
Fortran code for PV module characteristics and terminal current.

Figure 7.
The test circuit of the PV array.

Figure 8.
The output characteristics of the PV array.

Figure 9.
The typical discharge characteristics of nickel–metal hydride (Ni-MH).

Figure 10.
Discharge Ni-MH battery model.

Figure 11.
Discharge curve (GMH 100) [28].
Figure 11.
Discharge curve (GMH 100) [28].

Figure 12.
Curve fitting for 0.2 C discharge curve.

Figure 13.
Curve fitting for Y-intercept vs. i.

Figure 14.
The components of a battery model.

Figure 15.
Creation of the battery parameter input window.

Figure 16.
Battery parameter input window.

Figure 17.
Fortran code for battery model characteristics.

Figure 18.
Discharge curve (0.2 C).

Figure 19.
Discharge curve (1 C).

Figure 20.
Discharge curve (2 C).

Figure 21.
Discharge curve (5 C).

Figure 22.
Configuration of PV battery hybrid systems.

Figure 23.
Perturbation and observation (P&O) algorithm flowchart.

Figure 24.
Maximum power point tracking (MPPT) modeling of Fortran language.

Figure 25.
Buck circuit and control system.

Figure 26.
DC/DC Converter control scheme in power system computer-aided design (PSCAD).

Figure 27.
Battery and bidirectional DC/DC Converter in PSCAD.

Figure 28.
Control DC link voltage.

Figure 29.
Control of the charge mode.

Figure 30.
Control of the discharge mode.

Figure 31.
Charge and discharge control in PSCAD.

Figure 32.
Vector-control structure for an inverter.

Figure 33.
Inverter control modeling for Fortran language.

Figure 34.
Inverter parameter input.

Figure 35.
DC/AC inverter in PSCAD.

Figure 36.
PV battery hybrid system in PSCAD.

Figure 37.
Results of case 1.

Figure 38.
Results of case 2.


Table 1.
Parameter from 0.2 C discharge curve.
| Parameter | Value |
|---|---|
| 1.253 (V) | |
| 2.296 × 10⁷ (Ω | |
| 1.204 × 10⁴ (V/Ah) | |
| 0.1154 (V) | |
| 0.1108 () |
Table 2.
Parameter from 0.2 C discharge curve.
| Parameter | Value |
|---|---|
| 1.26 (V) | |
| 4.576 × 10⁴ (Ω |
Table 3.
Simulation setting value.
| Category | Parameter | Value |
|---|---|---|
| PV array | Rated Capacity | 2.5 (MW) |
| Battery | Rated Capacity | 2.4 (MWh) |
| Battery | Terminal Voltage | 240 (V) |
| DC link | Control Voltage | 600 (V) |
© 2020 by the authors. Licensee MDPI, Basel, Switzerland. This article is an open access article distributed under the terms and conditions of the Creative Commons Attribution (CC BY) license (http://creativecommons.org/licenses/by/4.0/).
Share and Cite
MDPI and ACS Style
Go, S.-I.; Choi, J.-H. Design and Dynamic Modelling of PV-Battery Hybrid Systems for Custom Electromagnetic Transient Simulation. Electronics 2020, 9, 1651. https://doi.org/10.3390/electronics9101651
AMA Style
Go S-I, Choi J-H. Design and Dynamic Modelling of PV-Battery Hybrid Systems for Custom Electromagnetic Transient Simulation. Electronics. 2020; 9(10):1651. https://doi.org/10.3390/electronics9101651
Chicago/Turabian StyleGo, Seok-Il, and Joon-Ho Choi. 2020. "Design and Dynamic Modelling of PV-Battery Hybrid Systems for Custom Electromagnetic Transient Simulation" Electronics 9, no. 10: 1651. https://doi.org/10.3390/electronics9101651
Note that from the first issue of 2016, this journal uses article numbers instead of page numbers. See further details here.