Malvertising in Facebook: Analysis, Quantification and Solution


1
Department of Telematic Engineering, Universidad Carlos III de Madrid, 28911 Leganés, Spain
2
UC3M-Santander Big Data Institute, 28903 Getafe, Spain
*
Author to whom correspondence should be addressed.
Electronics 2020, 9(8), 1332; https://doi.org/10.3390/electronics9081332
Submission received: 30 June 2020
/
Revised: 27 July 2020
/
Accepted: 13 August 2020
/
Published: 18 August 2020
(This article belongs to the Section Computer Science & Engineering)
Abstract
:Online advertising is a wealthy industry that generated more than $100B in 2018 only in the US and delivers billions of ads to Internet users every day with. These impressive numbers have also attracted the attention of malicious players that try to exploit the online advertising ecosystem for their own benefit. In particular, one of the most harmful practices refers to malicious users that act as advertisers to deliver unsafe ads. The goal of these ads is to compromise the security of the users that receive those ads. This practice is referred to as Malvertising. Some reports have estimated the economic loss caused by malvertising to the online advertising sector to $1.1B in 2017. This paper is the first work that analyses and quantifies the impact of malvertising in Facebook. To accomplish this study, we rely on a dataset that includes more than 5 M ads delivered to 3 K Facebook users from 126 K advertisers between October 2016 and May 2018. Our results reveal that although the portion of advertisers (0.68%) and ads (0.17%) associated to malvertising is very low, 1/3 of the users in our study were exposed to malvertising. Finally, we also propose a novel solution to block malvertising ads in real-time in Facebook.
1. Introduction
The online advertising ecosystem generated $107.5B in 2018 only in the US, which represents a 21.8% growth over the results of 2017 [1]. Some studies reported that only in Europe the online advertising sector was responsible for 1 M direct and 6 M indirect jobs in 2015 [2]. These numbers show that the online advertising ecosystem is a healthy sector that brings important benefits to the society in terms of employment, economy, and innovation.
The wealthy status of the online advertising sector has attracted the attention of malicious players that perform a fraudulent use of the ecosystem mainly to achieve one of the two following objectives: (i) obtain economic benefits, referred to as Fraud, (ii) compromise the security of the users receiving ads, referred to as Malvertising. Malvertising is the actual focus of this paper.
In malvertising the attacker, referred to as Malvertiser in the rest of the paper, plays the role of advertiser and delivers ads that aims to compromise the security of the devices where the ad is displayed (e.g., trying to persuade the user to install a malware) [3]. We can find two main types of malvertising attacks. In the first type, the attacker injects some code in the ad that looks for vulnerabilities in the user’s device to infect. This attack does not require proactive action of the user. In the second type of attack, malvertisers deliver (attractive) ads to persuade the user to click and forward her to a landing website managed by the malvertiser. This is actually mimicking the same approach used in phishing attacks [4]. Once in the landing website, the malvertiser may look for vulnerabilities in the user device to install a malware, or even persuade the user to download and install some malware (e.g., showing a message indicating that the device is infected and suggesting to install a software that would clean the system). The economic loss caused by malvertising to the online advertising sector has been estimated in $1.13B in 2017, and it was expected to grow at a yearly pace of 20–30% [5].
Previous research studies have focused in the first type of malvertising attack [6,7,8,9,10]. These research works analyze the code (mostly javascript) running on the displayed ads as well as in all of the intermediary URLs that, using redirections, forward the user to the ultimate landing page. These works also propose solutions that industry players (e.g., ad networks) could implement to mitigate the pernicious effects of malvertising. The methodology used in all these previous works uses automatic bots that visit websites or mobile apps emulating the behaviour of a user and analyze the ads received. Most of these works works rely on datasets including only tens of thousands of ads to derive their conclusions.
Our paper contributes to the literature by performing the first analysis of malvertising in Facebook (FB). FB is one of the most popular online services in the Internet with more than 2.4 B monthly active users [11], and it is the second player in terms of revenue in the online advertising ecosystem after Google [12]. The FB advertising platform differs from the standard online advertising ecosystem operating in websites and mobile apps, because it does not allow including code in the ads. While ads running malicious code is one of the main sources of malvertising in websites and mobile apps, this attack cannot be run in FB. Hence, all the solutions in the literature that analyze code injected in ads do not apply in the case of Facebook. Instead, studying malvertising in FB requires mainly focusing on the second type of malvertising attack described before (i.e., attracting the user to the malvertiser domain).
We define a malvertiser in the context of FB as an advertiser that delivers ads that forward users to unsafe websites (that probably are managed by the malvertiser) in the case they click on the ad. We use the McAfee’s SiteAdvisor service [13] to define the risk level of web domains. Hence, an ad delivered by a malvertiser will be classified as potentially unsafe/harmful in the case that McAfee labels the landing domain as unsafe. We could use multiple sources that label the risk of web domains and apply some heuristic based on the combination of all the risk signals generated from those sources. However, in this paper we adopt a conservative approach widely extended in the area of cybersecurity in which a single warning signal indicating a potential risk is enough to apply the defined countermeasures. Therefore, if we extrapolate this conservative approach to the case of malvertising, in case there is at least one information source that identifies a web domain as risky that domain must be classified as unsafe. In turn, all of the ads forwarding users to unsafe domains should be considered unsafe as well. We note that, by only using McAfee we are actually reporting a lower bound of the exposure of users to malvertising, because there could be domains labelled as safe according to McAfee that could be considered unsafe by other sources.
The main goal of the paper is to analyze the impact of malvertising in Facebook by quantifying: (i) the portion of malvertisers, (ii) the portion of unsafe ads in FB, (iii) the portion of users exposed to malvertising, and (iv) the interaction of users with unsafe ads. To this end, we rely on a large dataset that includes more than 5 M ads delivered to 3 K FB users from 122 K advertisers in the period October 2016–May 2018. This dataset has been collected using the web browser extension FDVT [14]. The FDVT retrieves, among other things, the ads FB delivers to FDVT users. To our knowledge, this is the largest dataset that is used to study malvertising. It is also important to highlight that our research is the only one that quantifies the portion of users actually exposed to malvertising. This happens because our work relies on ads delivered to real users, whereas previous research works use automated software browsing in websites or mobile apps but does not involve real users.
In addition, we aim to understand whether the impact of malvertising in FB is more relevant than in other online services. To this end, we compare the results of malvertising in FB to the malvertising observed in regular websites. To measure malvertising in regular websites, we use a dataset [15] that includes 40 K ads delivered to 589 users from more than 20 K advertisers.
Finally, our last contribution is a solution that blocks potentially unsafe ads in FB in real-time in the end-user premises.
To conclude the introduction, we summarize the main findings of our work:
- Despite that malvertising only contributes 0.17% of the ads in our dataset, our results reveal that 1/3 of the FDVT users were exposed to unsafe ads, and almost 18% to an ad related to highly risky malvertisers.
- Our results suggest that the exposure of users to malvertising differs from online service to online service. Based on the results obtained from the Facebook and WEB datasets used in this paper, the portion of unsafe ads is higher in regular websites (0.5%) than in Facebook (0.17%). However, the portion of users exposed to malvertising in FB is substantially larger (32.2%) as compared to websites (20.7%).
- Overall, our paper reports an important security problem. We performed a ballpark estimation that reveals that roughly 777 M users may have been exposed to unsafe ads, and 3.7 M of them may have landed in websites managed by malvertisers during the 18-month period considered in our study.
2. Background
2.1. Facebook Online Advertising Platform
FB offers advertisers the possibility to create micro-targeting campaigns to target well-defined profiles with ads. To this end, FB labels users with the so-called ad preferences, which refers to interests that may be relevant for the users, based on the user activity. For instance, if a user likes a FB page associated to healthy food FB will very likely add one (or more) ad preference(s) related to healthy food. Users’ profile in FB also includes socio-economic parameters, such as: gender, age, location (e.g., country, region, city, etc.), mobile device used, etc. For instance, an advertiser could define a campaign targeting users who are “women, living in Paris, between 20 and 35 years old, interested in Wine, Healthy Food and Soccer”. In turn, FB delivers the ad to users matching the defined targeted profile.
If a Facebook user clicks on an ad, she is forwarded to the landing page chosen by the advertiser (typically the advertiser website). Note that the ad content does not need to be related to the actual landing page that is associated to the ad. Therefore, a malicious user may use a fancy ad to capture the attention of the users and forward them to a website she manages.
2.2. Fdvt: Data Valuation Tool for Facebook Users
The FDVT [14] is a web-browser add-on that informs Facebook users of an estimation of the revenue that they are generating for FB based on the ads they receive and click while browsing in FB.
After installing the add-on, users have to follow a registration process in which they are asked to fill a small profile: country, gender, age, and relationship status. Only the country parameter is compulsory to use the FDVT. In addition, users have to accept the terms of use, the privacy policy and proactively provide permission to use the data (anonymously) collected for research purposes. To the best of our knowledge, this guarantees that the dataset used in this paper is compliant with the most recent data protection regulations.
The FDVT also collects information related to the ads delivered to the user. In particular, the FDVT collects: the timestamp when the ad was delivered, the position of the ad (either newsfeed or right side of the wall), and the url(s) embedded in the ad that will forward the user to the advertiser landing page. All of this information is collected from each FB session.
The core dataset of this study has been collected while using the FDVT add-on and it includes information of ads delivered to 3 K users between October 2016 and May 2018 [16].
2.3. Illustrating Malvertising in Facebook
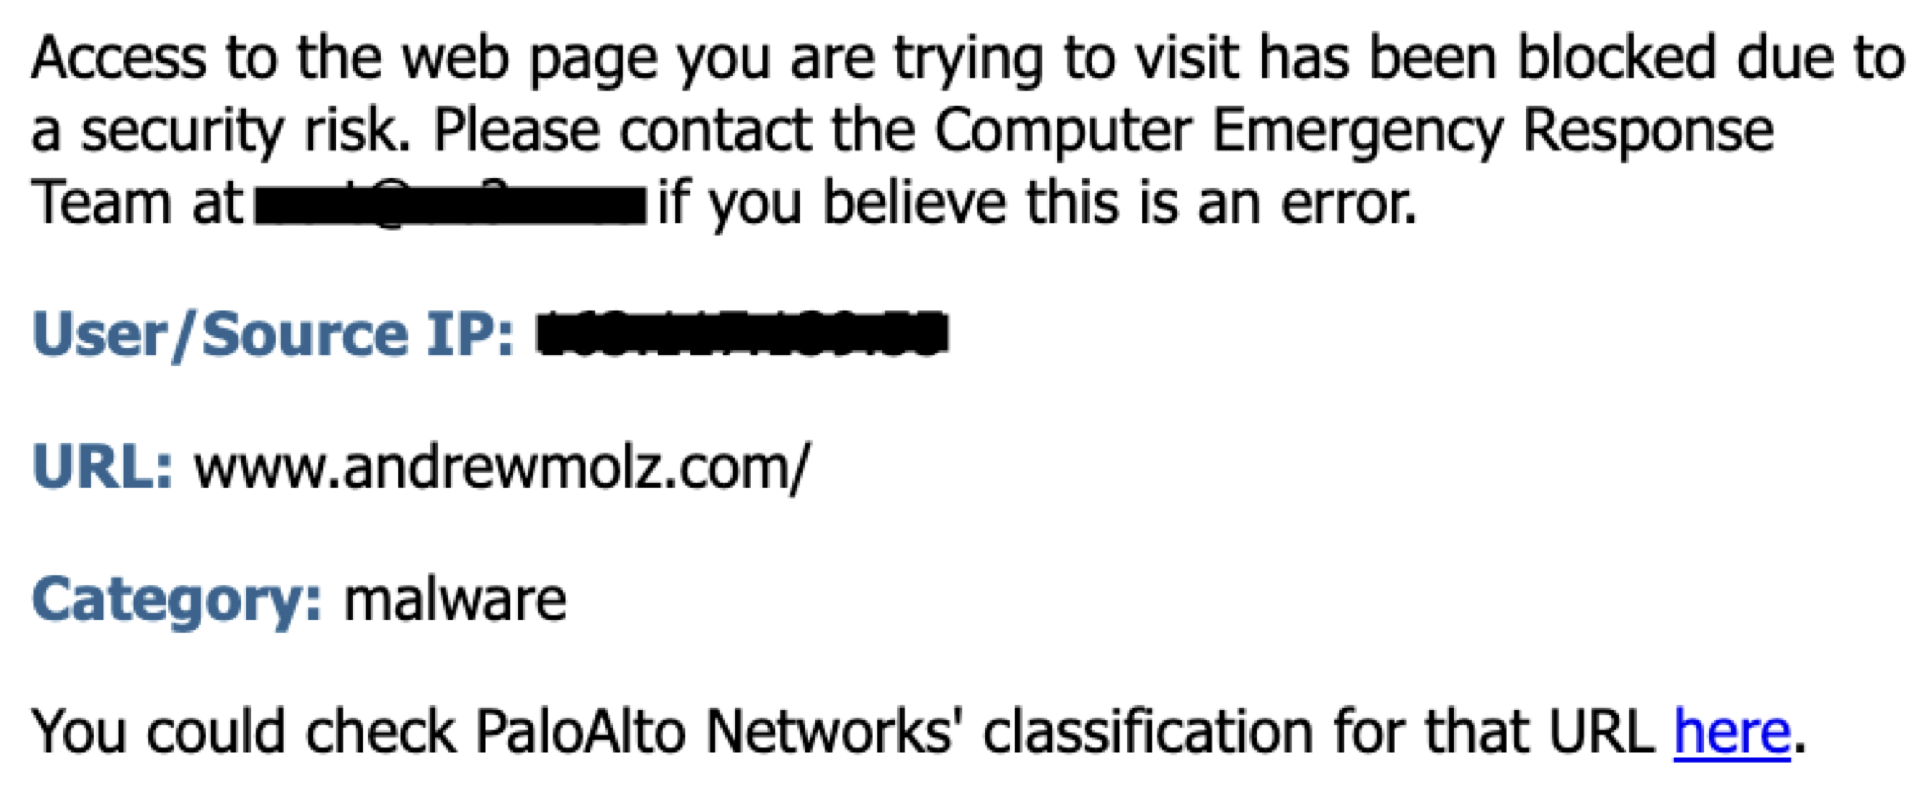
We use an example to illustrate how malvertising works in Facebook. Figure 1 shows a FB post that can be identified as an ad because below the user name it is showing the label “Sponsored”. That label identifies ads in FB. The ad in the figure is offering companies to help them with Facebook ad campaigns. In addition, it includes a banner showing a boxing ring picture, which is linked to part of the text where the advertiser suggests that using the offered service will allow businesses to knockout competition. This ad shows the landing page (www.andrewmolz.com) the user will reach in case she clicks on the ad in two places: in the middle of the banner and just below the banner. When we clicked on the ad the firewall of our institution automatically blocked the connection. Figure 2 shows the message that are displayed by our institution, indicating: “Access to the web page you are trying to visit has been blocked due to a security risk”.
We use this example to illustrate that malvertisers will usually deliver ads that are not easily identifiable as malvertising, even in the case of skilled users. Usually, unsafe ads do not present significant differences with respect to regular safe ads.
3. Materials and Methods
This section describes the datasets, metrics, and methodology used to accomplish our main objective of analysing malvertising in FB.
3.1. Datasets
The analysis conducted in the paper uses two datasets, including information about Facebook and websites ads, respectively. Next, we describe each one of them.
3.1.1. Facebook Dataset
Our research relies on a large dataset [16] that includes 5,302,179 ads delivered to 3001 FDVT users across 564,138 sessions. This dataset was collected between October 2016 and May 2018.
In this study, we identify advertisers by the web-domain associated to the landing page the user would reach in the case she clicks on the ad. In turn, we classify the risk level of advertisers based on the reputation field that we obtain from the McAfee’s SiteAdvisor service [13] for the advertiser’s web domain. The reputation field defines the risk level McAfee assigns to that website and is divided into four potential categorical values: Minimal Risk, Slightly Risky, Highly Risky, Unknown. Note that the reputation values used in this paper were retrieved in December 2018, and some of them may have changed by the time this article becomes public.
Next, for a better understanding we classify advertisers into the following security levels: (i) Safe when its associated web domain was assigned the Minimal Risk reputation; (ii) Unsafe when the reputation field was either Slightly or Highly risky; (iii) Highly Risky in the case the reputation field was Highly Risky. In our work, Unsafe and Highly Risky advertisers are considered as potential malvertisers, and the ads they deliver as potentially unsafe for FB users. Finally, note that the advertisers classified as Unknown by McAfee are filtered from our dataset, since we cannot establish whether they are safe or unsafe.
In addition to the risk label, McAfee also assigns topic labels (e.g., online shopping, marketing, phishing, etc.) to the domains we evaluate. There are more than hundred different topics and each domain is assigned between one and three topics. We complete our dataset with the topics that are associated to each advertiser.
As we already clarified in the introduction, this paper adopts a conservative approach widely applied in the area of cybersecurity. Our goal is to reduce as much as possible the impact of attacks by minimizing the number of false negatives. Let us assume a scenario where there are N sources classifying domains as either NO RISK or RISK. There could be approaches that aim to maximize the accuracy on the detection of RISK domains by combining the signals received from the N sources. Although this may be a reasonable approach that tries to avoid both false positive and false negatives, in the area of cybersecurity usually the goal is to minimize as much as possible false negatives. To this end, the best option is to adopt a conservative approach that considers as unsafe a domain as soon as one of the N sources reports that website as RISK. The impact of this conservative approach in the case of malvertising is that we will minimize the false negative ratio (i.e., classify an ad as safe when it is actually unsafe) at the cost of increasing the false positive ratio (i.e., classify an ad as unsafe when it is actually safe). In the case of malvertising (from the end user perspective) the cost of a false negative (e.g., compromising the device of a user) is several orders of magnitude higher than the cost of a false positive (e.g., a safe ad is blocked and not visualized by the user avoiding the option she clicks on it).
Based on the described conservative approach, the fact of using a single source to classify domains (i.e., McAfee) means that we are reporting a lower bound for the amount of unsafe ads, unsafe advertisers, and users exposed to advertisers. If we would include other classification sources, the reported volume of malvertising would be either equal or higher but never lower.
3.1.2. Web Dataset
In this paper, we compare the volume of malvertising in FB to regular websites. To that end, we borrowed a dataset collected from ads delivered in regular websites from Iordanou et al. [15]. This dataset includes 589 users that received 41 K ads from 20.5 K advertisers across standard websites. As we did for the case of FB, we classify the ads (and associated advertisers) using the reputation category McAfee assigns to the landing domain associated to the ad into: Safe, Unsafe, and Highly Risky. Note that the this dataset is not a representative sample of the whole web, and thus the extracted result are not generalizable. Still, we believe comparing FB and the web using two datasets involving real users is a relevant analysis to understand whether we can expect a similar exposure of users to unsafe ads across different online services.
3.2. Metrics
3.2.1. Malvertisers-Based Metrics
Quantifying the presence of unsafe advertisers allows explaining whether the number of malvertisers that exploit the FB advertising platform is negligible or they represent a relevant portion of advertisers instead. To this end, we define two metrics in our methodology:
- -
- Percentage of Malvertisers (P_Malvertisers): this metric measures the percentage of malvertisers. It is computed using the following formula: , where refers to the number of potential malvertisers (advertisers labeled as Slightly Risky or Highly Risky by McAfee) and to the total number of advertisers.
- -
- Percentage of Highly Risky Malvertisers (PHR_Malvertisers): this metric takes into account only the advertisers classified as highly risky within the group of unsafe advertisers. It is computed, as follows , where refers to the number of highly risky malvertisers (advertisers labeled as Highly Risky by McAfee). Note that, by definition PHR_Malvertisers ≤ P_Malvertisers.
3.2.2. Unsafe Ads-Based Metrics
Knowing the portion of unsafe advertisers does not allow to directly measure up to what extent they are polluting FB with ads. That very much depends on the number and intensity of their ad campaigns. We illustrate our claim with the following example. Let us assume a system with five advertisers: A, B, C, D, and E. A, B, C, and D are legitimate advertisers that run one campaign each reaching 10 K impressions per campaign, respectively. E is a malicious advertiser that runs five different ad campaigns reaching 10 K impressions each of them. Overall, the portion of unsafe advertisers is only 1/5, but the portion of unsafe ads (impressions) delivered is 1/2. Hence, we define the following metrics in order to quantify the portion of unsafe ads impressions (note from now on in the paper when we refer to number/portion of ads we will actually be referring to number/portion of ads impressions):
- -
- Percentage of Unsafe Ads (PU_Ads): this metric measures the volume of unsafe ads. It is computed as follows , where refers to the number of unsafe ads (ads delivered by potential malvertisers) and to the total number of ads.
- -
- Percentage of Highly Risky Ads (PHR_Ads): this metric takes into account only the ads classified as highly risky within the group of unsafe ads. It is computed as follows , where refers to the number of highly risky ads (ads delivered by highly risky malvertisers). By definition PHR_Ads ≤ PU_Ads.
3.2.3. User Exposure to Malvertising Metrics
The previous two metrics quantify the presence of malvertisers and the ads they generate, but they are not valid to measure the actual exposure of users to unsafe ads. Theoretically, a single advertiser with a single ad campaign could reach all of the users in FB. Therefore, to measure the exposure of users to malvertising we need to quantify the portion of users that have received unsafe ads. To this end, we define the following metrics:
- -
- Percentage of Users Exposed to Unsafe Ads (PUEU): this metric measures the volume of users that have received unsafe ads. It is computed, as follows , where refers to the number of users that have received unsafe ads and to the total number of users in our dataset.
- -
- Percentage of Users Exposed to Highly Risky Ads (PUEHR): this metric measures the volume of users that have received highly risky ads. It is computed as follows , where refers to the number of users in our dataset that have received some highly risky ad.
3.2.4. User Interaction with Unsafe Ads Metrics
Finally, we also want to understand up to what extent users interact with unsafe ads compared to safe ads. In order to quantify such interaction, we use a standard metric in the online advertising industry referred to as Click Through Ratio (CTR). The CTR defines the likelihood to click on an ad. Comparing the CTR of safe and unsafe ads will reveal whether malvertisers are savvy users able to reach CTR rates that are similar or even higher than professional advertisers.
3.3. Methodology Overview
Our analysis starts by applying the defined metrics to the FB dataset to understand the presence of malvertisers and unsafe ads and the exposure of users to them in FB. Next, we compare the malvertising in the case of FB to the case of the web. Finally, for the case of FB, we divide the users in our dataset based on gender and age in order to analyze whether there are significant differences in the exposure of different demographic groups to malvertisers and unsafe ads. This analysis allows to reveal, for instance, whether women are more exposed than men to malvertising, or if young users are more likely to receive unsafe ads than senior ones.
4. Results
4.1. Classifying Malvertising in Facebook
In this section, we analyze the distribution of ads across domains (i.e., advertisers) to understand whether such distribution differs between safe and unsafe ads. In particular, we divide the ads in three groups according to the McAfee’s reputation label for the associated landing domains: Safe ads, Slightly Risky, and Highly Risky, where the last two groups are associated to unsafe ads delivered from potential malvertisers. For each of the groups, we obtain the distribution of ads per domain topic using the topic McAfee assigns to the landing page associated to the ads.
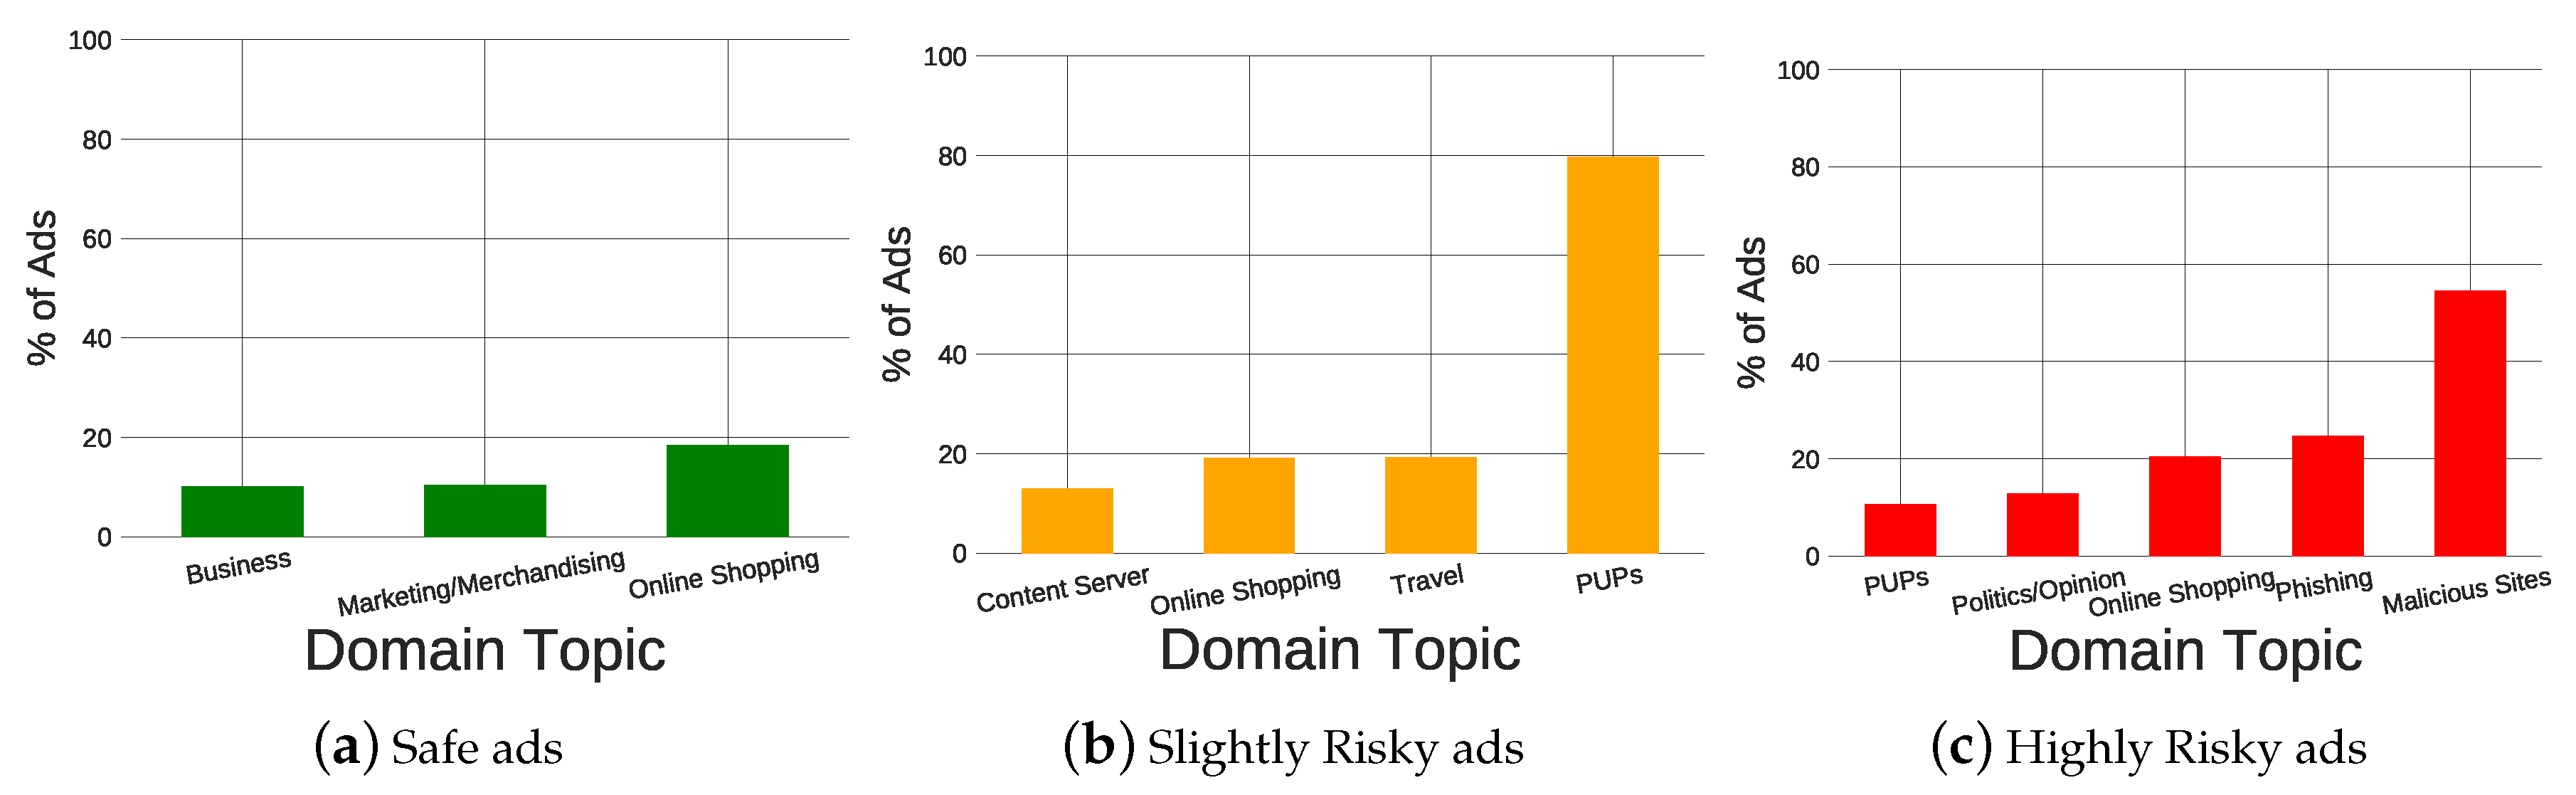
We compute the Jains Fairness Index (JFI) [17] for Safe, Slightly risky, and Highly risky ads in order to compare the homogeneity of the distribution. The JFI ranges between 0 and 1 and denotes a more homogeneous distribution the closer it is to 1. The JFI for the distribution of ads across topics is 0.14, 0.04, and 0.06 for safe, slightly risky, and highly risky ads, respectively. Hence, the first result of our analysis is that the distribution of safe ads across topics is more homogeneous. The main reason for this result is that in the case of Safe ads we do not find a clear predominant domain topic. The most popular one (Online Shopping) appears in less than 20% of the ads. In contrast, for the case of slightly risky and very risky ads, we can find a clear predominant domain topic present in 80% (Potentially Unwanted Programs or PUPs) and 55% (Malicious Sites) of the ads, respectively.
Figure 3 shows a bar plot for the top domain topics in the different ads’ groups: safe, slightly risky, and highly risky. By top domain topic, we refer to those categories that appear in at least 10% of the ads within a specific ad group. For instance, in the case of highly risky ads the topic Malicious Site is considered top, because it appears in 55% of the ads labeled as highly risky. Note that the sum of percentage in a group may be higher than 100% because McAfee may assign up to three topics to a domain.
Among Safe ads, the most relevant topics are Online Shopping (18.48%), Marketing/Merchandising (10.35%), and Business (10.08%). This list differs from the case of slightly risky ads where we find: PUPs (79.72%), Travel (19.28%), and Online Shopping (19.11%). Finally, the most popular topics that are associated with highly risky ads are Malicious Sites (54.53%), Phishing (24.74%), and Online Shopping (20.49%).
The bar plots seem to provide reasonable results. First, Safe ads are distributed across standard websites that offer products/services to users with domain topics, such as Online Shopping, Marketing, etc. In the context of potentially unsafe ads, we find clear differences between slightly risky ads and highly risky ads. Highly risky ads are explicitly linked to unsafe domains classified as Malicious or Phishing Sites in most cases. In contrast, slightly risky ads are mostly associated to the topic PUPs that denotes a potential risk, but it does not make it explicit. These results validate our approach (see metrics definition) of analyzing separately highly risky ads from the group of Unsafe ads, which includes both group of ads slightly risky and highly risky.
4.2. Quantifying Malvertising in Facebook
In this section, we quantify: (i) the presence of malvertisers, (ii) unsafe ads, (iii) the exposure of FB users to them, and (iv) the interaction of the users with unsafe ads.
4.2.1. Unsafe Ads, Advertisers and Users Exposure to Them
The first row of Table 1 shows for the case of FB: (i) total number of users, (ii) total number of ads, (iii) total number of advertisers, (iv) the percentage of unsafe ads (PU_Ads), (v) the percentage of highly risky ads (PHR_Ads), (vi) the percentage of malvertisers (P_malvertisers), (vii) the percentage of highly risky malvertisers (PHR_malvertisers), (viii) the percentage of users exposed to unsafe ads (PUEU) ads, and (ix) the percentage of users exposed to highly risky ads (PUEHR).
The results reveal that, in fact, the number of ads associated to malvertisers is quite small, since they only represent 0.17% of the ad impressions in our dataset. This number decreases even more to only 0.064% if we just focus on the highly risky ads. Similarly, malvertisers represent less than 1% of all the advertisers. If we look at these numbers in isolation, we could conclude that the impact of malvertising is actually negligible in FB. However, despite the small portion of unsafe ads, 1/3 of the FDVT users have been exposed to them, and almost 18% of the users have received ads coming from a malvertiser classified as highly risky. In particular, 12% of the FDVT users have been exposed to ads linked to websites labelled as Malicious Sites, and 7% of the users exposed to websites labelled as Phishing.
The divergence between the low portion of unsafe ads and the large percentage of users impacted is actually plausible, because a low portion of unsafe ads still represents a large overall number in FB. Just in our FDVT dataset, we have detected more than 800 (0.68%) potential malvertisers that delivered more than 9 K potentially unsafe ads. These numbers are coherent to explain that almost 1000 FDVT users received some of those unsafe ads.
4.2.2. Interaction of Users with Unsafe Ads
A very interesting question is whether unsafe ads are more efficient than safe ads on attracting the attention of the users. That means, whether using our data, we can find evidence that malvertisers are worse than professional advertisers on attracting click for the users or they are savvy users that achieve similar performance than professional advertisers. To this end, we compute the CTR metric for safe and unsafe ads in order to measure the interaction of users with each type of ad.
Table 2 shows the CTR for all, safe, unsafe and highly risky ads along with its confidence interval (CI) at the 95% level. To calculate the CI, we have used the Wilson Score Interval method [18], which is the method that Facebook uses to compute CTR confidence intervals (https://tinyurl.com/y4mkzdkf). The table presents the results for all users, men and women, separately. Men and women results will be used in Section 4.4.1.
The CTR for safe ads has been computed using more than 5 M ads. This leads to a very narrow confidence interval (CI) around the average CTR value equal to 0.4%. Contrary, due to the much mall smaller number of unsafe ads (and associated clicks), the CI for unsafe and highly risky ads is larger. Therefore, the average CTR reported in the table for unsafe (0.49%) and highly risky (0.47%) may change if we use a larger dataset for unsafe ads. However, the comparison of the safe ads CI Vs. unsafe ads CI, does not provide any evidence that unsafe ads are actually reaching lower CTR values than safe ads. Even, if we would consider as valid the lowest value in the CTR CI of unsafe ads, i.e., 0.365, the CTR difference would be less than 10%. Therefore, our results suggest that malvertisers are savvy users that are able to achieve similar CTR values when compared to professional advertisers.
In the case of highly risky ads the confidence interval the size of the data sample avoids extracting a statistically significant conclusion. The average CTR in our dataset associated to landing pages classified as Malicious Sites and Phishing websites is equal to 0.51% an 0.48%, respectively (although CTR average values of unsafe and highly risky ads are not statistically significant, we will use them in Section 5.1 to perform a ballpark estimation of the overall impact of malvertising in Facebook).
In a nutshell, our results suggest that potential malvertisers are savvy users that carefully design the ad campaigns (e.g., target group, ad creativity, etc.) to achieve similar CTR values than professional advertisers.
4.3. Comparing Malvertising in Facebook vs. Web Sites
We explore whether regular websites expose users to a larger portion of unsafe ads and malvertisers as compared to FB, and even more important whether the portion of users exposed to unsafe ads is similar in regular websites and FB. To this end, we are using two datasets that include information from ads delivered to real users in FB and the WEB, respectively. As we already mentioned, the WEB dataset just includes tens of thousands of ads and few hundred users. Hence, the results of our analysis cannot be generalized to the whole WEB. Still, this experiment is a good proof of concept to infer whether the malvertising phenomenon is homogeneous across different online services or not. In summary, the concrete reported results are only valid for the datasets used in this work, but the outcome will be a signal of whether malvertising should be studied individually in each large online service.
Table 1 shows for FB (first row) and the WEB (second row) the percentage of: (i) total number of users, (ii) total number of ads, (iii) total number of advertisers, (iv) unsafe ads (PU_Ads), (v) highly risky ads (PHR_Ads), (vi) unsafe advertisers (PU_malvertisers), (vii) highly risky advertisers (PHR_malvertisers), (viii) users exposed to unsafe (PUEU) ads, and (ix) users exposed to highly risky ads (PUEHR).
The portion of unsafe ads is 3× higher in regular websites (0.5%) than in FB (0.17%). This difference is slightly reduced to 2× when only considering highly risky ads (0.12% for websites compared to 0.064% in FB). In contrast to this result, the portion of users exposed to unsafe ads in FB (32%) exceeds 1.5× the portion of users exposed in websites (21%). This difference increases to 2.5× if we only consider highly risky ads.
Therefore, the results reveal that, in the analyzed datasets, the probability of finding unsafe ads is higher in a regular website (according to our WEB dataset) than in FB, but the actual number of users exposed to malvertising is higher in FB. Overall, this result suggests that the exposure of users to malvertising differs between online services. This, in turn, recommends individually studying malvertising in large online systems to understand its actual impact.
4.4. Analysis of Malvertising in Facebook Across Demographic Groups
In this section we verify whether we can observe significant differences across different demographic groups regarding their exposure to malvertising. In particular, we focus on gender and age.
4.4.1. Gender
Table 3 shows for women and men: (i) the number of users, (ii) the number of ads, (iii) the percentage of unsafe ads, (iv) the percentage of highly risky ads, (v) the percentage of users exposed to unsafe ads, and (vi) the percentage of users exposed to highly risky ads. Similarly, Table 2 shows for women and men the average CTR and its confidence interval at the 95% level for all ads, safe ads, unsafe ads, and highly risky ads. As we already mentioned in Section 4.2.2, the number of unsafe and highly risky ads is very small when compared to safe ads. That is why the CIs that are associated to unsafe and highly risky ads are considerably larger when compared to the all and safe ads groups.
Unsafe ads are less than 0.2% of the ads for women and men, and at the same time more than 30% of both males and females are exposed to unsafe ads. The difference among the two groups is rather small (32.65% and 30.82% of men and women, respectively). The difference increases a bit when only focusing on highly risky ads, since 18.3% of the men are exposed to this type of ads as compared to only 14.9% of the women.
When considering safe (or all) ads male and female shows the same CTR equal to 0.4%. However, we observe relevant differences among male and females when focusing on unsafe ads. The CIs of men and women for unsafe ads are biased towards higher CTR values. This is especially relevant for the case of women, which suggests that women are more likely to click on unsafe ads than men.
Unfortunately, for the case of highly risky ads, we do not have enough data to raise statistically significant conclusions. This is denoted by the very large CIs obtained for men and women.
In summary, the gender is not a relevant parameter to determine the exposure of users to unsafe ads, but in contrast there are relevant differences in the interaction with the ads between women and men.
4.4.2. Age
We divided the FDVT users into the following age groups based on the division proposed by Erikson et al. [19]: 13–19 (Adolescence), 20–39 (Early-Adulthood), 40–64 (Adulthood) and 65+ (Maturity). Table 4 shows for each age group: (i) the number of users, (ii) the number of ads, (iii) the percentage of unsafe ads, (iv) the percentage of highly risky ads, (v) the percentage of users exposed to unsafe ads, and (vi) the percentage of users exposed to highly risky ads (note we did not compute CTR values for age because for some groups we did not have enough data).
As expected, unsafe ads represent a very small portion of the ads in all age groups ranging between 0.15% for users between 40–65 and 0.19% for users younger than 20. However, the portion of users exposed to malvertising ranges between 17% and almost 35% depending on the age group. The results reveal that users in Early-Adulthood group (34.7%) have more probability to receive unsafe ads, closely followed by users in the Adulthood group (31.6%). Mature people (27.2%) and, especially, adolescent users (17.4%) are less exposed to malvertising. We observe the same distribution when focusing on the subgroup of Highly Risky ads where the most exposed users (close to 20%) are in the two middle age groups.
In summary, middle age users that range between 20 and 65 years old are significantly more exposed to malvertising in FB than teenagers and senior people.
5. Discussion
5.1. Estimating Overall Impact of Malvertising in Facebook
The results reported in this paper reveal an important security problem. In order to illustrate the potential dimension of this problem, let us perform a ballpark estimation and extrapolate the results obtained in Section 4.2 to the whole FB ecosystem.
Facebook reports that more than 7 M advertisers use their advertising platform, where they can reach more than 2.4 B users [11]. In addition, although FB does not publicly release information about overall ad impressions, a report from 2012 informed that FB delivered more than 7 B ad impressions daily. Note that it is very likely this number is much higher nowadays. If we use these numbers along with the results obtained from the FDVT dataset analysis, we can perform a ballpark estimation in order to evaluate the overall impact of malvertising in FB.
Our estimation reveals that there could be more than 47 K (0.68%) malvertisers in Facebook delivering almost 12 M (0.17%) of ad impressions every day (which is a lower bound because we are using as reference data from 2012 reporting 7 B daily impressions). More than 777 M users (32.19%) could have been impacted by the malvertising activity within the 18-month period considered in our analysis. If we just focus on the highly risky group our estimation reduces the previous numbers to 22,400 malvertisers (0.32%), 4.5 M daily unsafe ad impressions (0.064%), and more than 428 M users exposed to malvertising (17.73%).
Even more, if we consider the CTR reported for unsafe ads (0.49%), 3.7 M users may have landed in websites managed by malvertisers. Similarly, almost 2 M users (CTR = 0.47%) may have landed in websites managed by Highly Risky malvertisers. If we zoom in our estimation into explicitly harmful website categories, the portion of FDVT users exposed to Potentially Unwanted Program (PUP) sites, Malicious Sites, and Phishing sites is 22.26%, 12%, and 7.03%, respectively. This means that around 537 M, 289 M, and 169 M users may have been exposed to ads linked to UP, Malicious, and Phishing sites, respectively. In addition, if we consider that the CTR in Malicious sites is 0.51%, almost 1.7 M FB users may have landed in one of them. This number would decrease to 801 K users for phishing sites (CTR = 0.48%) and would increase to 2.72 M users for PUP sites (CTR = 0.515%).
In a nutshell, despite that our results are just a rough estimation, they are revealing a serious security issue for Internet users browsing in Facebook and, by extension, in online services and websites monetized through online advertising. Our rough estimations suggest that, only in Facebook, hundreds of millions of users are exposed to malvertising, and few millions may have landed into highly risky websites (in the 18 month period of our study) that may compromise their security.
5.2. Solutions to Mitigate Malvertising
The results of our work urge the industry and the research community to propose solutions that mitigate the exposure of users to malvertising in order to protect users’ security.
The best option would be an industry-based solution involving key online advertising players. For instance, companies participating directly or indirectly on the delivery of ads (e.g., media agencies, Demand Side Platforms (DSPs), online social networks, like Facebook, Twitter, Linkedin, etc.), could work together to define automatic processes to detect and block advertisers whose ads may forward users to potentially unsafe websites. They could create, distribute and update blacklists of websites potentially run by malvertisers. Unfortunately, it is unlikely that this solution is adopted in the medium term due to: (i) the complexity of the ecosystem in which there are many intermediaries involved from the ad campaign design to the delivery of the ads to the users, and (ii) the perverse incentives of the ecosystem that, for many players, correlates the revenue they obtain and the number of ad impressions delivered. These players have very little incentives to proactively implement solutions that block ads impressions, since that may imply, to some extent, a revenue reduction.
A second alternative is to propose user-based solutions. Users can already protect themselves by installing ad blockers that try to block all of the ads delivered to a user. This solution will prevent users from receiving unsafe ads, but it also avoids the delivery of safe ads. Therefore, using ad blockers to solve malvertising may be an efficient solution, but at the same time it is harming an important economic sector such as the online advertising. This sector brings many benefits to the society, such as: jobs, technology innovation, etc. Therefore, we believe that ad blockers are not the right solution to malvertising.
Hence, given the facts: (i) it is unlikely that the online advertising ecosystem provides a short-term response and (ii) current technical solutions for users such as ad blockers have important collateral harmful effects. It is important that the research community implements tools that directly protect Internet users from being exposed to malvertising without penalizing the vast majority of safe ads delivered to the users. In the next section, we describe our contribution in this area that aims to block unsafe ads in FB.
6. Solution to Block Malvertising in Facebook
Our goal is to provide Facebook users with a simple yet efficient solution able to block unsafe ads. We faced three important challenges: (i) the proposed solution has to work in real-time, (ii) it has to be transparent to the user in a way that it does not impact the browsing quality of experience, and (iii) it has to run in the end-user premises in order to be as low-invasive as possible. Next, we describe the design and implementation of our solution to cover the referred challenges, and later we present some performance tests in order to validate our solution.
6.1. Design and Implementation
We have designed our solution as a web-browser add-on that the user can install and run transparently while browsing in FB.
The most challenging part is to be able to block unsafe ads in real-time without impacting the user’s quality of experience. We aim to block unsafe ads before they appear in the visible part of the FB wall of the user. If we manage to do so, the user will not even notice the existence of the ad. Our web-browser extension follows the next steps:
- Step 1—Identify ads: the first step is to identify ads in real-time while the users browse in Facebook. We borrow this functionality from the FDVT. Basically, we implement a code that is able to parse the HTML code the browser loads and detect the iframes where an ad is embedded.
- Step 2—Retrieve landing URL from the ad: FB includes in most of the delivered ads a URL that denotes the landing page where the user will eventually be forwarded in the case she clicks on the ad. Figure 4 shows the example of a FB ad with a green box highlighting the position where the landing URL is embedded. Our browser extension directly parses the HTML code of the ad and retrieves the landing URL embedded in the ad. This is a clean and very quick solution since: (i) it does not require to open any connection with the landing website and (ii) it can be done quickly enough to block the ad before it is displayed in the visible part of the screen. Note that FB loads the HTML code of an ad before it becomes visible in the screen. The ads will appear in the screen in the case the user scrolls down. Therefore, our goal is to detect and block ads before they reach the visible part of the screen.
- Step 3—Classify the landing domain as safe or unsafe: once we have retrieved the landing domain associated to the ad, we rely on the McAfee service used in this research to classify the domain as safe or unsafe. To this end, the browser extension will query the referred McAfee service and obtain the reputation field label. If the label is slightly or highly risky, we consider the ad as potentially unsafe. Note, we could be more or less conservative in our decision to classify an ad as unsafe. For instance, we could only select as unsafe ads the ones labeled as highly risky. Even more, our solution can be easily adapted to use (or combine) other domain classification services different than McAfee.
- Step 4—Blocking the ad: in the case, the step 3 returns that an ad is unsafe (note this information will be ready before the ad is visible in the screen), our extension will modify the HTML code hiding the iframe (i.e., div section of the HTML code) that embeds the unsafe ads. Eventually, if the user scrolls down, she will just watch all of the other loaded posts and ads, but will not notice that the extension has blocked an unsafe ad. We note there are previous works in the literature that already proposed to hide ads as an ad-blocking alternative [20].
There are already efficient solutions integrated in major browsers, such as Google Safe Browsing (https://safebrowsing.google.com/) or Microsoft SmartScreen (http://tiny.cc/6xm0jz), which warn users when they try to access a website these systems consider unsafe. In addition, personal and enterprise firewalls usually operate with databases that include blacklists of unsafe domains. This allows the network administrator configuring the firewall to block any outgoing connection that tries to reach potentially unsafe domains (e.g., Palo Alto Networks (https://tinyurl.com/y6xrefms), Cisco (https://tinyurl.com/y9ll9w7t), etc.).
Our solution does not aim to compete with any of these solutions, but just complement them in the particular case of FB. The main improvement of our solution is that we avoid the exposure of the user to the malicious ad. Instead, the referred solutions would only act in the case the user clicks on the ad and it is redirected to a domain they consider malicious. Therefore, we believe our extension is a step further in the protection of FB users that is complementary to the existing solutions.
Finally, it is important to note that the proposed solution is only valid for PC environments, but, unfortunately, does not work in mobile devices. Currently, it is not feasible to implement this (or a similar) solution for mobile devices. This would require creating an application for mobile devices able to monitor ads delivered in the FB app. However, mobile operative systems (OS) do not allow such monitoring activity from applications created by external developers.
6.2. Performance Evaluation
We have used two parameters to evaluate the performance of our solution: (i) portion of ads for which we are able to detect the landing page and (ii) time to block unsafe ads, which refers to the time since the HTML code of the ad is loaded in the browser until the browser extension modifies the HTML code to hide the ad in the case it is unsafe.
We used a subset of 40 K ads collected from the FDVT in August 2019 in order to evaluate our capacity to detect landing URLs in ads. We identified the landing URL in 97% of these ads. This result implies that our web browser extension will be able to detect the vast majority of unsafe ads delivered to users.
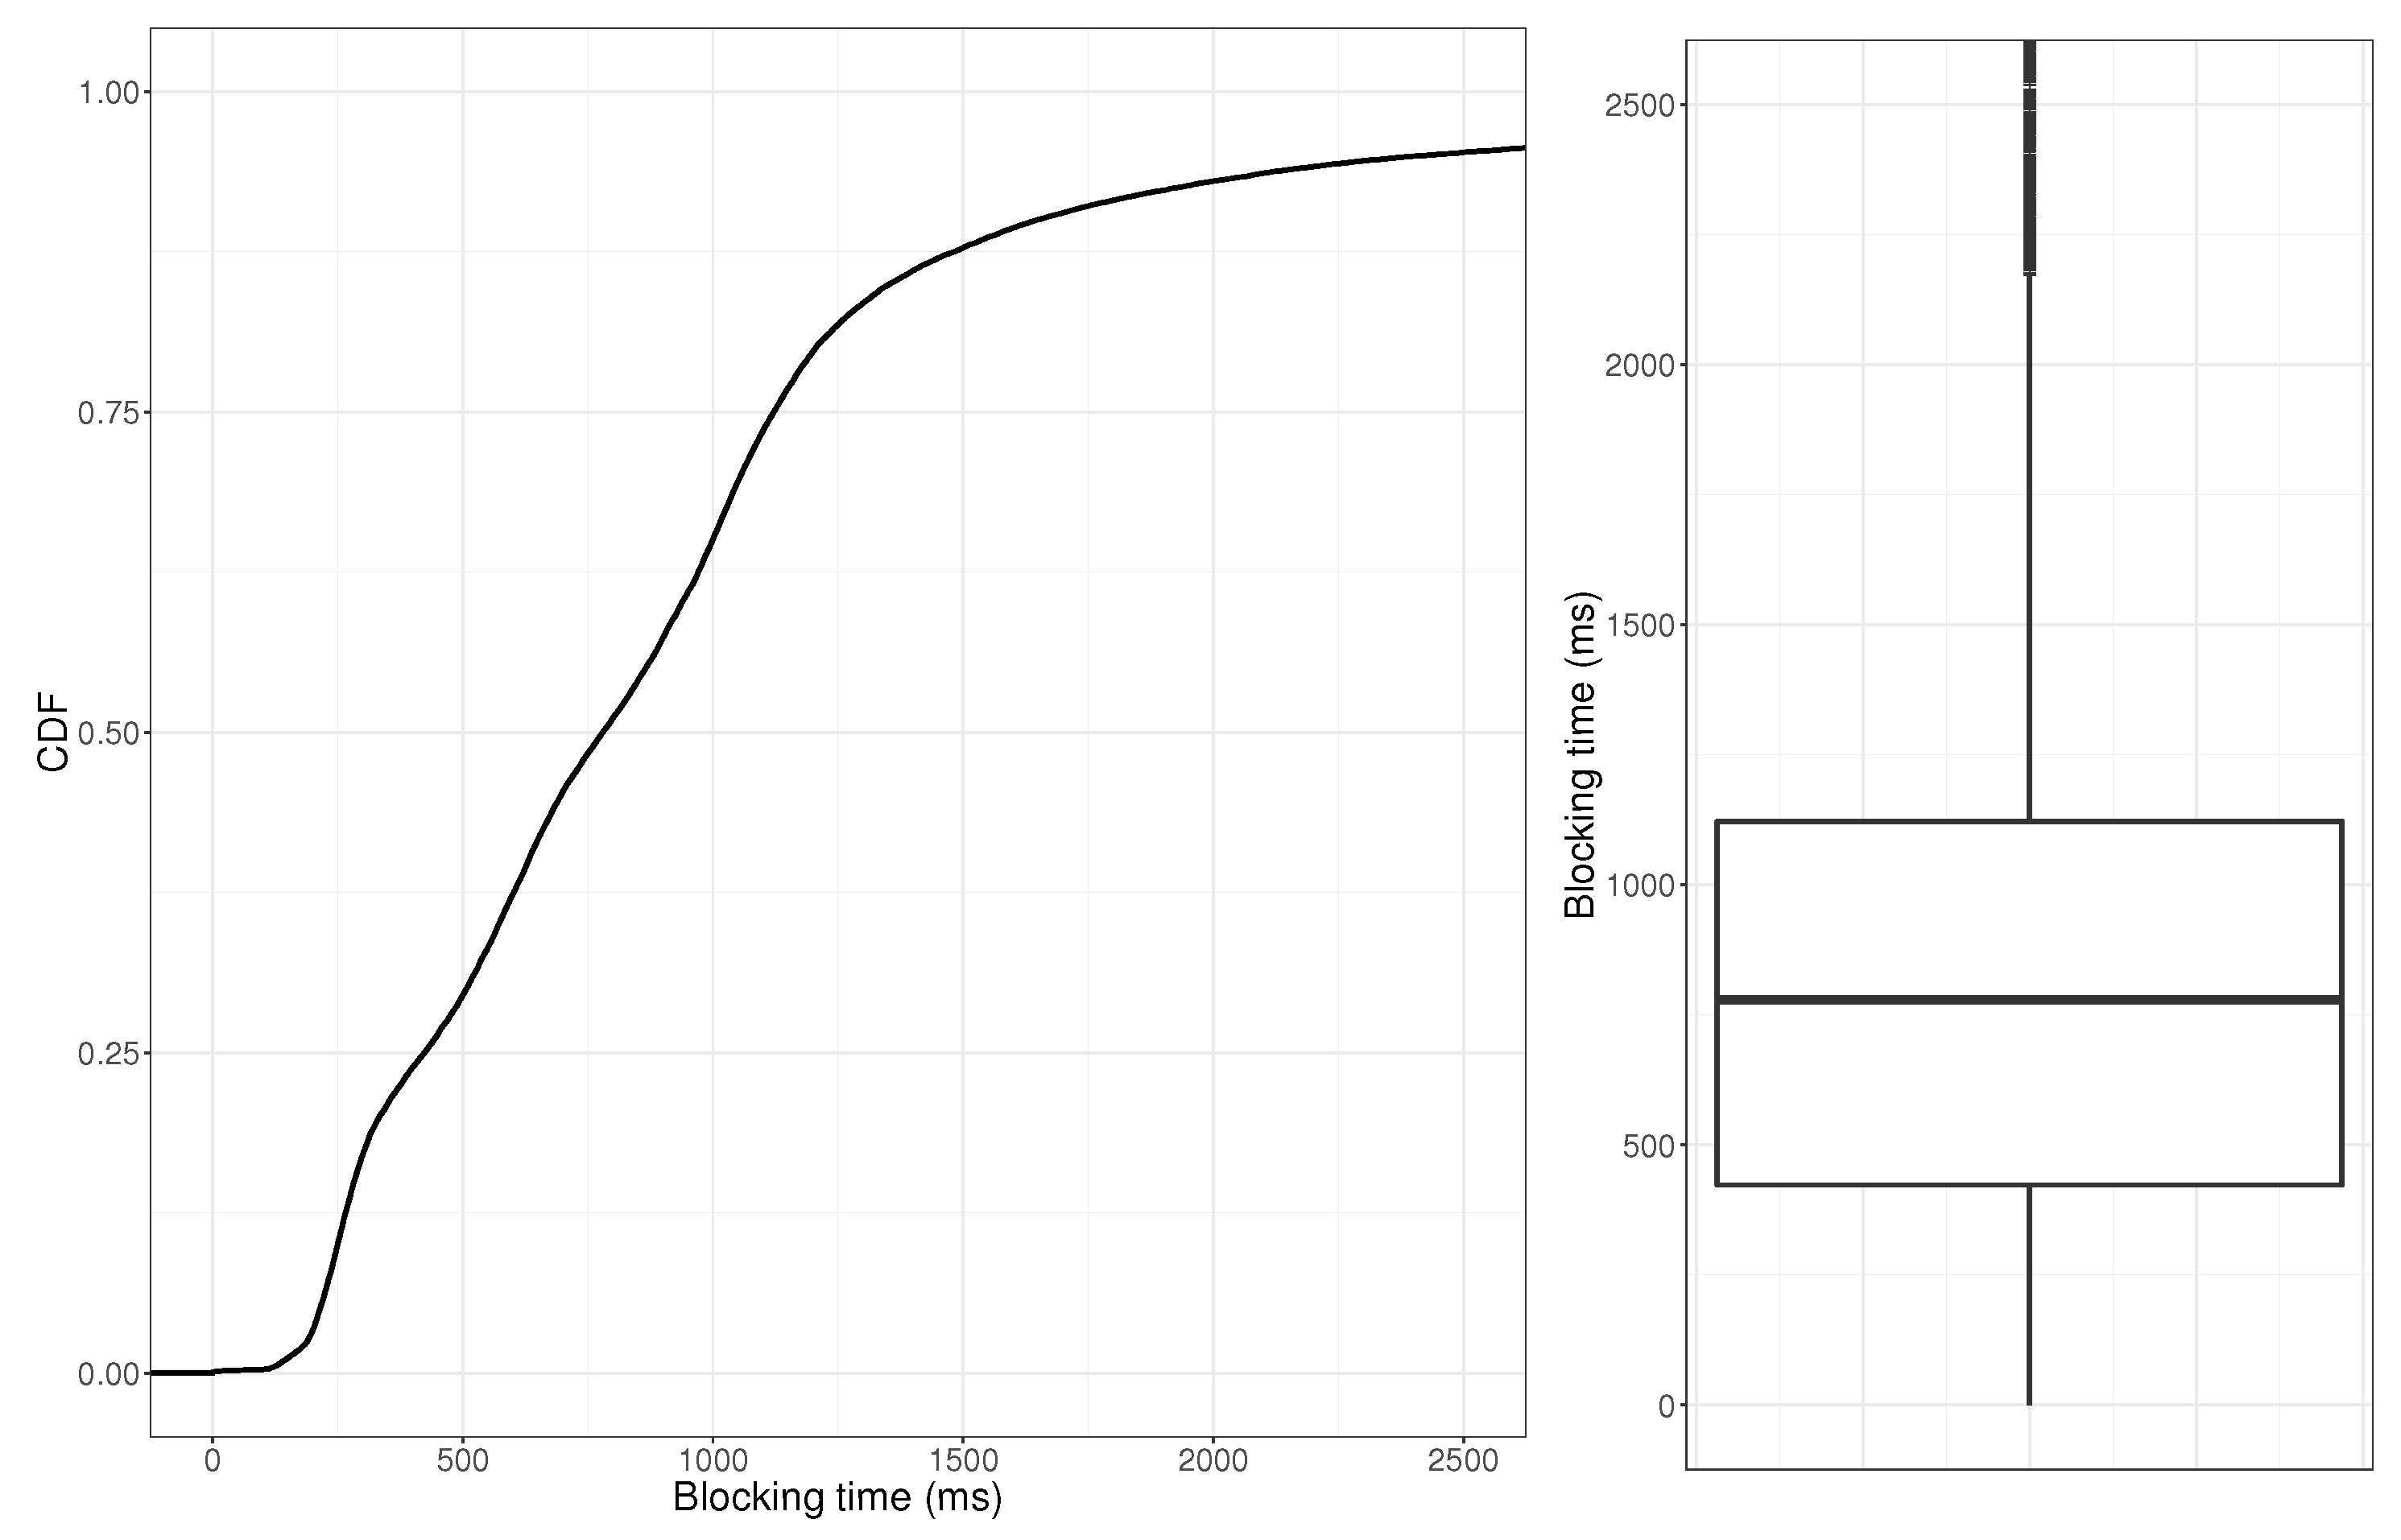
We used the same subset of ads to compute the time our solution requires to block the ads (to increase the volume of ads in our experiment we used both safe and unsafe ads indistinguishably. For this experiment the type of ad is irrelevant). Figure 5 shows the CDF and its associated boxplot for the blocking time across the 40 K ads. In median, our solution needs less than 800 ms to block an ad. Even more, for 90% of them our solution spent less than 2 s to hide the ads. Usually, the human process to scroll down in the screen to get the (unsafe) ad visible in the screen requires several seconds. Therefore, we conclude that our solution is transparent and it does not impact the browsing quality of experience of the users in FB.
6.3. Solution Release
Currently, the FDVT web browser extension has been extended to include the unsafe ad blocking functionality. The FDVT is a validated extension in the Google Chrome and Firefox stores. This implies that all of the users that have updated the FDVT to the latest version are already enjoying the unsafe ad blocking functionality.
In addition, we are developing a separated web browser extension that only implements the malvertising blocking functionality. Our goal is targeting users that are not interested in the FDVT main functionality but may be interesting on blocking unsafe FB ads. This extension will be submitted for evaluation both in Google Chrome and Firefox stores. The browser extension will be publicly available free of charge as soon as Firefox and Google approve it.
6.4. Future Improvements
We have in mind further improvements for our browser extension to: (i) improve the privacy of the users in the very unlikely case that McAfee implements an attach to infer personal information through the received queries and (ii) include a cache to reduce the time to decide whether to block and ad or not in case that ad belongs to an advertiser that have recently delivered and to the user.
6.4.1. Privacy Improvement
Our browser extension sends queries to McAfee that include the advertisers that have reached a particular user. Some of those advertisers may be targeting users based on personal information. Therefore, if McAfee implements a malicious behaviour could try to use all of the queries coming (for instance) from the same IP address and user agent to create a personal profile from the user behind that IP address and user agent.
Note that, to the best of our knowledge, there is no evidence regarding whether it is possible to infer an accurate user profile by just using as proxy the ads the user receives. Therefore, without a previous research study answering that question, we cannot calibrate the risk of the described attack.
Therefore, we will be mitigating the risk associated with a potential attack from McAfee’s side if we can introduce some extra features that increase the noise in the information McAfee receives from our browser extension.
This privacy improvement should not increase the decision time of our solution. This means that the solution still has to work in real-time. Therefore, we have discarded any solution based on cryptography because we cannot guarantee that it will allow us to meet the real-time requirement.
We propose extending our solution with a k-anonymity [21] approach. This is a very simple solution that significantly increases the noise of the signals received by McAfee and, at the same time, does not impact the performance of our solution. Every time an ad is identified, we will generate k queries to McAfee, where k is a low number ranging between three and five. One of the queries will contain the actual landing page associated with the ad, while the remaining queries will include domains picked at random from a predefined list. For instance, that list could be created using the Top 100 K/1 M sites from the Alexa Ranking (https://www.alexa.com/topsites). This way, most of the information McAfee could infer from a user would be actually noise. Note that, the k-anonymity solution implies a factor-k performance degradation on the inference of the profile of a user.
6.4.2. Adding a Cache
Sometimes users receive during some time (e.g., several hours or days) ads coming from the same advertiser. We plan to add a cache to our solution that stores the McAfee answer for all of the advertisers (i.e., landing pages) queried in the last week. This has two benefits: (i) for those advertisers stored in the cache we will reduce the time required to block unsafe ads; and, (ii) we will reduce the number of queries the browser extension sends to McAfee.
7. Related Work
The relevance of online advertising as one of the major sources of revenue in the Internet has attracted the attention of researchers in two major areas: (i) improving the efficiency of the online advertising ecosystem [22,23,24,25,26,27] and (ii) increasing the transparency and protection of Internet users exposed to online advertising. Our work fits in the second area. We organize the discussion of the related work into works addressing transparency and data protection in the online advertising ecosystem and works addressing malvertising.
7.1. Transparency and Data Protection
Most of the research carried out to protect users in the online advertising ecosystem focuses on protecting users’ privacy and creating transparency regarding the way online services exploit personal data [28,29,30,31,32,33]. In particular, and more related to our work, we can already find few works that create awareness and transparency regarding the exploitation of personal information in the case of Facebook [16,34,35,36,37,38]. In [34], the authors show how Facebook third-party tracking JavaScript can be exploited by an attacker to retrieve personal data (e.g., mobile phone numbers) associated with users visiting the attacker’s website. In [35], the authors demonstrate that FB ad preferences can be used to apply negative discrimination in advertising campaigns (e.g., excluding people based on their race). In [36], the authors analyze the sources of Personal Identifiable Information (PII) in Facebook, and how these sources are later used for PII-based targeted advertisement. In [37], the authors audit the ad selection algorithm in Facebook probing that users with particular demographic parameters are more/less likely to be exposed to certain types of ads. For instance, they show that ads that are related to jobs in the lumber industry are delivered to over 90% men and 70% white users, while ads for janitors are delivered to over 65% women and 75% black users. In [38], the authors demonstrate that up to 73% of FB users in Europe can be assigned sensitive ad preferences according to the definition of sensitive data included in the recent General Data Protection Regulation (GDPR) that applies to all European Union countries. Finally, in [16], the authors quantify that between 10% and 15% of the information received by users in its Facebook wall are ads. Even more, some users are systematically exposed to higher volume of ads than others.
7.2. Malvertising
Although transparency and privacy are the main research areas within the online advertising context, we can find a relevant body of literature in the last five years covering the “Malvertising” problem from different angles.
Some works [6,7,8,9,10] analyze ads that include some code (e.g., javascript) that looks for vulnerabilities within the user device to eventually compromising the device. Some of these works propose solutions to detect this type of ads and block them before being delivered to the user. In [6], the authors apply a Bayesian game theoretic approach analyzing numeric simulation over multiple game strategies and compute the Bayesian Nash equilibrium in order to extract insights that can be used by ad networks in order to identify potentially unsafe ads. In [7], the authors analyze 15,000 ads, from which they extract nine different features to train a Support Vector Machine (SVM) classifier that aims to detect unsafe ads. In [8], the authors analyze click-fraud malvertising in the mobile ecosystem and found that six out of the eight advertising networks analyzed are vulnerable to the bots authors implemented to perform click-fraud attacks. The authors propose three qualitative solutions to reduce the click-fraud: using faked advertisement banners to detect fraudulent clicks, filtering out program-generated touch events, and detect and filter anomalous behaviours. In [9], the authors also focus on the mobile ecosystem and analyze almost 500 K applications from Google Play, and more than 400 K from different app stores in China. They run an automatic test launching the apps and analyzing the ads they receive as well as the intermediaries involved. Overall, they analyzed more than 1 M connections from the apps to external links. In the case of Google Play, they found 948 malicious URLs coming from 64 unique domains, while, in the case of the Chinese apps, they detected 1475 malicious URLs coming from 139 unique domains. Finally, a recent study [10], which also focuses on the mobile ecosystem, presents a novel framework referred to as MAdLife that captures all of the in-app ad traffic generated during the complete ad’s lifespan. Using this framework, the authors automatically analyzed 5.7 K Android apps crawled from the Google Play store, and collected 83 K ads, from which 57 K ads were landing in a conventional web page. The authors found that 1.49% of those 57 K ads were unsafe. In addition, authors found 37 click-fraud apps and demonstrated that fraudulent apps expose users to a considerable higher number of unsafe ads.
Our work makes several novel contributions to the the malvertising literature: (i) our work is the first one focusing on Facebook. (ii) all of the works in the literature implement software that deploys bots to emulate user browsing in the web and/or mobile apps. Later, they analyze the ads delivered to the referred software, intermediary third-parties and landing pages. This methodology is valid for analyzing how many apps or websites are exposed to potentially unsafe ads but cannot quantify how many users are actually exposed to malvertising. Hence, overall, the proposed methodologies fail to measure the actual number/portion of users exposed to malvertising. Our work is the first one that analyzes ads delivered to real users, which allows quantifying the actual exposure of users to malvertising; (iii) Our dataset (+5 M ads) exceeds in several orders of magnitude existing datasets used to study malvertising (tens of thousands of ads); and, (iv) some of the existing works in the literature propose solutions to mitigate the malvertising problem. However, these solutions propose to remove unsafe ads from the inventory in the supplier side (e.g., ad network). These solutions may be eventually very efficient, but the main drawback is that they depend on the willingness of the supplier to implement them. In contrast, we propose a solution on the user’s side that does not require any proactive intervention or approval from the online advertising industry.
8. Conclusions
The main contribution of this paper is that it reveals a worrying security problem. Our estimations suggest that hundreds of millions of users may be exposed to malvertising only in Facebook. Even more, few millions of those users may have landed in highly risky websites, such as malware or phishing websites, in the period of 18 months covered in our study. This is a serious issue that would require a quick and efficient solution from the online advertising ecosystem, but, unfortunately, we are pessimistic this reaction may take place in the short-term. Unfortunately, existing solutions, like ad blockers, which do not require the intervention of online advertising companies, penalize the whole online advertising ecosystem blocking indistinguishably safe and unsafe ads. This has harmful direct and indirect effects in legitimate companies that are not involved in any fraudulent activity. To contribute to mitigating the malvertising problem on Facebook without impacting legitimate players, we introduce a web-browser extension that blocks unsafe ads in real-time transparently without impacting the user’s quality of experience. Finally, it is worth noting that our solution is easily extensible to block unsafe ads in other online services (e.g., websites, other social networks, etc.). It just requires a minor update to identify in real-time the ad iframe and the landing domain associated to the ad in the online service where we want to apply our solution. Hence, our short-term plan is to extend our solution to block malvertising in other online services beyond Facebook.
Author Contributions
Conceptualization, Á.C. and R.C.; methodology, A.A., J.G.-C., Á.C. and R.C.; software, A.A. and J.G.-C.; validation, A.A., J.G.-C., Á.C. and R.C.; investigation, A.A., J.G.-C., Á.C. and R.C.; data curation, A.A. and J.G.-C.; writing, A.A., J.G.-C., Á.C. and R.C.; visualization, A.A. and J.G.-C.; supervision, Á.C. and R.C.; project administration, Á.C.; funding acquisition, Á.C. and R.C. All authors have read and agreed to the published version of the manuscript.
Funding
The research leading to these results has received funding from: the European Union’s Horizon 2020 innovation action programme under grant agreement No 786741 (SMOOTH project) and the gran agreement No 871370 (PIMCITY project); the Ministerio de Economía, Industria y Competitividad, Spain, and the European Social Fund(EU), under the Ramón y Cajal programme (grant RyC-2015-17732); the Ministerio de Educación, Cultura y Deporte, Spain, through the FPU programme( Grant FPU16/05852); the Ministerio de Ciencia e Innovación under the project ACHILLES (Grant PID2019-104207RB-I00); the Community of Madrid synergic project EMPATIA-CM (Grant Y2018/TCS-5046); and the Fundación BBVA under the project AERIS.
Conflicts of Interest
The authors declare that there is no conflict of interest.
References
- PriceWaterhouseCoopers. IAB Internet Advertising Revenue Report 2018 Full Year Results. 2018. Available online: https://www.iab.com/wp-content/uploads/2019/05/Full-Year-2018-IAB-Internet-Advertising-Revenue-Report.pdf (accessed on 7 May 2019).
- Technology, I. The Economic Contribution of Digital Advertising in Europe. Technical Report. 2017. Available online: https://datadrivenadvertising.eu/wp-content/uploads/2017/09/DigitalAdvertisingEconomicContribution_FINAL.pdf (accessed on 17 August 2020).
- Jyotiyana, P.; Maheshwari, S. A Literature Survey on Malware and Online Advertisement Hidden Hazards. In Intelligent Systems Technologies and Applications 2016; Corchado Rodriguez, J.M., Mitra, S., Thampi, S.M., El-Alfy, E.S., Eds.; Springer International Publishing: Cham, Switzerland, 2016; pp. 449–460. [Google Scholar]
- Hong, J. The State of Phishing Attacks. Commun. ACM 2012, 55, 74–81. [Google Scholar] [CrossRef]
- GeoEdge Add Integrity. The Battle Against Auto-Redirects: Saving Publishers and Advertisers $1.13 Annually. Available online: https://site.geoedge.com/downloads/documents/Auto_Redirects.pdf (accessed on 17 August 2020).
- Huang, C.T.; Sakib, M.; Kamhoua, C.; Kwiat, K.; Njilla, L. A Bayesian Game Theoretic Approach for Inspecting Web-based Malvertising. IEEE Trans. Dependable Secur. Comput. 2018, 1. [Google Scholar] [CrossRef]
- Poornachandran, P.; Balagopal, N.; Pal, S.; Ashok, A.; Sankar, P.; Krishnan, M.R. Demalvertising: A Kernel Approach for Detecting Malwares in Advertising Networks. In Proceedings of the First International Conference on Intelligent Computing and Communication, Bengaluru, India, 18–20 September 2017; Mandal, J.K., Satapathy, S.C., Sanyal, M.K., Bhateja, V., Eds.; Springer: Singapore, 2017; pp. 215–224. [Google Scholar]
- Cho, G.; Cho, J.; Song, Y.; Choi, D.; Kim, H. Combating online fraud attacks in mobile-based advertising. EURASIP J. Inf. Secur. 2016, 2016, 2. [Google Scholar] [CrossRef] [Green Version]
- Rastogi, V.; Shao, R.; Chen, Y.; Pan, X.; Zou, S.; Riley, R. Are these Ads Safe: Detecting Hidden Attacks through the Mobile App-Web Interfaces. NDSS 2016. [Google Scholar] [CrossRef]
- Chen, G.; Meng, W.; Copeland, J. Revisiting Mobile Advertising Threats with MAdLife. In The World Wide Web Conference; ACM: New York, NY, USA, 2019; pp. 207–217. [Google Scholar] [CrossRef]
- Facebook. Facebook Reports Q2 2019 Results. 2019. Available online: https://investor.fb.com/investor-news/press-release-details/2019/Facebook-Reports-Second-Quarter-2019-Results/default.aspx (accessed on 17 August 2020).
- Emarketer.com. Google and Facebook Tighten Grip on US Digital ad Market. 2017. Available online: https://www.niemanlab.org/reading/google-and-facebook-tighten-grip-on-u-s-digital-ad-market/ (accessed on 17 August 2020).
- McAfee SECURE. Customer URL Ticketing System. Available online: https://www.trustedsource.org/ (accessed on 17 August 2020).
- González Cabañas, J.; Cuevas, A.; Cuevas, R. FDVT: Data Valuation Tool for Facebook Users. In Proceedings of the 2017 CHI Conference on Human Factors in Computing Systems, Denver, CO, USA, 6–11 May 2017; ACM: New York, NY, USA, 2017; pp. 3799–3809. [Google Scholar] [CrossRef]
- Iordanou, C.; Kourtellis, N.; Carrascosa, J.M.; Soriente, C.; Cuevas, R.; Laoutaris, N. Beyond content analysis: Detecting targeted ads via distributed counting. In Proceedings of the 15th International Conference on Emerging Networking Experiments and Technologies, Orlando, FL, USA, 9 December 2019. [Google Scholar]
- Arrate Galán, A.; González Cabañas, J.; Cuevas, M.; Calderón, M.; Cuevas Rumin, R. Large-Scale Analysis of User Exposure to Online Advertising on Facebook. IEEE Access 2019, 7, 11959–11971. [Google Scholar] [CrossRef]
- Jain, R.; Chiu, D.M.; Hawe, W. A Quantitative Measure of Fairness and Discrimination for Resource Allocation in Shared Computer Systems. arXiv 1998, arXiv:cs/9809099. [Google Scholar]
- Newcombe, R.G. Interval estimation for the difference between independent proportions: Comparison of eleven methods. Stat. Med. 1998, 17, 873–890. [Google Scholar] [CrossRef]
- Erikson, E.H.; Erikson, J.M. The Life Cycle Completed (Extended Version); WW Norton & Company: New York, NY, USA, 1998. [Google Scholar]
- Zhu, S.; Iqbal, U.; Wang, Z.; Qian, Z.; Shafiq, Z.; Chen, W. ShadowBlock: A Lightweight and Stealthy Adblocking Browser. In The World Wide Web Conference; ACM: New York, NY, USA, 2019; pp. 2483–2493. [Google Scholar] [CrossRef]
- Sweeney, L. k-Anonymity: A Model for Protecting Privacy. Int. J. Uncertain. Fuzziness Knowl.-Based Syst. 2002, 10, 557–570. [Google Scholar] [CrossRef] [Green Version]
- Sahni, N.S. Advertising Spillovers: Evidence from Online Field Experiments and Implications for Returns on Advertising. J. Mark. Res. 2016, 53, 459–478. [Google Scholar] [CrossRef]
- Johnson, G.A.; Lewis, R.A.; Nubbemeyer, E.I. Ghost Ads: Improving the Economics of Measuring Online Ad Effectiveness. J. Mark. Res. 2017, 54, 867–884. [Google Scholar] [CrossRef]
- Barford, P.; Canadi, I.; Krushevskaja, D.; Ma, Q.; Muthukrishnan, S. Adscape: Harvesting and Analyzing Online Display Ads. In Proceedings of the 23rd International Conference on World Wide Web, Seoul, Korea, 7–11 April 2014; ACM: New York, NY, USA, 2014; pp. 597–608. [Google Scholar] [CrossRef]
- Yuan, S.; Wang, J.; Zhao, X. Real-time Bidding for Online Advertising: Measurement and Analysis. In Proceedings of the Seventh International Workshop on Data Mining for Online Advertising, Chicago, IL, USA, 11 August 2013; ACM: New York, NY, USA, 2013; pp. 3:1–3:8. [Google Scholar] [CrossRef]
- Schumann, J.H.; von Wangenheim, F.; Groene, N. Targeted Online Advertising: Using Reciprocity Appeals to Increase Acceptance among Users of Free Web Services. J. Mark. 2014, 78, 59–75. [Google Scholar] [CrossRef]
- McCoy, S.; Everard, A.; Galletta, D.F.; Moody, G.D. Here we go again! The impact of website ad repetition on recall, intrusiveness, attitudes, and site revisit intentions. Inf. Manag. 2017, 54, 14–24. [Google Scholar] [CrossRef]
- Ullah, I.; Boreli, R.; Kaafar, M.A.; Kanhere, S.S. Characterising user targeting for in-App Mobile Ads. In Proceedings of the 2014 IEEE Conference on Computer Communications Workshops (INFOCOM WKSHPS), San Francisco, CA, USA, 20–24 May 2014; pp. 547–552. [Google Scholar] [CrossRef]
- Carrascosa, J.M.; Mikians, J.; Cuevas, R.; Erramilli, V.; Laoutaris, N. I Always Feel Like Somebody’s Watching Me: Measuring Online Behavioural Advertising. In Proceedings of the 11th ACM Conference on Emerging Networking Experiments and Technologies, Heidelberg, Germany, 1–4 December 2015; ACM: New York, NY, USA, 2015; pp. 13:1–13:13. [Google Scholar] [CrossRef] [Green Version]
- Vallina-Rodriguez, N.; Shah, J.; Finamore, A.; Grunenberger, Y.; Papagiannaki, K.; Haddadi, H.; Crowcroft, J. Breaking for Commercials: Characterizing Mobile Advertising. In Proceedings of the 2012 Internet Measurement Conference, Boston, MA, USA, 14–16 November 2012; ACM: New York, NY, USA, 2012; pp. 343–356. [Google Scholar] [CrossRef]
- Parra-Arnau, J.; Achara, J.P.; Castelluccia, C. MyAdChoices: Bringing Transparency and Control to Online Advertising. ACM Trans. Web 2017, 11, 7:1–7:47. [Google Scholar] [CrossRef]
- Estrada-Jiménez, J.; Parra-Arnau, J.; Rodríguez-Hoyos, A.; Forné, J. Online advertising: Analysis of privacy threats and protection approaches. Comput. Commun. 2017, 100, 32–51. [Google Scholar] [CrossRef] [Green Version]
- Englehardt, S.; Narayanan, A. Online Tracking: A 1-million-site Measurement and Analysis. In Proceedings of the 2016 ACM SIGSAC Conference on Computer and Communications Security, Vienna, Austria, 24–28 October 2016; ACM: New York, NY, USA, 2016; pp. 1388–1401. [Google Scholar] [CrossRef]
- Venkatadri, G.; Andreou, A.; Liu, Y.; Mislove, A.; Gummadi, K.P.; Loiseau, P.; Goga, O. Privacy Risks with Facebook’s PII-Based Targeting: Auditing a Data Broker’s Advertising Interface. In Proceedings of the 2018 IEEE Symposium on Security and Privacy (SP), San Francisco, CA, USA, 20–24 May 2018; pp. 89–107. [Google Scholar] [CrossRef] [Green Version]
- Speicher, T.; Ali, M.; Venkatadri, G.; Ribeiro, F.N.; Arvanitakis, G.; Benevenuto, F.; Gummadi, K.P.; Loiseau, P.; Mislove, A. Potential for Discrimination in Online Targeted Advertising. In Proceedings of the 1st Conference on Fairness, Accountability and Transparency, New York, NY, USA, 23–24 February 2018; Friedler, S.A., Wilson, C., Eds.; Machine Learning Research. PMLR: New York, NY, USA, 2018; Volume 81, pp. 5–19. [Google Scholar]
- Venkatadri, G.; Lucherini, E.; Sapiezynski, P.; Mislove, A. Investigating sources of PII used in Facebook’s targeted advertising. Proc. Priv. Enhancing Technol. 2019, 2019, 227–244. [Google Scholar] [CrossRef] [Green Version]
- Ali, M.; Sapiezynski, P.; Bogen, M.; Korolova, A.; Mislove, A.; Rieke, A. Discrimination through optimization: How Facebook’s ad delivery can lead to skewed outcomes. Proc. ACM Hum.-Comput. 2019, 3, 199. [Google Scholar] [CrossRef] [Green Version]
- Cabañas, J.G.; Cuevas, Á.; Cuevas, R. Unveiling and Quantifying Facebook Exploitation of Sensitive Personal Data for Advertising Purposes. In Proceedings of the 27th USENIX Security Symposium (USENIX Security 18); USENIX Association: Baltimore, MD, USA, 15–17 August 2018; pp. 479–495. [Google Scholar]
Figure 1.
Example of a real malvertising ad delivered to a real FB user.

Figure 2.
Snapshot of the message shown by our institution when clicking on the ad depicted in Figure 1. The click action redirects the user to a malvertiser landing domain. The connection was blocked by our institution firewall because the landing domain is identified as unsafe. Some text in the figure is hidden for double-blind review.

Figure 3.
This figure is a bar plot that shows the McAfee domain topics that are related to more than 10% of the ad impressions in our dataset for: Safe ads, Slightly Risky ads and Very Risky ads. The x axis shows the topics and the y axis the presence of each topic in percentage. The sum of percentages in a specific group of ads could go beyond 100% because McAfee may label a domain using up to three topic labels, thus an ad impression may be linked to up to three topics.

Figure 4.
Ad example that illustrates where the lading domain information is embedded in the ad using a green box.
Figure 4.
Ad example that illustrates where the lading domain information is embedded in the ad using a green box.

Figure 5.
CDF (left) and boxplot (right) that represent the time our solution requires to block ads. The depicted results are obtained from a subset of 40 K ads.
Figure 5.
CDF (left) and boxplot (right) that represent the time our solution requires to block ads. The depicted results are obtained from a subset of 40 K ads.


Table 1.
This table shows in the first row for Facebook (FDVT dataset) and in the second row for regular Websites (websites dataset): (i) total number of users, (ii) total number of ads in the dataset, (iii) total number of advertisers, (iv) percentage unsafe ads (PU_Ads), (v) percentage highly risky ads (PHR_Ads), (vi) percentage of malvertisers (P_malvertisers), (vii) percentage of highly risky malvertisers (PHR_malvertisers), (viii) percentage of users exposed to unsafe ads (PUEU) ads, and (ix) percentage of users exposed to highly risky ads (PUEHR).
| Total Users | Total Ads | Total Advertisers | PU_Ads | PHR_Ads | PU_Malvertisers | PHR_Malvertisers | PUEU | PUEHR | |
|---|---|---|---|---|---|---|---|---|---|
| 3001 | 5,302,179 | 122,743 | 0.17% | 0.064% | 0.68% | 0.32% | 32.19% | 17.73% | |
| Web | 589 | 41,149 | 20,563 | 0.5% | 0.12% | 0.52% | 0.19% | 20.74% | 7.19% |
Table 2.
This table shows the average Click Through Ratio (CTR) and its associated confidence interval at the 95% level using the Wilson Score Interval method. The CTR is reported in percentage. The table includes the results for level All, Safe, Unsafe, and Highly Risky ads retrieved from the FDVT dataset for the following demographic groups: all users, men, and women.
| All Users | Men | Women | ||||
|---|---|---|---|---|---|---|
| Avg. CTR (%) | CI 95% (%) | Avg. CTR (%) | CI 95% (%) | Avg. CTR (%) | CI 95% (%) | |
| All users | 0.4 | (0.395, 0.406) | 0.4 | (0.394, 0.406) | 0.4 | (0.387, 0.414) |
| Safe | 0.4 | (0.395, 0.405) | 0.4 | (0.394, 0.406) | 0.4 | (0.387, 0.414) |
| Unsafe | 0.49 | (0.365, 0.657) | 0.44 | (0.308, 0.627) | 0.81 | (0.425, 1.537) |
| Highly risky | 0.47 | (0.289, 0.763) | 0.46 | (0.263, 0.803) | 0.3 | (0.053, 1.691) |
Table 3.
This table shows for men and women in the FDVT dataset: (i) the number of users, (ii) the number of ads, (iii) the percentage of unsafe ads (PU_Ads), (iv) the percentage of highly risky ads (PHR_Ads), (v) the percentage of users exposed to unsafe ads (PUEU), and (vi) the percentage of users exposed to highly risky ads (PUEHR).
| Total Users | Total Ads | PU_Ads | PHR_Ads | PUEU | PUEHR | |
|---|---|---|---|---|---|---|
| Women | 498 | 846,248 | 0.13% | 0.039% | 30.82% | 18.26% |
| Men | 2306 | 4,009,965 | 0.17% | 0.065% | 32.65% | 14.86% |
Table 4.
This table shows for age groups 13–19 (Adolescence), 20–39 (Early-Adulthood), 40–64 (Adulthood) and 65+ (Maturity) the following information: (i) the number of users, (ii) the number of ads, (iii) the percentage of unsafe ads (PU_Ads), (iv) the percentage of highly risky ads (PHR_Ads), (v) the percentage of users exposed to unsafe ads (PUEU), and (vi) the percentage of users exposed to highly risky (PUEHR).
| Total Users | Total Ads | PU_Ads | PHR_Ads | PUEU | PUEHR | |
|---|---|---|---|---|---|---|
| Adolescence (13–19) | 144 | 109,651 | 0.19% | 0.08% | 17.36% | 10.42% |
| Early-Adulthood (20–39) | 1661 | 2,964,483 | 0.17% | 0.06% | 34.68% | 18.3% |
| Adulthood (40–64) | 665 | 1,381,502 | 0.15% | 0.066% | 31.58% | 19.65% |
| Maturity (65+) | 19 | 27,239 | 0.18% | 0.086% | 27.2% | 14.72% |
© 2020 by the authors. Licensee MDPI, Basel, Switzerland. This article is an open access article distributed under the terms and conditions of the Creative Commons Attribution (CC BY) license (http://creativecommons.org/licenses/by/4.0/).
Share and Cite
MDPI and ACS Style
Arrate, A.; González-Cabañas, J.; Cuevas, Á.; Cuevas, R. Malvertising in Facebook: Analysis, Quantification and Solution. Electronics 2020, 9, 1332. https://doi.org/10.3390/electronics9081332
AMA Style
Arrate A, González-Cabañas J, Cuevas Á, Cuevas R. Malvertising in Facebook: Analysis, Quantification and Solution. Electronics. 2020; 9(8):1332. https://doi.org/10.3390/electronics9081332
Chicago/Turabian StyleArrate, Aritz, José González-Cabañas, Ángel Cuevas, and Rubén Cuevas. 2020. "Malvertising in Facebook: Analysis, Quantification and Solution" Electronics 9, no. 8: 1332. https://doi.org/10.3390/electronics9081332
Note that from the first issue of 2016, this journal uses article numbers instead of page numbers. See further details here.