1. Introduction
The understanding of energy consumption is changing in a society with demands for more sustainable energy, where energy policies carried out by governments and companies are creating a growing social consciousness. In this sense, renewable energies are a fundamental pillar in the compulsory (i.e., that the Earth cannot wait for) energy transition from fossil fuels to renewable sources [
1]. Having said that, the immediacy and security of the fossil fuels to guarantee the energy needs in any part of the world and under any circumstance need to be beaten with rationality. Except in very few parts of the world, it is rare that a single renewable source (wind, solar, geothermal, tidal, etc.) can meet the needs of a community. Therefore, the solution is to carry out an amalgamation of renewable energies, looking for the synergy between them that can assure production and demand all the time [
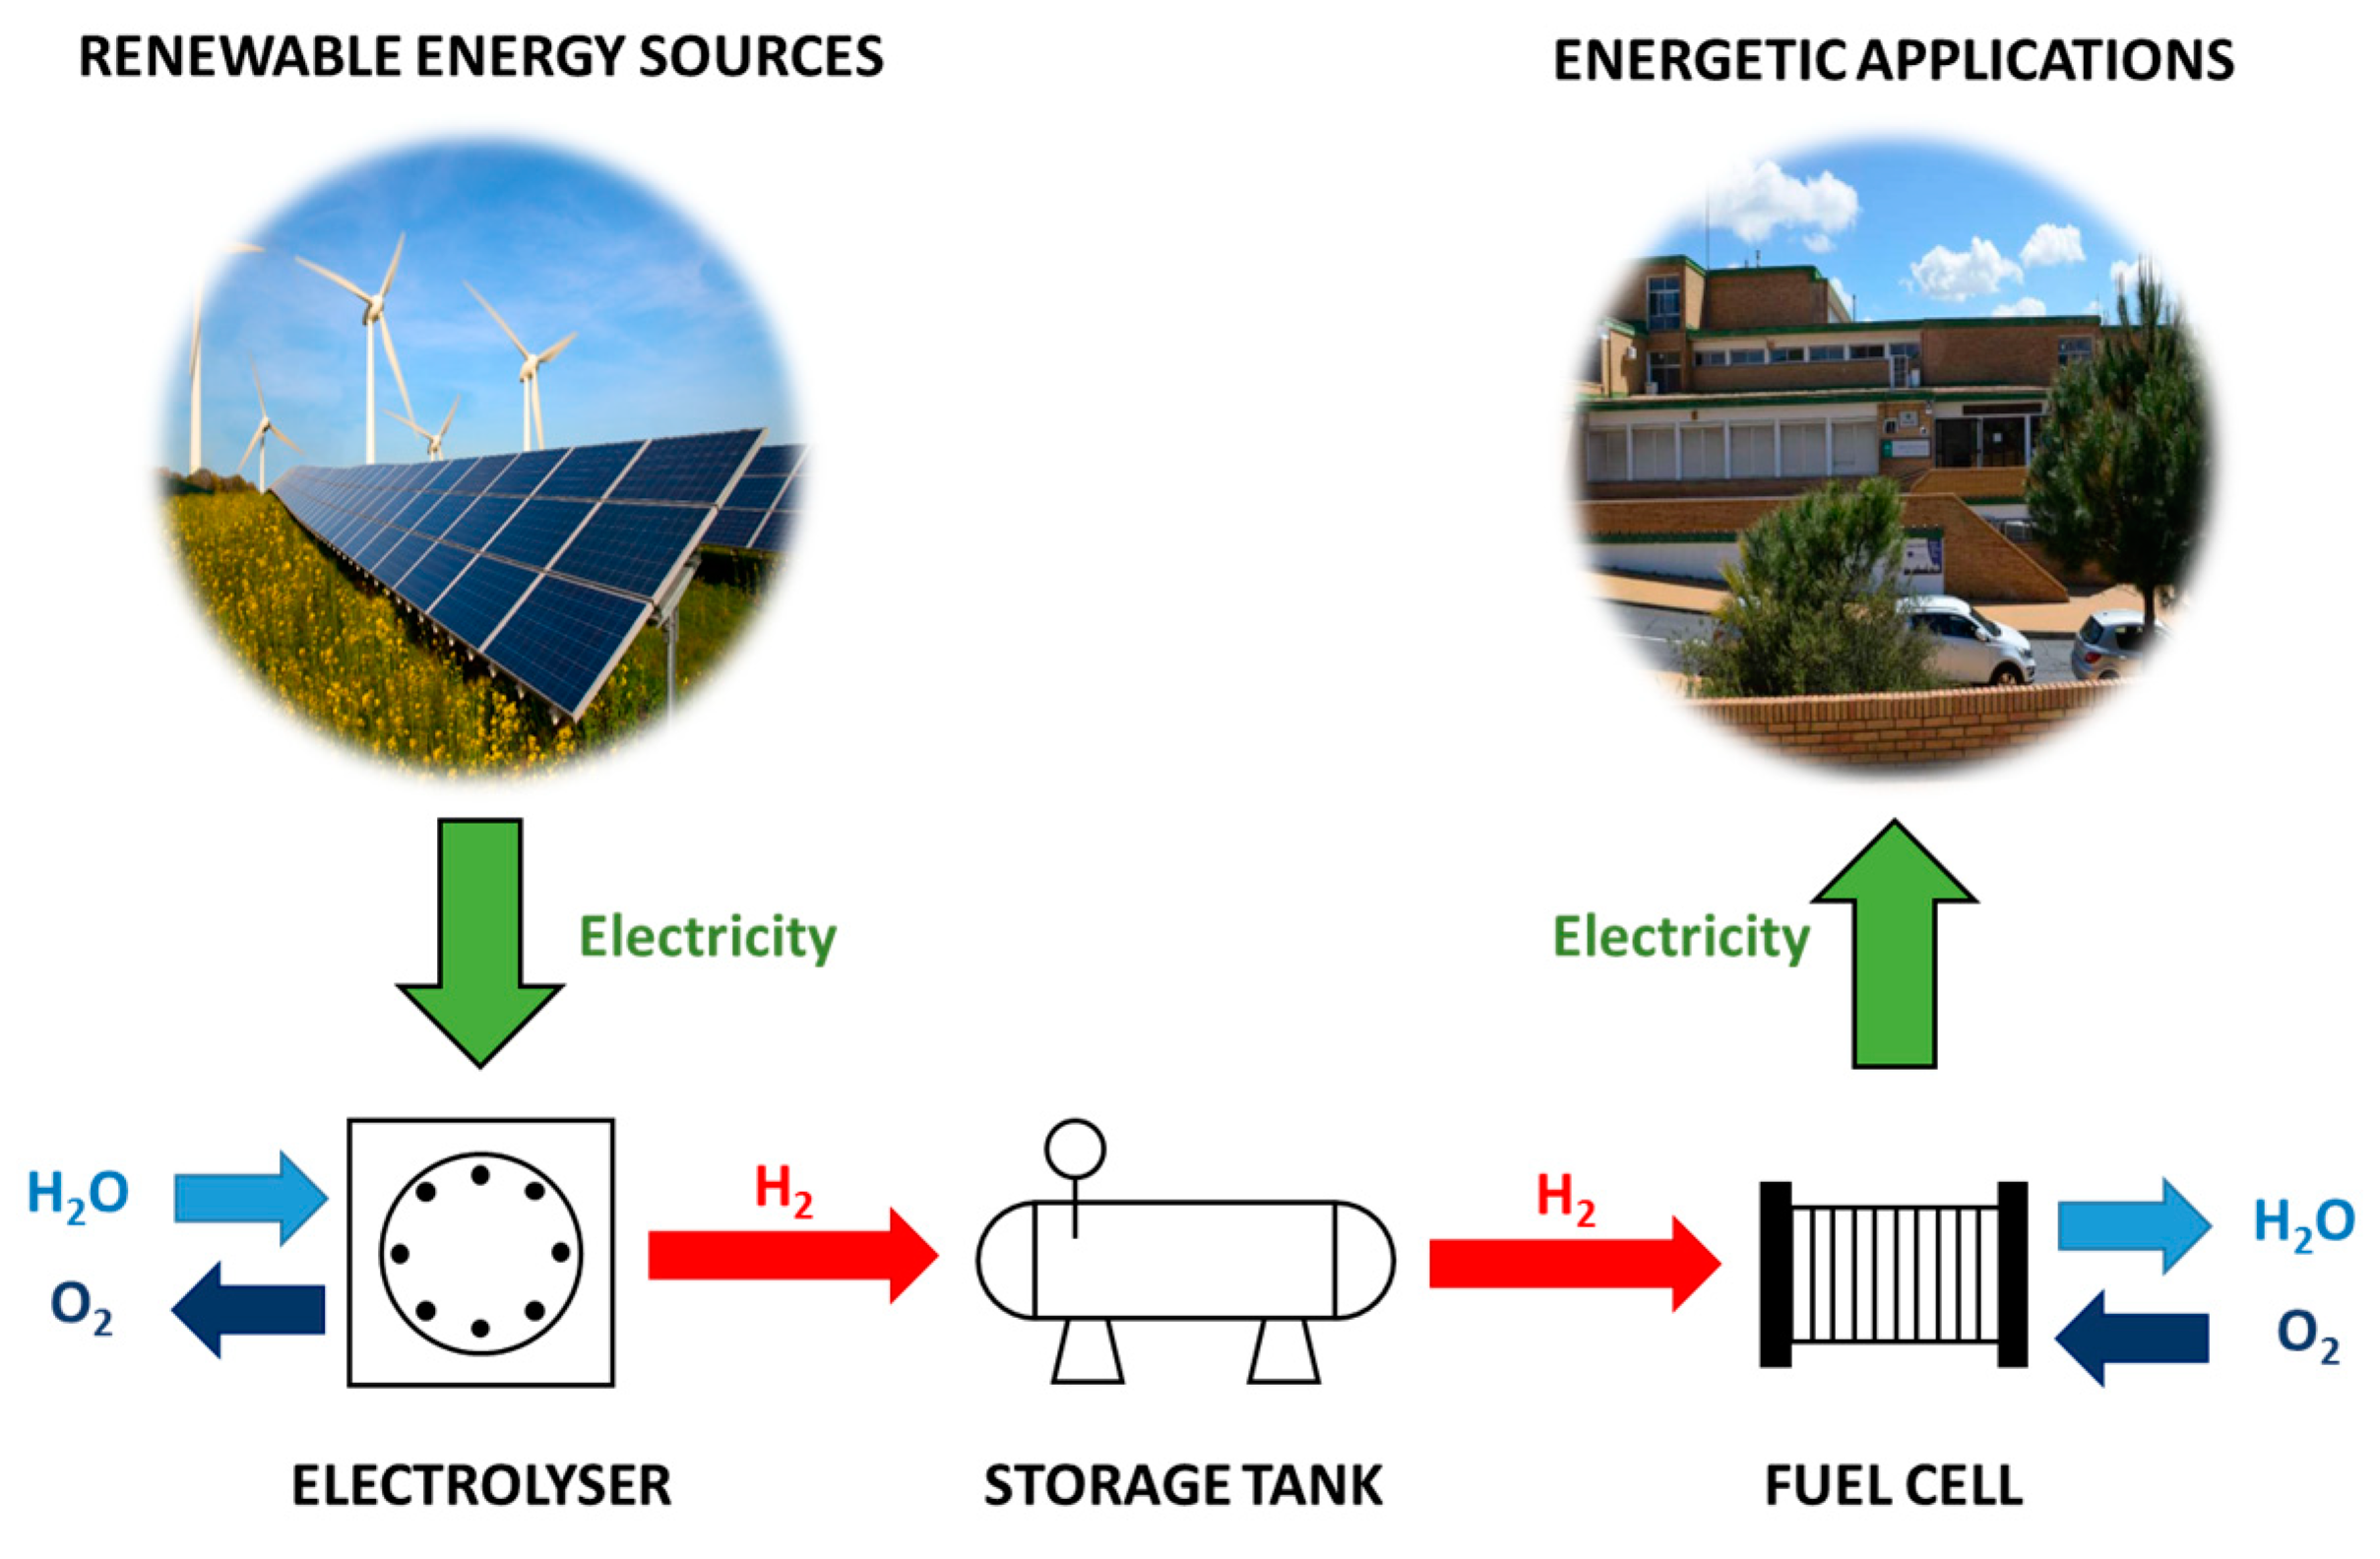
2]. In this scenario, hydrogen can play a pivotal role. Through an electrolyzer (hydrogen production) and fuel cells (electricity generation from hydrogen) integrated into renewable energy-based systems, energy demands can be met on a circular greenway (
Figure 1) [
3].
Regarding hydrogen production, various proposals can be found in the recent scientific literature on PEM electrolyzers, specifically when it comes to approaching balance of plant (BoP) design.
In 2011, Balaji et al. proposed an electrolysis plant for portable applications [
4]. The result was a low production electrolyzer with 0.08 Nm
3/h of hydrogen at 382 W of power consumption and an efficiency of 77.48%. Since the objective of this design is its mobility, it has a highly reduced BoP. The water management contains a tank that works as a filling tank as well as an oxygen separator. In the hydrogen production subsystem, there is a drying stage, made up of two silica gel desiccants that are alternated by electro valves, before reaching the storage tank. In terms of BoP, the system lacks a water filtering system, as well as a separation and venting system for the water that can condense along with the hydrogen produced.
A hydrogen-based system with higher capacity is presented in [
5] by means an electrolyzer of 1 kWe (the term kWe is referring to consumed electrical power), and 0.3 Nm
3/h, which focuses its study on the relationship between temperature and flow rate to obtain a system efficiency of 65% at 40 °C. The water subsystem in the BoP has a tank that includes the corresponding cooling system, an injection pump, and flow regulators through manual valves. In the hydrogen production subsystem of the BoP, there is an oxygen separator that returns the water to the system and works as a water inlet tank. The system also includes two gas separator tanks that act as refrigeration and drying system of the produced hydrogen.
An electrolyzer for direct coupling to photovoltaics is studied in [
6]. The study focuses on finding the best relationship between the number of cells and control technique on photovoltaic panels, to achieve a hydrogen production rate of 0.48 Nm
3/h with 11 cells, and power consumption of 2.25 kWe. In the BoP design, the water comes directly from the oxygen separator tank, which has external cooling and an injection pump to the stack. The hydrogen goes into an accumulator as the only component prior to storage, which has its own refrigeration and acts as a pressure separator. The water obtained in the drying process is not injected into the oxygen separator, but is sent to the water tank that acts as refrigeration, and has its own filtering system. Then, water must be taken from this refrigeration tank before starting-up the equipment, and there is no way for direct injection. This implies that the water that reaches the stack could be contaminated, as it does not have a deionizer system for the stack inlet water.
Looking for advanced developments with a higher hydrogen production rate, Kosonen et al. provide in [
7] a 1 Nm
3/h electrolyzer that consumes 4.5 kWe, with an efficiency of around 78%. The system has a large number of cells (66 cells) and a fairly simplified BoP. The water comes directly from the local water network, and goes through a deionizer, while the hydrogen production goes through a drying unit that lowers the temperature to −70 °C, since the system stores hydrogen in a Nordic location.
The electrolyzer presented in [
8] is made from two stacks with 48 cells each, producing 5 Nm
3/h, at 27 kWe. The efficiency is estimated theoretically at 99%. Although these two stacks-based designs claim high hydrogen production rates, for the electrolyzer implementation there is required complex and bulky BoP.
An electrolysis plant that offers a hydrogen production rate of tens Nm
3 is presented in [
9]. In this case, the stack technology is based on cells similar to PEM electrolyzer proposed in this paper. With an active area of 290 cm
2, stack made up of 60 cells, it provides 10 Nm
3/h at 46 kWe. The BoP contains an oxygen separator tank that works as a water filling tank and stack inlet water feed. The water flow is guaranteed by a pump, along with a filtering system. The hydrogen produced passes through a gas separator. A single cooling system provides the heat exchange for the water and the cooling of the hydrogen, with which the humidity is separated, and when it reaches a suitable level it is injected directly into the stack water feed. In the same operating range, Stansberry et al. developed in [
10] another 10 Nm
3/h electrolyzer, at 60 kWe and overall efficiency of 56% due to a heavy BoP implementation (drying units and chiller).
Finally, a larger PEM electrolyzer designed for hydrogen refueling stations and big energy storage systems is discussed in [
11]. In this case, the electrolyzer is able to produce up to 500 Nm
3/h, with a current density of 30 kA/m
2. According to the analyzed data of the BoPs of the proposals found in the scientific literature,
Table 1 shows a qualitatively comparison of the subsystems and their elements. Here it is verified how the developed BoP in this paper contains elements of large-scale and moderate-consumption systems. Therefore, it can be seen that the proposal BoP improves previous solutions by adding elements for better water filtering, such as low pressure separator (LPS), two phase filtering and recirculation filtering, as well as better hydrogen drying, adding LPS, a pressure swing adsorption (PSA) dryer (which does not require consumption like temperature swing adsorption (TSA) dryers), and redesigning the order of the elements by cooling before the high pressure separator (HPS). In addition to this novel proposal, a differentiating feature of this paper is that all the elements are described in detail in next sections, both in technical characteristics and in their exact connection, something that does not occur as precisely in the previous proposals [
4,
5,
6,
7,
8,
9,
10].
In order to clearly point out the novelty of this article,
Table 2 compares the developed electrolyzers in the analyzed works, from their technical specifications, with the one proposed in our research and presented in this paper (hydrogen production rate of 2.22 Nm
3/h, at 10 kWe and stack efficiency between 77% and 91%).
Table 2 shows that the authors’ proposal provides a mid-range production, with a fairly low electrical consumption. This is because the design is based on supplying the stack a high electrical current, up to 900 A; optimizing the relationship between hydrogen production and electricity supply. To achieve this design, cells from larger-scale electrolyzers are used, similar to Reference [
6], consisting of a stack of 60 cells of 290 cm
2. The design proposed by authors only requires 6 cells of 300 cm
2 to provide a 50% higher current density, despite having a similar cell active area. The current density of 3 A/cm
2 also differentiates the proposed design, since typical current density reviewed in the literature ranges from 1 A/cm
2 to 2 A/cm
2. This depends on the maximum cell current and the active cell area, and it’s limited by these factors. Regarding the hydrogen pressure, the developed electrolyzer is capable of supply hydrogen up to 40 bar without the need of a compressor. As can be seen, this capability from the developed electrolyzer optimizes the auxiliary consumption, removing any compressor power requirement, which obviously increases the total efficiency. Additionally, a significant difference between the proposed BoP regarding the literature review lies in the hydrogen cooling being placed just at the stack hydrogen outlet. Therefore, in the authors’ proposal, the first gas separator stage, included in all the revised works, receives more condensed water, so the hydrogen drying is more efficient from its first phase.
Therefore, the novelty of the proposed PEM electrolyzer is characterized by its mid-range production at optimized consumption, high current density with a low number of cells, high pressure without the need of compressors, and a BoP that optimizes the hydrogen cooling and drying stages. The complete design of the proposed BoP, as well as the characteristics of the stack and the electrolyzer are detailed in the following sections.
This paper continues and considerably expands previously developed research [
12] and contributes to hydrogen technology implantation into the energy industrial sector, with the design, experimentation and real implementation of a medium-size proton exchange membrane (PEM) electrolyzer for hydrogen production. After the design of the BoP, an exhaustive control system is developed to test the working conditions that will allow the PEM electrolyzer to produce hydrogen in a safe and efficient way. The aim of this research is to find an equilibrated solution between minimal BoP and correct performance, always into safety conditions of hydrogen generation. Additionally, although previous studies have been conducted in the simulation and experimental testing of PEM electrolyzers as power-hardware-in-loop (PHIL) simulators [
13], dSPACE Hardware-in-the-Loop simulators [
14], multiphysics simulators [
15], dynamic simulators based on MATLAB [
16] and mathematical dynamic Simulink simulators [
17], this development is oriented to the use of software tools based on totally integrated automation logic. Therefore, it includes the logic control design, necessary for the safe and effective performance of the plant, with the experimental tests to evaluate operation parameters, a monitoring environment, and quality testing.
The paper is organized as follow:
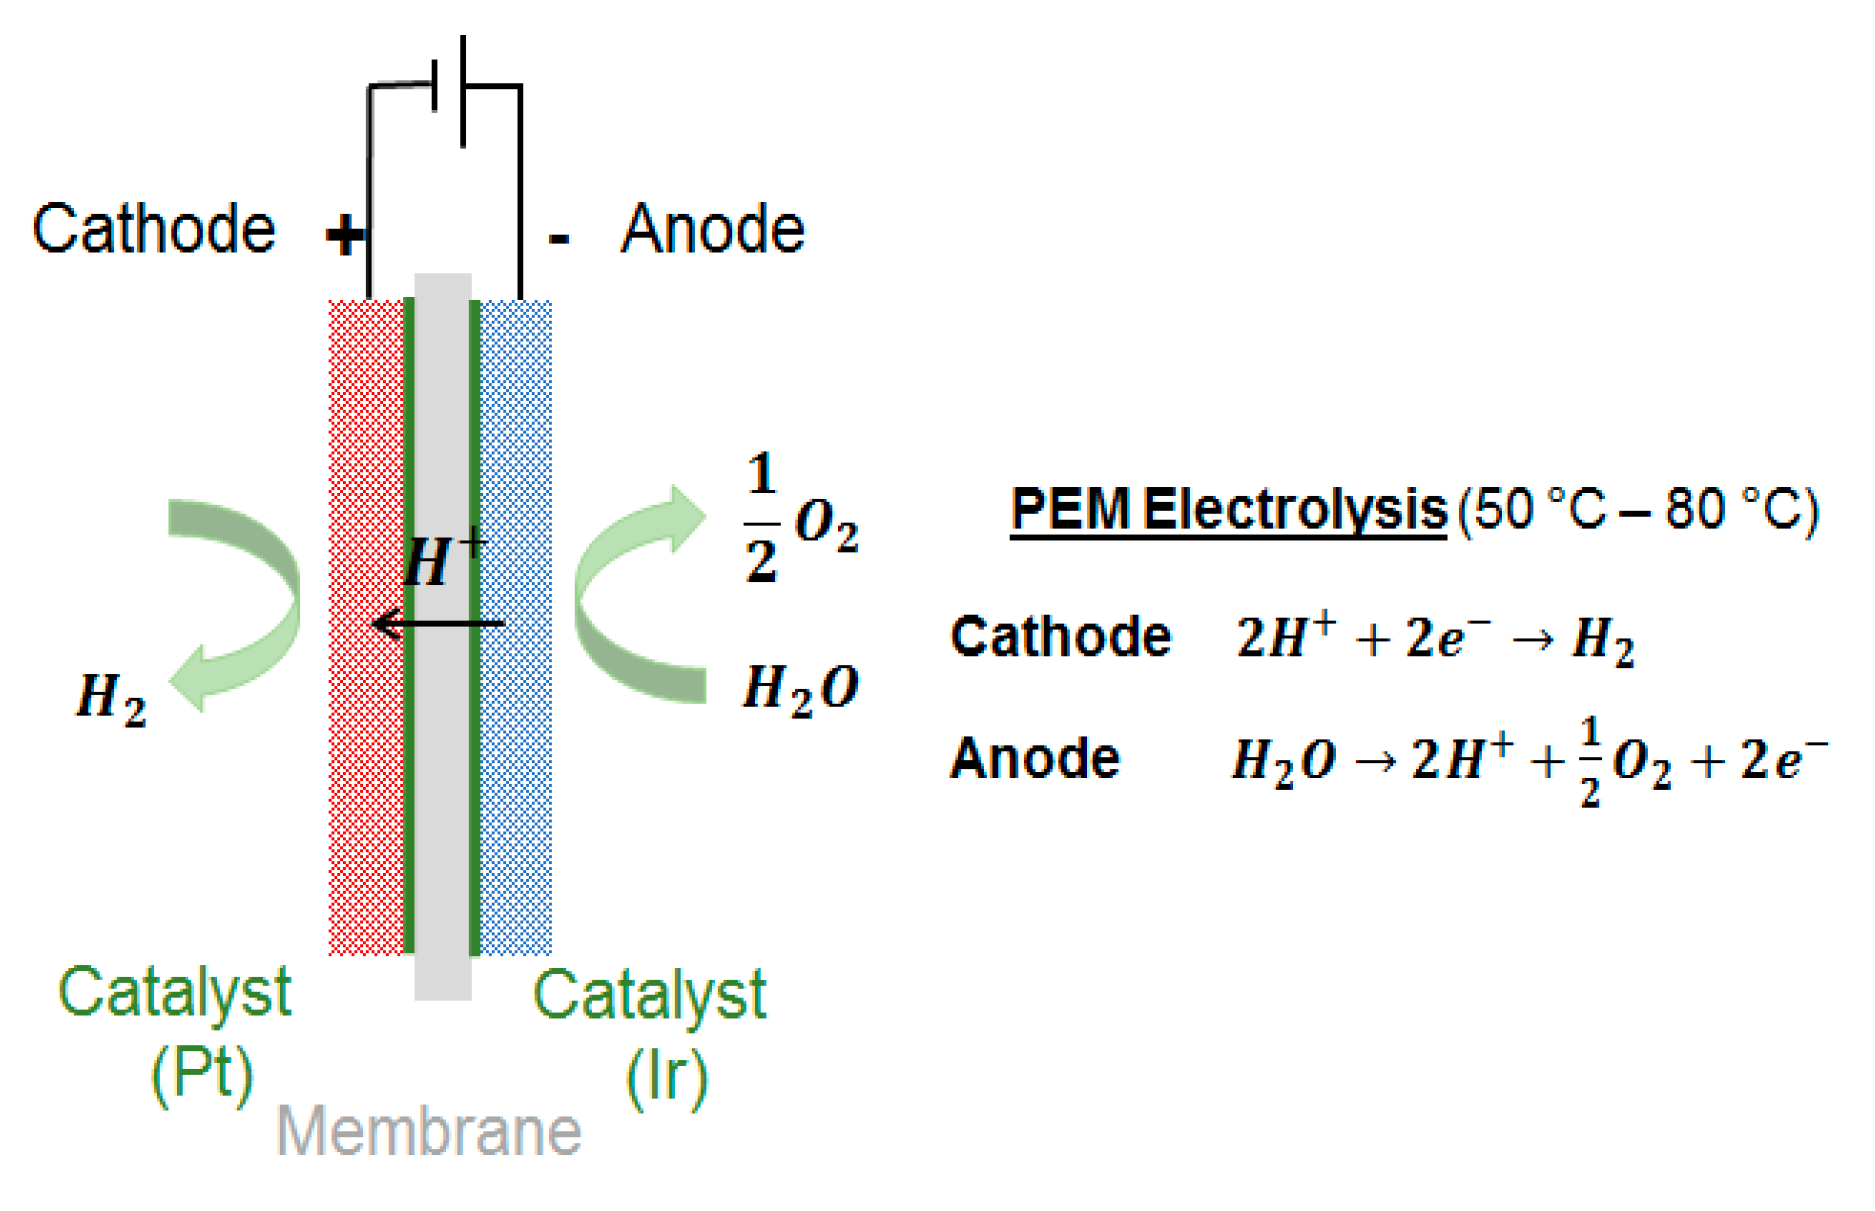
Section 2 explains material and methods used to develop the research, including a description of PEM electrolysis technology: main features and highlights. Next, a detailed description of the design, the developed control logic and implementation is offered in
Section 3.
Section 4 brings together the experimental results, discussed below in
Section 5. Finally, the overall conclusions are reflected in
Section 6.
3. Design and Implementation of the BoP
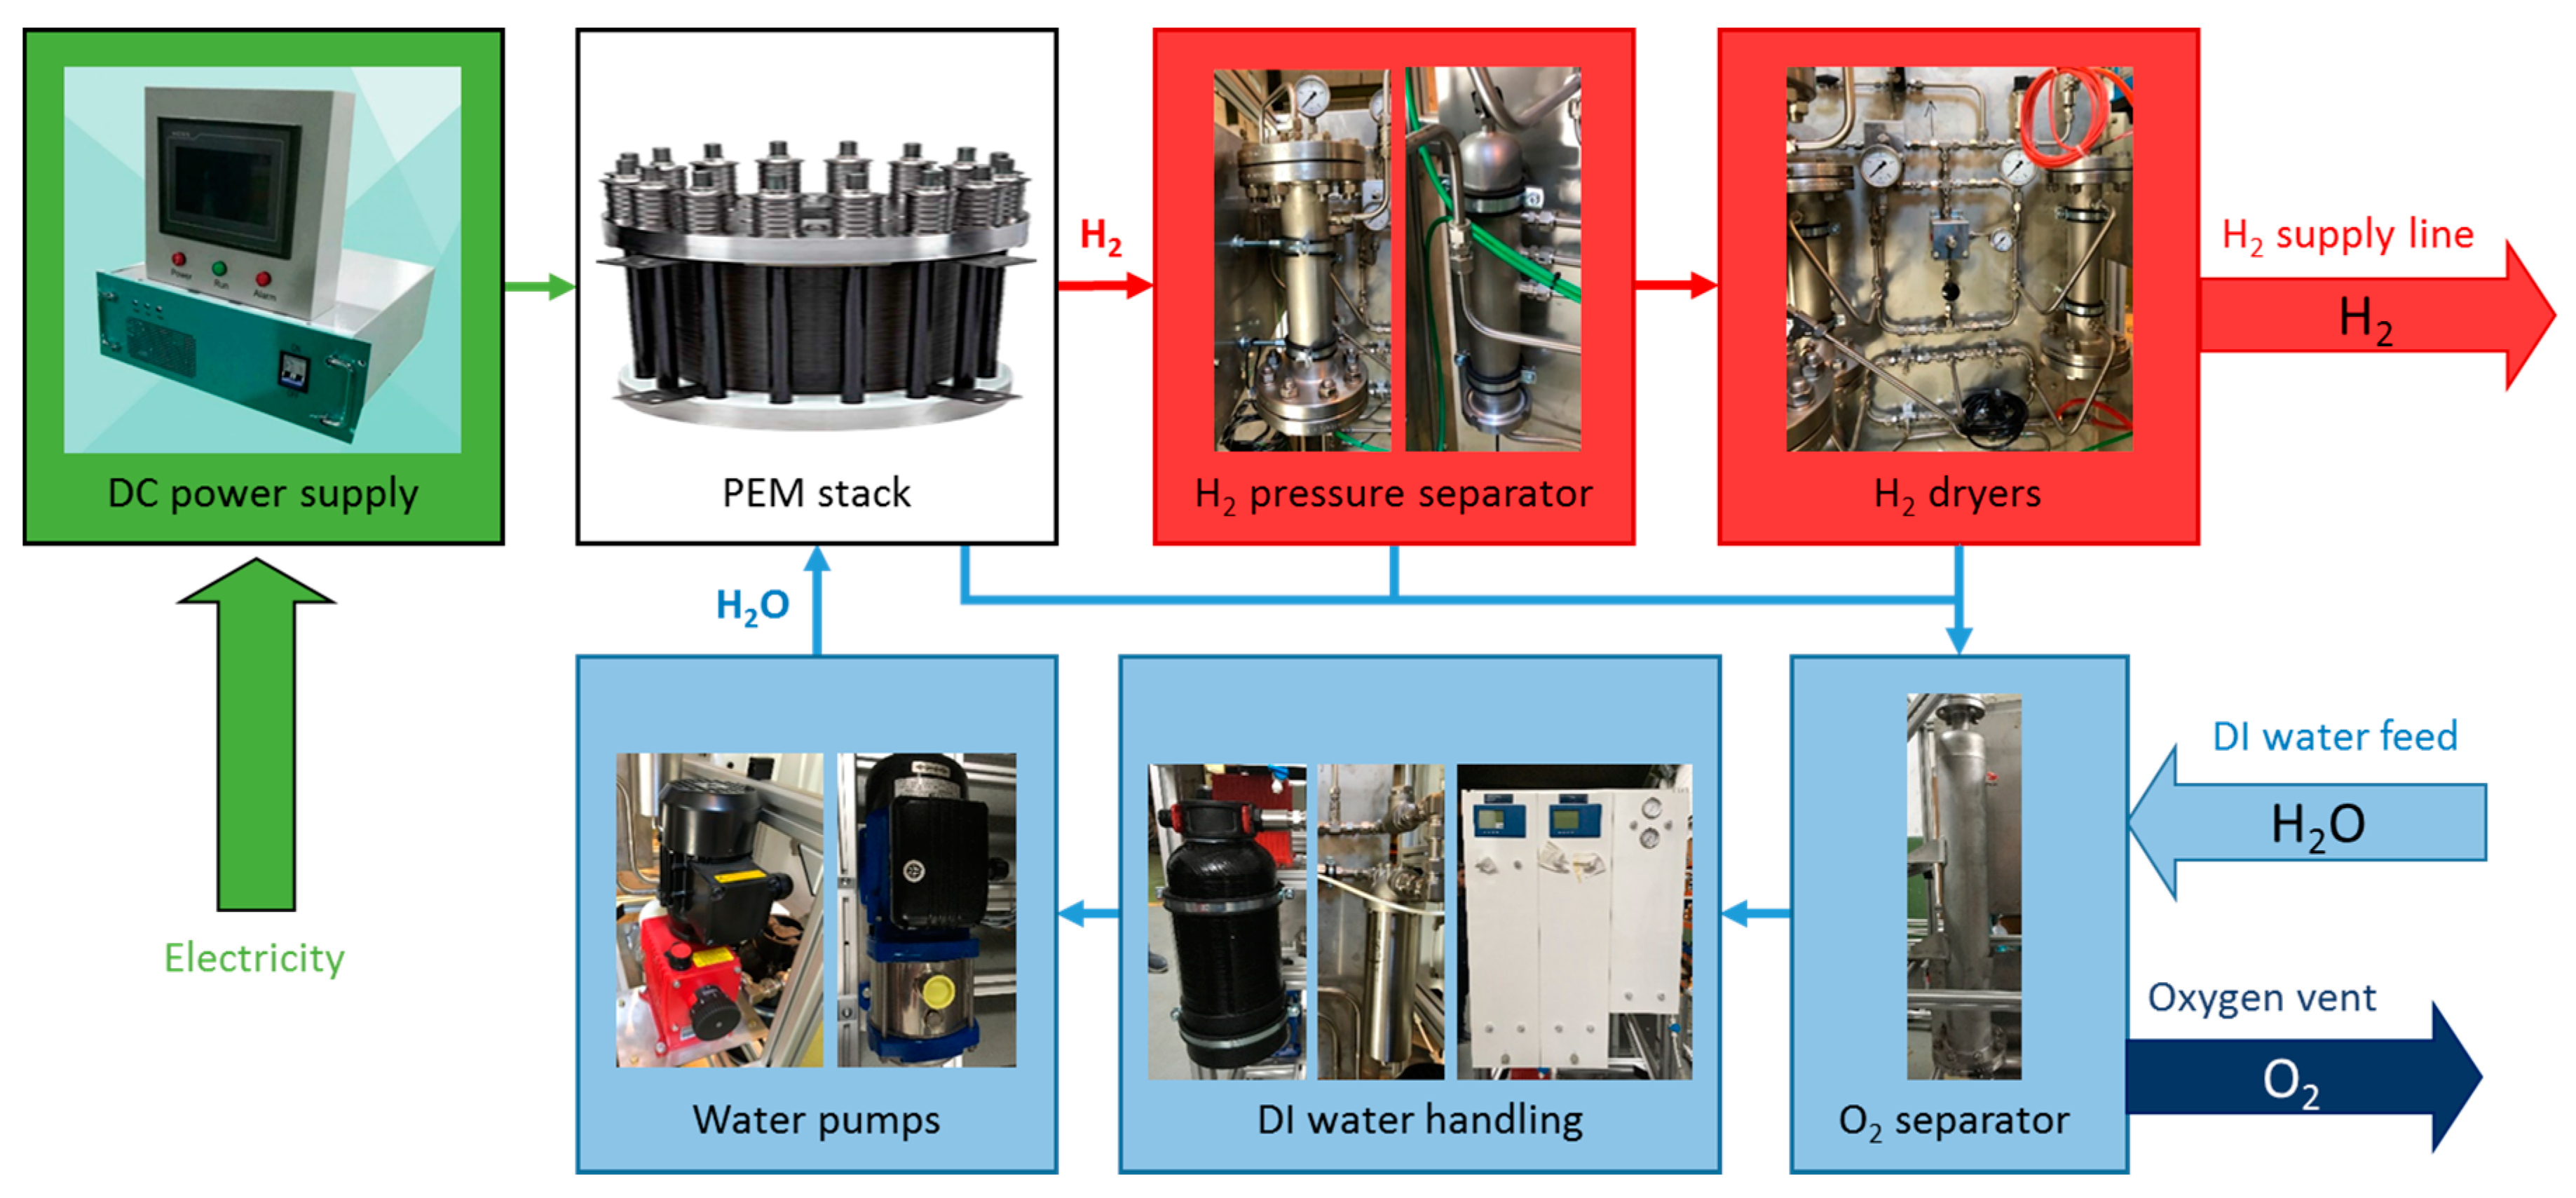
Going into the blocks of
Figure 3, the five subsystems that makes up the BoP and their key parts are the following:
Stack power supply subsystem: AC/DC rectifier, DC voltage transducer and DC current transducer.
Water management subsystem: deionized water circulation system (two phase filter and recirculation filter), inlet water tank, oxygen separator tank, injection pump, recirculation pump, piping, valves and instrumentation.
Hydrogen production subsystem: hydrogen processing: PSA dryers, high pressure separator (HPS), low pressure separator (LPS) tubing, and valves, and instrumentation.
Cooling subsystem: plate heat exchanger, dry cooler, cooling pump, valves and instrumentation.
Control subsystem: receives information from sensors and defines operation mode over actuators according to optimal operation and safety requirements.
Next, a solution for the design, implementation, and control of the BoP of the proposed PEM electrolyzer in the research is developed.
3.1. BoP Design
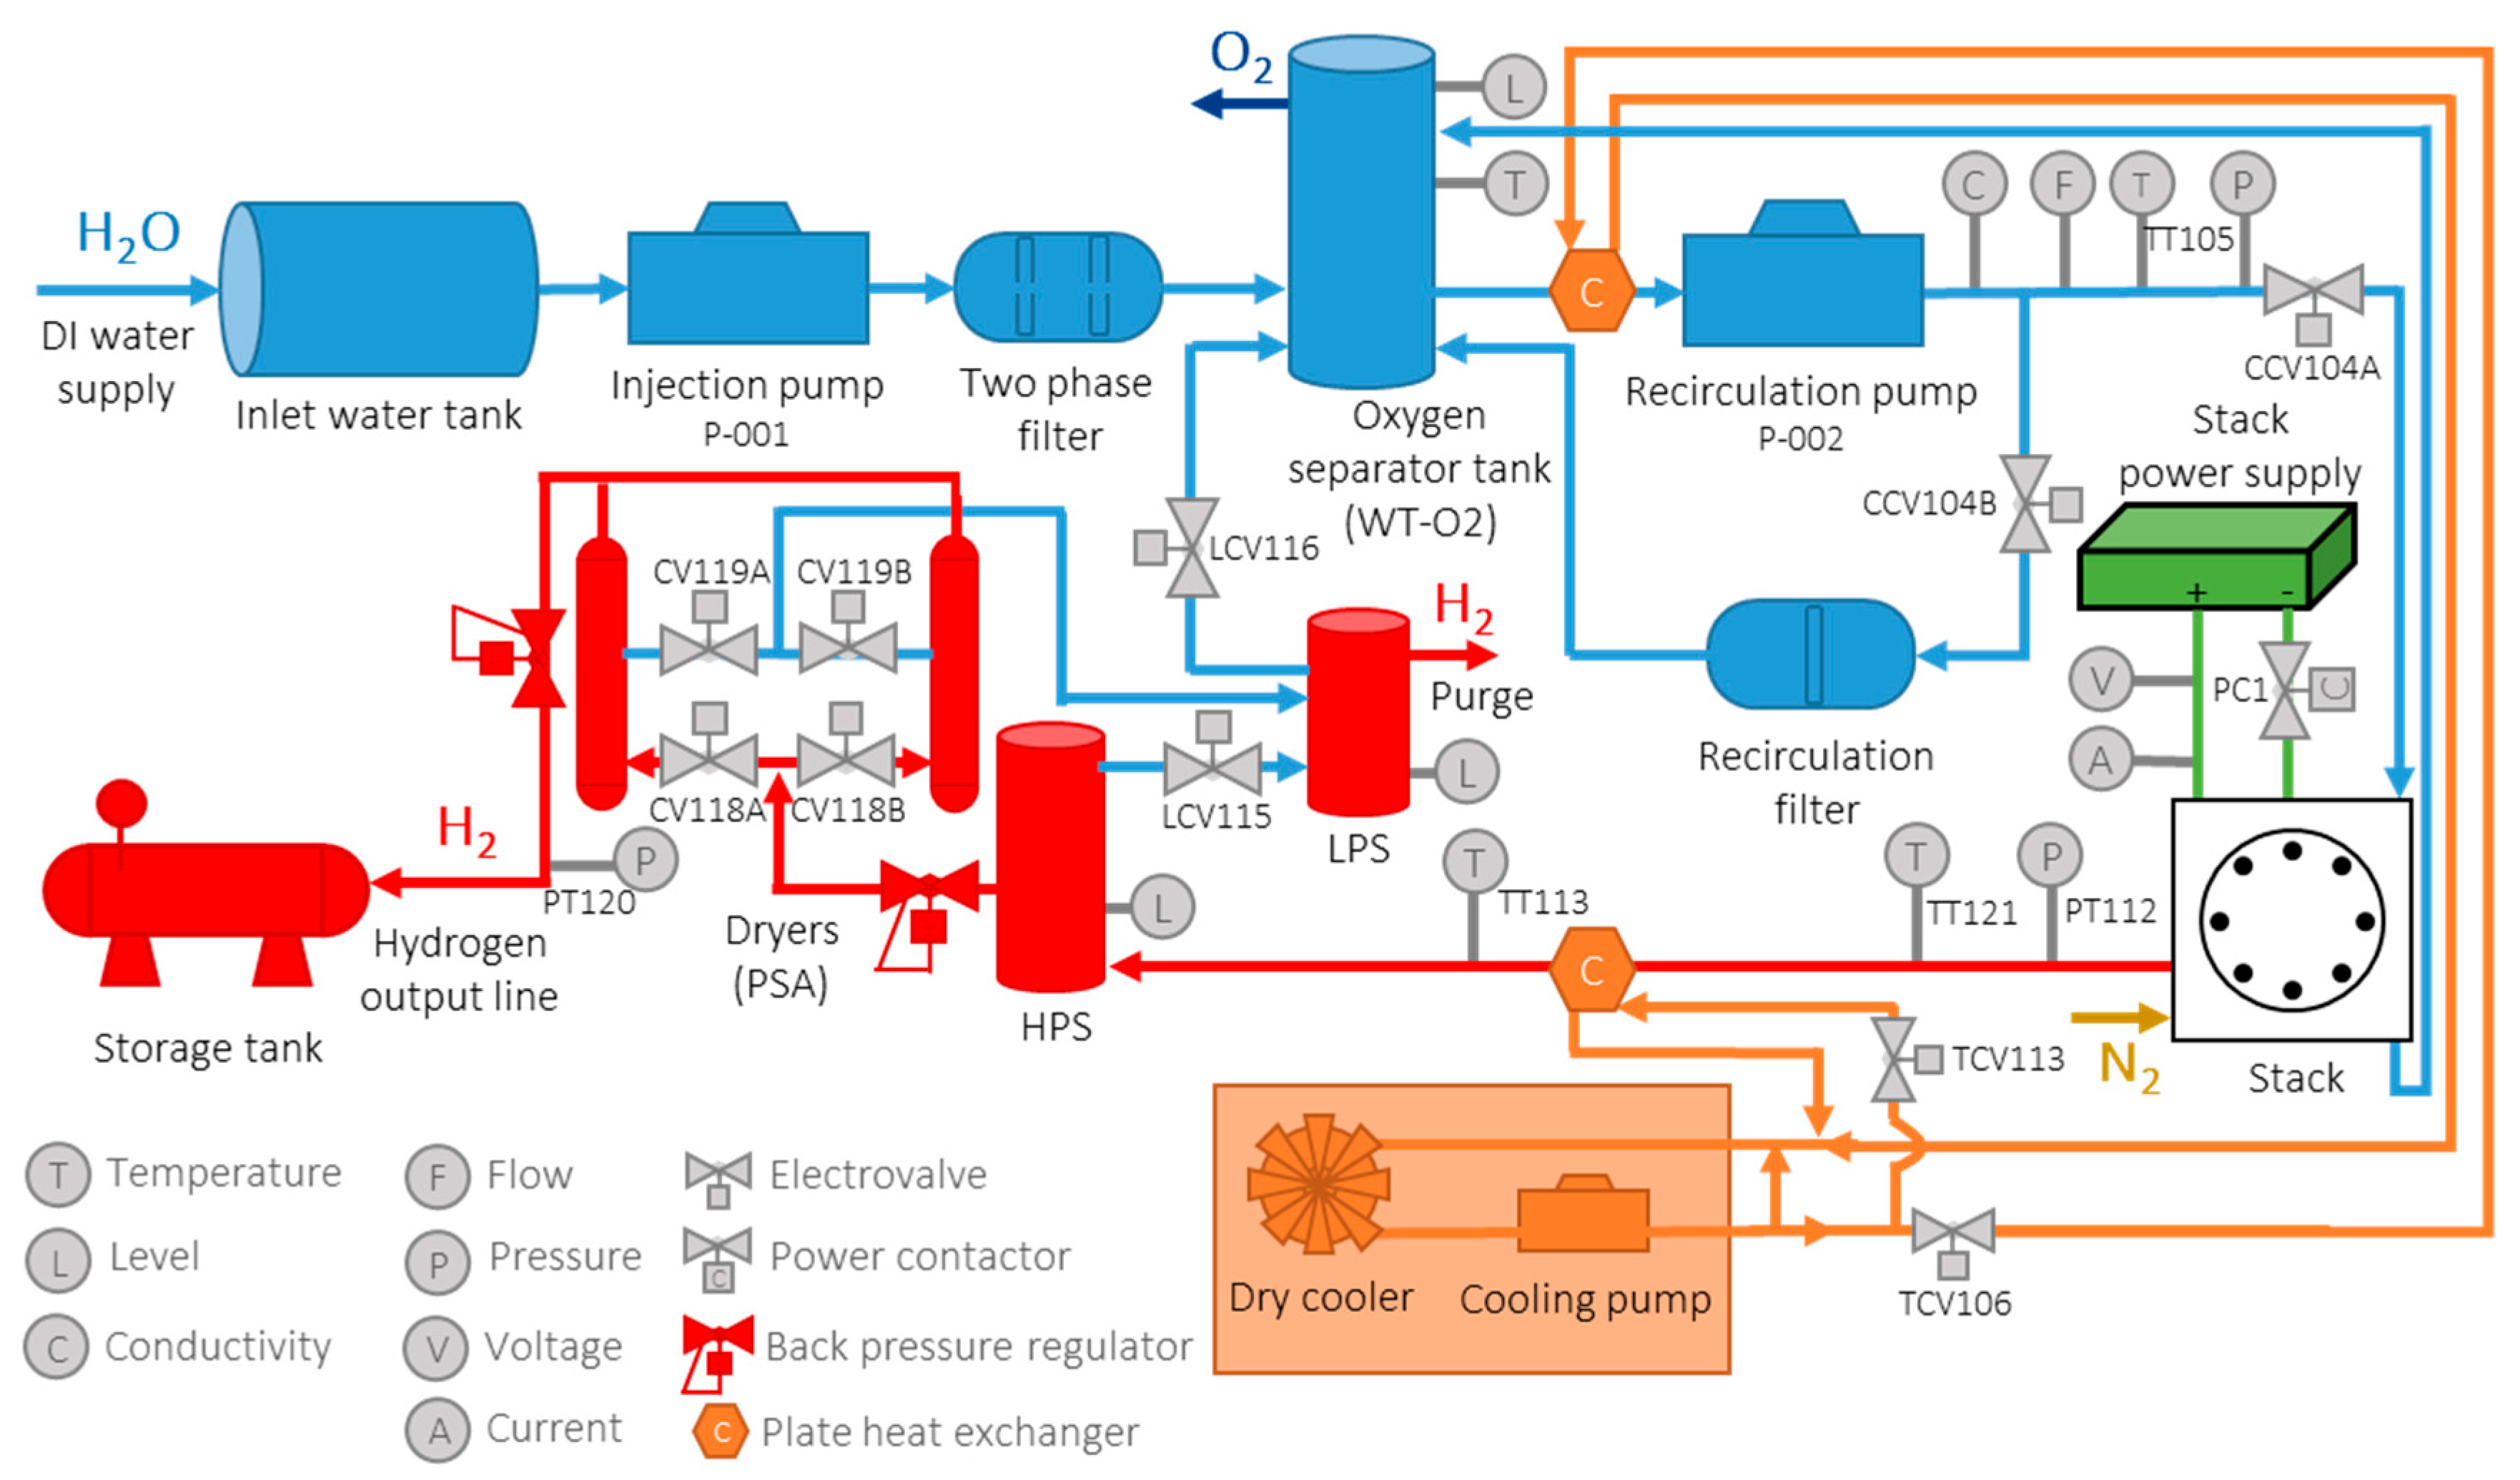
The subsystems and their elements making up the BoP are outlined in
Figure 4: the stack power supply in green, water subsystem in blue, hydrogen subsystem in red, cooling subsystem in orange and control subsystem in grey.
3.1.1. Stack Power Supply Subsystem
The stack power supply subsystem (in green) is responsible for providing the necessary direct current for trigger the electrolysis process that produces the hydrogen. Since the electrolyzer is operated at high power, and with very high-value currents (up to 900 A), current (A) and voltage (V) sensors are needed to continuously monitor the electrical supply to the stack. In addition, a power contactor (PC1) is incorporated, to guarantee safe operation, both in production situations and in the event of an emergency stop.
3.1.2. Water Management Subsystem
The water management subsystem (in blue) starts acquiring water from a DI water tank, which is convenient to have low conductivity and to ensure a longer stack lifespan. Once the water has been introduced into the system, an injection pump (P-001) is used to ensure an adequate input flow into the system. After passing through the injection pump, the water is circulated through a two-phase filter to give it a low conductivity. Otherwise, the PEM stack could be critically impaired. In the first phase, it is obtained a Type II conductivity (ASTM Standards for Laboratory Reagent Water (ASTM D1193-91)) (<1 μScm−1) and, in the second phase, the conductivity level drops to the Type I value (<0.056 μScm−1).
After the filtering stage, the water is introduced into an oxygen separator tank that has a triple function: (1) to be a buffer with the aim to adjust the water flow inside the circuit, (2) to act as a sink that collects all the wastewaters, and (3) to separate the oxygen from the water. From the oxygen separator tank, the water continues its flow to the water-control and recirculation phase. The recirculation pump (P-002) regulates the water flow after the oxygen separator tank, and the sensors’ line is used by the controller to have information of all critical water parameters, such as temperature (T), pressure (P), flow (F) and conductivity (C) before being injected into the PEM stack. The recirculation line is proposed as a means to correct the conductivity of the water; in case it is not within the allowed range.
3.1.3. Hydrogen Production Subsystem
The hydrogen production subsystem (in red) must be carefully designed to guarantee all the safety parameters, as well as the correct hydrogen drying, eliminating the humidity that it may contain, sending the extracted water to the oxygen separator tank. For this purpose, it can be seen in
Figure 4 that the PEM stack output is connected to the HPS. Once a high humidity gradient is reached in the HPS, this allows the wet hydrogen to flow (dirty hydrogen) into the LPS. Here, the hydrogen that can be mixed into the atmosphere is released, and the wastewater is sent to the oxygen separator tank. By contrast, the dry hydrogen (clean hydrogen) from the high-pressure separator, continues to the drying stage. The drying stage is based on pressure swing adsorption (PSA), a cyclic process that uses beds of solid adsorbent to remove impurities from the gas. The released water is sent to the LPS, following the same process previously described. The set of separators takes advantage of the pressure difference in the water contained in the form of moisture to dry the hydrogen. Throughout the process of hydrogen production, several sensors are placed; they are used to control the pressure (P) and temperature (T) parameters of hydrogen flow in the production and drying stages, prior to final storage. The inertization process makes use of the elements of the hydrogen subsystem; in order to bring it out in
Figure 4, a nitrogen inlet is included in the stack.
3.1.4. Cooling Subsystem
Inside the electrolyzer, the cooling subsystem (in orange) consists of two heat exchangers used in the water management subsystem and the hydrogen production subsystem. The circulation circuit is controlled by two electrovalves (TCV106 and TCV113, respectively), one for each subsystem. The water for the heat exchangers is cooled by an external air cooler, which has its own pump to guarantee water flow and pressure in the cooling line.
3.1.5. Control Subsystem
The control subsystem processes all the information received from sensors and, based on the user-defined parameters and the control logic defied, it automatically acts over actuators to put the system working at the proper operating state. All the above subsystems are controlled through the control subsystem.
3.2. Design of the Electrolyzer Control Logic
The control system to be implemented into the PEM electrolyzer should be able to have information and act accordingly into the rest of subsystems that made up the BoP: stack power supply subsystem, water management subsystem, hydrogen production subsystem and cooling subsystem. Additionally, it must include the whole sequence of the operating states and the management of the warnings and alarms generated during the electrolyzer operation.
To follow the development of the control logic in an easy way, all the elements that govern the electrolyzer operation are named with a number in parentheses that coincide with their numbering in
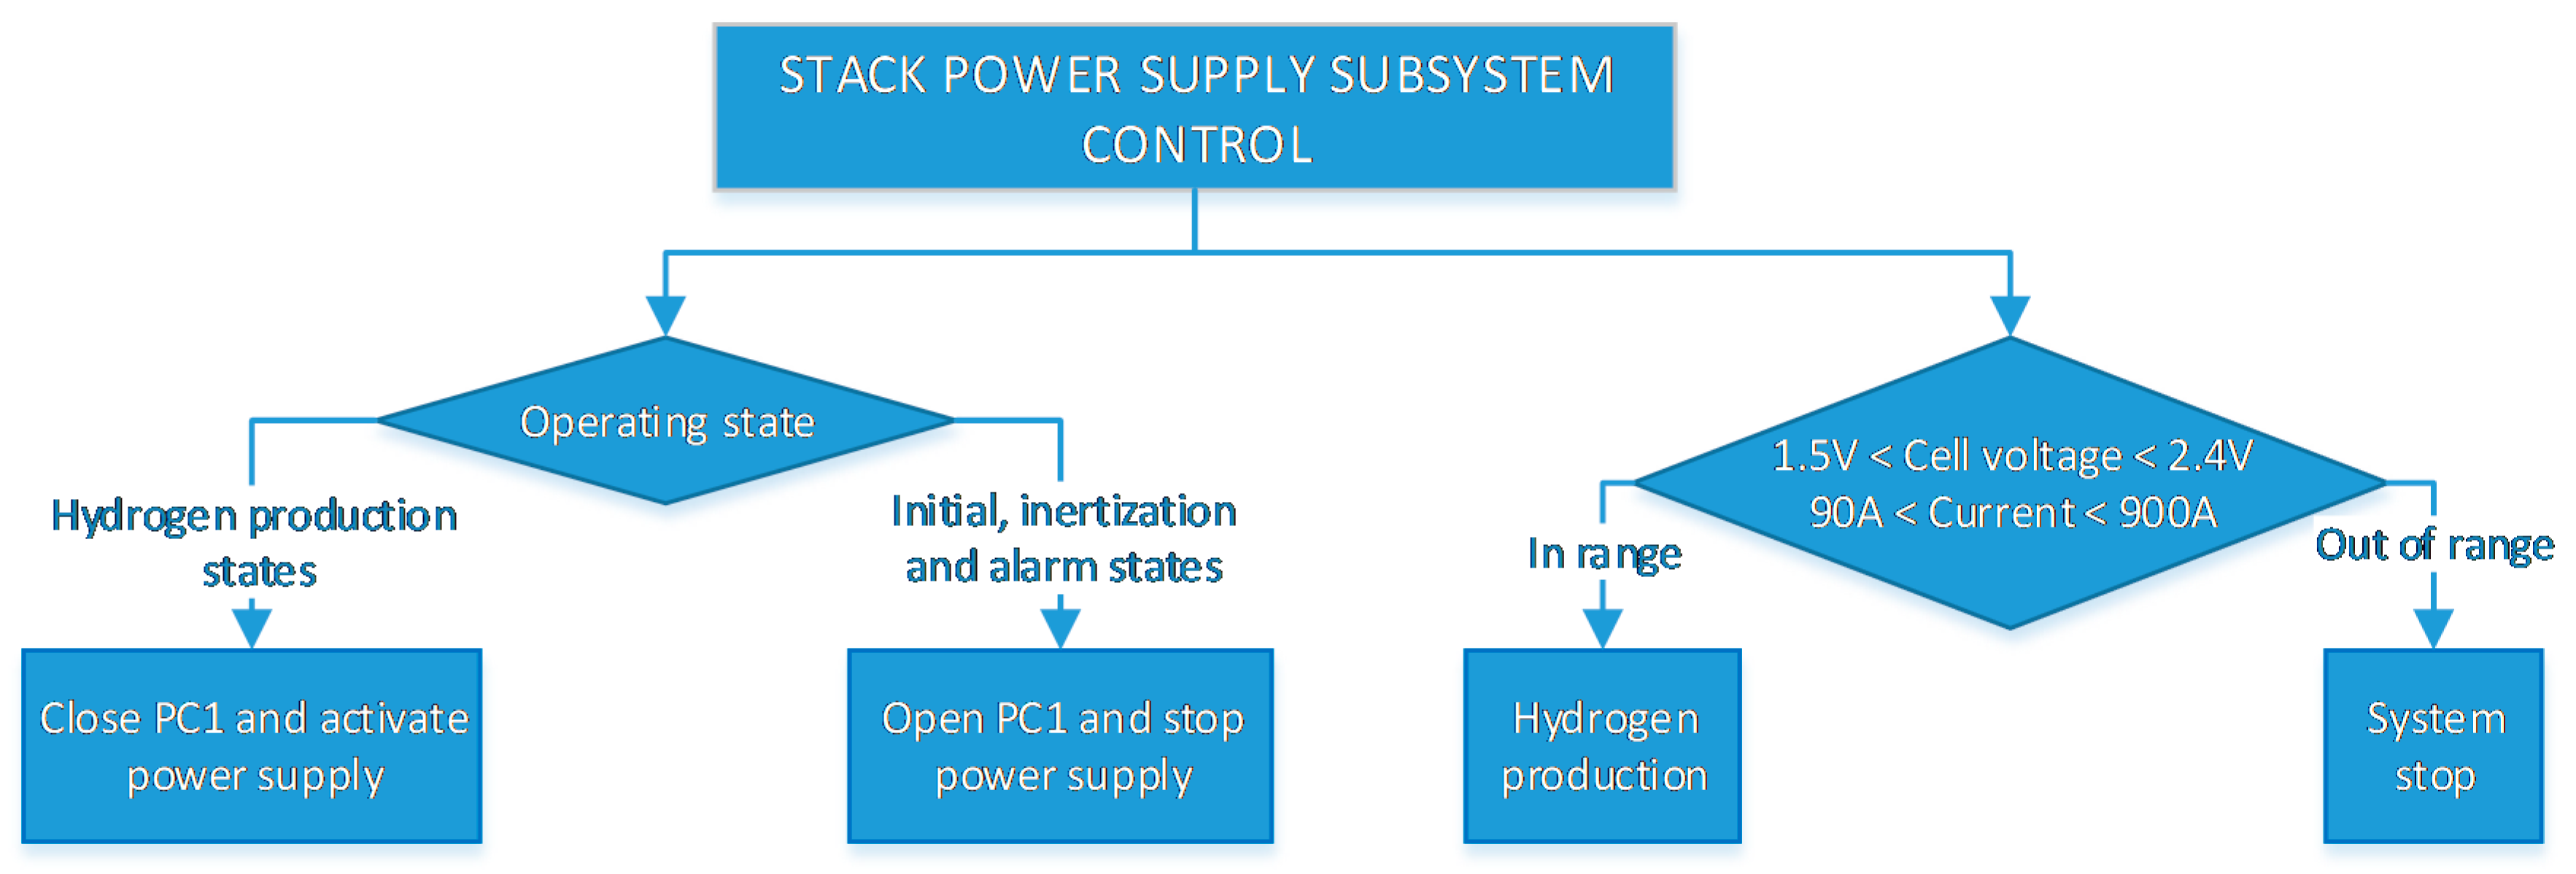
Figure 4. For the stack power subsystem the control logic receives the information from two main variables in the controller as shown in
Figure 5. Firstly, the operating state of the electrolyzer is considered. If it is a state where electric current is required to carry out the electrolysis process, then the power contactor (PC1) will close, allowing the physical connection between stack and the power supply, and right after that the power supply is activated. Secondly, stack voltage (V) and current (A) are measured. If their values are not within the adequate range of the stack operation (1.5 V < Cell Voltage < 2.4 V and 90 A < Stack Current < 900 A), the system is shutdown, which also stops supplying electricity to the stack.
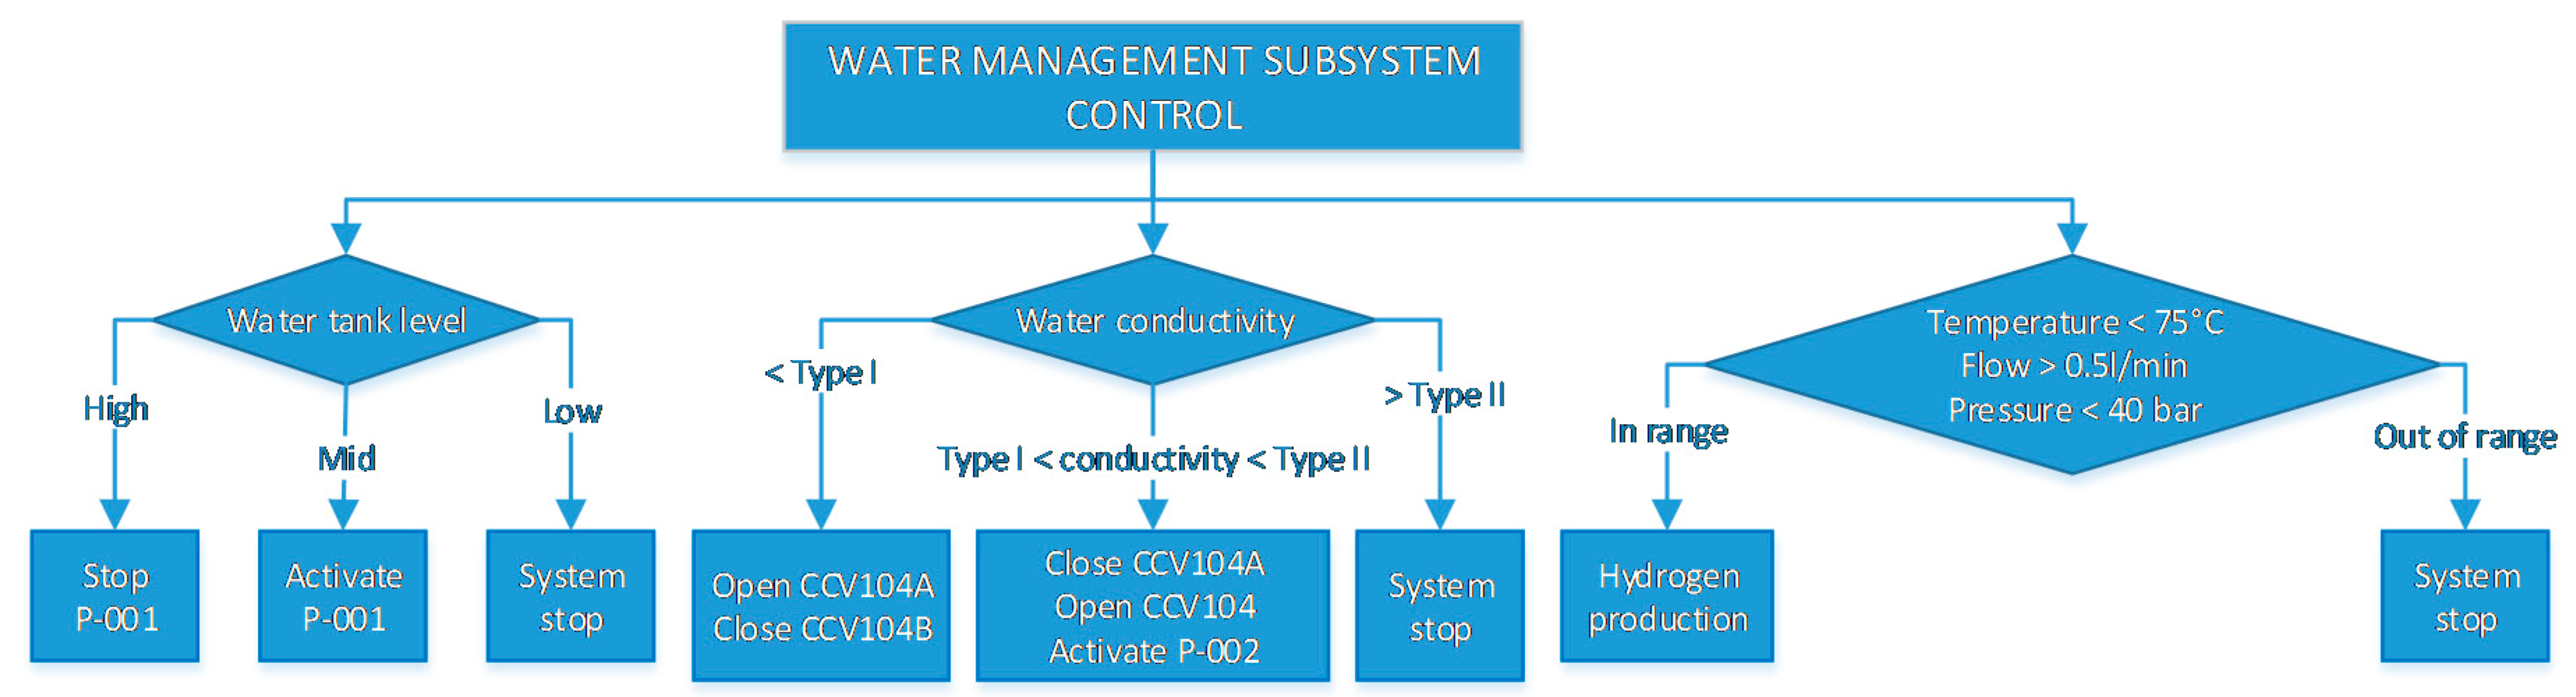
On the other hand, the water management subsystem control is shown in
Figure 6. It includes three main parts: water tank level control, water conductivity control and the control of the rest of the water physicochemical variables. Regarding the first part, the activation of the level sensor (L) in the oxygen separator tank activates the injection pump (P-001). When the level is high enough, the pump is deactivated. In case of lowering the level too much, at a low level, the PEM electrolyzer stops.
Concerning the conductivity control part, the water conductivity is regulated by acting over the electrovalve (CCV104B) to put in work the recirculation line. When the conductivity is low, the water is supplied directly to the stack without the need to subject the water to more purification treatment ((CCV104B) closed and (CCV104A) open). If, before production, the conductivity is medium (Type I < conductivity < Type II), the recirculation circuit (P-002) will be open to recirculate the water back to the purification filter ((CCV104B) open and (CCV104A) closed). If this occurs during production, a warning is activated. Finally, if the conductivity rises above Type II, the electrolyzer will be kept stopped, an alarm will be triggered, and through a process of disconnection and inertization (this will be explained later in this section), and an alarm will be triggered.
The third branch of
Figure 6 concerns the rest of the water physic-chemical parameters like flow, temperature, and pressure, which are measured with the aim to guarantee that the system parameters are within its operating specifications; otherwise the system stops.
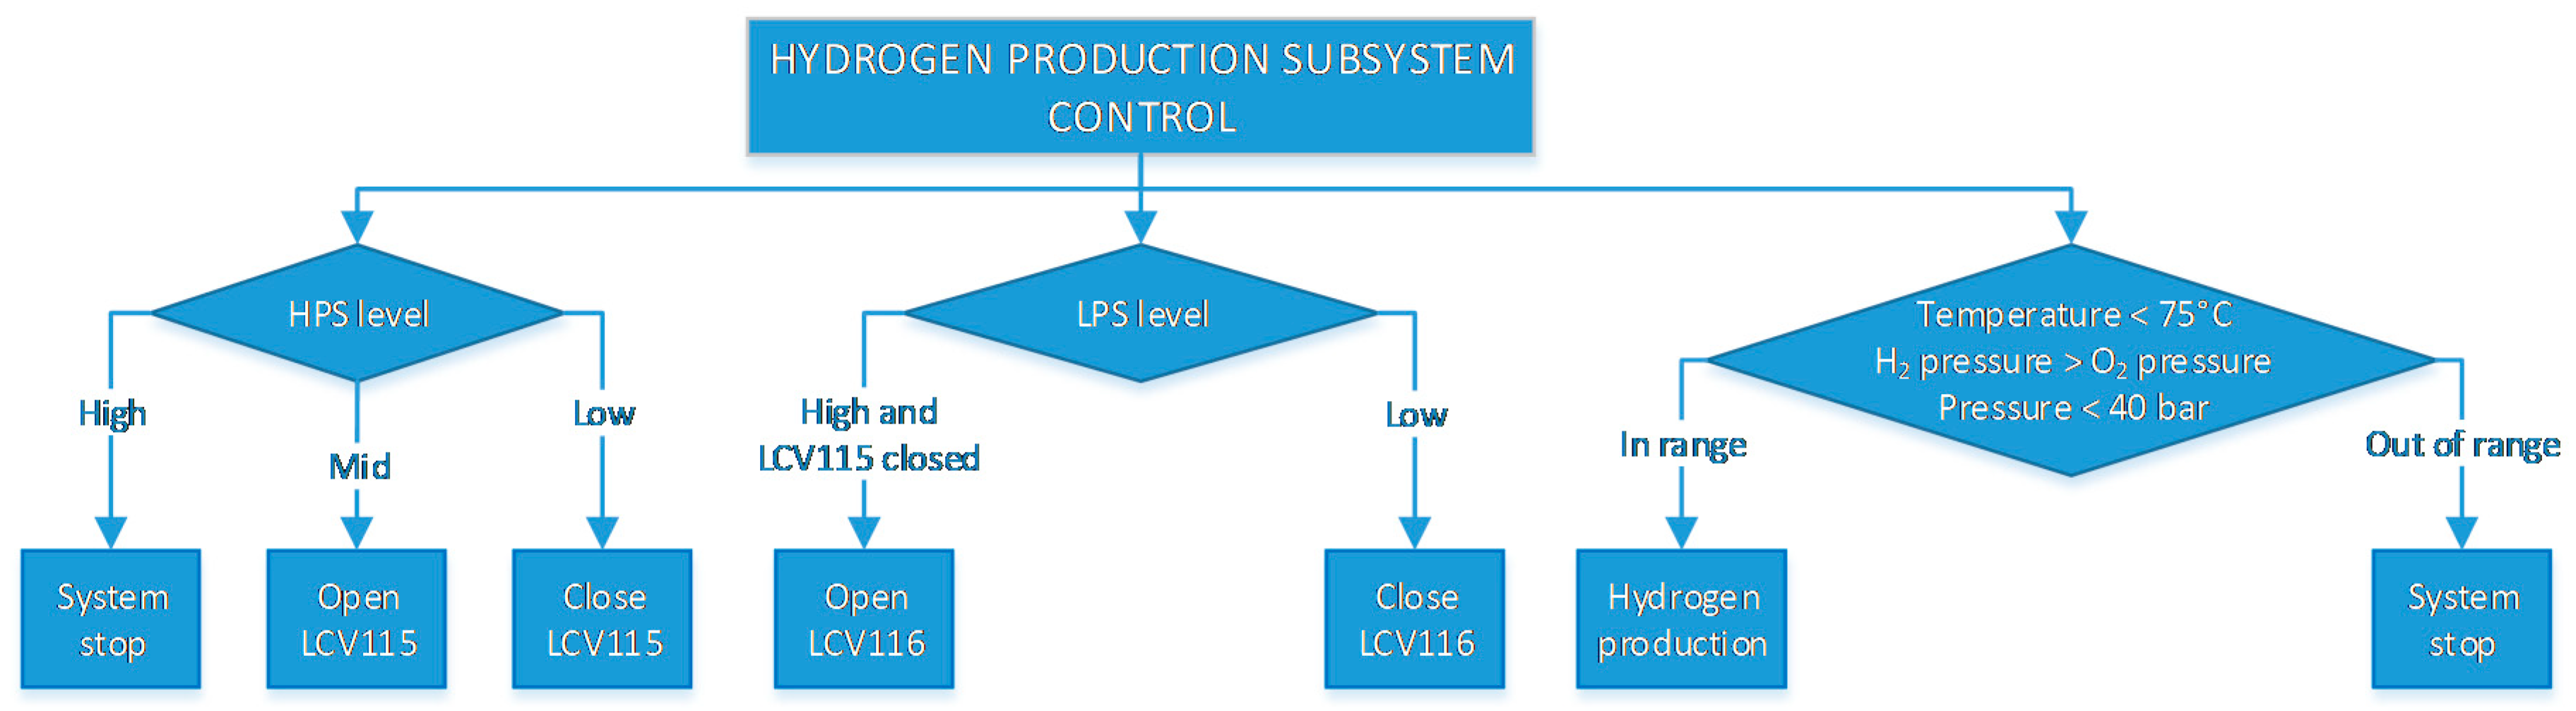
For the hydrogen subsystem control,
Figure 7, it is necessary to take into account the water level both in the HPS and the LPS. When a mid-level is detected in the HPS, the electrovalve (LCV115) will be open to letting the accumulated water pass towards the LPS. When the level drops, the valve will be closed again. In the case of a high level being detected, the electrolyzer stops. Water level control in the LPS works in a similar way, allowing the water to pass to the oxygen separator tank (by means of (LCV116) when there is enough water accumulated, as long as the electrovalve (LCV115) is closed. In an electrolysis process, it is crucial to avoid direct contact between the water and hydrogen lines. If the level in LPS is low, the valve (LCV115) closes since there is not enough water to transport.
After the LPS and HPS stages, the PSA drying stage follows a conventional three-phase cyclic process during production. This is defined temporarily with the opening and closing of electrovalves (CV118 and CV119) that allow the hydrogen flow to the final storage, the water accumulation and further purge through the LPS. During all the process, temperature and pressure are controlled, entering the system in stop if they are outside the established range.
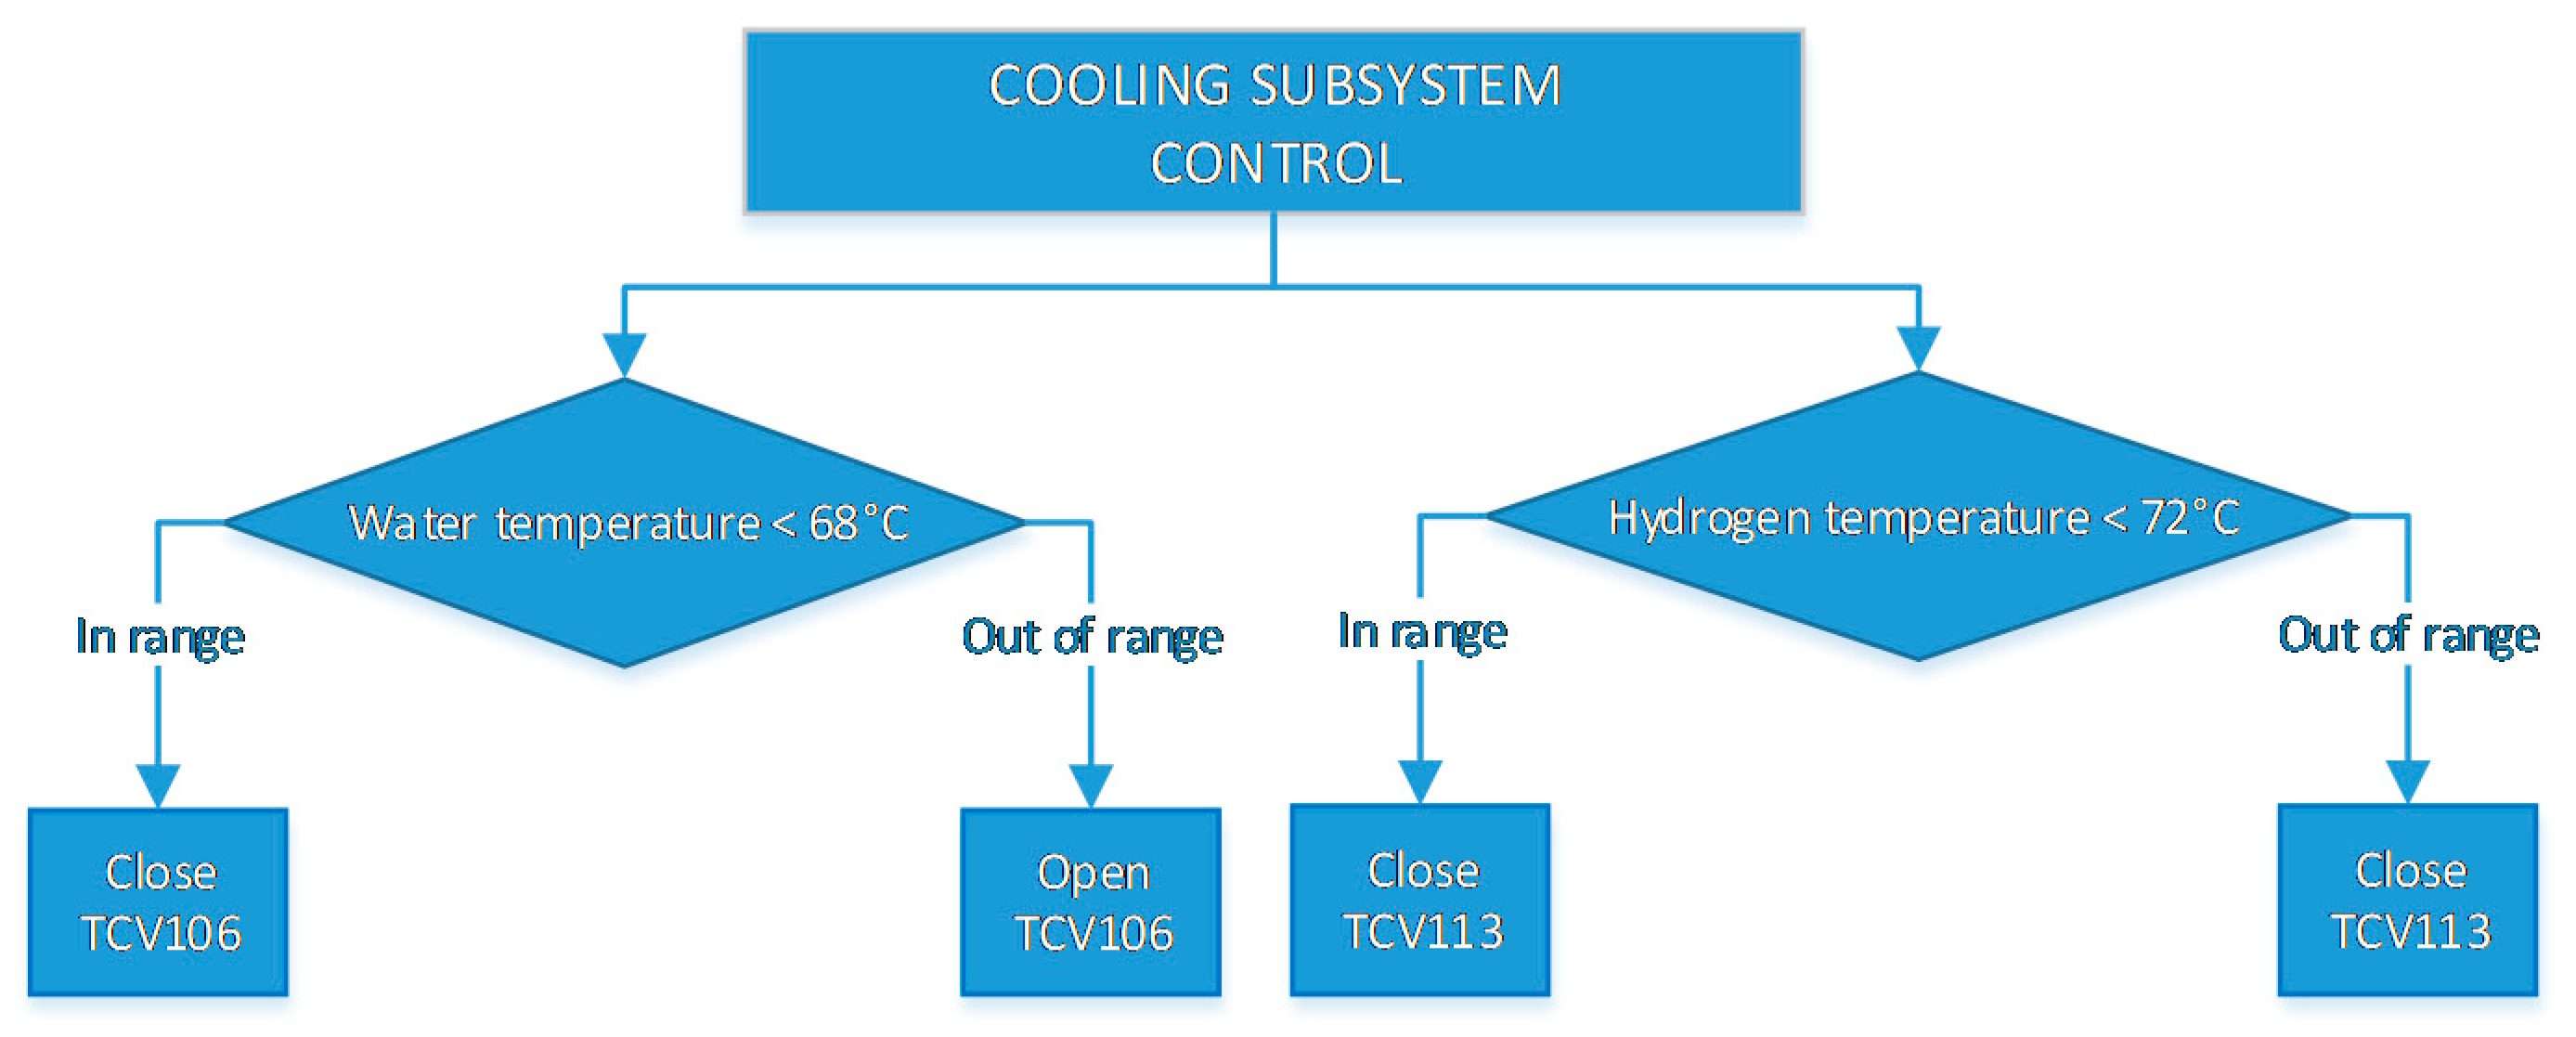
In a similar way, the cooling subsystem control logic is defined by the temperature of water and of hydrogen,
Figure 8. When they reach a maximum value, (water temperature < 68 °C) and hydrogen temperature < 72 °C), cooling electrovalves (TCV106 for water temperature control and TCV113 for hydrogen temperature control) will close and let the cooling water flow through the plate exchange heaters.
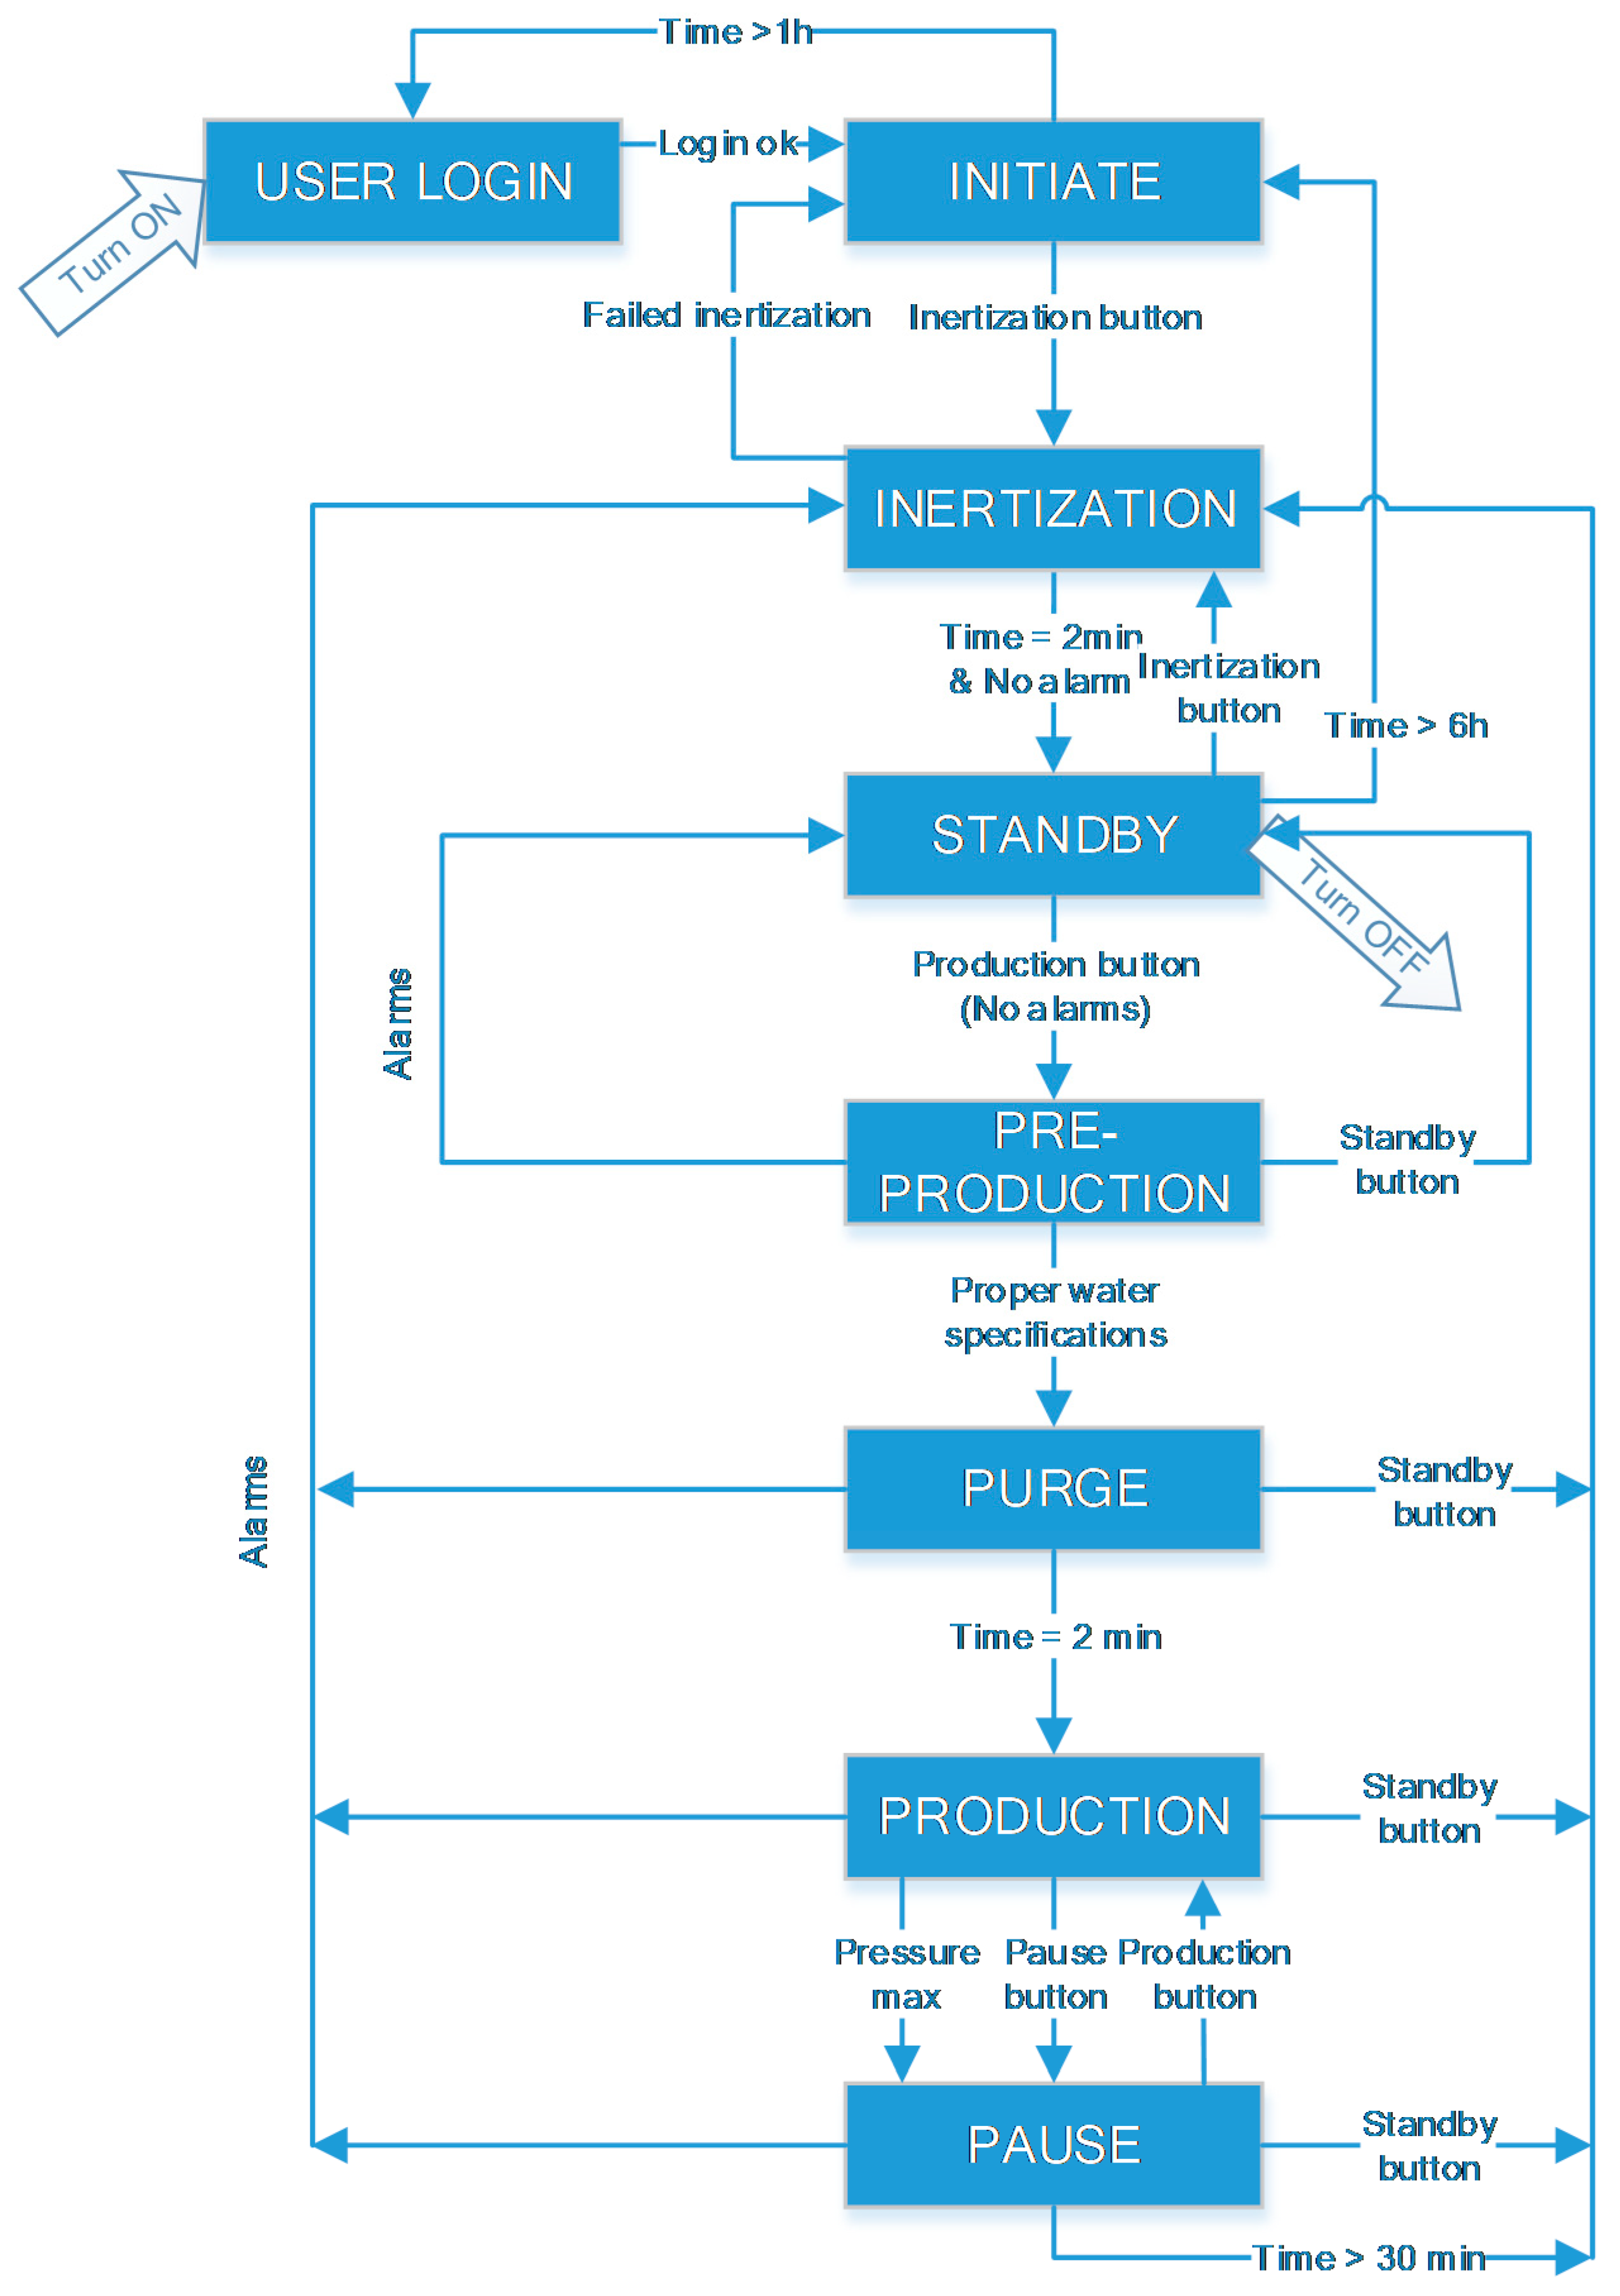
Once the control logic diagrams of the BoP subsystems have been described, the whole sequence that gathers these individual control logics into the operating states of the electrolyzer is illustrated in
Figure 9.
According to the whole sequence, when the plant is turned on and the user is logged correctly, the electrolyzer starts in Initiate state. In this state, the system is kept waiting for the user to manually activate the Inertization state. It consists of injecting, for a 2 min duration, nitrogen into the pipelines, which, as an inert gas, cleans the remaining hydrogen conduits, air or any other gas. If any fault occurs during inertization, it will return to the Initiate state, otherwise it goes to Standby state. In this state, the system is ready to start the production process under the user’s manual order. In case of remaining in the Standby state for more than 6 h, the system will return to the Initiate state. On the other hand, when in the Standby state, if the user activates the inertization button again, the electrolyzer comes back to it.
When the user activates the production button, the system goes to the Pre-production state. In it, the water line parameters values are verified: conductivity, flow, temperature, and pressure. If they are in range, the plant goes to the Purge state; on the contrary the corresponding alarms return the system to the Standby state. The system can also return to this state if the user presses the standby button.
Having arrived at this point where the operation conductions are verified, the Purge state begins. In this state, the first hydrogen production is carried out, which serves to purge the pipelines of nitrogen previously used during the Inertization stage. Obviously, this hydrogen is not yet used to be stored, so that it is purged to the atmosphere. This is a temporary process that lasts 2 min, where the hydrogen line is purged to expel all the nitrogen from the equipment. If the user presses the standby button, the system returns to the Inertization state.
Once all the previous states have been successfully completed, the Production state is reached, where the hydrogen produced can be stored at the electrolyzer output. Several cases can occur from the Production state. Thus, the user can push pause button to goes to Pause state, where the plant is limited to a minimum production of hydrogen using a minimum DC current. Additionally, as a security measure, if the hydrogen production flow reaches the maximum allowable pressure, the systems finishes production and moves to the Pause state. Additionally, the user can stop the process completely by means of the standby button, with which after performing the Inertization, the Standby state will be reached. This can also happen automatically if at any time the controller detects an alarm in the plant.
In the Pause state, it is possible to recover the Production state just by pushing the production button. Additionally, after staying at the Pause state more than 30 min, the system returns to the Inertization state. Finally, in all previous cases, from Pre-production to Pause states, if the standby button is pressed or an alarm is noticed, the system returns to the Inertization state.
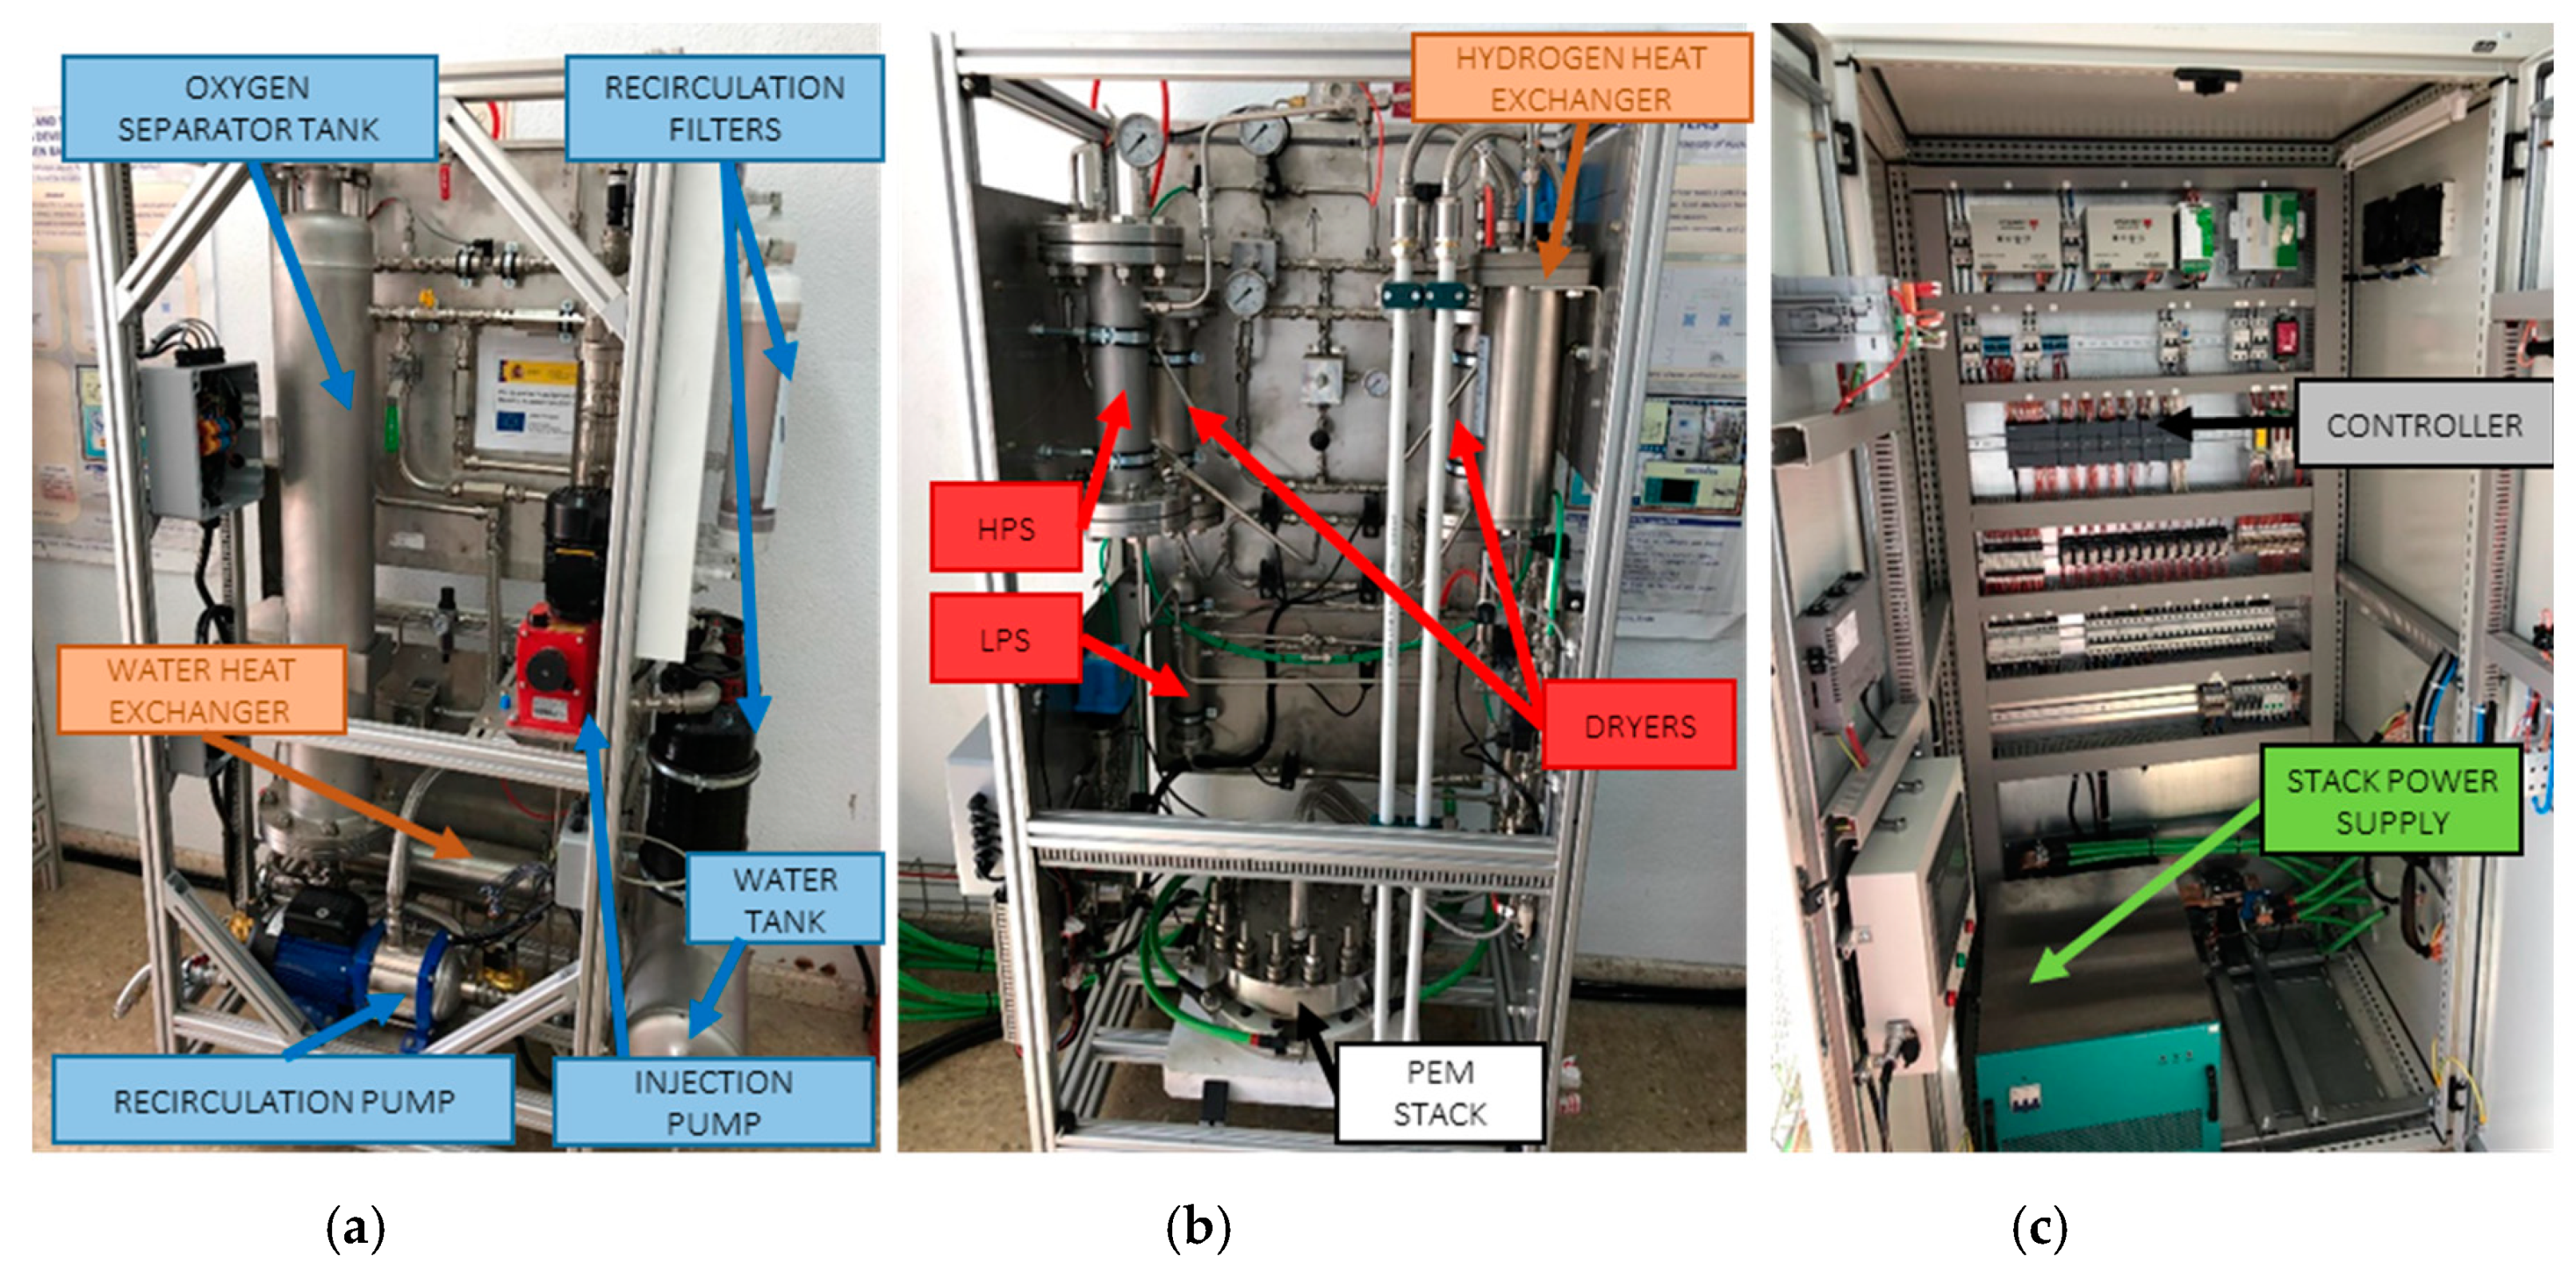
3.3. Implementation of the PEM Electrolysis Plant
Once the BoP of the PEM electrolyzer has been designed and the control logic is defined, the physical implementation of the electrolysis plant has been carried out.
Figure 10a shows the water management subsystem, as the location of the inlet water tank, oxygen separator tank, injection and recirculation pumps, the different filtering equipment, as well as all the sensors and actuators that control the effective and safe operation of this subsystem, including electrovalves, conductivity sensors, pressure, flow, level, and temperature.
Figure 10b shows the hydrogen production subsystem; there can be found the stack, together with the varied equipment of the hydrogen subsystem. In this area are the high and low-pressure separators (HPS and LPS), the PSA dryer, as well as the different connection sockets to the hydrogen storage tank and purging. Finally, the physical implementation includes the power supply and control subsystems,
Figure 10c. In this part, it is located the DC power supply that provides the DC current to the stack in a controlled manner. It also houses the controller module (PLC Siemens S7-1200), where all the control logic defined previously has been programmed and simulated, as well as serving as a platform for the experimental tests shown in the next section. As can be appreciated, the plate heat exchanger for water and hydrogen, as part of the cooling subsystem are also shown in
Figure 10a,b.
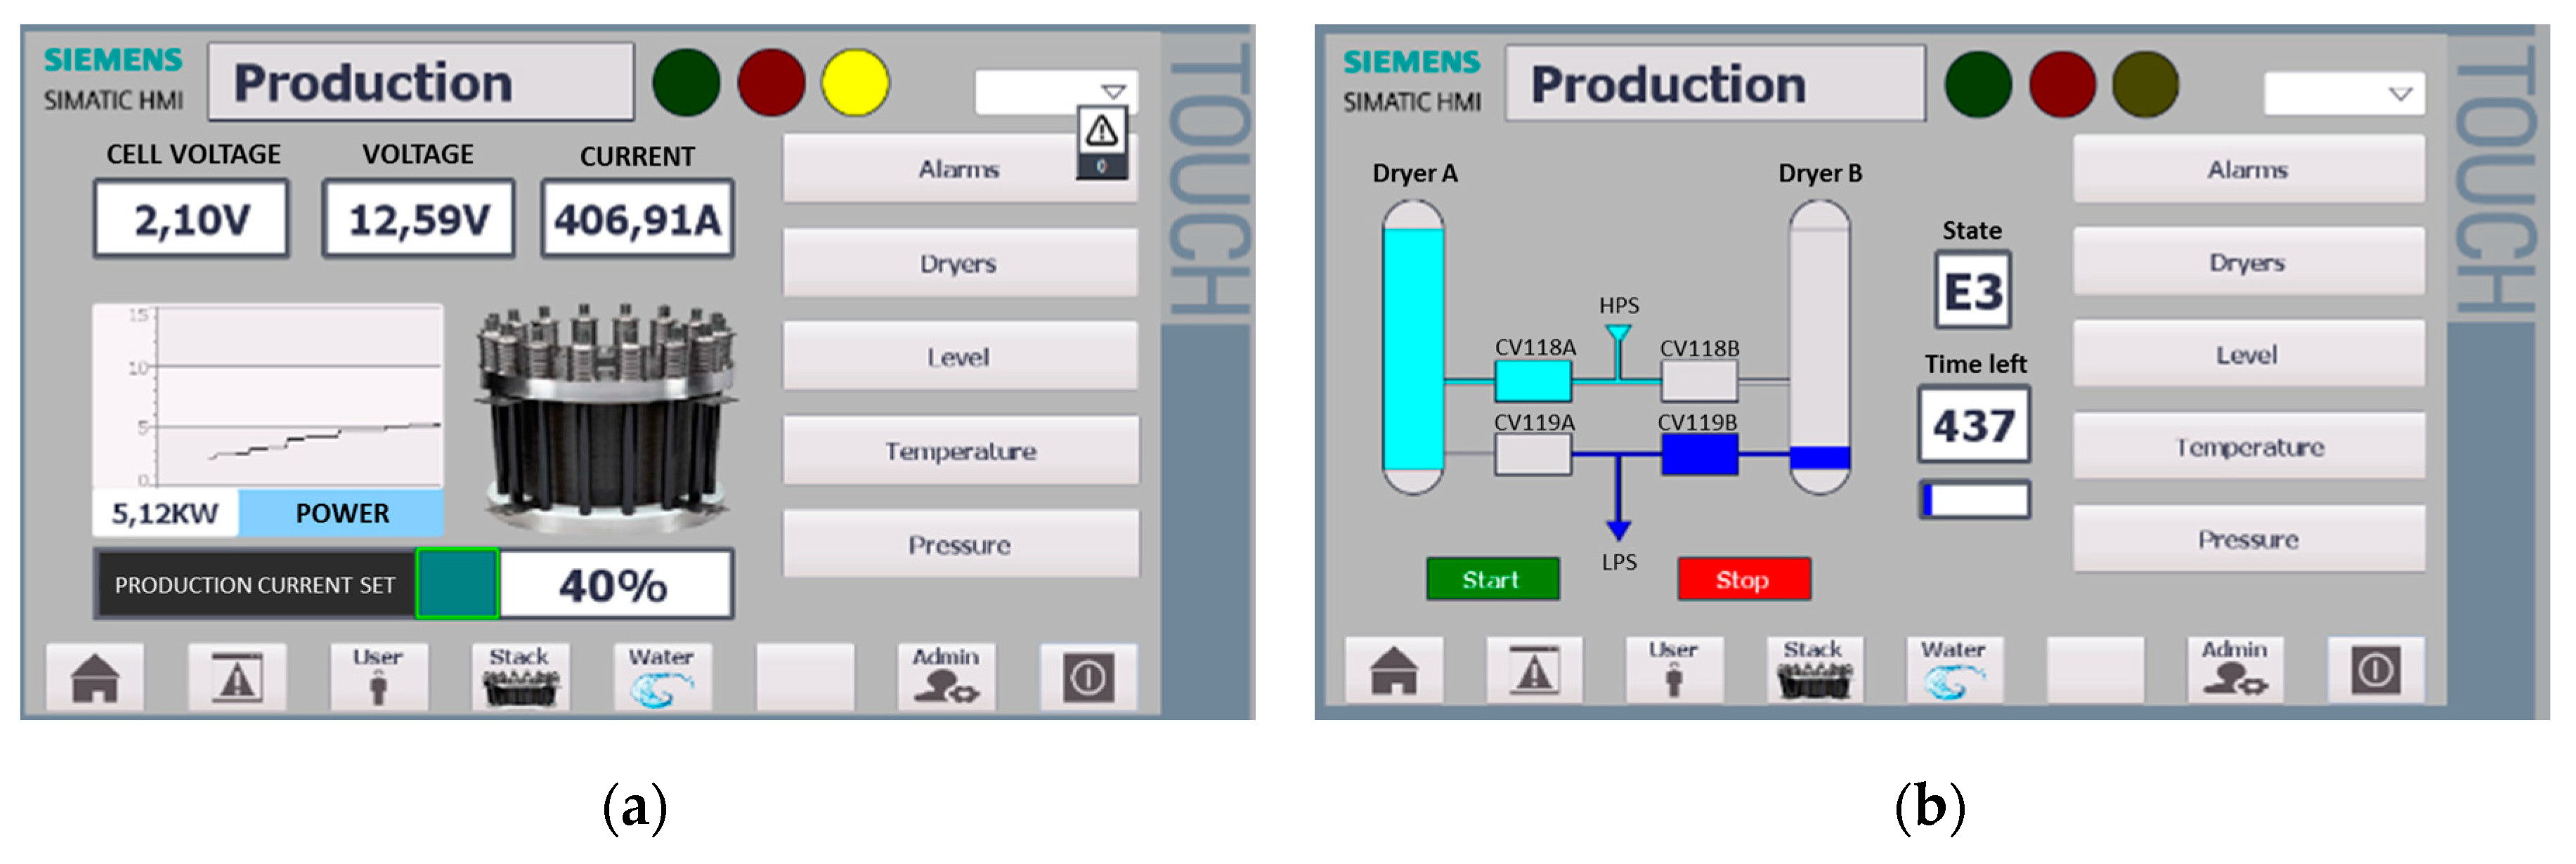
5. Discussion
Based on the results obtained from the SCADA interface,
Figure 11,
Figure 12,
Figure 13,
Figure 14 and
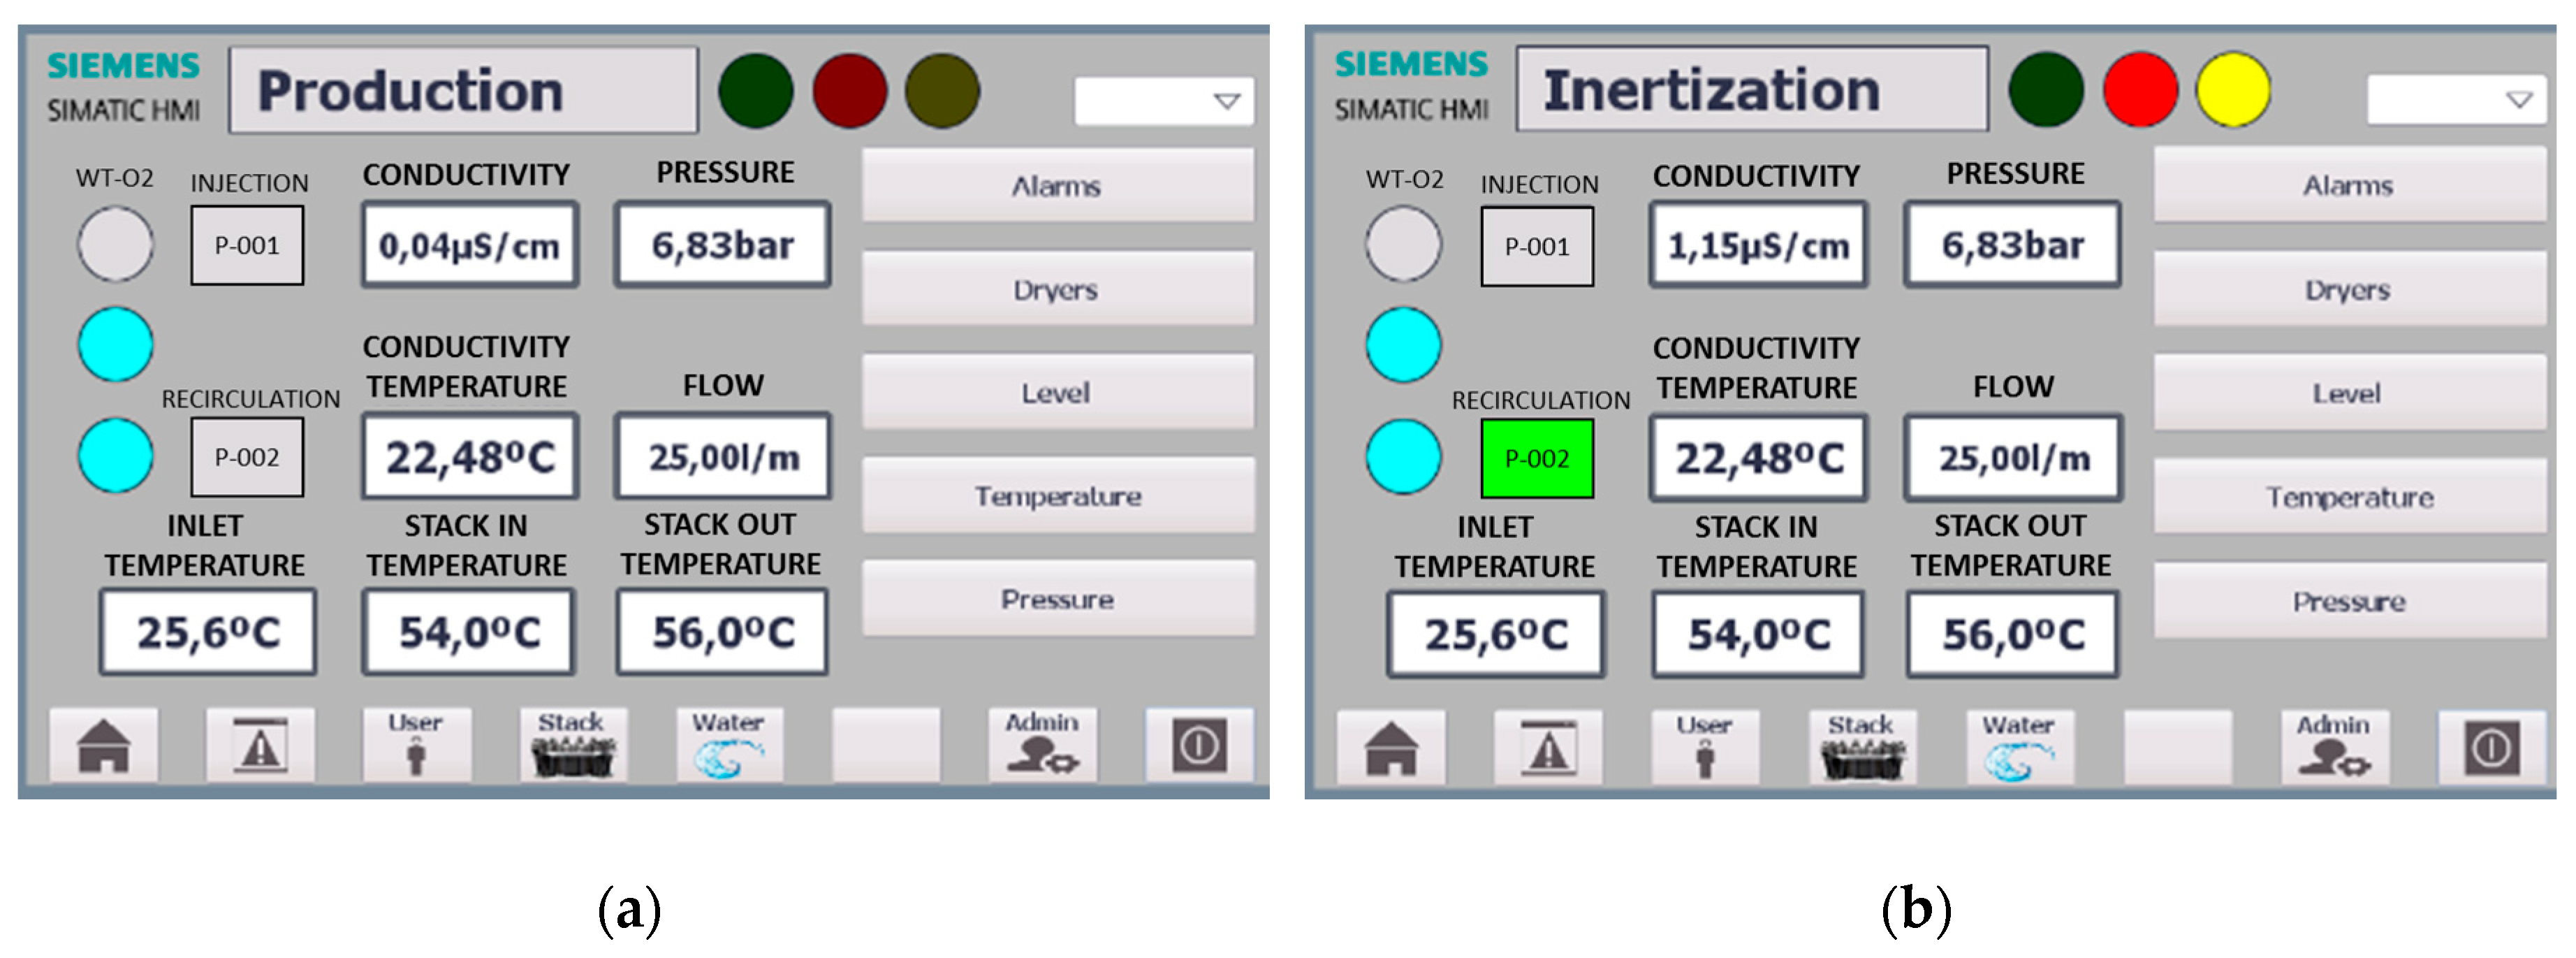
Figure 15 show the proper operation of the four subsystems that make up the BoP of the developed PEM electrolyzer. Regarding the water management subsystem, the developed control logic is guaranteed by means of the injection pump (P-001), the recirculation pump (P-002) and the water level at the oxygen separator tank is inside the allowed range (
Figure 12), as well as the water flow, temperature, pressure and conductivity (
Figure 13) during the production process.
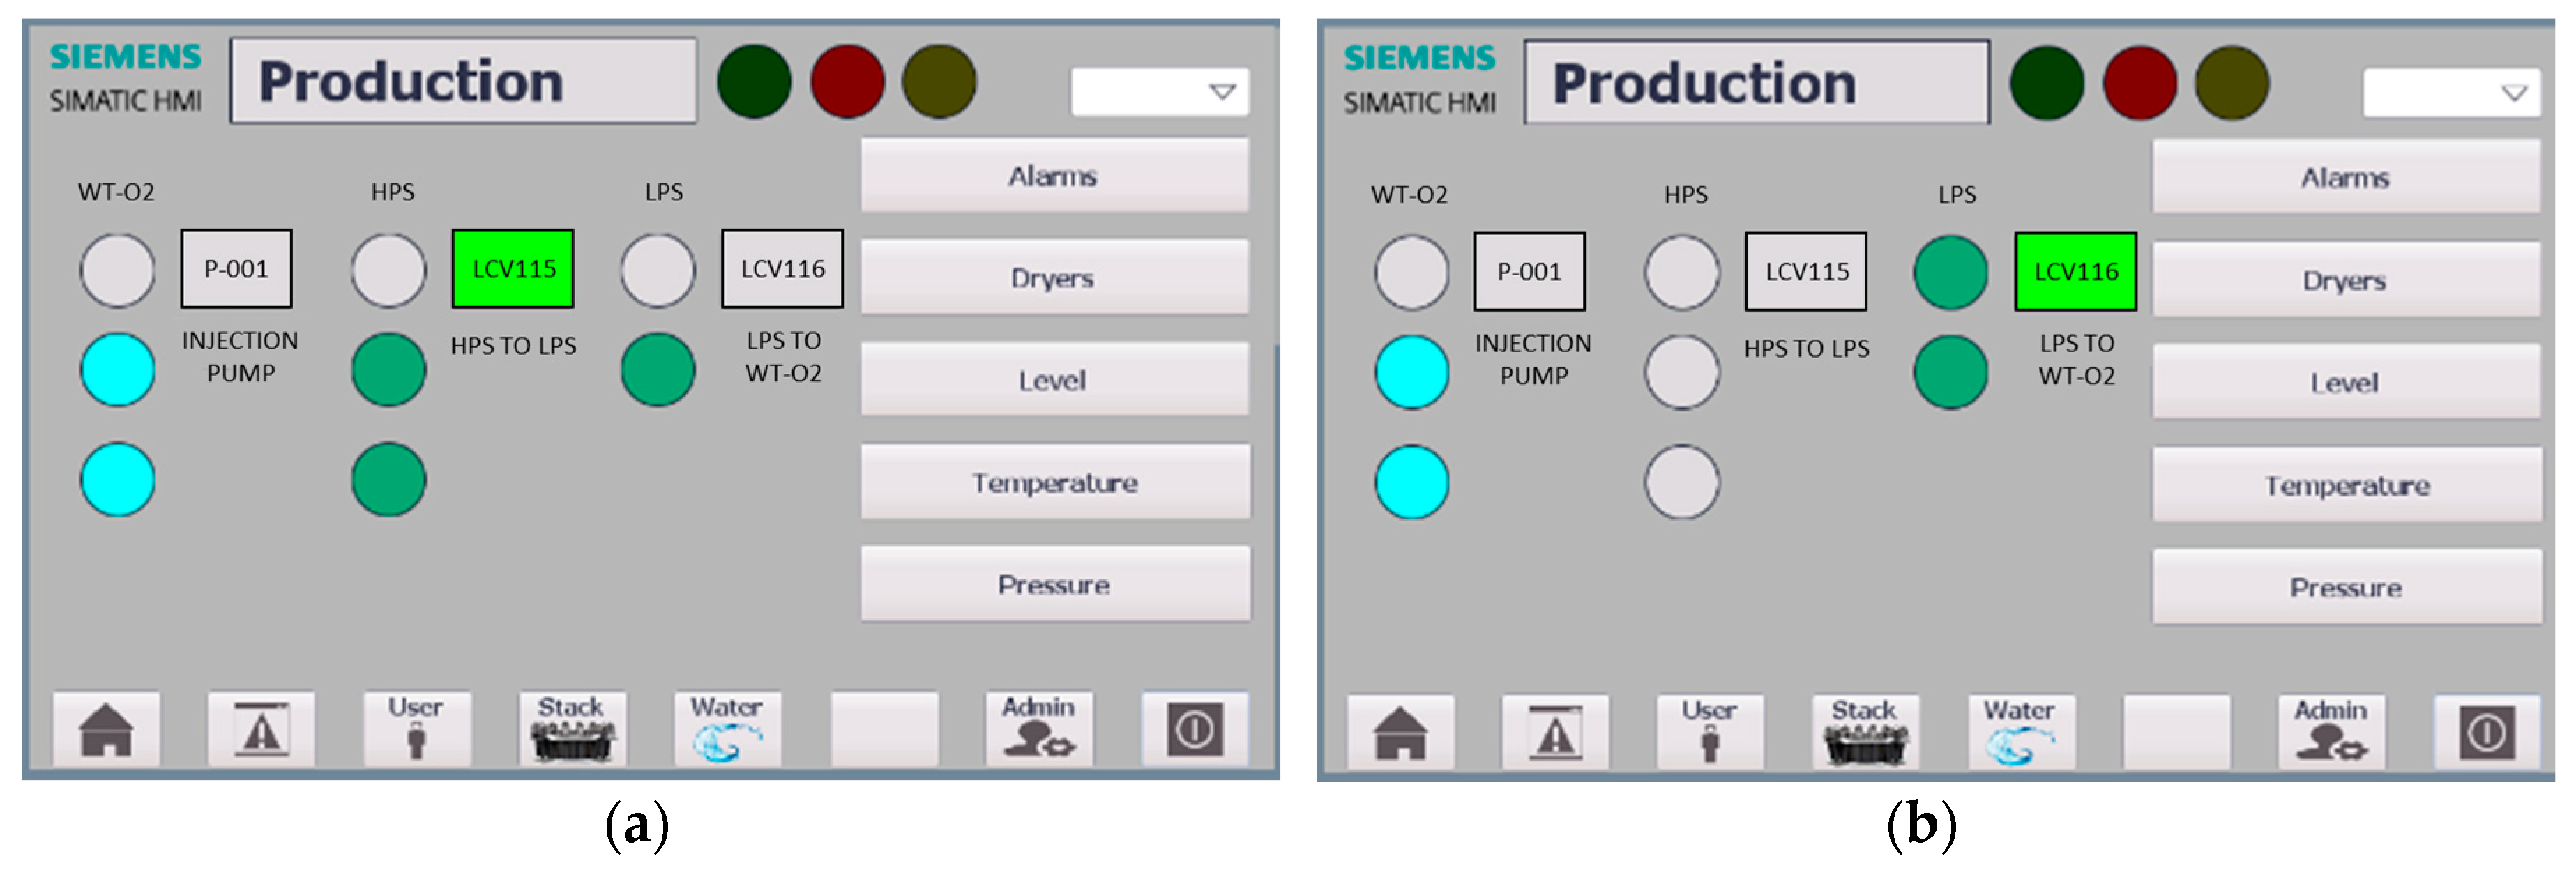
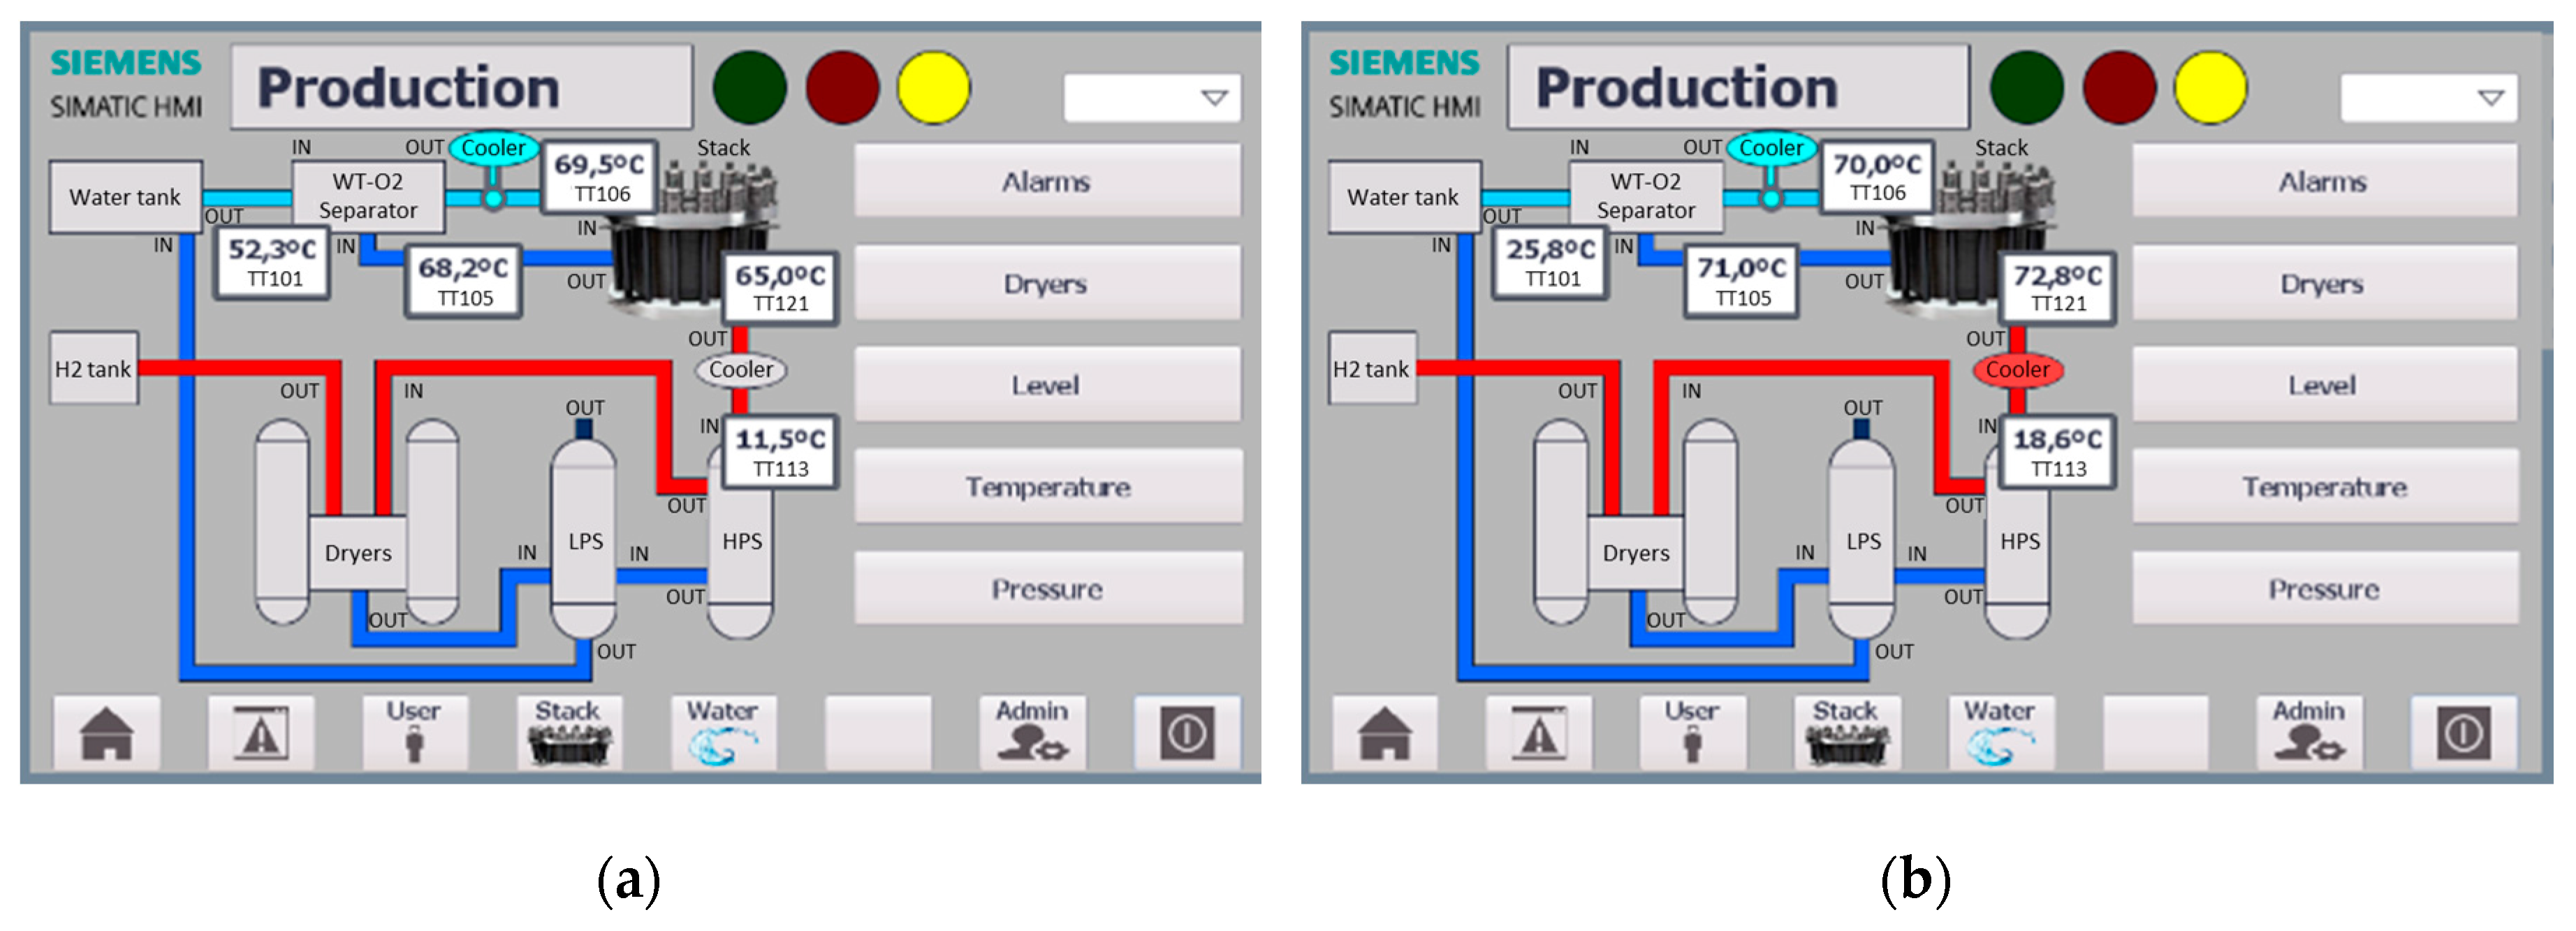
On the other hand, in relation to the hydrogen production subsystem, the controller tracks the levels in the pressure separators (HPS and LPS) (
Figure 14), acting over the electrovalves (LCV115 and LCV116) that communicates with both separators and the oxygen separator. Additionally, the monitoring interface shows the cooling subsystem operation. Then, when water or hydrogen flows achieve the highest allowable temperature values, the cooling subsystem is activated (
Figure 15).
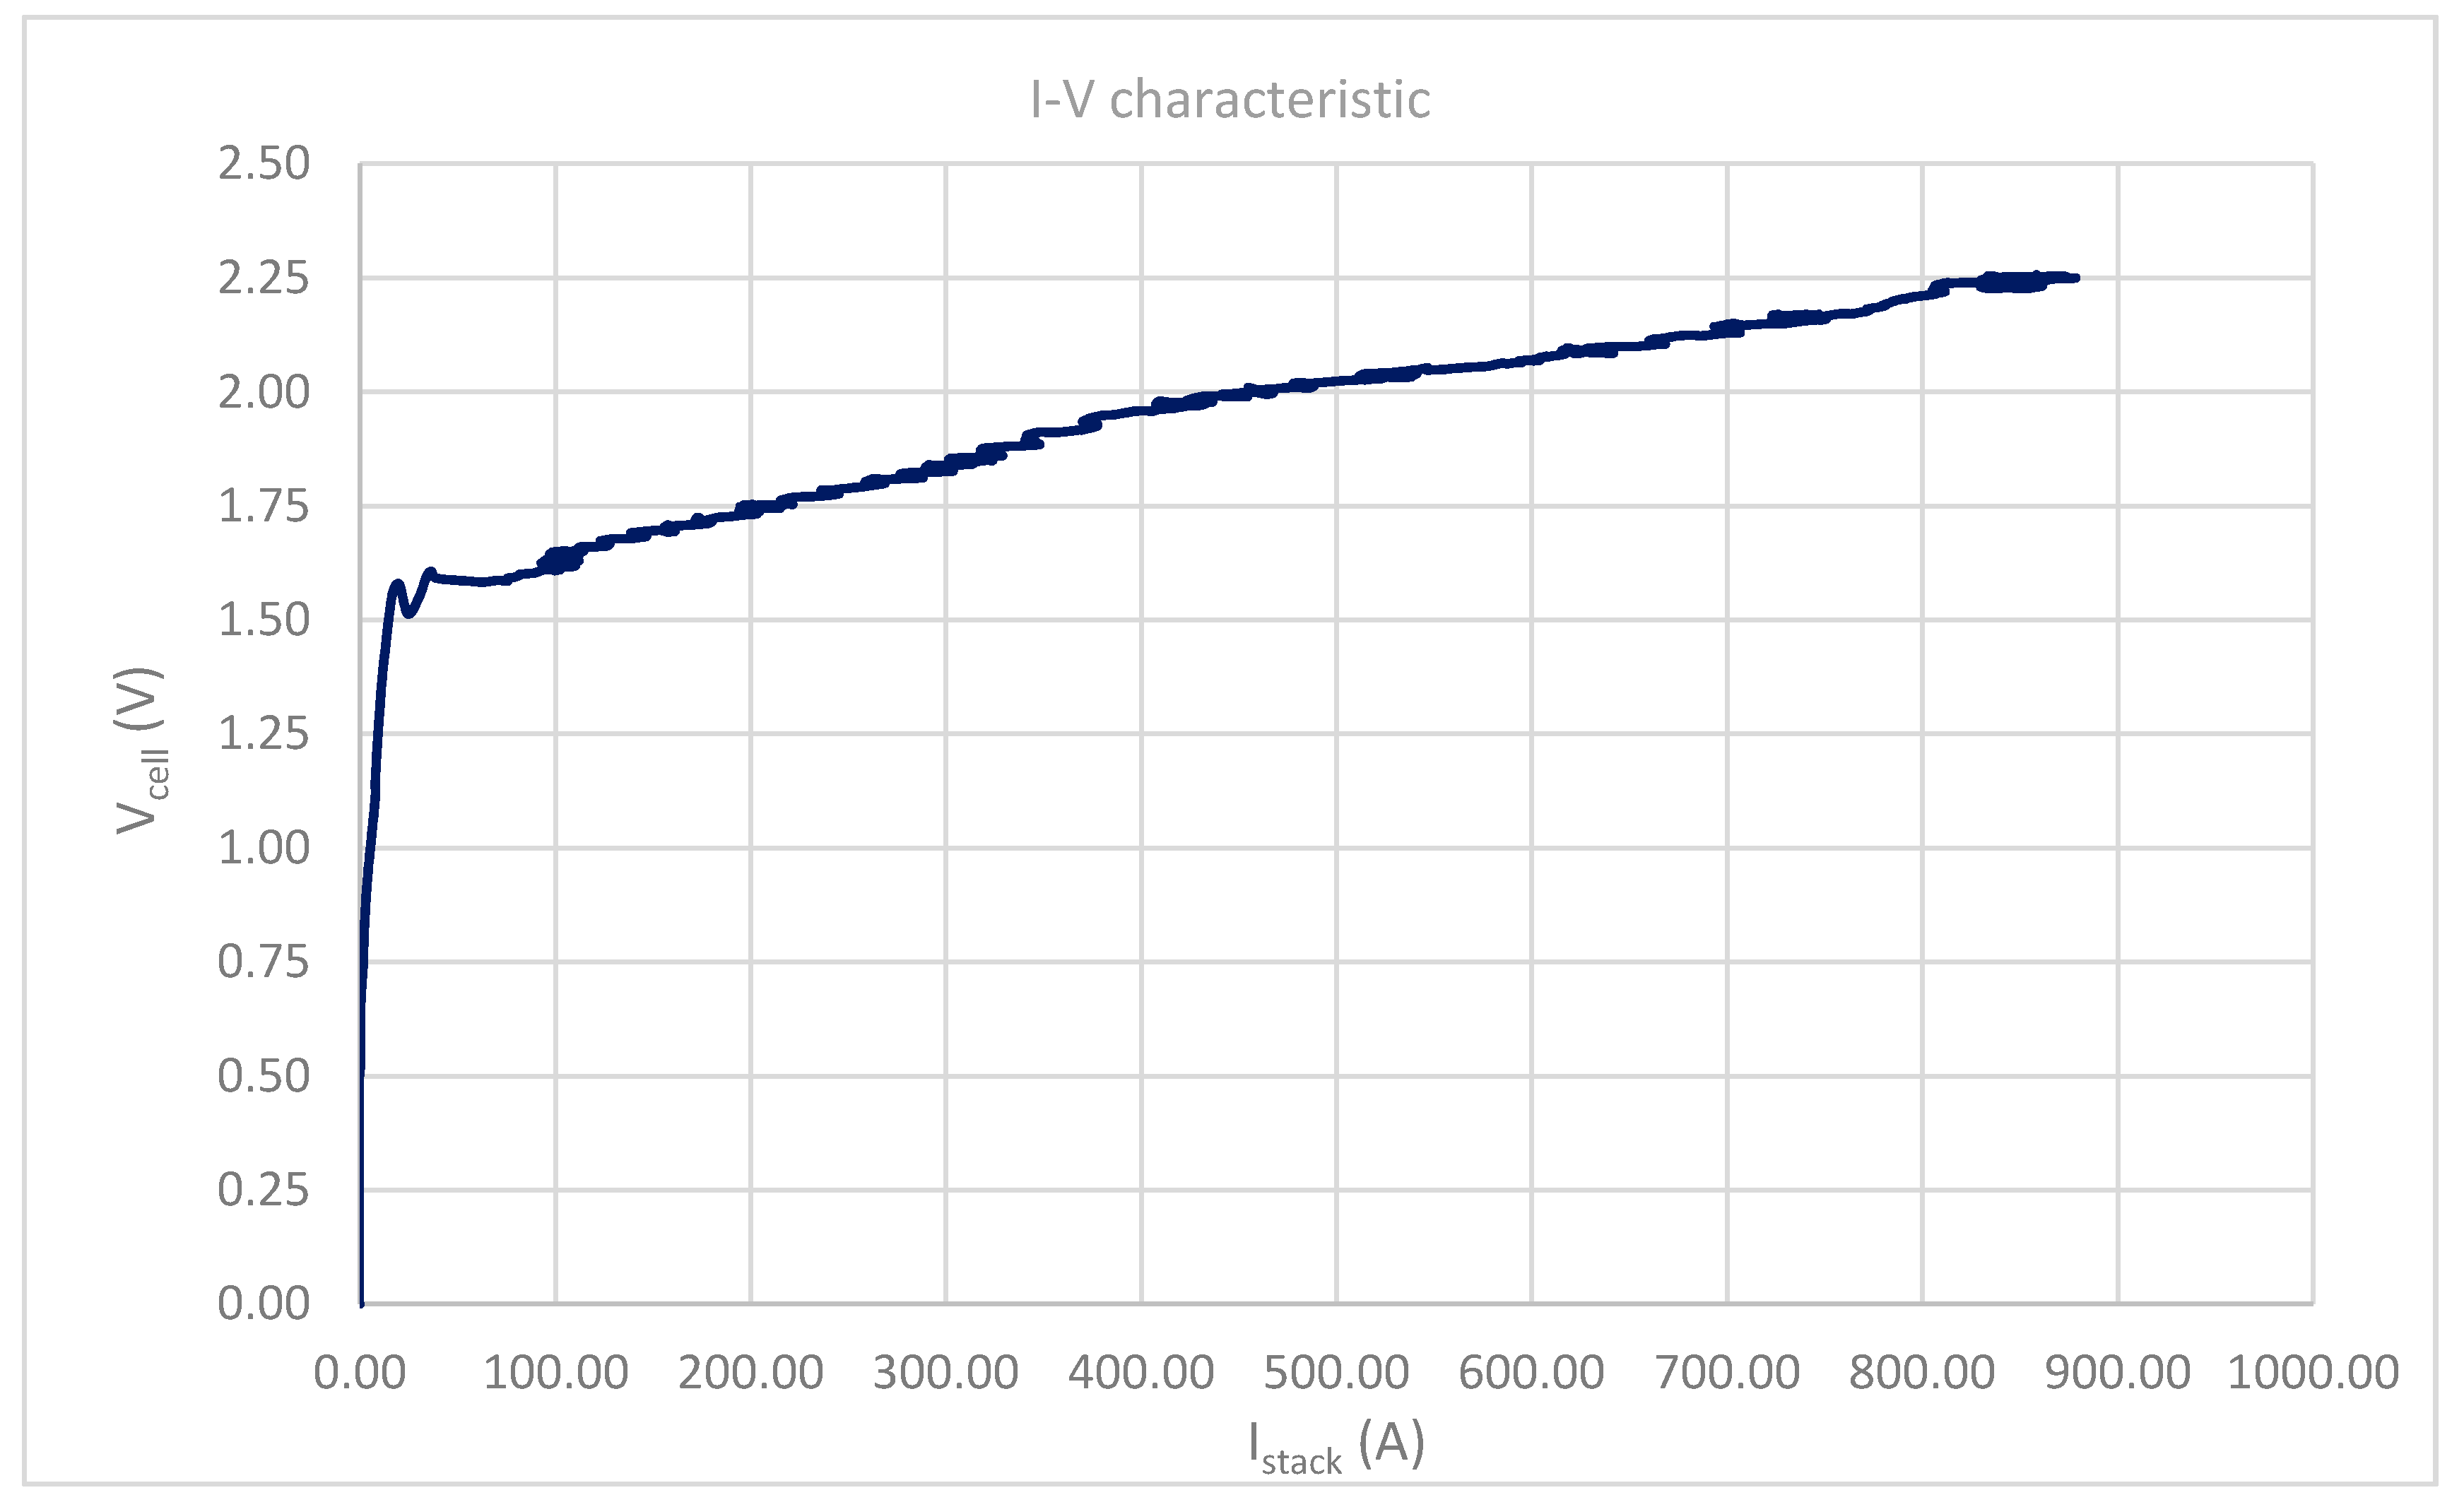
The I-V curve,
Figure 16 verifies that the system works within the range of current indicated for the cells, and through it, the electrolysis voltage is obtained to perform the stack efficiency calculations. In the curve that relates to the stack power and the hydrogen production rate (
Figure 17), the maximum production of the design is verified as well as a maximum consumption, which is close to the expected.
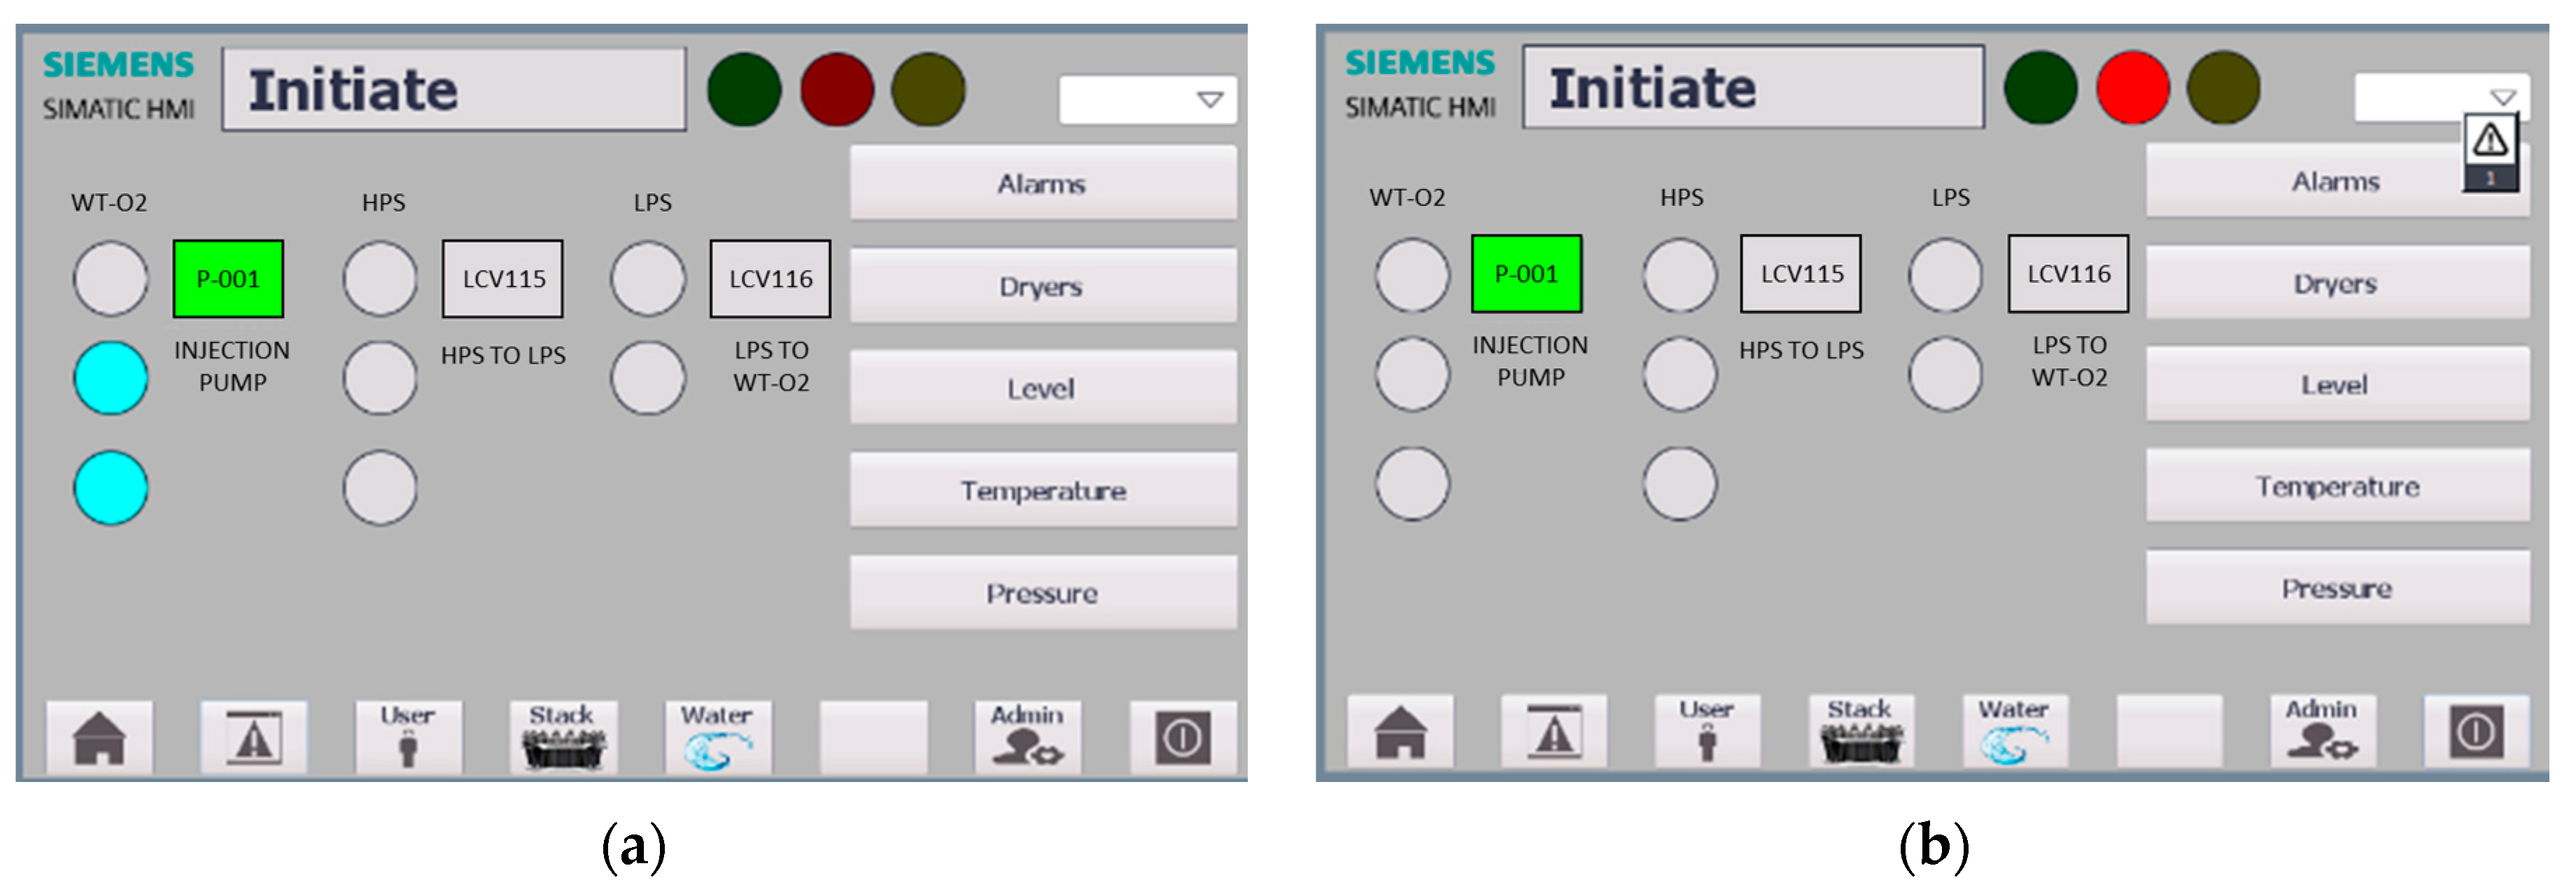
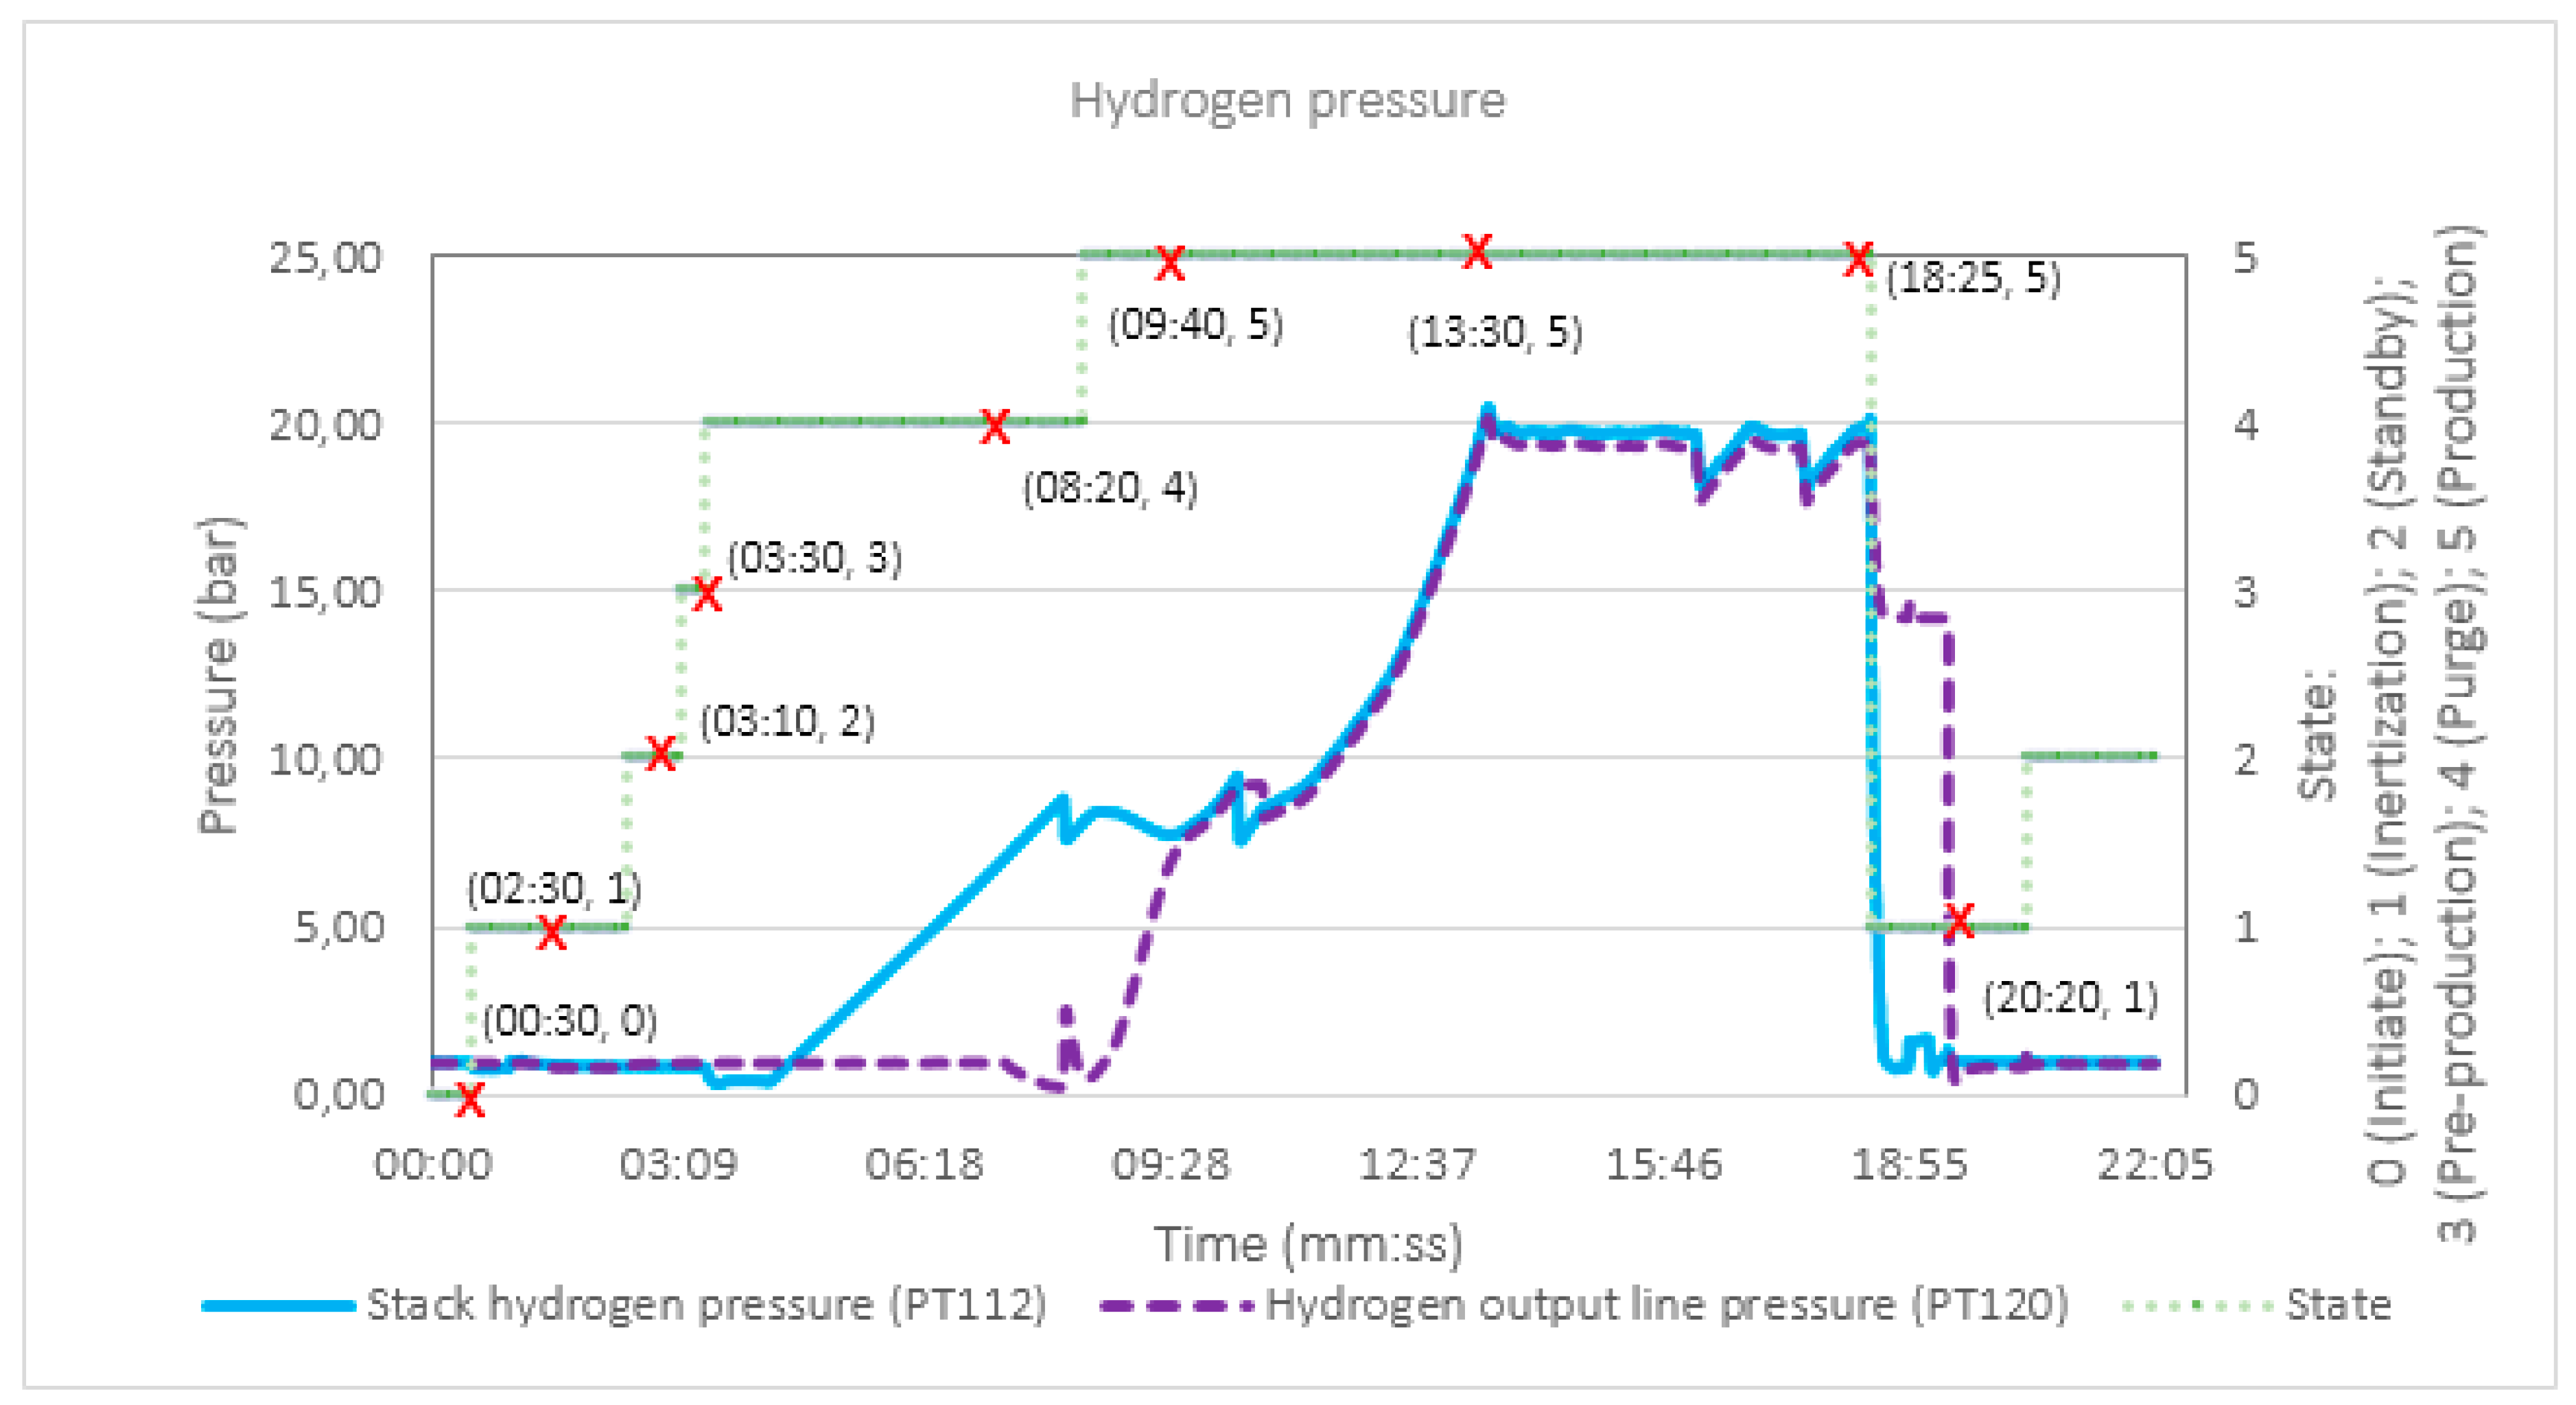
In the second part of the experimental test,
Figure 18 shows the processes the system goes through during a start-stop cycle. At the first phase of the
Initiate state, the pressure values are around 1 bar. When the user presses the inertization button and the
Inertization state begins (
Figure 18, coordinate (00:30). When the system completes a successful
Inertization (
Figure 18, coordinate (02:30, 1)), it passes to the
Standby state.
When the production button is pressed, the equipment goes quickly through the
Pre-production stage (
Figure 18, coordinate (03:10, 3), as the adequate conditions in the water subsystem are quickly reached to start the electrolysis process. This takes a few seconds, and in time 03:30, the
Purge state is reached. At this state, the hydrogen pressure at the stack output starts to rise until 9 bar (
Figure 18, coordinate (08:20, 4)). At this time the system enters into
Production state and the hydrogen flows to the drying stage. Due to the opening of the electrovalves (CV118 and CV119) that communicate HPS with PSA dryers, a small pressure drop peak occurs at the hydrogen flow leaving the stack. During the
Production stage, both pressures are equalized (
Figure 18, time 09:40) and their values coincide during the entire production process. Once the maximum established pressure of 20 bar is reached (
Figure 18, coordinate (13:30, 4), the hydrogen is ready to be delivered and stored in an external storage tank. It can be deduced that the pressurization time is 10 min (13:30–03:30), from
Purge to
Production state. During the production process it is possible to observe small occasional pressure drops, which are the ones that occur due to the operation PSA drying stage. The dryers accumulate the humidity of the hydrogen in its final phase, and periodically purge it to the outside. Because it is a pressure process, without the use of thermal elements, a small portion (1.6 bar) of the pressure of the production hydrogen is used to purge the humidity, which is the reason why instantaneous pressure drops occur. To carry out the controlled shutdown of the plant, the user presses the standby button and it stops in the
Inertization state (
Figure 18, coordinate (18:25, 5)), to purge hydrogen from the pipelines with the use of nitrogen. This process has two phases, firstly the pressure is purged from stack output and secondly the pressure is purged from the hydrogen output line. After
Inertization is complete, the PEM electrolyzer keeps at
Standby state (
Figure 18, coordinate (20:20, 1)), with hydrogen depressurized and ready to re-start the process or on the contrary, to be disconnected.
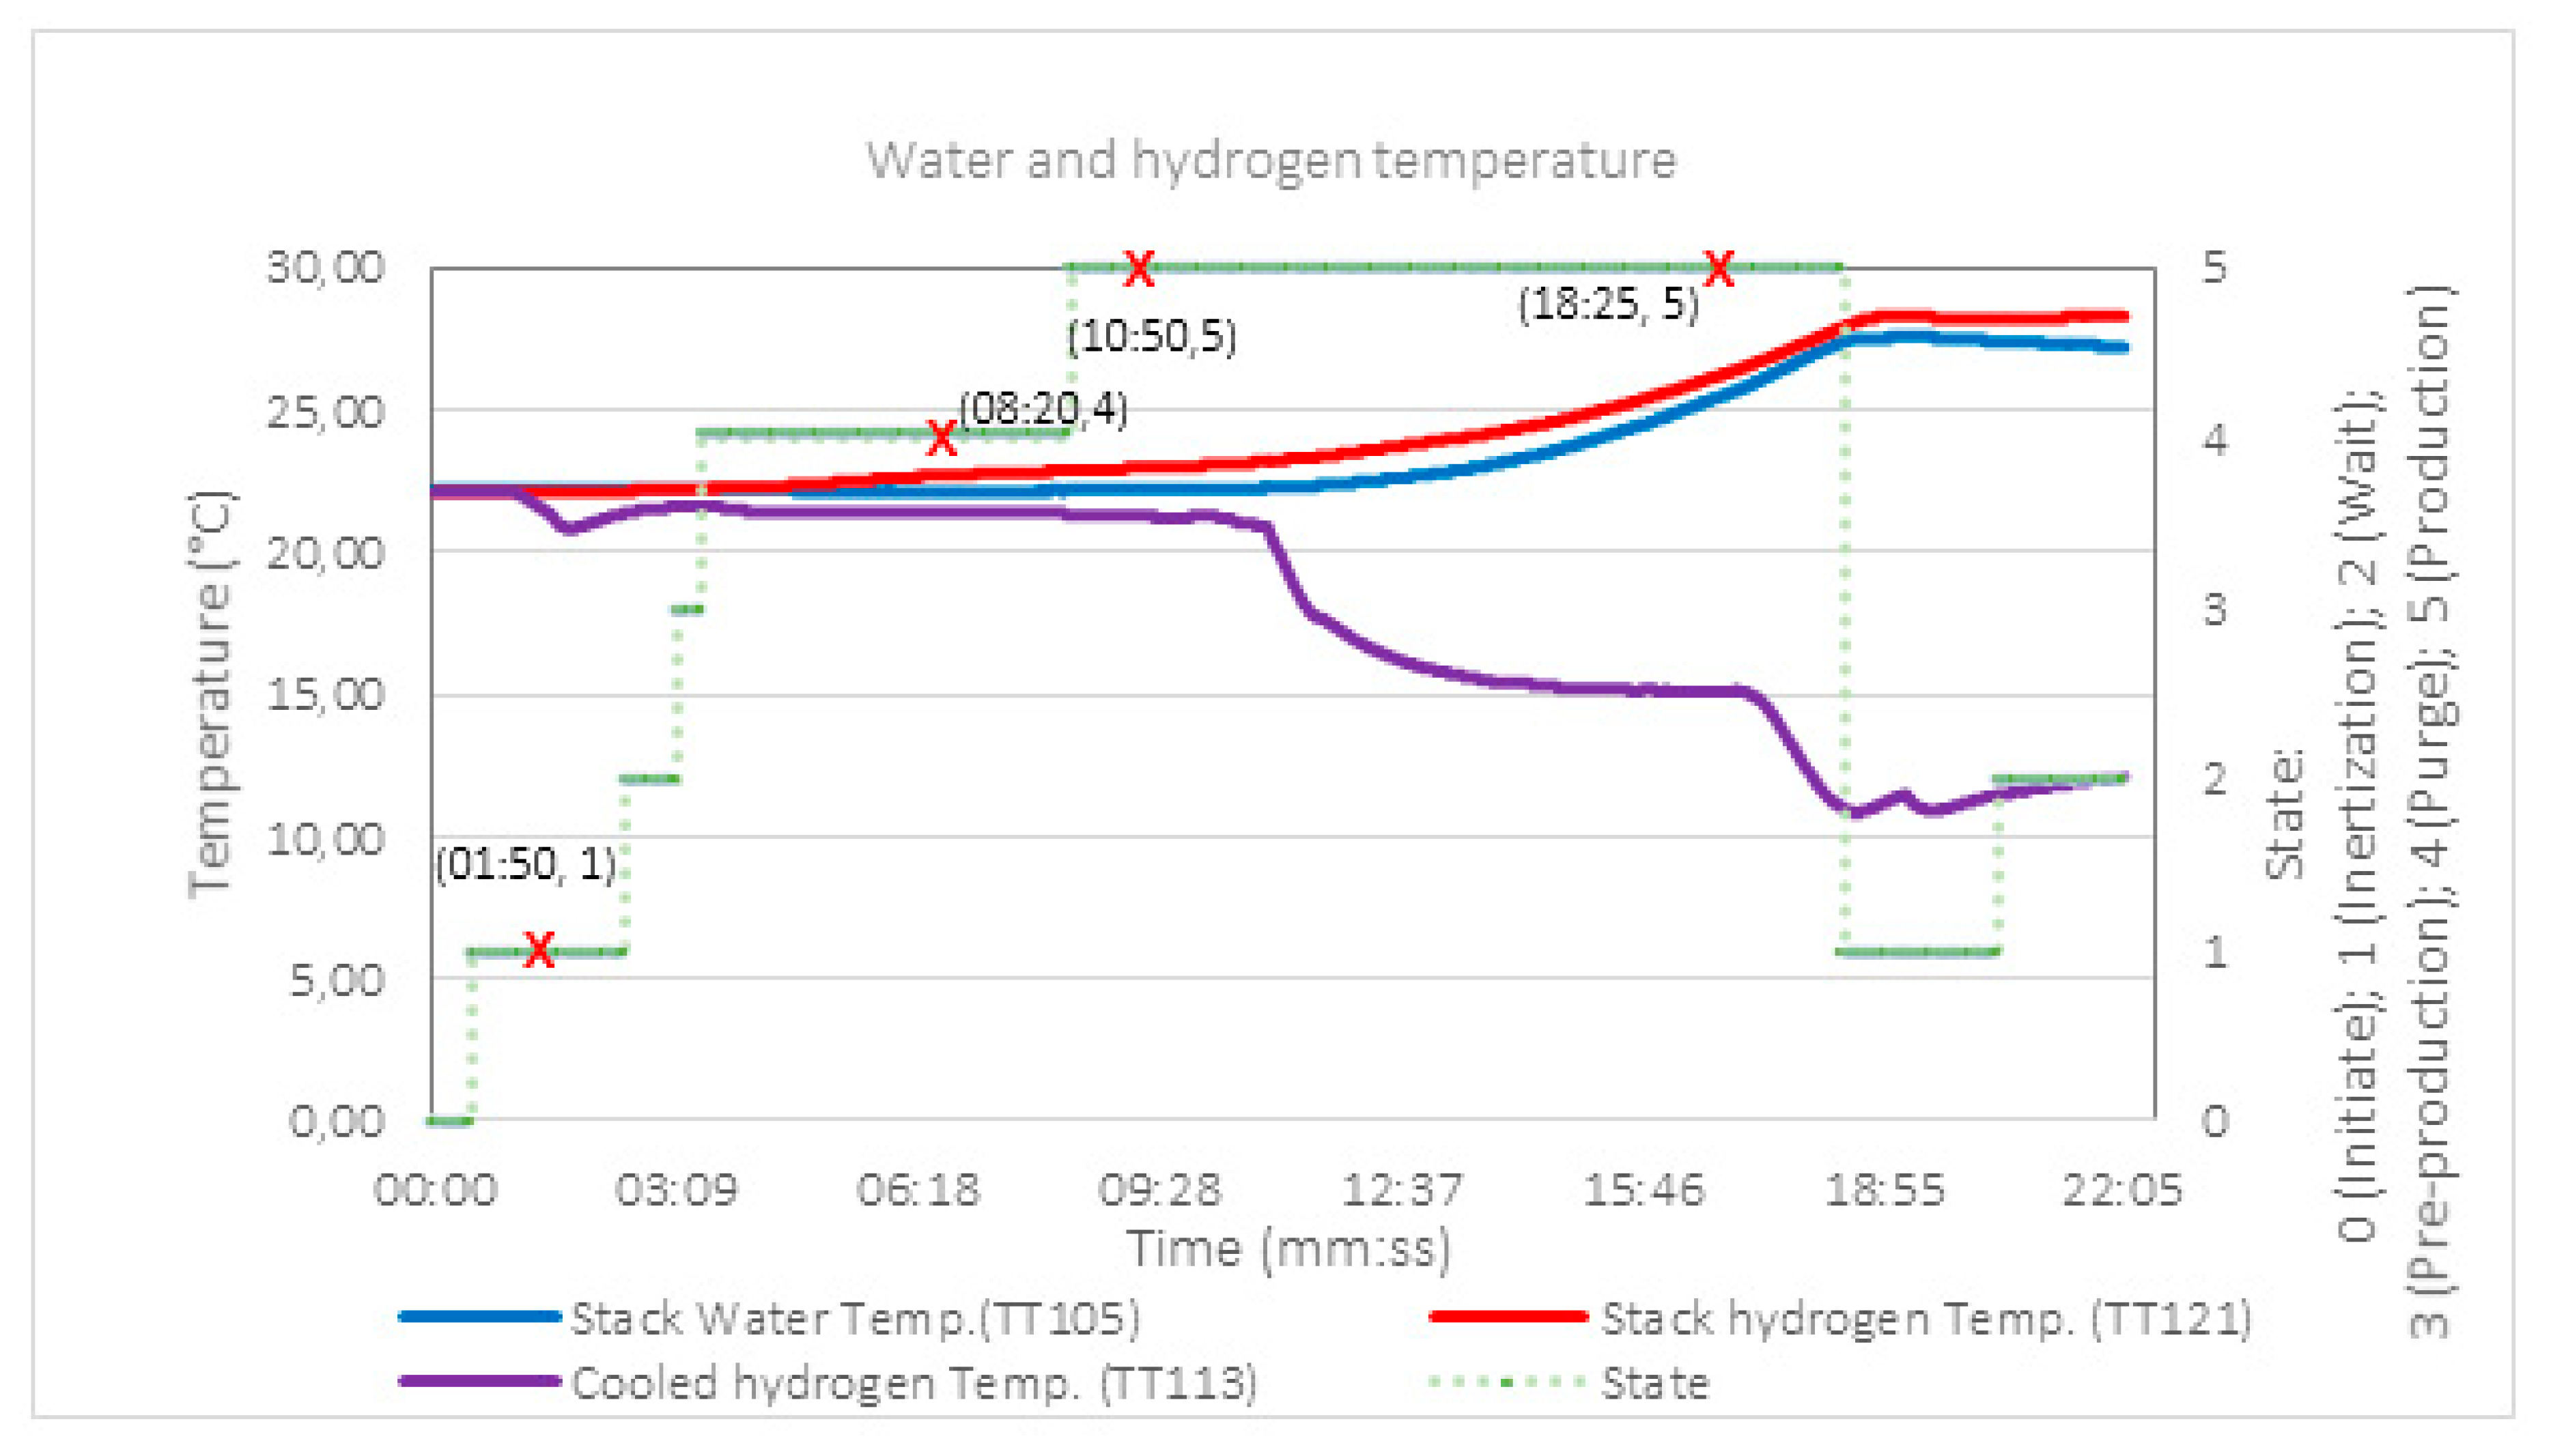
In a similar way to the hydrogen flow pressure,
Figure 19 allows the tracking of the water and hydrogen flow temperature. The initial temperature in the
Initiate state is 22 °C, corresponding to the ambient temperature. In the
Inertization state it is observed how there is a small drop in cooled hydrogen temperature (
Figure 19, coordinate (01:50, 1)), this is due to the operation of the cooling subsystem. Since the hydrogen flow temperature at the stack output is inside the allowed range, the cooling is deactivated and the temperature value is stabilized again. During the
Purge state, water and hydrogen temperature values go up smoothly until the
Production state (
Figure 19, coordinate (08:20, 4)), where the temperature curve slopes start to increase. At time 10:50, the controller is warned that the hydrogen flows temperature needs to be cooled, and it activates the cooling subsystem. Then, the temperature of the hydrogen flow after the cooling phase decreases until it is stabilized to 15 °C. From this moment, the developed control logic guarantees that the cooling subsystem maintains the hydrogen temperature at 15 °C during for the entire duration of the
Production state. When the user presses the standby button, the
Production state finishes (
Figure 19, coordinate (18:25, 4)), and the systems enters into the
Inertization state. As a consequence to turning off the system, the water and hydrogen flow temperatures are established to ambient temperature and the cooling subsystem is deactivated.
Finally,
Table 6 shows a summary of the main characteristics of the developed PEM electrolyzer.
6. Conclusions
This paper has described the design, implementation, and practical experimentation of a medium-size PEM electrolyzer for the production of pressurized hydrogen, from water and electric power (renewable if possible, as in our case). From a commercial stack, the key to achieving its best performance has been the optimal design of the BoP, paying special attention to the subsystems that comprise it: the stack power supply subsystem, water management subsystem, hydrogen production subsystem, cooling subsystem and control subsystem. Based on this, the control logic has been developed under the criteria of guaranteeing efficient and safe operation. For this purpose, each subsystem has required its own control logic according to plant technical specification. Additionally, the control logic of the four subsystems has been integrated into the operating states sequence that governs the electrolyzer performance.
The obtained experimental results validate the control logic in various operating cases, including warning and failure cases. Additionally, experimental results show correct operation in all the plant states. To check them, the evolution of the hydrogen flow pressure and temperature as well as water temperature have been analyzed. Comparing the developed electrolyzer with those found in the scientific literature, the first is characterized by its high stack efficiency (>77%) and low pressurization time (10 min) without an external compressor. This feature increases the global efficiency, reducing the consumption from auxiliaries. On the other hand, the current density of 3 A/cm2 also differentiates the proposed design, since the typical current density reviewed in the literature ranges from 1 to 2 A/cm2; this allows the achievement of high hydrogen production rates at low cell voltage. The last improvement of the proposed BoP regarding the literature review is the hydrogen cooling, placed at the stack hydrogen outlet. Therefore, the first gas separator stage (HPS) receives more condensed water, so the hydrogen drying is more efficient from its first phase.
In conclusion, the capacity of the developed PEM electrolysis plant regarding its production rate, wide operating power range, reduced pressurization time and high efficiency has been proved.

 ,
, 


