Article

Bradykinesia Detection in Parkinson’s Disease Using Smartwatches’ Inertial Sensors and Deep Learning Methods

1
Instrumentation and Applied Acoustics Research Group (I2A2), ETSI Industriales, Universidad Politécnica de Madrid, Campus Sur UPM, Ctra. Valencia, Km 7, 28031 Madrid, Spain
2
ALGORITMI Research Center, School of Engineering, University of Minho, 4800-058 Guimarães, Portugal
3
Department of Control and Computer Engineering, Politecnico di Torino, 10129 Turin, Italy
*
Author to whom correspondence should be addressed.
Electronics 2022, 11(23), 3879; https://doi.org/10.3390/electronics11233879
Submission received: 31 October 2022 / Revised: 16 November 2022 / Accepted: 21 November 2022 / Published: 24 November 2022

Abstract

:
Bradykinesia is the defining motor symptom of Parkinson’s disease (PD) and is reflected as a progressive reduction in speed and range of motion. The evaluation of bradykinesia severity is important for assessing disease progression, daily motor fluctuations, and therapy response. However, the clinical evaluation of PD motor signs is affected by subjectivity, leading to intra- and inter-rater variability. Moreover, the clinical assessment is performed a few times a year during pre-scheduled follow-up visits. To overcome these limitations, objective and unobtrusive methods based on wearable motion sensors and machine learning (ML) have been proposed, providing promising results. In this study, the combination of inertial sensors embedded in consumer smartwatches and different ML models is exploited to detect bradykinesia in the upper extremities and evaluate its severity. Six PD subjects and seven age-matched healthy controls were equipped with a consumer smartwatch and asked to perform a set of motor exercises for at least 6 weeks. Different feature sets, data representations, data augmentation methods, and ML models were implemented and combined. Data recorded from smartwatches’ motion sensors, properly augmented and fed to a combination of Convolutional Neural Network and Random Forest model, provided the best results, with an accuracy of 0.86 and an area under the curve (AUC) of 0.94. Results suggest that the combination of consumer smartwatches and ML classification methods represents an unobtrusive solution for the detection of bradykinesia and the evaluation of its severity.

1. Introduction

Parkinson’s disease (PD) is one of the most common neurodegenerative diseases worldwide [1], affecting millions of people and impacting their quality of life (QoL) [2]. PD is a progressive disease with a slow and variable evolution. In the early stages, the symptoms are weak, and they increase in intensity as the disease progresses [3]. PD involves both motor and non-motor symptoms, with some of the latter (i.e., speech impairment and sleep disorders) manifesting up to 20 years before the clinical diagnosis [4]. Being primarily a movement disorder, several motor signs are associated with PD, including bradykinesia, tremor, and rigidity. As the disease progresses, postural instability and freezing of gait (FOG) manifest, increasing the risk of falls [5] and contributing to decreased mobility [6]. As the main biochemical abnormality in PD is dopamine deficiency [7], current treatments are mainly based on dopamine replacement, with Levodopa representing the most effective drug treatment for PD [8,9]. However, current treatments do not prevent disease progression, their effectiveness decreases with disease progression [10], and long-term therapy frequently leads to severe side effects [11]. Moreover, as the disease progresses and drug therapy is administrated, patients may experience fluctuations in the state of their motor system, between the so-called ON state, where symptoms are under control and the patient can move fluidly, and an OFF state, in which a lack of dopamine predominates and symptoms reappear when the effect of the medication vanishes.
Bradykinesia represents one of the earliest motor signs of PD, and it is one of the main aspects that specialists try to quantify to diagnose PD and optimize therapy. It is defined by the slowness and decrease in the amplitude or speed of movement in a body part [12]. Akinesia and hypokinesia refer respectively to poor spontaneous movements (i.e., in facial expression) or associated movement (i.e., arm swing during walking) and the low amplitude of movement [2,13]. Bradykinesia can vary throughout the day and its severity also vary depending on the timing and amount of the last medication. In addition, the symptom’s severity also depends on the patient’s emotional state and environment [2]. Bradykinesia is one of the key signs in the evaluation of PD, it is directly related to dopamine deficiency [14], and it shows an exceptional response to treatment [15]. Thus, objectively quantifying this symptom would provide relevant information for treatment adjustments and early diagnosis. Following the movement disorder society revised version of the unified Parkinson’s disease rating scale (MDS-UPDRS), neurologists assess bradykinesia severity through the execution of rapid, repetitive, alternating hand and heel movements, and they observe the amplitude and slowness of the movement [16]. However, the assessment is performed sporadically, during brief follow-up visits, often without considering the effect of medication. Moreover, intra-rater and inter-rater variability affect the evaluation of the patient’s motor performance [17,18].
Subjectivity and late diagnosis highlight the need for new, more objective methodologies allowing the early diagnosis of the disease, the continuous monitoring of its evolution, and the evaluation of the response to therapy [19]. In this context, digital technologies have demonstrated their potential to change the disease paradigm, providing unobtrusive yet efficient solutions for the diagnosis, assessment, monitoring, and treatment planning of PD patients [20,21]. Indeed, an objective measure of PD symptoms can help improve disease management and accelerate the development of new therapies [15]. Wearable sensors benefit from the current technological advances to provide lightweight, portable, easy-to-use, inexpensive devices which can provide accurate measurements of physical variables [22]. Wearable motion sensors and ML methods have been widely used for objectively and rigorously assessing motor symptoms, motor fluctuations, and other complications that are relevant to adjust treatment and remote assistance [15,23,24,25,26].
In this context, this paper evaluates the potential of consumer smartwatches for estimating bradykinesia severity in PD. To this end, upper limb motion data were recorded from a triaxial accelerometer and triaxial gyroscope placed on the patient’s wrist. Then, signal processing, data augmentation, data transformation, and different ML and DL classification models were implemented to predict the bradykinesia severity following the standards of the MDS-UPDRS scale. The main contributions of this work are summarized as follows:
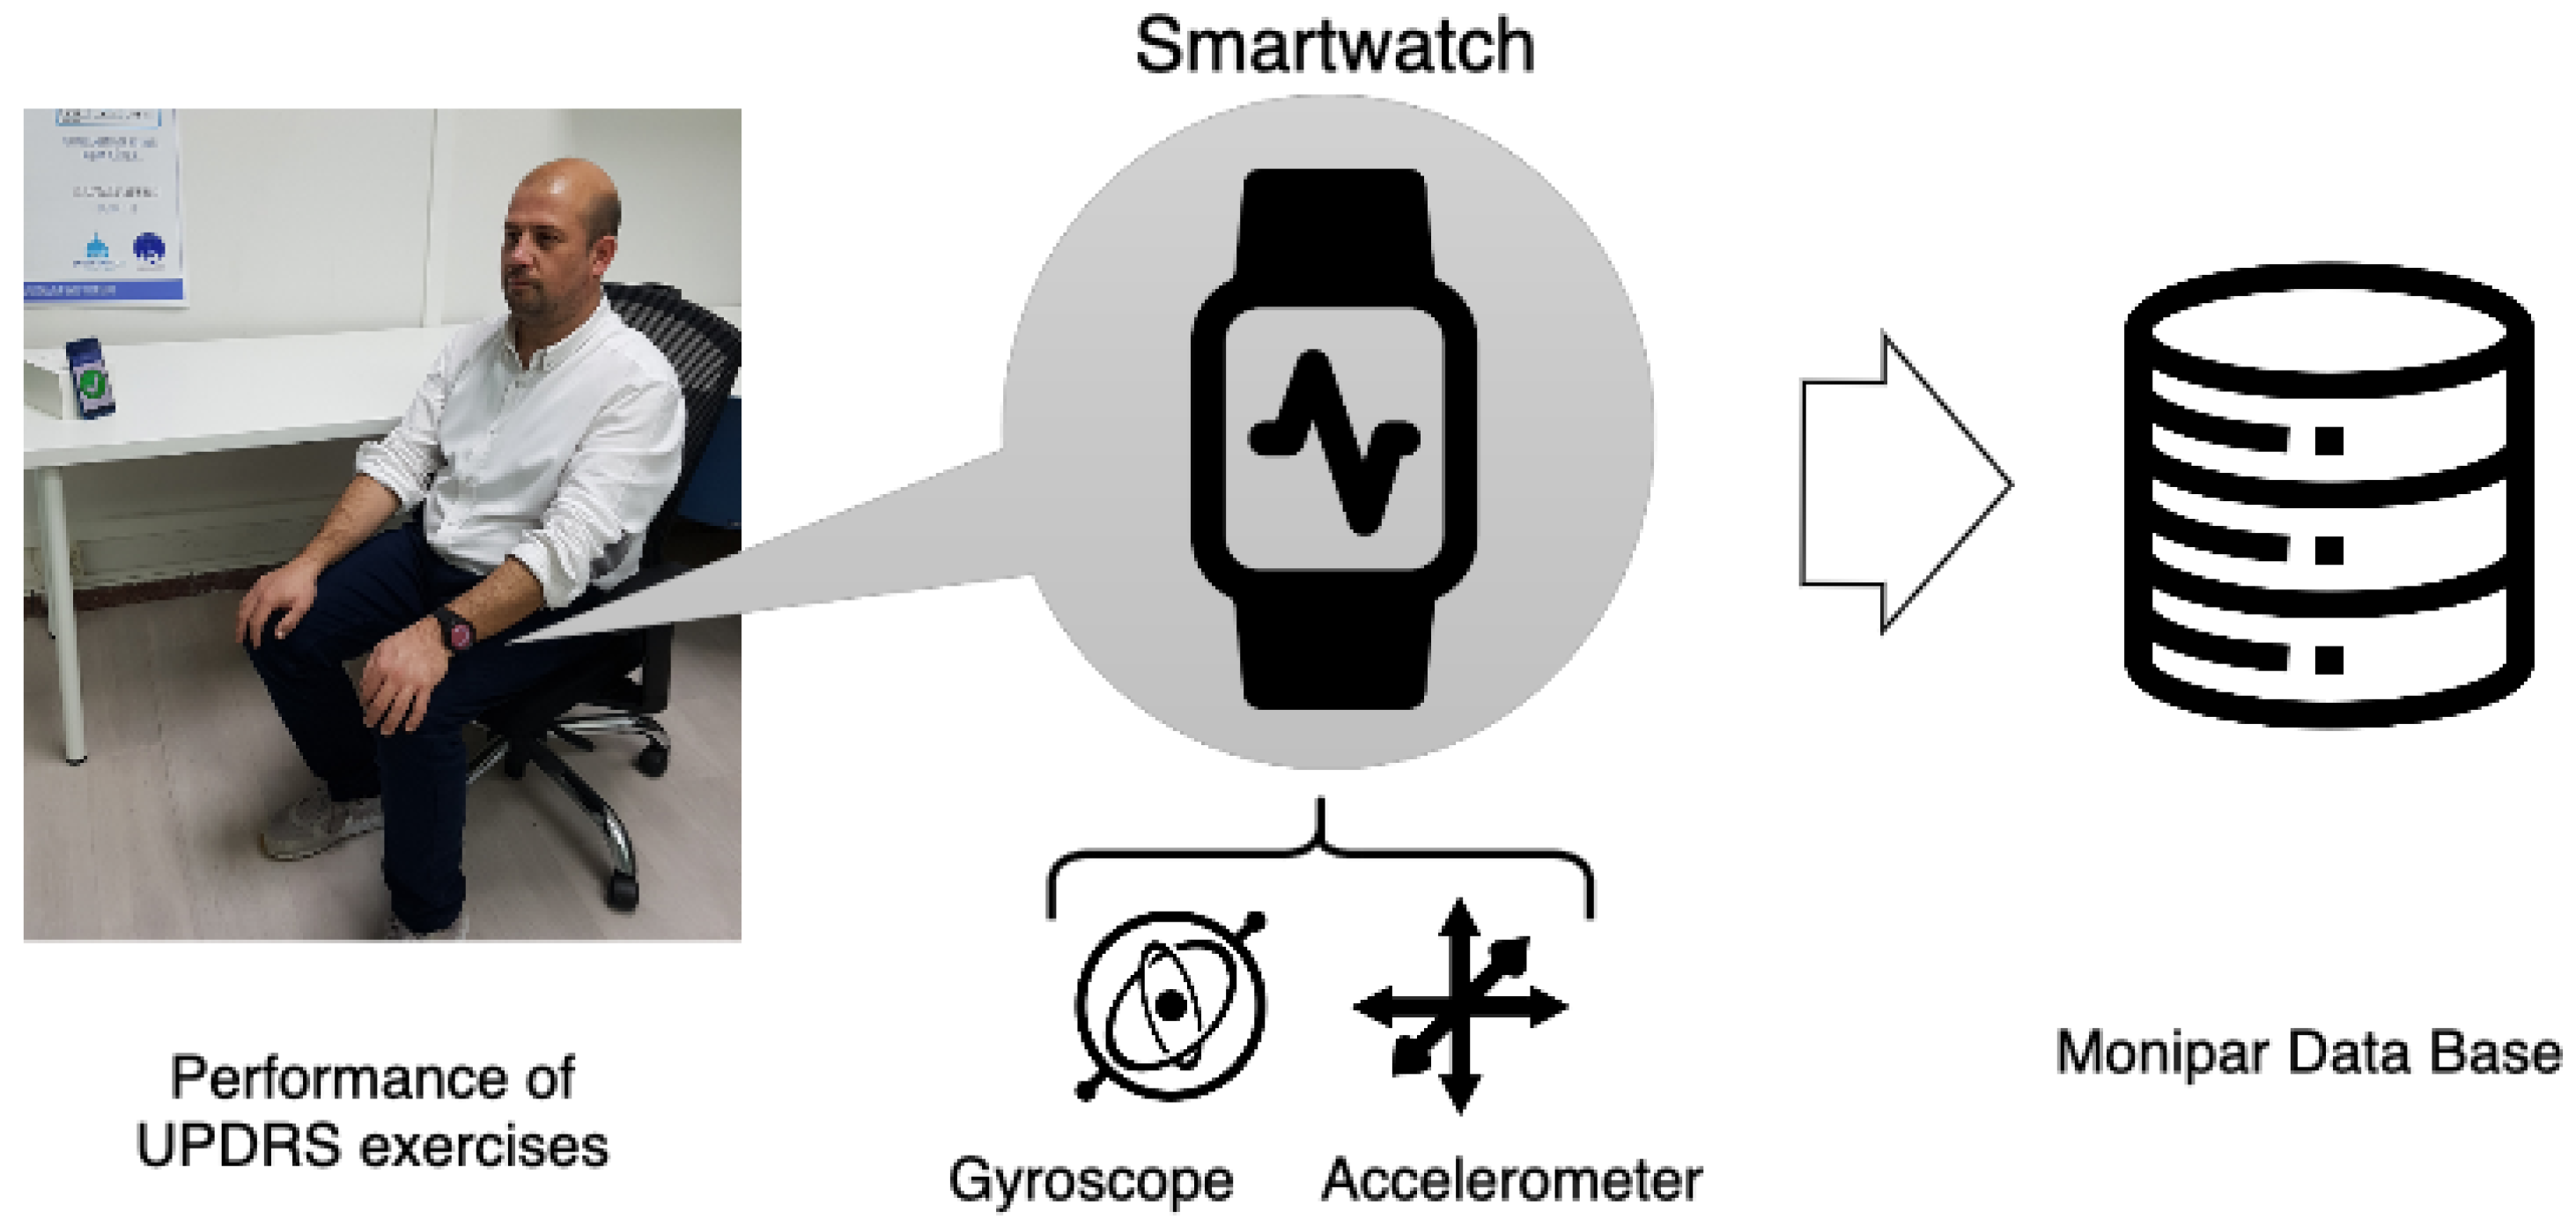
  • This study evaluates the potential of accelerometer and gyroscope sensors embedded in commodity smartwatches to detect bradykinesia severity using a set of standardized exercises. This approach can present an unobtrusive solution for bradykinesia monitoring in ambulatory and non-supervised environments using low-cost devices instead of using proprietary monitoring devices or sensors.
  • Different feature extraction methodologies proposed in the related literature are reproduced and evaluated with the data collected using commodity smartwatches. This task is performed to compare the predictive power of approaches based on ML and DL. In addition, the potential of different data representations and data augmentation techniques is evaluated with the aim of improving the performance of the systems for automatic bradykinesia severity scoring.
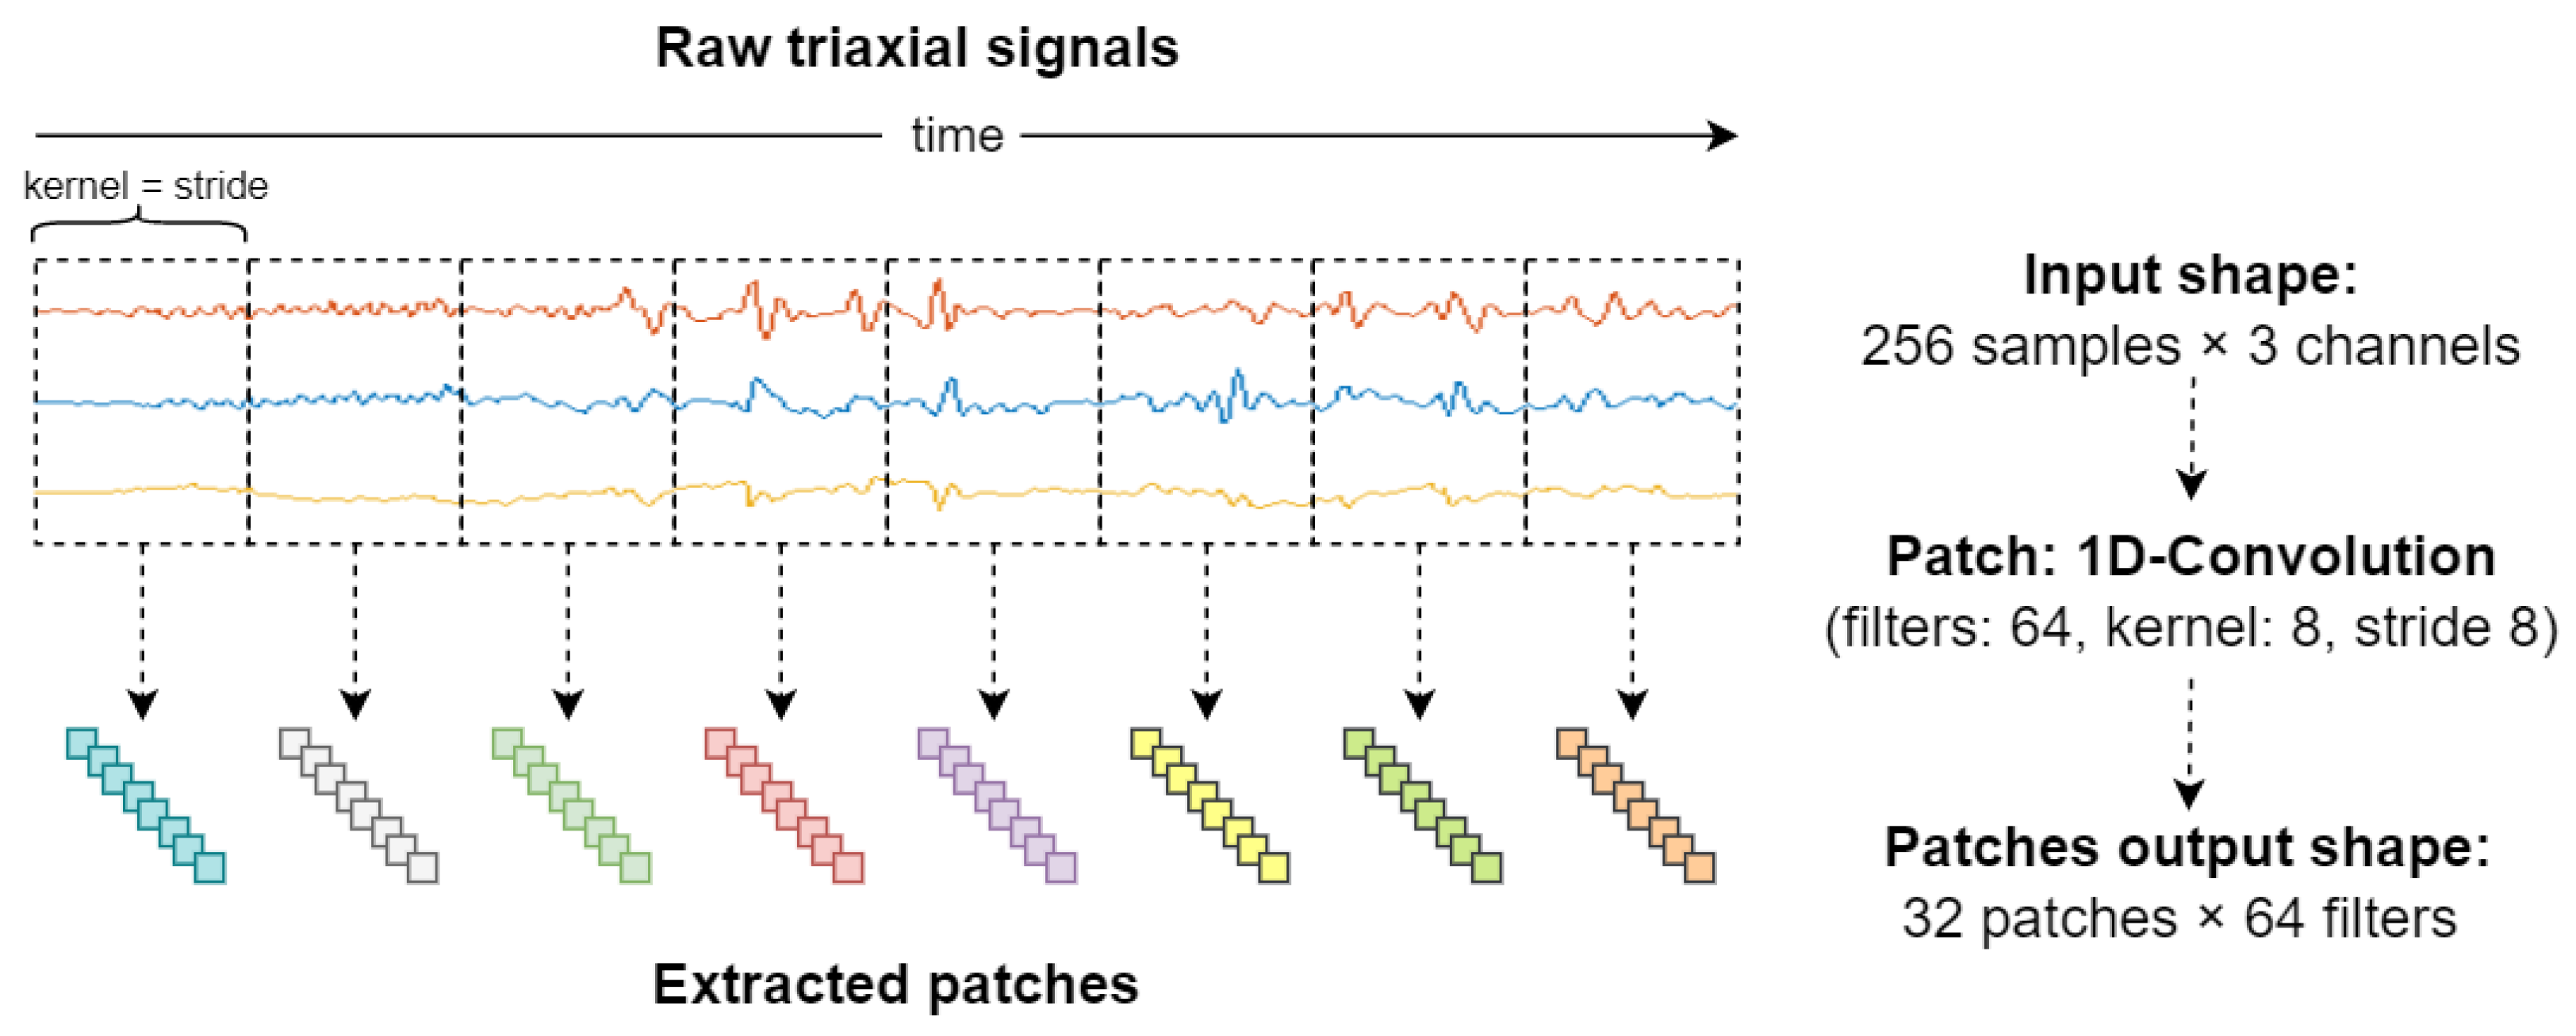
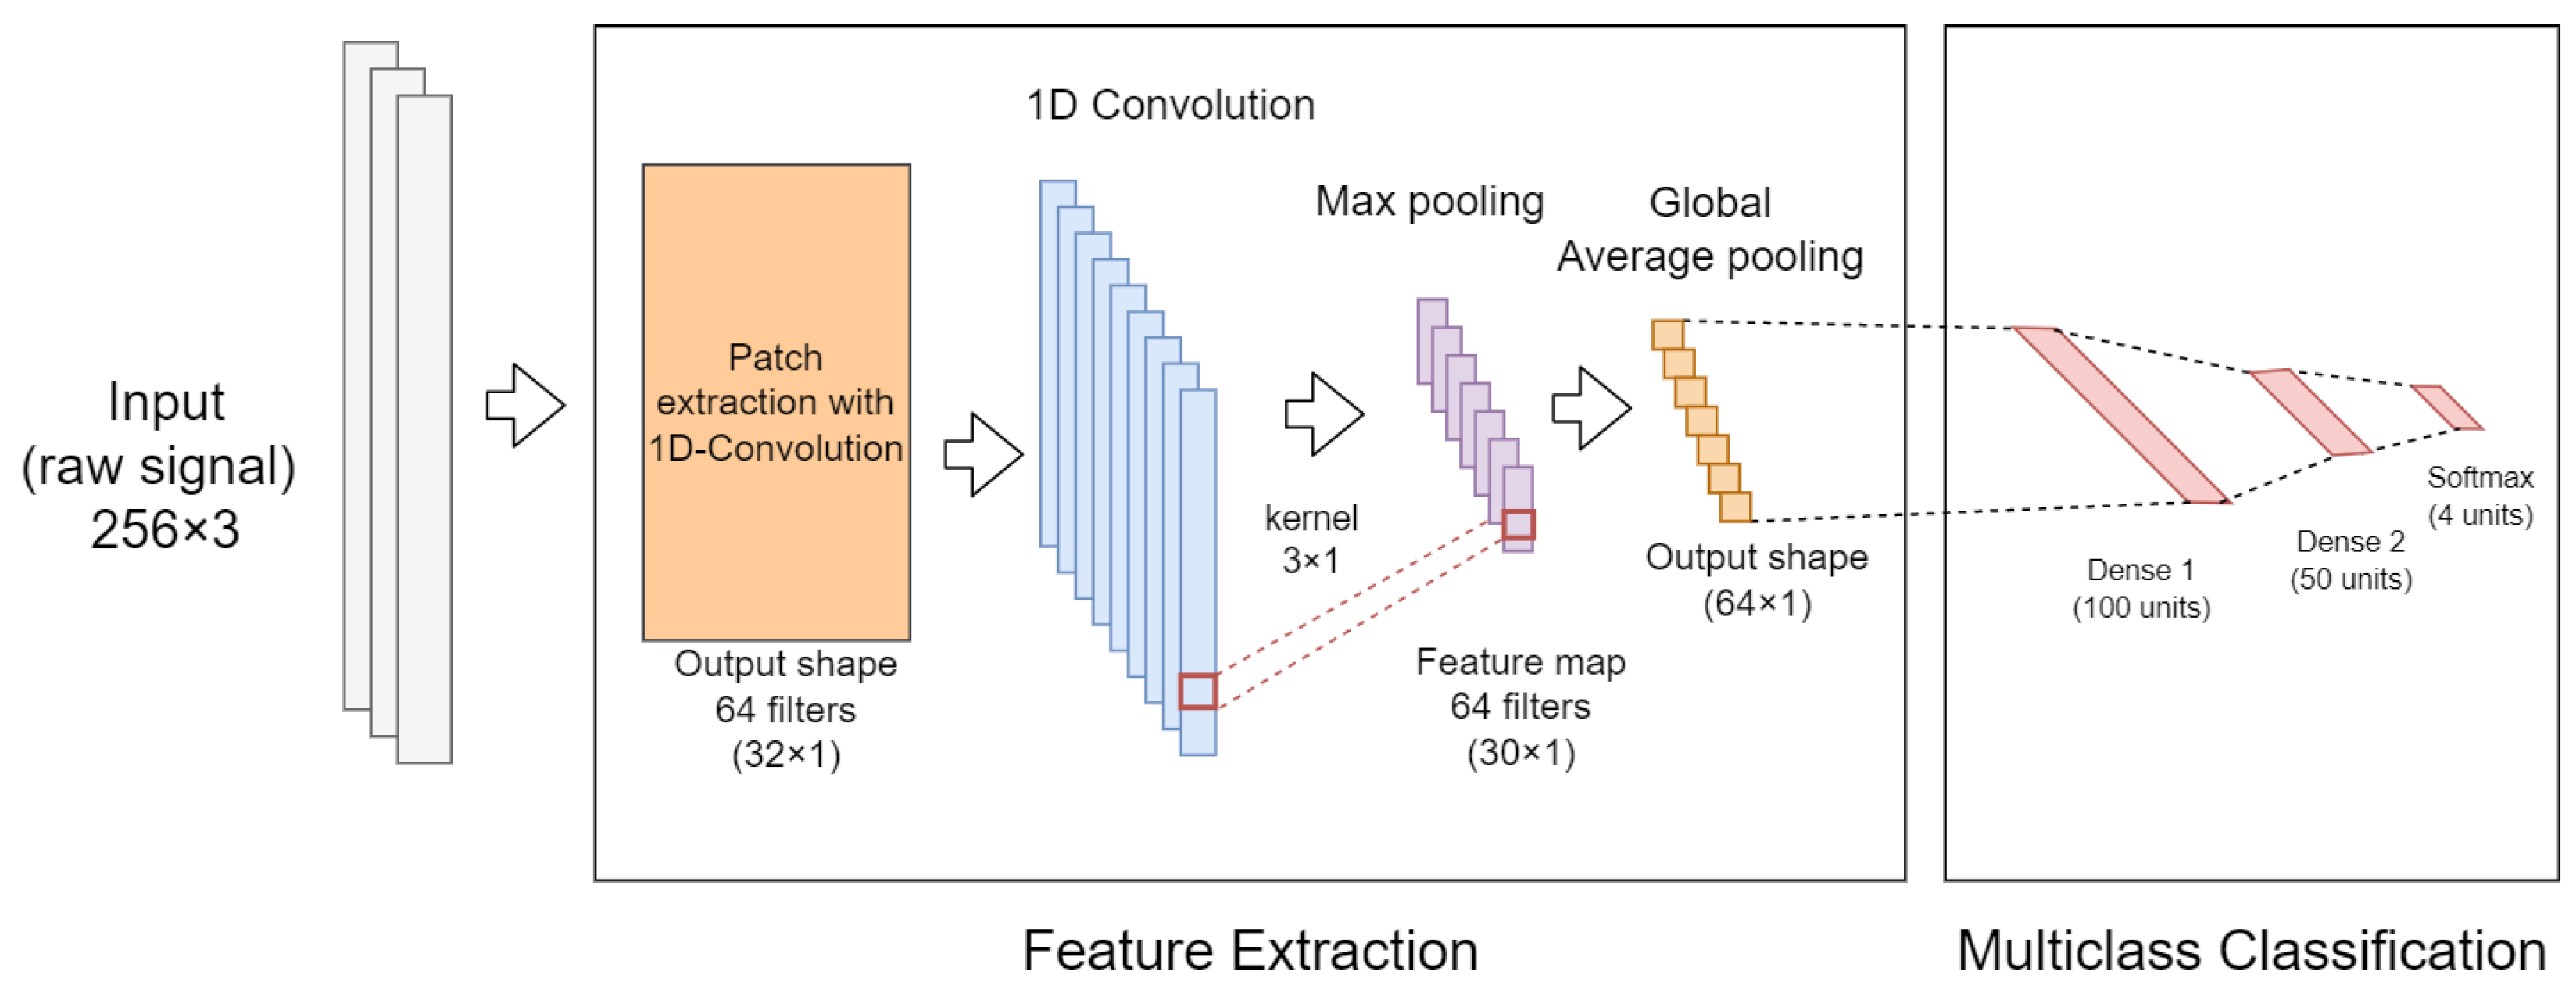
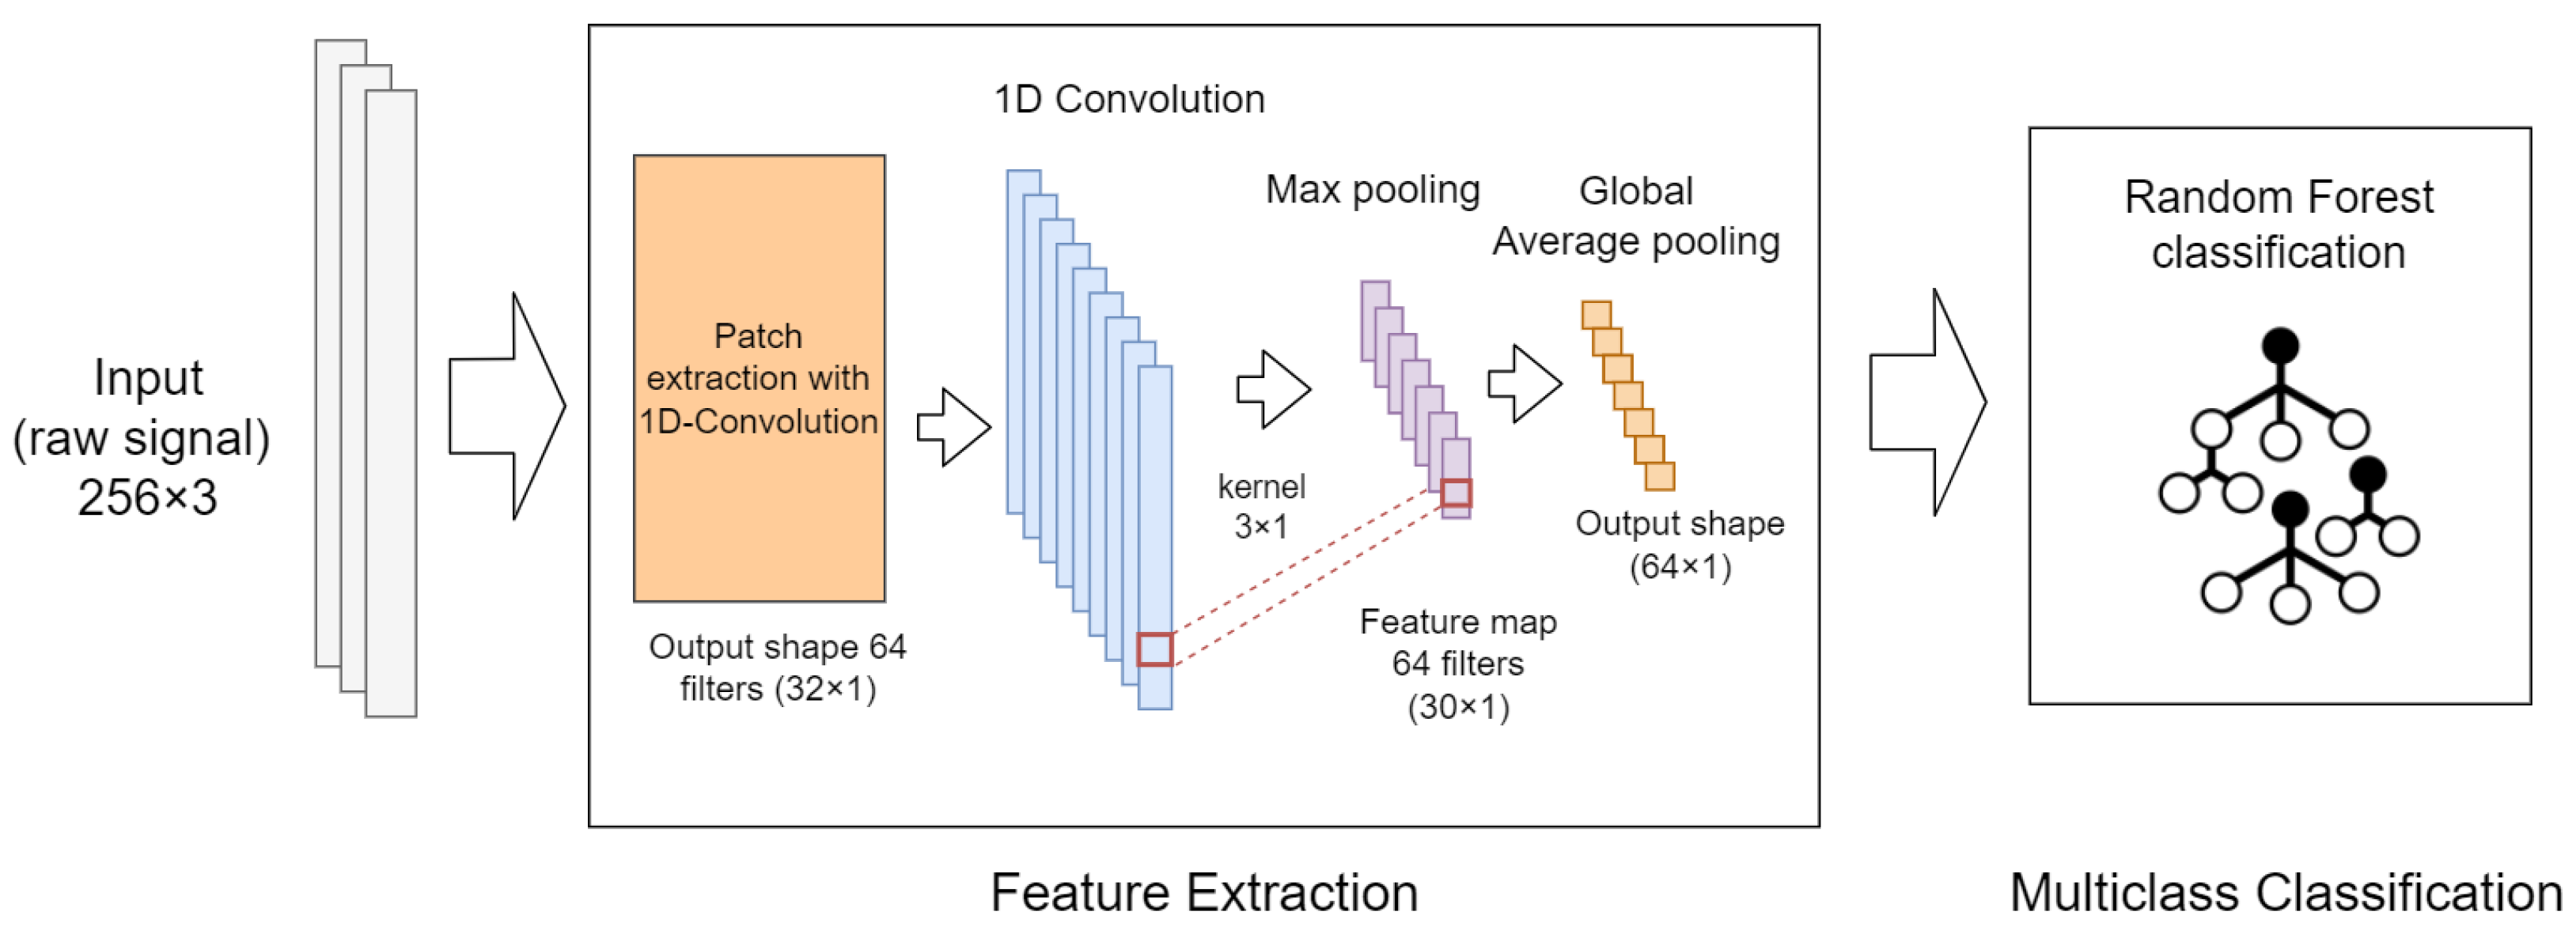
  • This work also introduces the use of convolutional neural networks (CNN) with patch input (implemented with 1D-convolutional layers) for automatic temporal window contextualization. The patch input strategy is proposed as a mechanism to automatically split and project the data of a single (multi-channel) sliding window into another dimension that can be exploited by classification algorithms. Additionally, the proposed approach is evaluated using an end-to-end neural network, and in combination with a Random Forest (RF) classifier located at the top of the neural network.
  • Finally, a methodology for the aggregation of a set of predictions (severity ratings) obtained from the classifiers during a single clinical visit is proposed and evaluated. This methodology is carried out with the aim of improving the outcomes of the bradykinesia assessment by providing a single severity indicator of the motor function of the upper limbs.
The rest of this paper is organized as follows: An overview of the research studies focusing on bradykinesia detection using wearable sensors is provided in Section 2. Section 3 describes the data set used in this study, the implemented signal processing and ML methods, and the performance evaluation procedure. Results are reported in Section 4 and discussed in Section 5, together with conclusions.

2. Related Work

The quantification of bradykinesia using wearable technologies has been widely explored in the last several decades. Besides commercial solutions, such as Kinesia® (Great Lakes NeuroTechnologies Inc., Cleveland, OH, USA) [27] and PKG® (Global Kinetics Pty Ltd., Melbourne, Australia) [28], several research studies focused on the detection of bradykinesia by characterizing the movement of patients. In [29], 50 PD patients were monitored to quantify bradykinesia and hypokinesia. Two accelerometers on the wrist were used for data collection, obtaining sensitivities of 60–71% and specificities of 66–76%. In [30], seven gyroscopes and two accelerometers were placed on the forearms, shins, and trunk for diagnosing the presence or absence of bradykinesia, tremor, body posture, and gait parameters, obtaining a Pearson correlation coefficient r of 0.71 with the UPDRS scale. In [31], a combination of a flexible sensor placed on the hand (triaxial accelerometer and gyroscope) and a consumer smartwatch (triaxial accelerometer) was employed to monitor 13 PD subjects. By using an RF algorithm, the authors achieved an AUC of 0.65 in a multiclass classification (MDS-UPDRS). In [32], an inertial measurement unit (IMU) wristband with an accelerometer was used to monitor 31 PD patients and 50 healthy controls. The authors proposed a methodology to extract bradykinesia digital biomarkers, providing a strong correlation (Pearson r = 0.67) between hand motion measurements and the MDS-UPDRS scoring.
The leg agility task (MDS-UPDRS item 3.8) was addressed in different studies for the quantification of bradykinesia. In [33,34], 34 and 24 subjects were enrolled, respectively. Three IMUs were mounted on the patient’s chest and each thigh. Time- and frequency-domain features were extracted and selected to feed classification algorithms, i.e., Support Vector Machine (SVM) and k-Nearest Neighbors (kNN). Bradykinesia severity (UPDRS score) was estimated with an accuracy of 43% in both studies. In [35], 19 subjects with PD were monitored with ankle-mounted IMUs for leg agility evaluation and treatment response. Time- and frequency-domain features were computed to feed different classifiers, i.e., SVM, Decision Tree, and Logistic Regression. Pearson correlation with the UPDRS bradykinesia score was found to be r = 0.83. Finally, in [17], smartphones’ sensors and ML were used to detect bradykinesia using leg agility exercises, achieving an accuracy of 77.7% in a multi-class classification using the UPDRS scale.
In recent years, the research community has explored the use of DL techniques for the automatic analysis of motor symptoms. DL methods make it possible to process the recorded inertial signals without the need for additional processing techniques, reducing the effort in the design and selection of discriminative feature sets [36]. However, despite the advantages of technology in PD, the application of these techniques requires a high amount of quality data and high computational processing power [37].
Relevant works using DL methods and wearable technology to assess bradykinesia have been proposed in [38,39], where CNN and sensors placed on the upper limbs have been employed. The results of these works indicate that they can outperform (shallow) ML approaches achieving an accuracy of 90.9% [38], and an AUC of 0.926 [39]. In [40], 30 PD patients were monitored during different activities using a single accelerometer on the wrist. CNN was used to process raw data and predict bradykinesia severity, achieving an accuracy of 0.67, sensitivity of 0.65, and specificity of 0.89. In [41], six flexible wearable sensors were used for recording data from 20 individuals with PD throughout multiple clinical assessments. Raw inertial data were input to a CNN algorithm, providing an AUC of 0.77.

3. Materials and Methods

In this section, the methodology developed to obtain different bradykinesia detection methods is described. Section 3.1 describes the data used in this study, including information regarding subjects’ characteristics, experimental procedures, and clinical assessment of bradykinesia. The preprocessing procedures, including filtering, feature extraction, data transformation, and data augmentation, are reported in Section 3.2. Section 3.3 describes the ML and DL classification algorithms employed in the present work, together with their implementation details. Finally, details regarding the performance evaluation methods are provided in Section 3.5.

3.1. Bradykinesia Dataset

The dataset employed in this study was collected using the Monipar application [42]. Monipar proposes a system based on wearable technology and artificial intelligence (AI) for monitoring motor activity in PD. The system consists of a mobile app that guides the user in performing 8 exercises of the MDS-UPDRS scale and a wearable module that records the subject’s movement using the triaxial accelerometer and gyroscope embedded in a consumer smartwatch. Specifically, tasks consisted of a series of 8 exercises belonging to the MDS-UPDRS scale part III, concerning the examination of the motor aspects [16]. The selected exercises include rest tremor amplitude, postural tremor of the hands, movement of the hands to the chest, finger tapping, hand movements, pronation–supination movements of the hands, arising from a chair, and gait. The duration of the entire procedure is approximately 7 min.

3.1.1. Data Acquisition

Data were recorded from 6 subjects (3 females and 3 males, 64.2 ± 8.2 years) diagnosed with PD in the early stages of the disease, according to the Hoehn and Yarn scale [43] (H&Y = 1 in all subjects) and from 7 healthy control subjects (4 females and 3 males, 64.0 ± 5.4 years). The data collection process was carried out for 8 and 9 weeks, respectively, using the Monipar application. Each week, subjects performed the pre-defined motor tasks in a controlled environment. A total of 105 weekly sessions were collected during the experimentation (46 sessions for PD; 59 sessions for healthy controls). These data correspond to more than 13 h of movement data collected with a triaxial accelerometer and a triaxial gyroscope. However, only relevant data related to the movement of the upper limbs, i.e., that recorded during finger tapping, hand movement, and pronation–supination movement of the hands, were analyzed in this study. The data from the three hand exercises correspond to 80 min (10% of the entire data set) of movement data collected by each of the inertial sensors.
The smartwatch employed for data collection was available on the market in 2019. This device employs Android Wear operating system and an internal memory of 4 GB (2 GB of free space). The device has a calibrated triaxial accelerometer with a maximum amplitude set to ±2 g, and triaxial gyroscope with a measurement range set to ±2000 dps.
The smartwatch was placed on the wrist of the most affected side, according to the clinical indication of the physician attending to the patient and the dominant hand of healthy controls. Data were recorded using the accelerometer and gyroscope embedded in the smartwatch, with a sampling frequency of 50 Hz. Such a frequency is appropriate for human motion analysis, as the frequency content generated by common human movements lies in the 0–20 Hz band [44]. Figure 1 summarizes the data collection process carried out using the Monipar app.

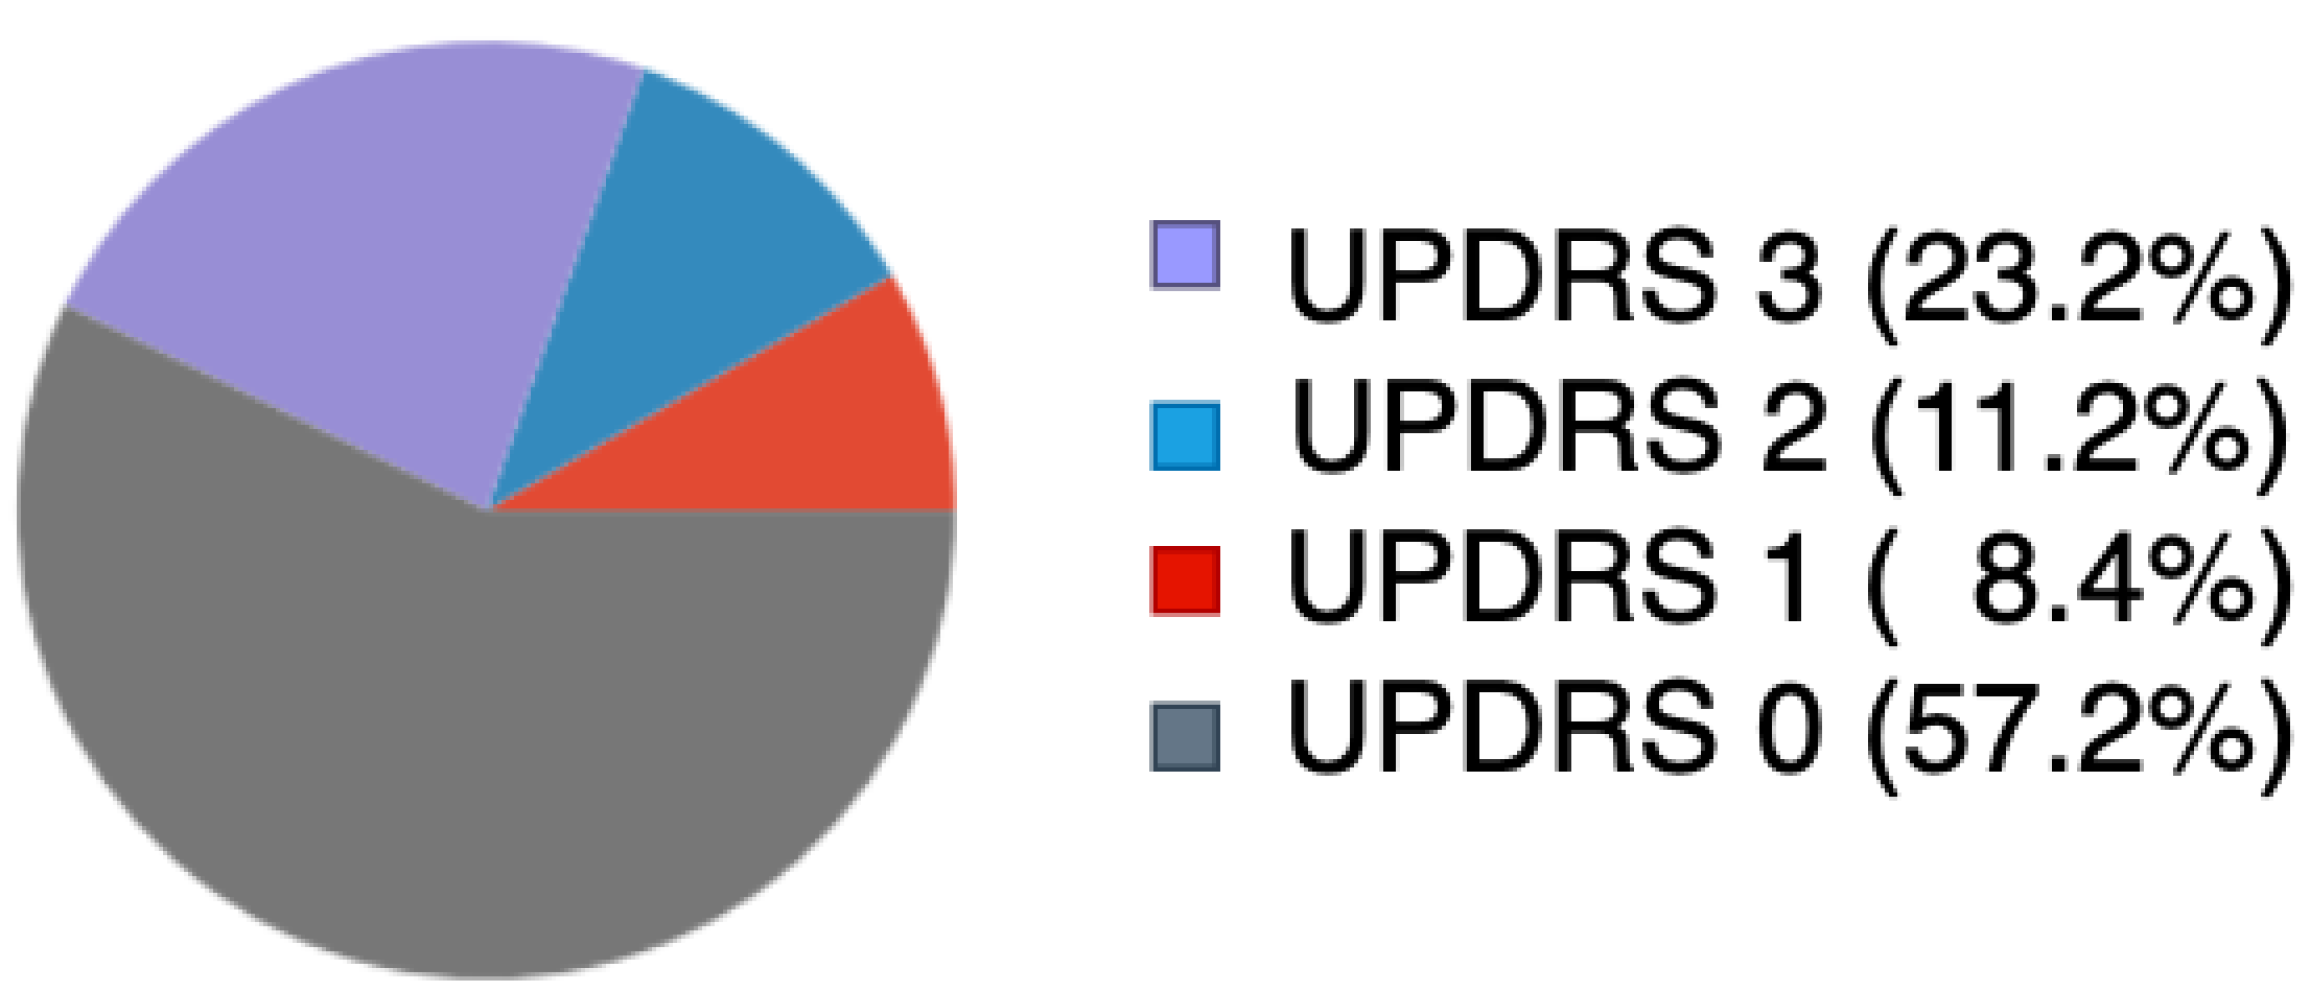
3.1.2. Data Labeling

Training supervised ML and DL methods to automatically detect motor symptoms requires data to be labeled by expert clinicians, who recognize symptoms and evaluate their severity. The labeling of the Monipar data was performed by a trained expert neurologist, who reviewed the videos of the weekly trials performed by the subjects. For each motor task, the clinician identified the presence of bradykinesia and evaluated its severity. According to the MDS-UPDRS guidelines, a score between 0 (no bradykinesia) and 4 (severe bradykinesia) was assigned to each task. To assign a single severity value to the data of each weekly assessment, the sub-scores of the three upper limbs exercises were averaged and rounded, and finally used as the reference metric. The distribution of the severity of bradykinesia in the group of PD patients and control subjects is reported in Figure 2. It can be observed that the recorded bradykinesia severity corresponds to four UPDRS ratings, including normal (0), slight (1), mild (2), and moderate (3). As evident from Figure 2, the data distribution is unbalanced, with more than 57% of the data corresponding to the UPDRS 0 severity (no bradykinesia). Moreover, movements belonging to the class UPDRS 4 (severe bradykinesia) are not represented. This is likely due to the intrinsic composition of the PD sample, which encompasses patients in the early stages of the disease.

3.2. Signal Preprocessing

In order to prepare data for the subsequent classification step, some preprocessing procedures were performed. First, data were filtered and segmented (Section 3.2.1); then, different data transformation methods were applied (Section 3.2.2) to provide the input for ML and DL algorithms; finally, data augmentation was exploited to increase the data set size and provide a more balanced distribution of data (Section 3.2.3).

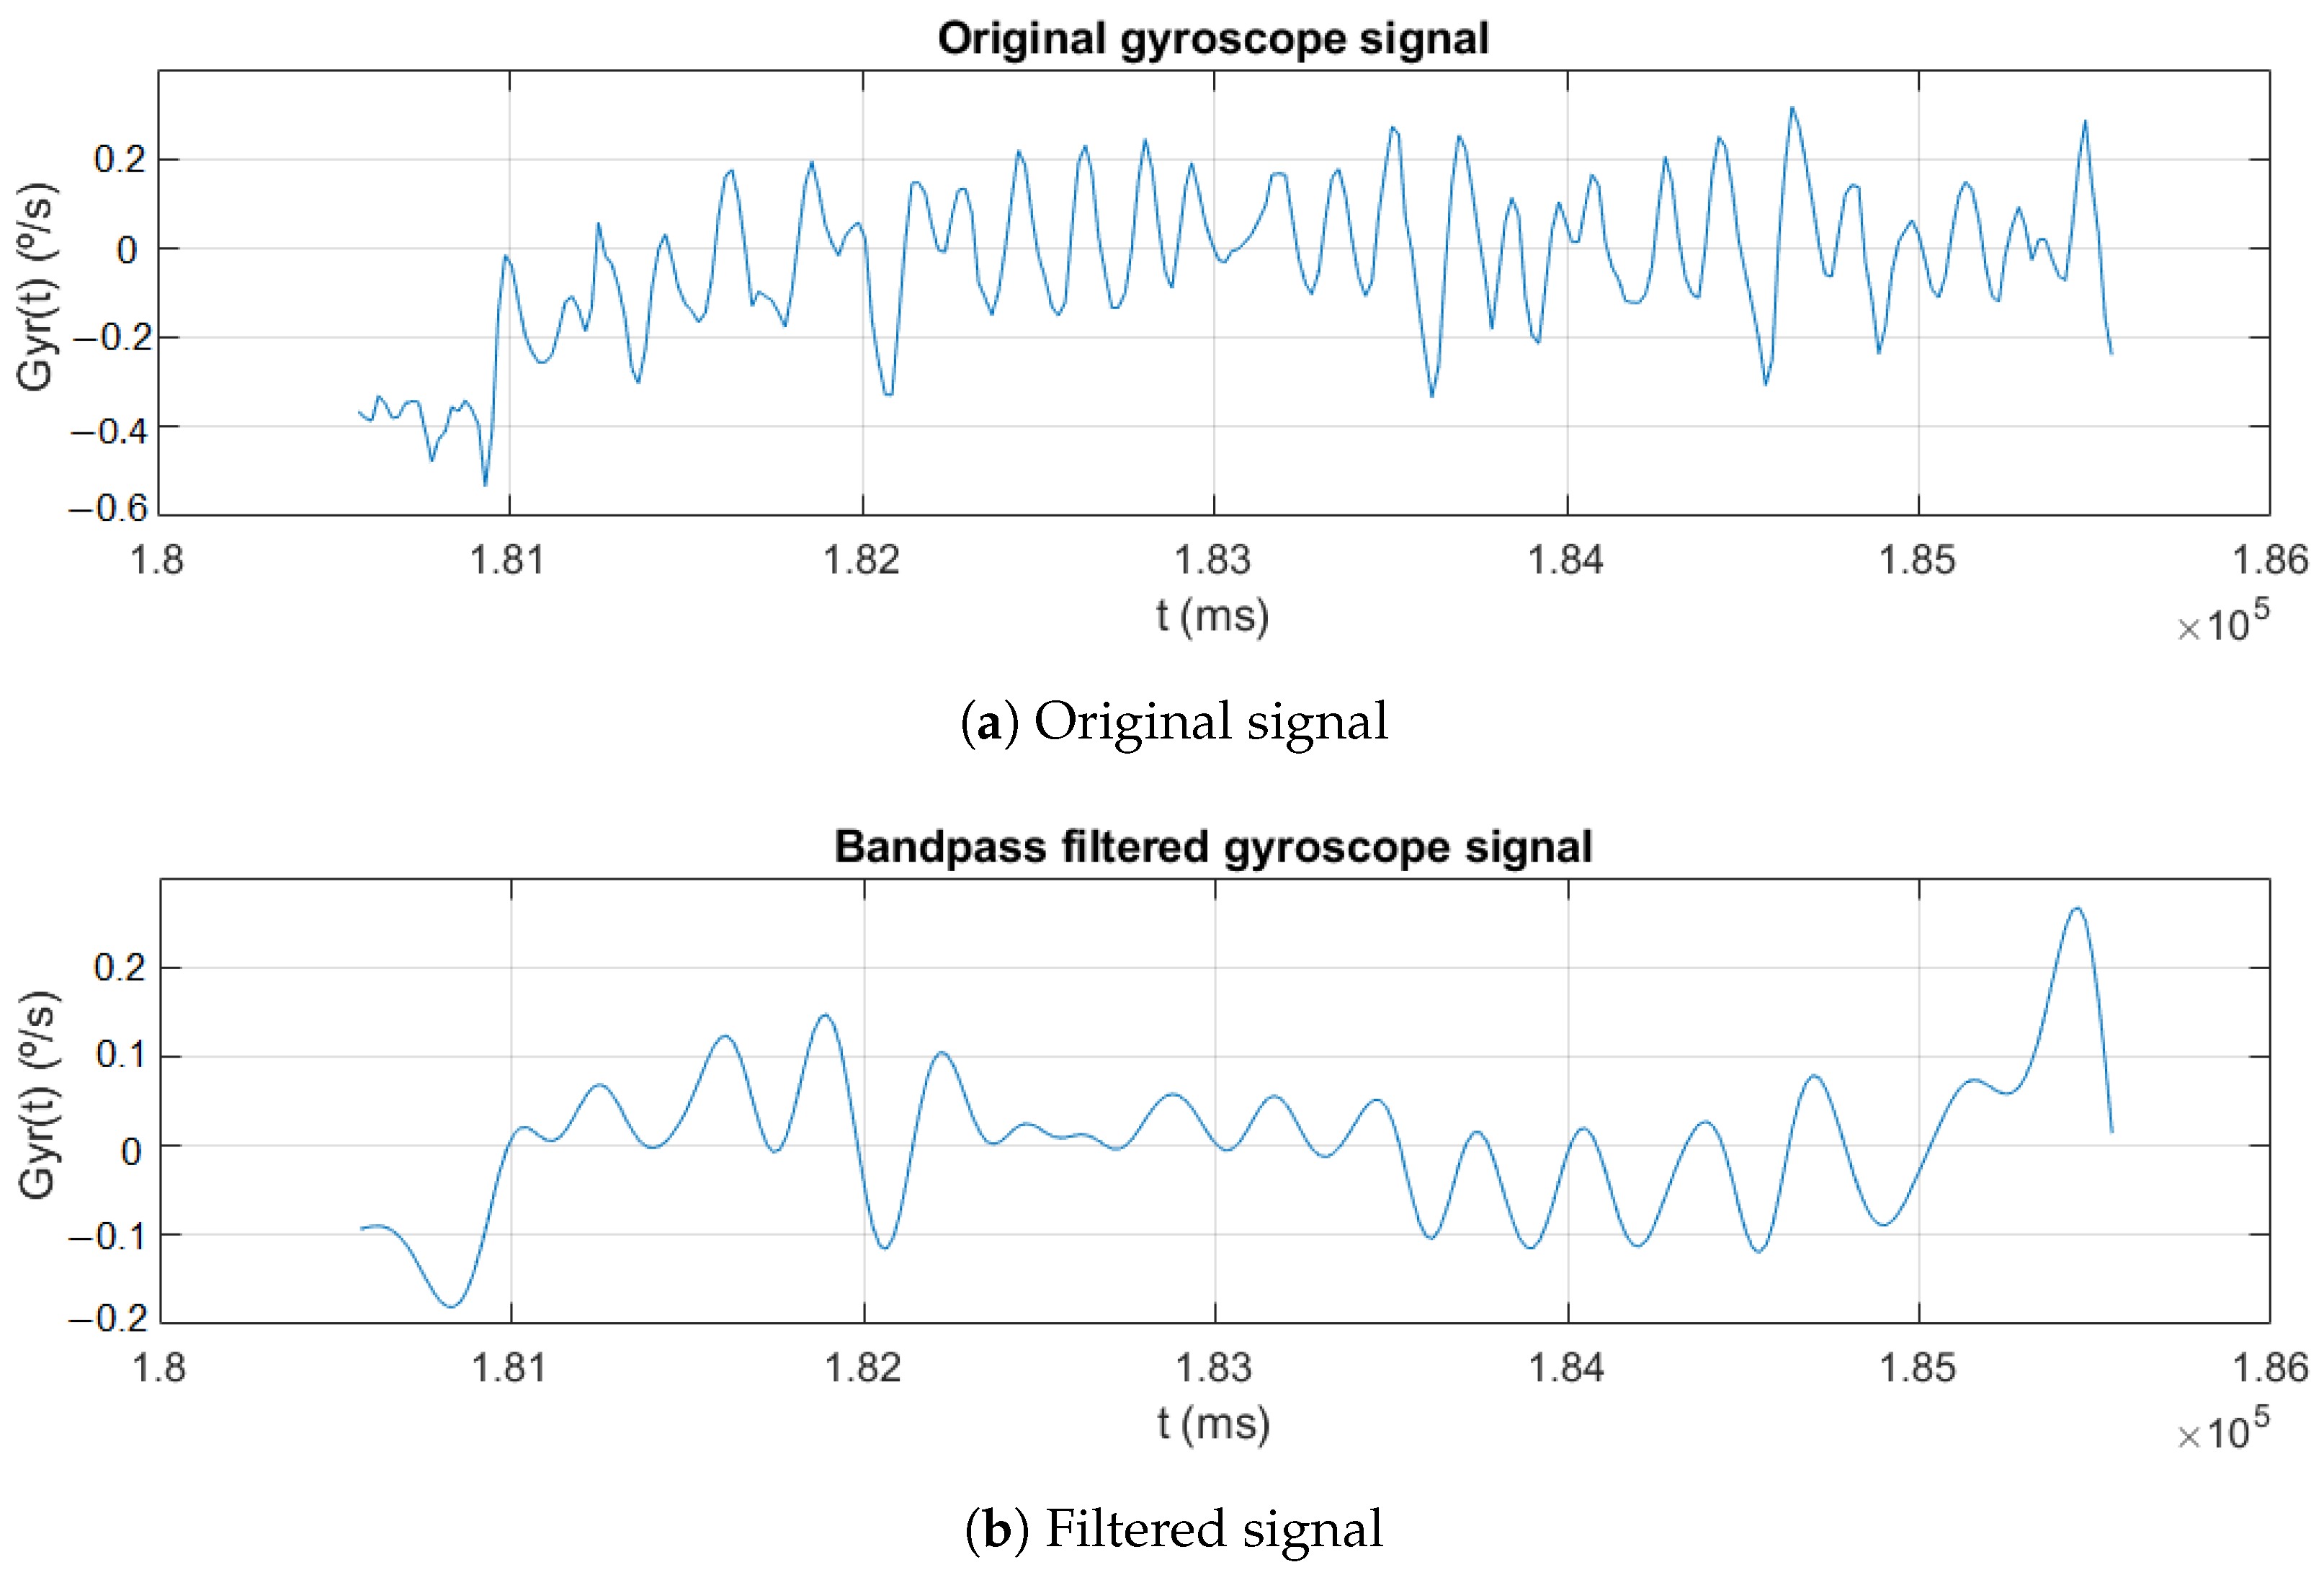
3.2.1. Filtering and Segmentation

The low-frequency components of the sensor readings are related to postural changes (gross movements), while the high-frequency components reflect the actual accelerations of the body segments, associated with rapid movements [45]. To remove the gravity effect and the noise produced by trembling or shaking, inertial data were filtered using a fourth-order zero-lag Butterworth band-pass infinite impulse response (IIR) digital filter, with cut-off frequencies of 0.25 Hz and 3.5 Hz. The advantage of the Butterworth-type filter is that it allows a nearly constant gain in the passband. Then, inertial signals were segmented using non-overlapping sliding windows of 5.12 s (i.e., 256 samples). Figure 3 shows a segment of the raw gyroscope signal (Figure 3a) and the corresponding filtered signal (Figure 3b).

3.2.2. Feature Extraction

Classic ML models such as RF require features to be extracted from recorded signals. Two feature sets proposed in the reference literature were reproduced in this study, belonging to both the time and frequency domains. This was carried out to establish a reference model for comparison with the proposed methods. The two sets of features [31,46] include a total number of 74 and 43 features, respectively.
As far as the input data for DL models are concerned, two different data representations were employed. The first consists of using the inertial readings, normalized in the range from −1 to 1. The second was created as follows. Every single window obtained from the segmentation process was divided into two consecutive windows of 2.56 s (i.e., 128 samples). Then, the signals’ fast Fourier transform (FFT) was computed for both windows and used as an input feature set. This feature extraction method is based on contextual windows and will be referred to in the rest of the paper as Contextual FFT. The contextualization of adjacent FFT windows is based on methods proposed in the reference literature to improve the performance in FOG detection using accelerometers [47,48,49].
A summary of the feature set employed in this study is shown in Table 1.

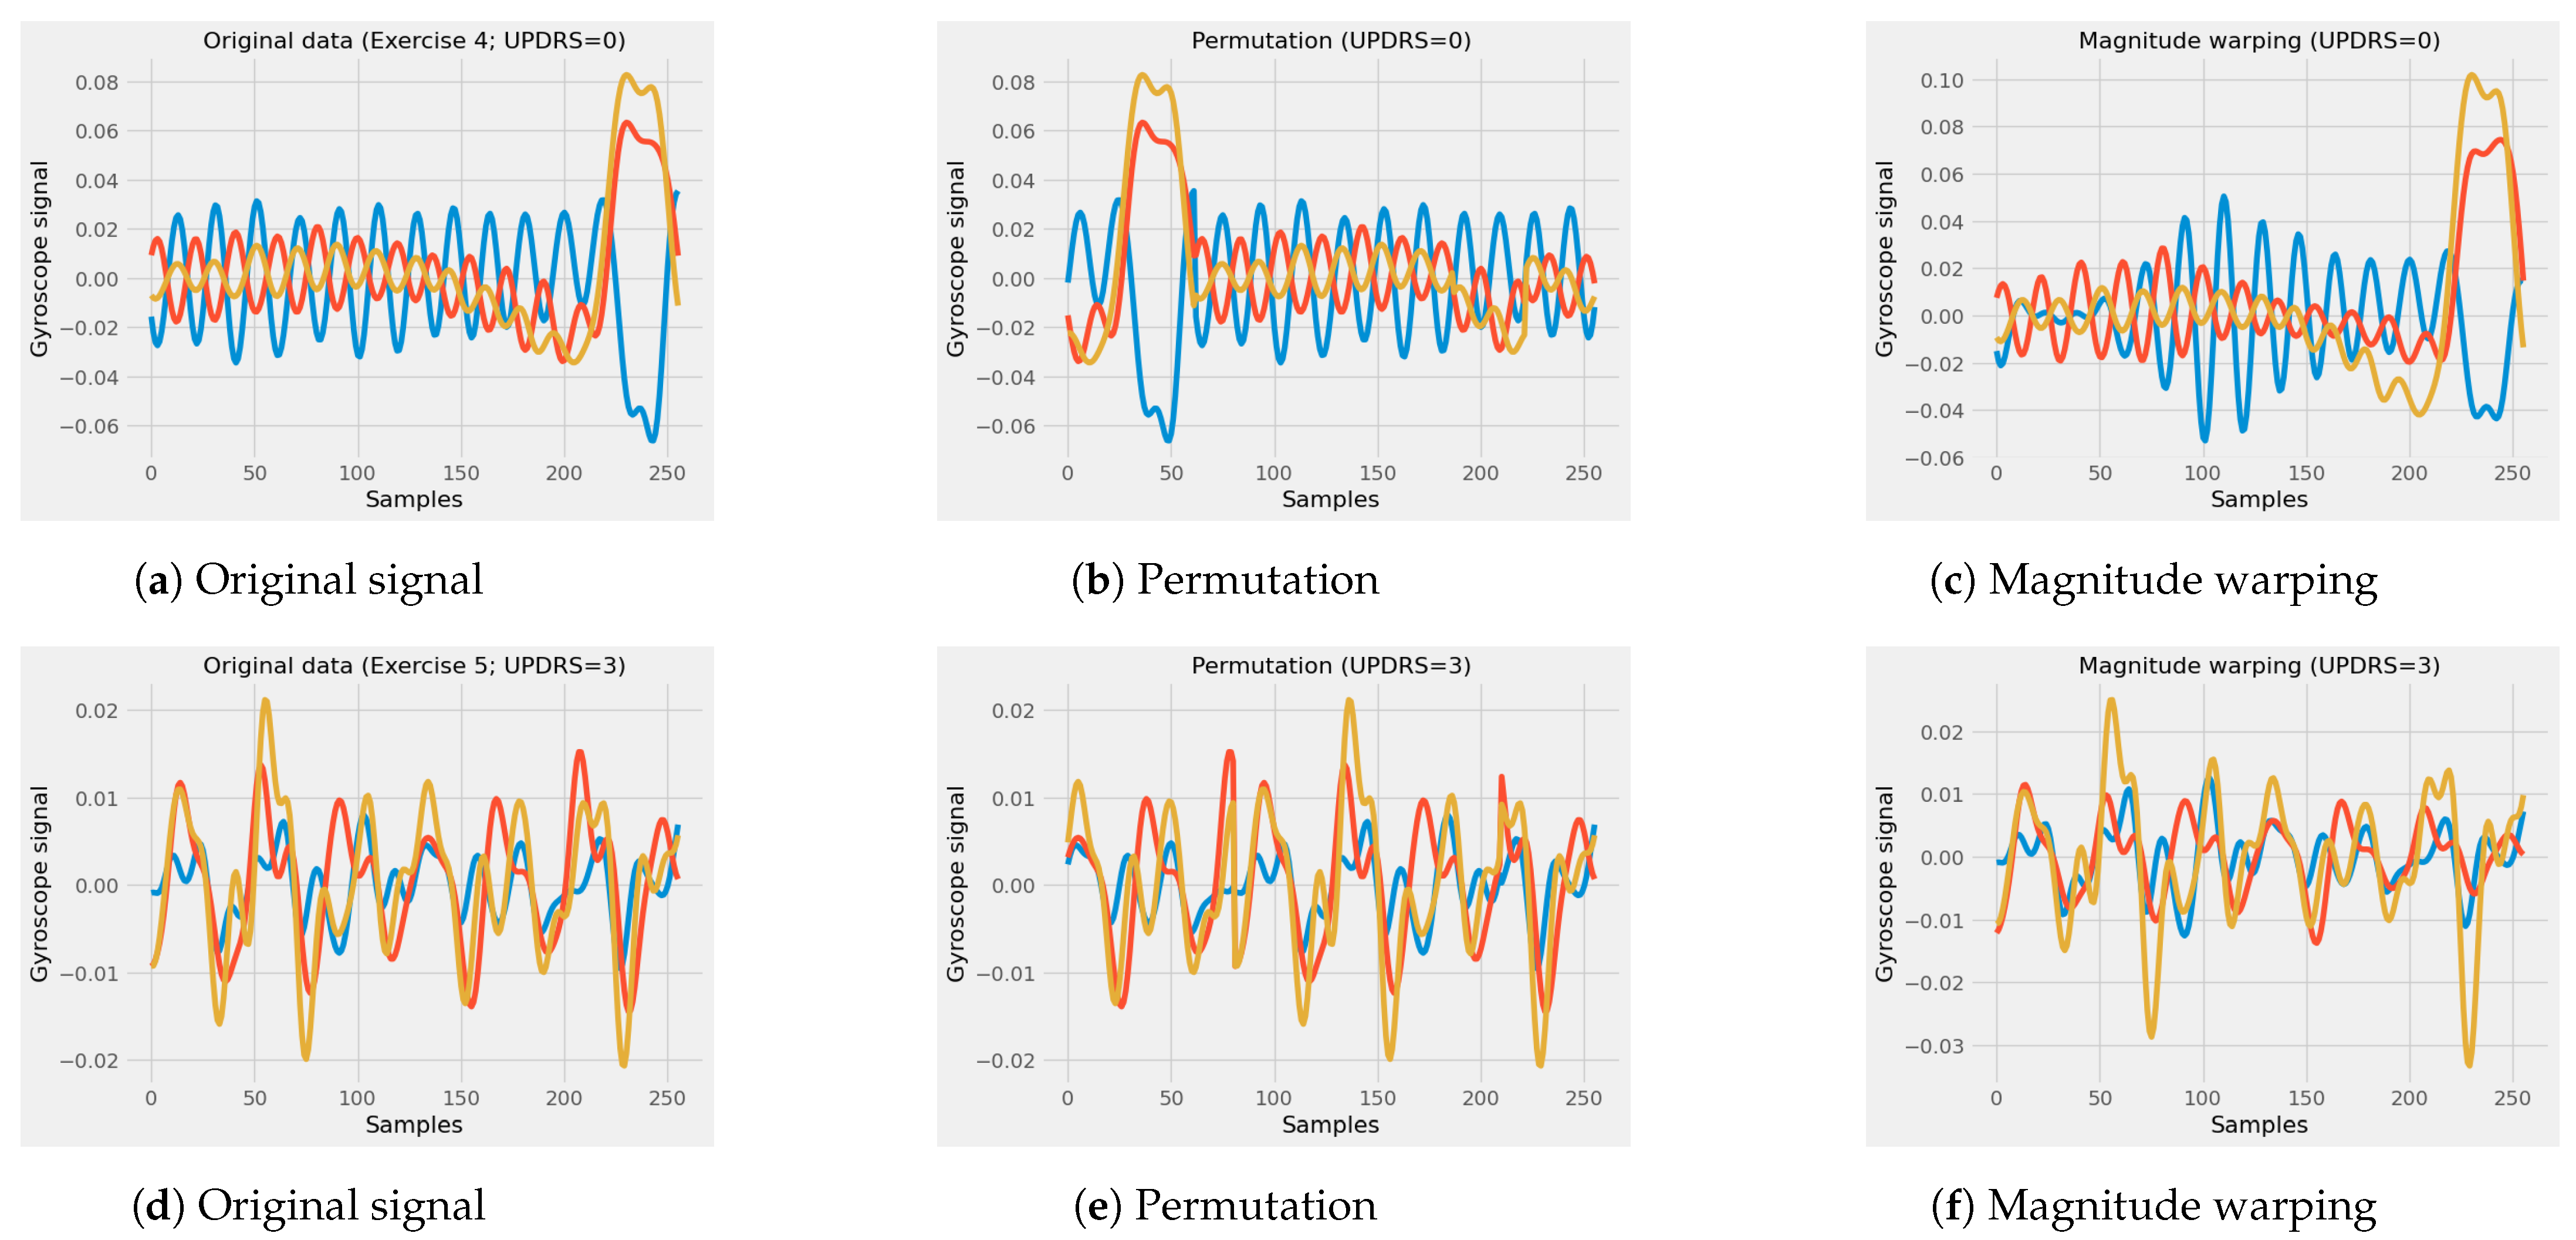
3.2.3. Data Augmentation

The synthetic minority over-sampling technique (SMOTE) [50] was used to balance the data input to classic ML classifiers. Specifically, the classes with a minority number of sliding windows (i.e., UPDRS 1 = 768; UPDRS 2 = 1027; UPDRS 3 = 2132) were resampled to provide the same number of sliding windows as the majority class (UPDRS 0 = 5253). The number of nearest neighbors used to construct the synthetic samples was set to 5. This procedure produced an increase in the dataset size of 53%.
As far as the raw signals input to convolutional models are concerned, the application of signal permutation and magnitude warping [51] were employed to quadruple the amount of data. In the former case, the input data were sliced into four equal-length segments, and these segments were randomly permuted to create a new sliding window. As for the latter method, convolution between the input data and a smooth (randomly generated) curve was performed to change the magnitude of the samples of the sliding window.
All the described data augmentation techniques were applied only to the training subsets, while the testing subset remained unchanged. Figure 4 shows examples of the original data and the data augmentation techniques applied to the gyroscope signals. As shown in Figure 4b,e, portions of the signal were randomly permuted from the original signals (see Figure 4a,d), while, in Figure 4c,f, the amplitude of the original signals was modified by a randomly generated (smooth) curve.

3.3. Classification Algorithms

Different algorithms were implemented to predict the bradykinesia severity in PD patients and control subjects, resulting in a multi-class classification task. The output of the implemented models is a value between 0 and 3, according to the clinical bradykinesia score provided by the MDS-UPDRS scale.
For comparison proposes, two detection methods have been reproduced and evaluated to generate baseline metrics. The reproduced methods were the feature sets proposed in Shawen et al. [31] and Channa et al. [46]; these feature sets fed an RF classification model with 100 estimators, as proposed in [31]. Additional parameters of the RF classification algorithm were a minimum sample split equal to 2, a minimum sample leaf equal to 1, and the split criterion was Gini impurity [52].
The following DL algorithms were trained either using raw inertial signals or using the Contextual FFT data representation, as previously described in Section 3.2.2.
CNN. It consists of an input layer (256 features and 3 channels), connected to three one-dimensional convolutional layers of (1D-CNN), all three with 64 filters of size equal to 8 and rectified linear unit (ReLU) activation functions. Then, a global average pooling (GAP) layer was connected. For classification tasks, a multi-layer-perceptron (MLP) block composed of a densely connected layer with 260 units and ReLU activation was densely connected to a softmax layer with 4 units, corresponding to the number of output classes (i.e., bradykinesia severity score from 0 to 3).
Contextual CNN. The features extracted by the contextual windows method were evaluated. In this case, the architecture of the CNN used is composed of an input layer (256 features and 3 channels), connected to three 1D-CNN, the first one with 64 filters of size 8 and the next two with 20 filters of size 8, all of them with ReLU activation function. A GAP layer was then connected. For the classification tasks, an MLP block composed of a densely connected layer with 180 units and a ReLU activation function was connected to the classification layer, made of 4 units with a softmax activation function.
CNN (PI). As a novel approach, a CNN with patch input (PI) was proposed and evaluated. The patch extraction was implemented using a 1D-CNN. For this task, the kernel and stride parameters were set with the same value. In this way, the convolutional layers can act as an automatic patch extractor and bring equivalent results to patching extraction strategies such as those employed in Transformer-based models and isotropic computer-vision models [53,54], in which images are divided into non-overlapping square patches in raster-scan order. The proposed patching input strategy adapted to process multi-channel signals is shown in Figure 5.
The training and evaluation of this latter model were performed using the filtered inertial signals. The architecture consists of an input layer implementing the PI strategy using 64 filters with kernel size and stride equal to 8 (in both cases). The input layer was connected to one 1D convolutional layer with 64 filters, a kernel size of 3, and a ReLU activation function. Then, a max pooling layer with a pool size of 2 and a subsequent GAP layer were connected. For the classification tasks, the MLP block included two densely connected layers, with 100 and 50 units, respectively, both with ReLU activation functions. Finally, these layers were connected to the final classification with 4 units and a softmax activation function. The architecture for the DNN with convolutional layers and PI is shown in Figure 6.
CNN (PI) + RF. The combination of CNN with PI and RF classification algorithm was evaluated. In this approach, the convolutional (with path input) block acts as a feature extractor, while the RF model (with 100 estimators) performs the classification tasks. While the CNN block allows the automatic extraction of features from the raw signal, the RF classifier takes advantage of a large number of individual decision trees that operate as an ensemble, providing good performance and high generalization capabilities.
In this classification algorithm, the parameters of the CNN block are similar to those used in the CNN architecture with path input (see Figure 6). The classification algorithm that combines convolutional layers with PI and RF is shown in Figure 7.
For the training of the DL algorithms, it was necessary to perform an initial hyperparameter tuning process. This adjustment was performed with the hyperband method [55], during which the learning rate, the number of filters, and the number of densely connected neurons were adjusted. A batch size of 64, a maximum number of epochs equal to 200, and a cross-entropy loss function were used in all cases to solve the multi-class classification problems. Moreover, an early stopping strategy was included, consisting of stopping the training process when the performance stops improving on the validation data set. The ADAM [56] backpropagation method was employed for optimizing the models’ parameters. The learning rate was set to 2.3 × 10 3 for all DL architectures except for the Contextual CNN, where 5.9 × 10 3 was used.

3.4. Session-Based Analysis

For further evaluation, a session-based analysis was performed using the best approach for bradykinesia severity rating. Since the output of the classification algorithms is a specific class (UPDRS 0 to 3) for each single sliding window (hereinafter referred to as window-level detection), the aggregation of the predicted windows from a single (weekly) session was performed using statistical methods.
The aggregation of data from the three exercises was performed by calculating the 95th percentile value of the corresponding window-level predictions. This was accomplished to mimic the clinical assessment, which is based on the worst severity rating (i.e., maximum MDS-UPDRS rating) observed by the examiner during the assessment period. In addition, the 95th percentile was selected in agreement with the methodology proposed in [32] to derive bradykinesia digital biomarkers from hand movements using wrist-worn sensors. Finally, the predicted outcomes of a single session were compared with the reference metric (average of the MDS-UPDRS sub-scores) described in Section 3.1.2.

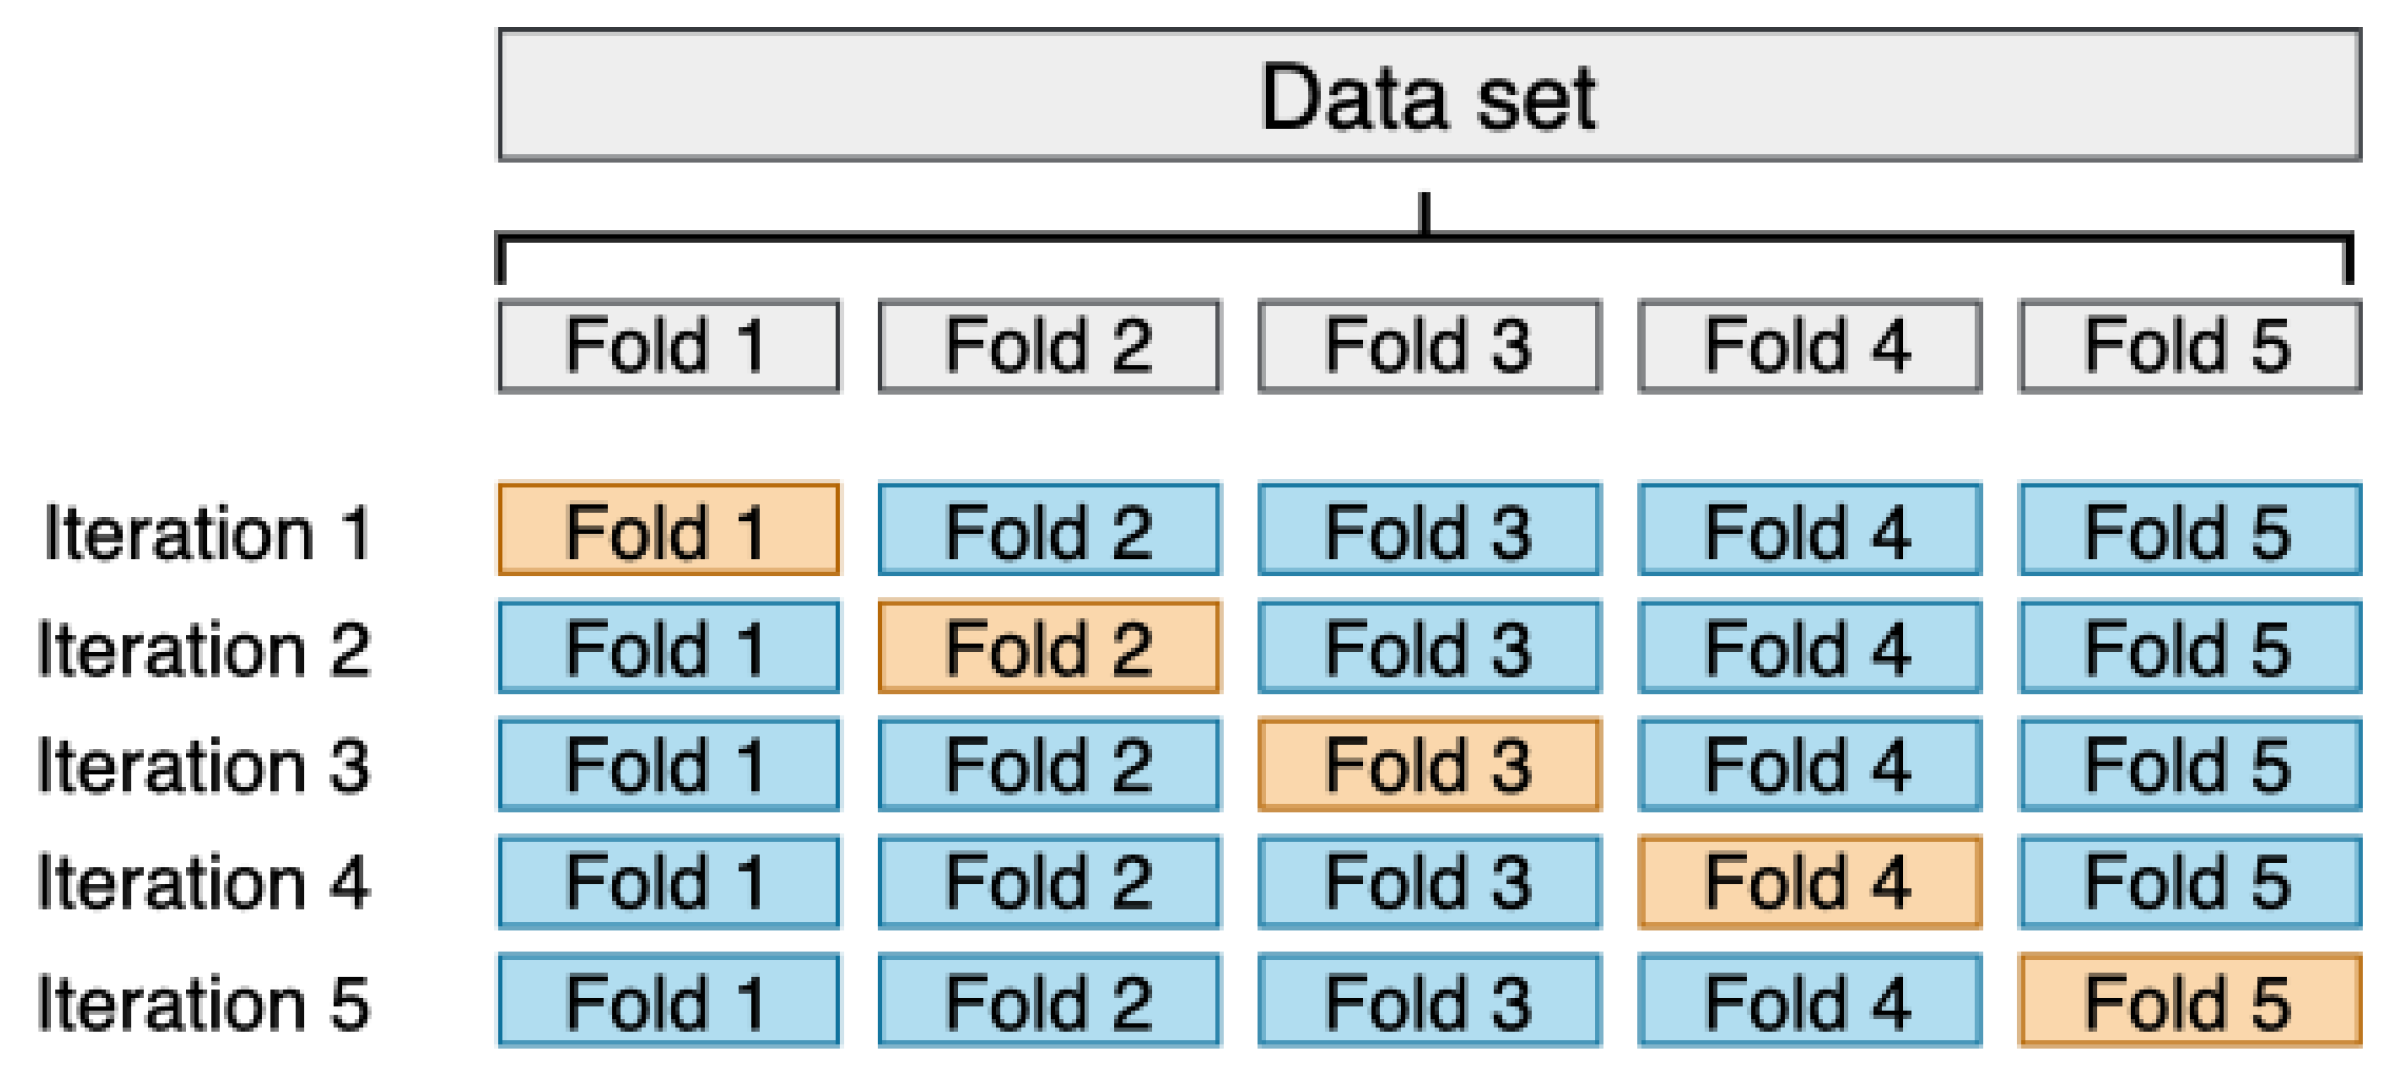
3.5. Evaluation Methodology

Stratified k-fold cross-validation (CV) with a k value equal to 5 (5-fold CV) was used to evaluate the performance of the algorithmic approaches. First, all the observations (sliding windows) of the data set were randomly shuffled; then, data were divided into 5 equal parts (folds) while preserving the percentage of samples for each class, as shown in Figure 8. At each interaction, ML and DL models were trained using four folds and tested on the final fold. The procedure was repeated 5 times, corresponding to the number of folds. Sliding windows of 256 samples with no overlap were used to avoid training and evaluation subsets sharing signal segments when using the 5-fold CV methodology. This validation approach was used to overcome the limited amount of bradykinesia data for each patient. Additionally, the performance metrics used to evaluate the bradykinesia detection models included accuracy, precision, recall, F1-score, area under the curve (AUC), Pearson r and root-mean-square error (RMSE) [57].

4. Experiments and Results

This section reports the results obtained in the present study. Several experiments were performed to evaluate the proposed approaches, to identify the combination of sensors (or combination of sensors), signal processing, input type, and DL algorithms that provide the best performance.
Section 4.1 reports the results of the RF classification model, fed with either accelerometer or gyroscope recordings, and using their combination. The experiments were performed using the two different feature sets proposed in the literature [31,46]. The results of the different DL approaches are reported in Section 4.2, evaluating the effect of different input types (raw data or FFT), data augmentation [50,51], and DL architectures. Finally, the results of the session-based analysis are reported in Section 4.3.

4.1. Baseline

Table 2 reports the performance of the RF classification model. The effect of different feature sets, sensors, and sensor combinations are evaluated. First, the feature set proposed by Channa et al. [46] provided better results than that used by [31], despite the smaller number of features extracted. This is reflected in all performance metrics for all types of sensor data. Specifically, the best performance in bradykinesia detection was obtained using features [46] extracted from the gyroscope recordings, achieving an AUC value up to 0.909 and a corresponding accuracy of 0.783. Moreover, from Table 2, it can be observed that the combination of accelerometer and gyroscope does not provide better performance than that obtained by using only the gyroscope data. This suggests that is possible to implement robust bradykinesia detection systems using a single inertial sensor.
In this study, the reproduction of Shawen et al. features [31] in conjunction with an RF algorithm achieved better performance than that reported by the authors (0.65 AUC) by using the gyroscope data. This behavior is expected because, in the work of Shawen et al. [31], the data employed corresponds to a set of activities of daily living (ADLs) in addition to the clinical assessment tasks (i.e., finger-to-nose).
Moreover, according to Table 2, the reproduction of both approaches [31,46] using the gyroscope data presents competitive results. These results are in line with the ones reported in similar studies, where an AUC of 0.926 [39] and accuracy up to 0.909 [38] were achieved.
Based on these results, the subsequent experiments were performed using only the gyroscope data. In addition, the feature set proposed by Channa et al. [46] in conjunction with an RF classifier with 100 estimators was selected as a baseline.

4.2. Classification Methods

In this section, the performance of six algorithmic approaches is reported and compared—specifically, the baseline model identified in the first experiment; the baseline model fed with data augmented using the SMOTE algorithm; the CNN model trained with the filtered inertial signals; the CNN model trained with the contextual FFT windows; the CNN model with the proposed PI and data augmentation; and, finally, the convolutional model (with PI) combined with the RF classification model.
In more detail, for the first approach, the performance metrics of the baseline model (hand-crafted features with an RF classification algorithm) were reported without additional processing. Second, to improve the predictive power of the first method, the SMOTE technique was employed to increment the data used to train the algorithm. Third, for comparison purposes, the performance of a (standard) CNN trained with a raw signal was evaluated. This approach was selected to take advantage of the capability of the CNNs to handle raw signals. Fourth, in an attempt to improve the CNN’s results, the performance of a similar (three-layer) CNN was evaluated in conjunction with features extracted by the contextual windows method. Fifth, the CNN with PI and MLP (see Figure 6) was evaluated in conjunction with the data augmentation techniques (permutation and magnitude warping). This method was proposed as an end-to-end solution for the detection of bradykinesia which does not require feature extraction. In addition, sixth, to improve the predictive power of the CNN with PI, the classification block at the top of the network was changed to an RF classification algorithm (see Figure 7). RF classifiers can provide good performance and high generalization capabilities even when handling unbalanced data [58], in this case, by using the features extracted by the CNN block. This latter approach was trained similarly to the fifth approach to facilitate the comparison of results.
The performance of these models is reported in Table 3. The best results for each metric are bold in Table 3.
According to the results reported in Table 3, the best accuracy (0.835) in bradykinesia detection was obtained employing the combination of CNN with path input and RF classification algorithm, while the best performance in terms of AUC (0.939) was achieved using the approach consisting of a CNN with path input and an MLP block for classification.
Data augmentation methods led to an improvement in performance for all the classification tasks. As for the baseline model, the effect of data augmentation was a slight increase in accuracy and AUC, and a decrease in recall and precision, which is reflected in the F1-score. When data augmentation techniques (SMOTE, signal permutation, and magnitude warping) were applied to DL algorithms, a significant performance improvement was observed. Specifically, accuracy, F1-score, and AUC improved by 15%, 12%, and 25%, respectively. The use of contextual FFT windows did not provide incremental performance regarding the use of raw inertial signals, probably due to the limited amount of data used during training. Finally, using CNNs combined with the RF model, instead of the classic MLP approach, led to an increase of 0.9% in accuracy and 0.8% in Fscore, while AUC decreased from 0.943 to 0.939. However, such small differences can not be considered significant.
On the one hand, the comparison of the results with most of the related literature work is difficult because of the diversity of approaches and validation methodologies. However, when comparing the performance of the best classification methods (CNN with PI) with the best results reported in similar studies (i.e., 0.926 [39]), slightly superior results in terms of AUC (0.939) were achieved. However, in terms of accuracy, higher performance than that achieved in this work (83.5%) was reported (i.e., 90.9% [38]). On the other hand, a direct comparison of the best-proposed method with the (reproduced) baseline shows a significant increment in accuracy (5.2%) and AUC (3%). This presents competitive results for bradykinesia severity rating using a single gyroscope sensor and opens opportunities for the development of unobtrusive solutions for monitoring based on consumer devices.

4.3. Results of the Session-Based Analysis

The results of the session-based analysis were obtained using the best-proposed method (CNN with PI and RF classification). For this task, the window-level predictions of each clinical visit were processed according to the methodology described in Section 3.4. After this process, the session-based results were compared with the reference evaluation obtained from MDS-UPDRS sub-scores during the clinical assessment (see Section 3.1.2).
In addition, to compare the results of the session-based analysis with the window-level evaluation, regression metrics were calculated using the proposed methods. The results of both assessment methods are shown in Table 4.
According to Table 4, the aggregation of the window-level predictions presents a slight increase in the accuracy (0.857) over the results of window-level detection (accuracy 0.835). However, a decrease in the Precision and Recall is identified in the session-based assessment. On the other hand, an increase in the Pearson r (0.945, p < 0.001) and a reduction in the RMSE (0.455) were achieved using the session-based methodology. The results of the session-based analysis indicate that it is feasible to derive a single indicator of the bradykinesia severity using the data aggregated from the three selected MDS-UPDRS exercises. In addition, this indicator shows a high correlation with the clinical assessment of a single clinical visit.

4.4. Summary of the Findings Observed in the Experiments

Overall, the present findings can be summarized as follows.
  • The use of the gyroscope sensors presents better results in bradykinesia detection than the use of only the accelerometer data or the combination of accelerometer and gyroscope data.
  • DL approaches provided better results than classic ML classifiers fed with extracted features. In addition, the use of the proposed method (CNN with PI and RF classification) presents competitive results for bradykinesia severity detection at the window level.
  • Data augmentation methods have a positive effect on classification performance and its effect is more pronounced in the DL-based approaches.
  • The use of data transformation methods such as FFT does not provide better results, compared to raw inertial signals.
  • Using DL approaches with an RF model as the final classification layer does not significantly improve performance.
  • The aggregation of the window-level predictions from a single clinical visit presents a slight increase in the accuracy and increases the correlation between the automatic and the clinical evaluation.

5. Discussion and Conclusions

Bradykinesia is a cardinal symptom for the evaluation of PD. The Objective quantification of this symptom is relevant for diagnosis, treatment adjustment, and a better understanding of disease progression. For this reason, research efforts have been devoted to developing automated systems that seek to diagnose and monitor bradykinesia. However, several limitations and challenges remain to consider.
There is a great heterogeneity of solutions, both in the number and type of sensors and in the methodologies proposed for data analysis. Therefore, the potential use of such technologies in the current clinical practice is limited due to the lack of validation and standardization.
The potential of complementing traditional assessment in medical centers and also extending the diagnosis and monitoring to a home environment suggest that the management of PD could be revolutionized by new wearable systems. However, challenges in scaling up solutions of this type remain, mainly due to the quality and quantity of data recorded to identify PD motor symptoms. This latter varies widely between individuals, and activities, and also evolves over time [41].
The results obtained in this study suggest that it is possible to use commercial smartwatches combined with AI techniques for the detection and evaluation of bradykinesia severity. Moreover, the best performances were obtained by using data recorded by a single tri-axial gyroscope, while combining acceleration and angular velocity data did not provide further improvements. The use of a single sensor embedded in the smartwatch would be beneficial in reducing the computational burden and increasing the battery life, thus enabling continuous monitoring.
The comparison between DL methods and classic ML-based classification approaches revealed the weak performances of the former, due to the limited amount of data. However, the simultaneous application of data augmentation techniques and novel algorithmic approaches led to significantly better performances (AUC 0.939; Accuracy 0.835) than those provided by shallow ML algorithms. Specifically, the use of DL architectures employing CNN patch extraction strategies seems to be a feasible approach to contextualize the raw data from a single sliding window. By employing such a technique, a DNN is capable of extracting specific information from small non-overlapping patches to feed discriminative architectures automatically. In addition, the proposed approach brings opportunities for applications in different tasks involving sequential data such as raw inertial signals. Moreover, the potential of combining this approach with recurrent architectures or transformer-based architectures may allow the development of end-to-end architectures capable of extracting and modeling automatically temporal dependencies. In this line, future studies could evaluate the performance of this approach in tasks where temporal dependencies are relevant, for example in the automatic detection of freezing of gait.
Table 5 reports a comparison of the methods and results of the proposed approach (at window-level) and those reported in the related literature. As can be observed, the classification performance provided by the proposed DL algorithm outperformed the state-of-the-art methods. Specifically, accuracy of 0.84 and AUC of 0.94 were higher than the best results from the related works (accuracy 0.77 and AUC 0.92 [17]). It is worth noticing that an accuracy of 0.91 was obtained in [38]. However, only a binary classification task (presence or absence of bradykinesia) was set in this case, compared to the multi-class classification problem (bradykinesia severity) used in this study.
As far as the regression results are concerned, the obtained correlation coefficient was found to be larger than that of related literature studies, while slightly smaller errors were obtained in [17]. However, the leg agility task was addressed in this latter study, using sensors on lower limbs. This represents a very specific exercise of the MDS-UPDRS, suitable for in-laboratory examinations but rather uncommon in daily living settings. Moreover, only a single sensor was employed in this study, representing a less invasive solution than those proposed in [31,33,35,39], suitable for passive long-term monitoring of PD patients in home settings. Finally, it is worth noticing that, unlike most related studies, a comprehensive performance evaluation was carried out in this work, providing both classification and regression metrics.
The present work has some limitations. The enrolled subjects’ cohort is larger than in [38] and comparable to [31], but it is smaller than in [17,33,35,39,40,41]. Data augmentation methods were used in this study to increase the data set size and provide more robust results. However, different patients may have different movement patterns, thus a larger population should be investigated to further validate the present findings. Moreover, data were collected during semi-supervised tasks, as was also carried out in most similar literature works [17,31,33,35,38,39,40,41]. In order to extend the use of the proposed method in non-supervised settings, a context algorithm for gesture recognition should be developed. Then, the activities recognized by such a model can be analyzed using the computer methods implemented in this work. Alternatively, a new unsupervised data collection procedure may be carried out, as achieved in [40], where the presence or absence of bradykinesia was estimated during unconstrained ADLs.
The proposed solution, further improved and validated on a larger cohort of PD patients, may be used to complement traditional outpatient visits. Specifically, data collected during the sporadic clinical examination can be employed for further training the proposed automatic scoring system. Afterward, the wearable solution can be used in the home setting to passively collect information regarding bradykinesia presence and severity. Finally, the information will be able to be assessed by clinicians for evaluating the evolution of the symptom over time and its fluctuations throughout the day, eventually planning proper therapy adjustments.
The present study is intended to show the potential of consumer wearable technology and DL approaches to detect the severity of bradykinesia by using data recorded during standardized MDS-UPDRS upper limbs’ motor tasks. Moreover, different ML and DL methodologies are proposed and compared, further discussing the effect of data augmentation, input type, and architectures.
Future studies will be in the direction of increasing the data set size, by enrolling a larger patient cohort. Then, the development of an automatic scoring system working in non-supervised conditions [40] would pave the way to continuous, long-term, unobtrusive monitoring of PD in home environments.

Author Contributions

L.S.: Conceptualization, Software, Methodology, Validation, Formal analysis, Writing—review and editing. B.D.: Data Curation, Software, Investigation, Methodology, Formal analysis, Writing—Original Draft. L.B.: Conceptualization, Formal analysis, Validation, Writing—review and editing. N.C.: Funding acquisition, Supervision, Writing—review and editing. S.C.: Validation, Formal analysis, Writing—review and editing. P.A.: Resources, Supervision, Writing—review and editing. J.M.L.: Resources, Supervision, Writing—review and editing. G.D.A.: Funding acquisition, Project administration, Writing—review and editing. I.P.: Formal analysis, Project administration, Writing—review and editing. All authors have read and agreed to the published version of the manuscript.

Funding

Part of this research was funded by the project “Tecnologías Capacitadoras para la Asistencia, Seguimiento y Rehabilitación de Pacientes con Enfermedad de Parkinson”. Centro Internacional sobre el envejecimiento, CENIE (código 0348_CIE_6_E) Interreg V-A España-Portugal (POCTEP); and (2) FCT—Fundação para a Ciência e Tecnologia within the R&D Units Project Scope: UIDB/00319/2020.

Institutional Review Board Statement

The study was conducted according to the guidelines of the Declaration of Helsinki. In addition, this study was approved by the Institutional Review Board (Ethics Committee) of the Universidad Politécnica de Madrid (date of approval: 18 June 2018) and the Ethics Committee of the University of Minho with the document identification CE.CSH 031/2018 (date of approval: 11 December 2018).

Informed Consent Statement

Informed consent was obtained from all subjects involved in the study.

Data Availability Statement

The data presented in this study are available on request from the corresponding author. The data are not publicly available because they contain protected patient health information.

Acknowledgments

This work has been supported by: (1) Grupo de Investigación en Instrumentación y Acústica Aplicada (I2A2). ETSI Industriales. Universidad Politécnica de Madrid; and (2) ALGORITMI Research Centre, University of Minho (Portugal).

Conflicts of Interest

The authors declare no conflict of interest.

Abbreviations

The following abbreviations are used in this manuscript:
AIArtificial intelligence
ADAMAdaptive moment estimation
ADLsActivities of daily living
AUCArea under the curve
CNNConvolutional neural network
CVCross-validation
DAData augmentation
DLDeep learning
DNNDeep neural network
FFTFast Fourier Transform
GAPGlobal average pooling
kNNk-nearest neighbors
IMUInertial measurement unit
LRLinear regression
MLMachine learning
MLPMulti-layer perceptron
PCAPrincipal component analysis
PDParkinson’s disease
QoLQuality of life
ReLURectified linear unit
RFRandom forest
ROCReceiver operating characteristic
RMSERoot mean square error
SMOTESynthetic minority over-sampling technique

References

  1. Pringsheim, T.; Jette, N.; Frolkis, A.; Steeves, T.D. The prevalence of Parkinson’s disease: A systematic review and meta-analysis. Mov. Disord. 2014, 29, 1583–1590. [Google Scholar] [CrossRef] [PubMed]
  2. Jankovic, J. Parkinson’s disease: Clinical features and diagnosis. J. Neurol. Neurosurg. Psychiatry 2008, 79, 368–376. [Google Scholar] [CrossRef] [PubMed] [Green Version]
  3. Kalia, L.; Lang, A. Parkinson’s disease. Lancet 2015, 386, 896–912. [Google Scholar] [CrossRef]
  4. Hou, J.; Lai, E. Non-motor Symptoms of Parkinson’s Disease. Int. J. Gerontol. 2007, 1, 53–64. [Google Scholar] [CrossRef] [Green Version]
  5. Williams, D.; Watt, H.; Lees, A. Predictors of falls and fractures in bradykinetic rigid syndromes: A retrospective study. J. Neurol. Neurosurg. Psychiatry 2006, 77, 468–473. [Google Scholar] [CrossRef] [PubMed]
  6. Bronte-Stewart, H. Postural instability in idiopathic Parkinson’s disease: The role of medication and unilateral pallidotomy. Brain 2002, 125, 2100–2114. [Google Scholar] [CrossRef] [PubMed] [Green Version]
  7. Patel, S.; Lorincz, K.; Hughes, R.; Huggins, N.; Growdon, J.; Standaert, D.; Akay, M.; Dy, J.; Welsh, M.; Bonato, P. Monitoring motor fluctuations in patients with Parkinson’s disease using wearable sensors. IEEE Trans. Inf. Technol. Biomed. 2009, 13, 864–873. [Google Scholar] [CrossRef] [PubMed] [Green Version]
  8. Davie, C. A review of Parkinson’s disease. Br. Med. Bull. 2008, 86, 109–127. [Google Scholar] [CrossRef] [Green Version]
  9. Fahn, S. Parkinson disease, the effect of levodopa, and the ELLDOPA trial. Arch. Neurol. 1999, 56, 529–535. [Google Scholar] [CrossRef] [Green Version]
  10. Olanow, C.W.; Stern, M.B.; Sethi, K. The scientific and clinical basis for the treatment of Parkinson’s disease. Neurology 2009, 72, S1–S136. [Google Scholar] [CrossRef] [PubMed]
  11. Parkinson Study Group. Evaluation of dyskinesias in a pilot, randomized, placebo-controlled trial of remacemide in advanced Parkinson disease. Arch. Neurol. 2001, 58, 1660–1668. [Google Scholar] [CrossRef] [PubMed]
  12. Hughes, A.J.; Daniel, S.E.; Blankson, S.; Lees, A.J. A clinicopathologic study of 100 cases of Parkinson’s disease. Arch. Neurol. 1993, 50, 140–148. [Google Scholar] [CrossRef]
  13. Berardelli, A. Pathophysiology of bradykinesia in Parkinson’s disease. Brain 2001, 124, 2131–2146. [Google Scholar] [CrossRef] [PubMed] [Green Version]
  14. Vingerhoets, F.; Schulzer, M.; Calne, D.; Snow, B. Which clinical sign of Parkinson’s disease best reflects the nigrostriatal lesion? Ann. Neurol. 1997, 41, 58–64. [Google Scholar] [CrossRef] [PubMed]
  15. Monje, M.H.G.; Foffani, G.; Obeso, J.; Sànchez-Ferro, Á. New Sensor and Wearable Technologies to Aid in the Diagnosis and Treatment Monitoring of Parkinson’s Disease. Annu. Rev. Biomed. Eng. 2019, 21, 111–143. [Google Scholar] [CrossRef] [PubMed]
  16. Goetz, C.G.; Tilley, B.C.; Shaftman, S.R.; Stebbins, G.T.; Fahn, S.; Martinez-Martin, P.; Poewe, W.; Sampaio, C.; Stern, M.B.; Dodel, R.; et al. Movement Disorder Society-sponsored revision of the Unified Parkinson’s Disease Rating Scale (MDS-UPDRS): Scale presentation and clinimetric testing results. Mov. Disord. Off. J. Mov. Disord. Soc. 2008, 23, 2129–2170. [Google Scholar] [CrossRef]
  17. Borzì, L.; Varrecchia, M.; Sibille, S.; Olmo, G.; Artusi, C.A.; Fabbri, M.; Rizzone, M.G.; Romagnolo, A.; Zibetti, M.; Lopiano, L. Smartphone-Based Estimation of Item 3.8 of the MDS-UPDRS-III for Assessing Leg Agility in People with Parkinson’s Disease. IEEE Open J. Eng. Med. Biol. 2020, 1, 140–147. [Google Scholar] [CrossRef]
  18. Espay, A.J.; Hausdorff, J.M.; Sánchez-Ferro, Á.; Klucken, J.; Merola, A.; Bonato, P.; Paul, S.S.; Horak, F.B.; Vizcarra, J.A.; Mestre, T.A.; et al. A Roadmap for Implementation of Patient-Centered Digital Outcome Measures in Parkinson’s disease Obtained Using Mobile Health Technologies. Mov. Disord. 2019, 34, 657–663. [Google Scholar] [CrossRef]
  19. Luis-Martínez, R.; Monje, M.H.; Antonini, A.; Sánchez-Ferro, Á.; Mestre, T.A. Technology-enabled care: Integrating multidisciplinary care in Parkinson’s disease through digital technology. Front. Neurol. 2020, 11, 575975. [Google Scholar] [CrossRef]
  20. Virginia Anikwe, C.; Friday Nweke, H.; Chukwu Ikegwu, A.; Adolphus Egwuonwu, C.; Uchenna Onu, F.; Rita Alo, U.; Wah Teh, Y. Mobile and wearable sensors for data-driven health monitoring system: State-of-the-art and future prospect. Expert Syst. Appl. 2022, 202, 117362. [Google Scholar] [CrossRef]
  21. Tauţan, A.M.; Ionescu, B.; Santarnecchi, E. Artificial intelligence in neurodegenerative diseases: A review of available tools with a focus on machine learning techniques. Artif. Intell. Med. 2021, 117, 102081. [Google Scholar] [CrossRef] [PubMed]
  22. Rovini, E.; Maremmani, C.; Cavallo, F. How Wearable Sensors Can Support Parkinson’s Disease Diagnosis and Treatment: A Systematic Review. Front Neurosci. 2017, 11, 555. [Google Scholar] [CrossRef] [PubMed]
  23. Hubble, R.; Naughton, G.; Silburn, P.; Cole, M.H. Wearable Sensor Use for Assessing Standing Balance and Walking Stability in People with Parkinson’s Disease: A Systematic Review. PLoS ONE 2015, 10, e0123705. [Google Scholar] [CrossRef] [Green Version]
  24. Borzì, L.; Olmo, G.; Artusi, C.A.; Fabbri, M.; Rizzone, M.G.; Romagnolo, A.; Zibetti, M.; Lopiano, L. A new index to assess turning quality and postural stability in patients with Parkinson’s disease. Biomed. Signal Process. Control 2020, 62, 102059. [Google Scholar] [CrossRef]
  25. Mei, J.; Desrosiers, C.; Frasnelli, J. Machine Learning for the Diagnosis of Parkinson’s Disease: A Review of Literature. Front. Aging Neurosci. 2021, 13, 633752. [Google Scholar] [CrossRef]
  26. Cubo, E.; Mir Rivera, P.; Sánchez Ferro, Á. Manual SEN de Nuevas Tecnologías en Trastornos del Movimiento; Ediciones SEN: Madrid, Spain, 2021. [Google Scholar]
  27. Heldman, D.A.; Urrea-Mendoza, E.; Lovera, L.C.; Schmerler, D.A.; Garcia, X.; Mohammad, M.E.; McFarlane, M.C.U.; Giuffrida, J.P.; Espay, A.J.; Fernandez, H.H. App-based bradykinesia tasks for clinic and home assessment in Parkinson’s disease: Reliability and responsiveness. J. Park. Dis. 2017, 7, 741–747. [Google Scholar] [CrossRef] [PubMed]
  28. Griffiths, R.I.; Kotschet, K.; Arfon, S.; Xu, Z.M.; Johnson, W.; Drago, J.; Evans, A.; Kempster, P.; Raghav, S.; Horne, M.K. Automated assessment of bradykinesia and dyskinesia in Parkinson’s disease. J. Park. Dis. 2012, 2, 47–55. [Google Scholar] [CrossRef] [Green Version]
  29. Dunnewold, R.J.; Hoff, J.I.; van Pelt, H.C.; Fredrikze, P.Q.; Wagemans, E.A.; van Hilten, B.J. Ambulatory quantitative assessment of body position, bradykinesia, and hypokinesia in Parkinson’s disease. J. Clin. Neurophysiol. 1998, 15, 235–242. [Google Scholar] [CrossRef] [PubMed]
  30. Salarian, A. Ambulatory Monitoring of Motor Functions in Patients with Parkinson’s Disease Using Kinematic Sensors; Technical Report; EPFL: Lausanne, Switzerland, 2006. [Google Scholar]
  31. Shawen, N.; O’Brien, M.K.; Venkatesan, S.; Lonini, L.; Simuni, T.; Hamilton, J.L.; Ghaffari, R.; Rogers, J.A.; Jayaraman, A. Role of data measurement characteristics in the accurate detection of Parkinson’s disease symptoms using wearable sensors. J. Neuroeng. Rehabil. 2020, 17, 52. [Google Scholar] [CrossRef] [PubMed] [Green Version]
  32. Mahadevan, N.; Demanuele, C.; Zhang, H.; Volfson, D.; Ho, B.; Erb, M.K.; Patel, S. Development of digital biomarkers for resting tremor and bradykinesia using a wrist-worn wearable device. NPJ Digit. Med. 2020, 3, 5. [Google Scholar] [CrossRef] [PubMed]
  33. Parisi, F.; Ferrari, G.; Giuberti, M.; Contin, L.; Cimolin, V.; Azzaro, C.; Albani, G.; Mauro, A. Body-Sensor-Network-Based Kinematic Characterization and Comparative Outlook of UPDRS Scoring in Leg Agility, Sit-to-Stand, and Gait Tasks in Parkinson’s Disease. IEEE J. Biomed. Health Inform. 2015, 19, 1777–1793. [Google Scholar] [CrossRef]
  34. Giuberti, M.; Ferrari, G.; Contin, L.; Cimolin, V.; Azzaro, C.; Albani, G.; Mauro, A. Automatic UPDRS Evaluation in the Sit-to-Stand Task of Parkinsonians: Kinematic Analysis and Comparative Outlook on the Leg Agility Task. IEEE J. Biomed. Health Inform. 2015, 19, 803–814. [Google Scholar] [CrossRef] [PubMed] [Green Version]
  35. Aghanavesi, S.; Bergquist, F.; Nyholm, D.; Senek, M.; Memedi, M. Motion sensor-based assessment of Parkinson’s disease motor symptoms during leg agility tests: Results from levodopa challenge. IEEE J. Biomed. Health Inform. 2019, 24, 111–119. [Google Scholar] [CrossRef] [PubMed]
  36. Bengio, Y. Deep learning of representations: Looking forward. In Statistical Language and Speech Processing, Proceedings of the First International Conference, SLSP 2013, Tarragona, Spain, 29–31 July 2013; Springer: Berlin/Heidelberg, Germany, 2013; pp. 1–37. [Google Scholar]
  37. Glorot, X.; Bengio, Y. Understanding the difficulty of training deep feedforward neural networks. In Proceedings of the Thirteenth International Conference on Artificial Intelligence and Statistics, Sardinia, Italy, 13–15 May 2010; Teh, Y.W., Titterington, M., Eds.; PMLR: Sardinia, Italy, 2010; Volume 9, pp. 249–256. [Google Scholar]
  38. Eskofier, B.M.; Lee, S.I.; Daneault, J.F.; Golabchi, F.N.; Ferreira-Carvalho, G.; Vergara-Diaz, G.; Sapienza, S.; Costante, G.; Klucken, J.; Kautz, T.; et al. Recent machine learning advancements in sensor-based mobility analysis: Deep learning for Parkinson’s disease assessment. In Proceedings of the 2016 38th Annual International Conference of the IEEE Engineering in Medicine and Biology Society (EMBC), Orlando, FL, USA, 16–20 August 2016; pp. 655–658. [Google Scholar]
  39. Park, D.J.; Lee, J.W.; Lee, M.J.; Ahn, S.J.; Kim, J.; Kim, G.L.; Ra, Y.J.; Cho, Y.N.; Jeong, W.B. Evaluation for Parkinsonian Bradykinesia by deep learning modeling of kinematic parameters. J. Neural Transm. 2021, 128, 181–189. [Google Scholar] [CrossRef]
  40. Pfister, F.M.; Um, T.T.; Pichler, D.C.; Goschenhofer, J.; Abedinpour, K.; Lang, M.; Endo, S.; Ceballos-Baumann, A.O.; Hirche, S.; Bischl, B.; et al. High-Resolution Motor State Detection in Parkinson’s Disease Using Convolutional Neural Networks. Sci. Rep. 2020, 10, 5860. [Google Scholar] [CrossRef] [Green Version]
  41. Lonini, L.; Dai, A.; Shawen, N.; Simuni, T.; Poon, C.; Shimanovich, L.; Daeschler, M.; Ghaffari, R.; Rogers, J.A.; Jayaraman, A. Wearable sensors for Parkinson’s disease: Which data are worth collecting for training symptom detection models. Npj Digit. Med. 2018, 1, 64. [Google Scholar] [CrossRef] [Green Version]
  42. Sigcha, L.; Pavón, I.; Costa, N.; Costa, S.; Gago, M.; Arezes, P.; López, J.M.; De Arcas, G. Automatic Resting Tremor Assessment in Parkinson’s Disease Using Smartwatches and Multitask Convolutional Neural Networks. Sensors 2021, 21, 291. [Google Scholar] [CrossRef]
  43. Hoehn, M.M.; Yahr, M.D. Parkinsonism: Onset, progression, and mortality. Neurology 1998, 50, 318. [Google Scholar] [CrossRef]
  44. Bao, L.; Intille, S.S. Activity recognition from user-annotated acceleration data. In Pervasive Computing, Proceedings of the Second International Conference, PERVASIVE 2004, Vienna, Austria, 21–23 April 2004; Springer: Berlin/Heidelberg, Germany, 2004; pp. 1–17. [Google Scholar]
  45. Bonato, P.; Sherrill, D.M.; Standaert, D.G.; Salles, S.S.; Akay, M. Data mining techniques to detect motor fluctuations in Parkinson’s disease. In Proceedings of the 26th Annual International Conference of the IEEE Engineering in Medicine and Biology Society, Chicago, IL, USA, 26–30 August 2004; Volume 2, pp. 4766–4769. [Google Scholar]
  46. Channa, A.; Ifrim, R.C.; Popescu, D.; Popescu, N. A-WEAR bracelet for detection of hand tremor and bradykinesia in Parkinson’s patients. Sensors 2021, 21, 981. [Google Scholar] [CrossRef]
  47. San-Segundo, R.; Navarro-Hellín, H.; Torres-Sánchez, R.; Hodgins, J.; De la Torre, F. Increasing robustness in the detection of freezing of gait in Parkinson’s disease. Electronics 2019, 8, 119. [Google Scholar] [CrossRef]
  48. Sigcha, L.; Costa, N.; Pavón, I.; Costa, S.; Arezes, P.; López, J.; De Arcas, G. Deep Learning Approaches for Detecting Freezing of Gait in Parkinson’s Disease Patients through On-Body Acceleration Sensors. Sensors 2020, 20, 1895. [Google Scholar] [CrossRef] [Green Version]
  49. Sigcha, L.; Borzì, L.; Pavón, I.; Costa, N.; Costa, S.; Arezes, P.; López, J.M.; De Arcas, G. Improvement of Performance in Freezing of Gait detection in Parkinson’s Disease using Transformer networks and a single waist-worn triaxial accelerometer. Eng. Appl. Artif. Intell. 2022, 116, 105482. [Google Scholar] [CrossRef]
  50. Chawla, N.V.; Bowyer, K.W.; Hall, L.O.; Kegelmeyer, W.P. SMOTE: Synthetic minority over-sampling technique. J. Artif. Intell. Res. 2002, 16, 321–357. [Google Scholar] [CrossRef]
  51. Um, T.T.; Pfister, F.M.J.; Pichler, D.; Endo, S.; Lang, M.; Hirche, S.; Fietzek, U.; Kulić, D. Data augmentation of wearable sensor data for parkinson’s disease monitoring using convolutional neural networks. In Proceedings of the 19th ACM International Conference on Multimodal Interaction, Glasgow, UK, 13–17 November 2017. [Google Scholar] [CrossRef] [Green Version]
  52. Jost, L. Entropy and diversity. Oikos 2006, 113, 363–375. [Google Scholar] [CrossRef]
  53. Trockman, A.; Kolter, J.Z. Patches are all you need? arXiv 2022, arXiv:2201.09792. [Google Scholar]
  54. Hassani, A.; Walton, S.; Shah, N.; Abuduweili, A.; Li, J.; Shi, H. Escaping the big data paradigm with compact transformers. arXiv 2021, arXiv:2104.05704. [Google Scholar]
  55. Li, L.; Jamieson, K.; DeSalvo, G.; Rostamizadeh, A.; Talwalkar, A. Hyperband: A Novel Bandit-Based Approach to Hyperparameter Optimization. J. Mach. Learn. Res. 2017, 18, 6765–6816. [Google Scholar]
  56. Kingma, D.P.; Ba, J. Adam: A Method for Stochastic Optimization. arXiv 2014, arXiv:1412.6980. [Google Scholar]
  57. Japkowicz, N.; Shah, M. Evaluating Learning Algorithms: A Classification Perspective; Cambridge University Press: Cambridge, UK, 2011. [Google Scholar]
  58. Breiman, L. Random Forests. Mach. Learn. 2001, 45, 5–32. [Google Scholar] [CrossRef]
Figure 1. Data collection methodology to detect bradykinesia using smartwatches and MDS-UPDRS exercises.
Electronics 11 03879 g001
Figure 2. Distribution of the severity of bradykinesia in the dataset.
Electronics 11 03879 g002
Figure 3. Filtering applied to the gyroscope signals. (a) sample of the original signal corresponding to exercise 4 (finger tapping); (b) gyroscope signal after applying a 0.25–3.5 Hz fourth-order Butterworth band pass filter.
Electronics 11 03879 g003
Figure 4. Data augmentation techniques applied in the gyroscope signals. (a) sample of the original signal corresponding to exercise 4 (finger tapping); (b) permutation of a sample signal of the exercise 4; (c) magnitude warping of a sample signal of exercise 4; (d) sample of the original signal corresponding to exercise 5 (hand movements); (e) permutation of a sample signal of the exercise 5; (f) magnitude warping of a sample signal of exercise 5.
Electronics 11 03879 g004
Figure 5. Patch input strategy with 1D-Convolution.
Electronics 11 03879 g005
Figure 6. Proposed architecture for a CNN with patch input and MLP.
Electronics 11 03879 g006
Figure 7. Proposed architecture for a CNN with patch input and Random Forest classification.
Electronics 11 03879 g007
Figure 8. K-fold validation (k = 5) employed to evaluate the performance of the classification algorithms.
Electronics 11 03879 g008
Table 1. Summary of the data representations. FFT: fast Fourier transform.
Feature SetNumber of FeaturesDescription of the Features
Shawen et al. [31]74- Time domain features (24)
- Frequency domain features (24)
- Features extracted from the derivatives of the signals (16)
- Entropy (4)
- Peak correlation between signals (3)
- Cross-correlation delay (3)
Channa et al. [46]43- Time domain features (28)
- Frequency domain features (12)
- Peak correlation between signals (3)
Filtered signal (256-sample window)768
(256 × 3)
Filtered signal obtained from the triaxial sensors (accelerometer or gyroscope).
Contextual FFT384
(128 × 3)
Concatenated single-side FFT of two consecutive windows. A single window (256 samples) was divided into 2 windows of 128 samples before FFT computation.
Table 2. Baseline methods. Accel: Accelerometer; Gyro: Gyroscope.
Feature SetSensor DataAccuracyPrecisionRecallF1-ScoreAUC
Accel0.7310.7210.7310.6920.889
Shawen et al. [31]Gyro0.7620.7530.7620.7270.907
Accel + Gyro0.7200.7050.7200.6730.886
Accel0.7490.7450.7490.7160.905
Channa et al. [46]Gyro0.7830.7730.7830.7550.909
Accel + Gyro0.7490.7460.7490.7180.893
Table 3. Results of different bradykinesia detection methods using data collected for a single triaxial gyroscope. SMOTE: synthetic minority over-sampling technique; RF: random forest; CNN: convolutional neural network; FFT: fast Fourier transform; MLP: multi-layer perceptron; PI: patch input; DA: data augmentation.
MethodData RepresentationClassifierAccuracyPrecisionRecallF1-ScoreAUC
BaselineChanna et al. [46]RF (100)0.7830.7730.7830.7550.909
Baseline + SMOTEChanna et al. [46]RF (100)0.7920.7020.6670.6800.912
CNNRaw signalCNN + MLP0.6750.6610.6750.6180.687
Contextual CNN 1FFT contextualCNN + MLP0.6290.5610.6290.5630.706
CNN(PI) + DA 2Raw signalCNN (PI) + MLP0.8260.7330.7510.7380.943
CNN(PI) + RF + DA 2Raw signalCNN (PI) + RF (100)0.8350.7500.7480.7460.939
1 Proposed method which employs contextualization of adjacent windows (Contextual FFT) in the input data. 2 Proposed method which implements the patch input strategy in the CNN feature extraction block. The best results for each evaluation metric are bold.
Table 4. Results of different assessment methods for bradykinesia detection using the proposed CNN with patch input and Random Forest classification. RMSE: root mean square error.
Assessment MethodAccuracyPrecisionRecallF1-ScorerRMSE
Window-level0.8350.7500.7480.7460.820.77
Session-based0.8570.7330.7280.7160.940.46
Table 5. Comparison of different bradykinesia detection methods and results. ML: machine learning; AUC: area under the curve; RMSE: root mean square error; IMU: inertial measurement unit; ADLs: activities of daily living; SVM: support vector machine; kNN: k-nearest neighbors; PCA: principal component analysis; MLP: multi-layer perceptron; RF: random forest; CNN: convolutional neural network; DA: data augmentation; LR: linear regression.
StudySensor (Location)TaskML Model (Input)AccuracyAUCrRMSE
 [17]Smartphone (thigh)Leg agilityMLP (features)0.770.920.920.42
 [31]Smartwatch, IMU (wrist, hand)gait, upper limbs exercisesRF (features)-0.65--
 [33]IMU (thighs)Leg agilitykNN (features + PCA)0.430-0.640-
 [35]IMU (ankles)Leg agilitySVM (features)--0.830.53
 [38]IMU (forearm)upper limbs exercisesCNN (raw data)0.91 (binary)---
 [39]IMU (wrist, fingers)upper limbs exercisesLR (features)-0.930.85-
 [40]Accelerometer (wrist)ADLsCNN (raw data + DA)--0.83-
 [41]IMU (hand)gait, upper limbs exercisesRF (features)-0.73--
ProposedSmartwatch (wrist)upper limbs exercisesCNN + RF (raw data)0.860.940.940.46
Publisher’s Note: MDPI stays neutral with regard to jurisdictional claims in published maps and institutional affiliations.

