1. Introduction
The decarbonization of the EU energy system, with targets to reduce greenhouse gas emissions by 55% or more by 2030 [
1] and to become a carbon-neutral continent by 2050 Ref. [
2], puts consumers at the center of the green energy transition. Reducing carbon emissions depends on renewable energy resources, an efficient energy use, and active consumer participation. The role of consumers is shifting with the energy transition from passive [
3], conventional [
4], and traditional consumers to active consumers who can choose their provider or energy source and participate through technology [
5], to producers [
6] who produce renewable energy [
7], and prosumers who consume the electricity they generate [
8]. In addition, they can also sell, store, or trade the surplus energy [
9] by becoming sellers or buyers [
6], as individuals or by joining with other users to form a kind of energy community [
10], connected through a dedicated infrastructure or even virtually Ref. [
11]. An energy community brings environmental, economic, or social community benefits to the participants and involves them in the process of decision-making [
12]. Consumers need to be empowered to take “an active and participatory role in the governance of local energy initiatives” [
13]. The use of smart meters allows consumers to actively participate and not only leads to increased power supply reliability but it would also decrease the time and efforts needed to localize faults and improve power quality [
14].
The active participation of consumers, the emergence of new opportunities, energy services and business models, and the decentralization of the energy supply [
15] also require digitalization, as consumers need new ways of being informed and to communicate in the process of the energy exchange.
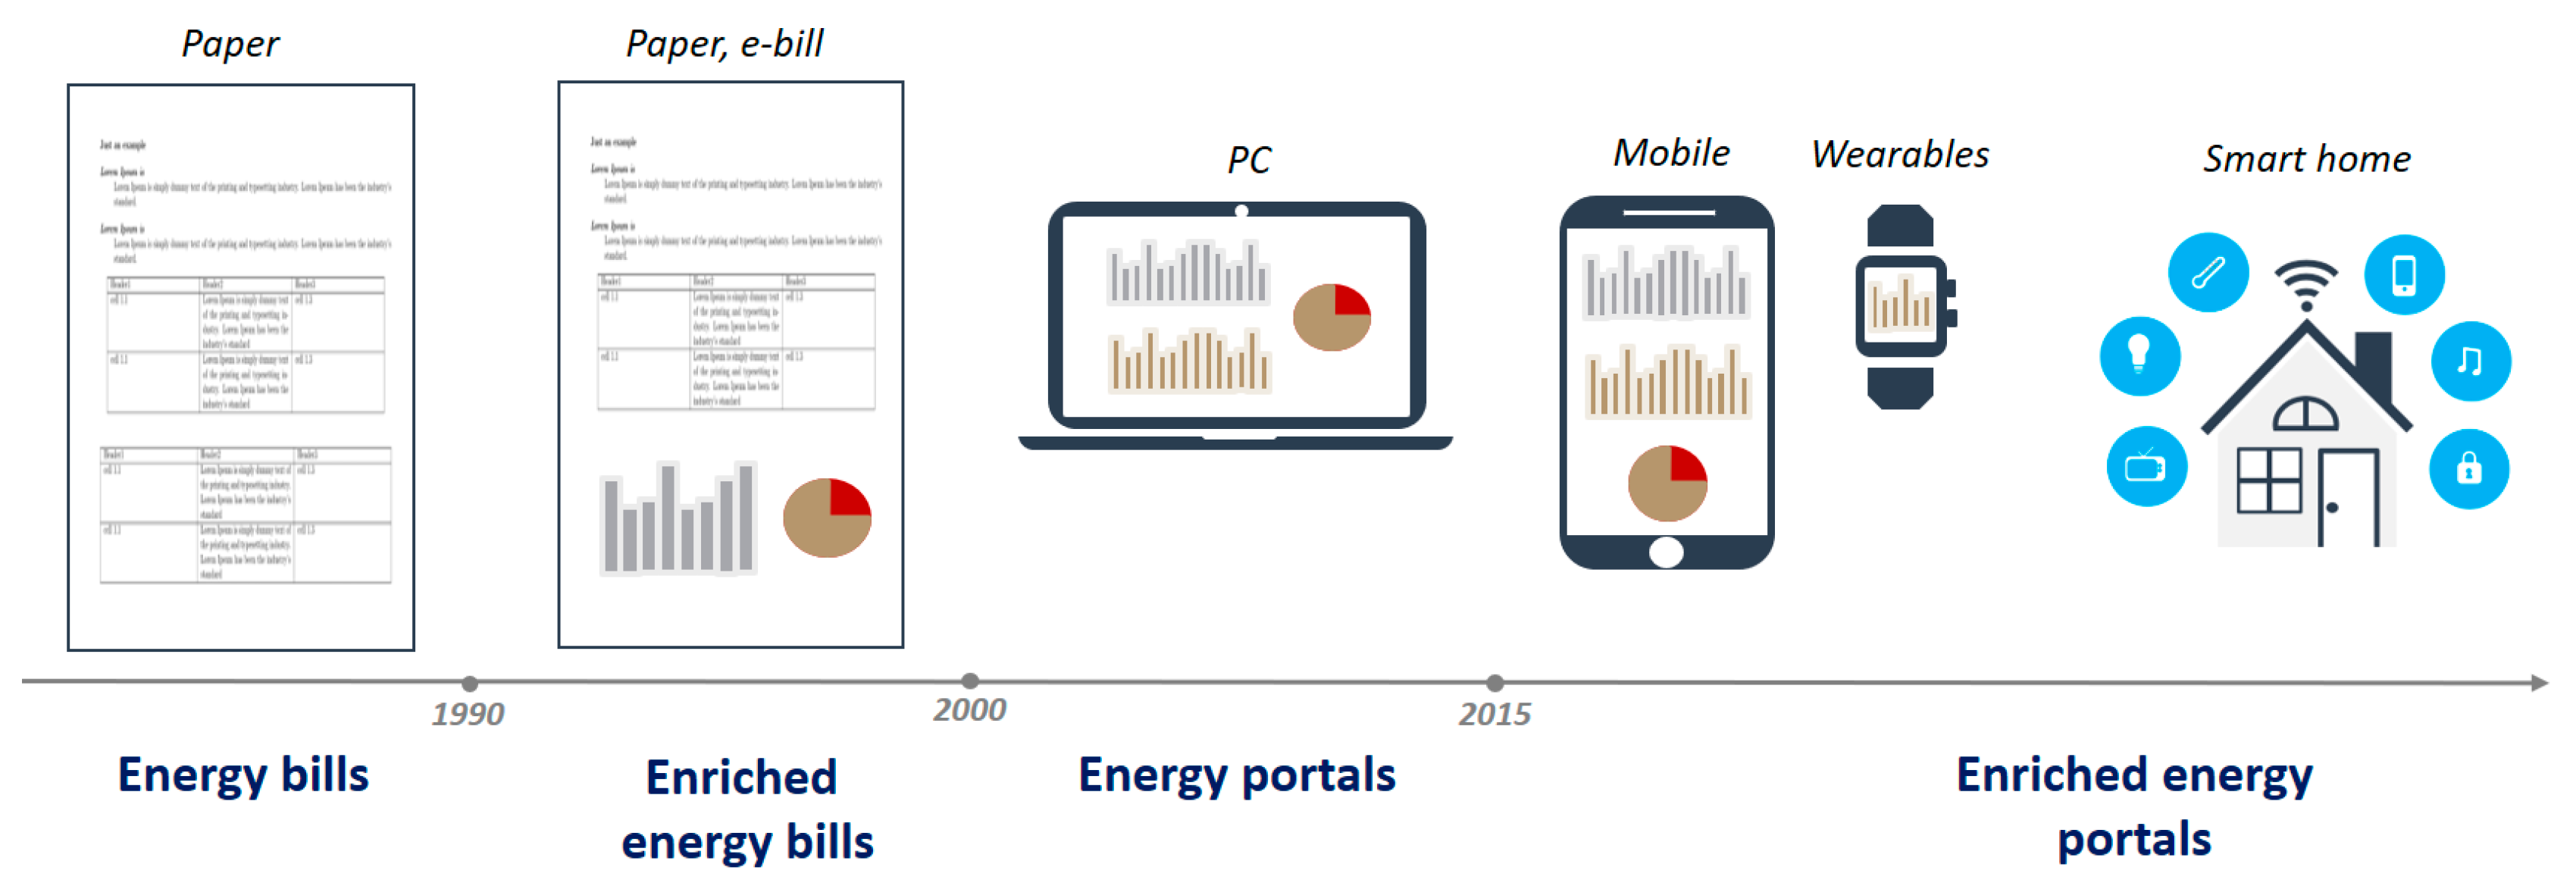
Figure 1 shows how communication between utilities and consumers has evolved over the years, starting with monthly paper bills. Traditionally, consumers received basic information about their energy consumption in kWh with payment information [
16]. Later, traditional monthly paper bills were enriched with additional consumption information and visualizations, etc. Paper bills were later replaced by electronic bills, which have recently evolved into web portals and apps. Nowadays, utilities are becoming more consumer-centric [
17] by exploring new, customizable, and scalable communication channels to enable a two-way communication with consumers and bring them closer to detailed information. A prompt, direct, and affordable communication with the customers is now enabled with the technology, especially with mobile technology [
18].
Portals that interface consumers with their smart meters [
19] are “compelling, actionable, and available to people” [
20]. Portals are interactive [
21] and provide consumers with detailed information about their consumption [
21] in the form of independent [
22] and direct consumption feedback [
23], to which consumers have already become accustomed. The improvement of the portals, which will also enables the integration of end-user devices along with smart meters, will enrich the information provided to consumers by combining heterogeneous data sources and create closer relationships [
24] between utilities and consumers. It will also discourage consumers from using multiple applications as the energy transition moves into the smart home space with the development of demand response and flexibility services. Consumers are increasingly using connected smart-home devices and services, referred to in the literature as “all-in-one remote control services” Ref. [
25]. Portals can enable bidirectional communication with consumers, allowing them to manage (turn on and off) devices in the home [
21] or schedule device operation [
26].
The energy transition begins with consumer awareness, followed by participation and governance [
13]. Consumers need to be “aware of the link between their daily behavior and energy consumption” [
27] and become knowledgeable participants who can make informed decisions [
21]. Two-way communication with consumers could be a long-term goal for utilities. However, consumers will not simply “magically absorb” or adopt new technologies; they must learn and accept them [
28]. The adoption or non-adoption of new energy technologies and services is related to several factors: the amount of information provided [
29], limited knowledge about the potential benefits of different energy services Ref. [
30], consumers’ skeptical perspective [
31], an inaccurate understanding of energy use Ref. [
22], myths, fears and doubts [
32], etc.
This paper presents the development of a web portal that provides information on electricity and water consumption. In addition to the web portal as an electronic feedback channel, consumers also received monthly newsletters via email. As a novel service, a smart shower head was installed in the homes of participating consumers to augment the information provided by the web portal with ambient feedback information from the environment at the point of consumption. The research focused on communication with the consumers, the delivery of feedback, the active participation and engagement of consumers, and the use of accumulated knowledge in the process of a new service development.
In this paper, we present the results of a seven-month field study in which 234 Slovenian households tested the portal. The objectives of the study were to (1) analyze the consumer onboarding process, (2) evaluate consumers’ interaction with the portal over time, (3) examine the impact of communication outside the portal (ambient device, email) on activity in the portal, and (4) evaluate the portal by the consumers.
The paper is organized as follows:
Section 2 outlines the related research.
Section 3 presents our methodology and techniques for data collection.
Section 4 reports on the portal design process and consumer adoption, focusing on the user interface design and feedback as well as the results of the analysis, followed by the discussion and conclusions in
Section 5.
2. Theoretical Background
The related and relevant literature was examined in an effort to clarify the crucial role that consumers play in contributing to demand flexibility, highlighting the efforts to make electricity tangible, particularly through the use of consumption feedback, leading towards consumer-centric solutions, which such energy portals are. In the SoA of the paper we have systematically examined: the types of feedback, factors that influence the effectiveness of the feedback and the feedback delivery channels, with emphasis on portals. Consumers play a crucial role in the development of innovations [
33]. By optimizing, increasing, or decreasing their consumption at a given time, consumers can create flexibility Ref. [
4]. This can be either a one-time cooperation or a frequent one for which they can be rewarded. Demand response is considered key to balancing consumption and production Ref. [
34] and matching the supply to the demand [
35]. In addition to flexible consumption, the value of the consumer in terms of energy savings is also emphasized, i.e., demand reduction with various incentives for consumers [
36]. However, energy demand flexibility is a “matter of changing established everyday practices” [
34] and consumers are not always willing to “sacrifice their comfort of life for the sake of energy consumption” [
37]. The data of the consumers typically need to be shared as well, to which consumers must consent, and this may raise privacy concerns as well [
38]. Therefore, consumer engagement and participation can be challenging. The literature shows positive attitudes among households toward participation in demand-side management [
39], with up to 10% of the target population participating in trials or programs [
30], with a “trusting relationship with the data collector” playing an important role in “consumer engagement” [
17], and a distrust of the utility being associated with a lower willingness to participate [
40]. Furthermore, the processing of personal data is regulated by The General Data Protection Regulation (GDPR), so, the data are private and belong to the consumers [
38]. However, the implementation of such programs and services requires consumers to be able to understand their consumption and identify their energy behaviors [
41]. A study by [
42] concluded, based on a comparison of 50 consumer markets, that electricity consumers have difficulty understanding and comparing products and services.
Energy consumption is invisible to most consumers [
43], abstract and intangible Ref. [
23]—it cannot be smelled, heard, felt, tasted, or seen [
42]—is typically a routine and passive purchase [
30], and appears to be a “thinking” rather than a “feeling” product [
19]. Therefore, research is focused on how to help consumers understand domestic energy use, as a greater awareness and knowledge will help change energy use and lead to sustainable energy behaviors [
24]. Attempts are being made to make electricity visible, from enriching monthly bills with basic consumption information and visualizations, to sharing tips for sustainable behavior through brochures, face-to-face conversations, and websites [
24], to labeling the appliances consumers use in the home [
44], or informing consumers about their energy use in the form of consumption feedback that is both informative and motivating [
45].
Consumption feedback, a “measure given after an event or action” [
27], is considered a learning tool that allows consumers to teach themselves [
46] and increases consumers’ awareness of their energy consumption when given frequently over time [
47]. Literature Ref. [
48] categorizes energy-related feedback into three types: explanatory, meaning to translate usage into understandable units; temporal, comparing consumers with themselves at different point in time; and normative, comparing consumers to other households or communities. Depending on the purpose, there are different types of feedback, e.g., real-time feedback, historical feedback, monetary feedback, feedback combined with advice or instructions, social influence and peer comparison, consumption disaggregated by appliances, eco-feedback, goal setting and gamification with rewards, and collective feedback [
41]. Eco-feedback provides information to consumers to encourage them to adopt sustainable behaviors [
49] and can cover different areas, such as energy, water, food, transportation, waste management, etc.
The effectiveness of feedback depends not only on the amount of information available to consumers [
29], but also on what type of information is presented [
49], how the information is presented [
50], and when it is presented [
49]. Consumers’ roles are changing and they are becoming more active due to the progress of Information and Communication Technologies (ICT) and the Internet of Things (IoT) [
51]. Research points to the presentation medium and location of feedback as key elements [
22]. Consumption feedback could be in written form and delivered through monthly bills, brochures, etc. [
24], or it could be digital and delivered through in-home displays (IHD) and ambient devices that provide feedback information at the point of consumption, or through mobile applications mobile or web portals that enable different types of interactive consumption feedback [
21]. However, the interest in portals, IHDs, and smart applications is greater than that in the paper feedback [
19]. The Energy Efficiency Directive promotes IHDs and studies have shown that they can increase visibility and an awareness of one’s energy use [
52], but they offer a different user experience than computers, tablets, or mobile devices, which are part of consumers’ daily lives [
41], and barriers cited in the literature include difficulty understanding the display and a lack of interest [
53].
The top three sources that consumers use to follow developments and events in the electricity market are utility newsletters, the general media, and applications [
54]. In addition, mobile applications have a positive impact on consumer engagement [
55]. Consumers may not be willing to make sacrifices, but they are curious and have a desire for knowledge and novelty [
54]. Energy consumers’ roles have shifted from passive to active, but the literature states that the initial goal was for the consumers to manage their own energy consumption at home [
3]. Research has shown that about 90.6% of consumers want to monitor their own behavior, and about 49.4% are even willing to allow the monitoring of third-party devices [
17]. Putting consumers first requires consumer-centric solutions and customization. As consumers are already accustomed to computers, tablets, mobile devices, and wearables [
41], the “visualization of electricity” should be portable and work on multiple platforms, with a focus on mobile devices [
37]. Portals are “compelling, actionable, and available to people” [
20], interactive, and customizable to a user profile, while providing consumers with detailed information about their consumption [
21] in a form of independent [
22] and direct consumption feedback [
23]. They are accessible through computers and mobile devices, enable push and pull messages, and consumers have already become accustomed to them. Research also shows that the environment in which users interact must be taken into account [
56], because the perception, such as the effectiveness, efficiency, or satisfaction, that consumers receive when interacting with products or services defines their user experience (UX) [
56].
3. Materials and Methods
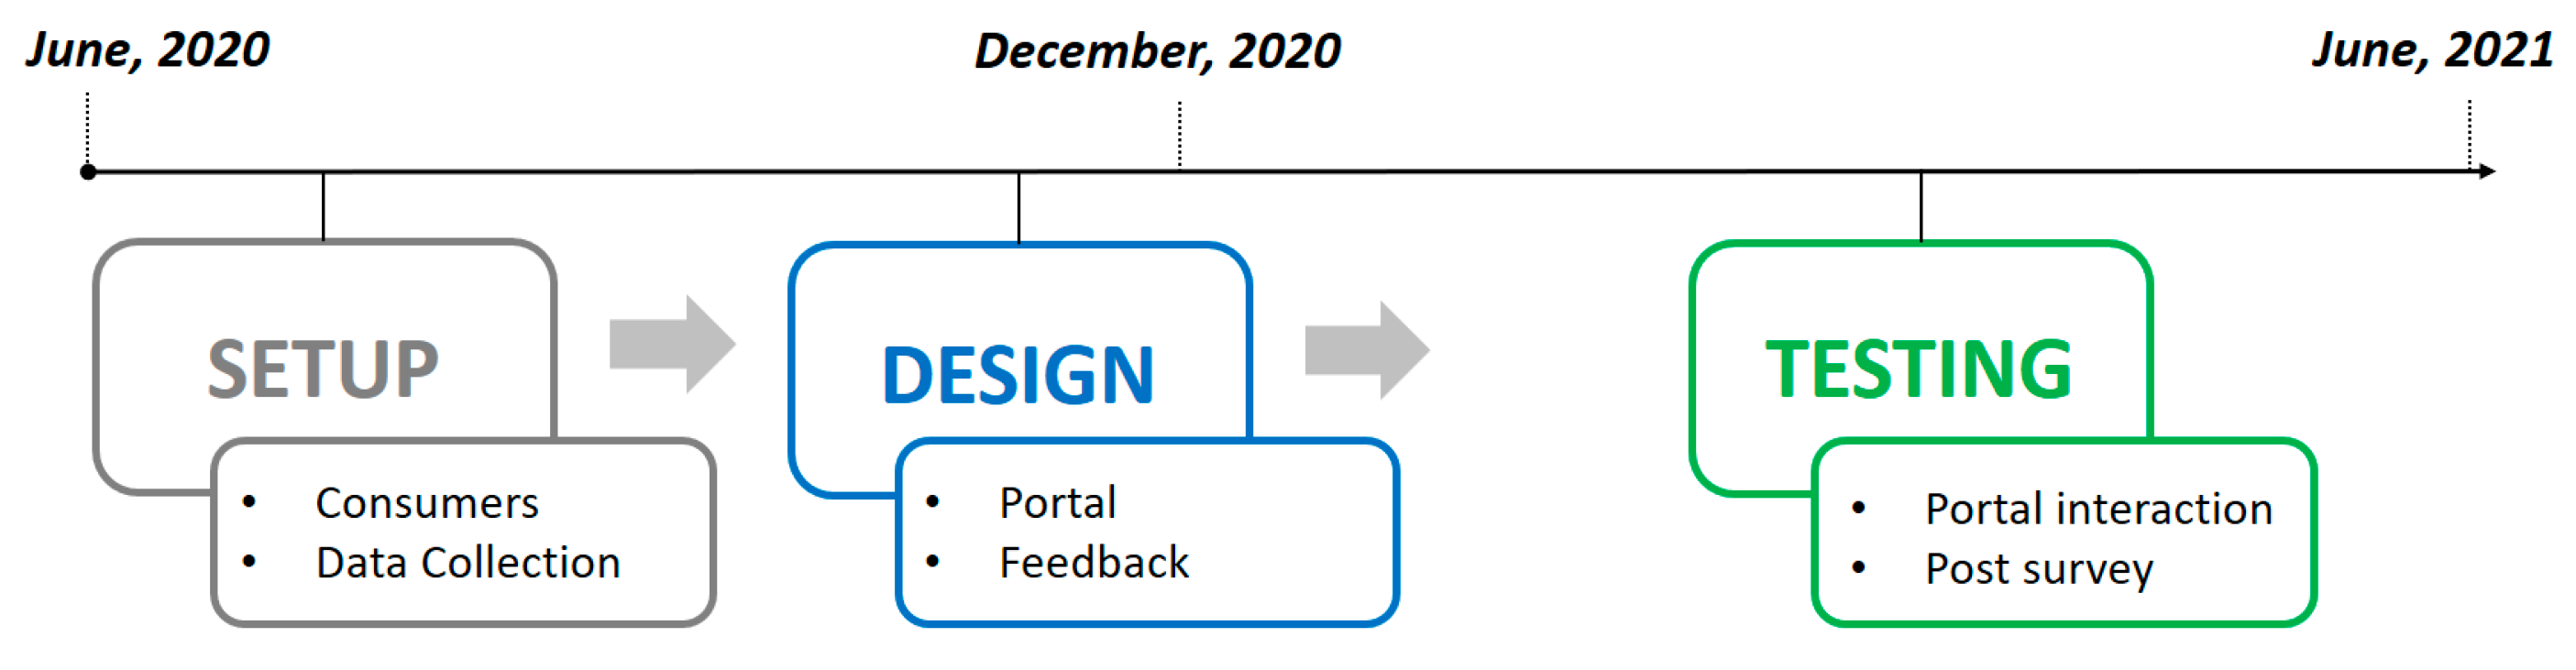
Figure 2 shows our three-step methodology: the setup, design, and testing of the portal with an integrated smart home device: a smart shower head. The smart shower head is one of several networked devices that can be used. In our pilot project, we chose the smart shower head because it is inexpensive, can be installed easily and quickly, and water consumption is tangible to the consumer.
The setup step included selecting consumers and setting up the data warehouse for a bidirectional data collection. The design step included the design of the portal and the design of the selected feedback. The testing phase included the 7-month testing period, during which consumers received feedback through three channels: the portal, ambient device, and email. The portal was tested by 234 Slovenian consumers (households). Data were collected on consumer interactions with the portal. The testing phase was concluded with a post-survey in which consumers evaluated the portal. The collected and anonymized data from both the consumer interactions with the portal and the post-survey were used for further analysis. We divide our findings into the following:
The process of onboarding consumers onto the portal;
The interaction with the portal over time;
The impact of communication outside the portal (ambient device, email) on the activity in the portal;
The consumer’s evaluation of the portal.
The remainder of this section focuses on describing the first step, the setup, which focuses on the consumer selection and data collection, and the third step, testing, which focuses on the portal interaction and post-survey. The second step, design, is presented in
Section 4.
- (a)
Consumer Selection and Setup
The invitation to participate in the pilot was sent to the customers of GEN-I, the largest Slovenian electricity supplier [
57]. Communication with the customers was well organized and carefully designed, following the guidelines of the utility. Consumers were selected based on several criteria: (1) consumers with a household consumption who (2) had a smart meter with remote reading enabled. The sample was selected using an online survey (3) to collect the relevant data. The selection survey included questions on age, income, education, occupation, the number of household members, and the type of residence. The survey also served as an invitation and was sent to approximately 10,000 randomly selected customers. Invitations were sent via email, using a web platform to automatically send the campaign to all recipients with a link to the survey. Of the 10,000 customers invited, approximately 1082 customers (10.82%) completed the survey and agreed to participate and share their data. Since many consumers met the selection criteria, the number was limited to 300 consumers for testing purposes. The final 300 consumers were selected based on the survey data: a willingness to participate, meeting the technical requirements, and household size. Later, some of the consumers dropped out of the study for personal reasons, so the final number of consumers invited to the portal was 285. The representativeness of the sample was examined during the project based on their household size, gender, age, income, and education level. The research was conducted based on the Slovenian national statistics for 2019 and the results [
58] show that the sample was very similar to the general population of Slovenia in terms of education—about 33% have at least a college degree in both cases—as well as the average monthly household income of EUR 2060 in Slovenia compared to the sample income of EUR 1500–EUR 2500. In terms of household size, gender, and age, consumers in the sample have larger households, with 3.2 persons per household, compared to the Slovenian average of 2.5 persons, an average age of 52.8 years compared to the Slovenian average of 44.5 years, and a higher proportion of men at 67.7% compared to 49.7% in the Slovenian population. After selection, consumers received a smart shower head to install and use during the study. The package sent to consumers included a smart shower head, a gateway with a power cord, and installation instructions (Android and iOS).
Data integration was a difficult process because there were several independent data sources. To extract the data from the various sources and load it into our data warehouse, we created a scheduler that runs daily and can also be run on demand. Once the data were extracted and loaded, processing and cleansing followed.
The portal used a two-way communication with consumers, to and from consumers. The feedback to consumers included data from heterogeneous sources: (1) smart meter with 15-minute telemetry data (ID of measurement point, timestamp, and electricity consumption [kWh]), (2) smart shower head with per-shower data (device ID, timestamp, volume [l], duration [sec], water flow [l/min], water temperature [°C]), (3) and the consumer’s information (general, household, environmental concerns, and socioeconomic characteristics), and consumer data from the utility.
During the interaction with the portal, consumer data were collected and stored. This included (1) content data: short surveys and savings tips posted on the portal (what consumers opened/liked or commented on), and (2) data from the user’s interaction with the portal that was later used for analysis (registration, visits by tab, visit duration, and clicks). To evaluate the design of the portal, consumer opinion was collected in a (3) follow-up survey in June 2021. The survey was uploaded to the portal. Each consumer received an email asking them to complete the survey and a link to access it. Through the survey, we collected data on consumers’ motivation to join and visit the portal, their satisfaction with the portal, and their evaluation of the portal design.
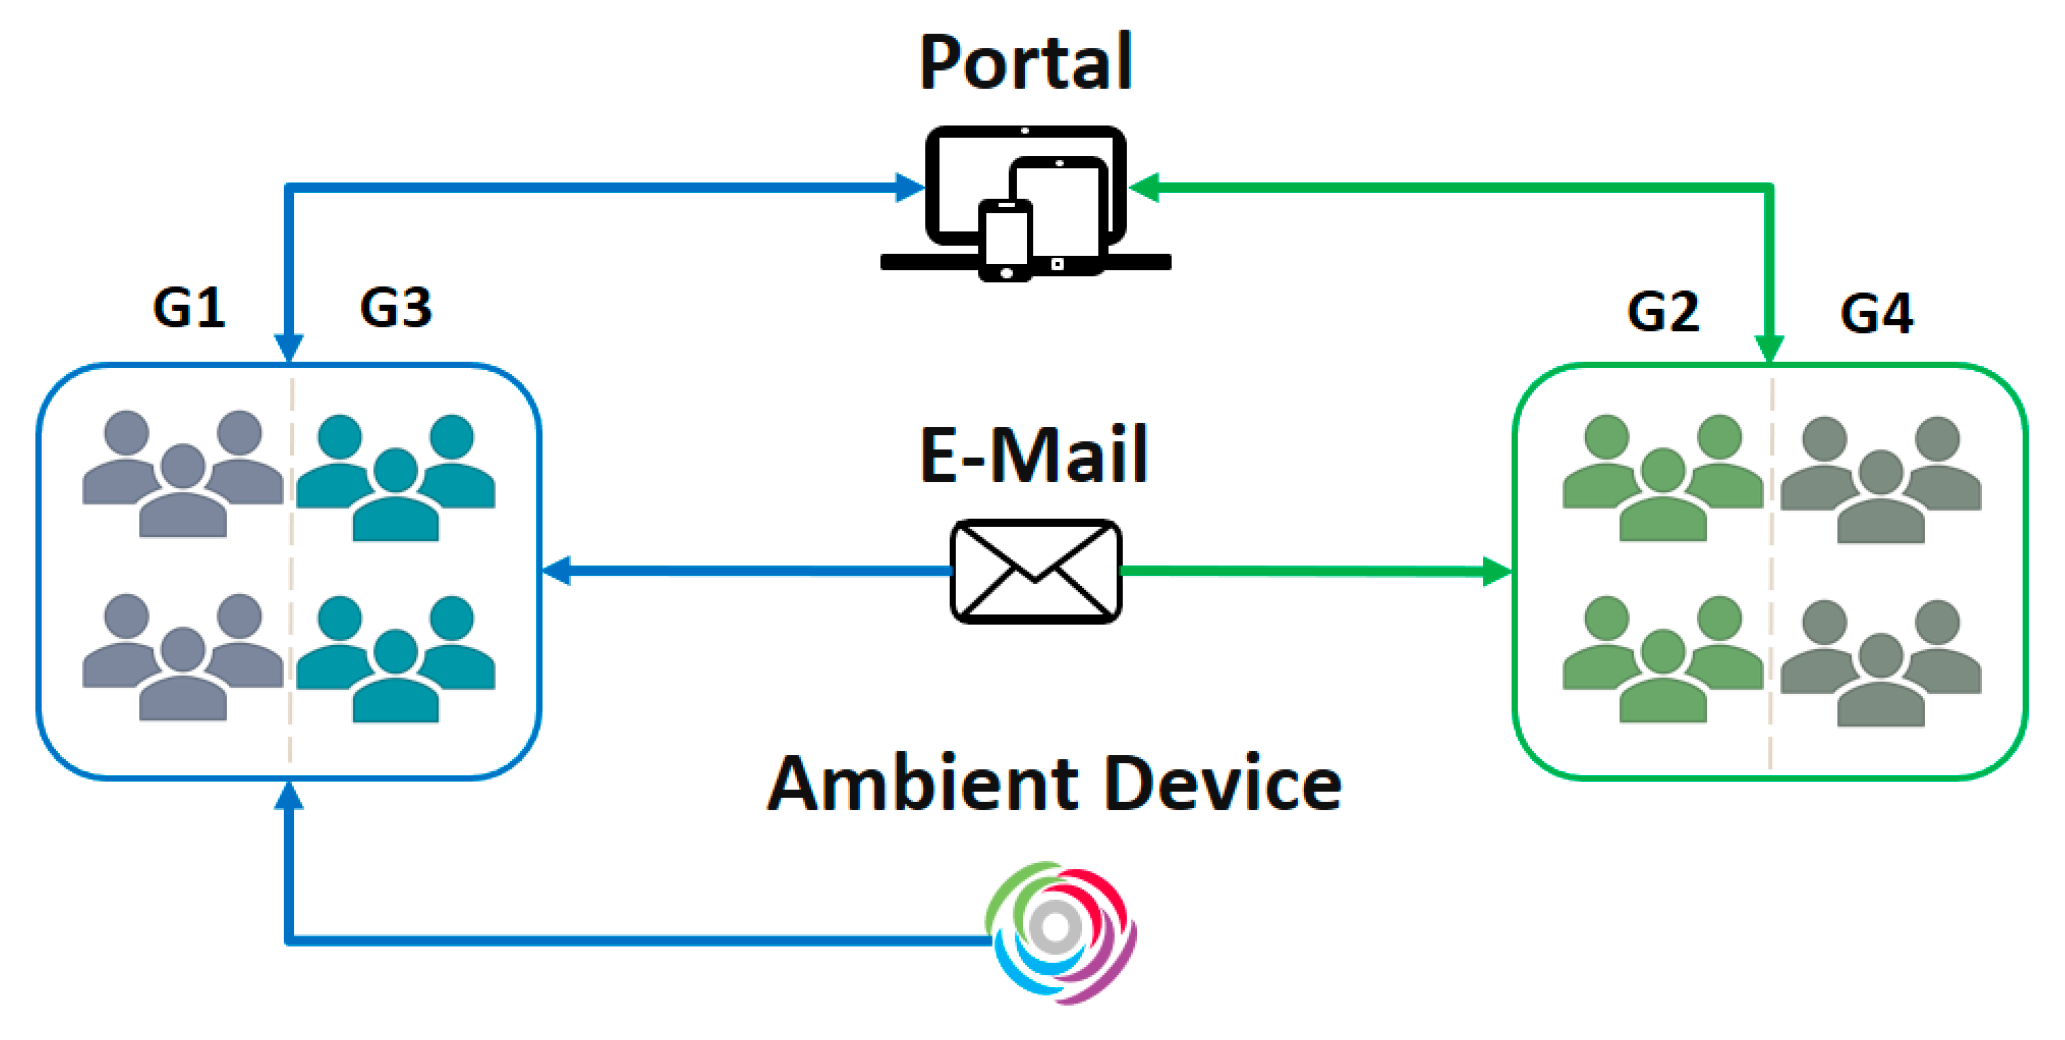
During the test period (
Figure 3), consumers received feedback on the consumption via the portal, email, and the ambient device. The portal was activated in December 2020 and all 285 selected consumers were invited to register. Over a 7-month period, between December 2020 and June 2021, the consumers tested the portal and their interaction with the portal was recorded. Feedback on the portal included: (near) real-time and historical consumption feedback, self/peer comparison, savings tips, a discussion forum, short survey, and feedback from the energy community (
Section 4.1.1).
In addition to communication through the portal, emails were also used. Invitations to participate in this study or to register for the portal, all notifications about the portal or smart shower heads, and various reminders were sent via email. Consumers also received a newsletter via email at the beginning of each month. The content and design of the monthly newsletter is described in
Section 4.
For the project, consumers were randomly divided into groups of approximately an equal size. As shown in
Figure 3, consumers were divided into 4 groups: (G1) consumers who were part of the energy community and received real-time feedback from the ambient device, (G2) consumers who were part of the energy community and did not receive real-time feedback from the ambient device, (G3) consumers who were not part of the energy community and received real-time feedback from the ambient device, (G4) and consumers who were not part of the energy community and did not receive real-time feedback from the ambient device.
4. Results
Results, presented in the following section are describing (1) the portal design process and (2) the analysis of the collected data. The portal design process presents the steps followed to design the portal, from the planning and market research step to the maintenance step. Furthermore, it presents a summary and description of the types of designed feedback. The analysis of the collected data will cover the process of on-boarding and explain how much time it took consumers to register on the portal and to first visit the portal, followed by the analysis of their interaction with the portal over time in terms of frequency, devices, time of the month and day, etc. Finally, consumers’ motivations for registering and visiting the portal, their evaluation of the portal in terms of its design, features, and information, as well as their satisfaction with the portal is presented.
4.1. Process of Portal Design and Testing
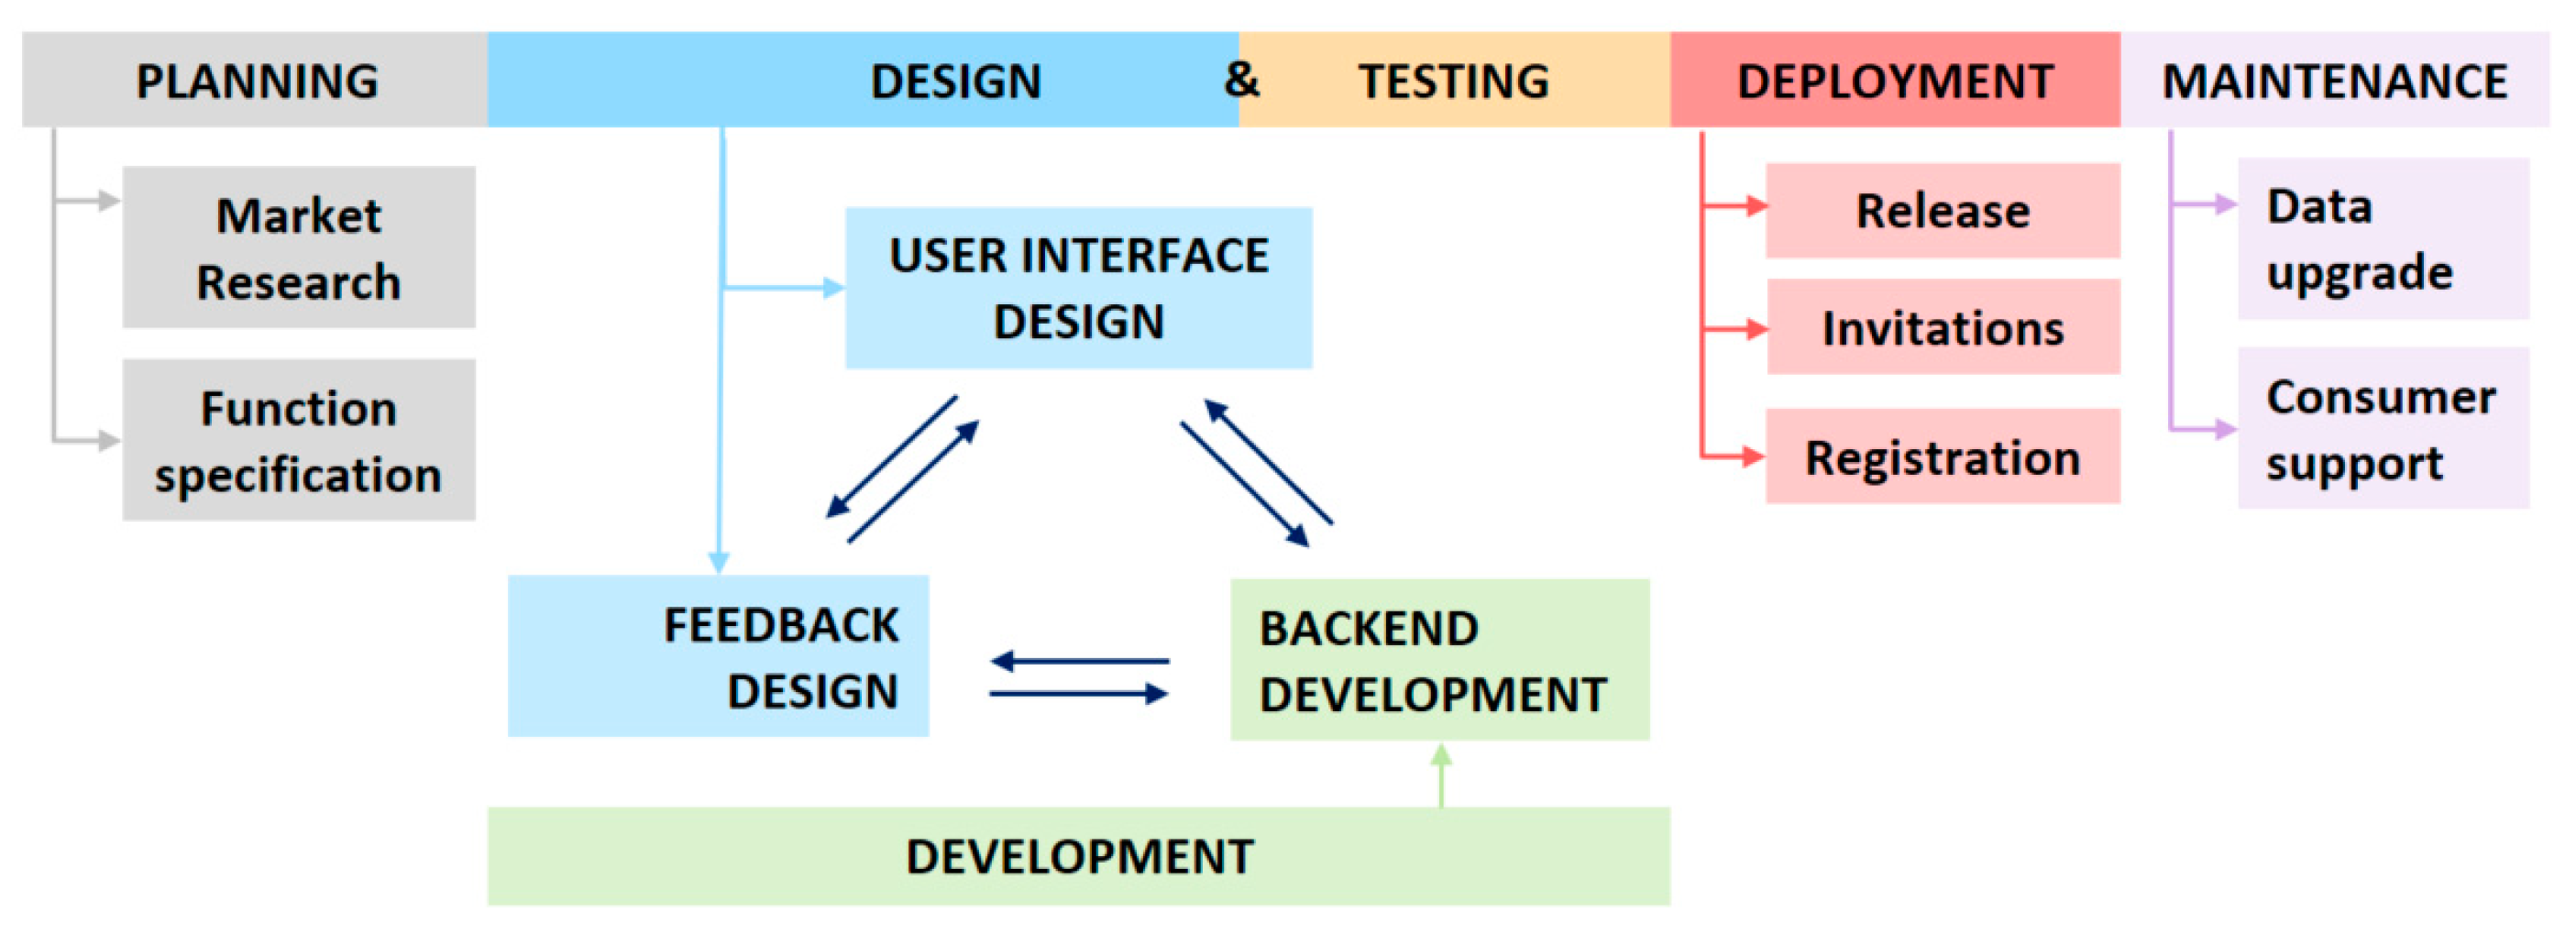
The design process of the portal began even before the selection of consumers and lasted for several months. It went through several phases and some of them were iterative. The design process involved developers, domain experts, and a group of test users. As
Figure 4 shows, the process included planning, the design development, and testing of the portal, its deployment and the onboarding of consumers, and later maintenance while the portal was in use.
The planning step included analyzing the available portals, such as Wattics, OPower, Arvato, FiWare, Solar, TIko, Eliq, and WePower, and defining the portal specifications (users, data and analytics, tabs, servers, data sources, registration, formats, APIs, filters, statistics, integration, etc.) needed to develop and test and later deploy the portal. The specifications were updated with each design iteration.
The design of the portal focused on the user interface design and various types of selected feedback (
Section 4.1.1 and
Section 4.1.2). The development of the portal was conducted in parallel with the design phase. Testing prior to the release of the portal was performed by a group of users from different areas (domain experts, developers and UX experts, and test users: a group of people who were not part of the team and had no connection to the portal). The tests included: functional and usability tests (navigation, scrolling, buttons, registration and login procedures, roles, fill-in forms), interface and compatibility tests (browsers, devices, font and grammar, logo, visuals, cookies and legal notices), database, performance, and security tests (integration of heterogeneous sources, transition from dummy to real-time data, daily scheduler, exceptions, user validations), etc.
Once the portal was designed, developed, and validated during testing, the next step was to engage the consumers, leading to the first official release of the portal in December. Invitations to consumers were sent via email and included a brief description of the portal and its available features, followed by a link to the portal with brief instructions on how to register and log in. During the registration process, some consumers asked for help via email or phone because they were having difficulty registering with the portal: either because of technical problems with their browser or because they simply could not find their metering point identifier information, even though we had intentionally included it in the invitations. After a successful registration, consumers tested the portal over the next 7 months.
The design of the portal did not end with the onboarding of the portal but continued through the maintenance phase. During the time consumers were interacting with the portal, it was necessary to review data daily, make changes, etc., as well as provide support to consumers via email or phone if they needed help understanding the data, logging into the portal, etc.
4.1.1. Feedback Design
During the test period, different types of consumption feedback were delivered to consumers through one of the three channels (
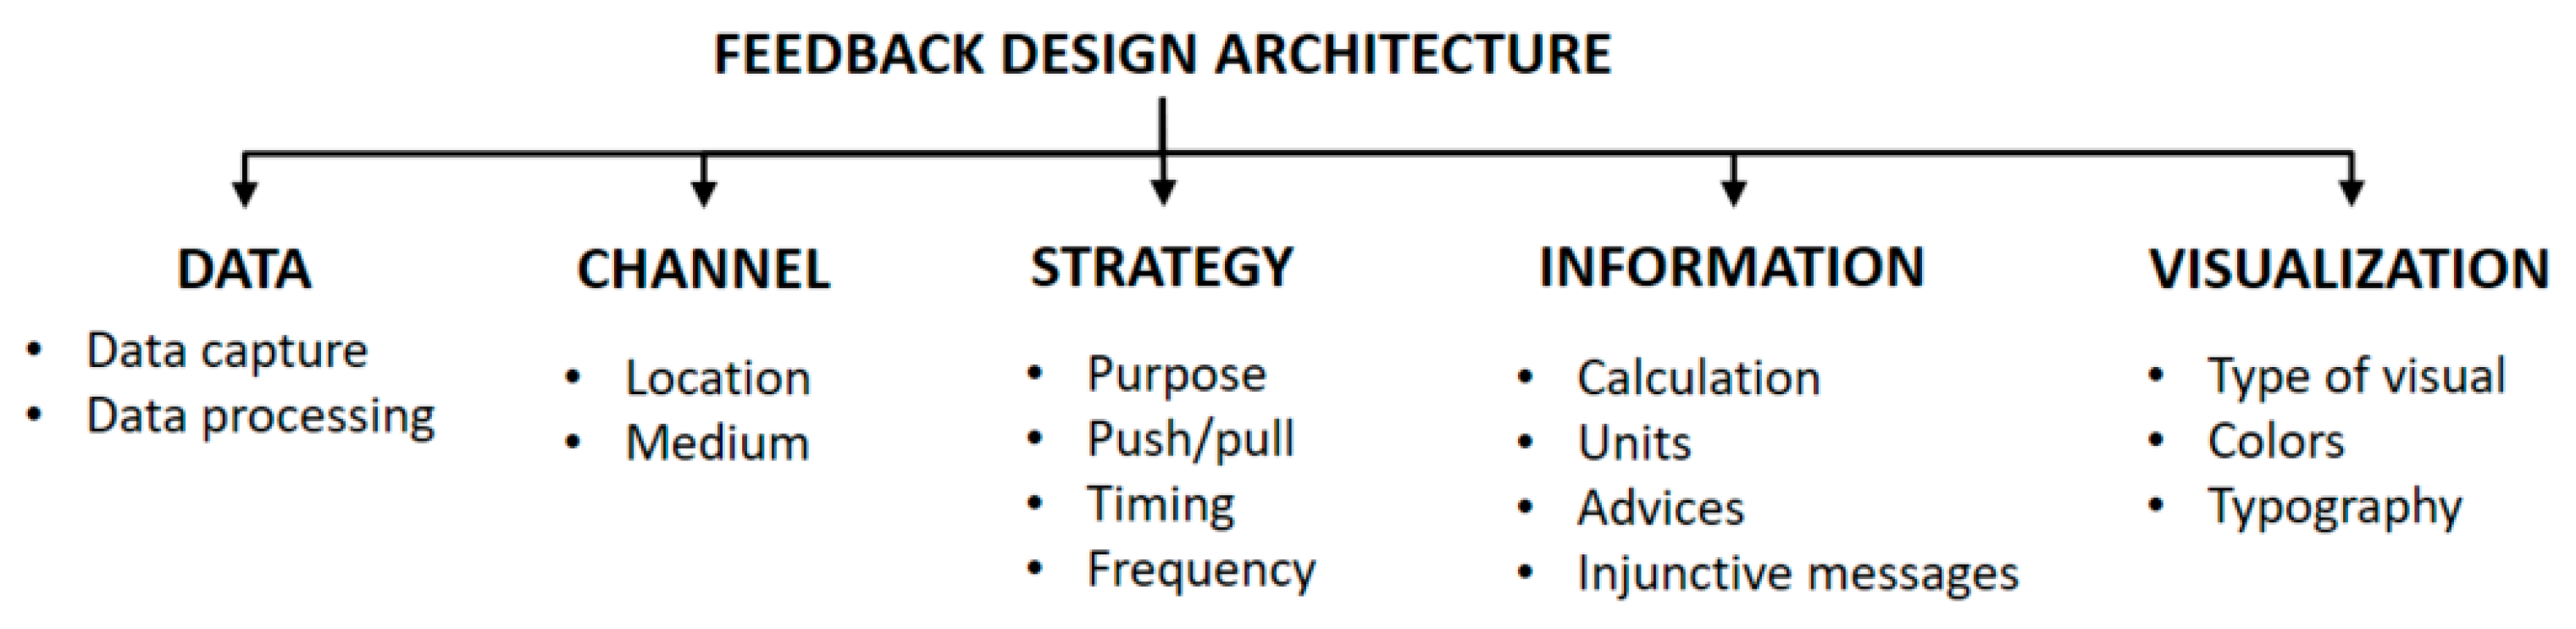
Figure 3). The design of the feedback messages followed the architecture shown in
Figure 5 in terms of data selection, channel, strategy, information, and visualization. An overview of the types of feedback is provided below, while the design of the user interface in which the consumption feedback is embedded is described in more detail in
Section 4.1.2.
- a.
(Near) real-time and historical consumption feedback
Consumption feedback was provided to consumers through the portal in a pull process, allowing consumers to filter (request) data for the desired time period. This information helped consumers analyze and understand their energy consumption in different granulations: 15-minute, hourly, daily, monthly.
For water consumption, data per shower was available, allowing consumers to retrieve information on the average water temperature, number of showers, average shower volume, average shower duration, and average amount of energy used to heat their water.
Self/peer comparison feedback was generated for both electricity and water consumption and delivered through two channels: the portal and email. The portal offered the self/peer comparison for electricity consumption only. The self-comparison was available in the form of a comparison of the monthly electricity consumption for the selected period with the monthly electricity consumption for the same period in the previous year in kWh. The comparison was available separately for each of the two tariffs. The peer-comparison feedback on the portal provided a comparison of the household’s monthly electricity consumption with the average monthly electricity consumption of the households in the group and showed the consumption difference as a%.
At the beginning of each month, consumers received an email with the monthly information about their average weekly consumption (for electricity and water) in the previous month compared to the rest of the consumers in the group. The information was accompanied by a prompt: an emoticon that showed a sad face if the household’s weekly consumption was higher than the household’s average weekly consumption, or a happy face if it was lower. Consumers who participated in the energy community groups also received feedback on the community comparison.
- c.
Savings tips, forum, short surveys
The portal’s home page served as a “news feed” that included messages such as savings tips, short surveys with results, and other publications that stimulated discussion among consumers in the form of comments, likes, and ratings. Consumers who were not part of the energy community did not have the opportunity to comment or read other comments. They could only access the content of the publication. The content was prepared by subject matter experts and made available to consumers through the portal. The purpose of this type of feedback was to motivate consumers to reduce their electricity consumption. The saving tips were published once a month, every month, and the topic depended on the month. For example, in December, we published a savings tip on how to decorate the Christmas tree in a less energy-consuming way. The text was accompanied by a picture that related to the information we provided.
We provided community feedback to members of the energy community groups. The data used here is electricity and water telemetry data summarized (kWh or liters) at the weekly level for the entire energy community and compared to the total weekly consumption of the non-energy community. Calculations were performed each Monday for the previous week and added to the portal. The information was accompanied by an encouraging message: an emoticon that showed a sad face if the weekly consumption of the energy community was higher than the weekly consumption of the non-energy community group, or a happy face if it was lower.
The smart shower heads provide ambient feedback to the consumers at the point of consumption. The device is equipped with an LED indicator, which changes color depending on the water consumed during showering: green, blue, purple, and red flashing. Thresholds were set based on baseline data for all consumers. The lights on the shower heads were turned on in early March 2021. To test the effectiveness of the ambient feedback, the smart shower head lights were only turned on for about half of the consumers (
Section 3).
4.1.2. User Interface Design
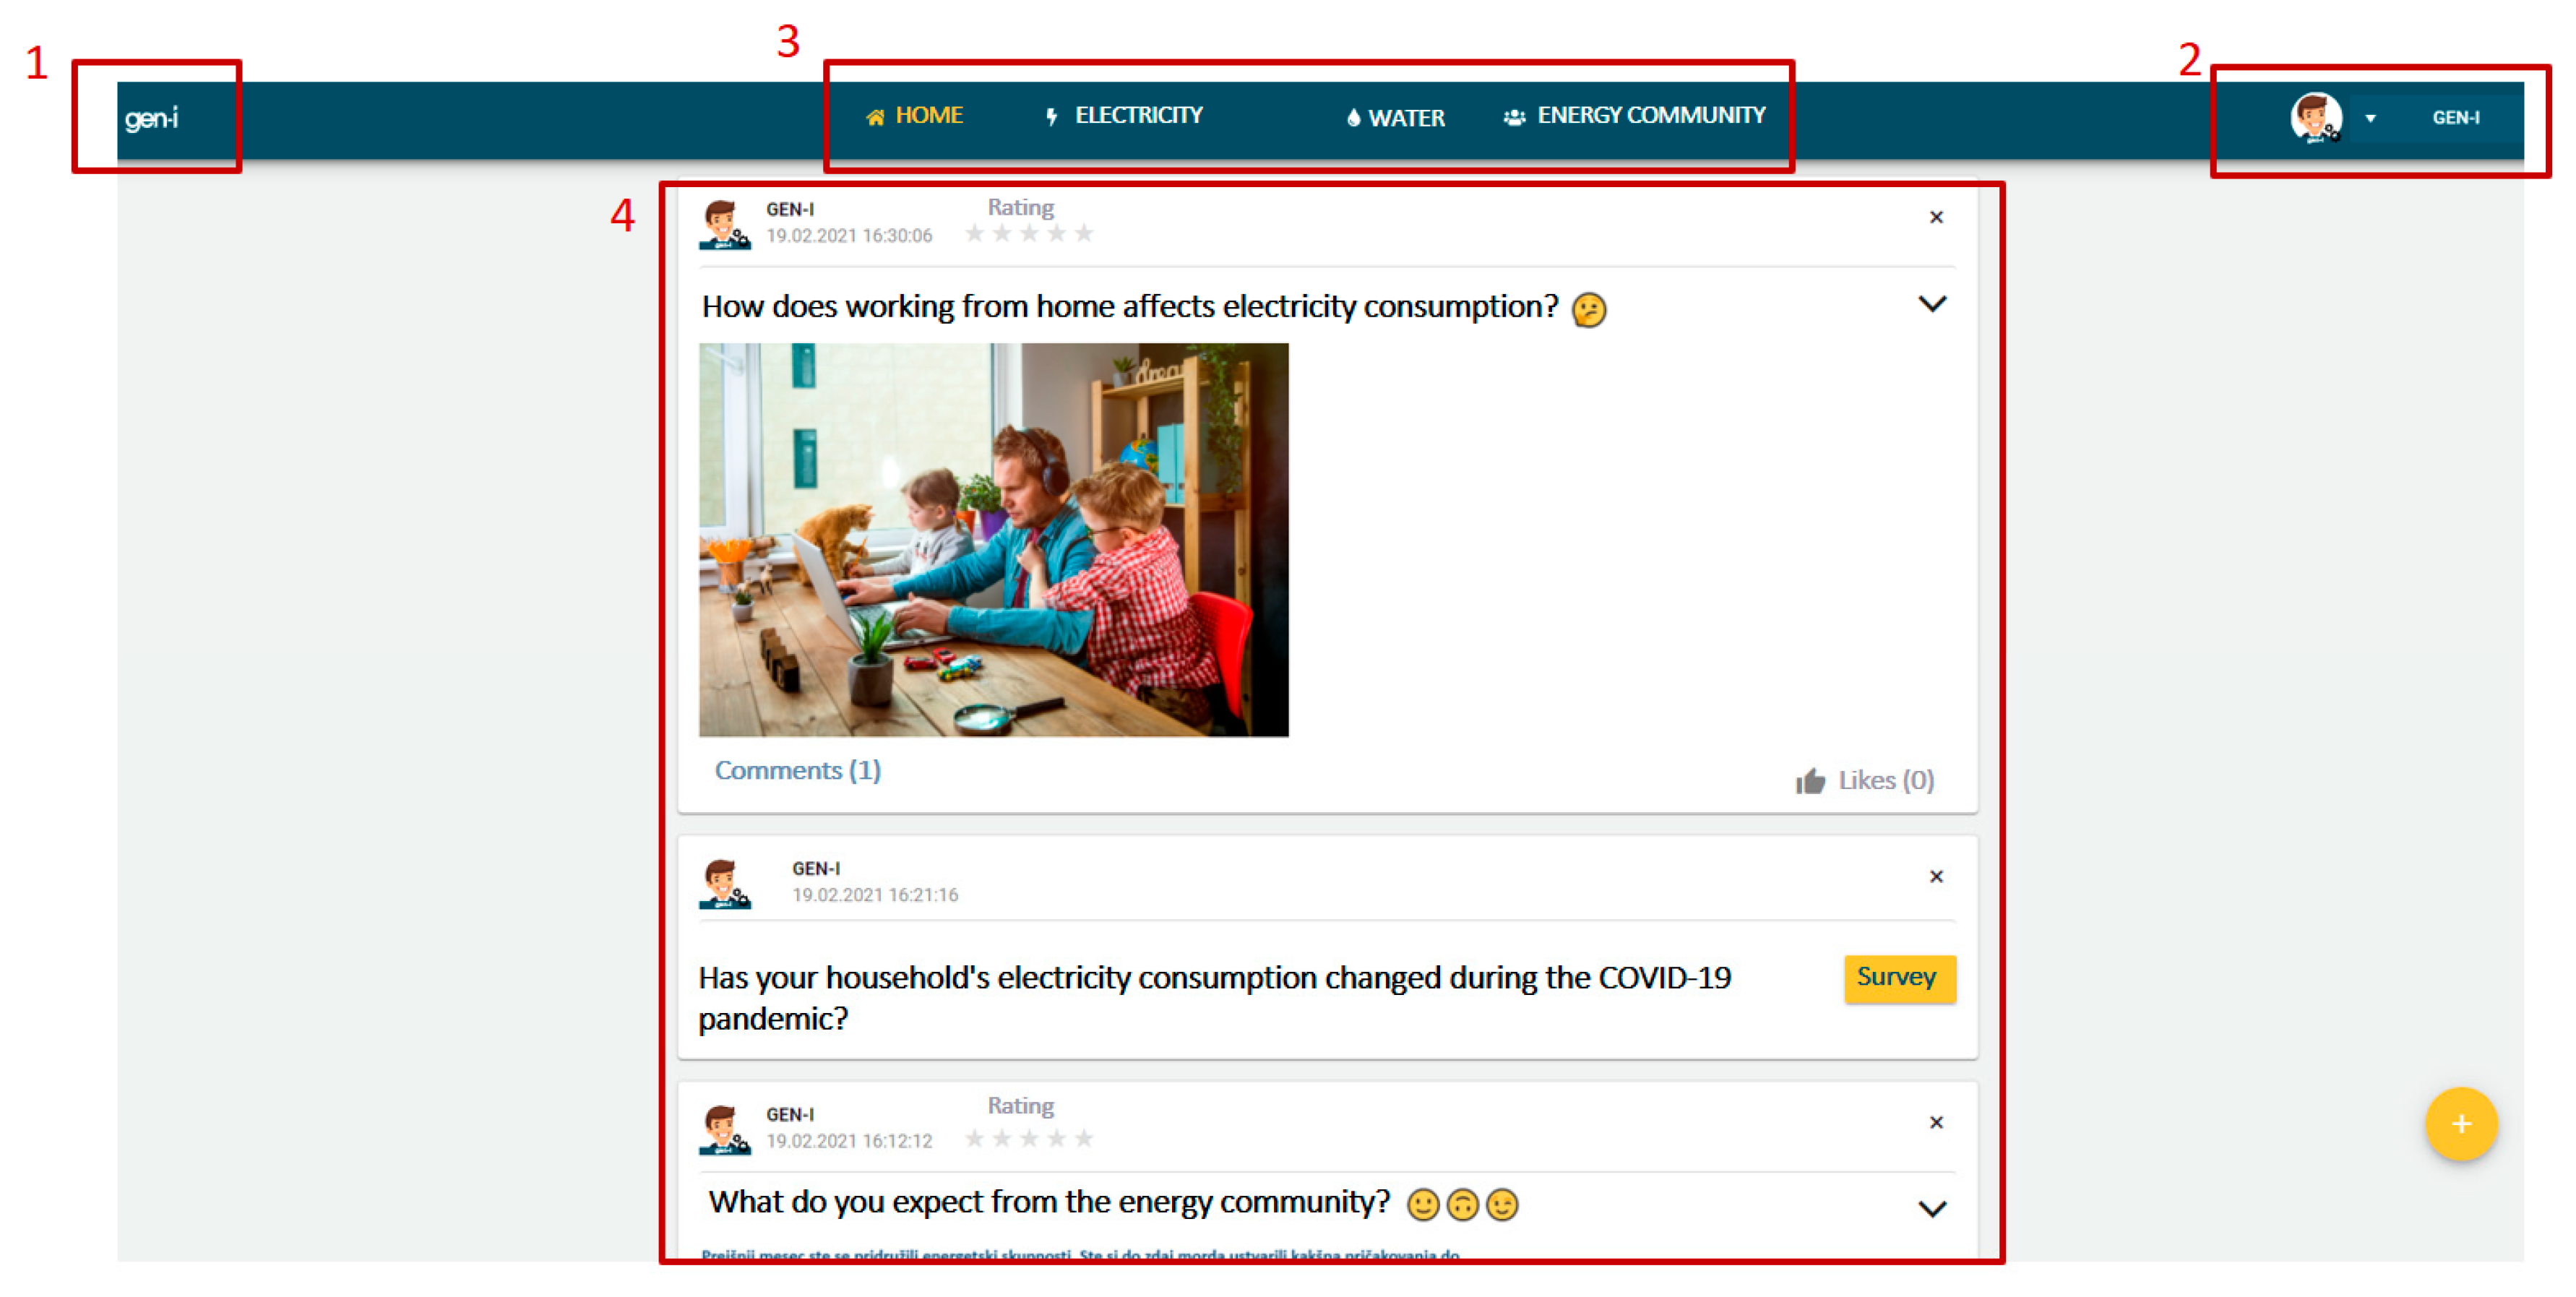
Consumers have access to data and feedback through a graphical user interface that we developed through an iterative process. Following UCD concepts, we focused on consumer needs when designing the portal. Both developers and professionals were involved in this phase. In the end, a group of test users was also included for final testing. An example of the user interface (Home tab and layout) is presented in
Figure 6.
The content of the portal is divided into six tabs: Home, Electricity, Water, Energy Community, My Profile, and Contact. After logging in, consumers begin on the Home tab, where they access the news feeds (
Figure 6). On each of the tabs, content is presented in a specific way. The layout defines the sections of the user interface and includes the header with the logo (
Figure 6, item 1), navigation to the rest of the tabs with menu buttons (
Figure 6, item 3), the Settings or Profile area (
Figure 6, item 2), and the main area where the content is presented (
Figure 6, item 4). The content in our case is the type of consumption feedback, followed by some basic text or descriptions.
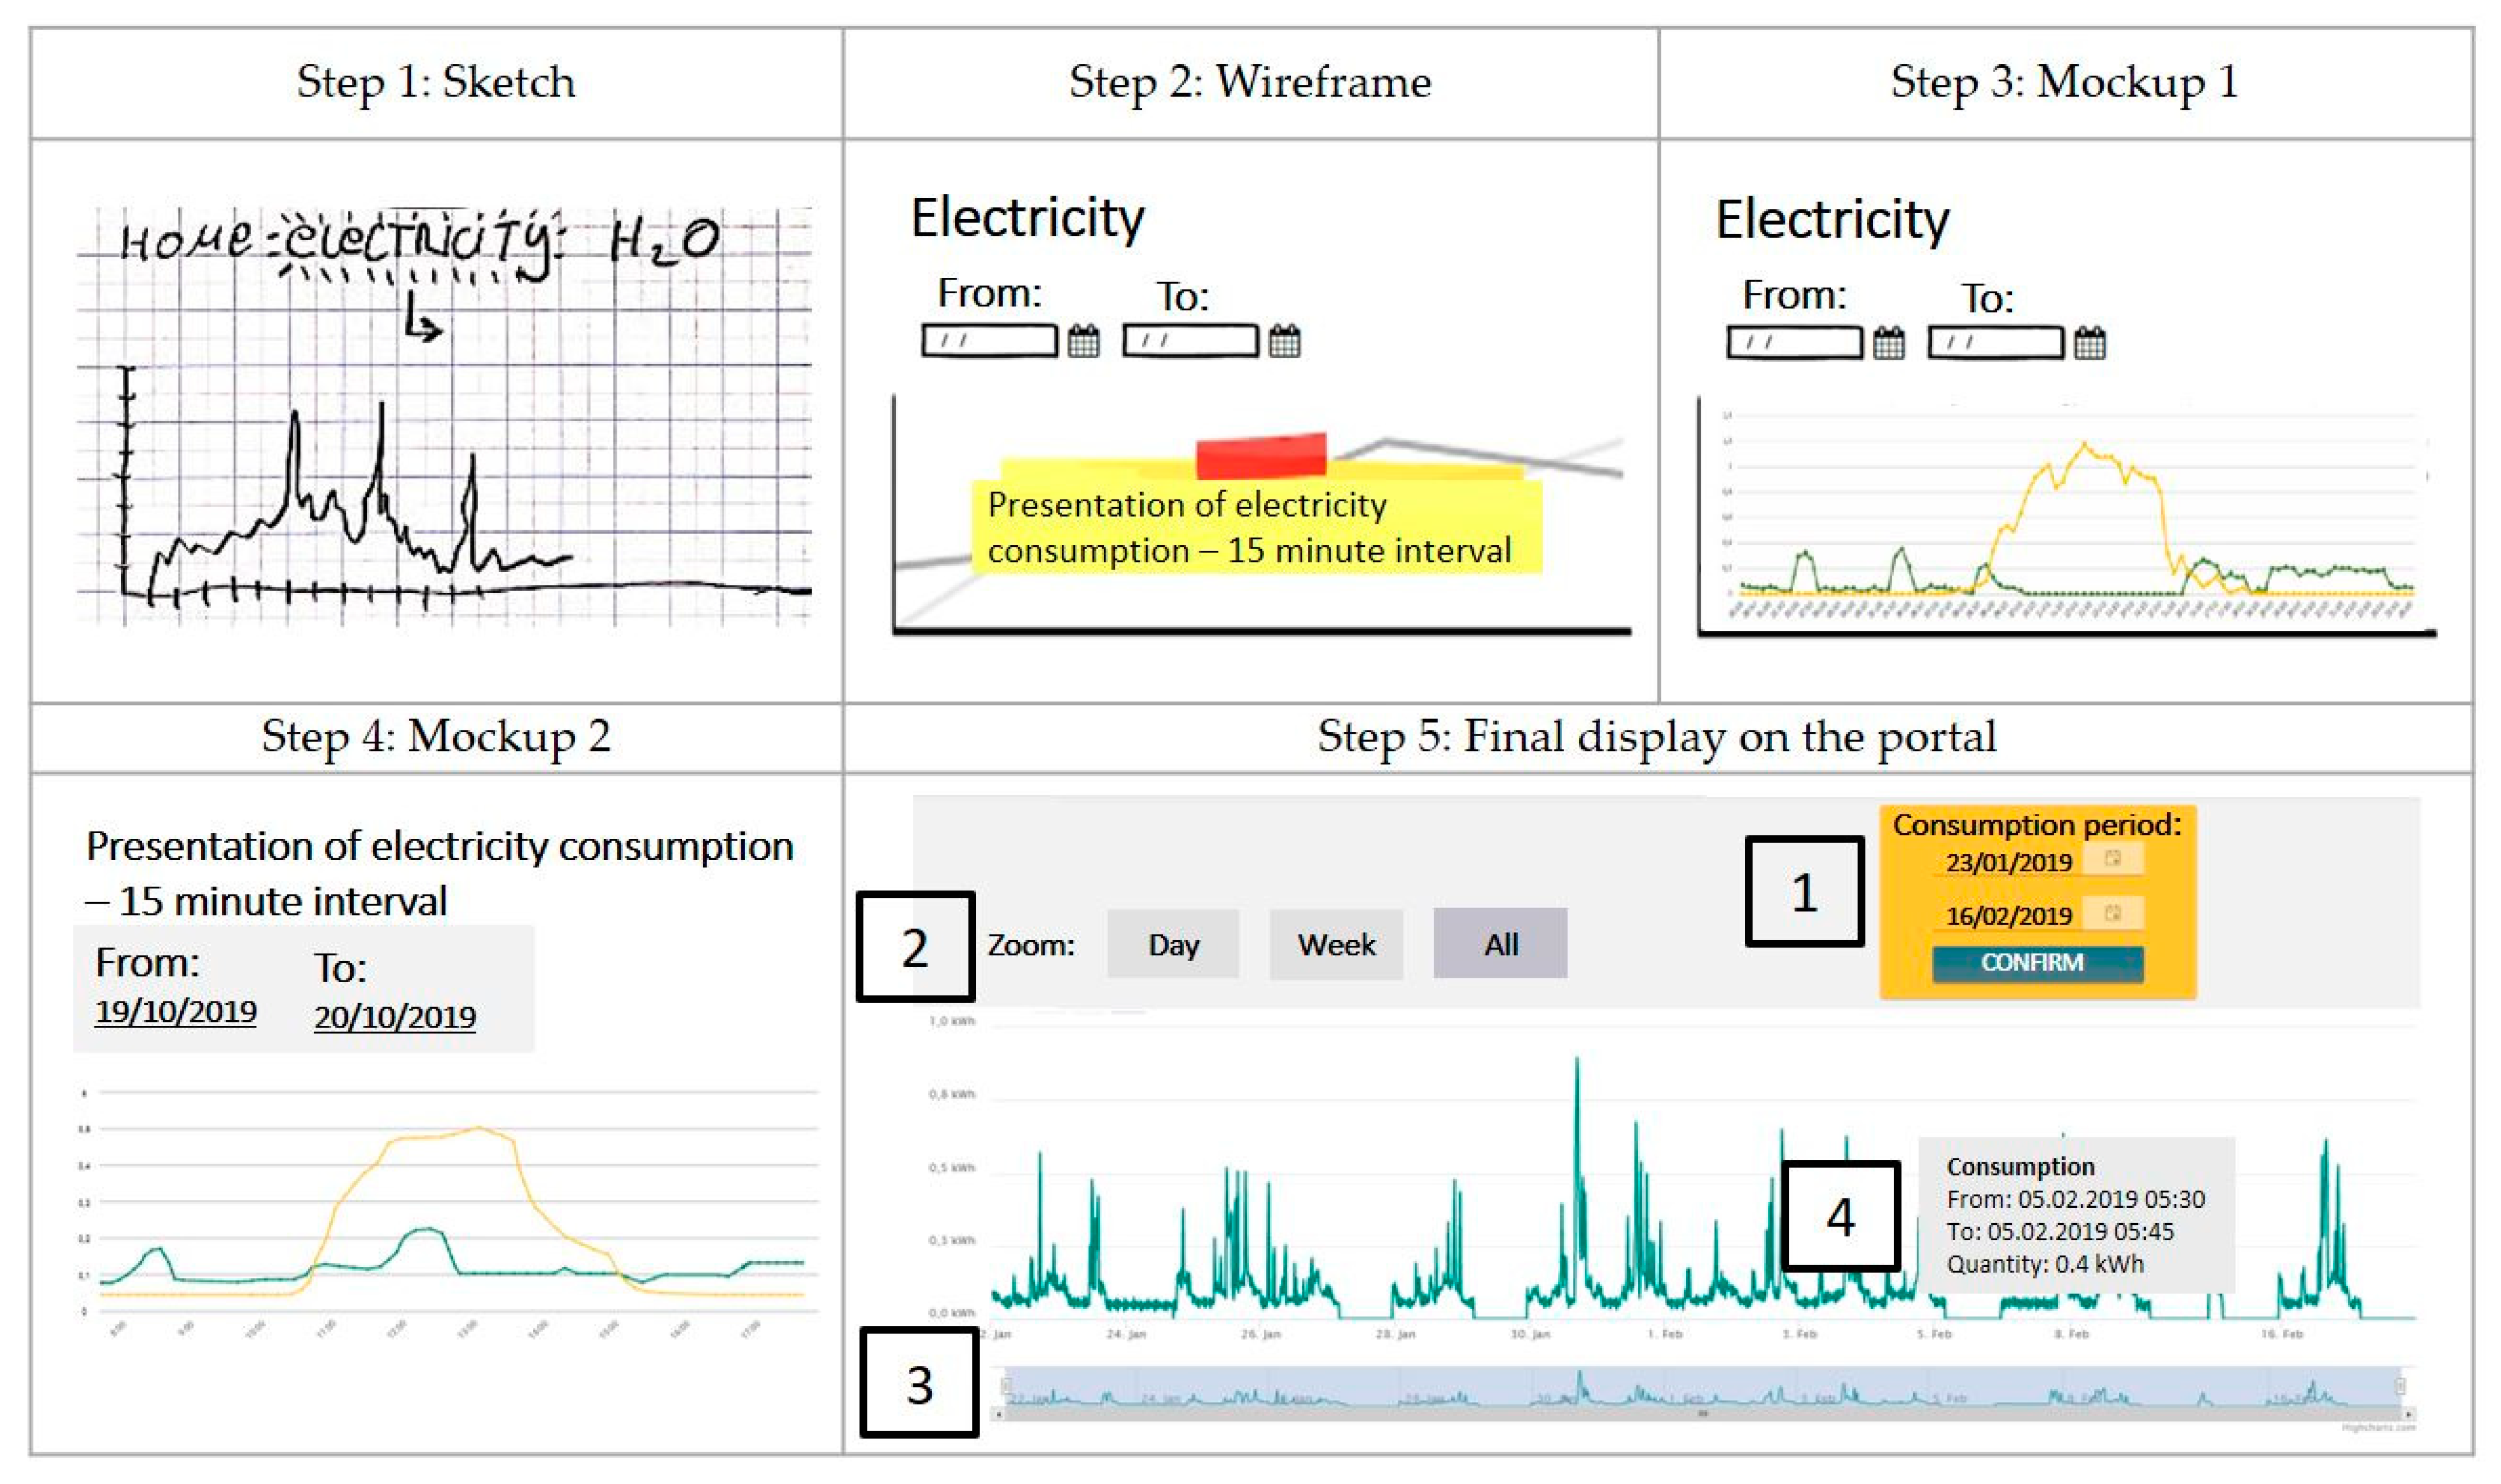
Figure 7 shows the process of designing the electricity consumption feedback (near real time). First, sketches were made on paper (
Figure 7, step 1), followed by several steps from wireframes to mockups (
Figure 7, steps 2–5), involving experts from the field and from UX to add text, images, colors, buttons, etc. The consumption is displayed with a continuous graph showing the real-time electricity consumption at 15-minute intervals. The following options have been added to the chart to facilitate the use of this feedback: simple filter in the form of a calendar where consumers can select the time frame for the data displayed (
Figure 7, Step 5, Item 1), buttons to quickly zoom in to previously set levels such as the current day or week (
Figure 7, Step 5, Item 2), a slider to easily change the time frame (
Figure 7, Step 5, Item 3) and display additional data such as the time frame and consumption on the screen (
Figure 7, Step 5, Item 4).
In the final step, we adopted the identity requirements of the utility: the corporate identity of the legacy portal that consumers were already using. Based on this, we selected the logo, color scheme, and typography, and created icons to make navigating the portal intuitive and as easy as possible for the users. As more and more consumers use mobile devices or tablets, the portal was designed to adapt to different screen resolutions. As consumers are divided into groups, they are given the rights of that group in terms of the data or tabs they can access.
4.2. The Process of Onboarding
After completing the consumer selection process described in
Section 3, 285 consumers were invited to the portal. In total, 245 of them registered on the portal and 234 visited the portal at least once. For a further analysis, we will use the data from the 234 registered consumers who visited the portal at least once.
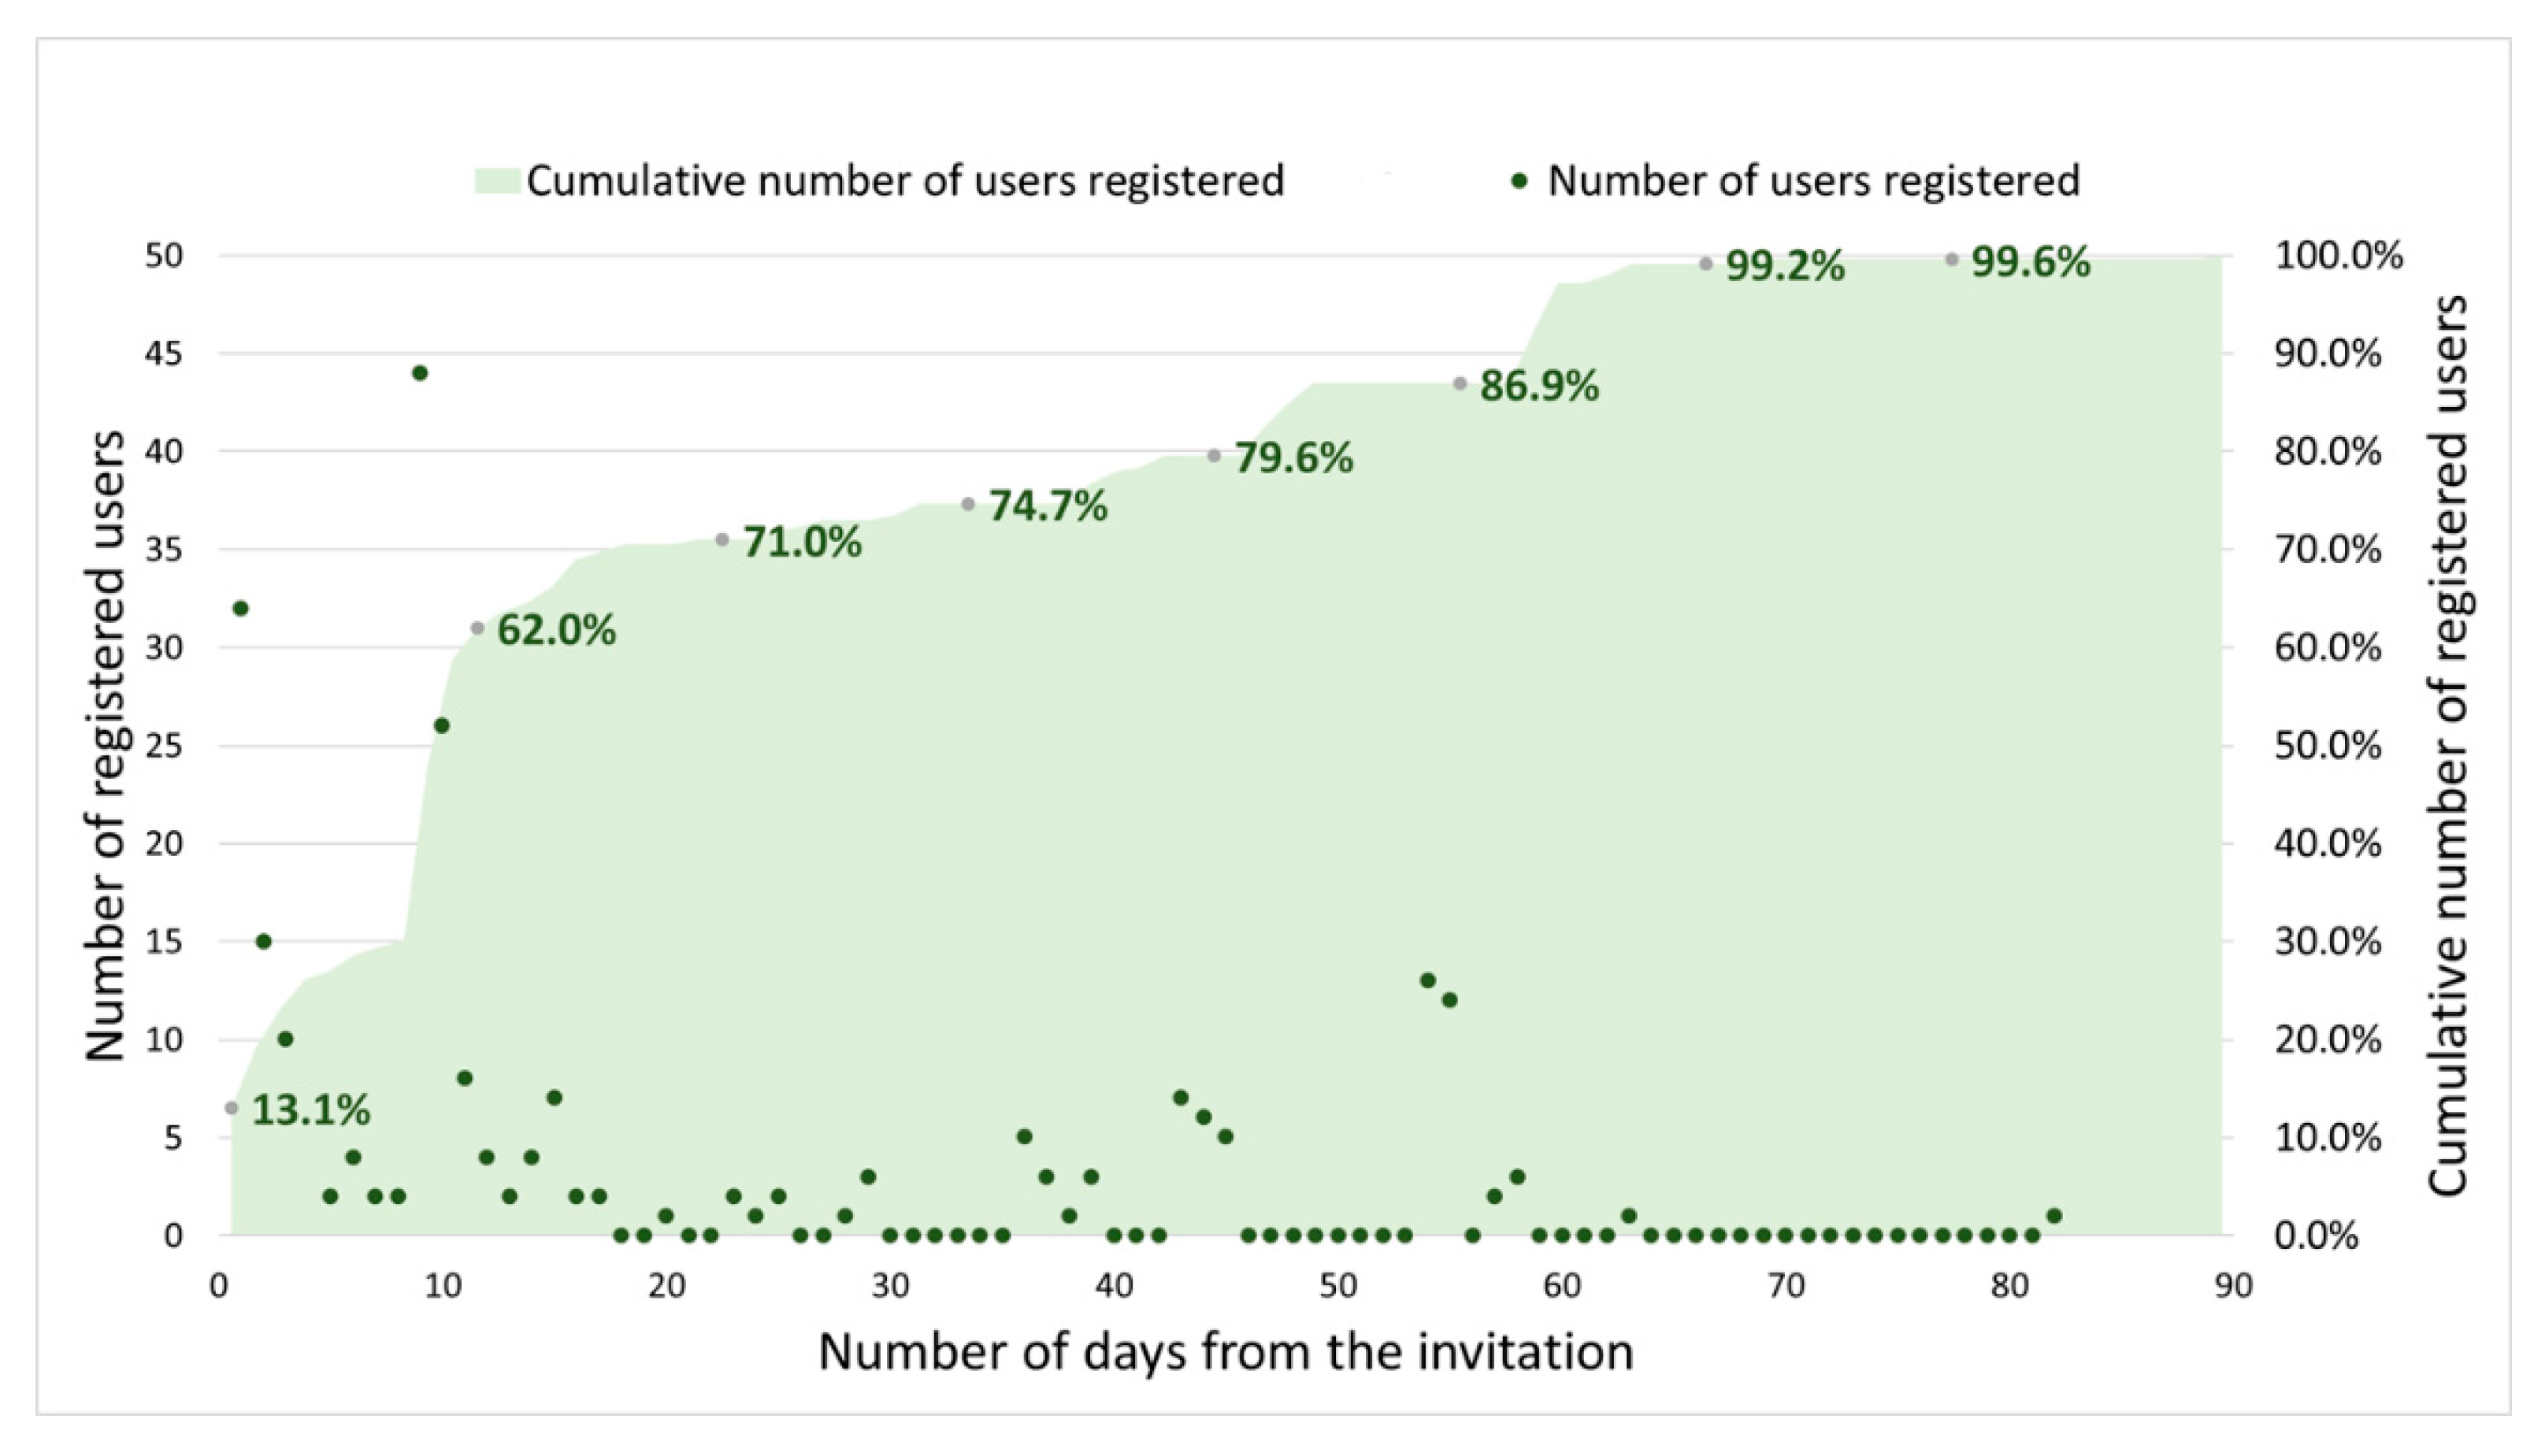
The portal is designed in such a way that users must first log in to the portal using their email address and the metering point ID as identification. The results show that about 86% (a total of 245 out of 285 invited consumers) registered on the portal. The time it took consumers to register on the portal is shown in
Figure 8, where the
y-axis represents the number of consumers registered (cumulative number [%] is presented on the
y-axis) and the
x-axis represents the number of days between the invitation being sent and the number of days it took consumers to respond. The time it took consumers to register on the portal ranged from 0 to 81 days. The median of the response time is 9 days. For example, 13% of the registered consumers registered the same day as the invitation, while 62% of the registered consumers took up to 10 days, etc.
Once registration was complete, the consumers were able to visit the portal. Of the 245 registered consumers, 11 consumers never visited the portal, while 234 consumers visited the portal at least once. About 95% of the consumers (224 out of 234) visited the portal for the first time within 5 minutes of their registration, while the remaining 10 consumers (5%) took more than 5 minutes. The majority of the consumers, 71% in total, used a PC when they first visited the portal, while the rest (29%) used mobile devices.
4.3. Interaction with the Portal over Time
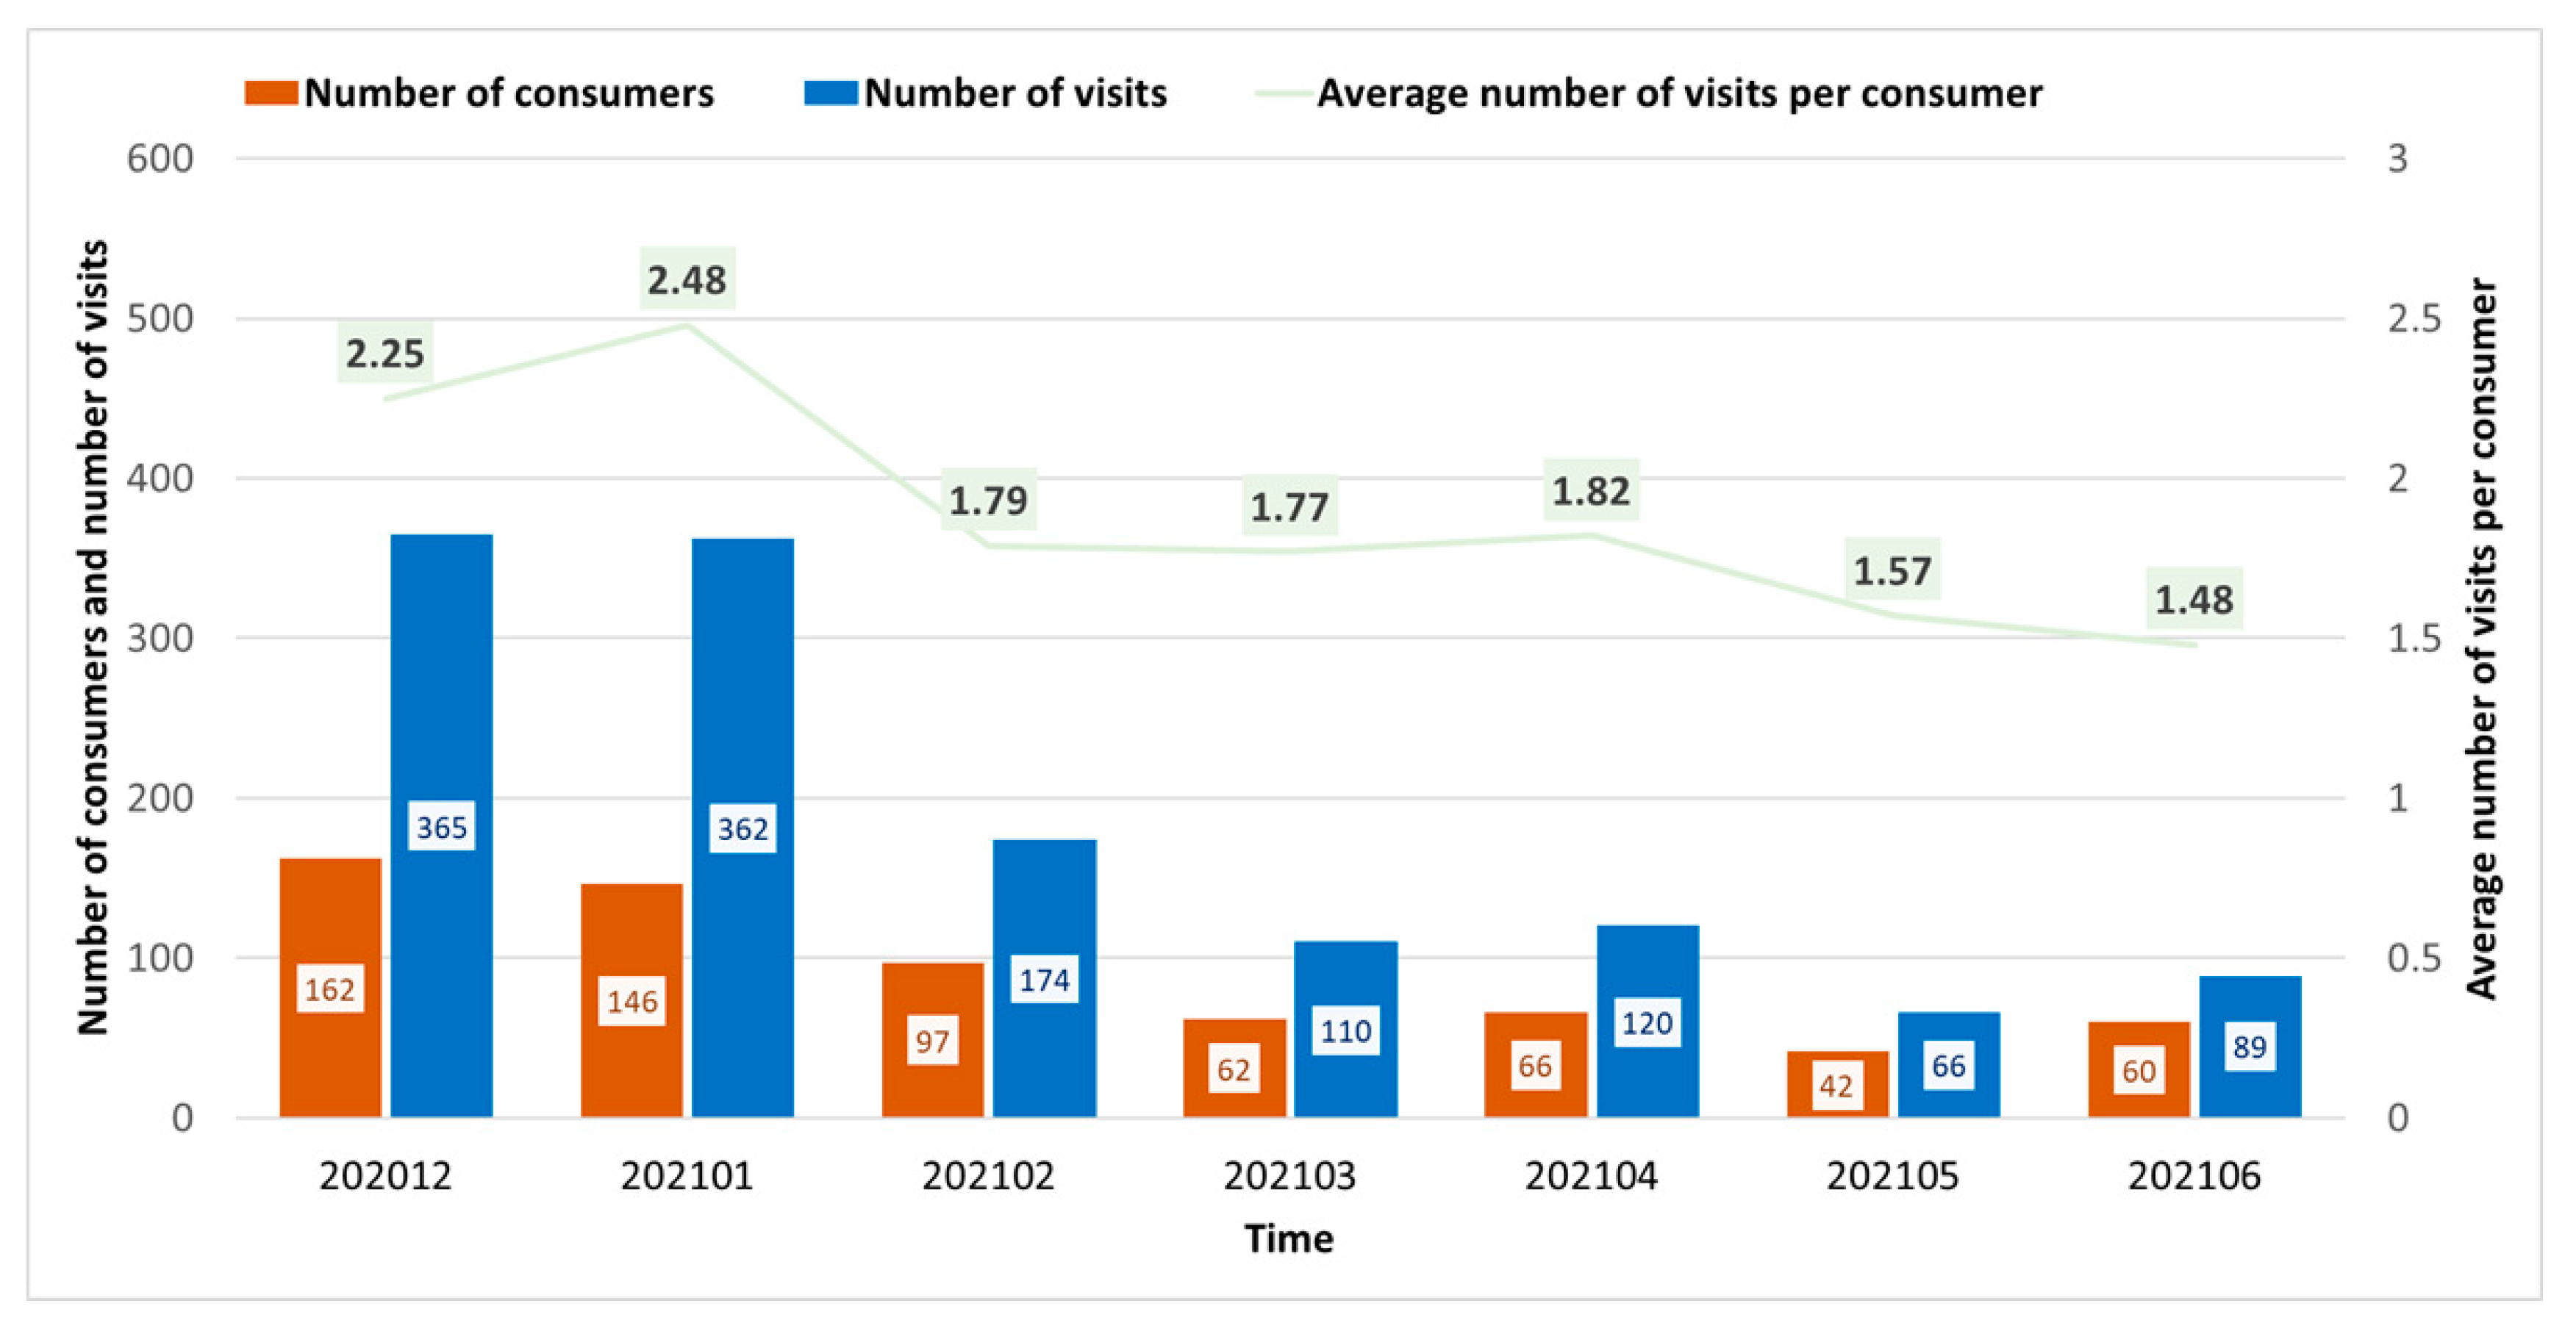
The data collected during the consumers’ interactions with the portal include information on the date and time of each consumer’s portal visits and the device they used. The results show that within 7 months of an interaction with the portal, the total number of visits by the 234 registered consumers who visited the portal at least once was 1286 times, which is equivalent to 5.5 visits per consumer over the entire period.
Figure 9 presents the total number of consumers and visits (
y-axis) over time (
x-axis) for each month during the testing period. Additionally, the average number of portal visits per consumer for each month is calculated and presented on a secondary axis. The data shows that the average number of visits per consumer ranges from 1.48 to 2.48, with an average of 1.9 visits per month.
The results show that the number of portal visits varies by the device: about 70% of all visits were from a PC, while 30% were from a mobile device. The number of portal visits varied by the time of day/week/month as well. The data shows increased activity on the portal in the middle of the month as well as at the beginning of the week.
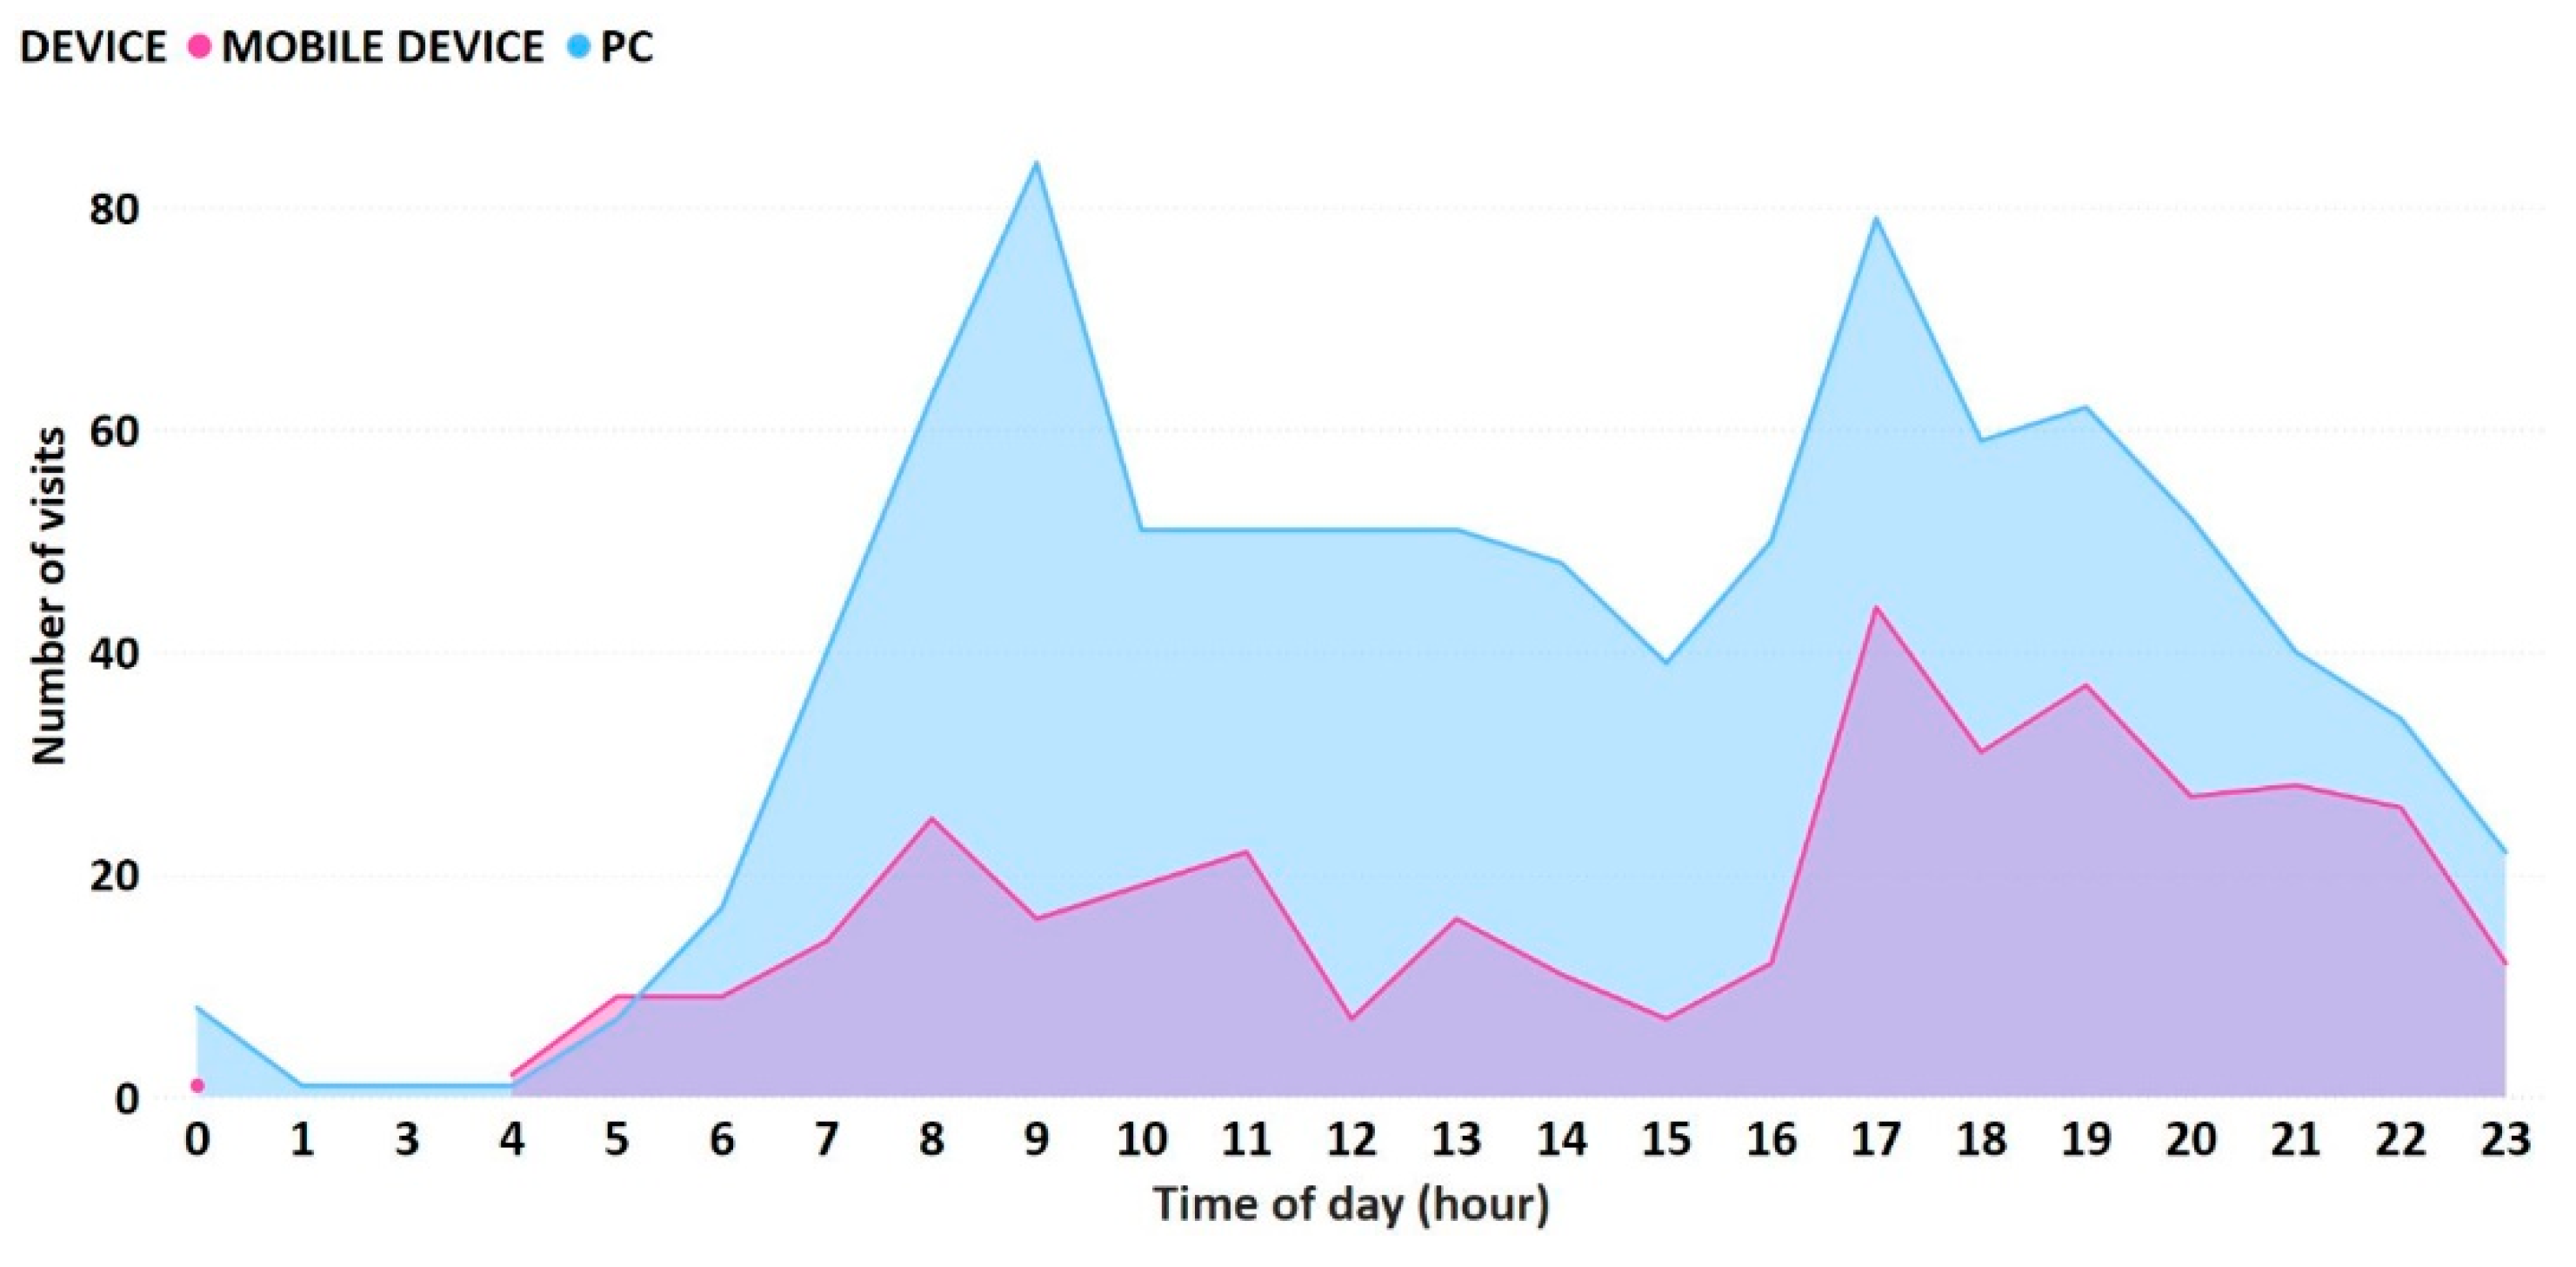
Figure 10 presents the total number of visits (
y-axis) for each hour of the day (
x-axis) during the testing period.
Figure 10 also highlights the peaks in the morning (7–9 am) and evening (5–8 pm) and shows the difference between the devices (mobile/ PC) used.
The data collected also includes information on which tabs consumers visited and how much time they spent on each tab.
Table 1 shows the total number and average number of visits, the number of consumers who visited the portal, and the total time and average amount of time spent on each tab, with Other containing the remaining tabs: y Profile, Contact, and Energy Community.
The data show that all consumers (N = 234) spent a total of 5533 minutes on the portal, which is approximately 23.65 minutes per consumer. On a monthly basis, i.e., during the 7 months of the test period, each consumer spent 3.4 min per month on the portal. The time consumers spent on each tab shows that consumers spent the most time on the Water tab, followed by the Electricity and Home tabs. At 2.05 min per session, the “Water” tab was the one with the longest time spent per session among the tabs.
4.4. Communication Outside the Portal
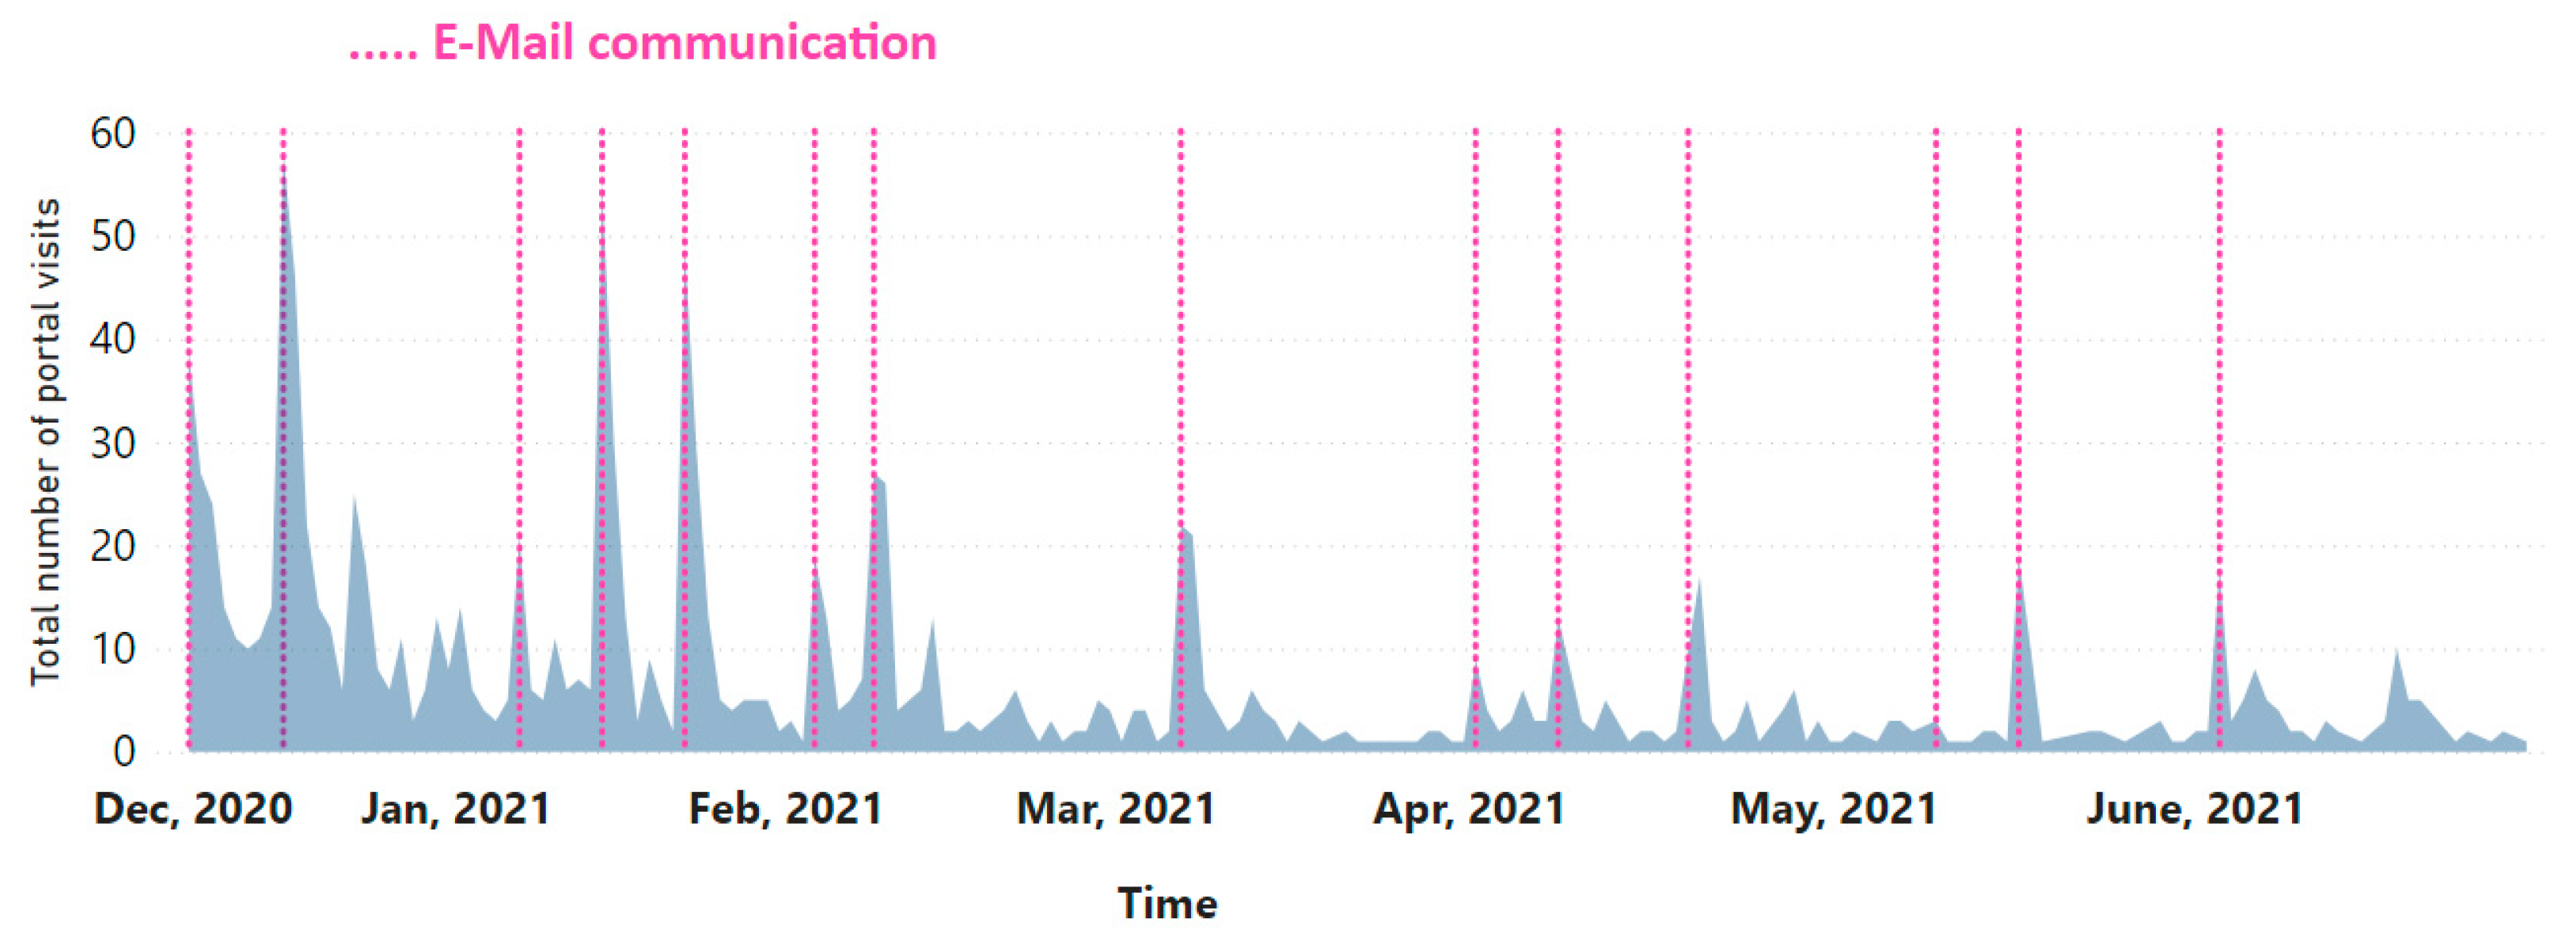
During the 7-month trial period, consumers received information about consumption via the portal, email, and ambient device. A comparison of the number of portal visits with the exact dates consumers were contacted via email on shows that there was an increased activity on the portal during this period.
Figure 11 shows the comparison: the total number of visits (
y-axis) over time (
x-axis) versus individual emails, e.g., invitations and reminders, notifications, and newsletters. The data shows that additional communication with consumers outside the portal increases activity (the number of visits) on the portal.
As explained in the Methodology chapter (on the testing period), half of the consumers also received feedback on their consumption through the ambient device, specifically the eco-feedback. To test whether the ambient device motivated consumers to visit the portal more frequently, we compared the activity on the portal (the number of visits, duration of visits to the Water tab, etc.) before and after the lights were turned on for the group. We also compared the activity on the portal for both groups (ambient feedback lights on or off). There was no evidence which suggested that turning on the lights on the ambient device increased the activity on the portal.
4.5. Evaluation of the Portal
The test phase of the portal was concluded with a follow-up survey. A total of 214 out of 234 registered consumers who had visited the portal at least once also completed the survey. The questions were not mandatory. Through the survey, we explored consumers’ motivations for registering and visiting the portal, evaluated the portal in terms of its design, features, and information, and examined the consumer satisfaction with the portal.
At the beginning of the survey, consumers also answered some questions about their Internet habits to compare them with their interaction with the portal. The questions consumers answered here related to (1) what type of Internet user they are, (2) what digital device they frequently use to access online information, (3) how often they check their personal email, and (4) how often they talk to those closest to them (family and friends) about their electricity use.
The data show (N = 212) that 64% of consumers describe themselves as advanced, 15% as average, and 19% as basic Internet users in terms of news, weather, email, social networking, online payments, and health applications, with the remaining 2% declining to answer. About 57% of consumers prefer mobile devices to access online information, while the remaining 43% prefer a PC, tablet, or laptop. About 81% of consumers check their personal email several times a day, while the rest check their personal email every morning (6%), every evening (7%), every other day (2%), weekly (2%), monthly (0.5%), and 1.5% declined to answer. Consumers talk about their electricity consumption once a month (34%), once in three months (25%), once a year (17%), once a week (12%), never (7%), or every day (2%), while 3% did not want to give an answer.
4.5.1. Motivation for Joining and Visiting the Portal
Consumers already had access to their current utility’s portal with electricity data, where they could get monthly feedback. Part of the survey was devoted to the consumers’ motivations for joining and visiting this portal. The four multiple-choice questions asked (1) what motivated them to register on the portal, (2) what motivated them to log on to the portal, (3) how often they thought they visited the portal compared to other web applications they already used, and finally, (4) why they did not use the portal more often.
The data show (N = 158) that about 43% signed up to the portal due to a “desire for information” about water consumption, about 38% for electricity consumption, and the remaining 19% were split between “advice on how to save energy”, “interest in the energy community and communication with other members”, or the consumers did not specify. Regarding the motivation to visit the portal, the results (N = 154) show that about 55% visited the portal out of curiosity about their energy consumption, 27% were motivated by the email they received, and the remaining 18% were distributed among the “colored lights on the smart shower head”, “content and information on the portal”, or consumers simply did not want to respond.
About 35% (N = 157) of consumers said they visit the portal “very rarely” compared to other web applications they use regularly, 27% answered “rarely”, 33% answered “occasionally”, 3% answered “often”, and 1% answered “very often”, while the remaining 1% did not answer this question. When asked why they do not visit the portal more often, 49.5% (N = 176) answered “the portal is interesting, but I did not have time to use it”, 20% of consumers would “rather use a mobile application than a web portal”, 15% “do not feel like communicating with other members of the energy community”, for 7% of consumers “the information on the portal was not informative enough”, for 5% the “design of the portal is not user-friendly enough”, and for 3.5% of consumers, “topics such as energy and energy saving are not interesting”. Each consumer had the possibility to choose several answers.
4.5.2. Evaluation of the Portal
A part of the questions was dedicated to the evaluation of the portal. There were three questions asking consumers to (1) evaluate the design of the portal, (2) indicate what they liked most about the portal, and (3) what and how they think the portal could be improved, through open-ended questions.
The consumers were asked to rate the design of the portal using a Likert scale. There were five areas they could rate from 1 (low rating) to 5 (best rating). The data shows that a total of 153 consumers rated the design with an average score of 3.98. For example, they rated the colors used as 3.97, the comprehensibility of the information provided as 3.95, the ease of use as 4.00, the layout of the portal as 3.85, and the usefulness of the information provided as 4.12.
A total of 152 consumers indicated what they liked most about the portal in the first open-ended question. The results show that consumers described the portal as “something new as well as simple and easy to use”. They mentioned several things they liked best about the portal and beyond, such as:
- ▪
Access to various data in one place;
- ▪
Understandable visualizations;
- ▪
The ability to check one’s consumption immediately after use;
- ▪
Monthly newsletter with emojis and tips;
- ▪
The color-changing smart shower head.
When asked what could be improved about the portal, consumers (N = 152) mentioned a more frequent data synchronization, the possibility to add additional objects (e.g., apartments, vacation homes, etc.) and additional devices (e.g., heat pumps, home appliances, etc.), and merging this portal into one solution to have all data (e.g., bills) in one place. Some of them also suggested a mobile application and additional features, such as: a comparison with the average consumption of a Slovenian household, data export, better summary of the most important data, calculator, linking of data with actual bill costs, and instant alerts.
4.5.3. Features and Information
Since the portal provides different types of feedback to consumers, consumers’ opinions and perceptions of the information they receive are important to the study. Therefore, one section of the questionnaire was dedicated to the features and information provided by the portal. It consisted of four questions related to (1) what information on the portal they found most interesting or (2) easiest to understand and (3) what information they missed, followed by (4) a list of examples of the features that might interest them.
The results show that 46% (N = 156) of consumers found “water usage data” to be the most interesting information, followed by “electricity usage data” at 31%, “energy saving tips” at 18.5%, “energy community information” at 2.5%, and the remaining 2% of the consumers did not provide a response. Similarly, 56% (N = 156) of the consumers chose the information on the “Water” tab as easier to understand, followed by the information on the “Electricity” tab with 34.5%, and 9.5% of the consumers gave no response.
The question about what information they miss on the portal was open-ended. A total of 152 consumers answered this question. The results show that consumers miss information such as: the real-time data (no delays), consumption costs in euros (bills), connection status of the device (smart meter) that is the source of the data on the portal, disaggregated consumption by appliances, smart saving tips, graphs and analysis, etc.
In the survey, we asked consumers to select from a list of sample features that might interest them using a multiple-choice question to get their opinion. Some 146 consumers responded. The feature “Get an alert when electricity consumption increases at a certain time” was the most common choice with 31% of responses, followed by “Get insight into electricity consumption separately by the appliances they use” with 27.5%, “Calculator for the savings a solar installation could bring” with 19.5%, “Get an alert when they reach the desired electricity consumption goal” with 16%, and “I do not know/I do not want to answer” with the remaining 6%.
4.5.4. Consumer Satisfaction and Experience with the Portal
The consumers were asked to rate (1) their overall satisfaction with the portal, (2) their experience with the portal, (3) the efficiency of the portal, and (4) their activities on the portal or in the study itself, the energy saving tips, and the short surveys on the portal using a Likert scale (1–5). Each section contained several statements that they could rate, some of which were worded positively and others negatively.
About 150 consumers rated the statements, and the data show that consumers agreed much more with the positive statements than the negative ones. For example, consumers are satisfied with the portal overall (3.97/5), it met their needs (3.55/5), and they would still prefer this portal over comparable portals (3.46/5); the portal met their expectations, saved them time searching for information (3.65/5), and they do not need an additional portal (3.30/5). Consumers (N = 105) also followed the energy saving tips published on the portal (2.36/5), the saving tips seem helpful to them (4.22/5), they participated in the short surveys (3.30/5), and they would like to see such content published on the portal in the future (3.71/5).
Negatively worded statements, on the other hand, were rated lower, for example: The portal was an unpleasant experience for the consumers (1.49/5) and they would rather use another portal of this type (2.01/5), it took them many clicks to get to the information they wanted (2.00/5), they made many wrong clicks (1.99/5), they spent a lot of time correcting the wrong clicks (1.77/5), the functionalities offered by the portal did not meet the consumers’ needs (1.91/5), and they would need a portal with more functionalities (2.69/5).
5. Discussion
This research was intended to improve our understanding of the process of developing an energy portal and introducing the portal to consumers. More specifically, the portal was developed with the aim of providing different types of consumption feedback to 234 Slovenian households, accompanied by monthly newsletters and ambient feedback. The process of the consumers’ introduction to the portal, their interaction with the portal over time, the impact of communication with consumers outside the portal on activities on the portal, and their evaluation of the portal were the focus of this research.
In selecting consumers, 10,000 randomly selected consumers were invited to participate in the study. Based on the fact that (a) a total of 10.82% of the target population was willing to participate in the study, which is in line with the literature [
30] and (b) the sample corresponds to the general population of Slovenia, we can say that there is a positive attitude in Slovenian households towards a participation in such studies. Since the participating households were existing customers who already had a trusting relationship with the utility, this could also contribute to their willingness to participate.
The number of consumers who registered on the portal was quite high (86%) and the median of the response time was 9 days. About 80% of consumers were motivated to register on the portal by their “desire for information on water and electricity consumption.” In addition, about 95% of all initial visits occurred within 5 minutes of completing the registration. All of this indicates that these consumers were curious and wanted to try the portal and check their consumption.
Consumers tested the portal for 7 months and visited it about 1.9 times per month during that time. According to the data, the average number of visits per consumer per month ranged from 1.48 to 2.48.
Figure 9 indicates that the average number of visits per consumer was about 2.25 in the first month of testing and climbed to 2.48 in the second month. However, it started to fall in the following months, from month three to month seven. Considering that 80% of these consumers said that they check their personal email several times a day, we can say that visiting the portal twice a month is not very frequent. Consumers also confirm this, as 95% of them think that they use the portal very rarely, rarely, or occasionally compared to other applications they already use. In addition, about 50% of consumers think that the portal is interesting, but they did not have time to use it. They mostly visited the portal in the middle of the month. The data also showed an increased activity on the portal during two peak times: in the morning (7–9 am) and in the evening (5–8 pm). This could be related to the fact that consumers receive or pay their electricity bills around this time of the month. It could also be related to the fact that more than half of consumers (59% overall) talk about electricity in their immediate environment once a month or once every three months, which is likely related to the frequency of billing. The fact that the average number of visits was higher at first and then began to decline, as well as the fact that consumers talk about electricity, say, once a month on average, could indicate that consumers were excited to try the portal at first and then continued with their usual behavior of checking it once a month. This is also in line with the literature that consumer engagement is a challenging process. There is still work to be done in order to maintain the active consumers’ participation over time.
The survey found that about 55% of consumers visited the portal out of curiosity about their energy use, but it also showed that 27% of consumers were motivated by the email (monthly newsletter) they received. The portal data also confirmed this, showing that an additional communication with consumers outside of the portal via email or other communication channels increased the activity (number of visits) on the portal because it also served as a reminder. With respect to the ambient lighting, there was no evidence that turning on the ambient lighting increased the activity on the portal. This could be related to the fact that the purpose of ambient devices is to provide eco-feedback to consumers at the point of consumption. Consumers can either follow or ignore the eco-feedback at the time of the shower use, but there is no need to follow up on the consumption data on the portal.
As more consumers use mobile devices or tablets, the portal was designed to adapt to different screen resolutions so that consumers can visit the portal using both mobile devices and PCs. The results show that the number of portal visits varied by the time of day depending on the device. For visits made using PCs,
Figure 10 shows two peaks (morning and evening), however, for visits made using a mobile device, there is only one peak (evening peak). The survey data showed that consumers (57%) prefer to use mobile devices to access online information. This is likely why consumers suggest mobile app design as an improvement. However, most visits, 70% overall, were from PCs, while only 30% were from mobile devices. This could be due to the smaller screen that mobile devices offer and the limitations regarding how much data could be displayed at the same time. For example, the number of electricity consumption data records (15-minute interval) for one day is 96, so consumers may have experienced difficulties accessing data for a longer period of time through mobile devices.
Consumers spent an average of 3.4 minutes per month on the portal. Among the tabs, the Water tab led the way with 2.05 minutes per session. The survey data showed that consumers found the water usage data the most interesting and easiest to understand. As described in the literature, electricity is invisible and intangible, but water is more tangible. This could be the reason why, on average, consumers lingered longer on the Water tab.
About 64% of consumers described themselves as advanced Internet users in terms of news, weather, email, social networks, online payments, and health applications, meaning that they already use different types of portals and applications and evaluated the portal based on these experiences. The portal was described as “something new, simple and easy to use” with understandable visualizations. They liked the color-changing smart shower head with the ability to check their consumption right after use, and also liked having access to different data in one place. Some of the consumers also pointed out the monthly newsletter with emojis that reminded them to sign up for the portal, as well as the savings tips they liked about the portal.
The consumers rated the design of the portal with an average score of 3.97/5 in terms of the colors used, the comprehensibility of the information provided, the ease of use, the layout of the portal, and the usefulness of the information provided. Overall, the consumers were satisfied with the portal (3.97/5), it met their requirements (3.55/5), and they would still prefer this portal over comparable portals (3.46/5). The portal met their expectations, saved their time in searching for information (3.65/5), and they did not need an additional portal (3.30/5). On the other hand, consumers missed information such as: the real-time data (no delays), consumption costs in euros (bills), connection status of the device (smart meter) that is the source of the data on the portal, disaggregated consumption by device, more articles, smart saving tips, graphs, and analysis. Therefore, it is necessary to invest in data quality and infrastructure, enable more frequent data synchronization, and better manage the problems with missing data.
To explore possible future enhancements to the portal, consumers were asked to choose between the additional features of the portal in which they would be interested. If given the option to add additional features to the portal, one-third would choose to receive alerts when their consumption increases, and another third would choose to receive insights into their consumption by device. Consumers are curious, willing to participate, and want to try new things. They are trying to better understand their own consumption, but there is still work to be done to enable consumers to play a more active and participatory role.
6. Conclusions
The results and findings are based on both consumers’ perception and opinions, collected through the survey and actual measurements from their interaction with the portal. The results show that there is a positive attitude in Slovenian households towards a participation in such studies. Having a trusting relationship with the utility may have additionally contributed to the consumers’ willingness to participate. The consumers were curious and wanted to try the portal and check their consumption. However, consumer engagement and maintaining the active consumers’ participation over time remain a challenging process that requires more research.
This paper offers nation-wide insights of a field study from several perspectives, as it presents: an example of utility service development; the iterative development of UI; the establishment of a monitoring system to measure the consumers’ interaction with the portal; an example of ambient feedback integration: the smart shower head, with the possibility of a further upgrade with more sensors; a technical perspective of heterogeneous data sources integration and anonymization: electricity, water, and survey. Future work includes a further scale up on more households as well as the design of new energy services for energy communities, demand reduction, and demand response services and their introduction to the consumers, based on the know-how gained with this study.


