
Non-Invasive Diagnosis of Liver Fibrosis in Chronic Hepatitis C using Mathematical Modeling and Simulation


1
Department of Mathematics, Columbus State University, 4225 University Avenue, Columbus, GA 31907, USA
2
TSYS School of Computer Science, Columbus State University, 4225 University Avenue, Columbus, GA 31907, USA
*
Author to whom correspondence should be addressed.
Electronics 2022, 11(8), 1260; https://doi.org/10.3390/electronics11081260
Submission received: 7 March 2022
/
Revised: 13 April 2022
/
Accepted: 13 April 2022
/
Published: 16 April 2022
(This article belongs to the Special Issue Modeling and Simulation Methods: Recent Advances and Applications)
Abstract
:Hepatitis C is a viral infection (HCV) that causes liver inflammation, and it was found that it affects over 170 million people around the world, with Egypt having the highest rate in the world. Unfortunately, serial liver biopsies, which can be invasive, expensive, risky, and inconvenient to patients, are typically used for the diagnosis of liver fibrosis progression. This study presents the development, validation, and evaluation of a prediction mathematical model for non-invasive diagnosis of liver fibrosis in chronic HCV. The proposed model in this article uses a set of nonlinear ordinary differential equations as its core and divides the population into six groups: Susceptible, Treatment, Responder, Non-Responder, Cured, and Fibrosis. The validation approach involved the implementation of two equivalent simulation models that examine the proposed process from different perspectives. A system dynamics model was developed to understand the nonlinear behavior of the diagnosis process over time. The system dynamics model was then transformed to an equivalent agent-based model to examine the system at the individual level. The numerical analysis and simulation results indicate that the earlier the HCV treatment is implemented, the larger the group of people who will become responders, and less people will develop complications such as fibrosis.
1. Introduction
Hepatitis C virus (HCV) is the infectious agent causing hepatitis C, with HCV-infected people serving as reservoirs for transmission to others. HCV infection affects over 170 million people across the world, leading to more than 350,000 deaths per year [1]. In the United States (U.S.), approximately 2.7–3.9 million people are living with HCV infections, and HCV is an increasing cause of morbidity and mortality. Two 20th century events appear to be liable for this increase: the widespread availability of injectable therapies and, therefore, the illicit use of injectable drugs [2].
Hepatitis C is increasing within the U.S., particularly among younger adults, and 4 out of 10 people are unaware that they are infected; hence, they do not receive care or treatment. According to the Centers for Disease Control and Prevention (CDC), people born between 1945 and 1965 account for 27% of all HCV infections and 73% of HCV-related mortality cases in the U.S. They are also at the greatest risk for hepatocellular carcinoma and other HCV-related liver disease.
HCV testing is an initiative toward improving health outcomes for persons infected with HCV. The CDC [3] used to recommend one-time screening for people born during 1945–1965. However, the CDC now recommends that every adult should be screened at least once in their lifetime. People who are at increased risk for contracting HCV infections and should be tested include injection or intranasal drug users, people with a history of blood transfusion before July 1992, people born to an HCV-infected mother, patients on chronic hemodialysis, incarcerated people, pregnant women, and people being stuck by a needle or having multiple sexual partners. Currently, there is no vaccine available for HCV infection [3], but since 2013, there have been highly effective, well-tolerated cures for hepatitis C. Hepatitis C can also be prevented by avoiding behaviors that can spread the disease, especially by injecting drugs [3].
HCV cases in Egypt present a major issue from public health and economic perspectives as Egypt has the highest occurrence rates of hepatitis C (13–15%) worldwide [4]. HCV infection can evolve into chronic hepatitis and lead to serious complications, such as the development of cirrhosis and liver cancer in some patients [5]. However, in the case of a highly variable rate of fibrosis progression, it is extremely difficult or impossible to identify who may develop cirrhosis and when. The Cleveland Clinic estimates that cirrhosis affects approximately 20% of those with chronic liver inflammations caused by hepatitis C within 20 years of acquisition. The major factors related to worsening fibrosis scores are: older age at the time of contracting the virus, male gender, and excessive alcohol use.
HCV treatment is difficult and expensive. The most typical efforts for the diagnosis of liver fibrosis progression include serial liver biopsies [6]. These biopsies are invasive, risky, inconvenient to patients, and expensive [7]. Currently, several non-invasive techniques, such as serum markers and imaging, are available as alternatives for liver biopsy, but they have not yet been validated [8,9].
Therefore, the objective of this study is to develop, validate, and evaluate a prediction mathematical model of non-invasive diagnosis that can replace the invasive techniques and serve as a measurement for the progression of liver fibrosis. The mathematical model is then validated through the implementation of equivalent simulation models that use different techniques to provide further insight into the behavior of the diagnostic process over time. The rest of the paper is organized as follows: Section 2 describes the dataset, mathematical model, and numerical analysis. Section 3 presents the implementation of the two simulation models, while Section 4 discusses the simulation results. Finally, Section 5 presents the conclusions and provides directions for future work.
2. Background
This section provides a background on works related to mathematical and simulation models of infectious, chronic, and epidemic diseases and HCV, focusing on agent-based modeling and system dynamics simulation approaches.
2.1. Mathematical Modeling and Infectious Diseases
Mathematical models of infectious disease transmission can be traced back to the 1900s, when Hamer examined the measles epidemic [10] and Ross explored the relationship between mosquito population levels and the incidence of malaria [11]. Since then, more mathematical models of disease transmission have been developed, such as models of the human immunodeficiency virus (HIV/AIDS) [12], dengue fever [13], and tuberculosis [14].
The World Health Organization (WHO) has exerted efforts to eliminate HCV transmission [15]. Many dynamic HCV transmission models were developed to achieve the WHO’s elimination targets. It was interesting to see that many of the existing models focus on elimination efforts in Europe, the U.S., and Australia, while only two models targeted low- and middle-income countries, such as Vietnam and Pakistan [16,17]. Various modeling approaches were developed to examine transmission dynamics of HCV, including stochastic individual-based and deterministic compartmentalization models [18,19,20,21,22,23,24]. These models utilized basic susceptible-infected (SI) formulations among people who inject drugs. However, sharing of unsterile syringes or injecting paraphernalia has been found as the main HCV transmission mechanism in all models.
With the current absence of an HCV vaccine, the attention has moved to compartmental modeling studies that focus on the evaluation of the impact of a theoretical and conceptual HCV vaccine on virus transmission [15]. For example, immune population stratification was incorporated in the models proposed in [25,26], while the efficacy of harm reduction was considered by other models, such as in [27].
2.2. System Dynamics in Modeling Infectious Diseases
System dynamics (SD) is a modeling and simulation method commonly used to understand the nonlinear behavior of complex systems over time using feedback loops, flows, stocks, time delays, and table functions. It is a mathematical modeling technique and methodology developed originally in the 1950s and has an extensive record of applications to social systems [28,29,30]. SD models consist of a set of differential equations and their components are emphasized on the aggregate level.
System dynamics have been used to model different policies to prevent or reduce the cases of infectious and chronic diseases in the past. Examples of SD applications include models for preventing chronic diseases [31], optimizing an HIV testing program [32], or controlling infectious and endemic diseases [33], among others.
SD has also been used to investigate different cases and risk factors related to HCV. Mateu-Gelabert et al. [34] developed a qualitative SD model to understand the risk of HCV among young people who inject drugs. The SD model helped to identify nonlinear behavior and feedback loop structures as well as processes that could help reduce the spread of HCV, such as harm reduction and HCV treatment. Al-Antari et al. [35] created an SD model that can be used to experiment with different measures to prevent or minimize the occurrence of hepatic fibrosis in HCV patients and to provide the ability to decrease the mortality rate from late-stage cirrhosis, using appropriate treatments. Other efforts developed SD models to understand the progression of the HCV disease and the associated cost in order to help the medical community develop treatment strategies [36].
In our paper, SD has been used as a validation method for our mathematical model. More specifically, the SD model simulates the non-invasive diagnosis and treatment of liver fibrosis in chronic hepatitis C and estimates the number of patients that will be cured or develop complications over time.
2.3. Agent-Based Modeling in Modeling Infectious Diseases
Agent-based modeling (ABM) is used to examine the system at the individual level and investigate the movements of agents with distinct behavior and characteristics in different groups. Modeling agents individually allows for capturing the diversity among agents with different attributes and practices and investigating the dynamic behavior of the system [37]. An ABM model typically consists of three parts:
- Agents, which represent heterogeneous agents (patients) with individual demographic characteristics (i.e., gender and age) and behavior.
- Interactions among agents, which change the agents’ state.
- Environment, which includes the space where agents are located and the rules under which they operate. In this case, the environment is represented as a random network.
In the case of infectious and epidemic disease modeling, ABM has been increasingly used to capture the transmission of a virus among agents with distinct and heterogeneous behavior and characteristics (e.g., age and underlying condition) [38,39,40,41]. ABM has also been used for simulating the transmission of HCV through the interaction of infected and non-infected agents [42], HCV epidemic forecasting among drug injection users [43], evaluating the effectiveness of different treatments in HCV patients [44,45], and optimizing HCV treatments to achieve the goal of eliminating HCV in the future [46].
In our case, we used ABM to validate our mathematical model. More specifically, we developed an ABM model that is equivalent to the SD simulation model and focuses on the representation of the patients at the individual level rather than the group level. The advantage of the ABM model is that it allows one to define characteristics and behavioral rules for each individual agent and further expand the model in the future to identify specific characteristics (i.e., age, gender, medical conditions) and social behaviors (i.e., drug injection) that may affect the outcomes of the diagnosis and treatment of liver fibrosis.
3. Mathematical Modeling of Hepatitis C Detection
This section focuses on the mathematical model and the numerical analysis. We used a dataset from an Egyptian study published on a free public domain [47]. This study includes 1741 hepatitis C virus patients who had hepatitis C virus genotype 4 (HCV-4) and were treated with a combined therapy interferon-Alfa and ribavirin for more than 15 months. HCV-4 is the most common variant of HCV in the Middle East and Africa, and particularly in Egypt. The study demonstrates an HCV liver fibrosis dataset that is labeled and has 31 features. The baseline histological staging class has the following label values: F0, F1, F2, F3, and F4, that represent different prognosis levels of liver fibrosis, as follows: no fibrosis (F0), portal fibrosis (F1), few septa (F2), many septa (F3), and cirrhosis (F4). The study included patients who responded to the treatment (responders) and patients who did not (non-responders).
3.1. Mathematical Model
Mathematical modeling plays an important role in discerning the dynamics of diseases. Here, we have formulated a Susceptible-Infected-Recovered (SIR) mathematical model using nonlinear ordinary differential equations and expanded it to include more states for the treatment of the population after infection. The model can be used for the non-invasive diagnosis of liver fibrosis in chronic hepatitis C. The notations along with their parametric values are shown in Table 1. Some of the parametric values were interpreted from the Egyptian patients’ data and other parametric values were calibrated through MATLAB. A similar SIR model has been used by Shah et al. [48].
The mathematical model of non-invasive diagnosis of liver fibrosis in patients with chronic hepatitis C is shown in Figure 1.
In this model, we divided the entire population into six groups: Susceptible (S), Treatment (T), Responder (R), Non-Responder (NR), Cured (C), and Fibrosis (F). Susceptible (S) people are all the people with hepatitis C who enter with the new recruitment rate, B.
People who can contract the virus belong to the susceptible population and they may enter a treatment group. The susceptible people can enter the treatment group at the rate of . People who enter the treatment group receive treatment and may respond to it. However, there is a portion of the population that will not respond to the treatment. Thus, from the treatment group, some people become responders at the rate of and some people become non-responders at the rate of .
Responders in our model are defined as people with no or minimal fibrosis (F0, F1, F2), while non-responders are defined as people with moderate to severe fibrosis (F3, F4). Responders can be cured at the rate of . Non-responders can develop further complications/fibrosis at the rate of . People who are cured can become re-infected/susceptible at the rate of . People who have more fibrosis/complications can re-enter the treatment group at the rate of . Here, B and describe the new recruitment rate and natural escape rate, respectively. Figure 1 is described by the following system of nonlinear ordinary differential Equations (1):
where (= total population).
Additionally, .
Adding the above set of equations of system (1), we have the following Equation (2):
which implies the Equation (3):
Therefore, the feasible region of the non-invasive diagnosis of liver fibrosis in the chronic HCV model is described by Equation (4):
This system has two equilibrium points: a disease-free equilibrium point and an endemic equilibrium point. The basic reproduction number is denoted as R0. R0 is one of the most powerful tools for analyzing and interpreting endemic models. The basic reproduction number is typically defined as the mean number of secondary infections generated by a single infectious individual over the whole susceptible population. We require R0 to access the stability of the disease-free equilibrium point (E0) and the endemic equilibrium point (E1).
The next-generation matrix method yields a spectral radius of matrix fv−1, where f and v are the Jacobian matrices of F and V evaluated with respect to each compartment at an equilibrium state, as described by Equation (5):
Let .
Therefore,
where F(X) denotes the rate of production of new people who become infected and V(x) represents the rate of transition between states, which yields us the set of Equations (6):
and
and
Here, v is a non-singular matrix. The reproduction numbers and are the spectral radii of and , respectively. The value of = 1.7 and = 0.65576 < 1.
3.2. Numerical Analysis of the Mathematical Model
We conducted a numerical analysis of the mathematical model and observed the trend for 10 years. The purpose of the analysis is to evaluate and validate the prediction mathematical model that can replace the invasive techniques and be used as a measurement for liver fibrosis progression. As per Figure 2, approximately 1400 susceptible individuals entered the treatment group. Individuals in the susceptible state can be infected with the virus and seek treatment. Approximately 900 susceptible individuals received treatment and became responders and, after about 2 years, this number will gradually decrease. On the other hand, about 500 susceptible individuals did not show clearance of the virus after treatment and became non-responders, while approximately 700 susceptible individuals were cured after treatment. In the following four years, there was a steep rise in the number of individuals who were cured, and after that, it started to gradually decrease. Finally, about 125 susceptible individuals developed complications and fibrosis, which means that they may re-enter the treatment group. From the results and the graph, we can conclude that the earlier the treatment of hepatitis C starts, the larger the percentage of the population who will become responders and develop less complications, such as liver fibrosis.
4. Validation Using Simulation
In order to validate the proposed mathematical model, we used two simulation methods: system dynamics (SD) and agent-based modeling (ABM). SD and ABM are two modeling paradigms, which are widely used in modeling complex social systems. Although SD follows a top-down approach while ABM follows a bottom-up approach when modeling a system, both methods can be used equivalently to model a system. Epidemiological models that are formulated as systems of differential equations are examples of systems that can go through a transformation process to derive equivalent implementations in both approaches [37].
In this paper, we derived two equivalent implementations of the mathematical model of non-invasive diagnosis of liver fibrosis in patients with chronic hepatitis C using ABM and SD approaches. The description of the SD model follows the guidelines of the Strengthening The Reporting of Empirical Simulation Studies (STRESS) framework [49] to capture the details of the overall simulation study. The use of the framework for the description of our model helped to improve the understanding of the simulation model and allowed for reproducibility and ease of scalability/reuse of our implementation. The conversion from the SD to the ABM model followed the guidelines provided by Macal [37], who provided a formal specification for SD and ABM models and used it to derive equivalent ABM models from SD ones.
4.1. System Dynamics
4.1.1. Objectives
The purpose of the SD model is to simulate the non-invasive diagnosis process of liver fibrosis in patients with chronic hepatitis C. The model evaluates the movement among the different stages of the diagnosis and treatment over time and estimates the number of people that receive treatment, are cured, develop complications, or die over time. The model can be used to answer questions, such as: “How many patients will be cured in the next 5 years?” or “How many people will develop fibrosis over time?”.
4.1.2. Logic
In this study, the SD model is represented by a stock and flow diagram that helps in studying and analyzing the system in a quantitative way. A stock is a variable that refers to a part of a system whose value accumulates or drains the effect of other variables. A flow represents the rate at which the stock is changing at any given point in time. A flow either causes a stock to increase (flows into a stock) or decrease (flows out of a stock). In the current SD model, the population groups of Susceptible (S), Treatment (T), Responder (R), Non-Responder (NR), Cured (C), and Fibrosis (F) are represented as stocks, while the rates (Table 1) are represented as flows. The SD model is depicted in Figure 3.
4.1.3. Data and Experimentation
As already mentioned in Section 3, the data source was a labeled HCV liver fibrosis dataset from a published Egyptian study [47], with 1741 data points from patients who had HCV-4. The input parameters (i.e., rates) were calculated from the Egyptian patients’ data. Values that could not be obtained from the dataset were calibrated through MATLAB. The input data and their values are depicted in Table 1. The run time for our simulation was set to 10 years, with an initial population of 2800 patients.
4.1.4. Implementation
The SD model was developed using the commercial software AnyLogic 8.7.3, University Researcher edition, and made use of its “System Dynamics Library”. The model can run on any operating system.
4.2. Agent-Based Modeling
To build the equivalent ABM model from the SD model, we applied the agency theorem for system dynamics.
Agency Theorem for System Dynamics:
“Let S be the set of all system dynamics models, SDM = {St, Rt(St-1), T}, and let St + 1 = ESDM[St] be the equivalent iterated map representation for SDM. Assume ESDM is invertible. Let A be the set of all agent-based simulation models, ABS = {At, Mt(At-1), I }. Then, S is a strict subset of A, such that S ⊊ A.”
Firstly, we defined an agent class with the characteristics and behavioral rules for each individual agent (i.e., patient) in the simulation, and then we observed the collective impact of these behaviors and interactions among agents. The state of an agent at any time is its particular disease state and can be one of the following: Susceptible (S), Treatment (T), Responder (R), Non-Responder (NR), Cured (C), Fibrosis (F), or Dead (final state). The agent class is defined as follows in pseudo-code and covers any individual in the population:
Agent_Class = agent [agent_unique_identifier, agent_disease_state, rate_of_state_change (if agent is in disease state “S”, “T”, “R”, “NR”, “C”, or “F”, or if agent is in disease state “Dead” it is 0)]
The agent state represents the agent’s behavior and is dynamically updated, while all other parameters are static. At each time step of the simulation, each agent’s disease state is updated based on the state chart shown in Figure 4. A susceptible agent can move to the treated population. An agent who enters the treatment state can become a responder, non-responder, or die. Non-responders can develop fibrosis and either seek treatment or die, while responders can be cured or die. An agent that has been cured can become susceptible to the disease over time.
5. Simulation Results
Before both simulation models can be executed, they need to be set up. The patients’ age and gender distributions are randomly generated for the ABM simulation. The rates for moving from one group to another are adopted from Table 1 for both models.
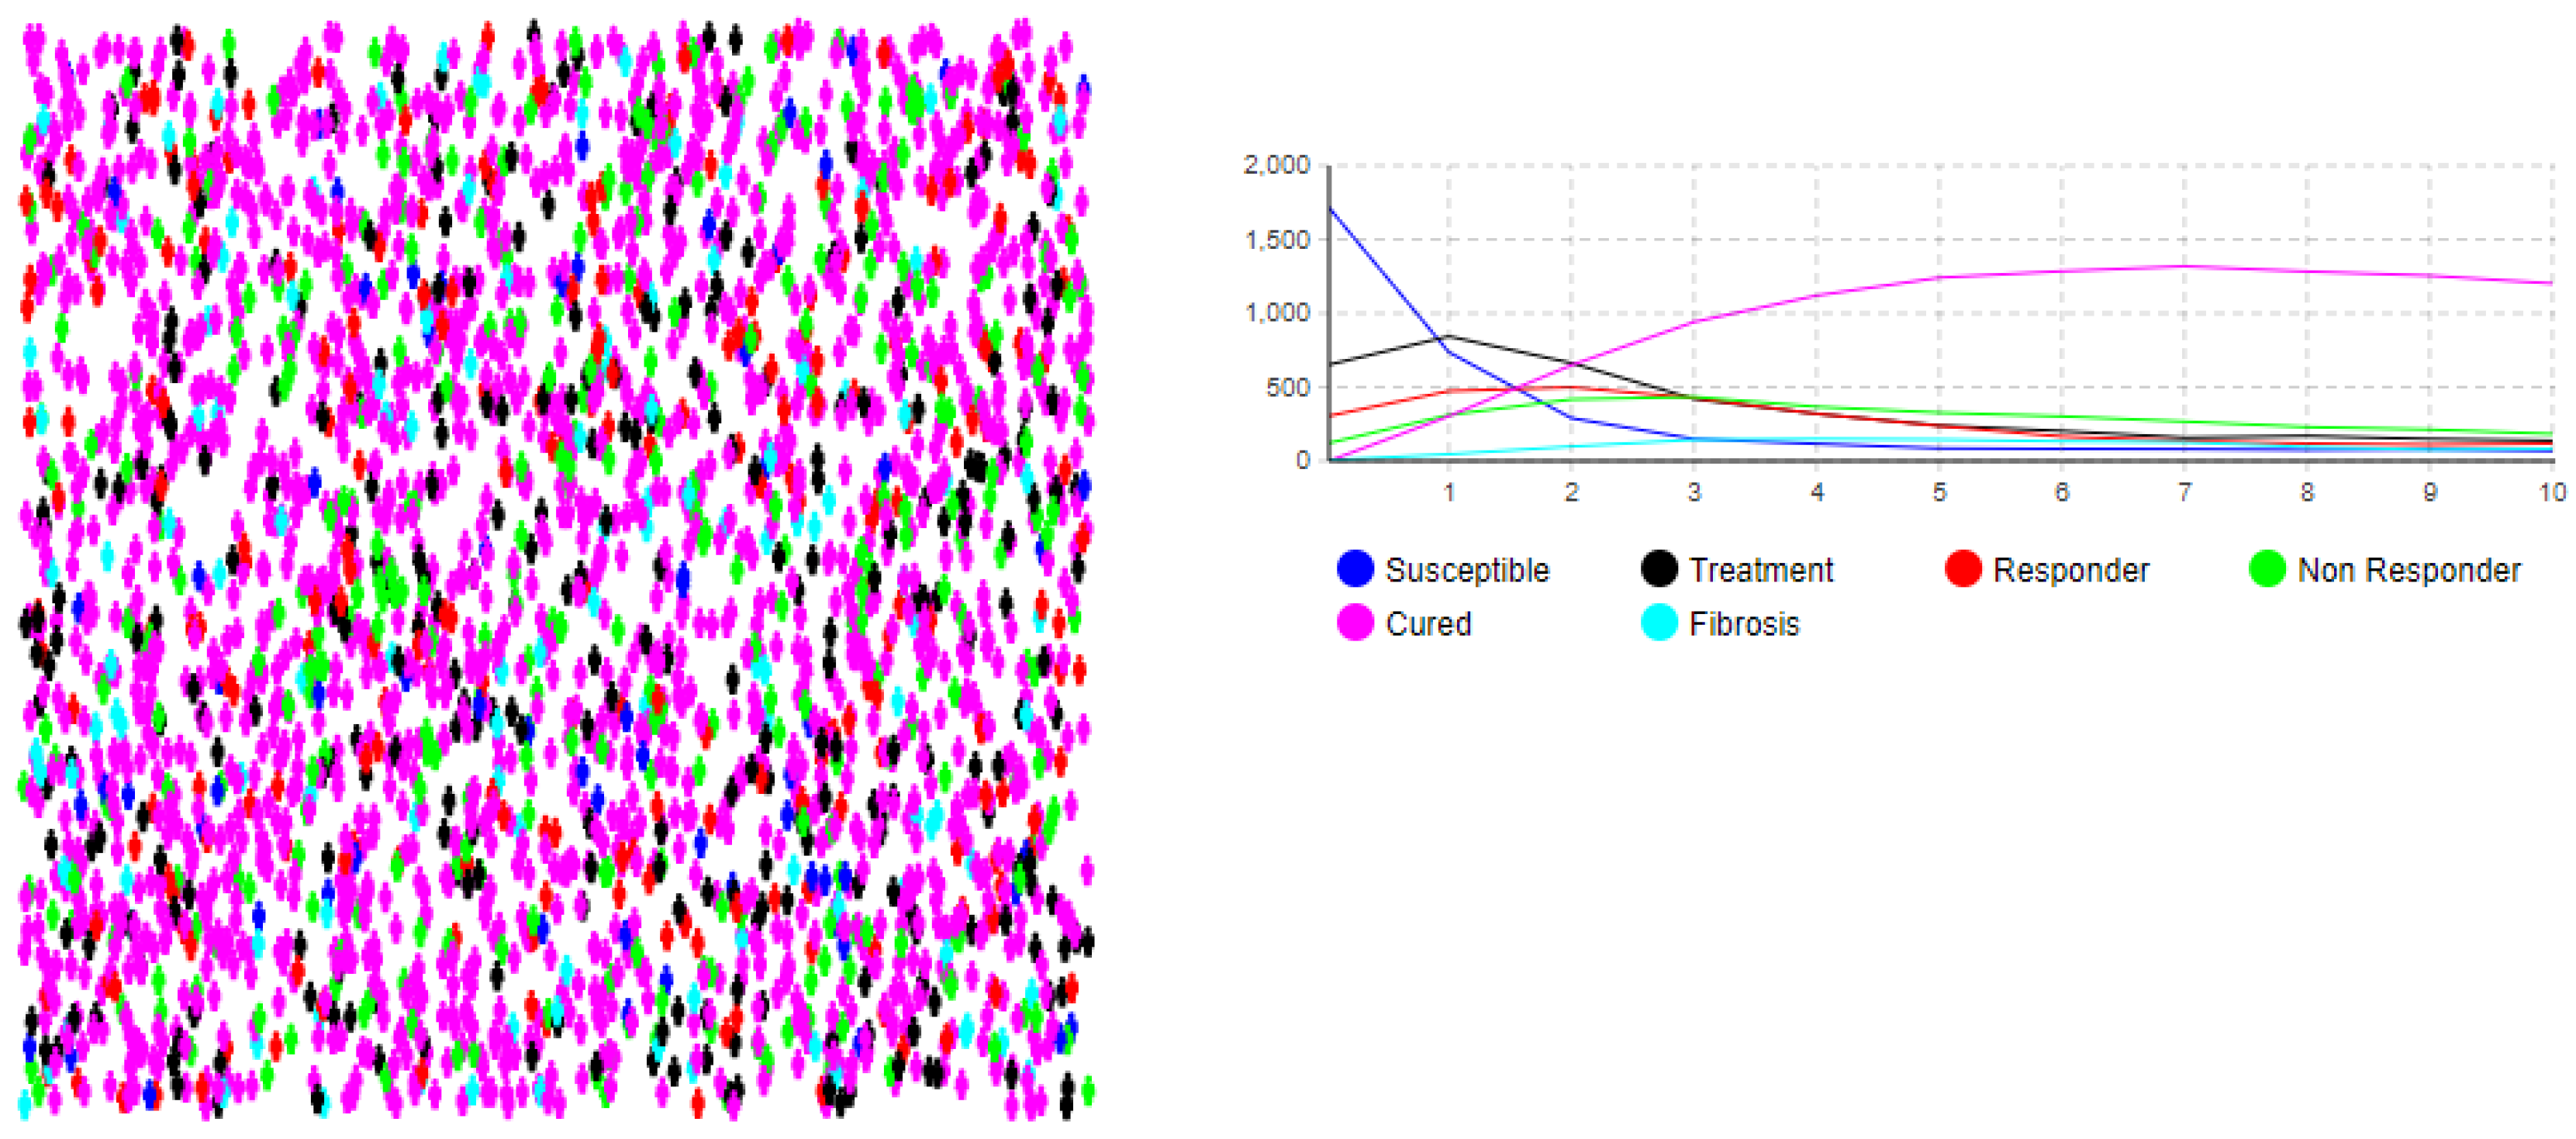
We ran the simulation model for a duration of 10 years with an initial population of 2800 people and observed the movements of each group (SD model) and individual (ABM model) over time. The simulation results of the SD groups’ movements and the ABM movements of the individuals are summarized in Figure 5 and Figure 6, respectively. Figure 6 also depicts the individual movements from one group to another by changing the color of each agent over time to depict the state in which the agent is at that point in time.
The simulation results match the numerical analysis, which shows that the mathematical model is valid. More specifically, the simulation results show that approximately 50% of the total population will start a treatment at the beginning of the diagnosis, approximately 64% of the population that receive treatment will respond to the treatment and become responders (move to the R state), and 77% of the responders will be cured (move to the C state) during the first year of the simulation. On the other hand, approximately 35% of the treatment population will not respond to the treatment (move to the NR state) and 25% of the non-responders will develop fibrosis during the first year. Overall, 4.5% of the total population will develop complications (i.e., fibrosis) during the first year after treatment. After about two years, the number of people in the Treatment, Responder, and Non-Responder groups will gradually decrease, while the number of individuals who are cured will increase in the next four–five years and then start gradually decreasing.
6. Discussion and Conclusions
This study presented the development, validation, and evaluation of a prediction mathematical model for non-invasive diagnosis of liver fibrosis in chronic hepatitis. Initially, we developed a mathematical model that consists of a set of differential equations. The population in the model was divided into six groups: Susceptible (S), Treatment (T), Responder (R), Non-Responder (NR), Cured (C), and Fibrosis (F). The data for the model implementation were obtained from a dataset from an Egyptian study published on a free public domain [47].
The model was then validated by deriving two equivalent simulation model implementations of the mathematical model to examine the process from different perspectives. The process was first modeled using the system dynamics simulation approach to understand the nonlinear behavior of the diagnosis process over time. The system dynamics model was then transformed to an equivalent agent-based model to examine the system at the individual level and investigate the movements of agents with distinct behavior and characteristics to different groups.
Numerical analysis showed that the earlier the hepatitis C treatment is implemented, the larger the group of people who will become responders, and less people will develop complications such as fibrosis. The results from running the simulations also showed that after about two years, the number of people in the Treatment, Responder, and Non-Responder groups will gradually decrease, while the number of individuals who are cured will increase in the next four–five years and then gradually decrease again. The simulation results agree with the results from the numerical analysis and with a previous study by Shah et al. [50], who showed that earlier hepatitis C treatment and the reduction of other risk factors such as alcohol via effective rehabilitation results in fewer complications and lower mortality.
Future work will focus on the expansion of the agent-based model to include demographic, geographic, and other characteristics, as well as behavior at the individual level of the population. This will allow for the examination of changes in subgroups of the population with specific characteristics.
Author Contributions
All authors have contributed equally. All authors have read and agreed to the published version of the manuscript.
Funding
This research received no external funding.
Institutional Review Board Statement
Not applicable.
Informed Consent Statement
Not applicable.
Data Availability Statement
Not applicable.
Conflicts of Interest
The authors declare no conflict of interest.
References
- Mohamed, A.A.; A Elbedewy, T.; El-Serafy, M.; El-Toukhy, N.; Ahmed, W.; El Din, Z.A. Hepatitis C virus: A global view. World J. Hepatol. 2015, 7, 2676–2680. [Google Scholar] [CrossRef] [PubMed]
- Alter, M.J. Epidemiology of hepatitis C virus infection. World J. Gastroenterol. 2007, 13, 2436–2441. [Google Scholar] [CrossRef] [PubMed] [Green Version]
- CDC. Hepatitis C—FAQs, Statistics, Data, & Guidelines. Available online: https://www.cdc.gov/HCV (accessed on 6 March 2022).
- Elgharably, A.; Gomaa, A.I.; Crossey, M.M.; Norsworthy, P.J.; Waked, I.; Taylor-Robinson, S.D. Hepatitis C in Egypt Past, Present, and Future. Int. J. of Gen. Med. 2017, 10, 1–6. [Google Scholar] [CrossRef] [PubMed]
- Bourliere, M.; Penaranda, G.; Renou, C.; Botta-Fridlund, D.; Tran, A.; Portal, I.; LeComte, L.; Castellani, P.; Rosenthal-Allieri, M.A.; Gerolami, R.; et al. Validation and comparison of indexes for fibrosis and cirrhosis prediction in chronic hepatitis C patients: Proposal for a pragmatic approach classification without liver biopsies. J. Viral Hepat. 2006, 13, 659–670. [Google Scholar] [CrossRef] [PubMed]
- Gebo, K.A.; Herlong, H.F.; Torbenson, M.S.; Jenckes, M.W.; Chander, G.; Ghanem, K.G.; El-Kamary, S.S.; Sulkowski, M.; Bass, E.B. Role of liver biopsy in the management of chronic hepatitis C: A systematic Review. Hepatology 2002, 36, S161–S172. [Google Scholar] [CrossRef] [PubMed] [Green Version]
- Chalasani, N.; Younossi, Z.; Lavine, J.E.; Diehl, A.M.; Brunt, E.M.; Cusi, K.; Charlton, M.; Sanyal, A.J. The diagnosis and management of nonalcoholic fatty liver disease: Practice Guideline by the American Association for the Study of Liver Diseases, American College of Gastroenterology, and the American Gastroen-terological Association. Hepatology 2012, 55, 2005–2023. [Google Scholar] [CrossRef]
- Cobbold, J.F.L.; Crossey, M.M.E.; Colman, P.; Goldin, R.; Murphy, P.S.; Patel, N.; Fitzpatrick, J.; Vennart, W.; Thomas, H.C.; Cox, I.J.; et al. Optimal combinations of ultrasound-based and serum markers of disease severity in patients with chronic hepatitis C. J. Viral Hepat. 2009, 17, 537–545. [Google Scholar] [CrossRef]
- Kamal, S.M.; Turner, B.; He, Q.; Rasenack, J.; Bianchi, L.; Al Tawil, A.; Nooman, A.; Massoud, M.; Koziel, M.J.; Afdhal, N.H. Progression of fibrosis in hepatitis C with and without schistosomiasis: Correlation with serum markers of fibrosis. Hepatology 2006, 43, 771–779. [Google Scholar] [CrossRef]
- Hamer, W.H. Epidemic disease in England. Lancet 1906, 167, 733–739. [Google Scholar]
- Ross, R. Report on the Prevention of Malaria in Mauritius; Waterlow: London, UK, 1908. [Google Scholar]
- Apenteng, O.O.; Ismail, N.A. Modelling the spread of HIV and AIDS epidemic trends in male and female popu-lations. World J. Model. Simul. 2017, 13, 183–192. [Google Scholar]
- Rangkuti, Y.M.; Side, S.; Noorani, M.S.M. Numerical Analytic Solution of SIR Model of Dengue Fever Disease in South Sulawesi using Homotopy Perturbation Method and Variational Iteration Method. J. Math. Fundam. Sci. 2014, 46, 91–105. [Google Scholar] [CrossRef] [Green Version]
- Side, S.; Mulbar, U.; Sidjara, S.; Sanusi, W. A SEIR model for transmission of tuberculosis. AIP Conf. Proc. 2017, 1830, 020004. [Google Scholar] [CrossRef]
- Pitcher, A.B.; Borquez, A.; Skaathun, B.; Martin, N.K. Mathematical modeling of hepatitis c virus (HCV) prevention among people who inject drugs: A review of the literature and insights for elimination strategies. J. Theor. Biol. 2019, 481, 194–201. [Google Scholar] [CrossRef] [PubMed]
- Vickerman, P.; Platt, L.; Hawkes, S. Modelling the transmission of HIV and HCV among injecting drug users in Rawalpindi, a low HCV prevalence setting in Pakistan. Sex. Transm. Infect. 2009, 85, ii23–ii30. [Google Scholar] [CrossRef]
- Durier, N.; Nguyen, C.; White, L.J. Treatment of Hepatitis C as Prevention: A Modeling Case Study in Vietnam. PLoS ONE 2012, 7, e34548. [Google Scholar] [CrossRef]
- Mather, D.; Crofts, N. A computer model of the spread of hepatitis C virus among injecting drug users. Eur. J. Epidemiol. 1999, 15, 5–10. [Google Scholar] [CrossRef]
- Murray, J.M.; Law, M.G.; Gao, Z.; Kaldor, J.M. The impact of behavioural changes on the prevalence of human immunodeficiency virus and hepatitis C among injecting drug users. Int. J. Epidemiol. 2003, 32, 708–714. [Google Scholar] [CrossRef] [Green Version]
- Esposito, N.; Rossi, C. A nested-epidemic model for the spread of hepatitis C among injecting drug users. Math. Biosci. 2004, 188, 29–45. [Google Scholar] [CrossRef] [Green Version]
- Hutchinson, S.J.; Bird, S.M.; Taylor, A.; Goldberg, D.J. Modelling the spread of hepatitis C virus infection among injecting drug users in Glasgow: Implications for prevention. Int. J. Drug Policy 2006, 17, 211–221. [Google Scholar] [CrossRef]
- Vickerman, P.; Hickman, M.; Judd, A. Modelling the impact on Hepatitis C transmission of reducing syringe sharing: London case study. Int. J. Epidemiol. 2007, 36, 396–405. [Google Scholar] [CrossRef] [Green Version]
- Corson, S.; Greenhalgh, D.; Hutchinson, S.J. A time since onset of injection model for hepatitis C spread amongst injecting drug users. J. Math. Biol. 2012, 66, 935–978. [Google Scholar] [CrossRef] [PubMed]
- Imran, M.; Rafique, H.; Khan, A.; Malik, T. A model of bi-mode transmission dynamics of hepatitis C with optimal control. Theory Biosci. 2013, 133, 91–109. [Google Scholar] [CrossRef] [PubMed]
- Hahn, J.A.; Wylie, D.; Dill, J.; Sanchez, M.S.; Lloyd-Smith, J.O.; Page, K.; Getz, W.M. Potential impact of vaccination on the hepatitis C virus epidemic in injection drug users. Epidemics 2009, 1, 47–57. [Google Scholar] [CrossRef]
- Stone, J.; Martin, N.K.; Hickman, M.; Hellard, M.; Scott, N.; McBryde, E.; Drummer, H.; Vickerman, P. The Potential Impact of a Hepatitis C Vaccine for People Who Inject Drugs: Is a Vaccine Needed in the Age of Direct-Acting Antivirals? PLoS ONE 2016, 11, e0156213. [Google Scholar] [CrossRef] [PubMed] [Green Version]
- Platt, L.; Minozzi, S.; Reed, J.; Vickerman, P.; Hagan, H.; French, C.; Jordan, A.; Degenhardt, L.; Hope, V.; Hutchinson, S.; et al. Needle syringe programmes and opioid substitution therapy for preventing hepatitis C transmission in people who inject drugs. Cochrane Database Syst. Rev. 2017, 2017, CD012021. [Google Scholar] [CrossRef] [PubMed] [Green Version]
- Forrester, J.W. Industrial Dynamics; MIT Press: Cambridge, MA, USA, 1961. [Google Scholar]
- Roberts, N.; Anderson, D.; Deal, R.; Garet, M.; Schaffer, W. Introduction to Computer Simulation: A System Dynamics Modeling Approach; Addision-Wesley: Boston, MA, USA, 1983. [Google Scholar]
- Sterman, J.D. Business Dynamics: Systems Thinking and Modeling for a Complex World; Irwin McGraw-Hill: Boston, MA, USA, 2000. [Google Scholar]
- Homer, J.B.; Hirsch, G.B. System Dynamics Modeling for Public Health: Background and Opportunities. Am. J. Public Health 2006, 96, 452–458. [Google Scholar] [CrossRef]
- Kok, S.; Vancouver HIV Testing Program Modelling Group; Rutherford, A.R.; Gustafson, R.; Barrios, R.; Montaner, J.S.G.; Vasarhelyi, K. Optimizing an HIV testing program using a system dynamics model of the continuum of care. Health Care Manag. Sci. 2015, 18, 334–362. [Google Scholar] [CrossRef] [Green Version]
- Li, M.; Yu, W.; Tian, W.; Ge, Y.; Liu, Y.; Ding, T.; Zhang, L. System dynamics modeling of public health services provided by China CDC to control infectious and endemic diseases in China. Infect. Drug Resist. 2019, 12, 613–625. [Google Scholar] [CrossRef] [Green Version]
- Mateu-Gelabert, P.; Sabounchi, N.; Guarino, H.; Ciervo, C.; Joseph, K.; Eckhardt, B.; Fong, C.; Huang, T.T. Bridging Epidemiology and System Dynamics Modeling to Better Understand HCV Risk Among Young People Who Inject Drugs. Preprint. 2021.
- Al-Antari, M.A.; Almasani, M.A.; Bu-Omer, H.M.; Wahba, K.K. A system dynamics based model for hepatic fibrosis in hepatitis C patients. In Proceedings of the 2016 33rd National Radio Science Conference (NRSC), Aswan, Egypt, 22–25 February 2016; 2016; pp. 431–441. [Google Scholar] [CrossRef]
- Razavi, H.; ElKhoury, A.C.; Elbasha, E.; Estes, C.; Pasini, K.; Poynard, T.; Kumar, R. Chronic hepatitis C virus (HCV) disease burden and cost in the United States. Hepatology 2012, 57, 2164–2170. [Google Scholar] [CrossRef] [Green Version]
- Macal, C.M. To agent-based simulation from system dynamics. In Proceedings of the 2010 Winter Simulation Conference, Baltimore, MD, USA, 5–8 December 2010; IEEE: Piscataway, NJ, USA; pp. 371–382. [Google Scholar]
- Moghadas, S.M.; Shoukat, A.; Espindola, A.; Pereira, R.S.; Abdirizak, F.; Laskowski, M.; Viboud, C.; Chowell, G. Asymptomatic Transmission and the Dynamics of Zika Infection. Sci. Rep. 2017, 7, 1–8. [Google Scholar] [CrossRef] [PubMed] [Green Version]
- Liu, S.; Xue, H.; Li, Y.; Xu, J.; Wang, Y. Investigating the Diffusion of Agent-based Modelling and System Dynamics Modelling in Population Health and Healthcare Research. Syst. Res. Behav. Sci. 2017, 35, 203–215. [Google Scholar] [CrossRef]
- Mahmood, I.; Arabnejad, H.; Suleimenova, D.; Sassoon, I.; Marshan, A.; Serrano-Rico, A.; Louvieris, P.; Anagnostou, A.; E Taylor, S.J.; Bell, D.; et al. FACS: A geospatial agent-based simulator for analysing COVID-19 spread and public health measures on local regions. J. Simul. 2020, 1–19. [Google Scholar] [CrossRef]
- Tuomisto, J.T.; Yrjölä, J.; Kolehmainen, M.; Bonsdorff, J.; Pekkanen, J.; Tikkanen, T. An agent-based epidemic model reina for covid-19 to identify destructive policies. medRxiv 2020. [Google Scholar] [CrossRef] [Green Version]
- Das, S.; Sen, D.; Ramamohan, V.; Sood, A. An Agent-Based Model of Hepatitis C Virus Transmission Dynamics in India. In Proceedings of the 2019 Winter Simulation Conference (WSC), National Harbor, MD, USA, 8–11 December 2019; pp. 984–995. [Google Scholar] [CrossRef]
- Gutfraind, A.; Boodram, B.; Prachand, N.; Hailegiorgis, A.; Dahari, H.; Major, M.E. Agent-based model forecasts aging of the population of people who inject drugs in metropolitan Chicago and changing prevalence of hepatitis C infec-tions. PLoS ONE 2015, 10, e0137993. [Google Scholar]
- Sharafi, H.; Behnava, B.; Azizi-Saraji, A.; Namvar, A.; Anvar, A.; Salimi, S.; Alavian, S.M. Treatment of hepatitis C virus infection with direct-acting antiviral agent-based regimens in Iranian patients with hereditary bleeding disorders. Virol. J. 2021, 18, 1–10. [Google Scholar] [CrossRef]
- Khan, B.; Duncan, I.; Saad, M.; Schaefer, D.; Jordan, A.; Smith, D.; Neaigus, A.; Jarlais, D.D.; Hagan, H.; Dombrowski, K. Combination interventions for Hepatitis C and Cirrhosis reduction among people who inject drugs: An agent-based, networked population simulation experiment. PLoS ONE 2018, 13, e0206356. [Google Scholar] [CrossRef]
- Tatara, E.; Collier, N.T.; Ozik, J.; Gutfraind, A.; Cotler, S.J.; Dahari, H.; Major, M.; Boodram, B. Multi-Objective Model Exploration of Hepatitis C Elimination in an Agent-Based Model of People who Inject Drugs. WSC 2019, 2019, 1008–1019. [Google Scholar] [CrossRef]
- Nasr, M.; El-Bahnasy, K.; Hamdy, M.; Kamal, S.M. A Novel Model based on Non-Invasive Methods for prediction of Liver Fibrosis. In Proceedings of the 13th International Computer Engineering Conference (ICENCO), Cairo, Egypt, 27–28 December 2017. [Google Scholar]
- Shah, N.H.; Sheoran, N.; Jayswal, E.N. Effective Lockdown and Plasma Therapy for COVID-19; Springer: Singapore, 2021; pp. 125–141. [Google Scholar] [CrossRef]
- Monks, T.; Currie, C.S.M.; Onggo, B.S.; Robinson, S.; Kunc, M.; Taylor, S.J.E. Strengthening the reporting of empirical simulation studies: Introducing the STRESS guidelines. J. Simul. 2018, 13, 55–67. [Google Scholar] [CrossRef]
- Shah, N.; Shukla, N.; Satia, M.; Thakkar, F. Optimal Control of HCV transmission under liquoring. Elsevier J. Theor. Biol. 2019, 465, 27–33. [Google Scholar] [CrossRef]
Figure 1.
Movement of individuals from one compartment to another compartment.

Figure 2.
Movement of individuals in each compartment.

Figure 3.
System dynamics simulation model.

Figure 4.
ABM state chart view of each individual agent.

Figure 5.
Results of SD simulation. The x-axis represents the time in years and the y-axis represents the number of patients.
Figure 5.
Results of SD simulation. The x-axis represents the time in years and the y-axis represents the number of patients.

Figure 6.
Results of ABM simulation. The x-axis represents the time in years and the y-axis represents the number of patients.
Figure 6.
Results of ABM simulation. The x-axis represents the time in years and the y-axis represents the number of patients.


Table 1.
Notations and parametric values for a mathematical model of non-invasive diagnosis of liver fibrosis in chronic hepatitis.
Table 1.
Notations and parametric values for a mathematical model of non-invasive diagnosis of liver fibrosis in chronic hepatitis.
| Notations | Description | Parametric Values |
|---|---|---|
| B | New recruitment rate | 0.15 |
| α1 | Rate at which susceptible individuals get treatment | 0.85 |
| α2 | Rate at which treatment group becomes responders | 0.60 |
| α3 | Rate at which treatment group becomes non-responders | 0.30 |
| α4 | Rate at which responders are cured | 0.80 |
| α5 | Rate at which non-responders develop fibrosis | 0.30 |
| α6 | Rate at which cured people can become susceptible again | 0.05 |
| α7 | Rate at which people with fibrosis can re-enter the treatment group | 0.70 |
| μ | Natural death rate | 0.05 |
Publisher’s Note: MDPI stays neutral with regard to jurisdictional claims in published maps and institutional affiliations. |
© 2022 by the authors. Licensee MDPI, Basel, Switzerland. This article is an open access article distributed under the terms and conditions of the Creative Commons Attribution (CC BY) license (https://creativecommons.org/licenses/by/4.0/).
Share and Cite
MDPI and ACS Style
Shukla, N.; Angelopoulou, A.; Hodhod, R. Non-Invasive Diagnosis of Liver Fibrosis in Chronic Hepatitis C using Mathematical Modeling and Simulation. Electronics 2022, 11, 1260. https://doi.org/10.3390/electronics11081260
AMA Style
Shukla N, Angelopoulou A, Hodhod R. Non-Invasive Diagnosis of Liver Fibrosis in Chronic Hepatitis C using Mathematical Modeling and Simulation. Electronics. 2022; 11(8):1260. https://doi.org/10.3390/electronics11081260
Chicago/Turabian StyleShukla, Nehal, Anastasia Angelopoulou, and Rania Hodhod. 2022. "Non-Invasive Diagnosis of Liver Fibrosis in Chronic Hepatitis C using Mathematical Modeling and Simulation" Electronics 11, no. 8: 1260. https://doi.org/10.3390/electronics11081260
Note that from the first issue of 2016, this journal uses article numbers instead of page numbers. See further details here.