
A Visual Cryptography-Based Watermarking Approach for the Detection and Localization of Image Forgery


1
School of Natural and Applied Sciences, Ankara Yildirim Beyazit University, Ankara 06010, Turkey
2
Department of Computer Engineering, College of Engineering, University of Diyala, Diyala 00964, Iraq
*
Author to whom correspondence should be addressed.
Electronics 2022, 11(1), 136; https://doi.org/10.3390/electronics11010136
Submission received: 20 December 2021
/
Revised: 27 December 2021
/
Accepted: 30 December 2021
/
Published: 2 January 2022
(This article belongs to the Special Issue Internet-to-Everything (I2X) Communications, Applications and Management in Future Networks)
Abstract
:The usage of images in different fields has increased dramatically, especially in medical image analysis and social media. Many risks can threaten the integrity and confidentiality of digital images transmitted through the internet. As such, the preservation of the contents of these images is of the utmost importance for sensitive healthcare systems. In this paper, the researchers propose a block-based approach to protect the integrity of digital images by detecting and localizing forgeries. It employs a visual cryptography-based watermarking approach to provide the capabilities of forgery detection and localization. In this watermarking scheme, features and key and secret shares are generated. The feature share is constructed by extracting features from equal-sized blocks of the image by using a Walsh transform, a local binary pattern and a discrete wavelet transform. Then, the key share is generated randomly from each image block, and the secret share is constructed by applying the XOR operation between the watermark, feature share and key share. The CASIA V 1.0 and SIPI datasets were used to check the performance and robustness of the proposed method. The experimental results from these datasets revealed that the percentages of the precision, recall and F1 score classification indicators were approximately 97% for these indicators, while the percentages of the TAF and NC image quality indicators were approximately 97% and 96% after applying several known image processing and geometric attacks. Furthermore, the comparative experimental results with the state-of-art approaches proved the robustness and noticeable improvement in the proposed approach for the detection and localization of image forgeries in terms of classification and quality measures.
1. Introduction
Nowadays, millions of images and videos are processed and transmitted by people over the internet. Images have been used heavily as evidence in law enforcement, the courts, science and medical healthcare [1]. The availability of editing software tools makes it very easy to insert, delete, edit and modify any part of the images. Hence, it is very necessary and imperative to develop forgery detection tools to identify different kinds of malicious modifications of images [2]. Resampling, image retouching, image copy paste and splicing are the main known modifications of digital images [3]. Hence, image integrity authentication, digital signatures, hash codes, watermarking and cryptography are the basic tools which are used to detect and localize the forgeries in the digital images [4]. There are two types of image authentication techniques: active [5] and passive [6]. The active techniques use the watermarks embedded inside the image to check the integrity [7,8,9,10,11], while the passive techniques do not use any prior knowledge about the image to detect forgery [12,13,14,15,16].
Digital Watermarking has been used widely, whether in its visible or blind form. Indeed, the watermark has information on the source, destination, possession, copy management, and bargain controlling, etc. [17]. Watermarking can deliver various services, for example intellectual property protection, bargain tracking, copy handling, ownership verification, certification, forensic investigation, playback chaining, estate system improvement and database connection, and biometric protection, etc. [18,19,20]. Copyright protection is defined as the function of confirming the possession rights to a court against the illegitimate manipulation and usage of digital data. It can enclose data about the possessor of the thing, which can be utilized to solve disputes. Each digital thing has a unique watermark specifying the holder of the thing, which requires a very high level of strength for tracking so that holders can be detected. For copyright services, the hidden watermark is supposed to be robust to various kinds of intentional and non-intentional attacks, such that the affected content is still valid in terms of visual quality [21]. The watermarking schemes are classified either as spatial domain or transform domain techniques. In the spatial domain, the watermark is hidden by changing the pixel values of the main image. For example, the least significant bit (LSB) method is one of the well-known techniques in the spatial domain. In the transform domain, the watermark is hidden by changing the frequency coefficients of the converted image. The most frequently used methods in the transform domain are discrete cosine transform (DCT) and discrete wavelet transform (DWT), etc. [22].
Many watermarking schemes have been proposed in the last few years. In these approaches, the watermark is hidden in the image at the sender side, and then it is extracted at the receiver side to check the integrity of the image. However, such watermarking techniques produce lower-quality images, and their performance is lowered by several known attacks. Hence, visual cryptography (VC)-based watermarking techniques are proposed as an alternative to the classical watermarking approaches [23,24]. In VC-based approaches, several shares are generated to produce the secret share that is saved into the third authority party to solve any conflicts which arise in the future. This means that there are no watermarks embedded inside the host image; instead, the watermarks are used only in the construction of the secret share at the sender side, and then they are reconstructed at the receiver side for integrity verification purposes. Hence, the VC-based watermarking schemes are regarded as a promising viable solution for image quality and robustness problems [25,26].
VC-based watermarking approaches have been used by researchers in the past few years to protect the copyright of a single image or multiple images [23,24,25,26]. Two types of VC watermarking schemes exist. An example on the first kind is the research in [27], in which the VC is used to generate two meaningless shares of the watermark: One share is embedded in the cover image, and the other share is saved into the trusted authority (TA) in order to be used later to recover the original watermark. This kind of watermarking scheme suffers from a lack of robustness, and the watermark embedding process produces a low-quality cover image. On other hand, the examples of the second kind of VC-based watermarking schemes are the research works in [28,29,30]. In these schemes, a share is generated from the cover image—it is called a master share—and another share is called the ownership share; the latter is composed by superimposing the master share and the watermark. Furthermore, the researchers in [25] used VC to hide some bits of the watermark in the blocks of the edge image. The main flaw of this approach is the degradation in the quality of the cover image after the embedding of the watermark. Another piece of research [23] hid the watermark inside the cover image without modifying it. However, this approach suffers from the limitation that the size of watermark is restrained by the size of the cover image. In another piece of research, the authors [28] utilized discrete wavelet transform (DWT) and VC to design a watermarking scheme to secure the copyright of the image, but this approach is also restricted by the size of the image. The researchers in [30] proposed a new watermarking scheme using DWT, VC and a secret key. The authors employ the secret key to derive the feature vectors from wavelet subands, and then the secret share is constructed by superimposing the feature share and watermark. This approach can resist several known attacks, but it is insecure according to [29]. In [26], the authors developed a watermarking approach based on singular value decomposition (SVD), DWT and VC. The feature vectors are extracted by using DWT and SVD, which are then classified using clustering algorithms. The master share is composed using the output of the clustering outcomes, and the ownership share is designed using a master share and a watermark using VC. Ali and Fardin [31] used visual cryptography and a support vector machine (SVM) classifier to develop an image watermarking scheme to protect the copyright of digital images. The VC is used to construct the master and owner shares of an image, while SVM is used to classify the image blocks into two main classes. In addition, Rani et al. [32] proposed an image forgery detection approach based on enhanced SURF and template matching. They achieved good detection results on the CASIA dataset. Kumar el al. [33] developed an approach using an optimization algorithm and visual cryptography to protect the authenticity and integrity of digital videos by embedding robust watermarks inside them.
All of the approaches mentioned above have their limitations and problems, as follows: (1) the size of the watermark is limited by the size of the cover image; (2) some approaches fail to resist some known attacks, such as noise, median filtering, sharping, scaling or/and rotation; (3) the insecure sending of side information, such as the key or key points, causing the receipt of side cause security problems; (4) decreasing or destroying the quality of the cover image as a result of embedding; and (5) some approaches cause a pixel expansion problem in the constructed shares. In addition to all of the earlier limitations, the main purpose of all of the above approaches is to protect the copyright of single or multiple images, while the objective of our proposed approach is to detect and localize forgeries in the digital images in an accurate and efficient manner. Hence, in this research article, the researchers investigate the hypothesis that we can overcome the above limitations and problems of the state-of-art approaches by developing novel watermarking approaches using visual cryptography and famous feature extraction algorithms. Furthermore, we investigate whether or not these proposed VC-based approaches can detect different shapes and sizes of forgeries in the images. The contributions of this research based on visual cryptography watermarking approaches can be summarized as follows:
- This is a novel approach to detect and localize forgeries in the digital images-based on visual cryptography-based watermarking schemes and feature extraction algorithms.
- This approach has the ability to detect and localize forgeries of different sizes and shapes in the digital images even at the pixel level.
- The proposed approach can be used for image copyright in addition to its main purpose of detecting and localizing forgeries in images. To the best of our knowledge, this is the first time a VC-based watermarking scheme has been used for the purpose of image forgery detection and localization.
- The proposed approach overcomes the limitations of the watermark size, resistance to attacks, pixel expansion, distorted cover image quality and the sending of side information that exist in the previous approaches.
2. Materials and Methods
This section sheds light on the main tools that we have used to create the proposed approach, and then we explain thoroughly our proposed method.
2.1. Visual Cryptography
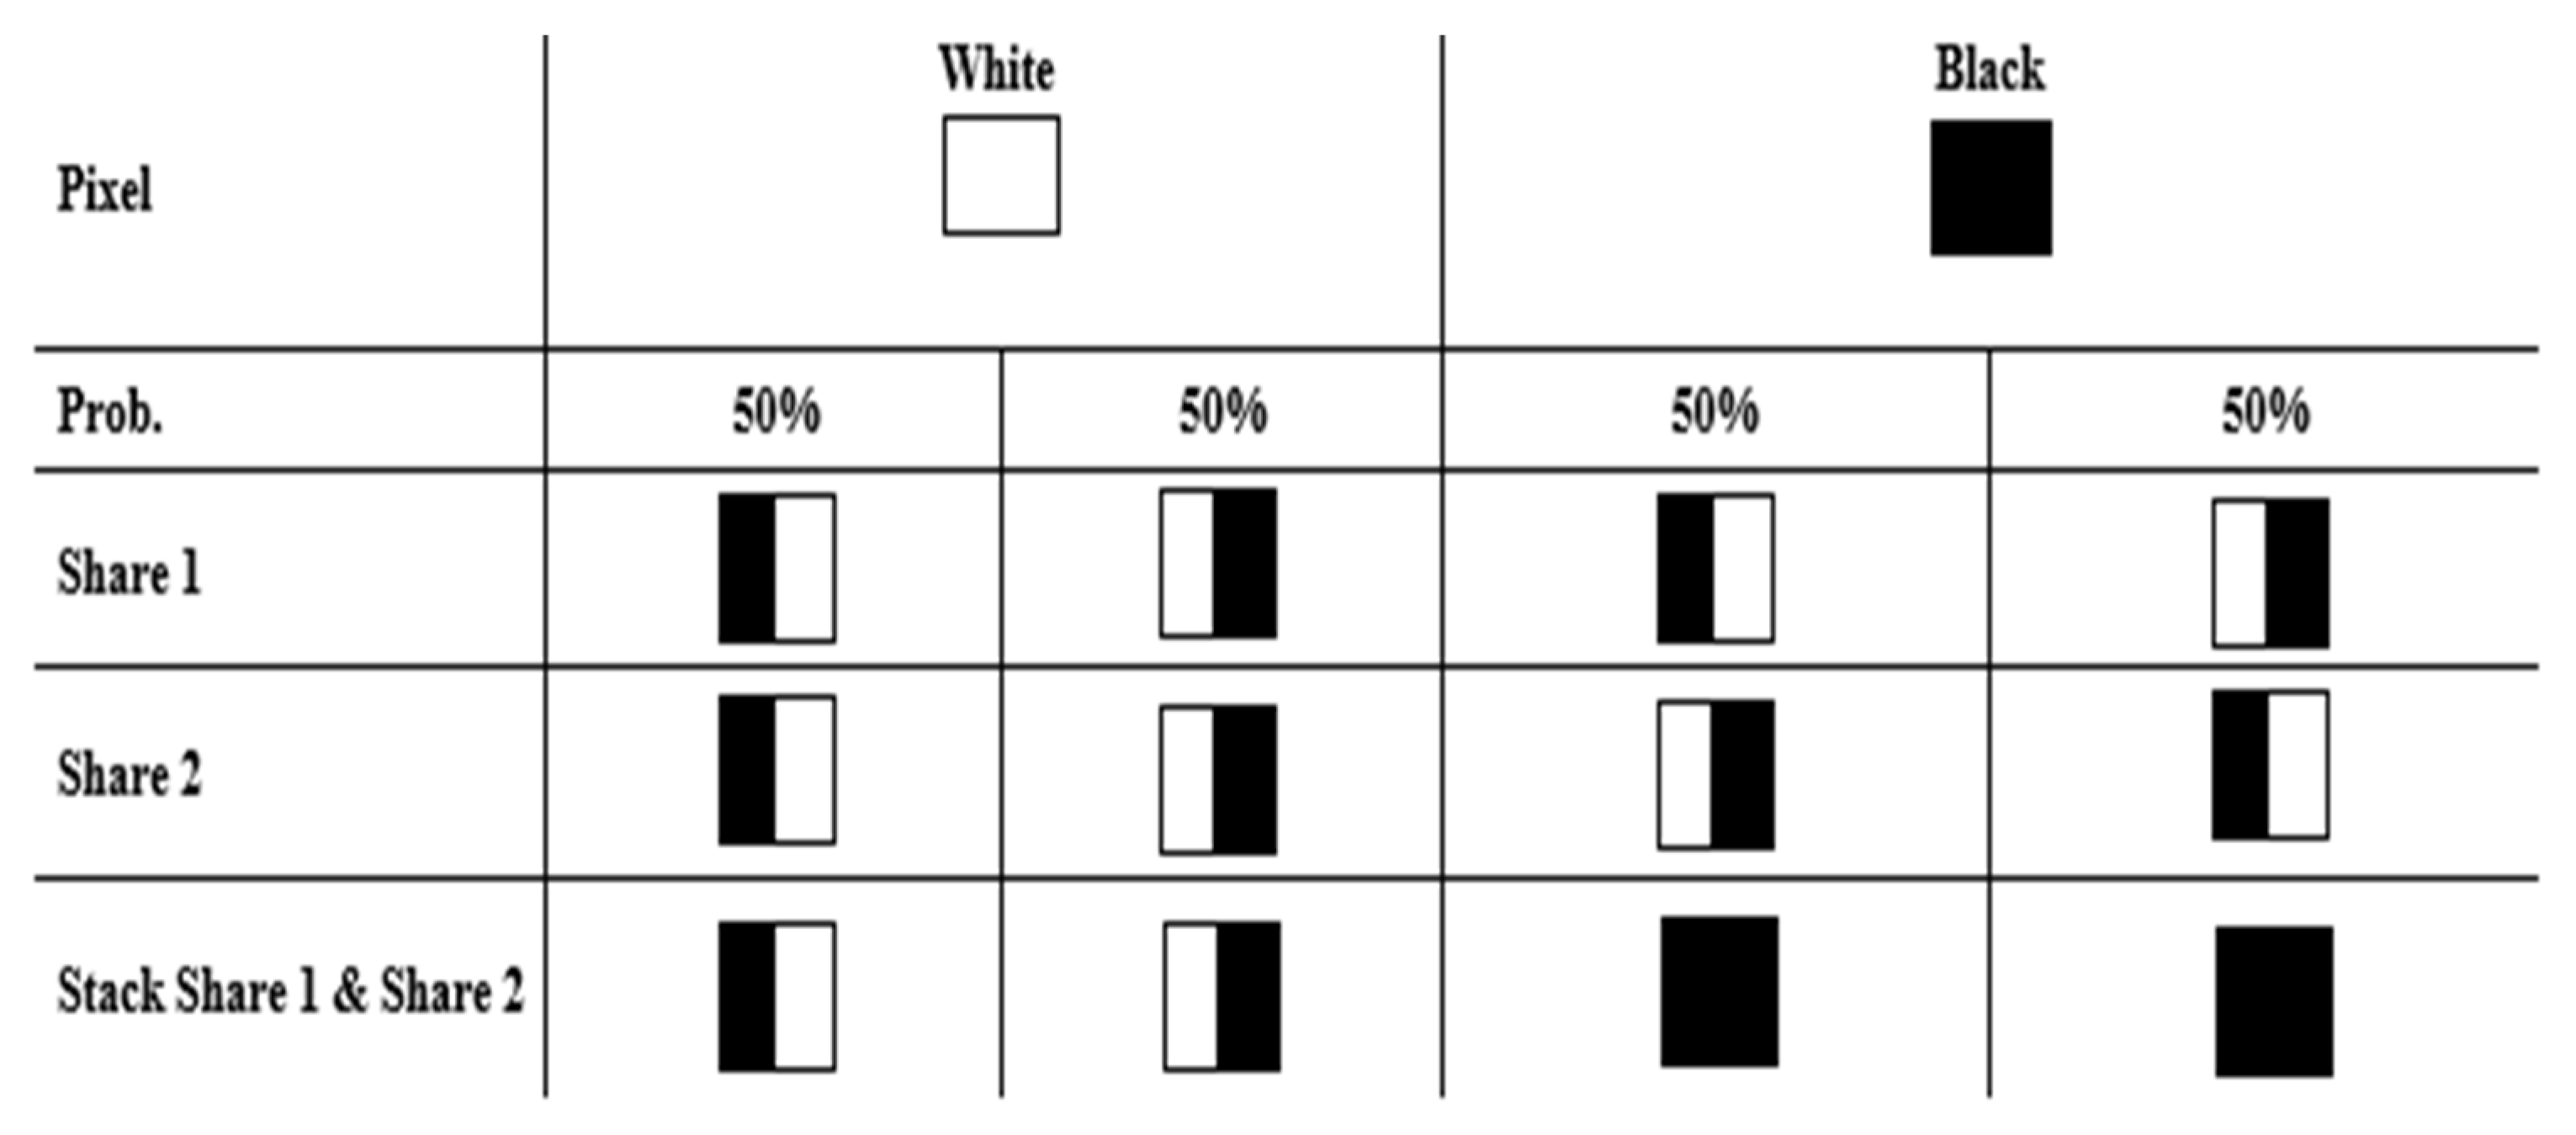
The Visual Cryptography (VC) concept was originally invented by Naor and Shamir in 1994 [34]. They developed a totally modern and safe method for sharing information and secret sharing. Based on this concept, an image can be divided into n shares in the encryption phase, and in the decryption phase a participant must have all n shares to recover the secret image. The source problem of the VC is the certain instance of a 2-out-of-2 visual secret sharing problem, which is the most regularly used, as shown in Figure 1. In this technique, the private image is spilt into two shares of arbitrary dots. For each pixel P of the private image, two blocks of 1 × 2 pixels are constructed in the intended location for each share. Hence, the constructed shares have a size of 1 s × 2 s if the source private image is of size 1 s × 1 s.
In the decryption phase, the two shares are superimposed together. For a black pixel P, the outcome is a block with two black subpixels. However, for a white pixel, the outcome is a block with one black subpixel and one white subpixel. For the participant’s eyes, the block with black and white subpixels will be seen as a white pixel, and the block with two black subpixels will be seen as a black pixel. Hence, the secret data is observed when these shares are superimposed together. In fact, what made this technique very practical was that any shares that are not completely combined will not be able to reveal the secret image. The VC was also applied to grayscale and color images, and resulted in many useful applications [35,36].
2.2. Walsh Hadmard Transform (WHT)
WHT is a category of size 2 discrete Fourier transform (DFT). It separates the input signal into a composition of Walsh functions, and can be defined as follows [37]:
where I represents the image to be transformed, and is a kernel function that can be defined as follows:
where is the mth bit in the binary sequence, and k is the total number of the bits. In order to extract directional features, the Hadmard diagonal, horizontal and vertical orientations must be calculated. Three wedge masks are utilized for the purpose of extracting these features—, and —from the Hadmard coefficients, as follows:
2.3. Local Binary Patterns (LBP)
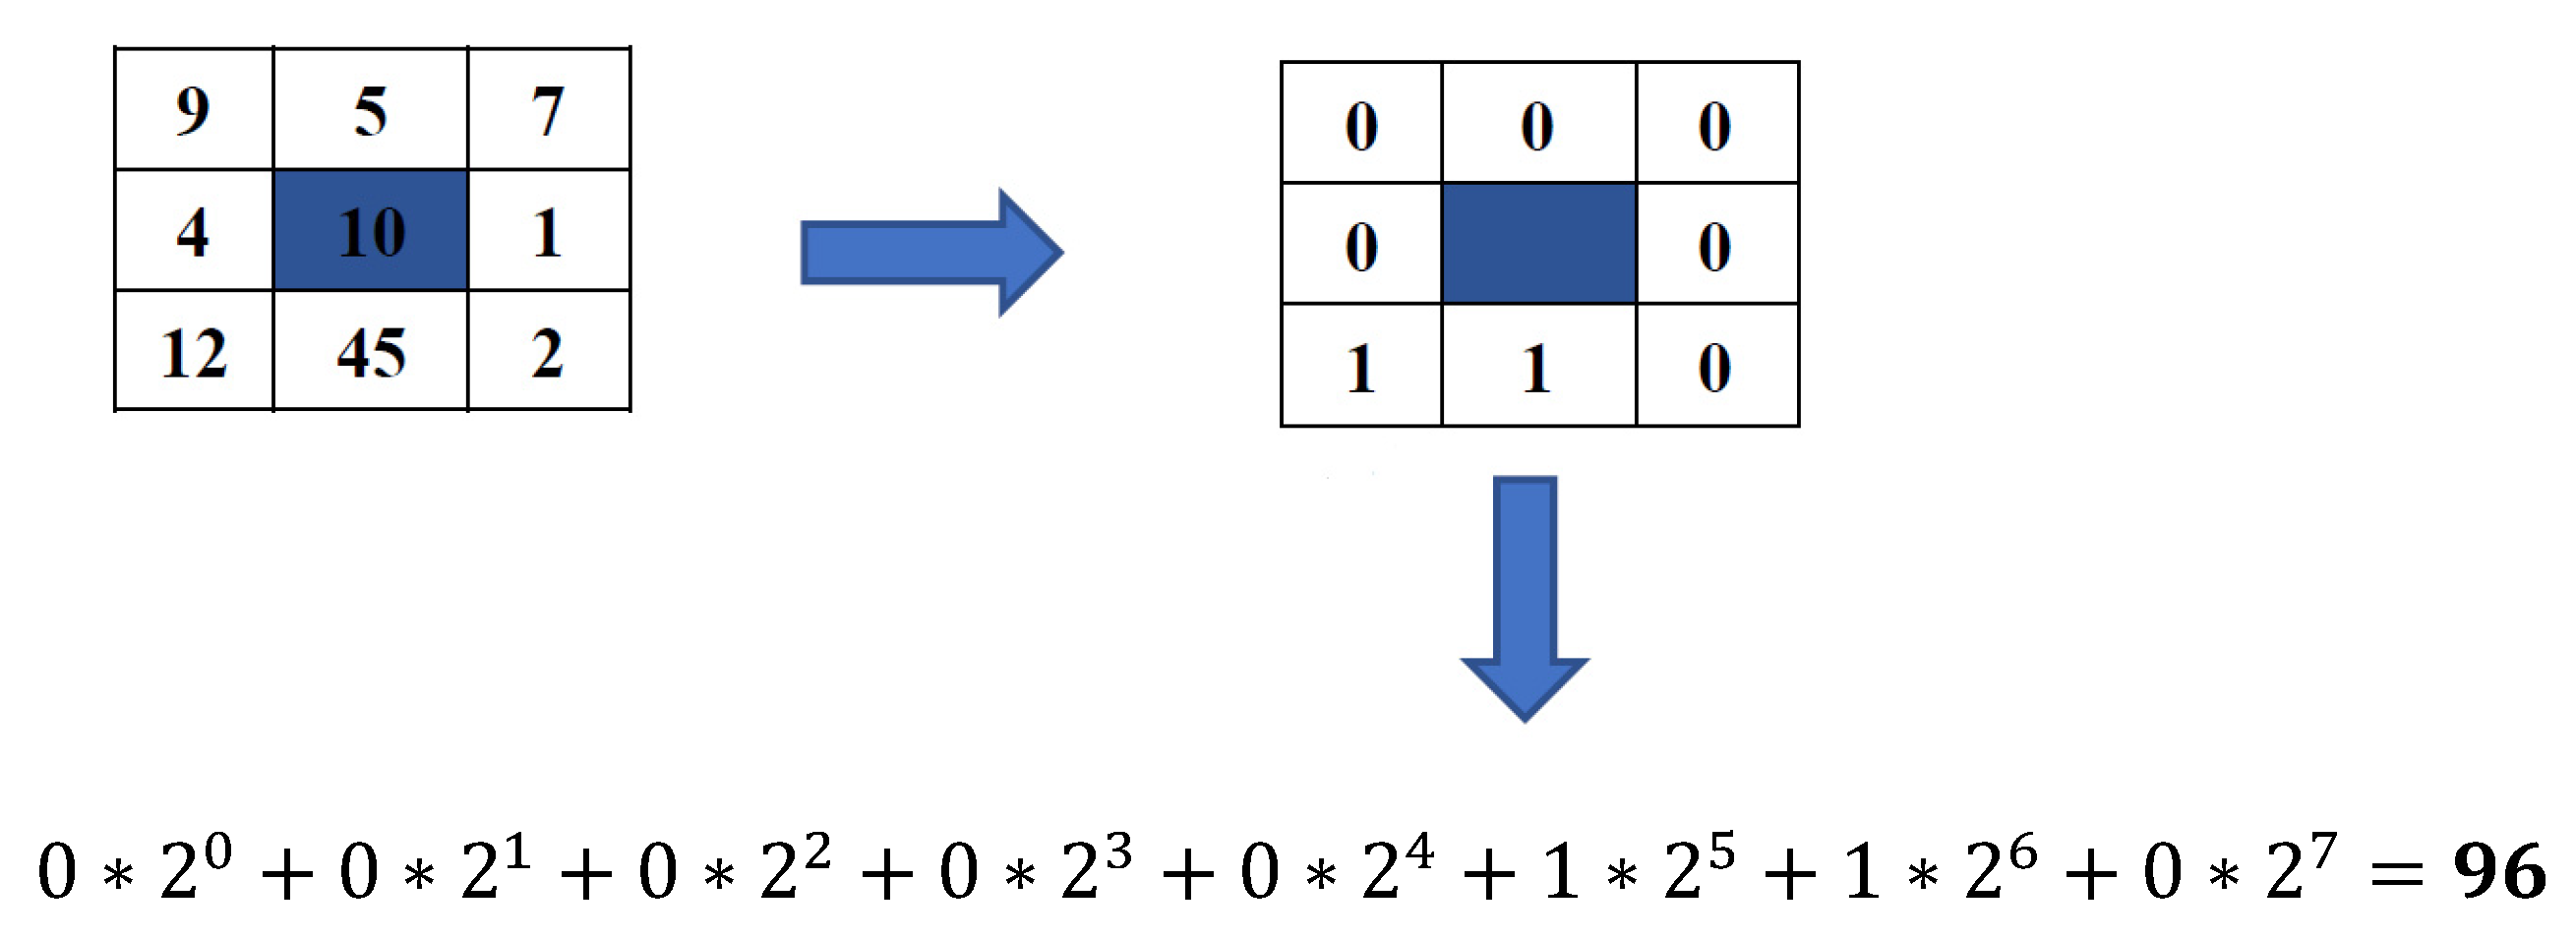
LBP is a powerful image texture descriptor which was proposed by Ojala et al. in 1994 [38]. It is used in many applications of image and computer vision. It uses a kernel (or window) of (3 × 3) centered at the desired pixel, as shown in Figure 2, and its code is obtained by applying the block kernel according to a mathematical formula, as follows [39]:
where represents the count of neighboring pixels, represents the neighboring pixel, and is the center pixel.
2.4. Discrete Wavelet Transform (DWT)
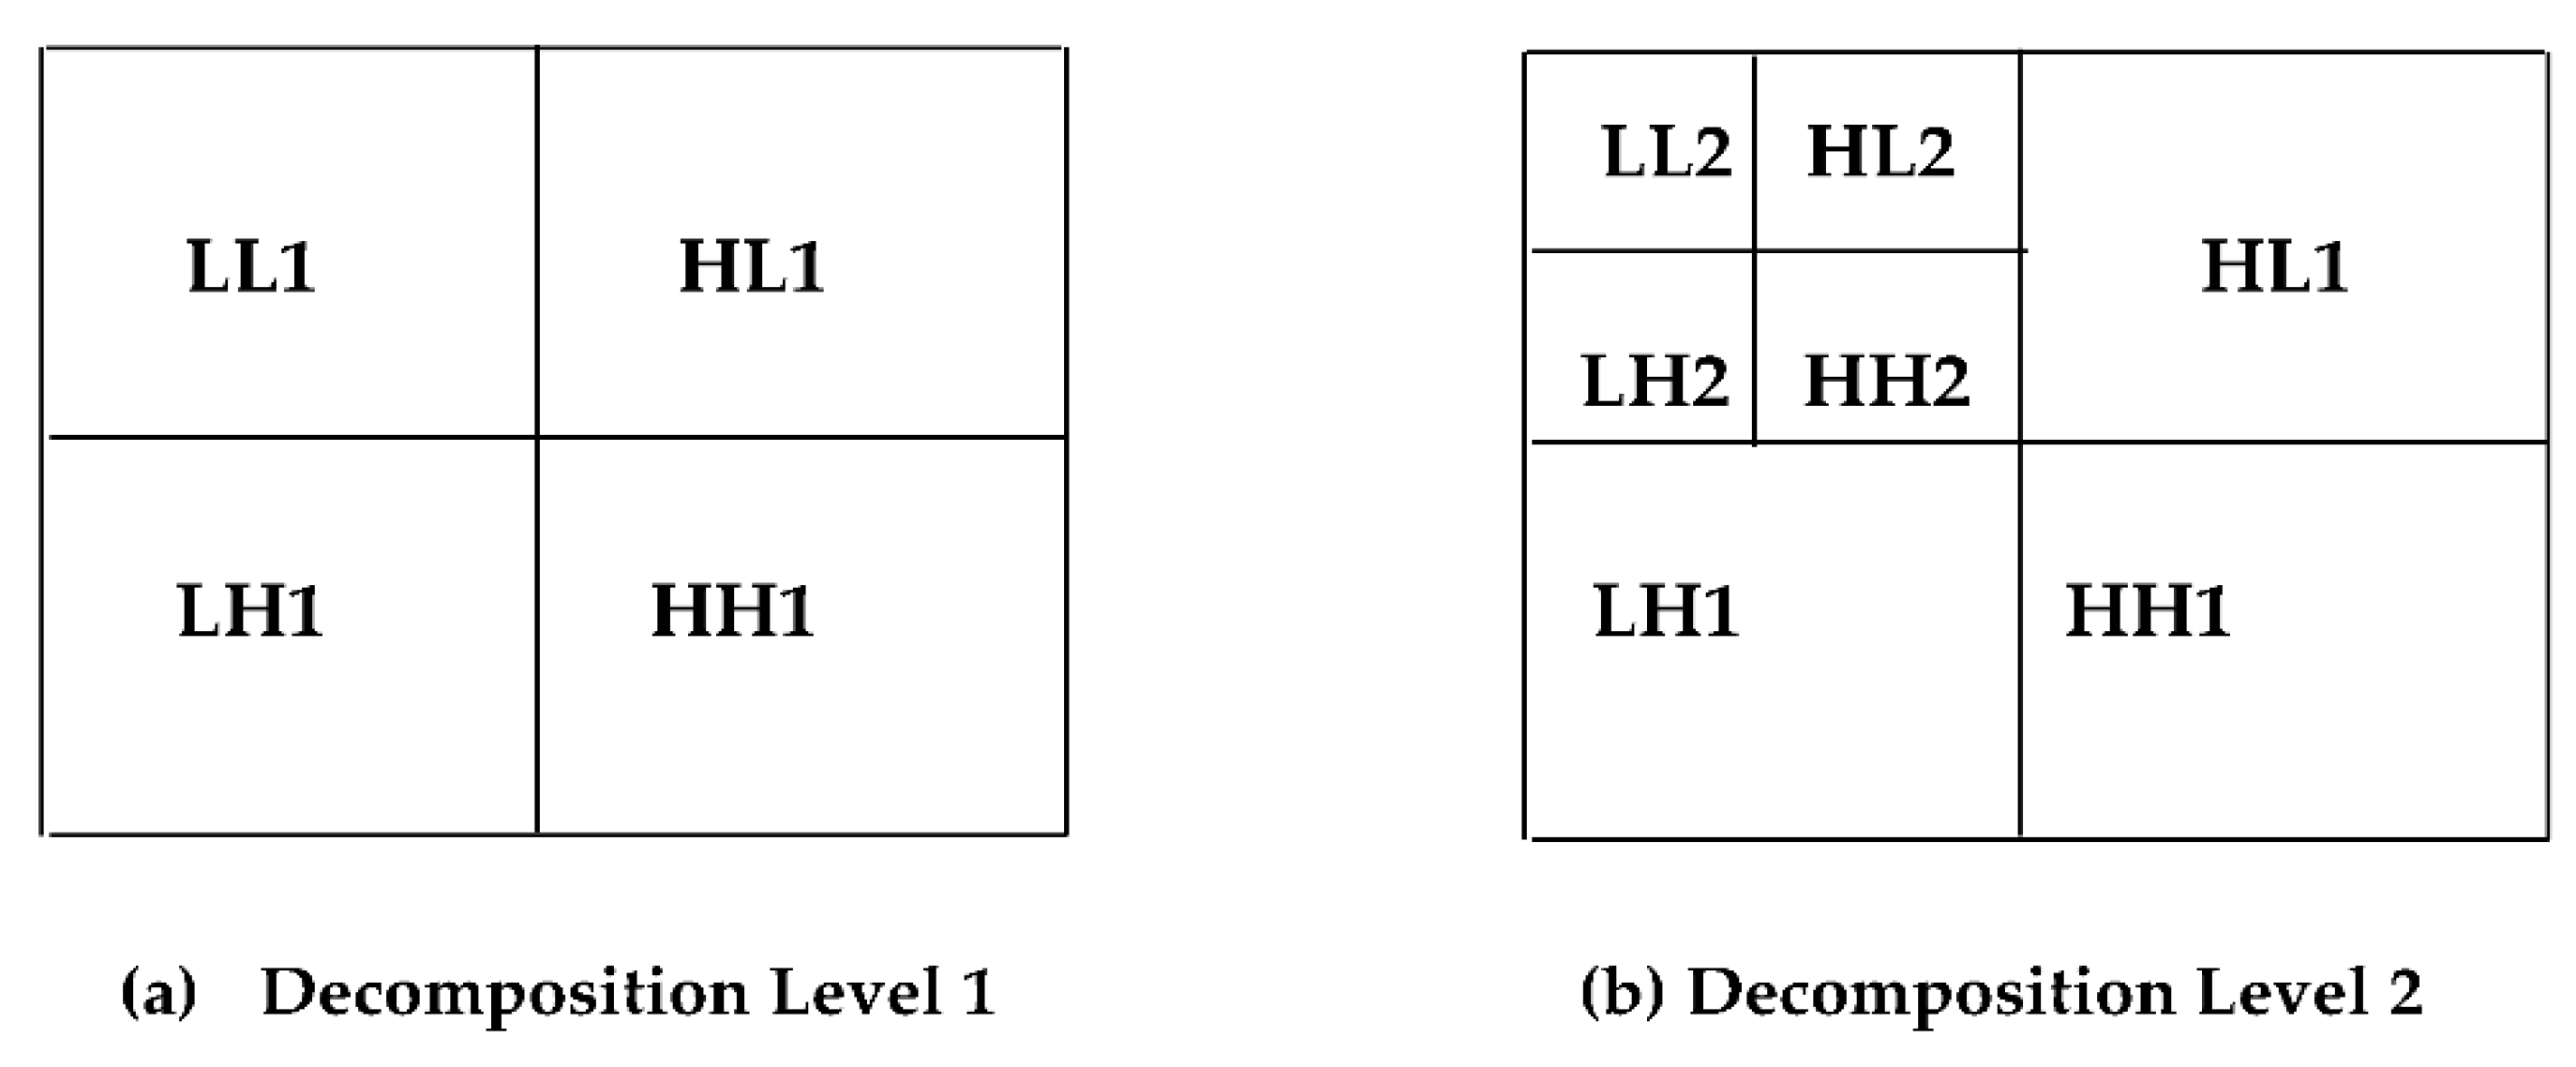
DWT is a mathematical tool which is used to decompose the input signal, image, audio or video into a number of decomposition levels (or sets) of coefficients into both spatial and frequency domains simultaneously [41]. The number of decomposition levels depends on the size of the analyzed signal or image, and the extent to which we want to obtain information about the input signal, as shown in Figure 3. There are many applications for DWT, and there are also different types of this useful tool. The interesting properties of DWT are the multiscale, localization and lossless properties. The mathematical equations of 2D DWT are given below:
The inverse 2D DWT is given by the following equations:
2.5. Proposed Method
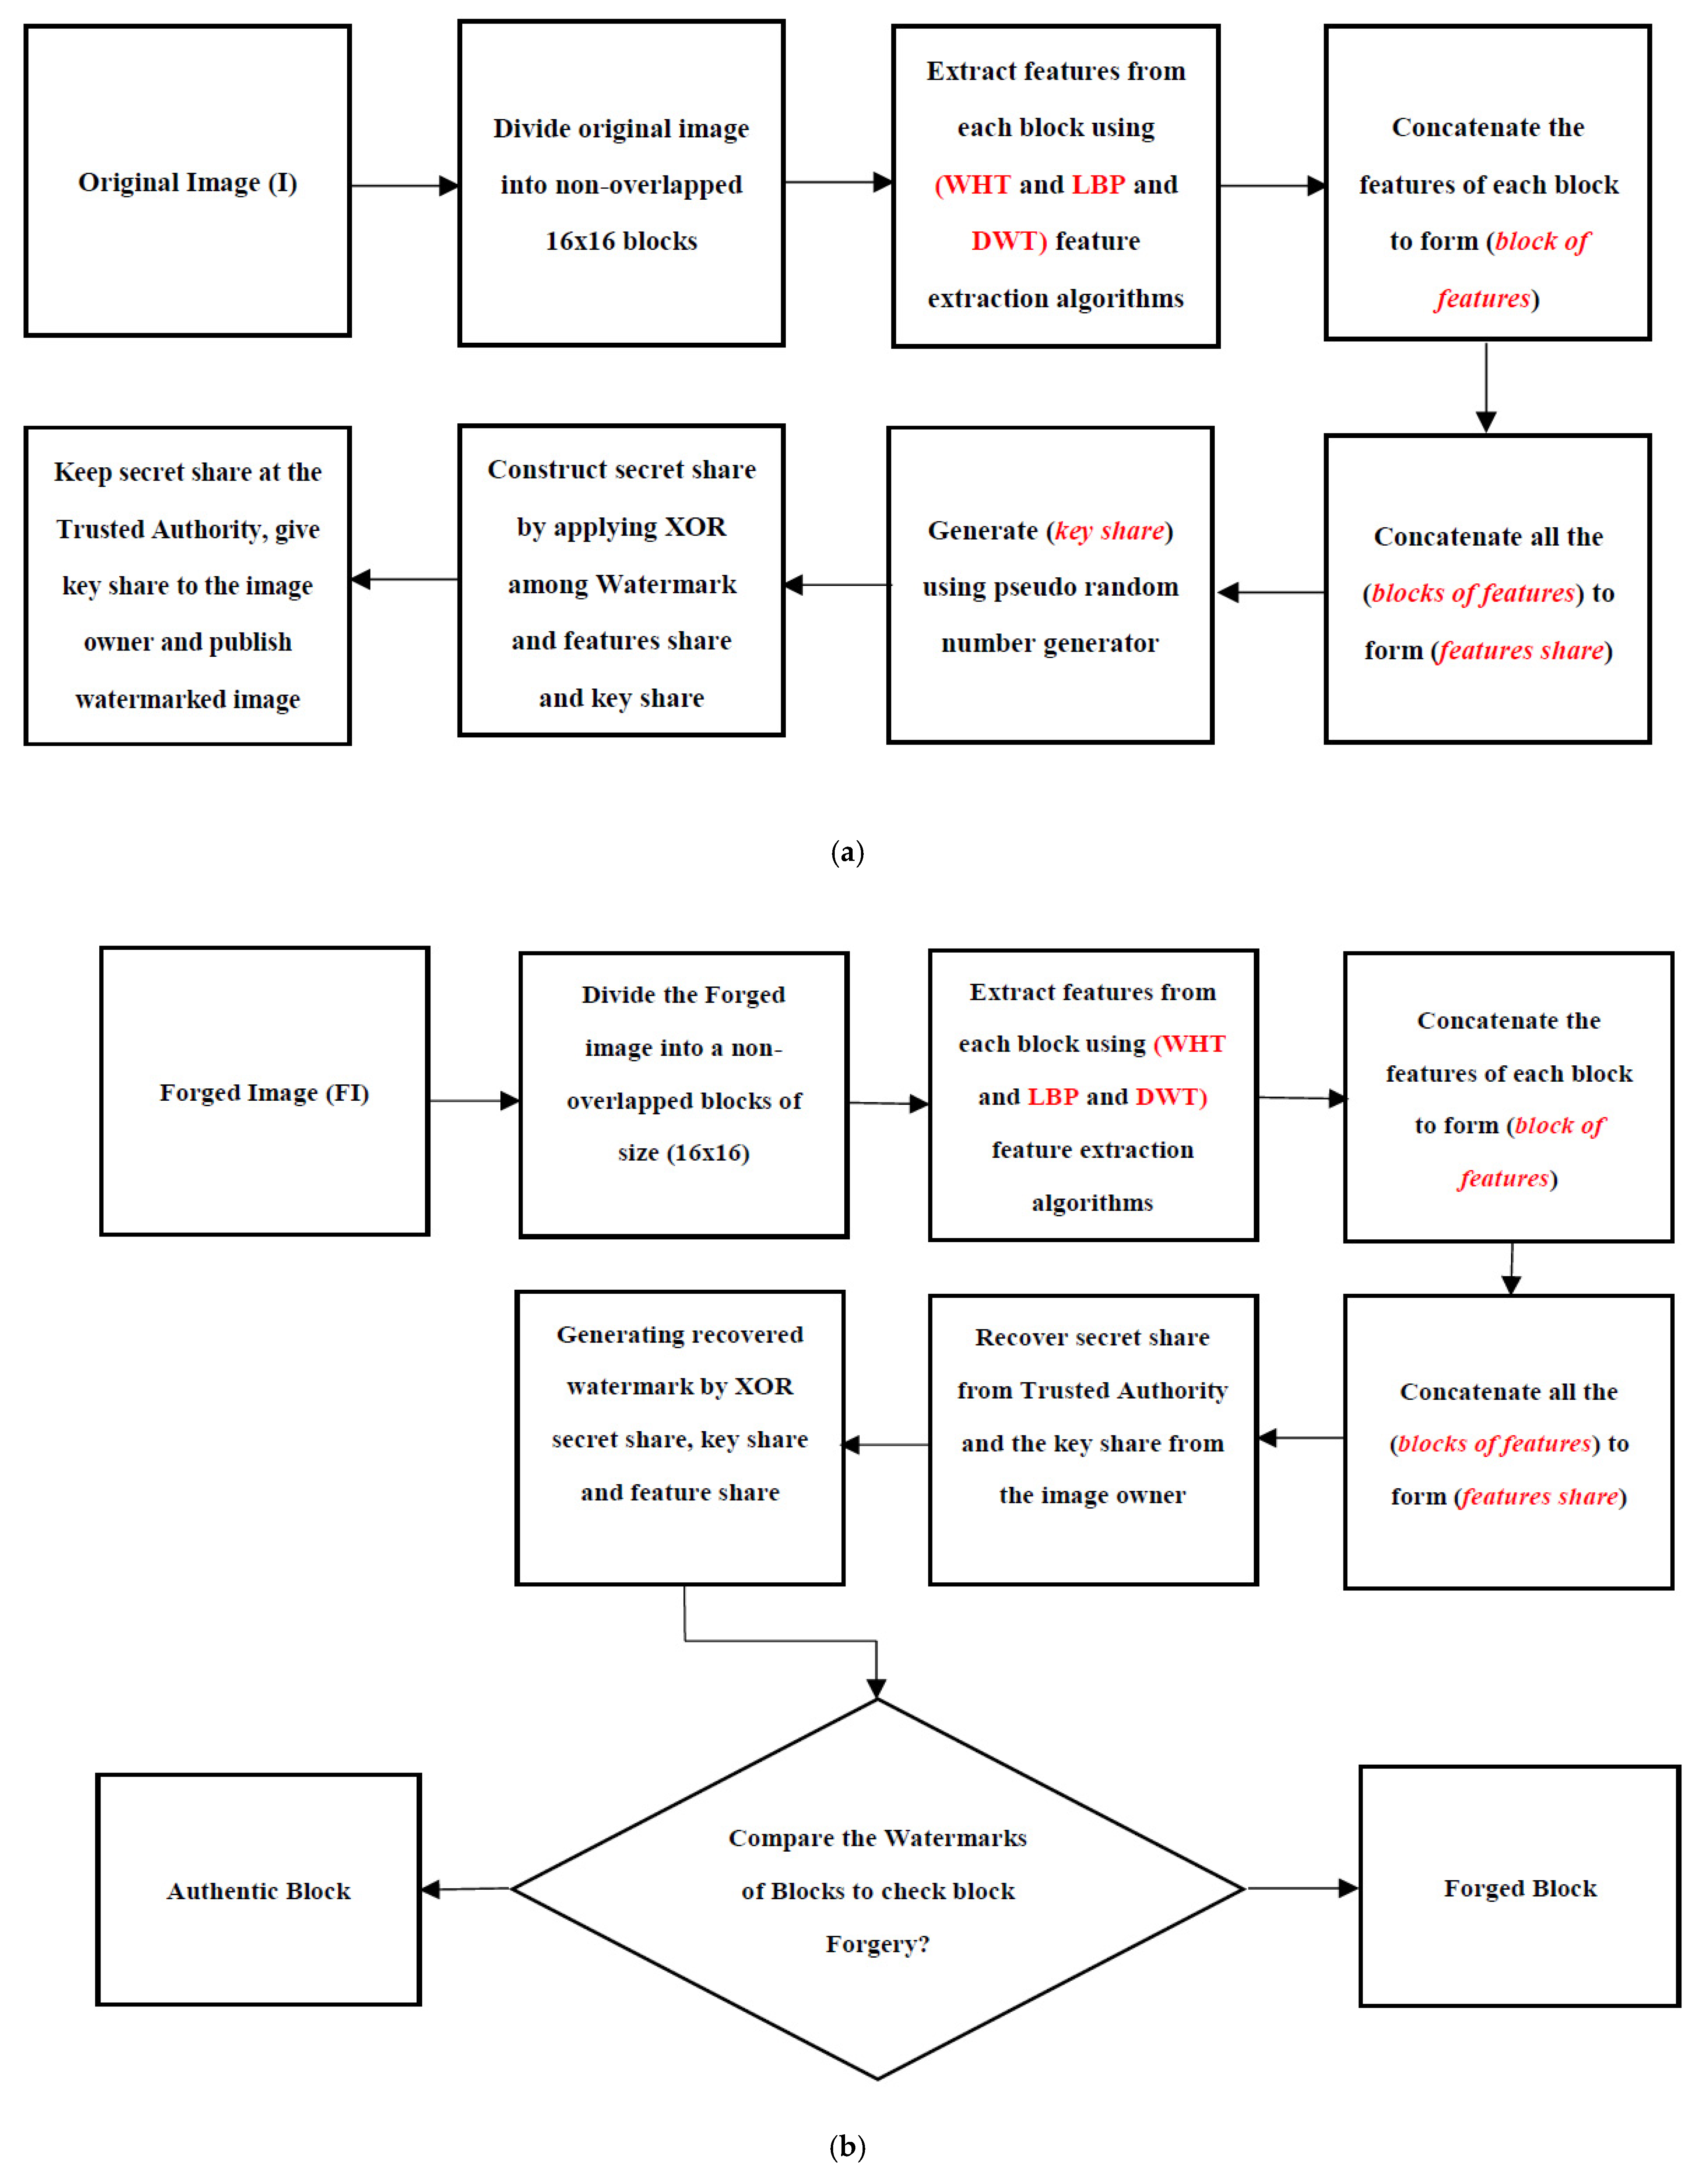
This section describes the proposed method employed for image forgery detection and localization using a VC-based watermarking scheme. Our proposed method consists of the Shares Construction Phase and Image Forgery Verification Phase, as shown below in the Figure 4. These phases are described below.
2.5.1. Shares Construction Phase
In this section, we explain the process of generating or constructing the features, key shares and secret shares. The features share is constructed for all of the image blocks using WHT, LBP and DWT. The pseudo code for this phase is described below, in Algorithm 1.
| Algorithm 1: Shares Construction Phase | |
| Input: Original Colour Image (I) of size (256 × 256) and Watermark (W) of size (256 × 256) | |
| Output: , | |
| Initialization: No. of Blocks = 16; Block Size = 16 × 16 pixels | |
| 1: | Divide image (I) into (16 × 16 = 256) blocks |
| 2: | For i = 1 into No. of Blocks |
| 3: | For j = 1 into No. of Blocks |
| 4: | vector |
| 5: | vector |
| 6: | vector |
| 7: | ] |
| 8: | (i, j) of size (16 × 16) |
| 9: | end |
| 10: | Add features block at location (i, j) into the feature share of size (256 × 256) (i, j) |
| 11: | end |
| 12: | Generate key share of size (256 × 256) using pseduo random number generator |
| 13: | Compute secret share |
| 14: | Keep secret share secretly with the trusted authority (TA) for future use |
| 15: | Key share (i.e., key image) is given secretly to the image owner |
| 16: | Publish watermarked image (I) and the waterark (W) |
WHT is used to extract directional features from each image block to assure the robustness of our proposed approach against geometrical attacks [37]. Then, LBP is used to extract the texture feature representation of image blocks that are robust to false positives and geometrical attacks [33]. Lastly, DWT is used to extract multiscale features from image blocks that represent the important features of each block at the different scales [41]. These features are combined together to form the block features, and then all of these block features are combined together to obtain the final feature share. The key share is generated randomly using a pseudo-random generator, and it is given secretly to the original image owner. Now, the secret share is constructed by applying the XOR operation between the original watermark, feature share and key share, as in the following equation:
where , , and represent the secret share, watermark, feature share and key share. Here, the key share is generated randomly for each tested image. Then, the secret share is constructed by exclusive OR among the watermark, feature share and key share.
2.5.2. Image Forgery Verification Phase
This section sheds light on the process of watermark extraction and forgery detection, and the localization process. In this phase, the forged image is first divided into 256 non-overlapped blocks, and then we compute the feature share in the same way described earlier in the shares construction phase (Section 2.5.1). After that, the secret share is recovered from the trusted authority (TA) and the key share is received from the owner of the original digital image. The recovered watermark is computed by exclusive OR among the feature, secret and key shares. The forgery verification is started by dividing the original and recovered watermarks into 256 blocks of size (16 × 16), and then exclusive OR between these blocks. Depending on the results of the matching between the blocks of two watermarks, we can specify whether the block is authentic or forged. Hence, if the result of exclusive OR between them is 0, then there is no forgery and the block is authentic; otherwise, if the result is 1, then this block is forged. After we specified the authentic and forged blocks, these blocks were marked as authentic or not by setting the pixels in the forged image to 1 or 0. The pseudo-code of the image forgery verification is illustrated in Algorithm 2.
3. Experimental Results and Analysis
The researchers conducted many experiments to prove the validity, robustness, effectiveness, efficiency and high performance of the proposed approach. Matlab 2018 software was used to do perform the experiments on an Intel (R) Core (TM) i7 CPU @ 2.30 GHz processor, 8.00 GB RAM laptop. The employed image forgery dataset, performance metrics and results are elaborated in the following subsections.
3.1. Benchmarking Image Datasets
The CASIA tampering image dataset was used in our experiments to evaluate our proposed approach. CASIA V 1.0 and CASIA V 2.0 are the two versions of this dataset, and in these experiments only the first version (V 1.0) was used in the implementation of our experiments. There are 1725 color images of 384 × 256 pixels in the V 1.0 dataset, all of which are in the JPEG format. In this version of the benchmarking dataset, there are two groups of images: authentic and tampered. In the authentic group there are 921 images, while in the tampered group there are 800 images. The images in this dataset are categorized into eight classes based on the image contents. The images are manipulated by different kinds of copy- paste tampering operation with different sizes of forgery (i.e., small, medium, and large). Furthermore, the source of tampering could be from the same or a different image.
| Algorithm 2: Image Forgery Verification Phase | |
| Input: , all of size (256 × 256). | |
| Output: Forged Regions Matrix FRM of size (16 × 16) | |
| Initialization: No. of Blocks = 16; Block Size = 16 × 16 pixels | |
| 1: | Divide Image FI into (16 × 16 = 256) blocks |
| 2: | For i = 1 into No. of Blocks |
| 3: | For j = 1 into No. of Blocks |
| 4: | vector |
| 5: | vector |
| 6: | vector |
| 7: | ] |
| 8: | (i, j) of size (16 × 16) |
| 9: | end |
| 10: | Add features block at location (i, j) into the secret share of size (256 × 256) (i, j) |
| 11: | end |
| 12: | Obtain key share of size (256 × 256) from Image Owner |
| 13: | Recover From the trusted authority (TA) to compute watermark |
| 14: | Compute Extracted Watermark |
| 15: | Divide Watermark and into (16 × 16 = 256) blocks |
| 16: | Verify if there exist forgery in each block of the image as follows: |
| 17: | For i = 1 into No. of Blocks |
| 18: | For j = 1 into No. of Blocks |
| 19: | (i, j) |
| 20: | IF ( == 0) Then |
| 21: | equal to (i, j) and the block (i, j) is Authentic Set block (i, j) = 0 in FRM matrix |
| 22: | Else |
| 23: | unequal to (i, j) and the block (i, j) is forged Set block (i, j) = 1 in FRM matrix |
| 24: | end |
| 25: | end |
| 26: | end |
| 27: | Remove Outlier Blocks |
| 28: | If all blocks of the image (FI) equal zero Then |
| 29: | Image (FI) is Authentic and there is no forgery in the image |
| 30: | Else |
| 31: | Image (FI) is forged image and the forged blocks in matrix FRM |
| 32: | End |
| 33: | End |
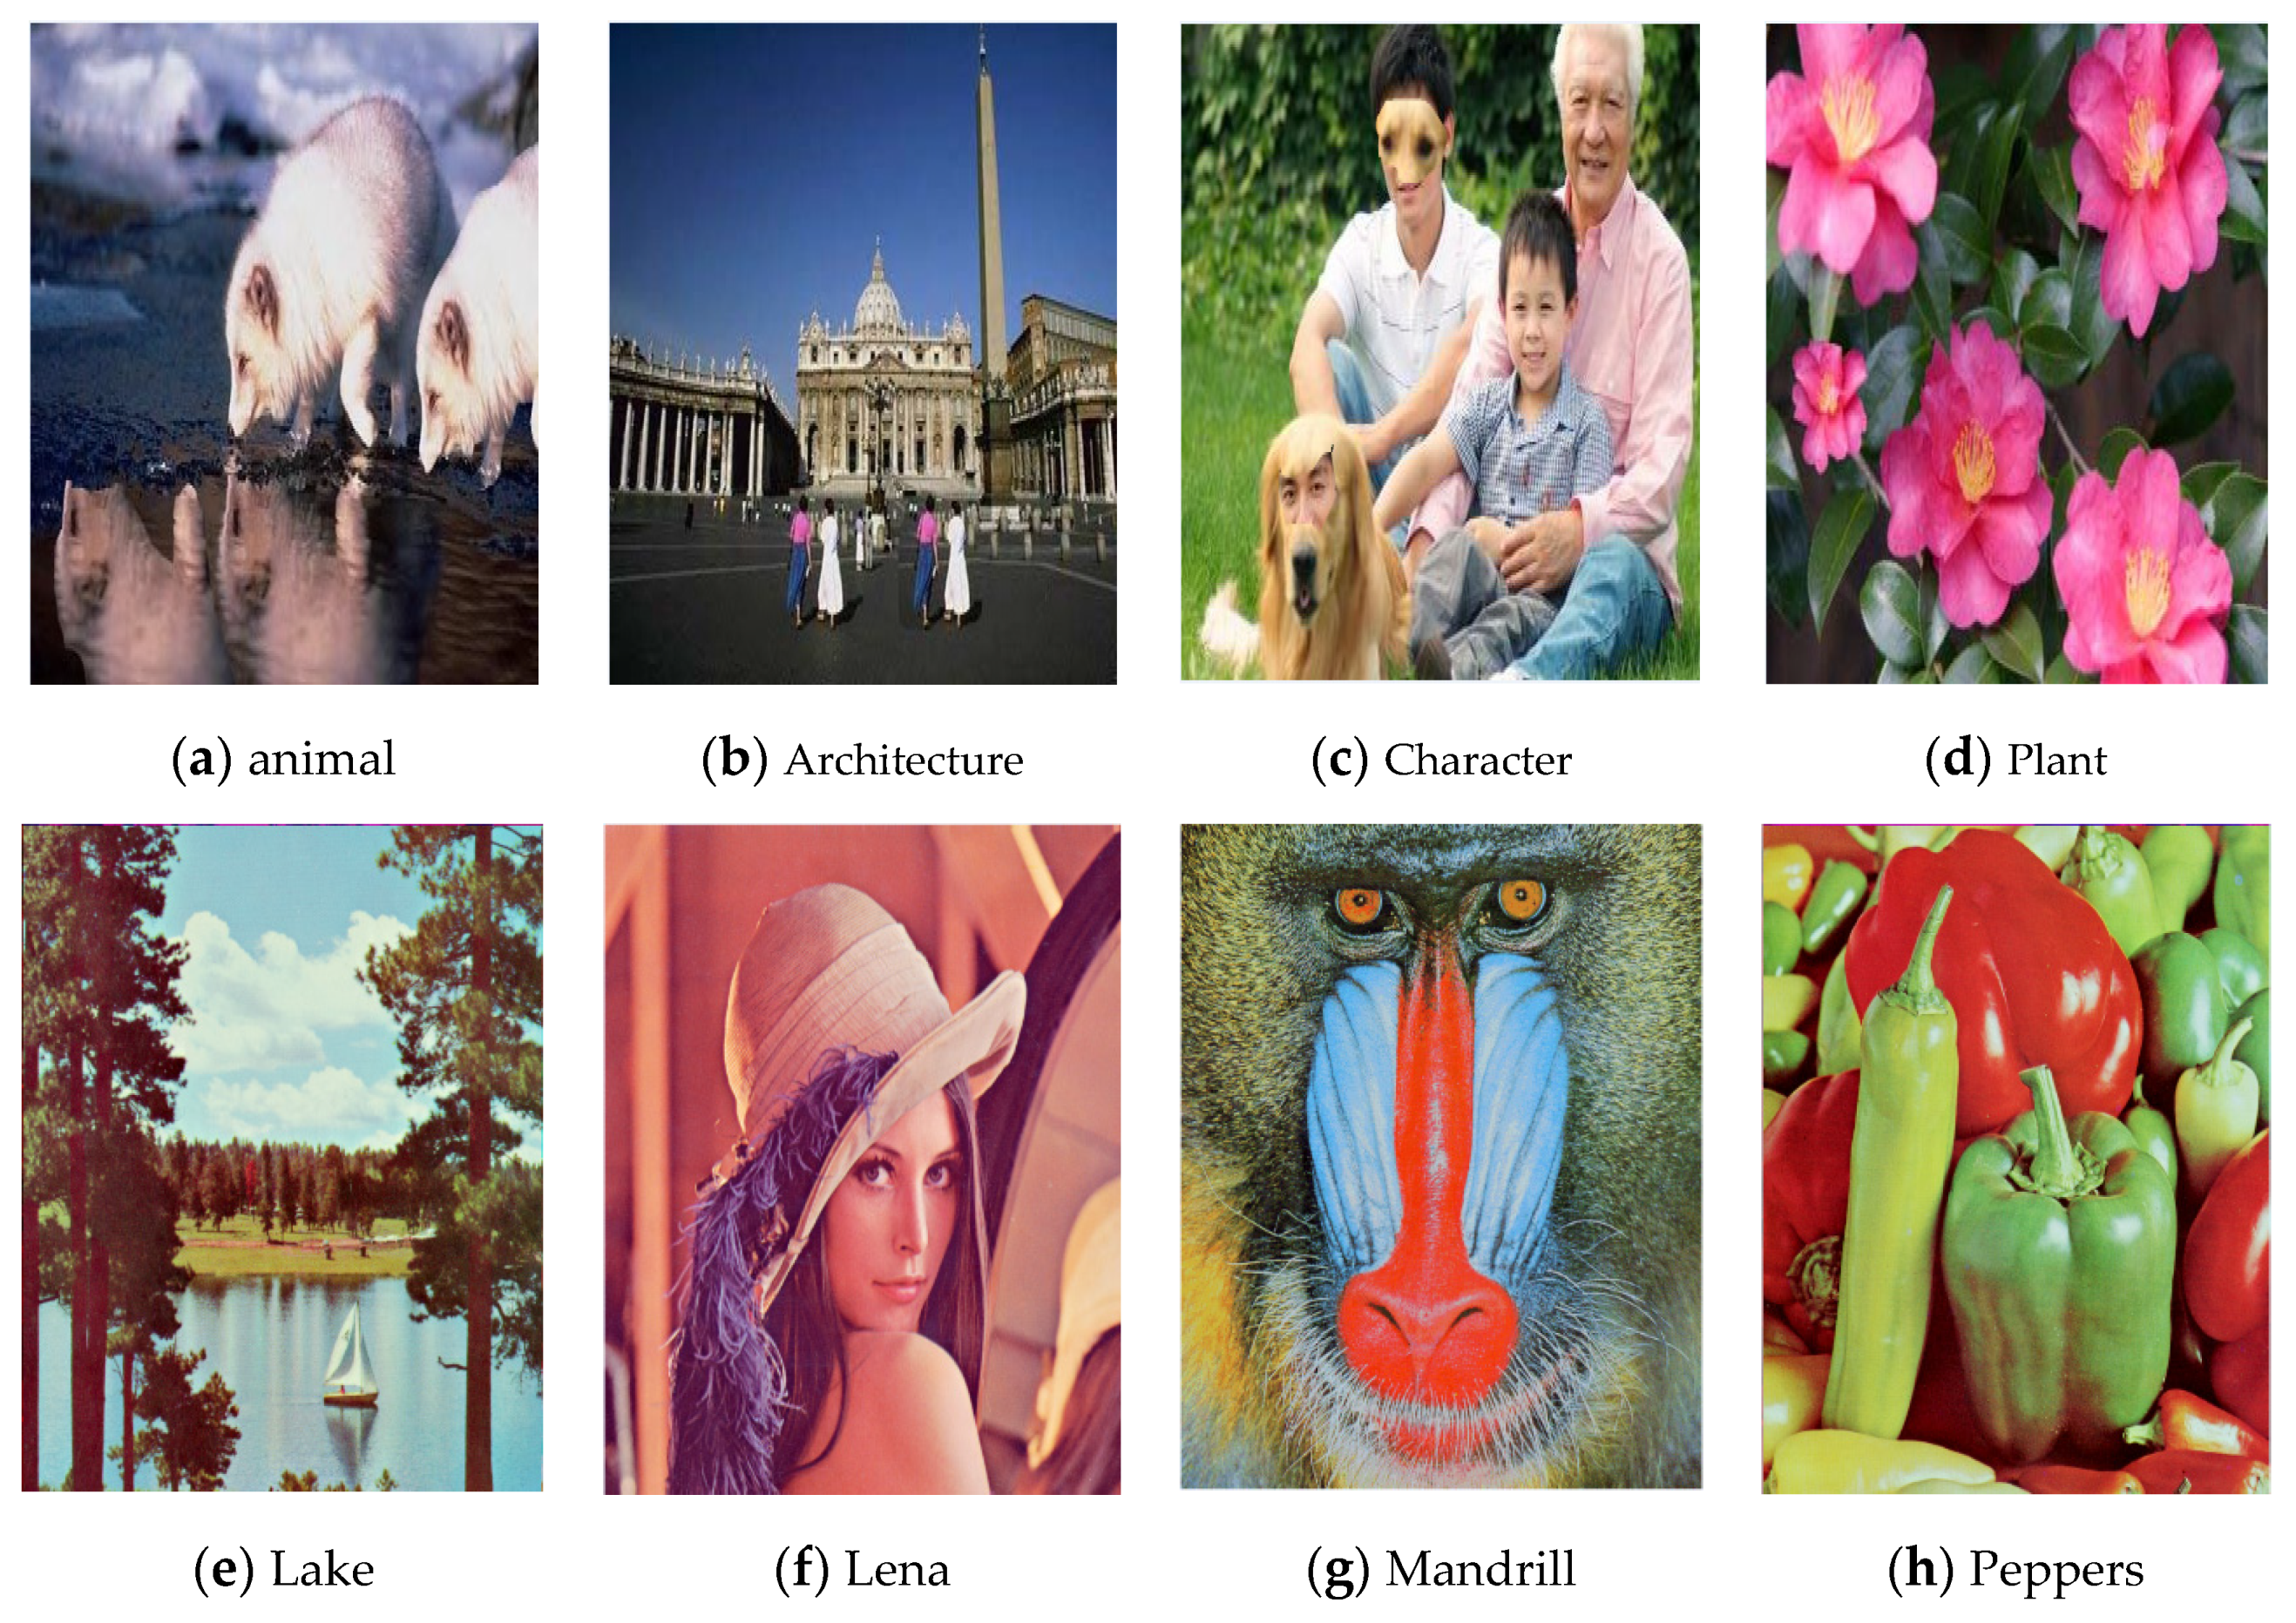
In addition, the shapes of the paste- forged regions are circular, rectangular, triangular, and of an arbitrary boundary. the paste- forged regions are circular, rectangular, triangular, and of an arbitrary boundary. Figure 5, below, shows examples of the CASIA V 1.0 forged image dataset, and also the four standard images of the SIPI dataset (Lake, Lena, Mandrill, Peppers). In this figure, there are images from the animal, architecture, character and plant categories that represent the most apparent texture classes within the CASIA V 1.0 dataset. Hence, they are presented here in this figure. For the SIPI dataset, four different images are used in the experiments described in the next subsections of this research article. The images in these datasets were taken by professional people within real environments that simulate the practical applications for real-time systems.
3.2. Performance Metrics
This section is devoted to the illustration of the performance metrics employed in our experiments to measure the system performance objectively. Furthermore, we give a subjective evaluation of our approach in Figure 6 using several examples of forged images. The performance metrics are elaborated below.
3.2.1. Peak-to-Signal-Noise-Ratio Measure (PSNR)
PSNR is a well-known measure to assess quantitatively the quality of a recovered image after processing, either by compression or encryption. It quantifies the difference between the original and recovered image pixels. The mathematical equations of this metric are
where the mean square error (MSE) quantifies the error difference between the original image I (i, j) and the recovered image K (i, j). Furthermore, the variables M and N represent the dimensions of the images I and K, and (i, j) represents the indices of these images.
3.2.2. Structural Similarity Index (SSIM)
The SSIM index is a popular metric to quantify the analogy between the original image and the recovered image using the concepts of the human visual system (HSV) [42]. It measures the quality of a recovered image by quantifying the difference in contrast, luminance and structure. The mathematical equation of this metric is:
where x and y are windows of images X and Y, and the explanation of the statistical parameters of this model can be found in several references.
The mean SSIM is between two images, X and Y, over (n) windows.
NC is the normalized correlation coefficient, and () is the size of the watermark. TAF is the tampering assessment function and are the original and extracted watermarks. BER is the bit error rate, X represents the number of bits that changed because of noise, is the exulsive OR operation, and () is the AND operation.
3.2.3. Classification Measures
The image forgery problem corresponds to the binary classification in which either the block is forged (True class) or authentic (False Class). Hence, the false positive rate FP, true positive rate TP, false negative rate FN, and true negative rate TN are the main measures of forgery classification accuracy that are utilized in our experiments. The efficiency and robustness of the proposed approach can be quantified using the F1 score, precision and recall, as follows:
3.3. Results
Extensive experiments were conducted to prove the validity, robustness and effectiveness of the proposed image forgery detection and localization approach. The CASIA V 1.0 image forgery dataset was used in our experiments to test the forgery detection and localization capability of the proposed approach. In addition, a group of standard images from the SIPI image dataset of TIFF format of size (512 × 512) were also used to compare the performance of the proposed approach with the state-of-the-art approaches. Three groups of experiments were performed, which were named as follows: (1) images with forgery only, (2) images with combined effects (i.e., forgery + another attack), and (3) comparative analysis. Table 1, Table 2, Table 3, Table 4, Table 5, Table 6 and Table 7 are presented in the following subsections to show the results from the CASIA V 1.0 and SIPI datasets.
3.3.1. First Group of Experiments (Images with Forgery only)
In this group of experiments, the CASIA dataset was used to evaluate the robustness of the proposed approach. Table 1, below, shows the classification performance of the forgery detection approach using precision, recall and F1 score measures, and NC, TAF, BER, PSNR and SSIM image quality measures.
The first column in Table 1 represents the category of forged images in the following manner: anim (animal category), arch (architecture), pla (plants), txt (text), nat (nature), cha (character), and sec (scene). It is evident from the experimental results shown in this table that the different categories have different forgery detection results, with an average detection accuracy of 97%. This can be attributed to the varying nature and texture of the images within each class. It can also be noticed that the text category obtained the highest classification accuracy (99%) among all of the CASIA classes. Furthermore, the NC, TAF, BER, PSNR and SSIM measures are presented to quantify the quality of the reconstructed watermark in comparison with the original watermark. Hence, the values of these metrics in this table reveal the fact that the different classes have different detection results, but with average accuracy (NC = 96% and TAF = 96%). For BER, it can be noticed that the range of values is between 0.03 and 0.05. These values are within the acceptable range of errors in the bits for the images which contain a forgery of variable size, shape and texture. In addition, we obtained the average values of the PSNR (14.24%) and SSIM (0.7%) quality measures, because there are different amounts of forgeries in the processed digital images. To sum up, the overall results in this table indicate the good performance of the proposed image forgery detection approach, and Figure 6 is presented below to show some of these detection results.
3.3.2. Second Group of Experiments (Images with Combined Attacks)
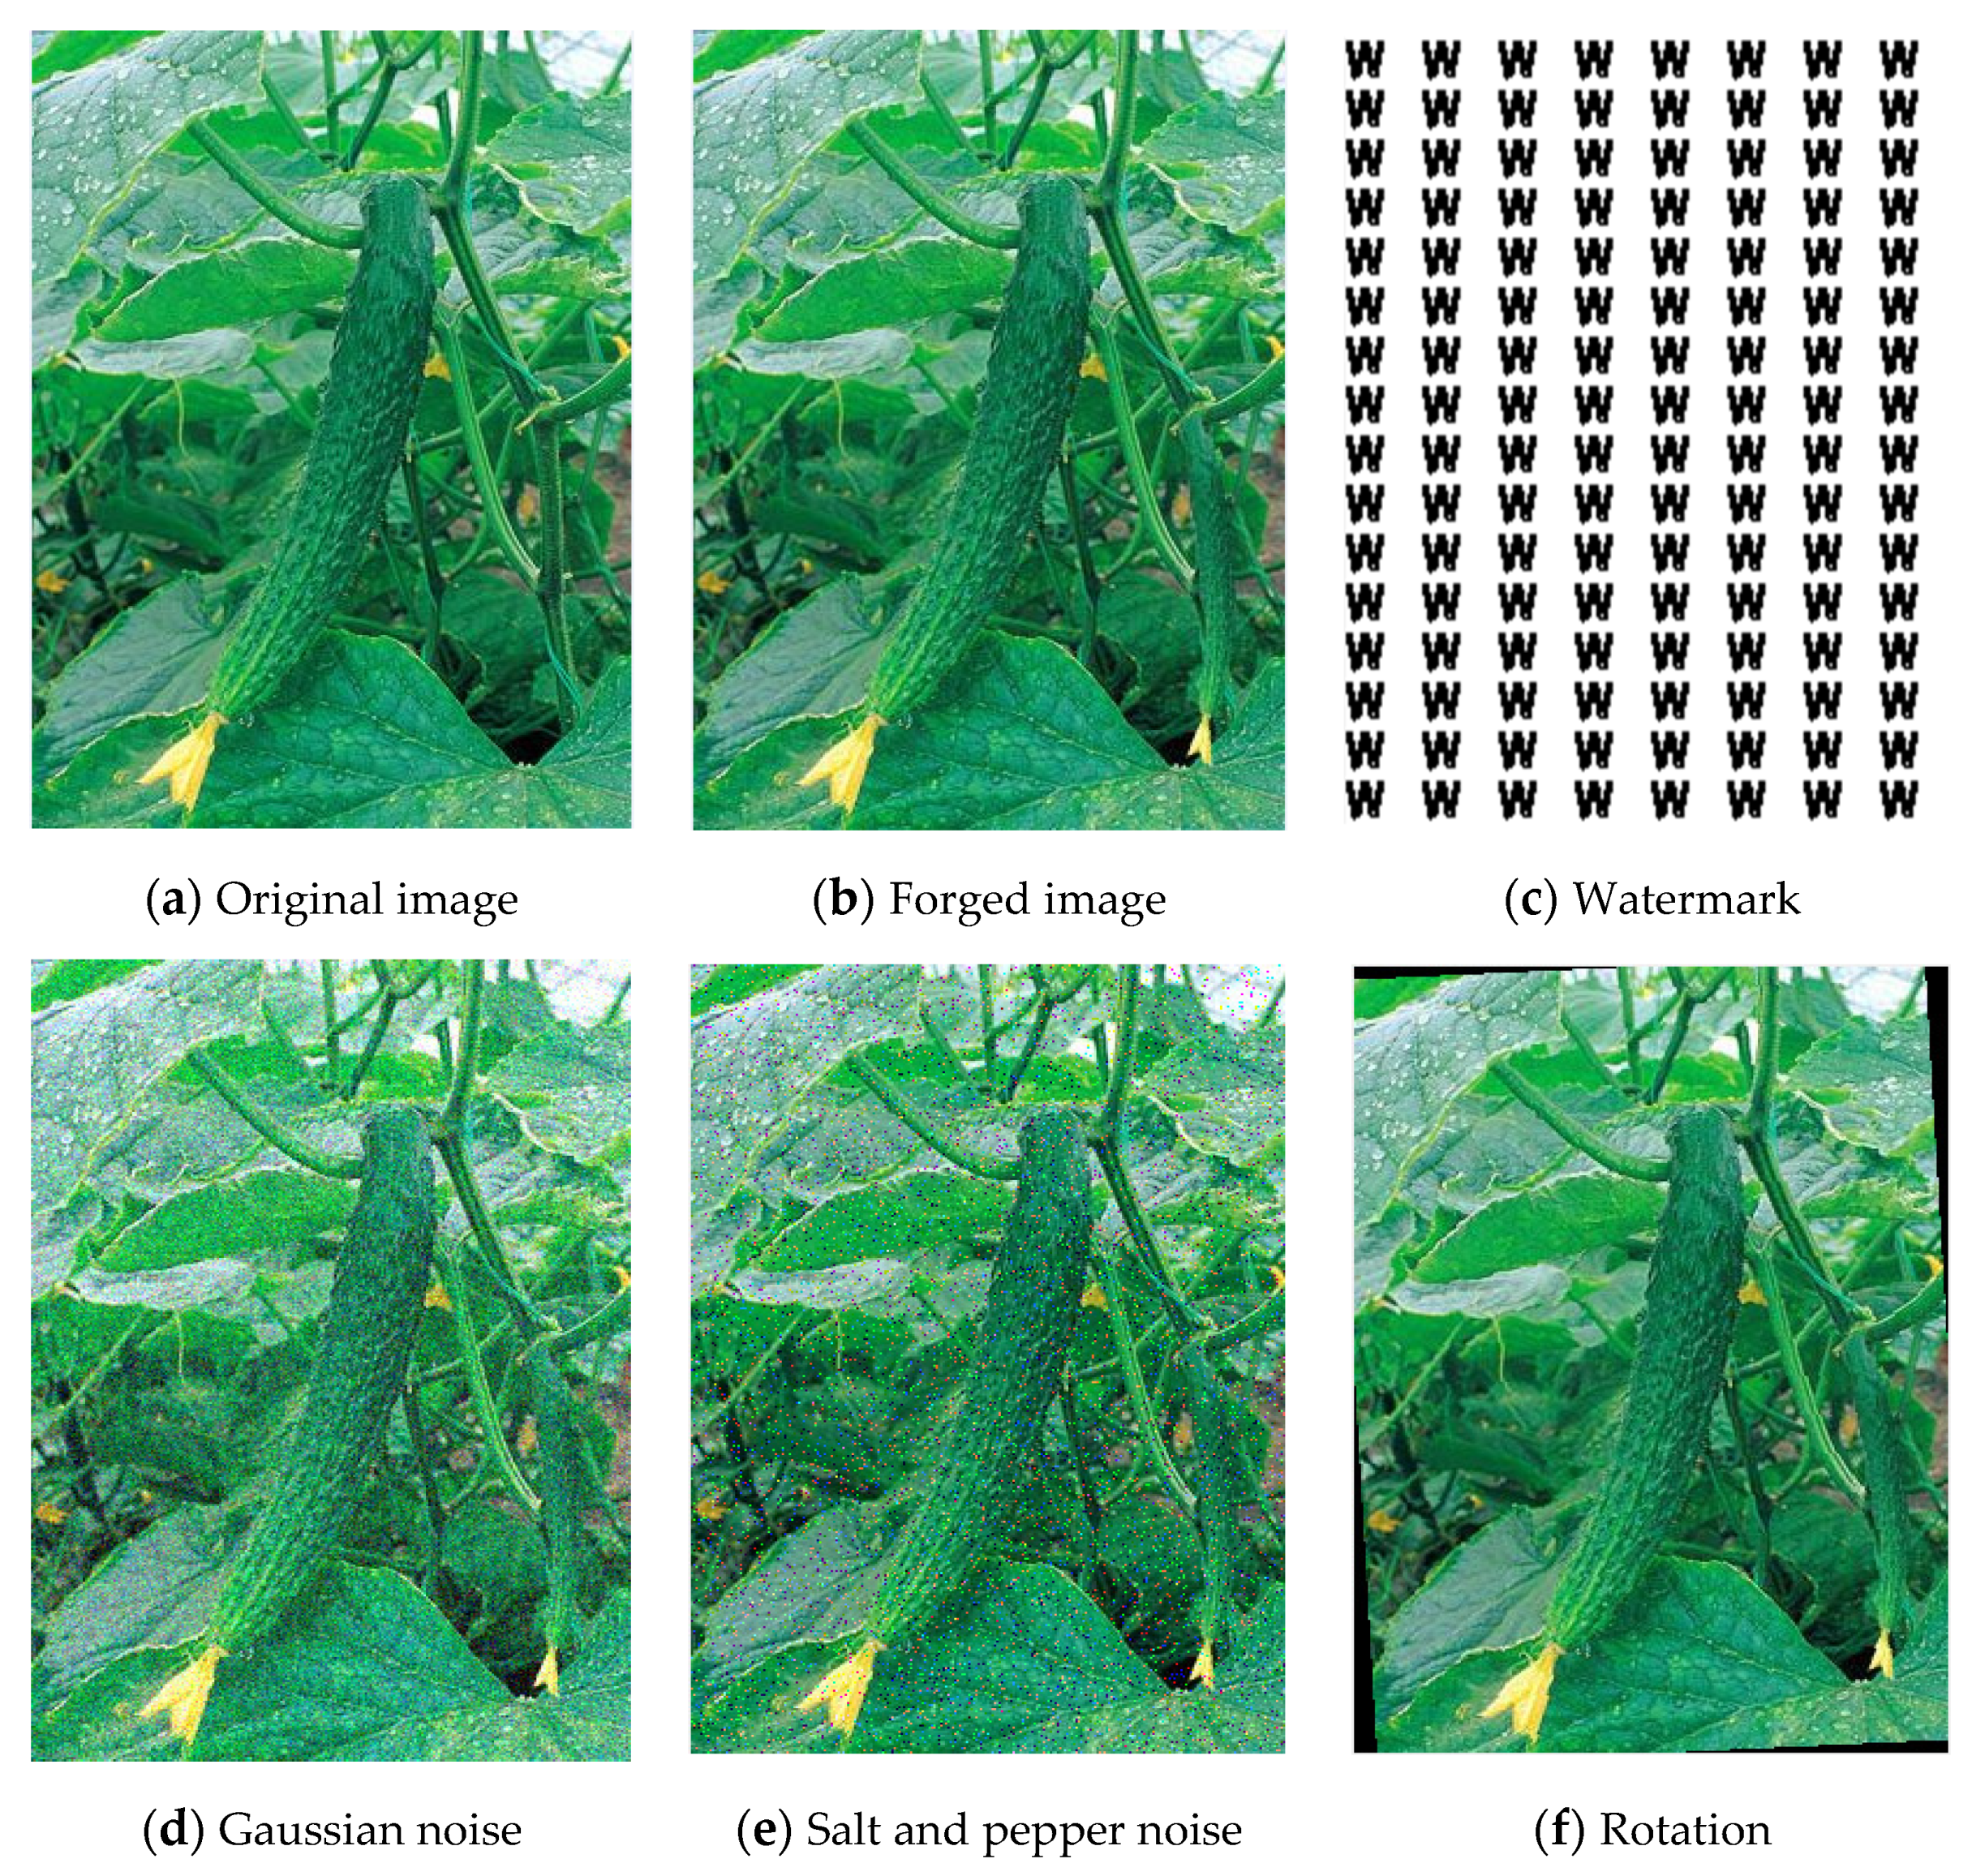
The aim of this group of experiments is to analyze the effects of several attacks on the performance of the proposed image forgery detection approach. In these experiments, a combination of attacks is applied to the images. For example, a combination of (forgery + compression), (forgery + noise), (forgery + scaling) or (forgery + rotation) is used to simulate the real attacks on the digital images, as shown below in Figure 7.
It is also worth mentioning that, in this figure, the original watermark is inserted along with the attacked forged images to show the effects of forgery and attacks on the original watermark. Table 2, Table 3, Table 4 and Table 5 show the results of the application of image processing and geometrical attacks to the forged images in the CASIA V1.0 dataset. The compression, noise, rotation and scaling attacks are the most important attacks that can confront the digital image during the acquisition, processing or/and transmission. Table 2, below, shows the results in terms of precision, recall and F1 score classification measures, and NC, TAF, BER, PSNR and SSIM image quality measures after the attacking of the forged images by the compression attack.
The results in Table 2 show that the precision, recall and F1 score values of the forgery classification measures increased ascendingly with the increasing value of the compression quality factor (i.e., the increase in the quality of the forged image) with average metric values of 97%, 97% and 97%, respectively. This is an expected result, as the increase in the quality of the compression produces high-quality images that lead ultimately to good classification results. The results in this table also show that the NC, TAF, PSNR and SSIM metric values increase gradually with the increasing value of the compression quality factor, with average metric values of 97%, 94%, 12.48% and 64%, respectively. Such behavior can be also attributed to the production of high-quality images after high-quality compression. For BER, we noticed that the error rates decreased with the increased compression quality of the forged image, which eventually implies good classification and reconstruction performance results.
The noise in the acquisition sensor or during the data transmission has a non-trivial influence on the performance of the image forgery detection system. We observed from the experimental results in Table 3 that the precision, recall and F1 score classification measure values started to decrease gradually with the increasing noise level, with average values of 95% for all of the forgery classification metrics. Such behavior is expected, as noise decreases the quality of the forged images, which eventually affects the quality of the image features and texture. Then, the classification performance of the proposed approach will be affected by such a decrease in the quality of the features. We found the same trend in the NC (94%), TAF (94%), PSNR (12.10%) and SSIM (61%) image quality measures, i.e., the values of these measures decreased gradually with the increased noise level. However, the values of all of the explained measures were still good enough to resist the noise attack. Lastly, the error rates (BER) increased gradually with the increasing noise level, with an average error rate of 6%.
For the scaling geometrical attack, the average values of the precision, recall and F1 score measure values were 93%, 95% and 94%, respectively, as shown in Table 4. From these results, we can notice that the scaling attack has a non-trivial influence on the forgery classification performance of the proposed approach, especially with the increasing value of the scaling factor. Furthermore, the values of the NC, TAF, PSNR and SSIM watermark image quality measures decreased gradually with the increasing value of the scaling factor, with average values of 92%, 92%, 11.02% and 57% for these metrics, respectively. The cause of such a trend or behavior of the results is attributed to the change in the geometry of the texture and features of the forged images, which eventually lead to the decrease in the classification performance to some extent. For BER, the error rates increased gradually with the increasing value of the scaling factor, with average value of 8%. Finally, we have to mention that the performance of the forgery detection approach under this attack, with the values in Table 4, can be regarded as sufficiently good and competitive. They refer to the resistance of the proposed approach for such a kind of challenging attack.
Table 5 presents the results of the application of a rotation geometrical attack to the forged images. The results show that the trend of precision, recall and F1 score classification metrics monotonically decreases with the increasing of the rotation angle, with average values of 94%, 95% and 94% for these metrics, respectively. Such behavior in the classification measure values is attributed to the influential effects of rotation on the texture and features of the forged images, which lead to difficulty in the classification of the forged blocks. Now, if we look at the watermark image quality measures, the trend of these measures is similar to the trend of the forgery classification metrics. In other words, their values decrease with increase of the rotation angle, with average values of NC (92%), TAF (92%), PSNR (10.79%) and SSIM (56%). Finally, the error rates represented by BER increase gradually with the increasing value of the rotation angle, and such behavior is expected for the reasons mentioned earlier in this paragraph.
3.3.3. Third Group of Experiments (Comparative Analysis)
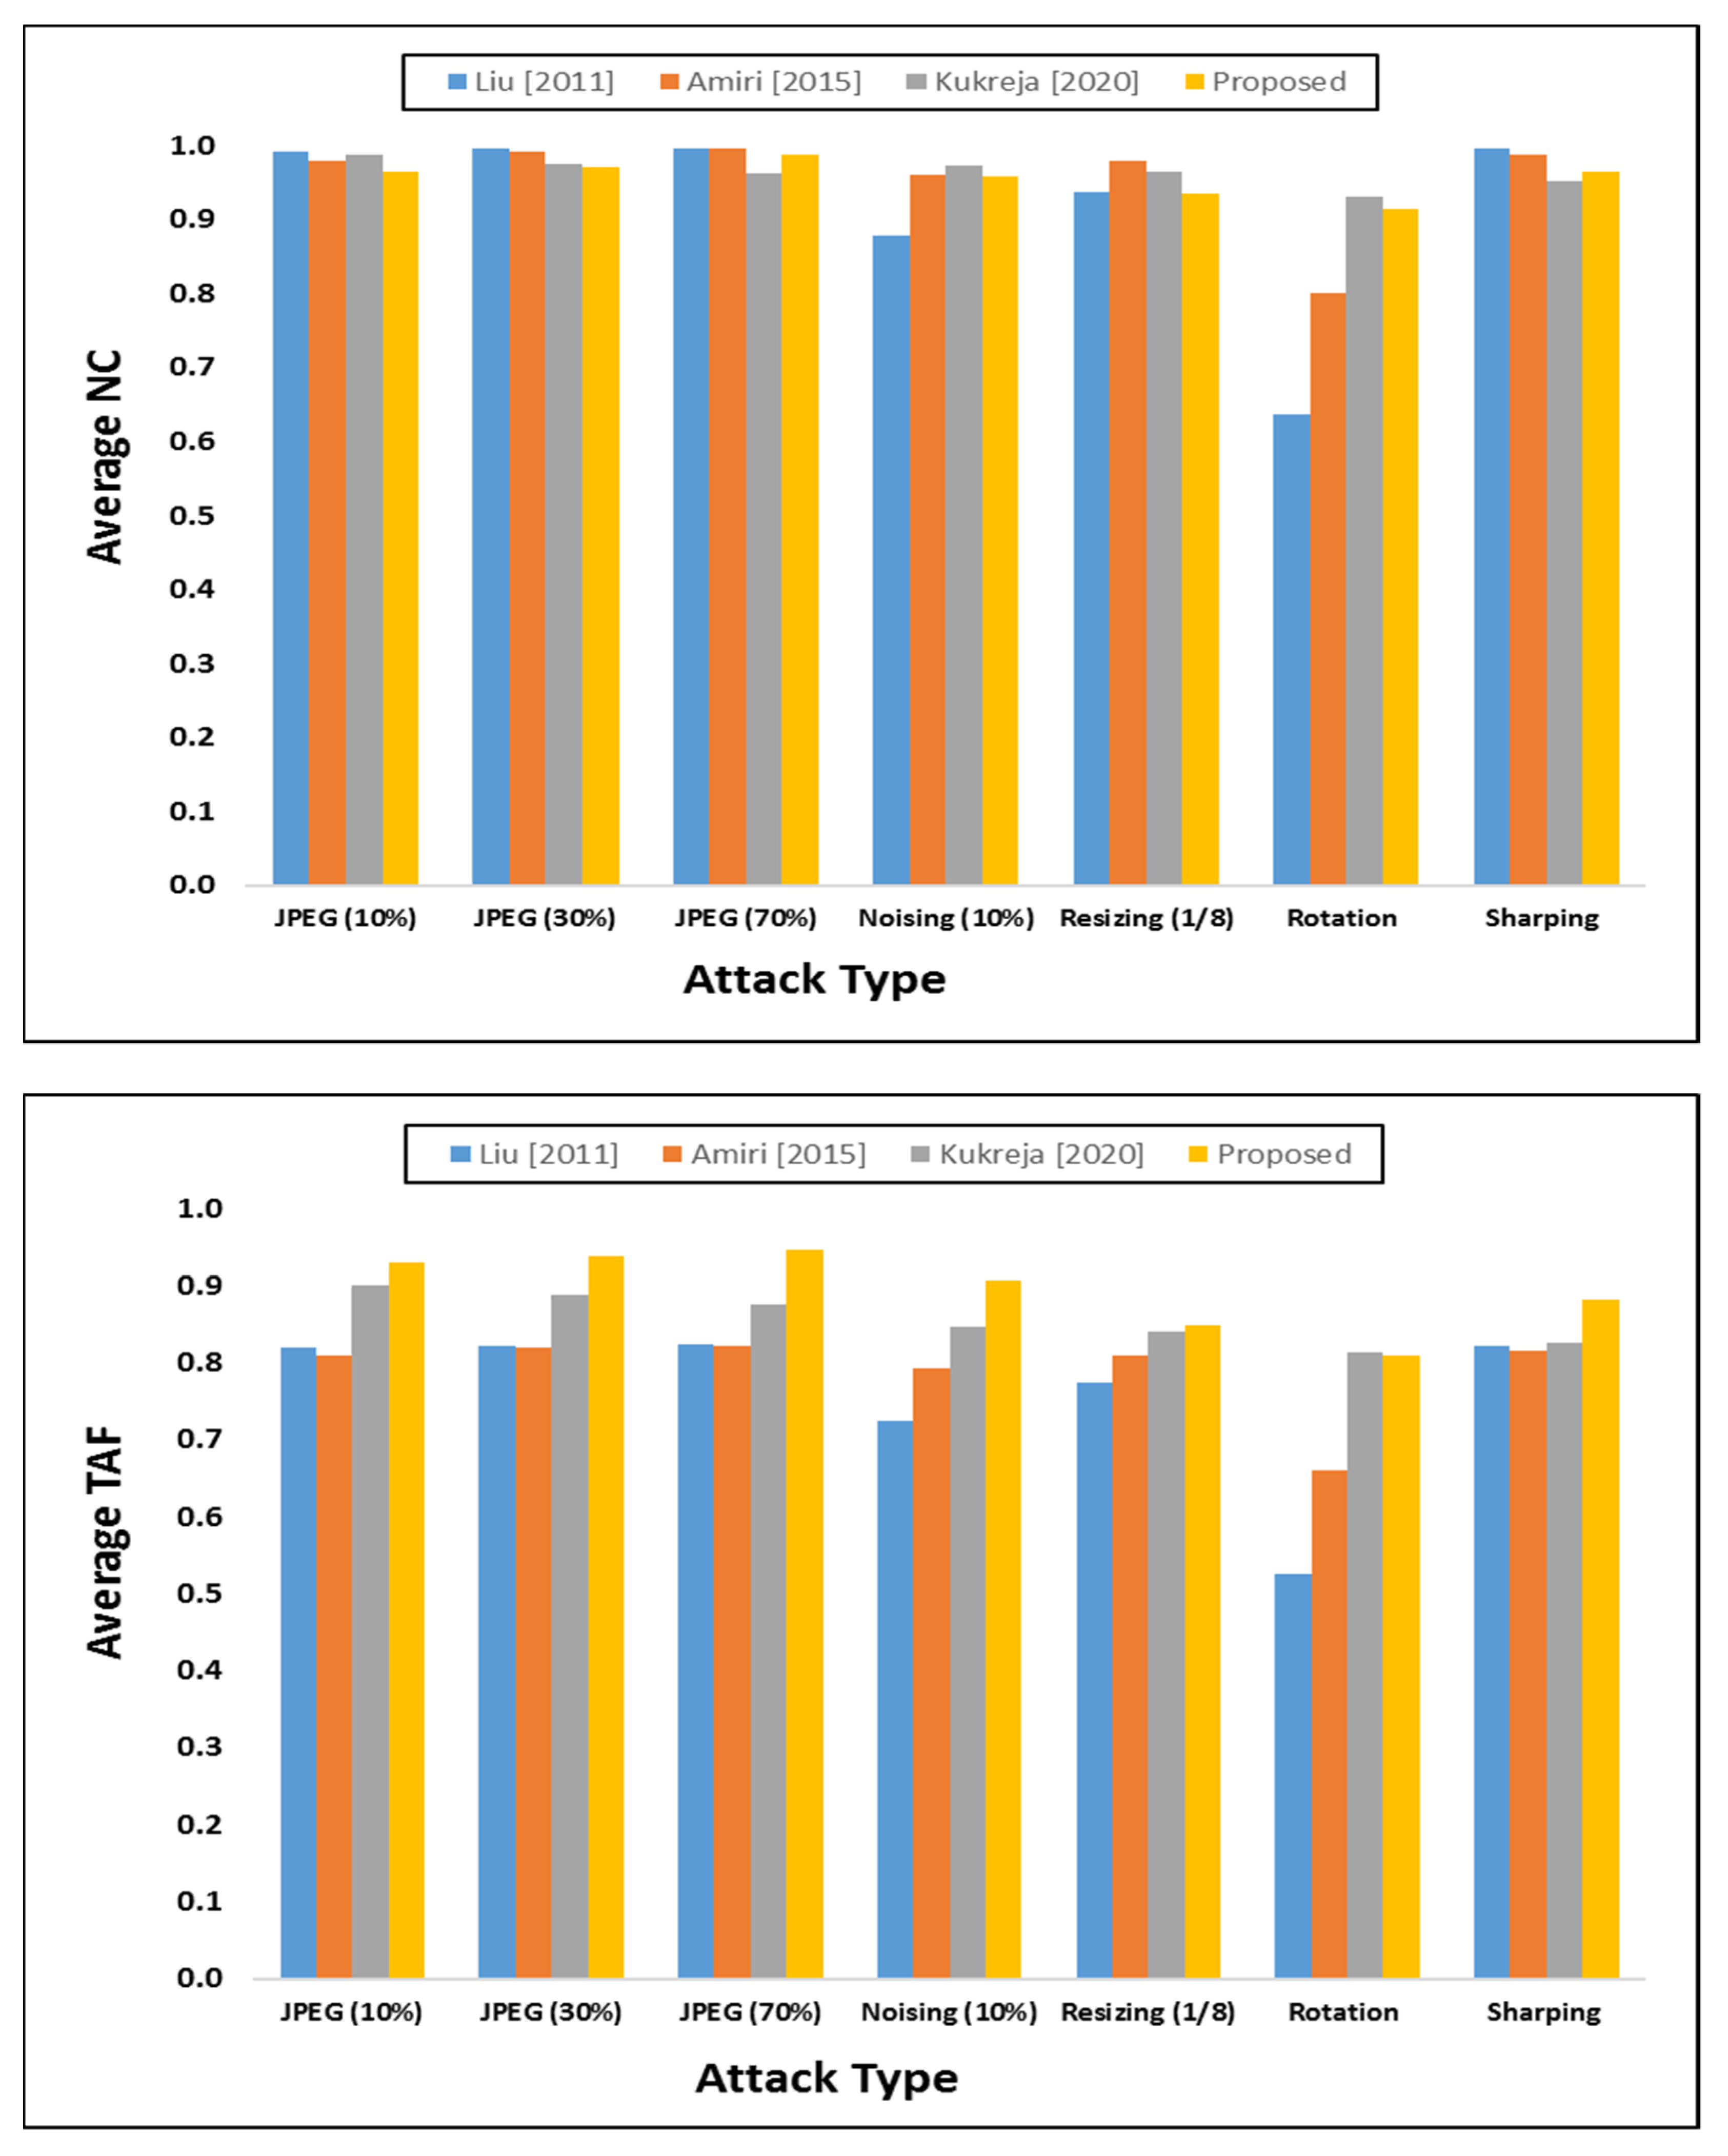
In this group of experiments, the proposed approach was compared with state-of-the-art approaches. More recent related works in the literature are used in our comparison, as shown in Figure 8: (1) Liu et al. [43], (2) Amiri et al. [44], and (3) Kukreja et al. [45]. The NC and TAF metrics are used to evaluate the performance of the compared approaches. The experimental results, shown in Figure 8, show that the proposed approach outperforms other approaches in terms of the average values of the TAF measure. However, our proposed approach obtained approximately the same or better performance than the other approaches in terms of the average NC measure results, as shown below in Figure 8. This indicates the superiority of our proposed forgery detection approach in comparison with other recent research works in the literature.
Table 6, below, shows the qualitative comparison of our proposed approach with state-of-the-art approaches: (1) Liu et al. [43], (2) Amiri et al. [44], (3) Kukreja et al. [45], (4) Kumar and Hensman [46], and (5) Kumar et al. [47]. The results of this table indicate that the proposed approach has more cons (or positive characteristics) than the other compared approaches. These cons are: (1) it is the only approach among them that can detect and locate forgery in digital images; (2) it does not need to send side information; (3) it can be used for image copyright protection, like the other compared methods; (4) it has robustness against known attacks. Hence, the proposed approach in this research paper outperforms the other compared state-of-the-art approaches according to the results in this table and Figure 8.
Secondly, the SIPI dataset was used in this group of experiments; more specifically, four standard images were used from this dataset for comparison purposes, as shown in Table 7. These images are Lena, Lake, Mandrill, and Peppers. The experimental results in Table 7 revealed that our proposed approach outperforms the other six approaches in the JPEG compression attack, with an obtained average value of 99%. Furthermore, it exceeds the other approaches for the median filtering attack, with an average value of 94%. The same improvement occurred in the proposed approach for Gaussian and salt and pepper noises attacks, with average values of 96% and 99%. For the rotation, Gaussian noise, speckle noise and Poisson noise, the proposed approach achieved comparable results. Hence, it can be said that the proposed approach, on average, is better than the compared state-of-the-art approaches after the exposure of the images to different kinds of attacks.
4. Discussion
Recently, several researchers proposed VC-based watermarking schemes for image copyright protection [43,44,45]. Liu and Wu [43] utilized a VC algorithm, DWT, error correction codes and noise-removing techniques to develop a watermarking approach to protect the copyright of multiple images and multiple users. Their approach is robust against several attacks. However, it cannot resist geometrical attacks including scaling and rotation, and the size of watermark is restrained by the size of the cover image. In the same direction, Amiri and Moghaddam [44] proposed a novel watermarking scheme to create feature shares from cover images by using VC, SVD, DWT and scale invariant feature transform (SIFT). Then, these feature shares were used with watermarks and private keys to compose the secret share. In case of any conflict, the watermark is recovered by stacking the feature shares, secret share and private key. This approach was proven to be robust against attacks, especially rotation and scaling. However, this approach provides copyright protection for single-user-only (not multiple users) and multiple images. Furthermore, it needs to send extra information (selected SIFT features) in an insecure channel to the receiver in order to create the master share. Hence, this approach is regarded as being too insecure to protect the copyright of the images. Kukreja et al. [45] proposed a novel watermarking scheme to protect the copyright of multiple users and multiple images by using VC, LBP, k-means clustering and speeded-up robust features (SURF). In this approach, the master share is constructed by LBP, SURF and a clustering algorithm. Then, this share is used with a watermark to create ownership shares that are used later to create the key share. In case of any dispute, the key share, master share and ownership share are used together to recreate the watermark to confirm the possession of the images. The key difference between this approach and the earlier approaches is that it needs only a subset of qualified owners to recover the watermark, and not all of them, like the other approaches, to assure the copyright of multiple images and multiple users. To sum up, all of these approaches have their own limitations and drawbacks in the protection of the copyright of a single image (or multiple images) or a single user (or multiple users), which can be summarized as follows:
Based on the above discussion, the proposed VC-based watermarking scheme can remedy all of the above limitations, and can be used solely to detect and localize forgeries in the digital images. In addition, we can use this approach to provide protection for the copyright of single or multiple digital images. To the best of researchers’ knowledge, this first approach uses VC-based watermarking to detect and localize image forgeries. Finally, we have to mention that the described experimental results are based on standard images collected by the research community under real scenarios, and that they mimic the actual operational environments. Therefore, we can say that there are no internal or external threats that may change the validity of these results, but as a future work we are planning to implement these algorithms in the real environments.
5. Conclusions, Limitations and Future Work
In this paper, we proposed an approach to detect and localize forgeries in images-based on a visual cryptography watermarking scheme. The CASIA V 1.0 and SIPI datasets were used to test the robustness and efficacy of this approach. Several known attacks, including compression, salt and pepper noise, Gaussian noise, Poisson noise, speckle noise, sharping, median filtering, rotation and scaling were applied to the digitally forged images in these datasets. Many experiments were conducted with the aim to evaluate the forgery detection and localization capability of the mentioned approach. We concluded that our scheme has good robustness against the aforementioned attacks, and it outperformed the compared state-of-art approaches. Furthermore, one characteristic that was recognized in the proposed approach is that all of the recent related works are used for image copyright protection only, but our approach is the first one proposed to detect and localize forgeries using a visual cryptography-based watermarking scheme. Hence, it provides a good alternative approach for image forgery detection and localization, and it can be used for image copyright protection. The limitations of the proposed approach can be listed as follows: (1) because our proposed approach is a block-based approach, there is a probability of the inclusion of some of the pixels of neighboring blocks with the forged blocks; (2) the proposed approach works fine with geometrical attacks to some extent; however, it begins to suffer whenever the scaling factor and rotation increase in large amounts. As a future work, the researchers plan to improve the proposed approach by using segmentation instead of block division for images, and also to use other available tools to increase the robustness of the proposed approach.
Author Contributions
Conceptualization, M.Z.S. and A.J.A.; methodology, M.Z.S. and R.Y.; software, M.Z.S.; validation, A.J.A. and R.Y.; writing—original draft preparation, M.Z.S. and A.J.A.; writing—review and editing, R.Y. and A.J.A.; visualization, M.Z.S. All authors have read and agreed to the published version of the manuscript.
Funding
There was no funding available for this research.
Data Availability Statement
The datasets used in this research are publicly available. The first dataset, CASIA V 1.0, is available at the following link: https://github.com/namtpham/casia1groundtruth. The standard images in the second SIPI dataset are available for download from the following link: http://www.imageprocessingplace.com/root_files_V3/image_databases.htm.
Acknowledgments
We would like to thank everyone who helped us in this research.
Conflicts of Interest
We declare that there is no conflict of interest of any kind with other research.
References
- Fridrich, A.J.; Soukal, B.D.; Lukáš, A.J. Detection of copy-move forgery in digital images. In Proceedings of the Digital Forensic Research Workshop, Cleveland, OH, USA, 6–8 August 2003; pp. 1–10. [Google Scholar]
- Hany, F. Image forgery detection. IEEE Signal Process Mag. 2009, 26, 16–25. [Google Scholar]
- Asghar, K.; Habib, Z.; Hussain, M. Copy-move and splicing image forgery detection and localization techniques: A review. Aust. J. Forensic Sci. 2017, 49, 281–307. [Google Scholar] [CrossRef]
- Yousif, S.F.; Abboud, A.J.; Radhi, H.Y. Robust image encryption with scanning technology, the El-Gamal algorithm and chaos theory. IEEE Access 2020, 8, 155184–155209. [Google Scholar] [CrossRef]
- Ulutas, G.; Ustubioglu, A.; Ustubioglu, B.; Nabiyev, V.V.; Ulutas, M. Medical image tamper detection based on passive image authentication. J. Digit. Imaging 2017, 30, 695–709. [Google Scholar] [CrossRef] [PubMed]
- Li, J.; Li, X.; Yang, B.; Sun, X. Segmentation-based image copy-move forgery detection scheme. IEEE Trans. Inf. Forensics Secur. 2014, 10, 507–518. [Google Scholar]
- Gul, E.; Ozturk, S. A novel hash function based fragile watermarking method for image integrity. Multimed. Tools. Appl. 2019, 78, 17701–17718. [Google Scholar] [CrossRef]
- Gull, S.; Loan, N.A.; Parah, S.A.; Sheikh, J.A.; Bhat, G.M. An efficient watermarking technique for tamper detection and localization of medical images. J. Ambient Intell. Humaniz. Comput. 2020, 11, 1799–1808. [Google Scholar] [CrossRef]
- Hussan, M.; Parah, S.A.; Gull, S.; Qureshi, G.J. Tamper Detection and Self-Recovery of Medical Imagery for Smart Health. Arab. J. Sci. Eng. 2021, 46, 3465–3481. [Google Scholar] [CrossRef]
- Bhalerao, S.; Ansari, I.A.; Kumar, A. A secure image watermarking for tamper detection and localization. J. Ambient Intell. Humaniz. Comput. 2021, 12, 1057–1068. [Google Scholar] [CrossRef]
- Ansari, I.A.; Pant, M.; Ahn, C.W. SVD based fragile watermarking scheme for tamper localization and self-recovery. Int. J. Mach. Learn. Cybern. 2016, 7, 1225–1239. [Google Scholar] [CrossRef]
- Alahmadi, A.; Hussain, M.; Aboalsamh, H.; Muhammad, G.; Bebis, G.; Mathkour, H. Passive detection of image forgery using DCT and local binary pattern. Signal Image Video Process. 2017, 11, 81–88. [Google Scholar] [CrossRef]
- Gardella, M.; Musé, P.; Morel, J.M.; Colom, M. Forgery Detection in Digital Images by Multi-Scale Noise Estimation. J. Imaging. 2021, 7, 119. [Google Scholar] [CrossRef]
- Mahdian, B.; Saic, S. Using noise inconsistencies for blind image forensics. Image Vis. Comput. 2009, 27, 1497–1503. [Google Scholar] [CrossRef]
- Mahdian, B.; Saic, S. Detection of copy–move forgery using a method based on blur moment invariants. Forensic Sci. Int. 2007, 171, 180–189. [Google Scholar] [CrossRef] [PubMed]
- Rao, Y.; Ni, J.; Zhao, H. Deep learning local descriptor for image splicing detection and localization. IEEE Access 2020, 8, 25611–25625. [Google Scholar] [CrossRef]
- Parashar, P.; Singh, R.K. A survey: Digital image watermarking techniques. Int. J. Signal Processing Image Processing Pattern Recognit. 2014, 7, 111–124. [Google Scholar] [CrossRef]
- Kumar, C.; Singh, A.K.; Kumar, P. A recent survey on image watermarking techniques and its application in e-governance. Multimed. Tools. Appl. 2018, 77, 3597–3622. [Google Scholar] [CrossRef]
- Abboud, A.J.; Jassim, S.A. Biometric templates selection and update using quality measures. In Mobile Multimedia/Image Processing, Security, and Applications 2012; SPIE: New York, NY, USA, 2012; Volume 8406, p. 840609. [Google Scholar]
- Abboud, A.J.; Jassim, S.A. Image quality guided approach for adaptive modelling of biometric intra-class variations. In Mobile Multimedia/Image Processing, Security, and Applications 2010; SPIE: New York, NY, USA, 2010; Volume 7708, p. 77080L. [Google Scholar]
- Le, T.H.N.; Nguyen, K.H.; Le, H.B. Literature survey on image watermarking tools, watermark attacks and benchmarking tools. In Proceedings of the 2010 Second International Conferences on Advances in Multimedia, Athens, Greece, 13–19 June 2010; pp. 67–73. [Google Scholar]
- Abboud, A.J.; Jassim, S.A. Incremental fusion of partial biometric information. In Mobile Multimedia/Image Processing, Security, and Applications 2012; SPIE: New York, NY, USA, 2012; Volume 8406, p. 84060K. [Google Scholar]
- Chang, C.C.; Chuang, J.C. An image intellectual property protection scheme for gray-level images using visual secret sharing strategy. Pattern Recognit. Lett. 2002, 23, 931–941. [Google Scholar] [CrossRef]
- Hsu, C.S.; Hou, Y.C. Copyright protection scheme for digital images using visual cryptography and sampling methods. Opt. Eng. 2005, 44, 077003. [Google Scholar]
- Wang, C.C.; Tai, S.C.; Yu, C.S. Repeating image watermarking technique by the visual cryptography. IEICE Trans. Fundam. Electron. Commun. Comput. Sci. 2000, 83, 1589–1598. [Google Scholar]
- Wang, M.S.; Chen, W.C. A hybrid DWT-SVD copyright protection scheme based on k-means clustering and visual cryptography. Comput. Stand. Interfaces 2009, 31, 757–762. [Google Scholar] [CrossRef]
- Hou, Y.C.; Chen, P.M. An asymmetric watermarking scheme based on visual cryptography. In Proceedings of the 2000 5th International Conference on Signal Processing Proceedings, 16th World Computer Congress 2000, Beijing, China, 21–25 August 2000; Volume 2, pp. 992–995. [Google Scholar]
- Hsieh, S.L.; Hsu, L.Y.; Tsai, I.J. A copyright protection scheme for color images using secret sharing and wavelet transform. In Proc. World Acad. Sci. Eng. Technol. 2005, 10, 17–23. [Google Scholar]
- Chen, T.H.; Chang, C.C.; Wu, C.S.; Lou, D.C. On the security of a copyright protection scheme based on visual cryptography. Comput. Stand. Interfaces 2009, 31, 1–5. [Google Scholar] [CrossRef]
- Lou, D.C.; Tso, H.K.; Liu, J.L. A copyright protection scheme for digital images using visual cryptography technique. Comput. Stand. Interfaces 2007, 29, 125–131. [Google Scholar] [CrossRef]
- Fatahbeygi, A.; Tab, F.A. A highly robust and secure image watermarking based on classification and visual cryptography. J. Inf. Secur. Appl. 2019, 45, 71–78. [Google Scholar] [CrossRef]
- Rani, A.; Jain, A.; Kumar, M. Identification of copy-move and splicing based forgeries using advanced SURF and revised template matching. Multimed. Tools Appl. 2021, 80, 23877–23898. [Google Scholar] [CrossRef]
- Kumar, M.; Aggarwal, J.; Rani, A.; Stephan, T.; Shankar, A.; Mirjalili, S. Secure video communication using firefly optimization and visual cryptography. Artif. Intell. Rev. 2021, 54, 1–21. [Google Scholar] [CrossRef]
- Naor, M.; Shamir, A. Visual cryptography. In Proceedings of the Workshop on the Theory and Application of Cryptographic Techniques, Perugia, Italy, 9–12 May 1994; Springer: Berlin/Heidelberg, Germany, 1994; pp. 1–12. [Google Scholar]
- Hou, Y.C. Visual cryptography for color images. Pattern Recognit. 2003, 36, 1619–1629. [Google Scholar] [CrossRef]
- Abboud, A.J. Protecting documents using visual cryptography. Int. J. Eng. Res. Gen. Sci. 2015, 3, 464–470. [Google Scholar]
- Pesteie, M.; Abolmaesumi, P.; Ashab, H.A.D.; Lessoway, V.A.; Massey, S.; Gunka, V.; Rohling, R.N. Real-time ultrasound image classification for spine anesthesia using local directional Hadamard features. Int. J. Comput. Assist. Radiol. Surg. 2015, 10, 901–912. [Google Scholar] [CrossRef]
- Ojala, T.; Pietikainen, M.; Harwood, D. Performance evaluation of texture measures with classification based on Kullback discrimination of distributions. In Proceedings of the 12th International Conference on Pattern Recognition, Jerusalem, Israel, 9–13 October 1994; Volume 1, pp. 582–585. [Google Scholar]
- Ojala, T.; Pietikäinen, M.; Harwood, D. A comparative study of texture measures with classification based on featured distributions. Pattern Recognit. 1996, 29, 51–59. [Google Scholar] [CrossRef]
- Sairamya, N.J.; Susmitha, L.; George, S.T.; Subathra, M.S.P. Hybrid Approach for Classification of Electroencephalographic Signals Using Time–Frequency Images With Wavelets and Texture Features. In Intelligent Data Analysis for Biomedical Applications; Academic Press: Cambridge, MA, USA, 2019; pp. 253–273. [Google Scholar]
- Mallat, S. A Wavelet Tour of Signal Processing; Elsevier: Amsterdam, The Netherlands, 1999. [Google Scholar]
- Wang, Z.; Bovik, A.C.; Sheikh, H.R.; Simoncelli, E.P. Image quality assessment: From error visibility to structural similarity. IEEE Trans. Image Processing 2004, 13, 600–612. [Google Scholar] [CrossRef] [PubMed] [Green Version]
- Liu, F.; Wu, C.K. Robust visual cryptography-based watermarking scheme for multiple cover images and multiple owners. IET Inf. Secur. 2011, 5, 121–128. [Google Scholar] [CrossRef]
- Amiri, T.; Moghaddam, M.E. A new visual cryptography based watermarking scheme using DWT and SIFT for multiple cover images. Multimed. Tools. Appl. 2016, 75, 8527–8543. [Google Scholar] [CrossRef]
- Kukreja, S.; Kasana, G.; Kasana, S.S. Extended visual cryptography-based copyright protection scheme for multiple images and owners using LBP–SURF descriptors. Vis. Comput. 2021, 37, 1481–1498. [Google Scholar] [CrossRef]
- Kumar, M.; Hensman, A. Robust digital video watermarking using reversible data hiding and visual cryptography. In Proceedings of the 24th IET Irish Signals and Systems Conference (ISSC 2013), Letterkenny, Ireland, 20–21 June 2013; pp. 1–6. [Google Scholar]
- Kumar, M.; Sriastava, S.; Hensman, A. A Hybrid Novel Approach of Video Watermarking. Int. J. Signal Processing Image Processing Pattern Recognit. 2016, 9, 395–406. [Google Scholar] [CrossRef]
- Roy, S.; Pal, A.K. A robust blind hybrid image watermarkingscheme in rdwt-dct domain using arnold scrambling. Multimed. Appl. 2017, 76, 3577–3616. [Google Scholar] [CrossRef]
- Murali, P.; Sankaradass, V. An efficient ROI based copyright protection scheme for digital images with SVD and orthogonal polynomials transformation. Optik 2018, 170, 242–264. [Google Scholar] [CrossRef]
- Ernawan, F.; Kabir, M.N. A block-based RDWT-SVD image watermarking method using human visual system characteristics. Vis. Comput. 2020, 36, 19–37. [Google Scholar] [CrossRef]
- Hurrah, N.N.; Parah, S.A.; Loan, N.A.; Sheikh, J.A.; Elhoseny, M.; Muhammad, K. Dual watermarking framework for privacy protection and content authentication of multimedia. Future Gener. Comput. Syst. 2019, 94, 654–673. [Google Scholar] [CrossRef]
- Thanki, R.; Kothari, A.; Trivedi, D. Hybrid and blind watermarking scheme in DCuT–RDWT domain. J. Inf. Secur. Appl. 2019, 46, 231–249. [Google Scholar] [CrossRef]
Figure 1.
Visual cryptography scheme for (2, 2) construction [34].
Figure 1.
Visual cryptography scheme for (2, 2) construction [34].

Figure 2.
LBP process [40].
Figure 2.
LBP process [40].

Figure 3.
2D DWT for two levels.

Figure 4.
Block diagram of the proposed method: (a) Shares construction phase; (b) Image forgery verification.
Figure 4.
Block diagram of the proposed method: (a) Shares construction phase; (b) Image forgery verification.

Figure 5.
Example images: (1) CASIA V 1.0 dataset (a–d); (2) SIPI dataset (e–h).

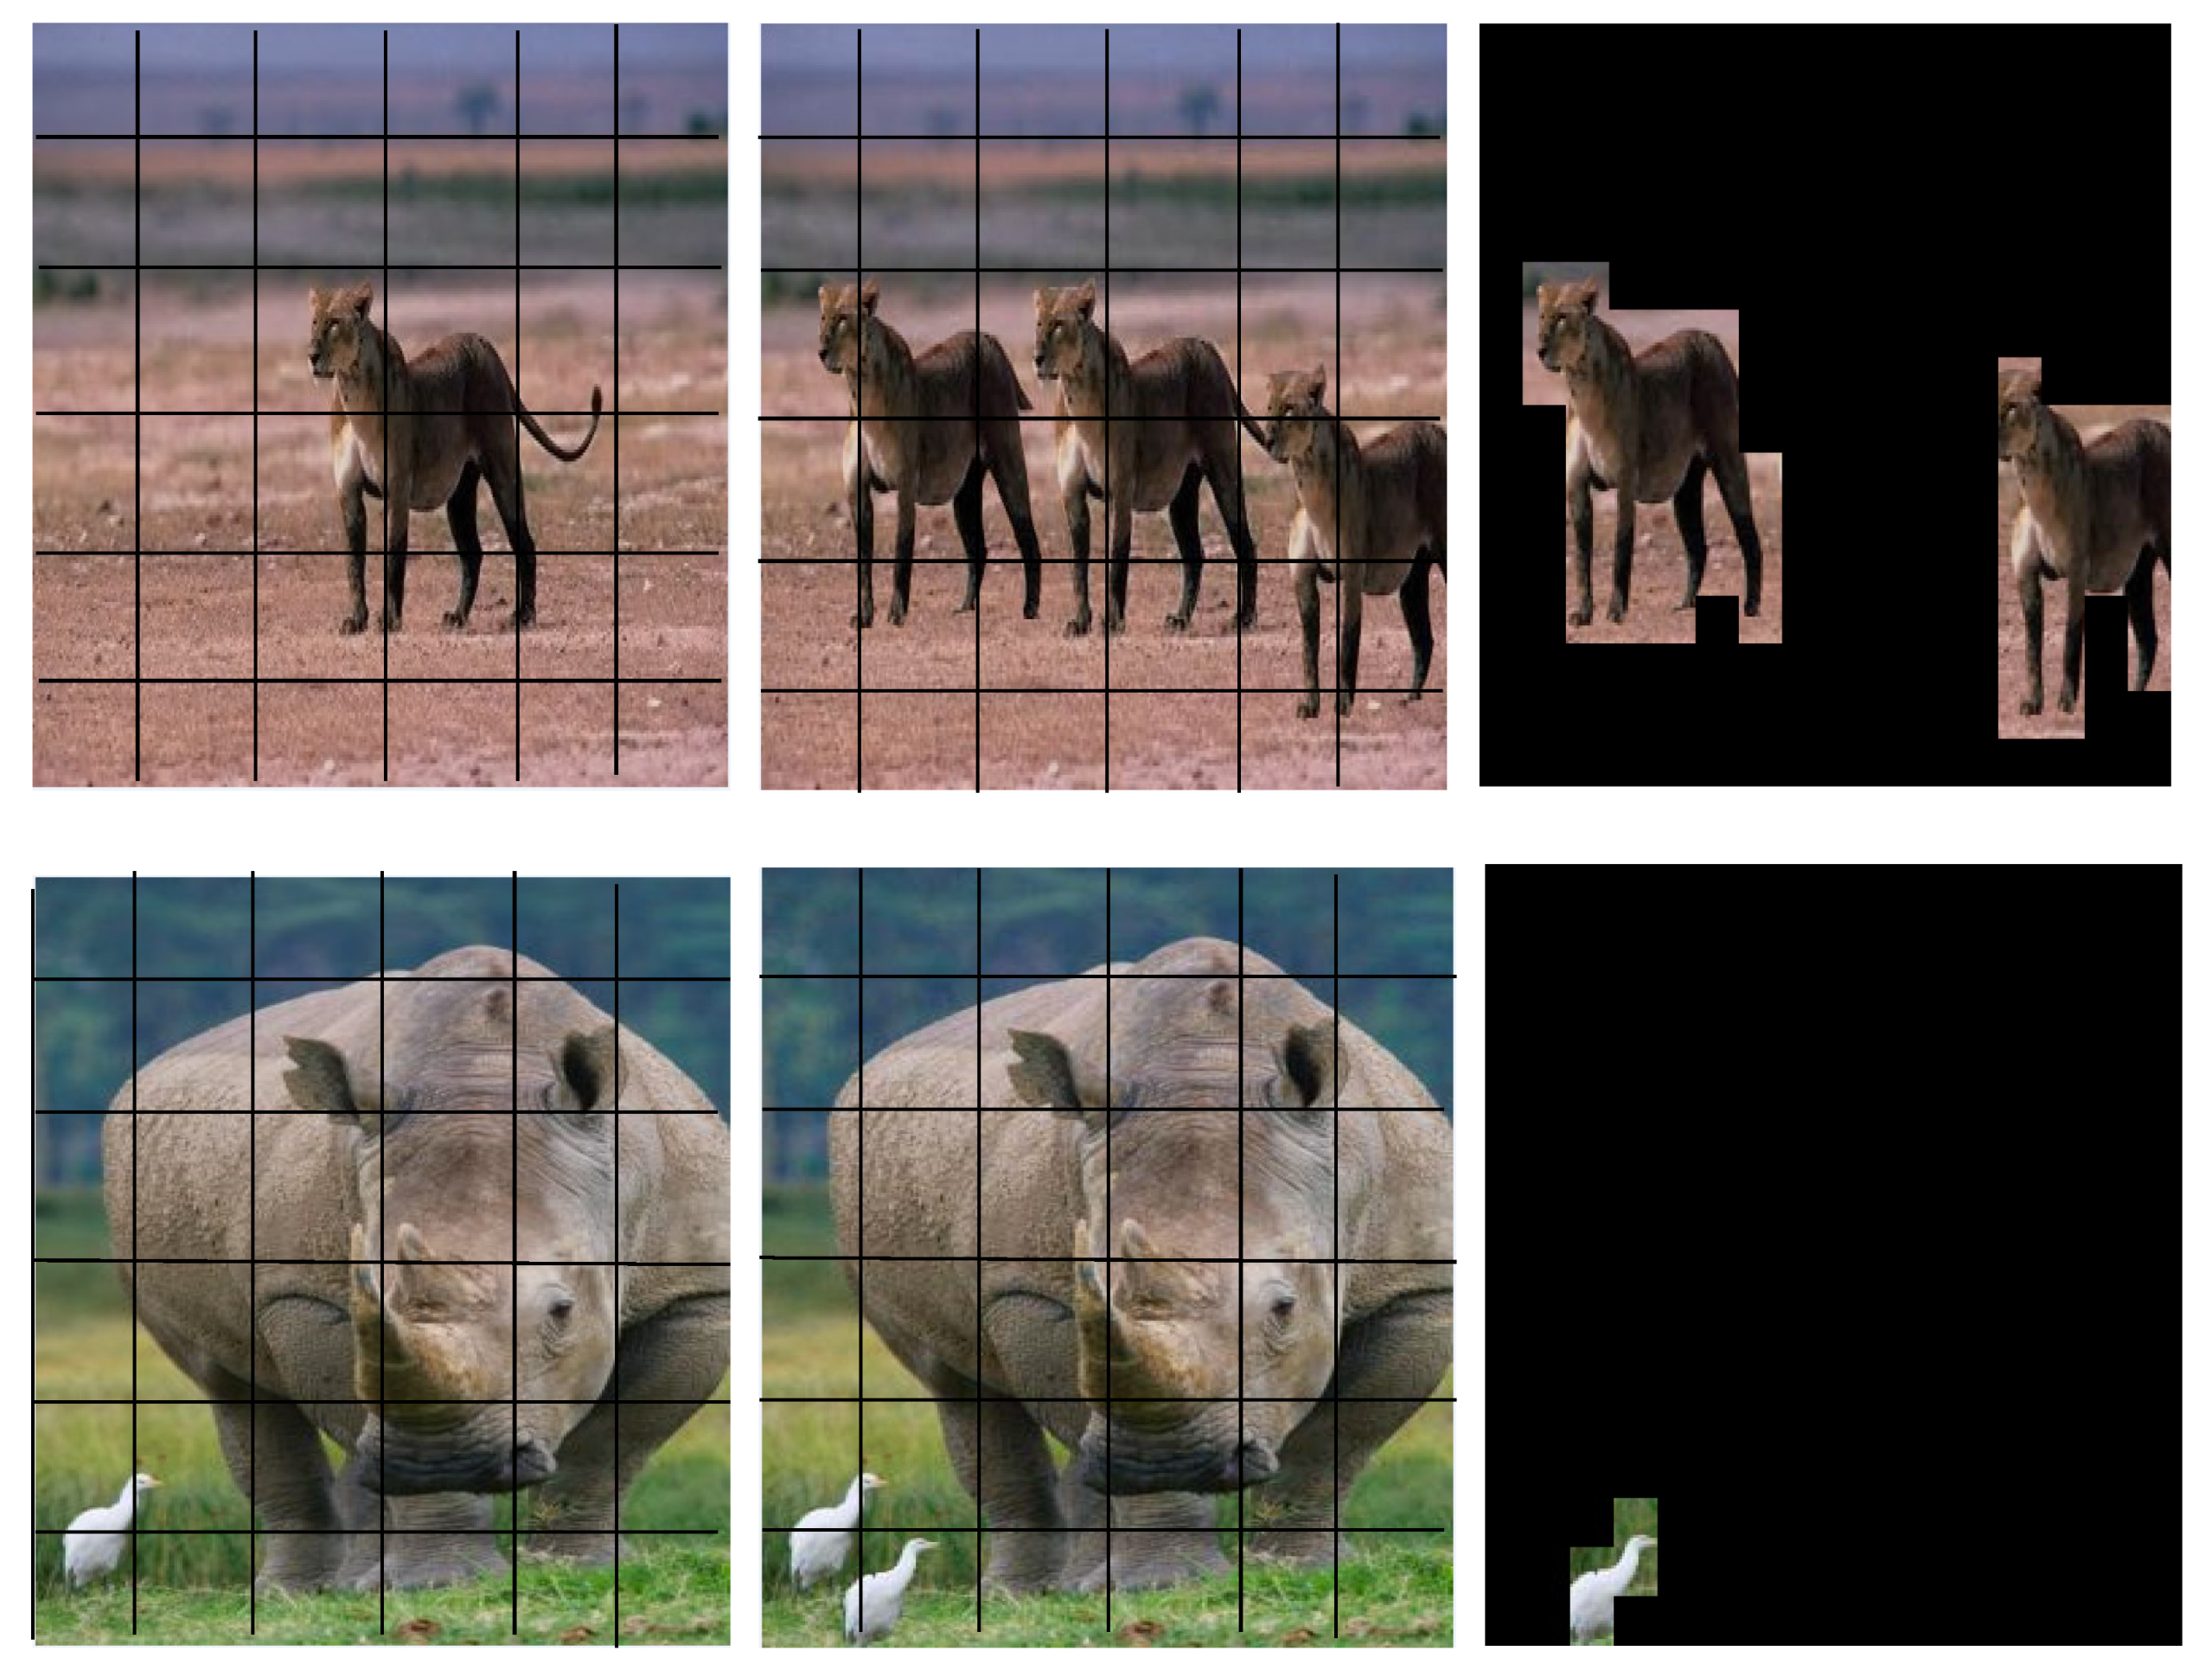
Figure 6.
Examples of forgery detection results from the CASIA V 1.0 dataset: the original image, the forged image and the forgery detection result.
Figure 6.
Examples of forgery detection results from the CASIA V 1.0 dataset: the original image, the forged image and the forgery detection result.

Figure 7.
Examples of forged images attacked by some known attacks.

Figure 8.
Comparative analysis of the proposed approach with state-of-the-art approaches.


Table 1.
Forgery classification and image quality measure values for the first group of experiments.
Table 1.
Forgery classification and image quality measure values for the first group of experiments.
| Measure/ Category | Forgery Classification Measures | Image Quality Measures | ||||||
|---|---|---|---|---|---|---|---|---|
| Precision | Recall | F1 Score | NC | TAF | BER | PSNR | SSIM | |
| Animal | 0.98 | 0.96 | 0.97 | 0.95 | 0.95 | 0.05 | 13.51 | 0.68 |
| Architecture | 0.96 | 0.97 | 0.96 | 0.97 | 0.97 | 0.03 | 14.77 | 0.72 |
| Plant | 0.98 | 0.97 | 0.97 | 0.96 | 0.96 | 0.04 | 13.83 | 0.68 |
| Texture | 0.99 | 0.96 | 0.98 | 0.96 | 0.96 | 0.04 | 13.60 | 0.68 |
| Nature | 0.98 | 0.99 | 0.99 | 0.96 | 0.96 | 0.04 | 14.00 | 0.69 |
| Character | 0.94 | 0.99 | 0.96 | 0.97 | 0.97 | 0.03 | 15.10 | 0.72 |
| Scene | 0.98 | 0.93 | 0.95 | 0.97 | 0.97 | 0.03 | 14.84 | 0.71 |
| AVERAGE | 0.97 | 0.97 | 0.97 | 0.96 | 0.96 | 0.04 | 14.24 | 0.70 |
Table 2.
Forgery classification and image quality measure values for the second group of experiments (Compression attack).
Table 2.
Forgery classification and image quality measure values for the second group of experiments (Compression attack).
| Compression Quality/Measure | Forgery Classification Measures | Image Quality Measures | ||||||
|---|---|---|---|---|---|---|---|---|
| Precision | Recall | F1 Score | NC | TAF | BER | PSNR | SSIM | |
| 20 | 0.95 | 0.95 | 0.95 | 0.93 | 0.93 | 0.07 | 11.62 | 0.61 |
| 40 | 0.96 | 0.95 | 0.95 | 0.94 | 0.94 | 0.06 | 12.10 | 0.63 |
| 60 | 0.96 | 0.96 | 0.96 | 0.94 | 0.94 | 0.06 | 12.54 | 0.65 |
| 80 | 0.98 | 0.98 | 0.98 | 0.95 | 0.95 | 0.05 | 12.75 | 0.65 |
| 100 | 0.98 | 0.99 | 0.98 | 0.95 | 0.95 | 0.05 | 13.37 | 0.68 |
| AVERAGE | 0.97 | 0.97 | 0.97 | 0.94 | 0.94 | 0.06 | 12.48 | 0.64 |
Table 3.
Forgery classification and image quality measure values for the second group of experiments (Noise attack).
Table 3.
Forgery classification and image quality measure values for the second group of experiments (Noise attack).
| Noise Level/ Measure | Forgery Classification Measures | Image Quality Measures | ||||||
|---|---|---|---|---|---|---|---|---|
| Precision | Recall | F1 Score | NC | TAF | BER | PSNR | SSIM | |
| 0.01 | 0.98 | 0.97 | 0.98 | 0.95 | 0.95 | 0.05 | 12.84 | 0.65 |
| 0.02 | 0.97 | 0.94 | 0.96 | 0.94 | 0.94 | 0.06 | 12.43 | 0.63 |
| 0.03 | 0.95 | 0.94 | 0.94 | 0.94 | 0.94 | 0.06 | 12.03 | 0.61 |
| 0.04 | 0.94 | 0.94 | 0.94 | 0.93 | 0.93 | 0.07 | 11.74 | 0.60 |
| 0.05 | 0.94 | 0.94 | 0.94 | 0.93 | 0.93 | 0.07 | 11.45 | 0.58 |
| AVERAGE | 0.96 | 0.95 | 0.95 | 0.94 | 0.94 | 0.06 | 12.10 | 0.61 |
Table 4.
Forgery classification and image quality measure values for the second group of experiments (Scaling attack).
Table 4.
Forgery classification and image quality measure values for the second group of experiments (Scaling attack).
| Scaling Factor/ Measure | Forgery Classification Measures | Image Quality Measures | ||||||
|---|---|---|---|---|---|---|---|---|
| Precision | Recall | F1 Score | NC | TAF | BER | PSNR | SSIM | |
| 1.005 | 0.98 | 0.98 | 0.98 | 0.94 | 0.94 | 0.06 | 12.03 | 0.61 |
| 1.010 | 0.95 | 0.98 | 0.96 | 0.92 | 0.92 | 0.08 | 11.30 | 0.58 |
| 1.015 | 0.92 | 0.95 | 0.94 | 0.92 | 0.92 | 0.08 | 10.87 | 0.56 |
| 1.020 | 0.91 | 0.92 | 0.91 | 0.91 | 0.91 | 0.09 | 10.57 | 0.55 |
| 1.025 | 0.91 | 0.92 | 0.91 | 0.91 | 0.91 | 0.09 | 10.33 | 0.55 |
| AVERAGE | 0.93 | 0.95 | 0.94 | 0.92 | 0.92 | 0.08 | 11.02 | 0.57 |
Table 5.
Forgery classification and image quality measure values for the second group of experiments (Rotation attack).
Table 5.
Forgery classification and image quality measure values for the second group of experiments (Rotation attack).
| Rotation Angle/ Measure | Forgery Classification Measures | Image Quality Measures | ||||||
|---|---|---|---|---|---|---|---|---|
| Precision | Recall | F1 Score | NC | TAF | BER | PSNR | SSIM | |
| 1.0 | 0.98 | 0.98 | 0.98 | 0.93 | 0.93 | 0.07 | 11.57 | 0.59 |
| 1.5 | 0.95 | 0.97 | 0.96 | 0.92 | 0.92 | 0.08 | 11.09 | 0.57 |
| 2.0 | 0.93 | 0.97 | 0.95 | 0.91 | 0.91 | 0.09 | 10.71 | 0.55 |
| 2.5 | 0.93 | 0.93 | 0.93 | 0.91 | 0.91 | 0.09 | 10.42 | 0.54 |
| 3.0 | 0.93 | 0.92 | 0.92 | 0.90 | 0.90 | 0.10 | 10.16 | 0.53 |
| AVERAGE | 0.94 | 0.95 | 0.95 | 0.92 | 0.92 | 0.08 | 10.79 | 0.56 |
Table 6.
Qualitative comparison of the proposed approach with the state-of-the-art approaches.
| Method | Image or video | Meaningful Shares | Recovery | Sides Information | Copyright Protection | Forgery Detection and Localization | Extraction | Robustness |
|---|---|---|---|---|---|---|---|---|
| Liu 2011 | Image | No | Yes | No | Yes | No | Superimposition | JPEG Compression sharpening blurring cropping distortion noising |
| Amiri 2015 | Image | No | No | Yes | Yes | No | XOR Superimposition | JPEG Compression sharpening blurring resizing rotation cropping noising distortion |
| Kukreja 2020 | Image | Yes | No | No | Yes | No | XOR Superimposition | JPEG Compression sharpening blurring resizing rotation cropping noising distortion |
| Kumar 2013 | Video | Yes | No | No | Yes | No | XOR Superimposition | Unsharp Salt&pepper Median Rotate Crop |
| Kumar 2016 | Video | Yes | No | No | Yes | No | XOR Superimposition | Unsharp Gaussian Salt&pepper Median Rotate Crop |
| Proposed 2021 | Image | Yes | Yes | No | Yes | Yes | XOR Superimposition | JPEG Compression sharpening blurring resizing rotation cropping noising distortion |
Table 7.
Quantitative comparison of the proposed approach with the state-of-the-art approaches.
| Roy et al. [48] | Mural et al. [49] | Ernawanet al. [50] | Hurrah et al. [51] | Thanki et al. [52] | Kukreja et al. [45] | Proposed | |
|---|---|---|---|---|---|---|---|
| JPEG Compression | |||||||
| Lena | - | 0.8500 | - | - | - | 0.9876 | 0.9900 |
| Lake | - | 0.8700 | - | - | - | 0.9829 | 0.9892 |
| Mandrill | - | 0.8200 | - | - | - | 0.9877 | 0.9943 |
| Peppers | 0.8916 | - | 0.5876 | - | 0.9837 | 0.9889 | 0.9910 |
| Rotation | |||||||
| Lena | - | 0.7900 | - | - | - | 0.9728 | 0.9190 |
| Lake | 0.7800 | - | - | - | - | 0.9629 | 0.8848 |
| Mandrill | 0.7900 | - | - | - | - | 0.9753 | 0.9256 |
| Peppers | 0.8617 | 0.5864 | - | - | - | 0.9876 | 0.8974 |
| Median Filtering | |||||||
| Lena | - | 0.9500 | - | - | - | 0.9523 | 0.9515 |
| Lake | - | 0.8700 | - | - | - | 0.8889 | 0.9370 |
| Mandrill | - | 0.8900 | - | - | - | 0.8941 | 0.9269 |
| Peppers | 0.8055 | - | - | - | - | 0.8196 | 0.9544 |
| Sharping | |||||||
| Lena | - | 0.8700 | - | 0.9750 | - | 0.9629 | 0.9686 |
| Lake | - | 0.9200 | - | - | - | 0.9723 | 0.9534 |
| Mandrill | - | 0.8300 | - | - | - | 0.9507 | 0.9654 |
| Peppers | 0.9645 | - | - | - | - | 0.9352 | 0.9653 |
| Gaussian Noise | |||||||
| Lena | - | 0.8900 | - | - | - | 0.9629 | 0.9386 |
| Lake | - | 0.8300 | - | - | - | 0.9753 | 0.9301 |
| Mandrill | - | 0.9000 | - | - | - | 0.9722 | 0.9446 |
| Peppers | 0.6412 | - | - | - | - | 0.9506 | 0.9333 |
| Salt & Peppers Noise | |||||||
| Lena | - | 0.8900 | - | 0.9600 | - | 0.9753 | 0.9958 |
| Lake | - | 0.9100 | - | - | - | 0.9858 | 0.9940 |
| Mandrill | - | 0.8100 | - | - | - | 0.9877 | 0.9955 |
| Peppers | 0.5852 | - | - | - | - | 0.9784 | 0.9959 |
| Speckle Noise | |||||||
| Lena | - | - | - | 0.9700 | - | 0.9890 | 0.9571 |
| Lake | - | - | - | - | - | - | 0.9536 |
| Mandrill | - | - | - | - | - | - | 0.9611 |
| Peppers | - | - | - | - | - | - | 0.9548 |
| Poisson Noise | |||||||
| Lena | - | - | - | 0.9600 | - | 0.9612 | 0.9410 |
| Lake | - | - | - | - | - | - | 0.9374 |
| Mandrill | - | - | - | - | - | - | 0.9471 |
| Peppers | - | - | - | - | - | - | 0.9409 |
Publisher’s Note: MDPI stays neutral with regard to jurisdictional claims in published maps and institutional affiliations. |
© 2022 by the authors. Licensee MDPI, Basel, Switzerland. This article is an open access article distributed under the terms and conditions of the Creative Commons Attribution (CC BY) license (https://creativecommons.org/licenses/by/4.0/).
Share and Cite
MDPI and ACS Style
Salim, M.Z.; Abboud, A.J.; Yildirim, R. A Visual Cryptography-Based Watermarking Approach for the Detection and Localization of Image Forgery. Electronics 2022, 11, 136. https://doi.org/10.3390/electronics11010136
AMA Style
Salim MZ, Abboud AJ, Yildirim R. A Visual Cryptography-Based Watermarking Approach for the Detection and Localization of Image Forgery. Electronics. 2022; 11(1):136. https://doi.org/10.3390/electronics11010136
Chicago/Turabian StyleSalim, Moataz Z., Ali J. Abboud, and Remzi Yildirim. 2022. "A Visual Cryptography-Based Watermarking Approach for the Detection and Localization of Image Forgery" Electronics 11, no. 1: 136. https://doi.org/10.3390/electronics11010136
Note that from the first issue of 2016, this journal uses article numbers instead of page numbers. See further details here.