Article

Performance Evaluation of Multiple Electrodes Based Electrical Impedance Spectroscopic Probe for Screening of Cervical Intraepithelial Neoplasia

1
Department of Biomedical Engineering, College of Medicine, Kyung Hee University, 26 Kyungheedae-ro, Seoul 02447, Korea
2
Impedance Imaging Research Center, Kyung Hee University, 26 Kyungheedae-ro, Seoul 02447, Korea
3
Medical Device Research Center, Medical Science Research Institute, Kyung Hee University Medical Center, Seoul 02453, Korea
4
Department of Obstetrics and Gynecology, Saint Vincent’s Hospital, The Catholic University of Korea, Suwon 16247, Korea
*
Author to whom correspondence should be addressed.
Electronics 2021, 10(16), 1933; https://doi.org/10.3390/electronics10161933
Submission received: 8 July 2021 / Revised: 5 August 2021 / Accepted: 9 August 2021 / Published: 11 August 2021
(This article belongs to the Section Bioelectronics)

Abstract

:
As regular cervical cancer screening becomes more common, the detection of cervical intraepithelial neoplasia (CIN) is increasing. We proposed a noninvasive and low-cost multi-channel electrical impedance spectroscopy (EIS) and probe with multiple active electrodes for screening CIN. Compared with four-electrode probes for impedance spectroscopy, the multiple active electrodes facilitated more flexible combination of current injection and voltage measurement, which allowed well-designed measurement protocols for focused sensitivity underneath the large size of the probe. Furthermore, the multiple active electrodes reduced the negative effects of the cabling between the system and probe inserted into the cervix. After presenting the basic performance, the EIS probe was tested by three different experimental phantoms using four different materials of electrical properties. The corresponding experimental results were presented to prove the functionality of the EIS probe and characterize the electrical properties at a wide range of frequencies from 0.625 to 100 kHz. It had high sensitivity underneath the surface of the probe and a rapidly decreased outer. Furthermore, we verified the frequency-dependent impedance changes using the giant vesicle phantoms with different amounts of extra- and intra-fluids separated by the insulating membranes. This study facilitates the feasibility into clinical practice for identifying CIN in the future.

1. Introduction

Cervical cancer is one of the most common cancers among women [1]. Fortunately, it is highly preventable with the early diagnosis and timely treatments of cervical intraepithelial neoplasia (CIN), since cervical cancer is also one of the most successfully treatable forms of cancer [2]. A simple Papanicolaou smear test has relatively low sensitivity, and anxiety persists due to delays until the result is received [3]. Currently, ThinPrep Cytologic Test (TCT) combined with the human papillomavirus (HPV) detection significantly improved the screening sensitivity and specificity for cervical cancers [4]. Nonetheless, many women suffer from cervical cancer and have no access to cancer screening, diagnosis, and treatments, attributed to the high cost and the lack of medical resources, especially in economically underdeveloped countries [1,2]. Hence, a cost-effective, high sensitivity, non-invasive, and real-time screening method for cervical intraepithelial neoplasia, which is a precancerous stage of cervical cancer, is extraordinarily required.
Electrical impedance spectroscopy (EIS) is a potential technology that can characterize the state of the cervical epithelium according to changes in pathological conditions [5,6]. The frequency-dependent electrical behavior is sensitive to the changes caused by an increased nuclear/cytoplasmic ratio, loss of the layer of flattened cells close to the surface, and an increase in extracellular space volume [7,8,9]. The breaking down of the superficial cell layer and the variation of intra- and extracellular space at the precancerous stages lead to the impedance variants when excited at different frequencies, which laid the foundation for the early diagnosis of cervical intraepithelial neoplasia within a local region. The EIS has been investigated as a low-cost and radiation-free medical technique to improve the sensitivity and specificity of cervical cancer screening [10,11,12,13].
For example, the EIS system using a four-electrode probe has demonstrated that it is possible to identify different stages of cervical intraepithelial neoplasia in the epithelium [11]. Since the measurement was obtained when injecting a current through a pair of electrodes and measuring voltage from another pair of electrodes, the electrical property in a local region under the probe was sensitive to the electrode location and the tissue geometry. It served as a supplementary tool or an alternative to the biopsy, which measures only a localized suspicious region of concern. Although clinical studies have been conducted to detect the progression of cervical intraepithelial neoplasia through EIS, EIS technology as a standalone screening tool is still insufficient. Therefore, it raises the demands of developing an EIS probe that enables examining the entire region of the cervix and provides the sensitivity reflected from the histological changes of epithelium.
This study aims to present an EIS system with multiple active electrodes probe capable of non-invasively measuring the electrical conductivity spectrum in the frequency range of 0.625 to 100 kHz. The electrical energy concentration algorithm was applied to reconstruct a more accurate impedance spectrum of the region under the probe using a well-designed current-voltage measurement protocol with several electrodes located inside a circle of 10 mm diameter [14,15]. Ultimately, we want to confirm the sensitivity of the EIS system to changes in conductivity just below the surface of the probe and the possibility of measuring the conductivity spectrum to changes in intracellular and external fluid in phantoms before the system is applied clinically as a screening tool of cervical cancer.
In Section 2, we describe the probe inserted into the cervix and technology to reduce the negative effect of the cabling and the EIS system for measuring multi-channel impedance across multiple electrode pairs. We introduce experimental methods to investigate the sensitivity of the conductivity measurement according to the target’s location and the delectability of the electrical characteristics according to the frequency using three phantoms with four materials in Section 3. Finally, we describe the results with analysis systematically in Section 4.

2. Electrical Impedance Spectroscopy for Screening Cervical Intraepithelial Neoplasia

2.1. Basic Principle of Multi-Electrode EIS Probe

The bottom surface of the multi-electrode EIS probe has a ground electrode E 0 at the center and 16 electrodes E k , k = 1 , , 16 for current injection and voltage measurements as described in Figure 1a. When a sinusoidal current I sin ( ω t ) is applied to the electrode pair E k , E j ( k , j = 1 , , 16 ) , the corresponding induced complex voltage V k j p q can be measured between the electrode pair E p , E q ( p , q = 1 , , 16 ) . Thereby, the goal of our work is to identify the resistivity of the region underneath the multi-electrode probe using the measured voltages V k j p q . In order to maximize the sensitivity of the measured voltages to the region right under the probe, we make use of the same electrical protocol for current injection and voltage measurements as elaborately described in [15,16]. Therefore, a combination of electrical energy concentration algorithm and current-voltage measurement protocol yields
Φ T S Γ = Φ T V , with Φ = [ ϕ 1 , , ϕ m , ϕ M ]
where Γ is the resistivity vector, M is the number of voxels in the target area, ϕ m : = arg min ϕ ( ϕ T · S ^ 2 2 + λ ϕ S m 2 2 ) , S m is the m-th column of the Jacobian matrix S [14], λ is the regularization parameter, and V is the collected 28 voltages V k j p q . The above linear system (1) can be solved through the least square method and Tikhonov regularization [17]. Based on the electrical energy concentration algorithm, we can reconstruct the resistivity of the region underneath the multi-electrode probe using the 28 measurements.

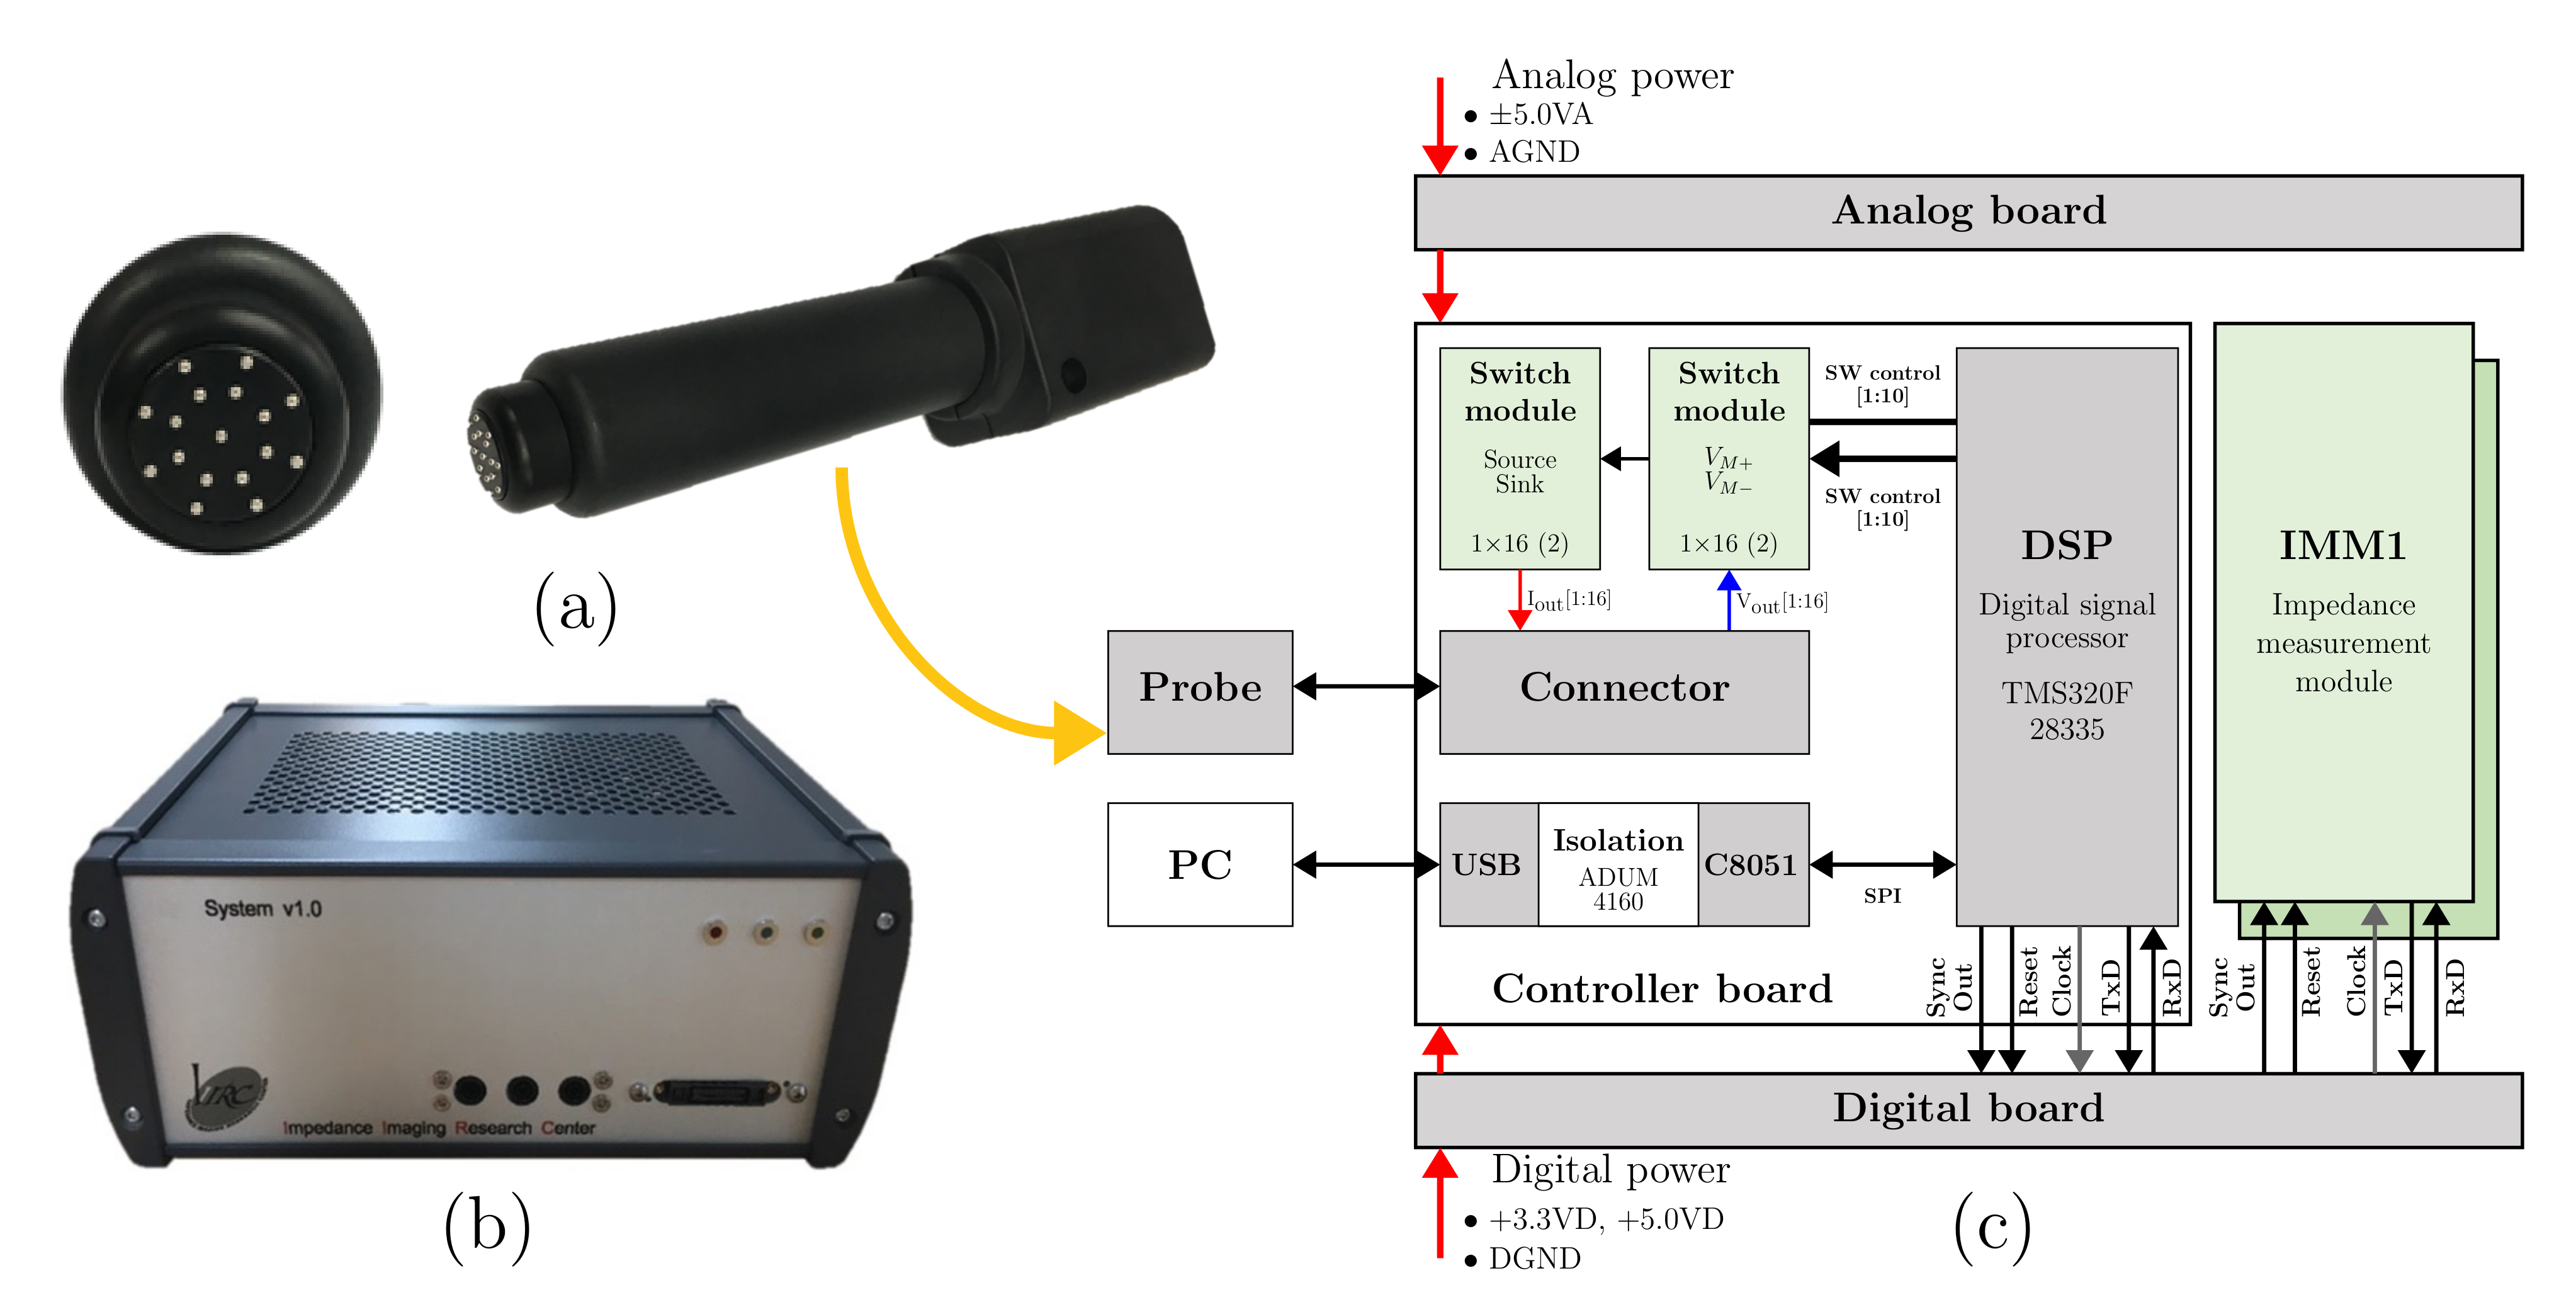
2.2. Probe with Multiple Active Electrodes

To measure the electrical properties by contacting the cervical tissue, a probe with a long shaft must be inserted into the cervix, and cabling between the probe and the measurement system is essential if we do not use custom application-specific integrated circuits (ASICs). Some systems placed some electronics at the end of cables with electrodes to reduce the negative impact of cables [18]. In the preliminary test, we found that the signal-to-noise ratio (SNR) was decreased by about 11 dB and 16 dB when increasing the length of cable from 0 to 1.5 and 3 m using the same impedance measuring device. Furthermore, the accuracy and sensitivity of the measurement system were deteriorated further due to the integrated effect of stray capacitance on cable and board when the contact impedance of electrode was largely due to the small surface area of the electrode.
The developed probe had a structure including 16 miniaturized electrodes arranged uniformly in two concentric circles on the bottom surface of the probe and one additional ground electrode at the center to measure a wide cervical tissue’s overall electrical property, as shown in Figure 1a [15]. The diameter of the outer electrode array (8 electrodes) was 10 mm, while the diameter of the inner electrode array (8 electrodes) was 6.67 mm. Each electrode had a diameter of 1 mm. Instead of using the ground electrode placed at the center of the multiple electrodes, we can connect the ground to another separated electrode attached to the skin surface outside the body when measuring a human body. For stable contact to tissues with uneven surfaces, we placed a multi-electrode probe implemented with multiple spring-loaded pins (G070R, LEENO, Busan, Korea) on the tissue and applied a little pressure to measure it. As presented in Figure 1a,b, a buffer amplifier composed of OPA2140 (Analog Devices, Wilmington, NC, USA) was implemented to improve the integrity of signals. In Figure 1c, a sealing case was used to protect the multi-electrodes and circuits by preventing the penetration of tissue substances into the probe when inserting the probe. A 40 pin cable from the handle part of the probe case connected the current and voltage signals to the multi-channel EIS system.

2.3. Multi-Channel Electrical Impedance Spectroscopy

The multi-channel EIS system and probe that included multiple active electrodes were implemented to screen cervical intraepithelial neoplasia, as shown in Figure 2a,b. The EIS system was developed by inheriting several circuits and functions of the KHU Mark2.5 EIT (electrical impedance tomography) system to measure the electrical impedance spectrum at the fixed multiple frequencies [19]. The structural architecture of the multi-channel EIS system can be represented by the block diagram as described in Figure 2c. Two identical impedance measurement modules (IMM) and two switching modules were controlled by a digital signal processor (DSP) for collecting impedance measurements from the predefined electrode pairs and measurement frequencies. Measured data was transferred to a PC for saving and classifying the status of tissues through another controller for USB communication. The connector module provided a driven shield and ground shield for multiple signal cables on the probe.

2.3.1. Impedance Measurement Module (IMM)

To find the electrical properties of tissues, an imperceptible small current of 305 µA was applied to the target region at all measurement frequencies, and we measured the corresponding induced voltage. The multi-channel EIS system has a structure similar to the EIT system, which visualizes the internal conductivity distribution from the voltages sequentially collected through the attached electrodes on the surface [17,20]. It repeats current injection between arbitrary pairs of electrodes and voltage measurement between other electrode pairs at multiple frequencies. However, compared to the conventional EIT system that monitors respiration through multiple electrodes attached to the chest, we need to use small electrodes for injecting current and measuring voltage in the probe. Therefore, a high-performance constant current source is required that applies a stable current output despite a change in load through an electrode with a large contact impedance generated due to a small electrode size. Besides, it is necessary to implement a multi-channel voltmeter with low noise and less interference between channels.
A dual single-ended current source was constructed using two improved Howland current circuits implemented in identical IMMs [19]. This voltage–current conversion circuit can provide good performance with simplicity. In particular, it can offer a way to improve the performance of output impedance in the current source through the adjusting of internal resistance and the addition of a generalized impedance converter (GIC) circuit for compensating output capacitance due to cables and boards. To measure the voltage difference between any arbitrary pair of electrodes accurately, we implemented a differential amplifier, multi-stage amplifiers, and filter. In particular, we tried to reduce the influence of the high internal resistance and large capacitance of the switches located in front of the differential amplifier by placing buffers near the electrode inside the probe. It collects the impedance values of cervical tissues when applying a sinusoidal current of magnitude 85 to 310 µA at the fixed frequency range of 0.625, 1, 5, 10, 50, and 100 kHz. The reason for using the fixed measurement frequencies lied in fact that the inductance generated by the GIC circuit considerably differed depending on the measurement frequency to match the LC resonance condition for reducing the impact of stray capacitance of the output terminal of the constant current source. It included four GIC circuits dedicated to each operating frequency range and a digital variable resistor that can adjust the inductance in the GIC circuit.
Inside the field programmable gate array (FPGA) (EP3C10F256C8N, Altera, San Jose, USA), a digital waveform generator for injecting current and a digital phase-sensitive demodulator for extracting the real and imaginary components of the measured voltage at the operating frequency were implemented. To obtain the impedance spectrum quickly, the following steps were executed repeatedly according to the determined frequencies: (1) switching the electrode pairs, and measuring voltages when injecting current, (2) calculating the real and imaginary components, and (3) transmission of the collected data described in [14] were separated and processed sequentially in the pipelined structure. The maximum speed of measuring the impedance spectrum at six frequencies was 11 sets/min.

2.3.2. Switching and Connector Modules

To connect an arbitrary pair of electrodes in the probe and the current outputs or voltage measurement channels of the IMMs, the switching module consists of four quad bidirectional T-bar switches (MAX4545, Maxim Integrated, San Jose, USA) and one 4-bit decoder (74HC4514, Texas Instruments, Dallas, USA). It received serial codes from the DSP controller in consonance with the pre-designed measurement protocols [15].
In general, analog switches have input characteristics of low resistance and large capacitance. Therefore, we added buffers in the probe to reduce the deterioration due to input features of switches and cables. Furthermore, we applied driven cable shields with the same voltage as each signal line by shield driver circuits implemented on the connector module. Twin-axial ribbon cables (EQCD Series, SAMTEC, New Albany, OH, USA) had separated shielded lines for each signal line, respectively. Another ground shield covered a whole cable to reduce external interference.

2.3.3. Controller Module

The controller board consists of a DSP main controller, a controller for USB communication, and a power isolation circuit. According to the measurement protocol, the DSP controller controlled the switching module using code and communicated with the FPGA in the IMM to generate injecting current at each frequency, calculating the voltage for impedance measurement, as well as applying the calibration settings to analog circuits depending on the operating frequency, simultaneously. We implemented two different high-speed synchronous serial communication interfaces. They focused on command transmission with two bytes length for control and data packet transmission for large measurement data transmission.
The switched-mode power supply (ECM100UQ42, XP Power, Singapore, Singapore) with power isolation was suitable for medical device electrical safety standard (IEC 60601-1) [21] and electromagnetic wave safety standard (IEC 60601-1-2) used in the EIS system [22]. A USB isolator (ADuM4160, Analog Devices, Wilmington, USA) was also used on the controller board to prevent electrostatic discharge and make an isolation barrier for safety.

2.4. Calibration

Considering a wide impedance range of the normal and CIN tissues, a high output impedance of the constant current source was required for each operating frequency. To do that, we provided a calibration method for improving the performance of a constant current source considering the length of a cable.
  • Connecting the developed calibration board made of precision resistors instead of a probe.
  • Injecting current to a 1 k Ω resistor on the calibration board and measuring the amplitude of injecting current by I/V (current-to-voltage) converter.
  • Injecting current to a 0 Ω resistor on the calibration board and measuring the amplitude of injecting current by I/V converter.
  • Calculating output impedance using the voltage drop method [19].
  • Changing the values of digital potentiometers in the current source circuit and repeating steps of 2–4.
  • Finding the setting for maximum output impedance of the current source from matching the balance of resistance ratio in the improved Howland circuits.
  • Connecting the dedicated GIC circuit at that operating frequency to the improved Howland circuits with the found settings in step 6.
  • Changing the values of digital potentiometers in the dedicated GIC circuit and repeat actions 2–4.
  • Finding the setting for maximum output impedance of the current source by adjusting inductance in the GIC circuit to find LC resonance conditions for canceling capacitance generated from cable and switches.
We repeated these steps of (1–9) to find the setting for output impedance of the constant current source over 1 M Ω at all measurement frequencies in order to reduce the load effect to less than 0.1%.
Source current and sink current with opposite polarities were simultaneously injected on the calibration board to match the magnitude and direct current (DC) component of two single-ended current outputs generated by two identical IMMs. The magnitude of two balanced currents was adjusted by monitoring the output current through the ground channel. The DC current contained in each current output was adjusted by watching a period integration of current output through 0 Ω resistance.
After completing the correction of the constant current source described above, we repeated the process of (1–3) again to find the settings for the maximum output impedance, which were then saved to PC.

3. Experimental Setup

Since the EIS system and the probe were proposed for screening cervical intraepithelial neoplasia based on the electrical properties, several phantom experiments were also deliberately designed to validate the frequency dependency of the electrical properties on the region of measurement, depth, as well as membrane properties.
We prepared three different experimental phantoms using four different materials: saline and carrot, mixtures of graphite-agar, and giant vesicle suspensions. Among the materials, the resistivity spectra of saline and agar within our measurement frequency range are almost constant, while the electrical properties of carrot, graphite, and giant vesicle are frequency dependent. Specifically, carrots have been commonly used to characterize frequency-dependent behavior in many EIS and EIT experiments [20]. Since the cell wall could protect the internal cell environments, it allows easy management of the position and shape of an object for experiments. For this reason, the first experiment with carrot phantom was exploited to explore the sensitivity to the change of conductivity underneath the probe consisting of multiple active electrodes. From the experimental results, we could expect sensitivity with respect to the region and depth of the target. As to graphite, the relative permittivity of graphite changes rapidly with respect to frequency [23]. Hence, the amount of graphite can produce the permittivity difference in the agar phantom. The second experiment with the mixture phantom of graphite-agar can show the resistivity spectra due to frequency-dependency for the conductivity and permittivity of materials together. Given that the cell membranes of extracted tissues are easy to deteriorate, giant vesicles have been used to mimic the cell membrane of tissues [24,25,26]. The last phantom including giant vesicles was used to demonstrate the frequency dependency for the electrical properties due to the membrane.
All the measurements were carried out after the calibration with the saline of known conductivity. The description of the experimental setups was presented below, and all the data sets collected from phantoms were processed by Matlab 2020b (Mathworks, Natick, MA, USA). Before conducting several phantom experiments, the basic performance of the EIS system was evaluated using a calibration board.

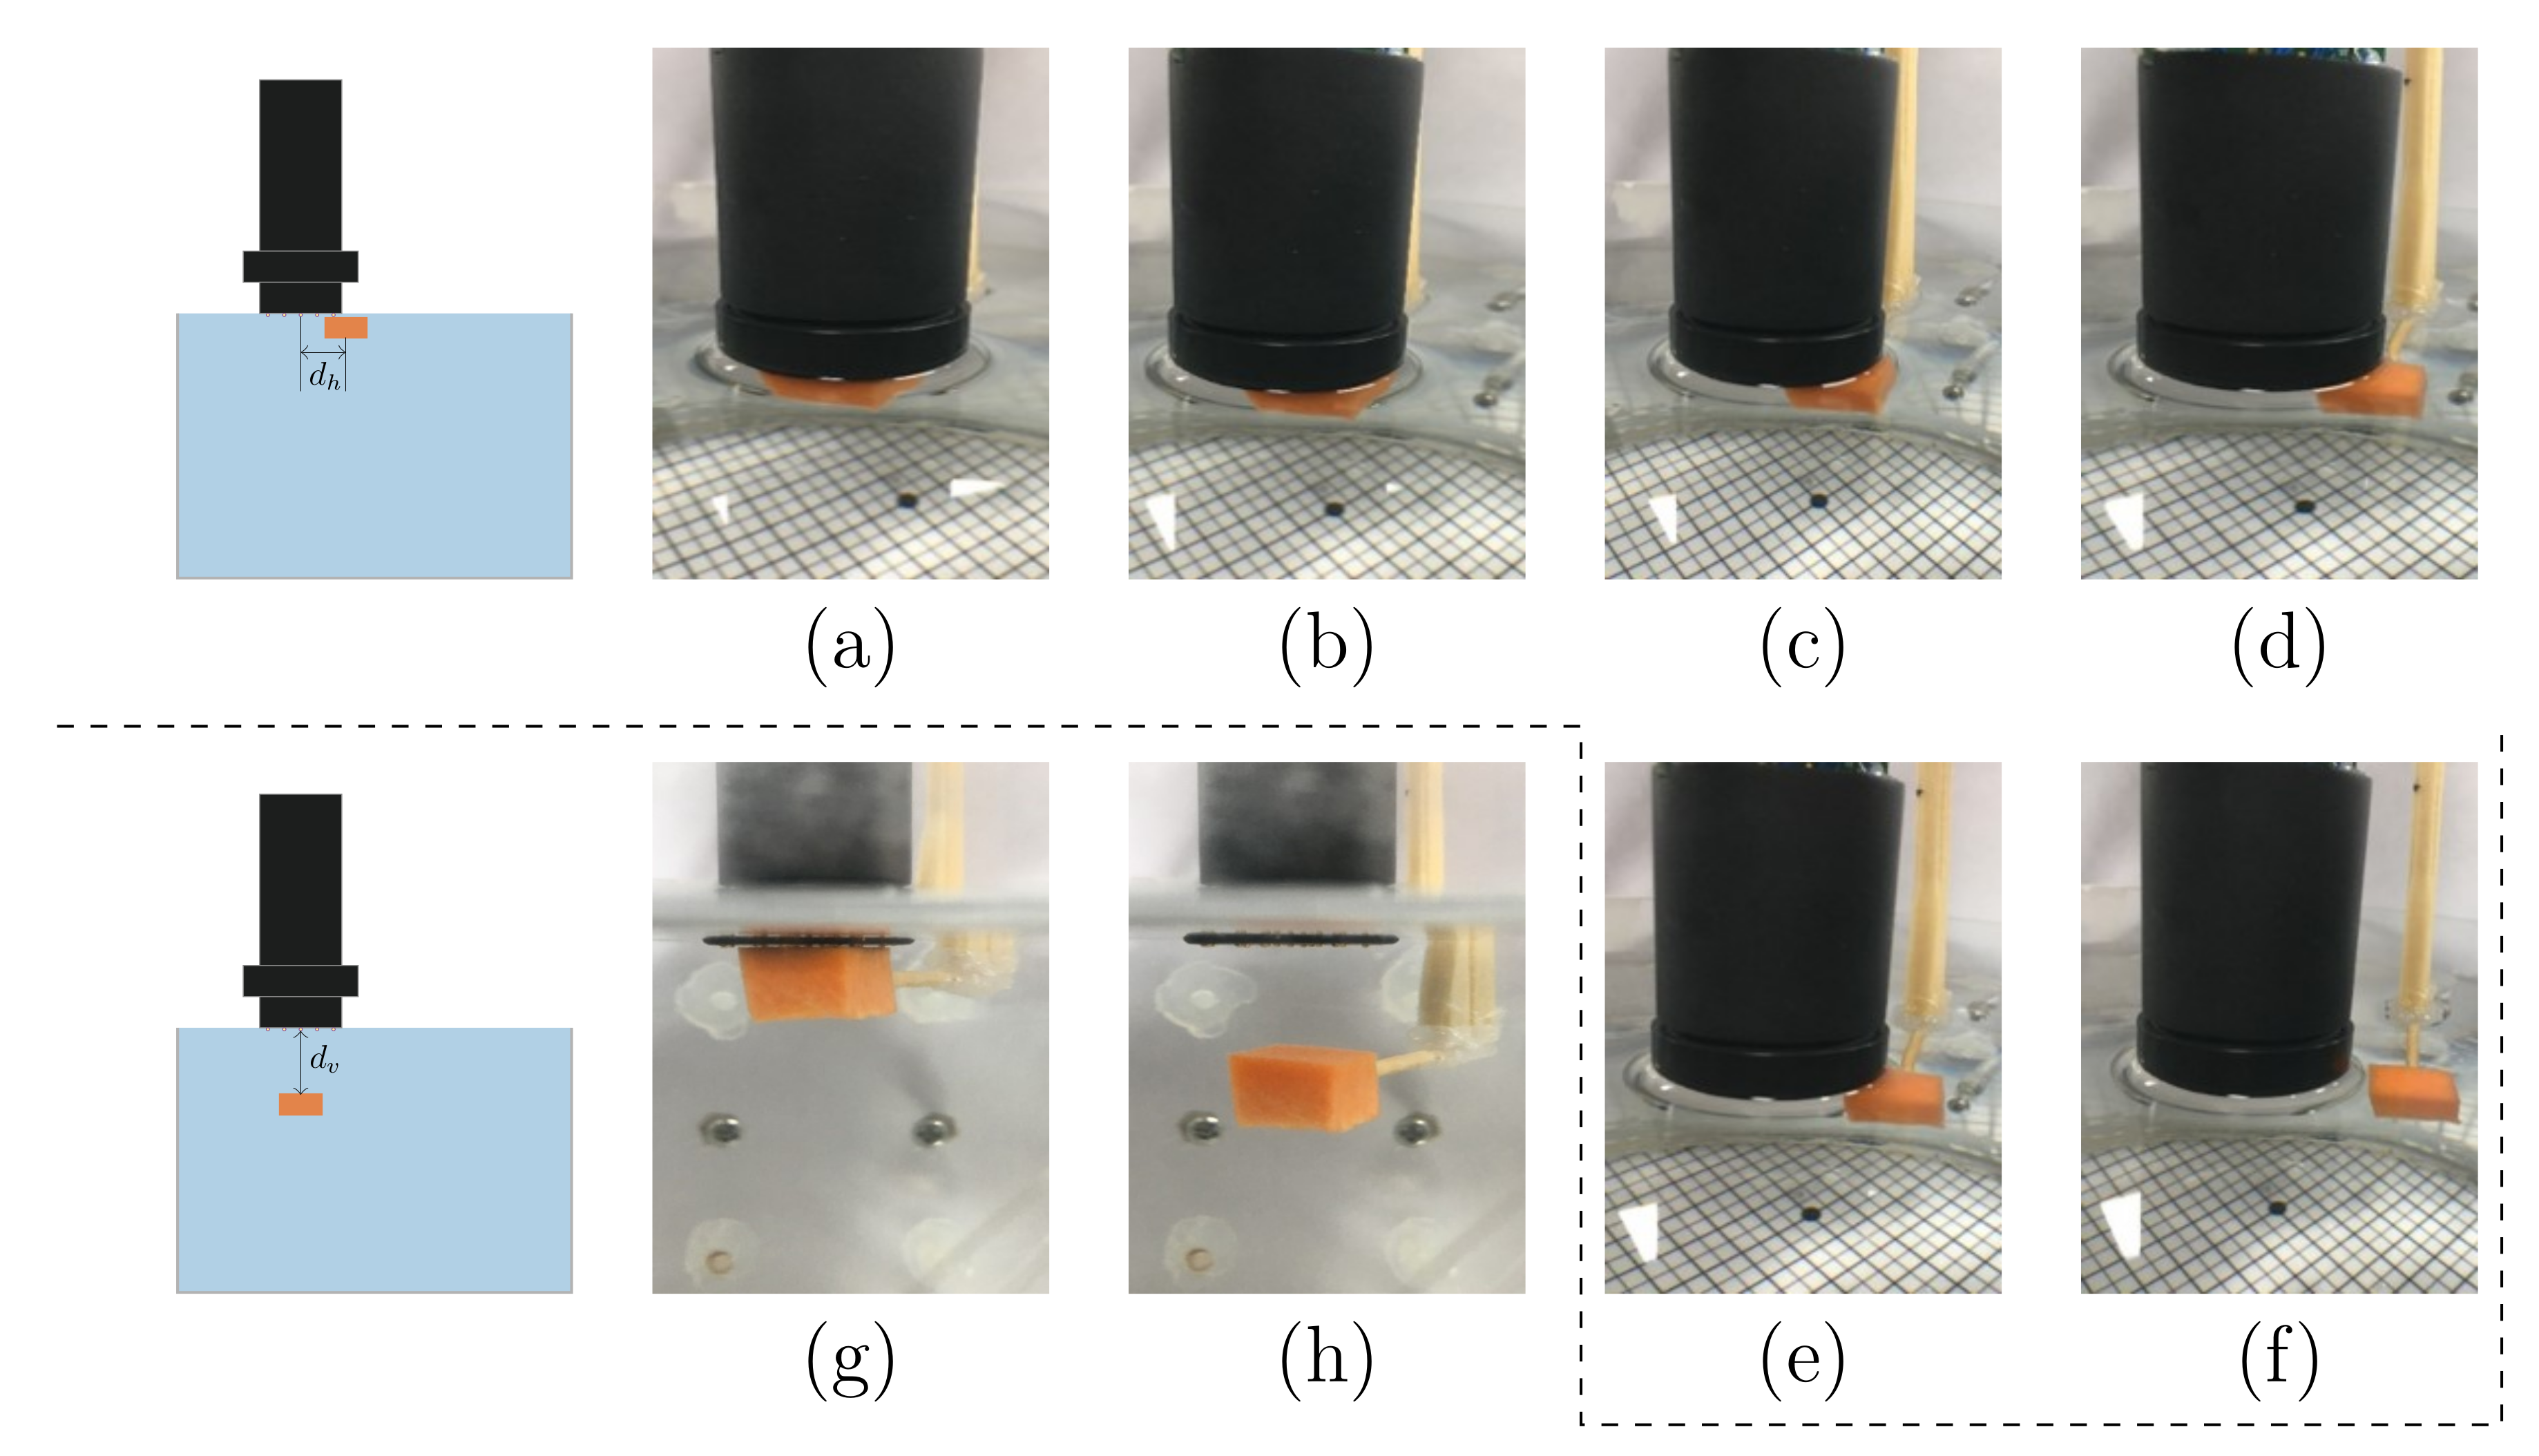
3.1. Carrot in Saline Phantom

We examined the measurement sensitivity according to the position of a cubic-shaped carrot object possessing a frequency-dependent conductivity in saline of constant conductivity [6]. A cylindrical tank (19 cm in diameter and 15 cm in depth) was filled with saline of 0.349 S/m. The surface of the electrodes arranged in the form of two concentric circles was completely immersed in the saline. We placed the cuboid carrot of size ( 6 × 6 × 3 mm 3 ) in the saline as illustrated in Figure 3. The probe’s position was fixed, and the position of the cuboid carrot object was relatively controlled using a hand-held fixed mount.
In the experiment, the carrot was placed horizontally and vertically apart from the center of the probe, as shown in Figure 3a–h, to scrutinize the sensitivity of the probe to the surrounding tissues. When the center position of the cuboid carrot ( d h ) was moved to (a) 0, (b) 2, (c) 4, (d) 6, (e) 8, (f) 10 mm regarding the center point in the probe, conductivity was measured at frequencies of 0.625, 1, 5, 10, 50, and 100 kHz for each horizontal position, as shown in Figure 3a–f. At this time, the top surface of the cuboid carrot was in close contact with the electrode. To investigate the sensitivity to depth, we measured the conductivity spectrum when increasing the vertical displacement ( d v ) between the top of the carrot and the bottom of the electrode surface by seven steps from 0 to 4.8 mm at 0.8 mm interval, as presented in Figure 3g,h. The progressive design of experiments allows insights into how the conductivity of surrounding tissues will influence the measured conductivity.

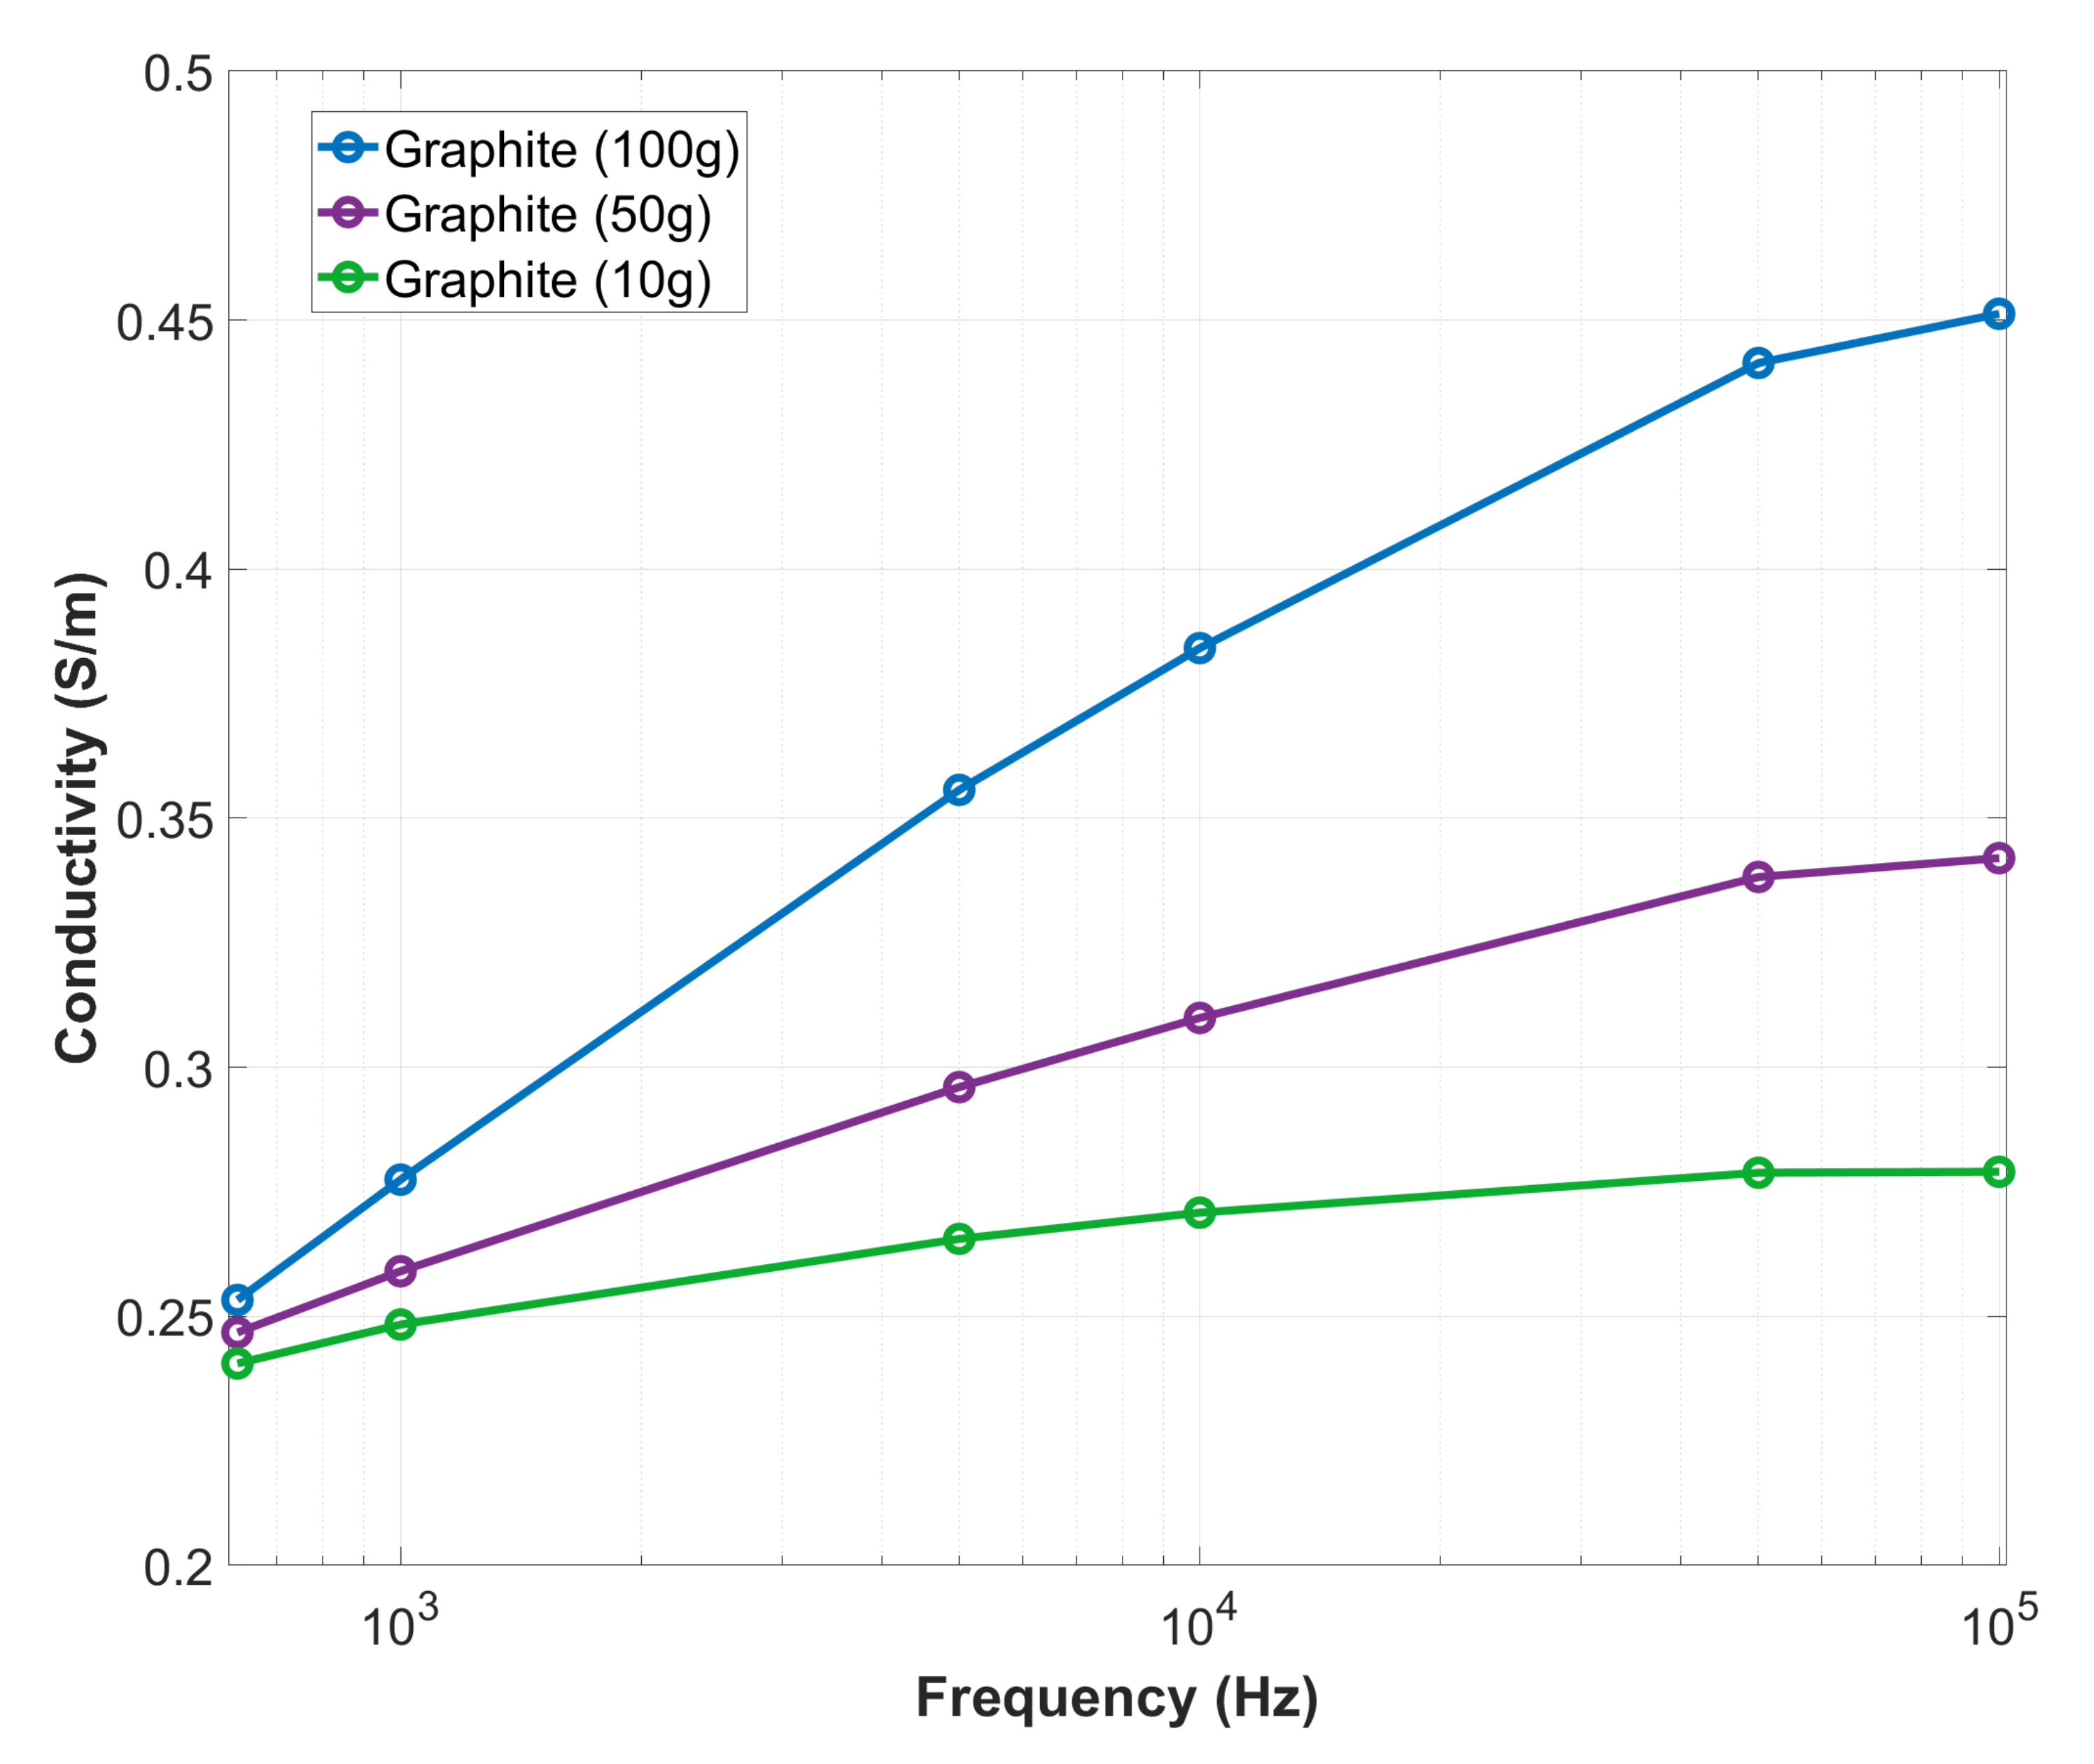
3.2. Graphite-Agar Phantoms

Both saline and agar, which are frequently used as phantoms for impedance spectrum measurement, are non-biological materials and exhibit constant conductivity regardless of the frequency range we used. However, the actual biological tissue is made of a material with permittivity at the frequency range we measure. Therefore, based on the previous studies of Kao et al. [23], we evaluated the performance of complex impedance measurement according to the change of permittivity by controlling the amount of graphite in the agar phantom.
The detailed composition of the mixture precisely followed Table 1, and all of the three phantoms, #1, #2, and #3, contained the same amount of distilled water (500 mL), agar (20 g), and NaCl (0.5 g). Nonetheless, as to the amount of graphite powder, phantom #1 included 10 g graphite, phantom #2 included 50 g, and phantom #3 possessed the maximum amount of graphite 100 g. After solidifying in the frame of volume 50 × 50 × 50 mm 3 ) for the mixture of graphite and agar, the magnitude of the conductivity spectrum was measured using a probe developed.

3.3. Giant Vesicle Phantoms

Giant vesicles can model structures similar to cell membranes, so they have been widely used to create phantoms to observe electrical phenomena caused by cell membranes [24,25,26]. Using the suggested method in the studies of Choi et al. [24], a phospholipid membrane for giant vesicles was formed, followed by the evaporation of the organic solvent.
In this study, the conductivity of saline used for generating giant vesicle suspensions was 0.344 S/m, and phantoms were prepared with five different volume fractions of the giant vesicles. The giant vesicle density of each phantom was estimated as 20%, 25%, 30%, 40%, and 50% from the fluorescence microscopy observation, approximately. The mean ± standard deviation (SD) of the diameters of the giant vesicles were 13 ± 4.7 µm.
The prepared phantoms using giant vesicle suspensions were exposed to the current at the aforementioned frequency range of 0.625, 1, 5, 10, 50, and 100 kHz. The electrical characteristics of each phantom with different volume fractions of giant vesicles were recorded using the EIS system with multiple active electrodes probe.

4. Results and Discussion

4.1. Basic Performance of EIS System

The dual single-ended current source was calibrated to maximize the output impedance of the source and sink channels using digitally controlled variable resistors inside the current source circuit and the GIC. As a result, they exhibited values of 20.6 to 1000 M Ω at measurement frequencies. The average output impedance of the source side was 523.2 M Ω , and the sink side was 534.4 M Ω , which showed similar performance. When the interference among measurement channels was evaluated in the measurement frequency band, the performance was less than −80 dB except for the current injection channel. To evaluate the performance of the EIS system, a resistance phantom on the calibration board was used to perform measurements at the operating frequencies of 0.625, 1, 5, 10, 50, and 100 kHz for one hour. The signal-to-noise ratio calculated from the measured data maintained over 80 dB at all operating frequencies. In the accuracy-test using 40–500 Ω resistive loads, the average measurement error was 0.23% at all measurement frequencies, and the accuracy was higher than 99.5%.

4.2. Carrot in the Saline Phantom

Figure 4 demonstrates the changes of conductivity measured by the EIS system with multiple active electrodes probe when the carrot was moved horizontally and vertically apart from the center of the probe inside the saline tank.
As is observed in Figure 4a,b, the conductivity (unit: S/m) of cuboid carrot increases with respect to the applied frequency due to the penetration of current at high frequencies. In contrast, the conductivity of saline is constant at all measured frequencies. The conductivity measured by the probe is approaching the conductivity of the background saline as the object moves away from the probe.
In Figure 4a, the frequency difference in the conductivity spectrum at the measured frequencies was less than 6.1% when the object’s center position was placed at 0 mm and 2 mm of d h , which the whole object was included in the region under the multiple active electrodes probe. However, the difference of the conductivity spectrum among measured frequencies was decreased when the partial volume of the object was only included in the region under the probe. If the center of the object was positioned at 6 mm of d h , only 12.7% of the object was included in the multi-array electrode region so that the difference in the conductivity spectrum was abruptly reduced. At the 8 mm position, the result similar to the ones of the 6 mm case could be explained as they were affected by the inaccurate position of the object and diffusion of current when the object was positioned at the boundary of the probe. Thus, it can be seen that the sensitivity of the measurement decreases sharply near the boundary of the probe. Additionally, when the object was completely moved out of the probe as shown in case of d h = 10 mm, the frequency difference in the conductivity spectrum was 99.9% decreased compared with that of case of d h = 0 mm.
In Figure 4b, d v increased from 0 to 4.8 mm by 0.8 mm interval. When comparing the difference in the conductivity spectrum between 0 mm and 0.8 mm of d v , it was 63.8%) decreased. From the trend of measurement for increasing d v , we could predict that the sensitivity of the depth direction decreases very rapidly. In other words, this means that most of the sensing energy is focused on the region just below the multiple electrodes probe, and the sensitivity to thin tissues could be maximized when an amount of injection current is fixed. It may be better for observing the epithelial cell layer of the cervical tissue, as it is less affected by the properties of the deep tissue below the probe surface.

4.3. Graphite-Agar Phantoms

Figure 5 presents the conductivity spectra of three graphite-agar phantoms #1, #2, and #3 with various concentrations of graphite powder. Albeit the conductivity of agar and saline alone is nearly invariant at the applied range of frequency, after the addition of the graphite powder, the mixture conductivity of graphite-agar escalates with the increment of applied frequencies [23], as shown in Figure 5. Moreover, the conductivity of the mixture increases with more concentration of graphite powder added to the phantoms within the frequency range from 0.625 to 100 kHz. Although the pilot experiment on the change in permittivity presented limited results, it attempted to show the possibility of using all information on the conductivity and permittivity of the tissue in the future.

4.4. Giant Vesicle Phantoms

Analogously, the conductivity spectra of giant vesicle suspensions in saline are shown in Figure 6 when the applied frequency varies from 0.625 kHz to 100 kHz. The conductivity spectra from the giant vesicle suspensions of five different volume fractions, 20%, 25%, 30%, 40%, and 50%, are displayed as circles, while the saline conductivity spectrum is marked as squares. Phantoms with five different volume fractions exhibited different frequency dependencies in the conductivity spectrum depending on the proportion of giant vesicles with phospholipid membranes. When comparing the magnitude of the complex conductivity measured at 0.625 kHz and 100 kHz, it showed a change of 13.9 ± 1.4% (mean ± SD) as the volume ratio of giant vesicles increased. On the other hand, since the low-frequency injection current cannot easily penetrate through the insulating membrane composed of phospholipids, the conductivity spectra of the giant vesicle phantoms had changed within 0.3% at measurement frequencies below 5 kHz.
As the frequency of the sensing current injected from the probe increases, the amount of current passing through the insulating membrane increases. Therefore, the conductivity of the giant vesicle suspension increases, as shown in Figure 6. It shows limited results because it was challenging to control the size and number of giant vesicles. However, as the volume of giant vesicles contained in saline increases, the magnitude change in conductivity according to frequency increases, which is related to the different amounts of extra-fluid and intra-fluid separated by the insulating membrane [24]. When considering histological changes included an increased nuclear/cytoplasmic ratio, loss of the layer of flattened cells, and an increase in the volume of extracellular space, these results show that it might be possible to detect the cervical intraepithelial neoplasia using the developed EIS system.

4.5. Toward Clinical Trials

The clinical application of EIS has been frequently suggested due to its advantages of low cost, high sensitivity, real-time diagnosis, and radiation-free. However, for screening cervical tissue, the EIS system requires a long shaft structure due to the deep location of the cervical tissue. For this reason, there have been studies on the diagnosis of the severity of CIN using a four-electrode probe adjunctive to the colposcopy [9,10,11,12,13,27]. Given that the coverage of the four-electrode probe was quite small, the colposcopy was priorly used to visualize the pathological region, which was then investigated by the four-electrode probe to improve the sensitivity and specificity. The small measurable region and the negative sensitivity area of the four-electrode probe limited the usage as an independent screening device of the cervical region for CIN. For that reason, a few EIS systems using a multi-electrode probe have been developed to overcome these limitations. For instance, the multi-electrode probe was designed to identify prostate cancer [28,29]. According to the experimental results for the sensitivity with respect to the sensing region and depth using a carrot, it had higher sensitivity underneath the multi-electrode probe of 10 mm diameter than that of the periphery region. Although this experiment did not compare the results from the conventional four-electrode, the accuracy in the region under the multi-electrode probe was higher according to a comparative study with the existing four-electrode measurement [16]. Thus, it would be helpful to estimate the electrical property under the large size of the multi-electrode probe as the independent screening device for CIN.
Realistically, the cervical tissue is more sophisticated than the phantoms used in the experiments. Based on the previous EIS measurements associated with the severities of CIN and applied frequencies, we could have an estimation of resistivity changes around 2–30 Ω · m within the frequency range of 0.1–100 kHz due to the histological changes according to the progression of CIN [9,30]. We repeated measurements for each case three times, and the average standard deviation of measurements at all frequencies was 0.05 ± 0.04 Ω · m. Therefore, it may be enough to classify the pathological state of the cervical tissue. However, these performance indicators were obtained from the results of similar phantoms. It is necessary to carry out further investigation into the performance of the real cervical tissues in the clinical trial. Nevertheless, the results of various phantom experiments for performance verification have laid the groundwork for clinical trials in a large number of human subjects using a non-invasive, simple, and low-cost device.
When performing a clinical experiment on cervical tissue, one issue is involved with the stable contacts of a large number of electrodes due to an uneven surface. To deal with this issue, in the developed system, each electrode was manufactured using a spring-loaded pin to improve the contact by applying a little pressure. Additionally, it would be necessary to include a sensor to measure the applied pressure to the tissues. It is worth reminding that the delectability of the proposed EIS probe depends not only on the conductivity changes of the object, but also on the location of the target object as illustrated in Figure 4.
Finally, we expect to perform the clinical trials using the proposed EIS system with the probe that consists of multiple active electrodes for the feasibility of screening CIN in the next step. Further studies will involve a large number of recruited patients diagnosed with different grades of CIN, the quantitative analysis of cervical tissue, and comparative studies with the other existing EIS devices applied to the CIN screening.

5. Conclusions

We proposed the multi-channel EIS system and probe with multiple active electrodes to screen cervical cancer using impedance spectroscopic measurement. The technique was applied to reduce the negative effect of the cable used for connection between the probe inserted into the cervix and the EIS measurement system. It was designed to quickly measure the impedance spectrum from several pairs of electrodes according to the pre-designed protocol.
Along with the basic performance verification of the constant current source and the voltmeter, we considered tissue changes occurring in the precancerous lesion of cervical cancer, and proposed an experimental method to present the performance of sensitivity and delectability with measuring electrical properties. From the results of phantom experiments, it was possible to present the change in the measurement sensitivity of the multiple active electrode probe according to the horizontal and vertical position of the target and measurement frequency. Furthermore, the aforementioned results demonstrated the possibility of identifying the changes in permittivity and conductivity due to the destruction of the insulating cell membranes. These results can be used to evaluate the quality or interpret the data measured in future clinical trials.

Author Contributions

Conceptualization, D.P. and T.O.; methodology, Y.J., T.Z. and T.O.; software, Y.J. and T.Z.; validation, T.O. formal analysis, T.Z. and T.O.; investigation, D.P. and T.O.; resources, T.O.; data curation, T.Z. and T.O.; writing—original draft preparation, T.Z.; writing—review and editing, D.P. and T.O.; visualization, T.Z. and T.O.; supervision, T.O.; project administration, D.P. and T.O.; funding acquisition, T.Z., D.P. and T.O. All authors have read and agreed to the published version of the manuscript.

Funding

This research was supported by Basic Science Research Program through the National Research Foundation of Korea (NRF) funded by the Ministry of Education(NRF-2020R1I1A1A01066649), and the National Research Foundation of Korea (NRF) grant funded by the Korea government (NRF-2020R1A2C1008975 and NRF 2019R1A2C1086807).

Conflicts of Interest

The authors declare no conflict of interest.

References

  1. Bray, F.; Ferlay, J.; Soerjomataram, I.; Siegel, R.L.; Torre, L.A.; Jemal, A. Global cancer statistics 2018: GLOBOCAN estimates of incidence and mortality worldwide for 36 cancers in 185 countries. CA A Cancer J. Clin. 2018, 68, 394–424. [Google Scholar] [CrossRef] [Green Version]
  2. Cohen, P.A.; Jhingran, A.; Oaknin, A.; Denny, L. Cervical cancer. Lancet 2019, 393, 169–182. [Google Scholar] [CrossRef]
  3. Mayrand, M.H.; Duarte-Franco, E.; Rodrigues, I.; Walter, S.D.; Hanley, J.; Ferenczy, A.; Ratnam, S.; Coutlee, F.; Franco, E.L. Human papillomavirus DNA versus Papanicolaou screening tests for cervical cancer. N. Engl. J. Med. 2007, 357, 1579–1588. [Google Scholar] [CrossRef] [PubMed] [Green Version]
  4. Clavel, C.; Masure, M.; Bory, J.P.; Putaud, I.; Mangeonjean, C.; Lorenzato, M.; Nazeyrollas, P.; Gabriel, R.; Quereux, C.; Birembaut, P. Human papillomavirus testing in primary screening for the detection of high-grade cervical lesions: A study of 7932 women. Br. J. Cancer 2001, 84, 1616–1623. [Google Scholar] [CrossRef] [PubMed] [Green Version]
  5. Rigaud, B.; Morucci, J.P.; Chauveau, N. Bioelectrical impedance techniques in medicine. Part I: Bioimpedance measurement. Second section: Impedance spectrometry. Crit. Rev. Biomed. Eng. 1996, 24, 257–351. [Google Scholar] [CrossRef]
  6. Gabriel, S.; Lau, R.W.; Gabriel, C. The dielectric properties of biological tissues: II. Measurements in the frequency range 10 Hz to 20 GHz. Phys. Med. Biol. 1996, 41, 2251. [Google Scholar] [CrossRef] [Green Version]
  7. White, F.H.; Gohari, K. Alterations in the volume of the intercellular space between epithelial-cells of the hamster cheek-pouch: Quantitative studies of normal and carcinogen-treated tissues. J. Oral Pathol. Med. 1984, 13, 244–254. [Google Scholar] [CrossRef]
  8. Sorensen, F.B.; Bichel, P.; Jakobsen, A. Stereological estimates of nuclear volume in squamous-cell carcinoma of the uterine cervix and its precursors. Virchows Archiv A Pathol. Anat. Histopath. 1991, 418, 225–233. [Google Scholar] [CrossRef]
  9. Walker, D.C.; Brown, B.H.; Hose, D.R.; Smallwood, R.H. Modelling the electrical impedivity of normal and premalignant cervical tissue. Electron. Lett. 2000, 36, 1603–1604. [Google Scholar] [CrossRef] [Green Version]
  10. Abdul, S.; Brown, B.H.; Milnes, P.; Tidy, J.A. A clinical study of the use of impedance spectroscopy in the detection of cervical intraepithelial neoplasia (CIN). Gynecol. Oncol. 2005, 99, S64–S66. [Google Scholar] [CrossRef] [PubMed]
  11. Brown, B.H.; Tidy, J.A.; Boston, K.; Blackett, A.D.; Smallwood, R.H.; Sharp, F. Relation between tissue structure and imposed electrical current flow in cervical neoplasia. Lancet 2000, 355, 892–895. [Google Scholar] [CrossRef]
  12. Das, L.; Das, S.; Chatterjee, J. Electrical bioimpedance analysis: A new method in cervical cancer screening. J. Med. Eng. 2015, 2015, 636075. [Google Scholar] [CrossRef] [Green Version]
  13. Olarte Echeverri, G.; Aristizábal Botero, W.; Gallego Sánchez, P.A. Evaluation of electrical impedance spectroscopy for cervical intraepithelial lesions detection. Biosalud 2015, 14, 26–35. [Google Scholar] [CrossRef]
  14. Kwon, H.; McEwan, A.L.; Oh, T.I.; Farooq, A.; Woo, E.J.; Seo, J.K. A local region of interest imaging method for electrical impedance tomography with internal electrodes. Comput. Math. Methods Med. 2013, 2013, 964918. [Google Scholar] [CrossRef] [PubMed]
  15. Karki, B.; Wi, H.; McEwan, A.; Kwon, H.; Oh, T.I.; Woo, E.J.; Seo, J.K. Evaluation of a multi-electrode bioimpedance spectroscopy tensor probe to detect the anisotropic conductivity spectra of biological tissues. Meas. Sci. Technol. 2014, 25, 075702. [Google Scholar] [CrossRef]
  16. Kwon, H.; Wi, H.; Karki, B.; Lee, E.J.; McEwan, A.; Woo, E.J.; Harrach, B.; Seo, J.K.; Oh, T.I. Bioimpedance spectroscopy tensor probe for anisotropic measurements. Electron. Lett. 2012, 48, 1253–1255. [Google Scholar] [CrossRef] [Green Version]
  17. Seo, J.K.; Woo, E.J. Nonlinear Inverse Problems in Imaging; John Wiley & Sons: Hoboken, NJ, USA, 2012. [Google Scholar]
  18. Cherepenin, V.; Karpov, A.; Korjenevsky, A.; Kornienko, V.; Mazaletskaya, A.; Mazourov, D.; Meister, D. A 3D electrical impedance tomography (EIT) system for breast cancer detection. Physiol. Meas. 2001, 22, 9–18. [Google Scholar] [CrossRef]
  19. Wi, H.; Sohal, H.; McEwan, A.L.; Woo, E.J.; Oh, T.I. Multi-frequency electrical impedance tomography system with automatic self-calibration for long-term monitoring. IEEE Trans. Circuits Syst. 2013, 8, 119–128. [Google Scholar]
  20. Holder, D.S. Electrical Impedance Tomography: Methods, History Furthermore, Applications; CRC Press: Boca Raton, FL, USA, 2004. [Google Scholar]
  21. IEC 60601-1:2005+AMD1:2012+AMD2:2020 CSV. Medical Electrical Equipment—Part 1: General Requirements for Basic Safety and Essential Performance; International Organization for Standardization: Geneva, Switzerland, 2020. [Google Scholar]
  22. IEC 60601-1-2:2014+AMD1:2020 CSV. Consolidated Version Medical Electrical Equipment—Part 1–2: General Requirements for Basic Safety and Essential Performance—Collateral Standard: Electromagnetic Disturbances—Requirements and Tests; International Organization for Standardization: Geneva, Switzerland, 2020. [Google Scholar]
  23. Kao, T.J.; Saulnier, G.J.; Isaacson, D.; Szabo, T.L.; Newell, J.C. A versatile high-permittivity phantom for EIT. IEEE. Trans. Biomed. Eng. 2008, 55, 2601–2607. [Google Scholar] [CrossRef] [PubMed] [Green Version]
  24. Choi, B.K.; Katoch, N.; Kim, H.J.; Park, J.A.; Ko, I.O.; Kwon, O.I.; Woo, E.J. Validation of conductivity tensor imaging using giant vesicle suspensions with different ion mobilities. Biomed. Eng. Online 2020, 19, 1–17. [Google Scholar] [CrossRef]
  25. Schwan, H.P. Electrical properties of tissue and cell suspensions. Adv Biol Med Phys. 1957, 5, 147–209. [Google Scholar] [PubMed]
  26. Dimova, R.; Riske, K.A.; Aranda, S.; Bezlyepkina, N.; Knorr, R.L.; Lipowsky, R. Giant vesicles in electric fields. Soft Matter 2007, 3, 817–827. [Google Scholar] [CrossRef] [Green Version]
  27. Brown, B.H.; Milnes, P.; Abdul, S.; Tidy, J.A. Detection of cervical intraepithelial neoplasia using impedance spectroscopy: A prospective study. BJOG Int. J. Obstet. Gynaecol. 2005, 112, 802–806. [Google Scholar] [CrossRef] [PubMed]
  28. Khan, S.; Mahara, A.; Hyams, E.S.; Schned, A.R.; Halter, R.J. Prostate cancer detection using composite impedance metric. IEEE Trans. Med. Imaging 2016, 35, 2513–2523. [Google Scholar] [CrossRef] [Green Version]
  29. Murphy, E.K.; Mahara, A.; Khan, S.; Hyams, E.S.; Schned, A.R.; Pettus, J.; Halter, R.J. Comparative study of separation between prostatic malignant and benign tissue using electrical impedance spectroscopy and electrical impedance tomography. Physiol. Meas. 2017, 38, 1242–1261. [Google Scholar] [CrossRef] [PubMed]
  30. Balasubramani, L.; Brown, B.H.; Healey, J.; Tidy, J.A. The detection of cervical intraepithelial neoplasia by electrical impedance spectroscopy: The effects of acetic acid and tissue homogeneity. Gynecol. Oncol. 2009, 115, 267–271. [Google Scholar] [CrossRef]
Figure 1. (a) The concept diagram of the multiple active electrodes EIS probe. (b) Implementation of EIS probe with spring-loaded pins, signal buffers, and printed circuit board (PCB). (c) Probe sealing case to protect against contamination.
Electronics 10 01933 g001
Figure 2. (a) Probe with multiple active electrodes. (b) Multi-channel electrical impedance spectroscopy. (c) The block diagram of the EIS system.
Electronics 10 01933 g002
Figure 3. The experimental setup for investigating the sensitivity of probe with respect to the position. (af) The carrot moves horizontally away from the center of probe d h = 0 mm to d h = 10 mm at 2 mm interval. (g,h) The carrot moves vertically away from the center of the probe d v = 0 mm to d v = 4.8 mm at 0.8 mm interval.
Electronics 10 01933 g003
Figure 4. Conductivity spectra of the carrot in saline phantom from 0.625 to 100 kHz when the carrot was moving horizontally (a) and vertically (b) apart from the center of the probe. (a) The conductivity σ with respect to the horizontal distance d h of carrot to the center of the probe. (b) The conductivity σ with respect to the vertical distance d v between the top surface of the carrot and the bottom of the probe.
Electronics 10 01933 g004
Figure 5. The conductivity spectra of three graphite-agar phantoms with various concentrations of graphite added: 10 g, 50 g, and 100 g.
Electronics 10 01933 g005
Figure 6. Conductivity spectra of giant vesicle suspensions in saline when applied frequencies are 0.625, 1, 5, 10, 50, and 100 kHz. Five different partial volume fractions of 20%, 25%, 30%, 40%, and 50% giant vesicles in the saline with the same amount of total volume are marked as circles in the conductivity spectra. The saline conductivity spectrum is displayed as squares.
Electronics 10 01933 g006
Table 1. The mixture composition of graphite-agar phantoms.
Phantom No.#1#2#3
Distilled water (mL)500500500
Agar (g)202020
NaCl (g)0.50.50.5
Graphite (g)1050100
Publisher’s Note: MDPI stays neutral with regard to jurisdictional claims in published maps and institutional affiliations.

