
Enhanced Math Efficacy and Performance of Minority Students through Student Class Preparation and Teacher Support


1
Department of Counseling, Recreation, & School Psychology, College of Arts, Sciences & Education, Florida International University, Miami, FL 33199, USA
2
Department of Learning and Instruction, Graduate School of Education, State University of New York, New York, NY 10022, USA
3
Department of Teaching and Learning, College of Arts, Sciences & Education, Florida International University, Miami, FL 33199, USA
*
Author to whom correspondence should be addressed.
Educ. Sci. 2023, 13(11), 1158; https://doi.org/10.3390/educsci13111158
Submission received: 14 September 2023
/
Revised: 9 November 2023
/
Accepted: 17 November 2023
/
Published: 19 November 2023
Abstract
:This research investigates how minority students demonstrate their math self-efficacy and performance, shaped by factors such as class preparation and math teacher support. Leveraging a comprehensive US national dataset, this study aims to provide broadly applicable insights and suggestions for students from diverse racial and linguistic backgrounds. The findings underscore the substantial influence of high school students’ class preparation on teacher support, math self-efficacy, and math performance. Notably, teacher support exhibits a positive impact solely on math self-efficacy but does not extend to their math performance. Upon examination of various demographic groups, this research identifies noteworthy disparities in the effects experienced by different racial and linguistic groups. This study’s results carry practical implications for educators and practitioners, shedding light on strategies to enhance various minority students’ math self-efficacy and outcomes.
1. Introduction
Fostering robust math performance and instilling confidence among students stands as an ongoing challenge for educators and policymakers alike. This challenge takes on heightened significance within the context of US education, where the math performance of high school students trails behind that of their peers in other developed countries [1]. Researchers have also linked the United States’ poor math performance to a significant failure in providing adequate support for minority students, including those from racial and linguistic minority backgrounds [2,3]. Scholars have diligently sought to pinpoint the underlying factors contributing to this subpar math performance while also delving into the substantial achievement gap that exists between minority and White students [4,5,6,7,8]. In response to this dual concern—the overall lackluster performance and the pronounced performance disparity—educational researchers in the US have proffered recommendations aimed at identifying pivotal drivers for enhancing math performance and refining the math classroom environment [8].
Significantly, the role of teacher support within math classrooms has emerged as a critical determinant for cultivating students’ academic self-efficacy and overall outcomes within the US educational landscape [9]. The effective cultivation of students’ ability to comprehend mathematical ideas, concepts, and procedures can be achieved through meaningful discourse with teachers, particularly when teachers construct specialized contexts for the purposeful use of language [10]. This factor assumes even greater importance for minority students [11,12,13]. Within schools marked by supportive educators attuned to students’ individual needs, the likelihood of engagement in negative behaviors, such as substance abuse or violence, diminishes. Correspondingly, students are more inclined to develop positive self-perceptions and exhibit prosocial behaviors, thereby fostering a conducive environment for academic success [14].
Furthermore, research underscores the necessity of exploring the impact of teacher influence on students’ educational outcomes while accounting for the students’ familial backgrounds and the broader school milieu [12]. In this study, researchers attempted to provide actionable insights concerning how teachers can impact minority students’ academic motivation and their math outcomes in school. This effort is particularly important in the context of the intricate dynamics of diverse groups and their interplay with both academic and non-academic outcomes. Consequently, the present study undertakes a thorough examination of the distinct effects of teacher support on students hailing from varied racial, linguistic, and social classes. This investigation encompasses both performance outcomes and self-efficacy within the math classroom context, intricately intertwined with the dynamics of the math class itself. We posit that a comprehensive exploration of the interactions between these variables is indispensable to comprehending the nuanced facets of teacher support’s efficacy for minoritized students, who contribute diverse cultural perspectives to their math education. This effort is of particular significance in the US math education that suffers from a performance gap between mainstream and marginalized students [3].
To elucidate the multifaceted impact of student backgrounds, classroom dynamics, and teacher support on math performance, our study draws insights from prior research that explain the disparities in students’ math performance and math self-efficacy. We begin by consulting literature that considers math efficacy as a precursor to academic achievement in math. This serves as a foundational step towards comprehending the intricate pathways and varied outcomes experienced by groups representing diverse racial, linguistic, social, and gender backgrounds.
Our dataset derives from the High School Longitudinal Study of 2009 (HSLS), a comprehensive US national database. The choice to utilize this extensive data set stems from a motivation to furnish empirical research findings endowed with a high degree of generalizability.
The study is guided by the following key questions:
- Which groups, categorized by racial, linguistic, social class, and gender factors, exhibit significant disparities in terms of class preparation, perceptions of teacher support, math self-efficacy, and math performance?
- To what extent does students’ class preparation shape significant pathways toward forming perceptions of teacher support, math self-efficacy, and math performance? Do these pathways diverge across different racial, linguistic, social class, and gender groups?
- Does students’ perception of teacher support exert an influence on their math self-efficacy or math performance? How do these effects vary among different racial, linguistic, social class, and gender groups?
- Does students’ math efficacy influence their math performance? How do these influences differ across various racial, linguistic, social class, and gender groups?
2. Literature Review
2.1. Racial Disparities in Math Self-Efficacy and Achievement
Disparities in students’ math efficacy can be construed as structured sociocultural responses stemming from their environment, which in turn impact their self-efficacy. According to Spencer et al. [15], a student’s preexisting beliefs concerning their affiliation with an ethnic or racial group can exert influence on their academic performance. This phenomenon transpires through an internalization process wherein students view group performance as indicative of individual ability and interest in a particular subject. This notion, known as “stereotype threat”, has the potential to disrupt students’ performance and lead to unfavorable outcomes such as stigmatization, heightened uncertainty, anxiety, and ultimately, subpar performance in mathematics [16].
Several research studies investigating the impact of math efficacy on math performance within minority groups have yielded inconsistent findings [12,17,18,19,20]. It is evident that human development and learning are intricately linked to cultural, institutional, and historical contexts. The developmental trajectory of children unfolds in two distinct phases: social and psychological. During the early stages of life, children’s psychological growth is facilitated through interactions with their surroundings, and these interactions are subsequently internalized through an intra-psychological process. Performance in math class easily invites sociocultural stereotypes, which leads to perceptions of competence based on race and color. Cheema and Skultety [21] analyzed nationally representative data from 15-year-old US students and found that Black and Hispanic students consistently overestimated their abilities in science and mathematics, whereas white students consistently underestimated their abilities.
2.2. Linguistic Group Difference in Math Efficacy and Performance
Proficiency in language plays a pivotal role not only in the comprehension of written text and writing skills but also in the acquisition of mathematical knowledge [10,20]. While the numerical system is often deemed a universal language, the mastery of mathematical text and word problems necessitates specific language competencies, including precise vocabulary, syntax, and symbols. Unlike their proficient English-speaking peers, students classified as English language learners (ELLs) confront the additional challenge of simultaneously mastering English language skills while engaging with grade-level content, including mathematics [22]. Consequently, they encounter heightened obstacles in achieving success in mathematics [23,24].
In the exploration of disparities between ELLs and non-ELLs concerning self-efficacy, Soland and Sandilos [25] highlighted that ELL students tend to commence their academic journey with notably lower levels of self-efficacy compared to their non-ELL counterparts. Moreover, their low self-efficacy is linked to slow growth in math and reading proficiency as they progress through middle school grades. In a study involving fifth graders, Sandilos et al. [26] discovered that students who had not yet attained English proficiency exhibited inferior performance and self-efficacy across both mathematics and science, unlike their English-proficient peers. Interestingly, the relationship between limited English proficiency and math achievement was not fully explained by self-efficacy. Kim et al. [27] revealed that ELL students harboring robust beliefs in their capacity to learn within specific content domains were more likely to employ cognitive and metacognitive strategies to aid the comprehension, retention, and application of academic language. To summarize, ELLs often contend with lower academic self-efficacy than their non-ELL counterparts. Nonetheless, cultivating high self-efficacy in mathematics could serve as a potent catalyst for supporting their accomplishments within English-based math classrooms.
2.3. Impact of Home and School Environments on Math Efficacy and Performance
The home environment, encompassing factors such as family socioeconomic status (SES), parental occupation, home literacy surroundings, and parental role strain emerges as the foremost predictor of initial disparities in students’ academic achievements. Students from low SES households, in contrast to their middle- and upper-income counterparts, often lack early exposure to mathematical concepts, quality instruction, and personalized attention in mathematics [28,29]. Consequently, they encounter limited access to educational resources and reduced parental involvement in their learning [5,30,31]. These circumstances frequently result in academic lag, contributing to diminished math efficacy and reduced engagement in mathematical learning [32,33]. This sequence of causation fosters a cycle of disengagement and subdued expectations. Furthermore, disadvantages within the home environment can be compounded by inequitable opportunities within the educational system [29]. Notably, school segregation based on social class influences students’ motivation levels and exposure to high-quality educational resources and qualified educators [34,35]. Black students are three times more likely to live in poverty than White students [1], and the academic achievement gap is largely attributed to disparities in SES [36]. Furthermore, distinctions in school-based experiences between minoritized students and parents and those of White students have also been invoked to elucidate the achievement gap. Ancis et al. [37] and Herman [38] highlighted that Black students often perceive instances of racial prejudice within academic settings, which elevates emotional stress and dampens motivation to learn. This divergence in school experiences leads to fewer opportunities for Black students to engage with high-achieving peers and hinders their overall learning environment [39]. To encapsulate, minoritized students encounter fewer learning opportunities at home and encounter greater obstacles within schools when compared to their White counterparts.
2.4. Influences of Students’ Unpreparedness on Math Classroom Dynamics
The math classroom provides a multifaceted setting encompassing various contexts, including the physical classroom environment and the social interactions within it. A burgeoning body of research underscores the integral role of student behavior and peer interactions in shaping motivation, engagement, and academic achievement [40,41,42,43,44,45,46,47,48]. Students who perceive their school environment as supportive and welcoming tend to invest their time in academic pursuits, resulting in reduced disciplinary concerns and increased instructional engagement.
Within this contextual framework of math classrooms, an examination of the ramifications of students’ unpreparedness in class emerges as a central avenue for understanding behavioral engagement, fostering math learning, and reinforcing effective teaching strategies. Behavioral engagement, characterized by students’ persistent effort, focused concentration, and interest in academic tasks, notably correlates with academic achievement [49]. Ford et al. [50] and Peterson-Lewis and Bratton [51] have attributed low academic performance among minority students to disengaged behaviors and reduced behavioral engagement. On the contrary, students’ completion of homework, serving as a tangible manifestation of behavioral engagement, has demonstrated a positive association with enhanced math performance across middle and high school levels [51,52,53,54].
2.5. Supportive Teacher Influence in Mathematics Classrooms
Teachers hold a pivotal role as influential role models within the school environment, greatly impacting students’ engagement in learning [42], academic achievements [9], and the development of their mathematics self-efficacy and performance [55,56]. The implementation of effective instructional practices by teachers has proven to be a potent tool for inspiring students and enhancing their confidence in mathematics. Research by Marchant et al. [57] further underscores that teachers’ responsiveness to students’ needs in a supportive setting fosters motivation and self-efficacy, subsequently influencing academic performance. In school mathematics, Martin [58] studied high-achieving Black students in grades seven through nine and validated previous findings that Black students face numerous challenges both within and outside of school that impede their progress. However, if they navigate these hurdles successfully, they are more likely to persevere and attain academic and mathematical success. Therefore, the presence of supportive teachers in nurturing math classrooms proves pivotal for the academic success of minority students, encompassing mathematics and beyond. Investigating disparate experiences in schooling is imperative for comprehending the academic outcome disparities between minority and white students. This article delves into social factors within math classrooms, including teacher support and students’ preparedness for class. Furthermore, building upon earlier research, we examine how these variables’ impacts on math efficacy and performance vary across racial, linguistic, social class, and gender groups.
3. Methodology
3.1. Data Sources
In this study, we conducted analyses using data sourced from the National Center for Education Statistics (NCES), specifically the High School Longitudinal Study (HSLS). The HSLS dataset tracked students from their 9th grade year in 2009 through 2011 employing a two-stage random sample selection process. For data collection, schools were initially selected using a probability proportional to size (PPS) method, followed by the random selection of students from each chosen school. The HSLS dataset included a total of 25,206 students from 944 public and private high schools encompassing both 9th and 11th grades [59]. This comprehensive database is well-suited for our study, as it provides valuable insights into students’ math performance, math self-efficacy, perceptions of teacher support by students, classroom environment details such as student unpreparedness for math class, as well as pertinent demographic information.
3.2. Variables
We extracted data related to four main racial groups from the HSLS database: Asian, Black, Hispanic, and White. Due to small sample sizes, we omitted the analysis of seven other racial groups originally present in the dataset due to small sample cases. Each racial group variable was created as a dummy variable (e.g., Asian = 1 or 0, Black = 1 or 0, etc.). The dataset included 1952 students identified as Asian (8.3%), 2450 as Black (10.4%), 3797 as Hispanic (16.2%), and 12,082 as White (51.4%).
Socio-economic status (SES) in the HSLS was represented using continuous composite variables standardized by the NCES. We also considered language status, categorizing students into two groups: English-dominant students (LOTE = 0) and those dominant in any language other than English (LOTE = 1). The dataset comprised 17,863 English-dominant students (76.0%) and 3556 students dominant in a language other than English (15.1%). Regarding student sex, we assigned a code of 0 to males (n = 11,973; 50.9%) and 1 to females (n = 11,524; 49.0%).
Students’ unprepared class was one mediator variable in this study connecting students’ demographic characteristics to teacher support and influencing the quality of teacher support, student math efficacy, and math performance. Constructed as a latent variable, students’ unprepared class was formed by three indicator items, developed through a measurement model of structural equation modeling (SEM) based on a study that explored students’ school readiness [60]. A higher score indicated a perception of being less prepared for the class. The confirmatory factor analysis (CFA) within the SEM framework yielded loadings for each indicator item (refer to Table 1). These indicator items featured a four-response option scale (1 = never, 2 = seldom, 3 = often, and 4 = usually). To ensure coherence across the three items, reliability analysis using both MacDonald’s omega and Cronbach’s alpha indicated satisfactory item consistency. Furthermore, for preliminary analyses exploring varied group differences concerning students’ unprepared class, a composite variable was constructed via exploratory factor analysis (EFA) with Bartlett scores. The cumulative variances of the factors were sufficient (60.50%), along with acceptable loadings (See Table 1 for comprehensive details regarding indicators, reliabilities, and EFA loadings).
Teacher support in math classrooms was the central focus in this study, designated as the second mediator in SEM analyses. Teacher support was also analyzed as a latent variable comprising five indicator items derived from a study that developed and validated teacher support measures. [61]. The five indicator items shared a common five-response option scale (1 = strongly disagree, 2 = disagree, 3 = agree, and 4 = strongly agree). Adequate item consistency was confirmed through MacDonald’s omega reliability and Cronbach’s alpha scores. Parallel to the approach with students’ unprepared class, a composite variable was developed via EFA and Bartlett scores for preliminary analyses comparing diverse groups (refer to Table 1 for detailed information on indicators, reliabilities, and EFA loadings). The SEM measurement model provided loadings for each indicator item, with results further elaborated in the results section and Table 1. The measurement model demonstrated good fit statistics according to the RMSEA, CFI, TLI, and SRMR measures (see details in Table 5).
In this study, math self-efficacy scores were identified as another mediator variable, postulated to exert a significant influence on math performance. HSLS datasets provided math self-efficacy scores, which were generated by the National Center for Education Statistics (NCES) using principal component factor analysis. These scores were standardized (mean of 0 and standard deviation of 1), denoting students’ overarching beliefs in their mathematical abilities. Indicator variables encompassed students’ confidence in performing excellently, comprehending math textbooks, mastering math skills, and excelling in math assignments. The coefficient of reliability (alpha) reported by NCES was 0.65.
Outcome variable of the study was students’ math performance, which was directly collected by NCES. Math scores were acquired through a two-stage assessment involving multiple-choice items based on Item Response Theory (IRT), estimating students’ math proficiency [59]. The mean math score was 40.19 (SD = 11.98, range = 15.85–69.93). Table 2 and Table 3 present means and standard deviations of math scores for subgroups.
3.3. Analytical Framework and Methods
The study’s analyses encompassed two components: preliminary analyses and main analyses. Preliminary analyses provided unidimensional outcomes without accounting for the influence of other variables, while main analyses incorporated the effects of various variables in the analytical model.
We employed various preliminary analyses such as Kruskal–Wallis (KW), ANOVA, Mann–Whitney (MW), and t-tests to examine group differences in single outcomes. KW replaced one-way ANOVA for mean comparisons involving more than two groups with violated homogeneity variance assumptions. MW was employed for two-group comparisons with a violation of homogeneity variance assumptions, while independent samples t-tests were used for two-group comparisons without the violation.
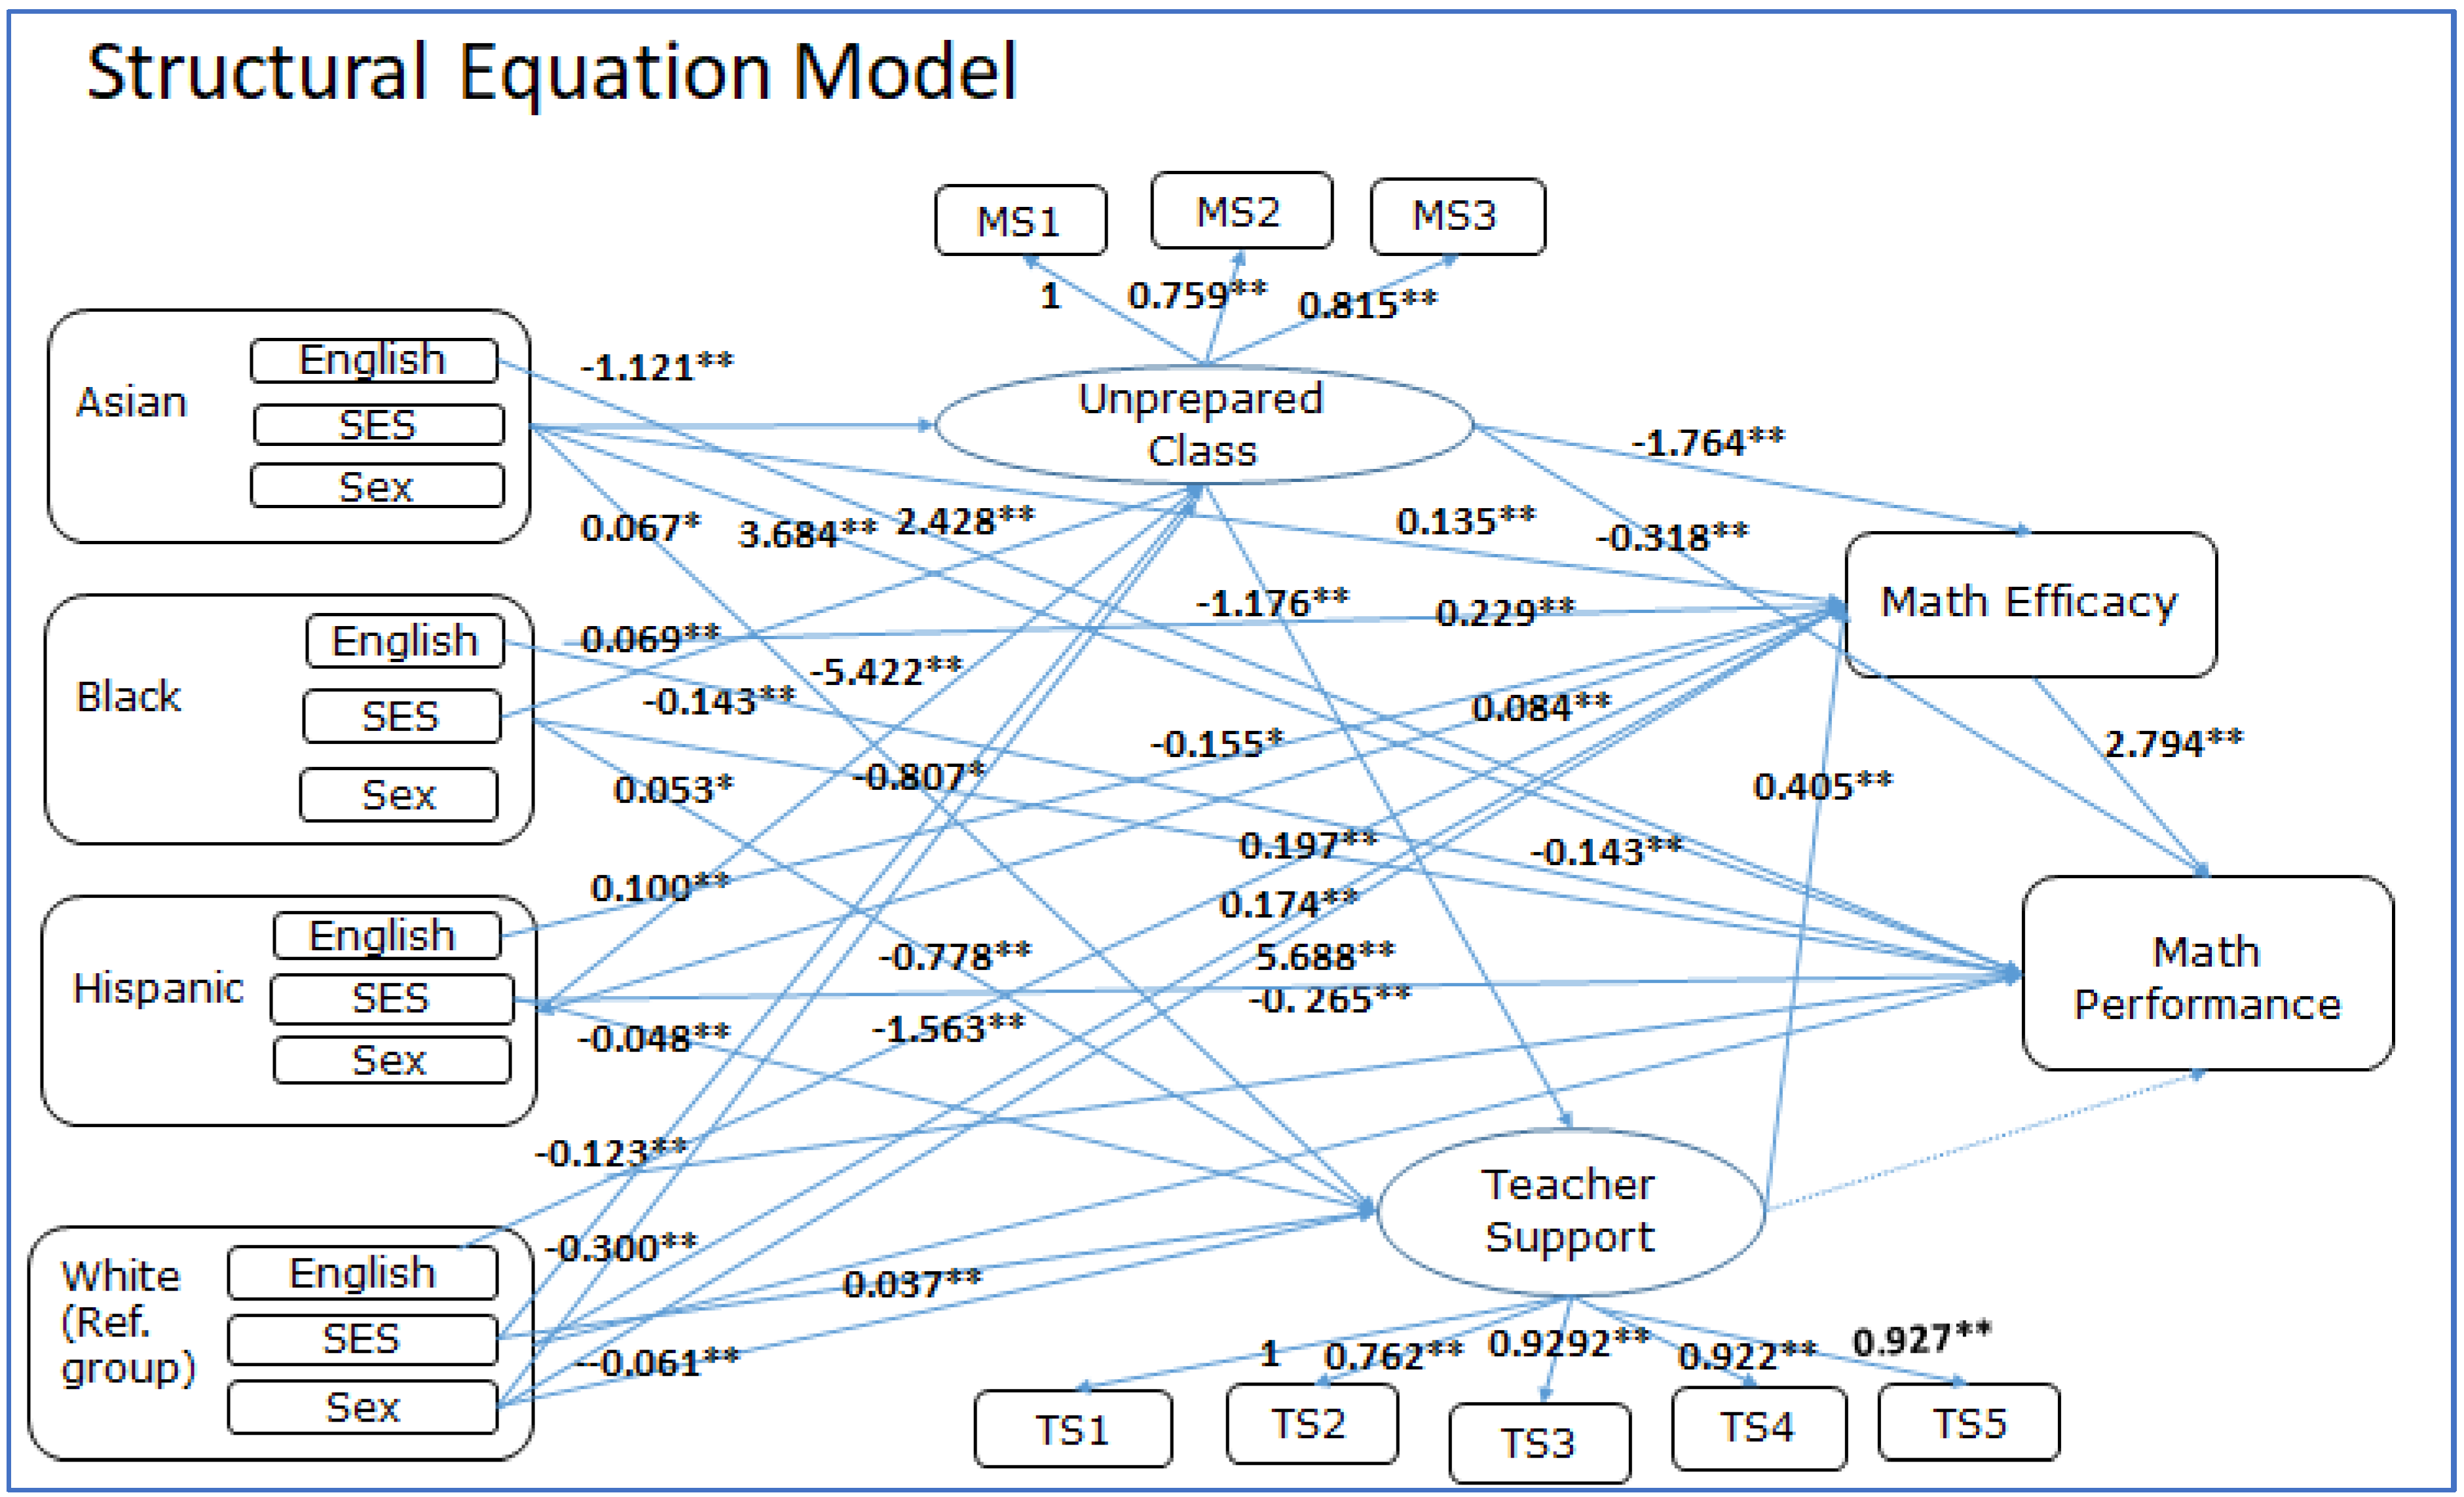
The main analytical tool was structural equation modeling (SEM), and it examined how student class preparation level, teacher support, math self-efficacy function as mediators for different racial, linguistic, SES, and sex groups, impacting math performance. In our analytical model, class preparation levels were specified as student unpreparedness, attempting to keep the negative meaning of indicator items in the data. The full model includes interaction variables between race, linguistic status, and SES variables, as well as their sole contributions as independent variables. The reference group of the model was the middle-class White male English-dominant students (see Figure 1 for the study model).
4. Results
4.1. Preliminary Analysis Results
In this section, we present the outcomes of our preliminary analyses, which encompass a series of statistical tests to explore the baseline differences among racial and language groups for all variables including SES, unprepared class, teacher support, math efficacy, and math performance. Table 2 provides results from descriptive statistics, one-way ANOVA, and Kruskal–Wallis (KW) tests conducted for comparisons among racial groups. Similarly, Table 3 compares the outcomes of two-group comparisons from descriptive statistics, independent samples t-tests, and Mann–Whitney tests, focusing on linguistic and sex groups, for the same set of variables.
Our preliminary analyses comparing SES among racial and linguistic groups revealed significant disparities. Consistent with previous research [1]. Hispanic and Black students exhibited noticeably lower SES compared to White and Asian students. When linguistic status was analyzed in relation to SES, we identified that students dominant in a language other than English (LOTE) had lower SES than their English-dominant counterparts.
When the examination of student unpreparedness for class scores was performed, Asian students displayed the lowest scores, indicating their heightened preparation for math classes. White and Black students followed, while Hispanic students displayed the highest scores. In language and sex group comparisons for student unpreparedness for class, the results indicated no significant difference between the two language groups, while females exhibited lower unpreparedness scores compared to males.
When the composite variable of teacher support was evaluated, Asian students were found to have higher scores than other racial groups, indicating that they perceived greater teacher support. In the language group comparison, LOTE dominants perceived higher levels of teacher support than their English-dominant counterparts. No discernible difference was observed between the two sex groups in terms of teacher support.
In the examination of math self-efficacy, Asian students showed the highest scores, followed by Black students, and finally, White and Hispanic students. Language group comparisons showed LOTE dominants had significantly higher math self-efficacy than English-dominant students. In the comparison of the two sex groups, males exhibited greater math self-efficacy than females.
In the last preliminary analysis, we explored the differences in math performance among racial groups. The findings demonstrated that Asian students exhibited the highest math performance, followed by White, Hispanic, and Black students. In comparing math performance across language groups and sex groups, no significant differences were noted.
4.2. Structural Equation Modeling (SEM) Results
The outcomes of our SEM analysis were derived through a two-step modeling process. Initially, a measurement model was employed to ensure the consistency of indicator items within two latent variables: students’ unpreparedness for class and teacher support. Descriptive statistics for the variables are presented in Table 4, while fit statistics can be found in Table 5. The indicators and their corresponding loadings can be found in Table 6. The SEM models displayed acceptable fit statistics, where the Root Mean Square Error of Approximation (RMSEA) was 0.030 (see Table 5 for additional fit statistics). Although the chi-square statistic was significant (χ2 = 65,812.962, p < 0.01), it was not seriously interpreted considering its sensitivity for a large sample.
Indicators of students’ unpreparedness for class exhibited sufficient loadings, with the item “How often the student goes to class without pencil/paper” holding the highest loading, serving as the anchor item in each measurement model. Similarly, teacher support, as another latent variable, exhibited robust loadings across all indicator items. The highest loading was attributed to the item “Math teacher thinks all students can be successful”, which was employed as the anchor item.
Transitioning to the subsequent step, a structural model was adopted, encompassing all variables. In this model, students’ unpreparedness for class acted as the first mediator, followed by teacher support as the second mediator, and math efficacy as the third mediator. The examination of male students’ unpreparedness for class scores among four racial groups yielded significant distinctions. Notably, Hispanic males displayed lower preparedness for class (β = 0.100, p < 0.001) while Asian males exhibited higher preparedness for class (β = −0.121, p < 0.001) when compared to White males.
Further investigation into the relationship between racial groups, SES, and unpreparedness for class revealed that among White students, SES was associated with their level of preparedness for class. Specifically, White students from higher SES backgrounds displayed lower unpreparedness scores (β = −0.123, p < 0.001), indicative of better preparation. Moreover, interactions between minority groups and SES were observed. Compared to White middle-class students, higher SES Black students demonstrated higher scores of unpreparedness for class (β = 0.069, p < 0.001). Contrarily, White females exhibited better preparedness for class (β = −0.300, p < 0.001) in comparison to White males.
The mediating role of teacher support scores was also explored in the SEM model. Comparisons indicated that Asian and Black males exhibited higher teacher support scores (β = 0.067, p < 0.05; β = 0.053, p < 0.05, respectively) relative to White males. Among White students, higher SES correlated with higher teacher support scores (β = 0.037, p < 0.001), while Hispanic students from higher SES backgrounds displayed lower teacher support scores (β = −0.048, p < 0.05). Distinctly, lower teacher support scores were observed among White female students (β = −0.061, p < 0.001) when compared to their male counterparts. Importantly, a negative association was identified between students’ unpreparedness for class scores and teacher support scores (β = −0.176, p < 0.001), implying that students who exhibited higher unpreparedness scores reported lower teacher support.
Regarding math self-efficacy scores, the three minority male groups displayed significantly higher scores than White males (Asian’s β =0.135, p < 0.01; Black’s β = 0.229, p < 0.001; Hispanic’s β = 0.084, p < 0.01). SES among White students positively correlated with math self-efficacy (β = 0.174, p < 0.001), indicating that higher SES White students tended to possess higher math self-efficacy. However, within the Black group, higher SES students demonstrated lower math self-efficacy (β = −0.143, p < 0.001) compared to White students from middle-class backgrounds. Notably, White LOTE dominants exhibited greater math self-efficacy than their English-dominant counterparts (β = 0.197, p < 0.001). However, Hispanic LOTE dominants displayed lower math self-efficacy scores (β = −0.155, p < 0.05) than White English dominant students. Comparatively, White female students exhibited lower math self-efficacy scores (β = −0.265, p < 0.001) than White male students. Students’ unprepared class was negatively associated with math self-efficacy (β = −0.318, p < 0.001), and teacher support was positively associated with math efficacy (β = 0.405, p < 0.001).
The associations between all independent and mediator variables extended to math performance as well. Asian males demonstrated significantly higher math performance (β = 3.684, p < 0.001), while Black and Hispanic males exhibited notably lower math performance (β = −5.422, p < 0.001; β = −1.563, p < 0.001, respectively) compared to White males. Among White students, higher SES was linked to higher math performance (β = 5.688, p < 0.001). Conversely, higher SES Black and Hispanic students displayed lower math performance (β = −0.807, p < 0.001; β = −0.778, p < 0.001, respectively) in comparison to White students with middle SES. Remarkably, Asian LOTE students achieved significantly higher math performance than White English-dominant students (β = 2.428, p < 0.001). Importantly, a negative relationship was observed between students’ unpreparedness for class and math performance (β = −1.764, p < 0.001), while a positive association emerged between math self-efficacy and math performance (β = 2.794, p < 0.001).
5. Discussion and Conclusions
Teacher support plays a crucial role in enhancing students’ mathematical performance as previous research has consistently shown. Given that students’ math performance in the United States has historically lagged that of other nations, it is imperative to investigate the teacher’s role in math education. Furthermore, it is essential to examine the impact of teacher support on academically at-risk students.
Understanding the persistent achievement gap in US mathematics between minority students and their White peers remains a challenge for educators. As education researchers strive to develop theories and strategies to narrow this gap, it is crucial to delve into the broader social context of mathematics education. Building on prior research that identified effective methods for increasing the engagement of minority students in mathematics [62], we have chosen student class preparation and teacher support as the major factors influencing their math self-efficacy and math performance. Consequently, we explored the relationships between students’ class preparation, teacher support, math self-efficacy, and math performance, while considering potential variations across different racial, linguistic, and gender groups. The primary objective of this study is to enhance the research field and inform educational practice by elucidating distinct teacher support effects on diverse student groups. The main contribution of this study lies in its ability to uncover various dynamics within the variables.
The US national database, the High School Longitudinal Study (HSLS), was particularly well-suited for this study. The dataset’s primary objective was to track the progress of mathematics achievement among high school students and included variables related to teachers and math classrooms. This study focused on these critical variables, thus providing valuable insights into the influence of teachers and classroom environments on students’ math outcomes.
5.1. Unidimensional Group Comparisons Using Preliminary Analysis
To address the first research question, which aims to comprehend the diverse dynamics among student groups, we conducted analyses to compare differences in socioeconomic status (SES), student class preparation, teacher support, math self-efficacy, and math performance among various racial, linguistic, and gender groups. Our findings confirmed that Hispanic and Black students had significantly lower SES compared to White and Asian students. Additionally, linguistic minority students (LOTE dominants) exhibited significantly lower SES than their English dominant counterparts, as reported by prior research [1,2,3,5]. These SES disparities indicate that racial and linguistic minority students often face challenges related to family financial circumstances, which may stem from their parents’ educational backgrounds, occupations, and limited educational resources at home, as noted by multiple researchers [5,30,31,32].
As one of the factors related to the math class environment, we conducted an analysis of students’ unprepared class scores, which yielded varying results in our preliminary analyses. Notably, Hispanic students demonstrated higher frequencies of unpreparedness in their classes. While male students displayed higher frequencies of class unpreparedness than female students, we did not observe significant differences between linguistic groups.
Teacher support also exhibited inconsistent results in our preliminary analyses, although the level of inconsistency was less pronounced compared to students’ unprepared class scores. Asian students reported the highest levels of teacher support, while Hispanic and Black students displayed similar scores to White students. Consistent with our preliminary analysis result, linguistic minority students reported higher teacher support scores than their English dominant peers. These results did not align with the argument of Ruck and Wortley [63], which emphasized minority students’ negative perceptions of teacher treatment and school environments.
In the examination of math self-efficacy, Asian students demonstrated the highest scores, followed by Black students, while White and Hispanic students scored lower. These findings provide insights into a research area that has previously yielded inconsistent results. In other words, Black students maintained their belief in their ability to excel academically despite facing inequities in their home and educational environments.
Contrary to prior findings suggesting that English Language Learners (ELL) tended to have lower self-efficacy in math [25], we observed higher math self-efficacy among LOTE dominants compared to their English dominant counterparts. Despite facing challenges in math classrooms, such as unclear mathematical texts, unfamiliar symbols, and unfamiliar learning structures, LOTE dominant students maintained their belief in their academic capabilities.
The analysis of math performance indicated that Asian and White students outperformed Hispanic and Black students, consistent with prior studies highlighting persistent performance gaps between mainstream and minority groups [31]. Additionally, our study noted lower math performance among LOTE dominants, partially corroborating previous findings regarding the lower math performance of students learning English when assessments were conducted in English [26].
In summary, minority students, including Black, Hispanic, and LOTE students, tend to come from less affluent family backgrounds. Hispanic male students, in particular, showed a tendency to be less prepared for class. Asian and LOTE students reported a high perception of teacher support, while Black and LOTE students exhibited higher levels of self-efficacy. It was noted that Black, Hispanic, and LOTE students demonstrated relatively lower math performance.
5.2. Relational Outcomes with a SEM Model
Using structural models as the main analysis, the three research questions of this study were answered by examining the relational outcomes while considering the effects of other variables within the analytical context. For the research question concerning student’ class preparation, we found that students’ lack of class preparation was negatively associated with teacher support, math efficacy, and math performance. These results support previous findings indicating that unprepared students tend to have unfavorable perceptions toward teachers and learning [44,46].
Moving forward, we explored specific subgroups for class unpreparedness. Asian males exhibited higher preparedness for class while Hispanic males displayed lower preparedness for class when compared to White males. Among White students, a significantly negative relationship between class unpreparedness and socioeconomic status (SES) was observed. This suggests that White male students from higher social classes were better prepared for class compared to their middle-class counterparts. However, Black students from higher SES families displayed higher levels of unprepared class scores.
Overall, teacher support demonstrated a significant positive impact on math efficacy as we noted in previous studies [46,55,57]. This indicates that when students perceive their teachers as supportive and conducive to their academic success, their math self-efficacy significantly increases. Further analysis of teacher support revealed that Asian male students perceived a higher level of teacher support compared to their White male counterparts. Additionally, Black male students reported higher scores than White male students. These results were distinct from prior findings that emphasized negative perceptions of teachers and schools among Black students [63].
As anticipated, high socioeconomic status (SES) had a positive impact on teacher support scores, with White students from high SES backgrounds exhibiting high teacher support scores. Furthermore, our predictions held true as we found a positive association between teacher support and math efficacy. In contrast, the SES effects for Hispanic students were negative, suggesting that students from higher SES families displayed lower teacher support scores compared to White students with middle SES. These findings shed light on the intricate dynamics of how SES is related to teacher support among minority students when they perceive teachers as facilitators of their math learning.
Using structural equation modeling, we also established that students’ math efficacy significantly predicted their math performance and their class unpreparedness was negatively associated with their math performance. However, the study’s most unexpected discovery was the lack of a significant relationship between students’ perceived teacher support and their math performance. This finding stands in contrast to prior research findings [9,57]. Our interpretation of this result is that it may be attributed to the students’ subjective perception of teacher support rather than objective observations. While it is well-established that teachers’ responsive support for students’ learning directly impacts their performance, it appears that students may not always perceive their teachers’ behaviors as supportive. This finding underscores the importance of considering objective measures alongside subjective perceptions in future studies aimed at predicting students’ academic success.
Another noteworthy finding is the association of math self-efficacy and math performance. In the previous interpretation of math self-efficacy, we observed higher math self-efficacy scores among minority males, aligning with our preliminary findings and a prior study. However, their elevated math efficacy did not necessarily translate into higher math performance, in line with the findings of Cheema and Skultety [21] who reported that Black and Hispanic students often overestimated their math abilities.
With analysis with subgroups, the outcomes of math performance reaffirmed previous research findings of performance gaps, with Black and Hispanic students performing below White and Asian students [4]. Even among students from high SES families, we observed lower math performance among Black and Hispanic students compared to their White middle-class peers [30]. Notably, linguistic minority students in the Asian group displayed higher math performance than White English-dominant students. In other words, Asian linguistic minority students were able to surpass the performance levels of White English-dominant students, challenging previous findings of low math performance [26,27]. As Kim et al. [27] noted ELL students’ elevated self-efficacy boosted academic performance, we also predict the heightened math performance with enhanced self-efficacy of LOTE dominants.
To summarize the main outcomes of this study, students’ lack of class preparation was negatively associated with teacher support, math efficacy, and math performance. Students’ SES was an intricate outcome: while White students with high SES demonstrated good preparation for class, Black students with high SES displayed less preparation. Teacher support demonstrated a significant positive impact on math efficacy; however, it was not positively associated with performance. Black students perceived higher teacher support than White students. Hispanic students from high SES had a negative perception of teacher support. High math self-efficacy of minority students was not associated with their high performance.
5.3. Contribution, Limitation, and Conclusions
This study not only corroborates prior research but also provides valuable evidence supporting the effects of math efficacy and explores contextual influences on high school students’ math performance. These findings hold both theoretical and practical significance. Firstly, by simultaneously considering various factors that influence students’ mathematics performance, including family financial background, student readiness, teacher support perception, and academic efficacy, our statistical model enhances our understanding of group-specific differences in math performance. Previous studies on the math performance gap often examined the contributions of single observed variables. In contrast, our study examines multiple variables within the same model. Secondly, our use of structural modeling allows us to capture both direct and indirect effects of variables on students’ performance outcomes. Lastly, our use of a nationally representative U.S. dataset enhances the generalizability of our empirical research findings.
Despite the significant contributions of our analysis, some limitations should be noted. Firstly, our research did not consider the effects of physical classroom settings or teachers’ instructional practices in math class due to the scope of this study. Consequently, the results related to these physical contexts and instructional activities may not be fully comprehensive. Considering the intricate interplay between teachers and students, these results may have some biases. Secondly, while this study contributes to the understanding of the achievement gap, it also highlights several limitations that call for further research. We were unable to include important variables in our study, and future research should explore a broader range of factors related to family, community, school, and peers. Simultaneously addressing other contextual factors such as peer and community variables could offer a more comprehensive explanation of the math performance gap. Additionally, further research is needed to better comprehend the differential effects of certain individual and school-level factors among different racial groups. Lastly, this study employs a cross-sectional design, limiting our ability to draw strong causal inferences from the results. Future research employing longitudinal models will be essential for establishing the causal effects of these factors on the math performance gap. A deeper understanding of the longitudinal relationships between social and academic factors is crucial for designing instructional practices that motivate and enhance achievement among all students.
In conclusion, this study’s major contribution lies in providing detailed insights into the diverse dynamics at play among various minority groups in math learning. We found that students’ class preparation, perception of teacher support, math efficacy, and math performance operate differently for racial and linguistic minority students in conjunction with their social class backgrounds.
Author Contributions
Conceptualization, M.C.; methodology, M.C. and S.K.; software, S.K.; validation, S.K.; formal analysis, M.C. and S.K.; investigation, H.B.; resources, H.B. and R.W.P.; data curation, M.C.; writing—original draft preparation, M.C.; writing—review and editing, R.W.P.; visualization, M.C.; supervision, M.C.; project administration, M.C. All authors have read and agreed to the published version of the manuscript.
Funding
This research received no external funding.
Institutional Review Board Statement
Not applicable.
Informed Consent Statement
Not applicable.
Data Availability Statement
This paper used a US national database that is publicly available at https://nces.ed.gov/surveys/hsls09/hsls09_data.asp (accessed on 1 October 2023).
Conflicts of Interest
The authors declare no conflict of interest.
References
- de Brey, C.; Musu, L.; McFarland, J.; Wilkinson-Flicker, S.; Diliberti, M.; Zhang, A.; Branstetter, C.; Wang, X. Status and Trends in the Education of Racial and Ethnic Groups 2018; National Center for Educational Statistics: Washington, DC, USA, 2019. [CrossRef]
- Maldonado, S.I.; Mosqueda, E.; Capraro, R.M.; Capraro, M.M. Language Minority Students’ Mathematics Achievement in Urban Schools: Coursework, Race-Ethnicity, and English-Language Proficiency. Penn GSE Perspect. Urban Educ. 2018, 15, n1. [Google Scholar]
- Boda, P.A.; James, K.; Sotelo, J.; McGee, S.; Uttal, D. Racial and gender disparities in elementary mathematics. Sch. Sci. Math. 2022, 122, 36–53. [Google Scholar] [CrossRef]
- Chang, M.; Choi, N.; Kim, S. School involvement of parents of linguistic and racial minorities and their children’s mathematics performance. Educ. Res. Eval. 2015, 21, 209–231. [Google Scholar] [CrossRef]
- Orr, A.J. Black-White differences in achievement: The importance of wealth. Sociol. Educ. 2003, 76, 281–304. [Google Scholar] [CrossRef]
- Renth, B.A.; Buckley, P.; Puchner, L. Academic Performance Gaps and Family Income in a Rural Elementary School: Perceptions of Low-Income Parents. Educ. Leadersh. Rev. Dr. Res. 2015, 2, 70–84. [Google Scholar]
- Scammacca, N.; Fall, A.M.; Capin, P.; Roberts, G.; Swanson, E. Examining factors affecting reading and math growth and achievement gaps in grades 1–5: A cohort-sequential longitudinal approach. J. Educ. Psychol. 2020, 112, 718–734. [Google Scholar] [CrossRef] [PubMed]
- Milner, H.R. Beyond a test score: Explaining opportunity gaps in educational practice. J. Black Stud. 2012, 43, 693–718. [Google Scholar] [CrossRef]
- Roorda, D.L.; Koomen, H.M.; Spilt, J.L.; Oort, F.J. The influence of affective teacher–student relationships on students’ school engagement and achievement: A meta-analytic approach. Rev. Educ. Res. 2011, 81, 493–529. [Google Scholar] [CrossRef]
- Wilkinson, L.C. Teaching the language of mathematics: What the research tells us teachers need to know and do. J. Math. Behav. 2018, 51, 167–174. [Google Scholar] [CrossRef]
- Moschkovich, J. Talking to learn mathematics with understanding: Supporting academic literacy in mathematics for English learners. In Language, Literacy, and Learning in the STEM Disciplines; Routledge: London, UK, 2018; pp. 13–34. [Google Scholar]
- Strayhorn, T. The Role of Schools, Families, and Psychological Variables on Math Achievement of Black High School Students. High Sch. J. 2010, 93, 177–194. [Google Scholar] [CrossRef]
- Miles, M.L.; Buenrostro, P.M.; Marshall, S.A.; Adams, M.; McGee, E.O. Cultivating racial solidarity among Mathematics education scholars of color to resist white supremacy. Int. J. Crit. Pedagog. 2019, 10, 97–125. [Google Scholar]
- Okpechi, P.; Thapa, A.; Cohen, J.; Guffey, S.; Higgins-D’Alessandro, A.; Oselumese, I.B.; Omoike, D.; Andrew, O.; Chukwuemeka, O.; Rubie-davies, C.M.; et al. The role of supportive school environments in promoting academic success. In The Routledge International Handbook of Social Psychology of the Classroom; Taylor & Francis: London, UK, 2005. [Google Scholar] [CrossRef]
- Spencer, S.J.; Logel, C.; Davies, P.G. Stereotype threat. Annu. Rev. Psychol. 2016, 67, 415–437. [Google Scholar] [CrossRef]
- Lee, J.E.R.; Nass, C. Distinctiveness-based stereotype threat and the moderating role of coaction contexts. J. Exp. Soc. Psychol. 2012, 48, 192–199. [Google Scholar] [CrossRef]
- Amer-Mestre, J.; Ayarza-Astigarraga, A.; Lopes, M.C. E-learning engagement gap during school closures: Differences by academic performance. Appl. Econ. 2023, 1–23. [Google Scholar] [CrossRef]
- Ambady, N.; Shih, M.; Kim, A.; Pittinsky, T.L. Stereotype susceptibility in children: Effects of identity activation on quantitative performance. Psychol. Sci. 2001, 12, 385–390. [Google Scholar] [CrossRef] [PubMed]
- Stevens, T.; Olivarez, A.; Lan, W.Y.; Tallent-Runnels, M.K. Role of mathematics self-efficacy and motivation in mathematics performance across ethnicity. J. Educ. Res. 2004, 97, 208–222. [Google Scholar] [CrossRef]
- Wilkinson, L.C. Learning language and mathematics: A perspective from Linguistics and Education. Linguist. Educ. 2019, 49, 86–95. [Google Scholar] [CrossRef]
- Cheema, J.R.; Skultety, L.S. Self-efficacy and literacy: A paired difference approach to estimation of over-/under-confidence in mathematics-and science-related tasks. Educ. Psychol. 2017, 37, 652–665. [Google Scholar] [CrossRef]
- Cook, H.G.; Boals, T.; Lundberg, T. Academic achievement for English learners: What can we reasonably expect? Phi Delta Kappan 2011, 93, 66–69. [Google Scholar] [CrossRef]
- Avalos, M.A.; Medina, E.; Secada, W.G. Reading mathematics problems: Exploring how language counts for middle school students with varying mathematics proficiency. In Language, Literacy, and Learning in the STEM Disciplines; Routledge: London, UK, 2018; pp. 55–78. [Google Scholar]
- Abedi, J.; Herman, J. Assessing English language learners’ opportunity to learn mathematics: Issues and limitations. Teach. Coll. Rec. 2010, 112, 723–746. [Google Scholar] [CrossRef]
- Soland, J.; Sandilos, L.E. English language learners, self-efficacy, and the achievement gap: Understanding the relationship between academic and social-emotional growth. J. Educ. Stud. Placed Risk 2021, 26, 20–44. [Google Scholar] [CrossRef]
- Sandilos, L.E.; Baroody, A.E.; Rimm-Kaufman, S.E.; Merritt, E.G. English learners’ achievement in mathematics and science: Examining the role of self-efficacy. J. Sch. Psychol. 2020, 79, 1–15. [Google Scholar] [CrossRef]
- Kim, D.H.; Wang, C.; Ahn, H.S.; Bong, M. English language learners’ self-efficacy profiles and relationship with self-regulated learning strategies. Learn. Individ. Differ. 2015, 38, 136–142. [Google Scholar] [CrossRef]
- Contreras, D.; Elacqua, G.; Martinez, M.; Miranda, Á. Income inequality or performance gap? A multilevel study of school violence in 52 countries. J. Adolesc. Health 2015, 57, 545–552. [Google Scholar] [CrossRef]
- Sirin, S.R. Socioeconomic status and academic achievement: A meta-analytic review of research. Rev. Educ. Res. 2005, 75, 417–453. [Google Scholar] [CrossRef]
- Aikens, N.L.; Barbarin, O. Socioeconomic differences in reading trajectories: The contribution of family, neighborhood, and school contexts. J. Educ. Psychol. 2008, 100, 235–251. [Google Scholar] [CrossRef]
- McKown, C. Social equity theory and racial-ethnic achievement gaps. Child Dev. 2013, 84, 1120–1136. [Google Scholar] [CrossRef]
- Dewsbury, B.M.; Swanson, H.J.; Moseman-Valtierra, S.; Caulkins, J. Inclusive and active pedagogies reduce academic outcome gaps and improve long-term performance. PLoS ONE 2022, 17, e0268620. [Google Scholar] [CrossRef] [PubMed]
- Chang, M.; Park, B.; Singh, K.; Sung, Y.Y. Parental involvement, parenting behaviors, and children’s cognitive development in low-income and minority families. J. Res. Child. Educ. 2009, 23, 309–324. [Google Scholar] [CrossRef]
- Corcoran, S.P.; Evans, W.N. The role of inequality in teacher quality. In Steady Gains and Stalled Progress: Inequality and the Black-White Test Score Gap; Russell Sage Foundation: New York, NY, USA, 2008; pp. 212–249. [Google Scholar]
- Vigdor, J.L.; Ludwig, J. Segregation and the test score gap. In Steady Gains and Stalled Progress: Inequality and the Black-White Test Score Gap; Russell Sage Foundation: New York, NY, USA, 2008. [Google Scholar]
- Magnuson, K.; Rosenbaum, D.T.; Waldfogel, J. Inequality and Black-White achievement trends in the NAEP. In Steady Gains and Stalled Progress: Inequality and the Black-White Test Score Gap; Russell Sage Foundation: New York, NY, USA, 2008; pp. 33–65. [Google Scholar]
- Ancis, J.R.; Sedlacek, W.E.; Mohr, J.J. Student perceptions of campus cultural climate by race. J. Couns. Dev. 2000, 78, 180–185. [Google Scholar] [CrossRef]
- Herman, M.R. The black-white-other achievement gap: Testing theories of academic performance among multiracial and monoracial adolescents. Sociol. Educ. 2009, 82, 20–46. [Google Scholar] [CrossRef]
- Grissmer, D.; Eiseman, E. Can gaps in the quality of early environments and noncognitive skills help explain persisting black-white achievement gaps? In Steady Gains and Stalled Progress: Inequality and the Black-White Test Score Gap; Russell Sage Foundation: New York, NY, USA, 2008. [Google Scholar]
- Floyd, C.B. Closing the gap: International student pathways, academic performance and academic acculturation. J. Acad. Lang. Learn. 2015, 9, A1–A18. [Google Scholar]
- Kellow, J.T.; Jones, B.D. The effects of stereotypes on the achievement gap: Reexamining the academic performance of African American high school students. J. Black Psychol. 2008, 34, 94–120. [Google Scholar] [CrossRef]
- MacNeil, A.J.; Prater, D.L.; Busch, S. The effects of school culture and climate on student achievement. Int. J. Leadersh. Educ. 2009, 12, 73–84. [Google Scholar] [CrossRef]
- Milam, A.J.; Furr-Holden, C.D.M.; Leaf, P.J. Perceived school and neighborhood safety, neighborhood violence and academic achievement in urban school children. Urban Rev. 2010, 42, 458–467. [Google Scholar] [CrossRef]
- Nelson, R.M.; DeBacker, T.K. Achievement motivation in adolescents: The role of peer climate and best friends. J. Exp. Educ. 2008, 76, 170–189. [Google Scholar] [CrossRef]
- Oates, G.L.S.C. An empirical test of five prominent explanations for the black–white academic performance gap. Soc. Psychol. Educ. 2009, 12, 415–441. [Google Scholar] [CrossRef]
- Patrick, H.; Ryan, A.M.; Kaplan, A. Early adolescents’ perceptions of the classroom social environment, motivational beliefs, and engagement. J. Educ. Psychol. 2007, 99, 83. [Google Scholar] [CrossRef]
- Yue, H.; Rico, R.S.; Vang, M.K.; Giuffrida, T.A. Supplemental instruction: Helping disadvantaged students reduce performance gap. J. Dev. Educ. 2018, 41, 18–25. [Google Scholar]
- Ryan, A.M.; Patrick, H. The classroom social environment and changes in adolescents’ motivation and engagement during middle school. Am. Educ. Res. J. 2001, 38, 437–460. [Google Scholar] [CrossRef]
- Fredricks, J.A.; Blumenfeld, P.C.; Paris, A.H. School engagement: Potential of the concept, state of the evidence. Rev. Educ. Res. 2004, 74, 59–109. [Google Scholar] [CrossRef]
- Ford, D.Y.; Grantham, T.C.; Whiting, G.W. Another look at the achievement gap: Learning from the experiences of gifted Black students. Urban Educ. 2008, 43, 216–239. [Google Scholar] [CrossRef]
- Peterson-Lewis, S.; Bratton, L.M. Perceptions of “acting Black” among African American teens: Implications of racial dramaturgy for academic and social achievement. Urban Rev. 2004, 36, 81–100. [Google Scholar] [CrossRef]
- Aksoy, T.; Link, C.R. A panel analysis of student mathematics achievement in the US in the 1990s: Does increasing the amount of time in learning activities affect math achievement? Econ. Educ. Rev. 2000, 19, 261–277. [Google Scholar] [CrossRef]
- Eren, O.; Henderson, D.J. The impact of homework on student achievement. Econom. J. 2008, 11, 326–348. [Google Scholar] [CrossRef]
- Kalenkoski, C.M.; Pabilonia, S.W. Does high school homework increase academic achievement? Educ. Econ. 2017, 25, 45–59. [Google Scholar] [CrossRef]
- Johnson, C.W. The Link between Teacher Practices and High School Students’ Mathematics Self-Efficacy: A Multilevel Analysis; Cleveland State University: Cleveland, OH, USA, 2008; Available online: http://rave.ohiolink.edu/etdc/view?acc_num=csu1229719270 (accessed on 7 July 2021).
- Karabenick, S.A.; Sharma, R. Perceived teacher support of student questioning in the college classroom: Its relation to student characteristics and role in the classroom questioning process. J. Educ. Psychol. 1994, 86, 90. [Google Scholar] [CrossRef]
- Marchant, G.J.; Paulson, S.E.; Rothlisberg, B.A. Relations of middle school students’ perceptions of family and school contexts with academic achievement. Psychol. Sch. 2001, 38, 505–519. [Google Scholar] [CrossRef]
- Martin, D.B. Mathematics Success and Failure among African-American Youth: The Roles of Sociohistorical Context, Community Forces, School Influence, and Individual Agency; Routledge: London, UK, 2000. [Google Scholar]
- Ingels, S.J.; Pratt, D.J.; Herget, D.R.; Burns, L.J.; Dever, J.A.; Ottem, R.; Rogers, J.E.; Jin, Y.; Leinwand, S. High School Longitudinal Study of 2009 (HSLS: 09): Base-Year Data File Documentation. NCES 2011-328; National Center for Education Statistics: Washington, DC, USA, 2011.
- Skilton, C.J. Involving experts by experience in assessing students’ readiness to practise: The value of experiential learning in student reflection and preparation for practice. Soc. Work Educ. 2011, 30, 299–311. [Google Scholar] [CrossRef]
- Mantzicopoulos, P.; Neuharth-Pritchett, S. Development and validation of a measure to assess head start children’s appraisals of teacher support. J. Sch. Psychol. 2003, 41, 431–451. [Google Scholar] [CrossRef]
- Dotterer, A.M.; Lowe, K. Classroom context, school engagement, and academic achievement in early adolescence. J. Youth Adolesc. 2011, 40, 1649–1660. [Google Scholar] [CrossRef] [PubMed]
- Ruck, M.D.; Wortley, S. Racial and ethnic minority high school students’ perceptions of school disciplinary practices: A look at some Canadian findings. J. Youth Adolesc. 2002, 31, 185–195. [Google Scholar] [CrossRef]
Figure 1.
Significant path coefficients from structural equation model. Note: * indicates significant at 0.05 and ** indicates significant at 0.01.
Figure 1.
Significant path coefficients from structural equation model. Note: * indicates significant at 0.05 and ** indicates significant at 0.01.


Table 1.
Reliability statistics, items, and loadings of exploratory factor analysis for student class preparation and teacher support.
Table 1.
Reliability statistics, items, and loadings of exploratory factor analysis for student class preparation and teacher support.
| Student Unprepared Class | |
| Reliability | |
| McDonald’s w | 0.676 |
| Cronbach Alpha | 0.670 |
| Items | Loading |
| How often 9th grader goes to class without pencil or paper | 0.808 |
| How often 9th grader goes to class without books | 0.739 |
| How often 9th grader goes to class without their homework done | 0.739 |
| Teacher Support | |
| Reliability | |
| McDonald’s w | 0.883 |
| Cronbach Alpha | 0.881 |
| Items | Loading |
| Math teacher thinks all student can be successful. | 0.881 |
| Math teacher values/listens to students’ ideas. | 0.865 |
| Math teacher treats students with respect. | 0.892 |
| Math teacher makes math interesting. | 0.728 |
| Math teacher treats every student fairly. | 0.880 |
Table 2.
Descriptive statistics, one-way ANOVA, and Kruskal–Wallis (KW) tests for racial group comparisons with SES, student unprepared class, teacher support, math efficacy, and math performance.
Table 2.
Descriptive statistics, one-way ANOVA, and Kruskal–Wallis (KW) tests for racial group comparisons with SES, student unprepared class, teacher support, math efficacy, and math performance.
| Variable | Mean (SD) | Mean (SD) | Mean (SD) | Mean (SD) | Levene’s F | Statistics |
|---|---|---|---|---|---|---|
| Asian | Black | Hispanic | White | |||
| SES | 0.372 (0.89) | −0.166 (0.73) | −0.389 (0.73) | 0.188 (0.74) | F = 52.365 ** | KW = 1971.750 ** |
| Unprepared-Class | −0.247 (0.97) | 0.051 (1.01) | 0.168 (1.06) | −0.044 (0.97) | F = 9.922 ** | KW = 211.978 ** |
| Teacher Support | 0.131 (0.91) | 0.040 (1.04) | 0.005 (0.98) | −0.025 (1.00) | F = 3.681 * | F = 11.587 ** |
| Math Efficacy | 0.326 (0.89) | 0.179 (0.93) | −0.038 (0.98) | 0.004 (1.00) | F = 3.099 * | F = 64.642 ** |
| Math Performance | 48.334 (12.27) | 34.525 (10.97) | 36.714 (11.18) | 41.245 (11.57) | F = 6.379 ** | KW = 1568.108 ** |
Note: KW indicates the H-value of Kruskal–Wallis tests; * indicates significant at 0.05, and ** indicates significant at 0.01.
Table 3.
Descriptive statistics, independent samples T (t) and Mann–Whitney (MW) tests for linguistic and sex group comparisons with SES, student unprepared class, teacher support, math Efficacy, and math performance.
Table 3.
Descriptive statistics, independent samples T (t) and Mann–Whitney (MW) tests for linguistic and sex group comparisons with SES, student unprepared class, teacher support, math Efficacy, and math performance.
| Variable | Mean (SD) | Mean (SD) | Levene’s F | Statistics | Mean (SD) | Mean (SD) | Levene’s F | Statistics |
|---|---|---|---|---|---|---|---|---|
| English | LOTE | Male | Female | |||||
| SES | 0.104 (0.76) | −0.197 (0.86) | F = 122.848 ** | MW = −22.212 ** | 0.053 (0.78) | 0.053 (0.78) | F = 9.922 ** | t = −0.226 |
| Unprepared-Class | −0.004 (0.98) | 0.018 (1.07) | F = 38.659 ** | MW = −0.384 | 0.173 (1.02) | −0.179 (0.94) | F = 27.500 * | MW = −26.392 * |
| Teacher Support | −0.014 (1.00) | 0.077 (0.98) | F = 0.080 | t = −4.526 ** | 0.004 (1.01) | −0.004 (.99) | F = 0.179 | t = −0.607 |
| Math-Efficacy | 0.028 (1.00) | 0.117 (0.97) | F = 4.068 * | t = −4.437 ** | 0.135 (0.99) | −0.052 (0.99) | F = 2.117 | t = 12.948 ** |
| Math Performance | 40.128 (11.79) | 40.524 (12.86) | F = 49.001 ** | MW = −0.965 | 40.174 (12.33) | 40.197 (11.61) | F = 46.817 ** | MW = −0.058 |
Note: LOTE indicates Language Other Than English Dominants; t indicates the t-value of independent samples t-test; MW indicates the Z-value of Mann–Whitney tests; * indicates significant at 0.05; and ** indicates significant at 0.01.
Table 4.
Descriptive statistics of variables.
| N | Mean | SD | |
|---|---|---|---|
| Asian | 20,281 | 0.10 | 0.30 |
| Black | 20,281 | 0.12 | 0.33 |
| Hispanic | 20,281 | 0.19 | 0.39 |
| White | 20,281 | 0.60 | 0.49 |
| LOTE | 21,419 | 0.17 | 0.37 |
| Female | 23,497 | 0.49 | 0.50 |
| SES | 21,444 | 0.05 | 0.78 |
| Math-Efficacy | 18,759 | 0.04 | 1.00 |
| Math Performance | 21,444 | 40.19 | 11.98 |
| Valid N (listwise) | 16,829 |
Note: Means of categorical variables (Asian, Black, Hispanic, White, LOTE, Female) indicate percentages of the group.
Table 5.
Fit statistics of measurement model and full structural model.
| Chi-Square | RMSEA | CFI | TLI | SRMR | |
|---|---|---|---|---|---|
| Measurement Model | 145.237, p = 0.000 | 0.019 | 0.998 | 0.989 | 0.009 |
| Full Structural Model | 65,812.962, p = 0.000 | 0.030 | 0.969 | 0.949 | 0.019 |
Table 6.
Fit statistics and effects from structural equation modeling.
| Variables | Estimate | SE | p | |
|---|---|---|---|---|
| Student Unprepared Class By | Class_Prep1 (Paper) | 1.000 | 0.000 | -- |
| Class_Prep2 (Books) | 0.759 | 0.014 | 0.000 ** | |
| Class_Prep3 (Homework) | 0.815 | 0.017 | 0.000 ** | |
| Teacher Support By | Teacher1 (Success) | 1.000 | 0.000 | -- |
| Teacher2 (Value) | 0.762 | 0.009 | 0.000 ** | |
| Teacher3 (Respect) | 0.929 | 0.008 | 0.000 ** | |
| Teacher4 (Interesting) | 0.922 | 0.007 | 0.000 ** | |
| Teacher5 (Fair) | 0.927 | 0.011 | 0.000 ** | |
| Student Unprepared Class On | Asian | −0.121 | 0.041 | 0.003 ** |
| Black | 0.039 | 0.027 | 0.144 | |
| Hispanic | 0.100 | 0.027 | 0.000 ** | |
| SES | −0.123 | 0.010 | 0.000 ** | |
| Asian by SES | 0.013 | 0.022 | 0.550 | |
| Black by SES | 0.069 | 0.025 | 0.005 ** | |
| Hispanic by SES | −0.024 | 0.021 | 0.260 | |
| LOTE | 0.017 | 0.046 | 0.713 | |
| Asian by LOTE | −0.086 | 0.060 | 0.156 | |
| Black by LOTE | −0.069 | 0.095 | 0.463 | |
| Hispanic by LOTE | −0.026 | 0.054 | 0.627 | |
| Sex | −0.300 | 0.015 | 0.000 ** | |
| Asian by Sex | 0.047 | 0.040 | 0.236 | |
| Black by Sex | 0.021 | 0.037 | 0.576 | |
| Hispanic by Sex | −0.018 | 0.031 | 0.574 | |
| Teacher Support By | Asian | 0.067 | 0.034 | 0.049 * |
| Black | 0.053 | 0.025 | 0.038 * | |
| Hispanic | 0.043 | 0.023 | 0.059 | |
| SES | 0.037 | 0.009 | 0.000 ** | |
| Asian by SES | −0.011 | 0.019 | 0.567 | |
| Black by SES | 0.002 | 0.022 | 0.927 | |
| Hispanic by SES | −0.048 | 0.018 | 0.009 ** | |
| LOTE | 0.079 | 0.042 | 0.063 | |
| Asian by LOTE | −0.068 | 0.054 | 0.204 | |
| Black by LOTE | −0.071 | 0.083 | 0.392 | |
| Hispanic by LOTE | −0.037 | 0.049 | 0.444 | |
| Sex | −0.061 | 0.013 | 0.000 ** | |
| Asian by Sex | 0.000 | 0.034 | 0.998 | |
| Black by Sex | 0.036 | 0.035 | 0.303 | |
| Hispanic by Sex | −0.035 | 0.027 | 0.201 | |
| Student Unprepared Class | −0.176 | 0.011 | 0.000 ** | |
| Math Self-Efficacy On | Asian | 0.135 | 0.044 | 0.002 ** |
| Black | 0.229 | 0.032 | 0.000 ** | |
| Hispanic | 0.084 | 0.032 | 0.009 ** | |
| SES | 0.174 | 0.012 | 0.000 ** | |
| Asian by SES | 0.015 | 0.027 | 0.586 | |
| Black by SES | −0.143 | 0.032 | 0.000 ** | |
| Hispanic by SES | −0.045 | 0.027 | 0.094 | |
| LOTE | 0.197 | 0.054 | 0.000 ** | |
| Asian by LOTE | −0.106 | 0.069 | 0.128 | |
| Black by LOTE | −0.327 | 0.113 | 0.004 | |
| Hispanic by LOTE | −0.155 | 0.064 | 0.016 * | |
| Sex | −0.265 | 0.019 | 0.000 ** | |
| Asian by Sex | 0.001 | 0.046 | 0.976 | |
| Black by Sex | −0.001 | 0.046 | 0.985 | |
| Hispanic by Sex | −0.030 | 0.039 | 0.436 | |
| Student Unprepared Class | −0.318 | 0.017 | 0.000 ** | |
| Teacher Support | 0.405 | 0.014 | 0.000 ** | |
| Math Performance On | Asian | 3.684 | 0.529 | 0.000 ** |
| Black | −5.422 | 0.340 | 0.000 ** | |
| Hispanic | −1.563 | 0.336 | 0.000 ** | |
| SES | 5.688 | 0.126 | 0.000 ** | |
| Asian by SES | −0.088 | 0.320 | 0.784 | |
| Black by SES | −0.807 | 0.320 | 0.012 * | |
| Hispanic by SES | −0.778 | 0.275 | 0.005 ** | |
| LOTE | −0.032 | 0.576 | 0.955 | |
| Asian by LOTE | 2.428 | 0.783 | 0.002 ** | |
| Black by LOTE | −0.920 | 1.200 | 0.444 | |
| Hispanic * LOTE | 0.673 | 0.678 | 0.321 | |
| Sex | 0.002 | 0.192 | 0.991 | |
| Asian by Sex | −0.603 | 0.544 | 0.268 | |
| Black by Sex | 0.639 | 0.471 | 0.175 | |
| Hispanic by Sex | 0.212 | 0.388 | 0.585 | |
| Student Unprepared Class | −1.764 | 0.157 | 0.000 ** | |
| Teacher Support | −0.090 | 0.138 | 0.514 | |
| Math Self-Efficacy | 2.794 | 0.089 | 0.000 ** |
Note: * indicates significant at 0.05 and ** indicates significant at 0.01.
Disclaimer/Publisher’s Note: The statements, opinions and data contained in all publications are solely those of the individual author(s) and contributor(s) and not of MDPI and/or the editor(s). MDPI and/or the editor(s) disclaim responsibility for any injury to people or property resulting from any ideas, methods, instructions or products referred to in the content. |
© 2023 by the authors. Licensee MDPI, Basel, Switzerland. This article is an open access article distributed under the terms and conditions of the Creative Commons Attribution (CC BY) license (https://creativecommons.org/licenses/by/4.0/).
Share and Cite
MDPI and ACS Style
Chang, M.; Bang, H.; Kim, S.; Pontier, R.W. Enhanced Math Efficacy and Performance of Minority Students through Student Class Preparation and Teacher Support. Educ. Sci. 2023, 13, 1158. https://doi.org/10.3390/educsci13111158
AMA Style
Chang M, Bang H, Kim S, Pontier RW. Enhanced Math Efficacy and Performance of Minority Students through Student Class Preparation and Teacher Support. Education Sciences. 2023; 13(11):1158. https://doi.org/10.3390/educsci13111158
Chicago/Turabian StyleChang, Mido, Hyejin Bang, Sunha Kim, and Ryan W. Pontier. 2023. "Enhanced Math Efficacy and Performance of Minority Students through Student Class Preparation and Teacher Support" Education Sciences 13, no. 11: 1158. https://doi.org/10.3390/educsci13111158
Note that from the first issue of 2016, this journal uses article numbers instead of page numbers. See further details here.