Teacher Perceptions of Training and Pedagogical Value of Cross-Reality and Sensor Data from Smart Buildings


1
College of Education, Sea Grant, Oregon State University, Corvallis, OR 97331, USA
2
Wood Science and Engineering, Oregon State University, Corvallis, OR 97331, USA
3
School of Electrical Engineering & Computer Science, Oregon State University, Corvallis, OR 97331, USA
4
Pre-College Programs, Oregon State University, Corvallis, OR 97331, USA
*
Author to whom correspondence should be addressed.
Educ. Sci. 2020, 10(9), 234; https://doi.org/10.3390/educsci10090234
Submission received: 31 July 2020
/
Revised: 28 August 2020
/
Accepted: 2 September 2020
/
Published: 4 September 2020
(This article belongs to the Special Issue Construction and Built Environment Education in A Digital Context)
Abstract
:This paper discusses elementary, and secondary (K-12) teachers’ perceptions of cross-reality (XR) tools for data visualization and use of sensor data from the built environment in classroom curricula. Our objective was to explore the use of sensor-informed XR in the built environment and civil engineering (BECE) field to support K-12 science, technology, engineering, and mathematics (STEM) experiential learning and foster BECE-related career awareness. We conducted surveys and informal questionnaires with 33 primary and secondary teachers attending an annual two-day university-based teacher professional development workshop as part of a statewide STEM afterschool program serving students in rural communities. We assessed teachers’ familiarity with, knowledge about, and appraisal of using cross-reality platforms and sensor data in classrooms and after school curricula. Findings show that, while all teachers reported relatively high interest in learning about sensor applications and innovative interactive techniques, middle school teachers in particular were most likely to see value in using these applications for teaching and learning. Implications for teacher professional development are discussed.
Keywords:
smart buildings; sensor data; cross-reality; data literacy; STEM education; K-12 education1. Introduction
With the implementation of the Next Generation Science Standards (NGSS) in the U.S., engineering and technology concepts have gained noteworthy inclusion in the core concepts guiding kindergarten, elementary, and secondary (K-12) science, technology, engineering, and mathematics (STEM) education [1]. Despite the fact that 94.2% of teaching certification programs in 52 U.S. states and territories contain engineering content or engineering design elements [2], research has shown that few K-12 teachers are academically prepared to teach engineering subjects [3]. Bybee and Loucks-Horsley [4], among others [5], suggest that teachers require specific professional development in order to develop the pedagogical skills to incorporate engineering and design pedagogies into their teaching, especially as part of an integrated STEM curriculum. University-based initiatives, such as the one in which this study is based, leverage the resources of formal and informal education organizations and communities to offer professional development in STEM for teachers and STEM experiential learning for youth with the explicit goals of promoting student college and career access and success [6]. The value of such learning outside the formal classroom has long been widely recognized across general education [7] and engineering education specifically [8,9,10].
One of the advantages of these informal learning programs is the possibility to test and introduce new tools, such as digital technologies, and new pedagogical strategies that have not yet been matured or otherwise developed for robust educational application. The importance of such new tools and strategies is substantiated by Hoeg and Bencze [11], who argue that engineering concepts, especially those explored in pre-college education, tend to be otherwise highly abstract and lack authentic applications, making learning difficult and thus not connecting students with potential career pathways.
The use of authentic data as a resource for experiential, cross-curricular STEM learning is gaining increasing attention [12,13,14]. Data literacy is recognized as key for twenty-first century learners to be successful in an increasingly data-rich society, and in BECE and other STEM careers, which are developing towards a growing use of sensing technologies and big data [15,16,17,18]. However, previous research has highlighted a paucity of opportunities for pre-service teachers to work with complex data in the classroom [19], a limited confidence in scaffolding their students in data-focused discussion and inquiry [20,21], and the need for professional development offerings as a way to introduce instructors to benefits of incorporating data literacy and use of authentic data into their curricula [22,23].
In the last decade, efforts have been made by industry and academia to develop novel, effective ways to visualize and communicate sensor data, including use of immersive technologies [24], such as phone or tablet based augmented reality (AR) or headset-based virtual reality (VR) simulations. Use of immersive, interactive visualization tools for educational purposes has received a great deal of attention by many authors, with the greatest focus on the impacts for students as learners (c.f.) [25,26,27,28,29]. Pre-service teacher perceptions on the integration of VR into instructional activities were investigated by Chou et al. [30]. Remarkably, while both K-12 students and pre-service teachers saw strong benefits in integrating VR into instruction, most pre-service teachers reported a need for professional learning to effectively integrate the technology and to learn the pedagogy and best practice to ensure meaningful learning for students [30]. Many teachers also expressed interest for support to develop or locate instructional content in immersive environments meeting specific curricular goals.
In this study, we explore opportunities to introduce authentic data available from the built environment and smart buildings, as well as immersive digital environments for data interaction, in 4th to 12th grade after-school programs and related teacher professional development to engage students in scientific inquiry and engineering problems. In particular, this study aims to assess teachers’ familiarity with, knowledge about, and appraisal of using sensor data made visual in virtual building tours assessed via headset-virtual reality environments, as well as projections of visualizations of data from sensors on real or virtual building components via handheld device augmented reality applications in afterschool and classroom curricula. To that end, we address the following research questions:
- How do grades 4–12 teachers assess their knowledge of the use of basic principles of physics, engineering, and engineering design in teaching built environment and civil engineering (BECE) content and processes?
- How familiar are grades 4–12 teachers with the use of sensors, sensor data from smart buildings, and cross-reality (XR) environments in teaching and learning?
- How do grades 4–12 teachers assess their knowledge of the use of sensors, sensor data from smart buildings, and XR environments in teaching physics, engineering, and engineering design?
- What is the perceived value of sensors, sensor data from smart buildings, and XR environments in teaching and learning physics, engineering, and design among grades 4–12 teachers?
This study is particularly relevant to university initiatives to support K-12 STEM programs, professional development programs for K-12 STEM teachers, and career awareness activities in BECE and related STEM fields, contributing to the current body of knowledge on how and to what extent new generations can be exposed to and prepared for STEM content that is relevant to emerging BECE-related careers. We expect to provide information that will contribute to strengthen future understanding of teachers’ skills and intentions regarding the integration of emerging sensing and visualization technologies and data science in their future classrooms. We also expect to advance knowledge on how to prepare teachers to effectively engage students in real-world applications relevant to developing critical thinking and problem-solving skills, fundamental for 21st century learners and for the future of the BECE sector.
2. Background Literature
The following sections describe the current state of the research in the use of sensors and sensors data in STEM education, with a specific emphasis on data of the built environment. Developments in the use of interactive interfaces for data visualization and navigation are also briefly reviewed.
2.1. Use of Sensors in STEM Education
A series of studies between the 1980s and the beginning of the 21st century provided pioneering contributions on the use of probeware in STEM education, by introducing scientific inquiry in K-12 education based on real-time sensor data capture. Tinker and Barclay completed the earliest research in 1982, demonstrating the effectiveness of using probeware to teach kinematics phenomena within a fourth-grade classroom [31]. In a later study, Brasell [32] found that real-time sensor graphing improves the learning process compared to the asynchronous analysis of the same physical phenomenon (i.e., motion). Mokros and Tinker [33], and Russell et al. [34], investigated student data manipulation activities in a microcomputer-based laboratory (MBL). They found that the possibility to link complex scientific symbols to physical events under student control supported critical thinking processes and science inquiry. In all of these studies, sensors and probeware were used to process, analyze, and display data enabled students to manipulate parameters, test hypothesis, and explore relationships. The value of interacting with authentic data to bridge between formal (i.e., abstract) and concrete operations was emphasized in all these studies.
The Technology Enhanced Elementary and Middle School Science II project (TEEMSS) investigated effectiveness of probes and computers in inquiry learning environments at the middle school level [35]. Within the same project, use of sensors to support engineering design and problem-solving activities within different students age/grade groups was investigated [36]; students performed engineering tasks, such as the design of a playground using force and motion sensors (grade 3–4), and building and monitoring a working greenhouse using temperature, relative humidity, and light sensors (grade 5–6) [35]. STEM learning of students involved in the TEEMSS pilot study reported by Zucker et al. [36] showed gains that were statistically significantly higher, across all grades, than students in the control groups, who did not use the TEEMSS materials. It is worth noting students using sensors and computers scored higher than non-TEEMSS students only on some units, but not on others: Significantly, one of the highest achievements of TEEMS students were improved data literacy skills, specifically the ability to interpret graphs [35].
Professional STEM educator development programs have a substantial impact on teacher awareness [37] and abilities relative to conducting inquiry and making predictions [38] by using authentic data from sensors. Maeng et al. [39] investigated preservice secondary science teachers’ technology-enhanced inquiry instruction and their developing Technological Pedagogical Content Knowledge (TPACK) in the context of a 2-year Master of Teaching program. Findings of this study highlight the value of sensors in supporting science instruction, and specifically data collection and analysis, as well as communication and discussion of results [39].
2.2. Integration of Data Literacy in K-12-STEM Programs
Research has shown that students at all levels struggle with constructing and interpreting visualizations of data, whether in the form of simple graphs and tables [40,41] or more sophisticated false-color imagery such as that used in geospatial visualization of remotely sensed data [42]. Moreover, students have significant difficulties connecting elements of visualizations and models with the real-world phenomena they represent, even when those data and models are keyed to geospatial representations which offer a degree of familiarity and cultural resonance [42,43,44,45,46]. Research has explored the integration of computing technologies and visualizations of data with inquiry teaching practices as a way of addressing data literacy for both students [13,20,47,48] and teachers [21,42]. The industry is also aware that efficient and effective communication of sensor data is critical for the correct utilization and the usefulness of smart systems [49]. In the last decade, efforts have been made to develop novel, effective ways to visualize and communicate sensor data from buildings, including the use of immersive technologies [50]. Use of immersive, interactive visualization tools for educational purposes has received a great deal of attention (c.f.) [25,26,27] and one of the purposes of our study is to evaluate teacher’s perceptions of the use of these tools to increase familiarity with sensor data representation and data analysis tasks.
2.3. Using Smart Buildings in STEM Education
Integration of sensors in buildings and infrastructures is becoming an increasingly common practice aimed to advance control and evaluation of the performance of the built environment [51]. Furthermore, real-time sensor data are often made available to building occupants and non-technical audiences in order to increase awareness of sustainable practices related to the design and management of facilities and infrastructures (e.g., [50,52,53,54]. Buildings to which these practices are applied are commonly referred to as “smart buildings”, and are a current focus of modern building information modelling (BIM) development and research [51]. The rapid adoption of this technology in BECE substantiates the need for education as to its best use which, in turn, demands a detailed understanding of present tools and trends for the best development of new curricula in both formal and informal learning environments.
The role of the built environment to convey STEM related content and support experiential learning has been explored particularly in relation to the development of energy-efficient buildings and green design practices (e.g., [54,55,56]). The “Building Dashboard,” a real-time system for monitoring and displaying the environmental performance of buildings, has been employed in several educational scenarios and in small communities [53,54,57], demonstrating its capability to enhance systems thinking and promote civic engagement and co-production of knowledge. For the same purpose, Lehrer and Vasudev [58] propose a combination of information visualization and use of social media. Visualization interfaces, designed to give “sociotechnical” and “eco” feedback, have proven to have an impact on users’ behavior and decision-making (e.g., a user learns how to conserve electricity by real-time feedback on power consumption). The “Integrated Teaching and Learning Laboratory” at the University of Colorado, opened in 1997, is an early example of a smart structure in an educational facility showcasing engineering systems and sensors integrated into the building to promote scientific and engineering inquiry related to structural efficiency [52]. Other examples have been proliferating (e.g., Virginia Tech’s Smart Infrastructure Laboratory “VT-SIL”). Despite the increasing number of such settings, there is a paucity of research-based professional development on smart building-enabled instruction, as well as of studies on how and to what extent smart buildings, their infrastructure and data can support formal and informal STEM learning.
2.4. Immersive Technologies in STEM Education
Principles related to data visualization in traditional contexts apply to interactive mixed reality (MR) or cross-reality (XR) systems [59]. However, the unique advantages provided by XR are still under investigation by the XR research community, and these efforts have been hampered by the cost and primitive nature of the technology [60]. For example, there have been numerous investigations into solving issues related to the overlay and overcrowding of data in cyber physical spaces [61,62,63,64]. Such research has yielded a better understanding of how information is comprehended and perceived in XR [65,66,67] and, critical to our purposes, how it can best be used as an educational tool [29,68]. While Maas and Hughes [29] present an argument for the term mixed reality as an overarching conceptual overlay for studies that span the “reality spectrum” (p. 222), for this project, we prefer the term cross-reality in that it focuses on the places and ways virtual environments directly impact the real world. The cross-reality environments we are concerned with here are a fusion of ubiquitous sensor/actuator networks and shared virtual worlds [68,69,70] that may be excellent grounds for anchoring developmental data literacy experiences.
The merit of XR as a cyberlearning enabler comes from situated learning theory [71,72]. The forefront of research in this area is concerned with the exploration of how mixed reality can stimulate and utilize senses beyond the five “common” ones (sight, hearing, touch, smell, and taste), to include kinematic, spatial, sonar, and radar senses [73]. This suggests that learning is more effective when information is conveyed in a physical manner that directly correlates to its in situ importance [74,75]. XR also has the potential to realize dynamic and agile educational solutions due to its ability to deliver rapid prototyping, intuitive design, and demonstration of concepts and procedures that produce a more effective and immersive learning experience [74]. Just as in VR, there also appears to be a strong positive effect on motivation from interaction with and in XR systems [29,75,76]. In addition to these more general efforts, research within Architecture, Engineering, and Construction (AEC) education has suggested a strong potential for XR as a tool to present information, but also cautions that explicit efforts must be made to ensure the usability of the technology [77], especially due to the highly spatial and physical nature of the concepts and laws in AEC.
2.5. Interactive Multimodal Representation of Data from Buildings
A 2016 review including virtual site visits and comparisons of as-planned vs. as-built structures outlined the large variety of simulation and visualization AR applications in the construction industry [78]. Smart, instrumented buildings produce historical sequences of almost real-time data from multiple sensors that offer excellent opportunities for learners to engage with ways of understanding and visualizing big data from the built environment. Information visualization [79] and visual analytics [80] are the two most prevalent research domains studying the presentation of this scale of data. For example, Mustapha et al. [81] present two data visualization platforms for non-expert users based on AR and VR systems. Very similar to the applications presented to teachers in this project, for the AR platform, smartphones were used as viewfinders and sensor data was overlaid on a video feed of the physical space. In the VR interface, a gaming software engine was used to navigate the Building Information Model (BIM) of the monitored structure, allowing interactions with multiple sensors, graphs, and data sources while navigating through the building in a virtual environment. A study by Napolitano et al. [49] presents a Structural Health Monitoring (SHM) platform integrating visualization of sensor networks and data in a virtual environment, employing a combination of Virtual Tour (VT) and Informational Modelling (IM) design patterns. In the VT/IM environment, a user can access both raw and processed data and relate sets of data to the monitored structure by accessing technical drawings and sensor infrastructure. The platform was tested with a group of civil engineering students, who found the 3D platform useful to contextualize data and understood its relevance [49].
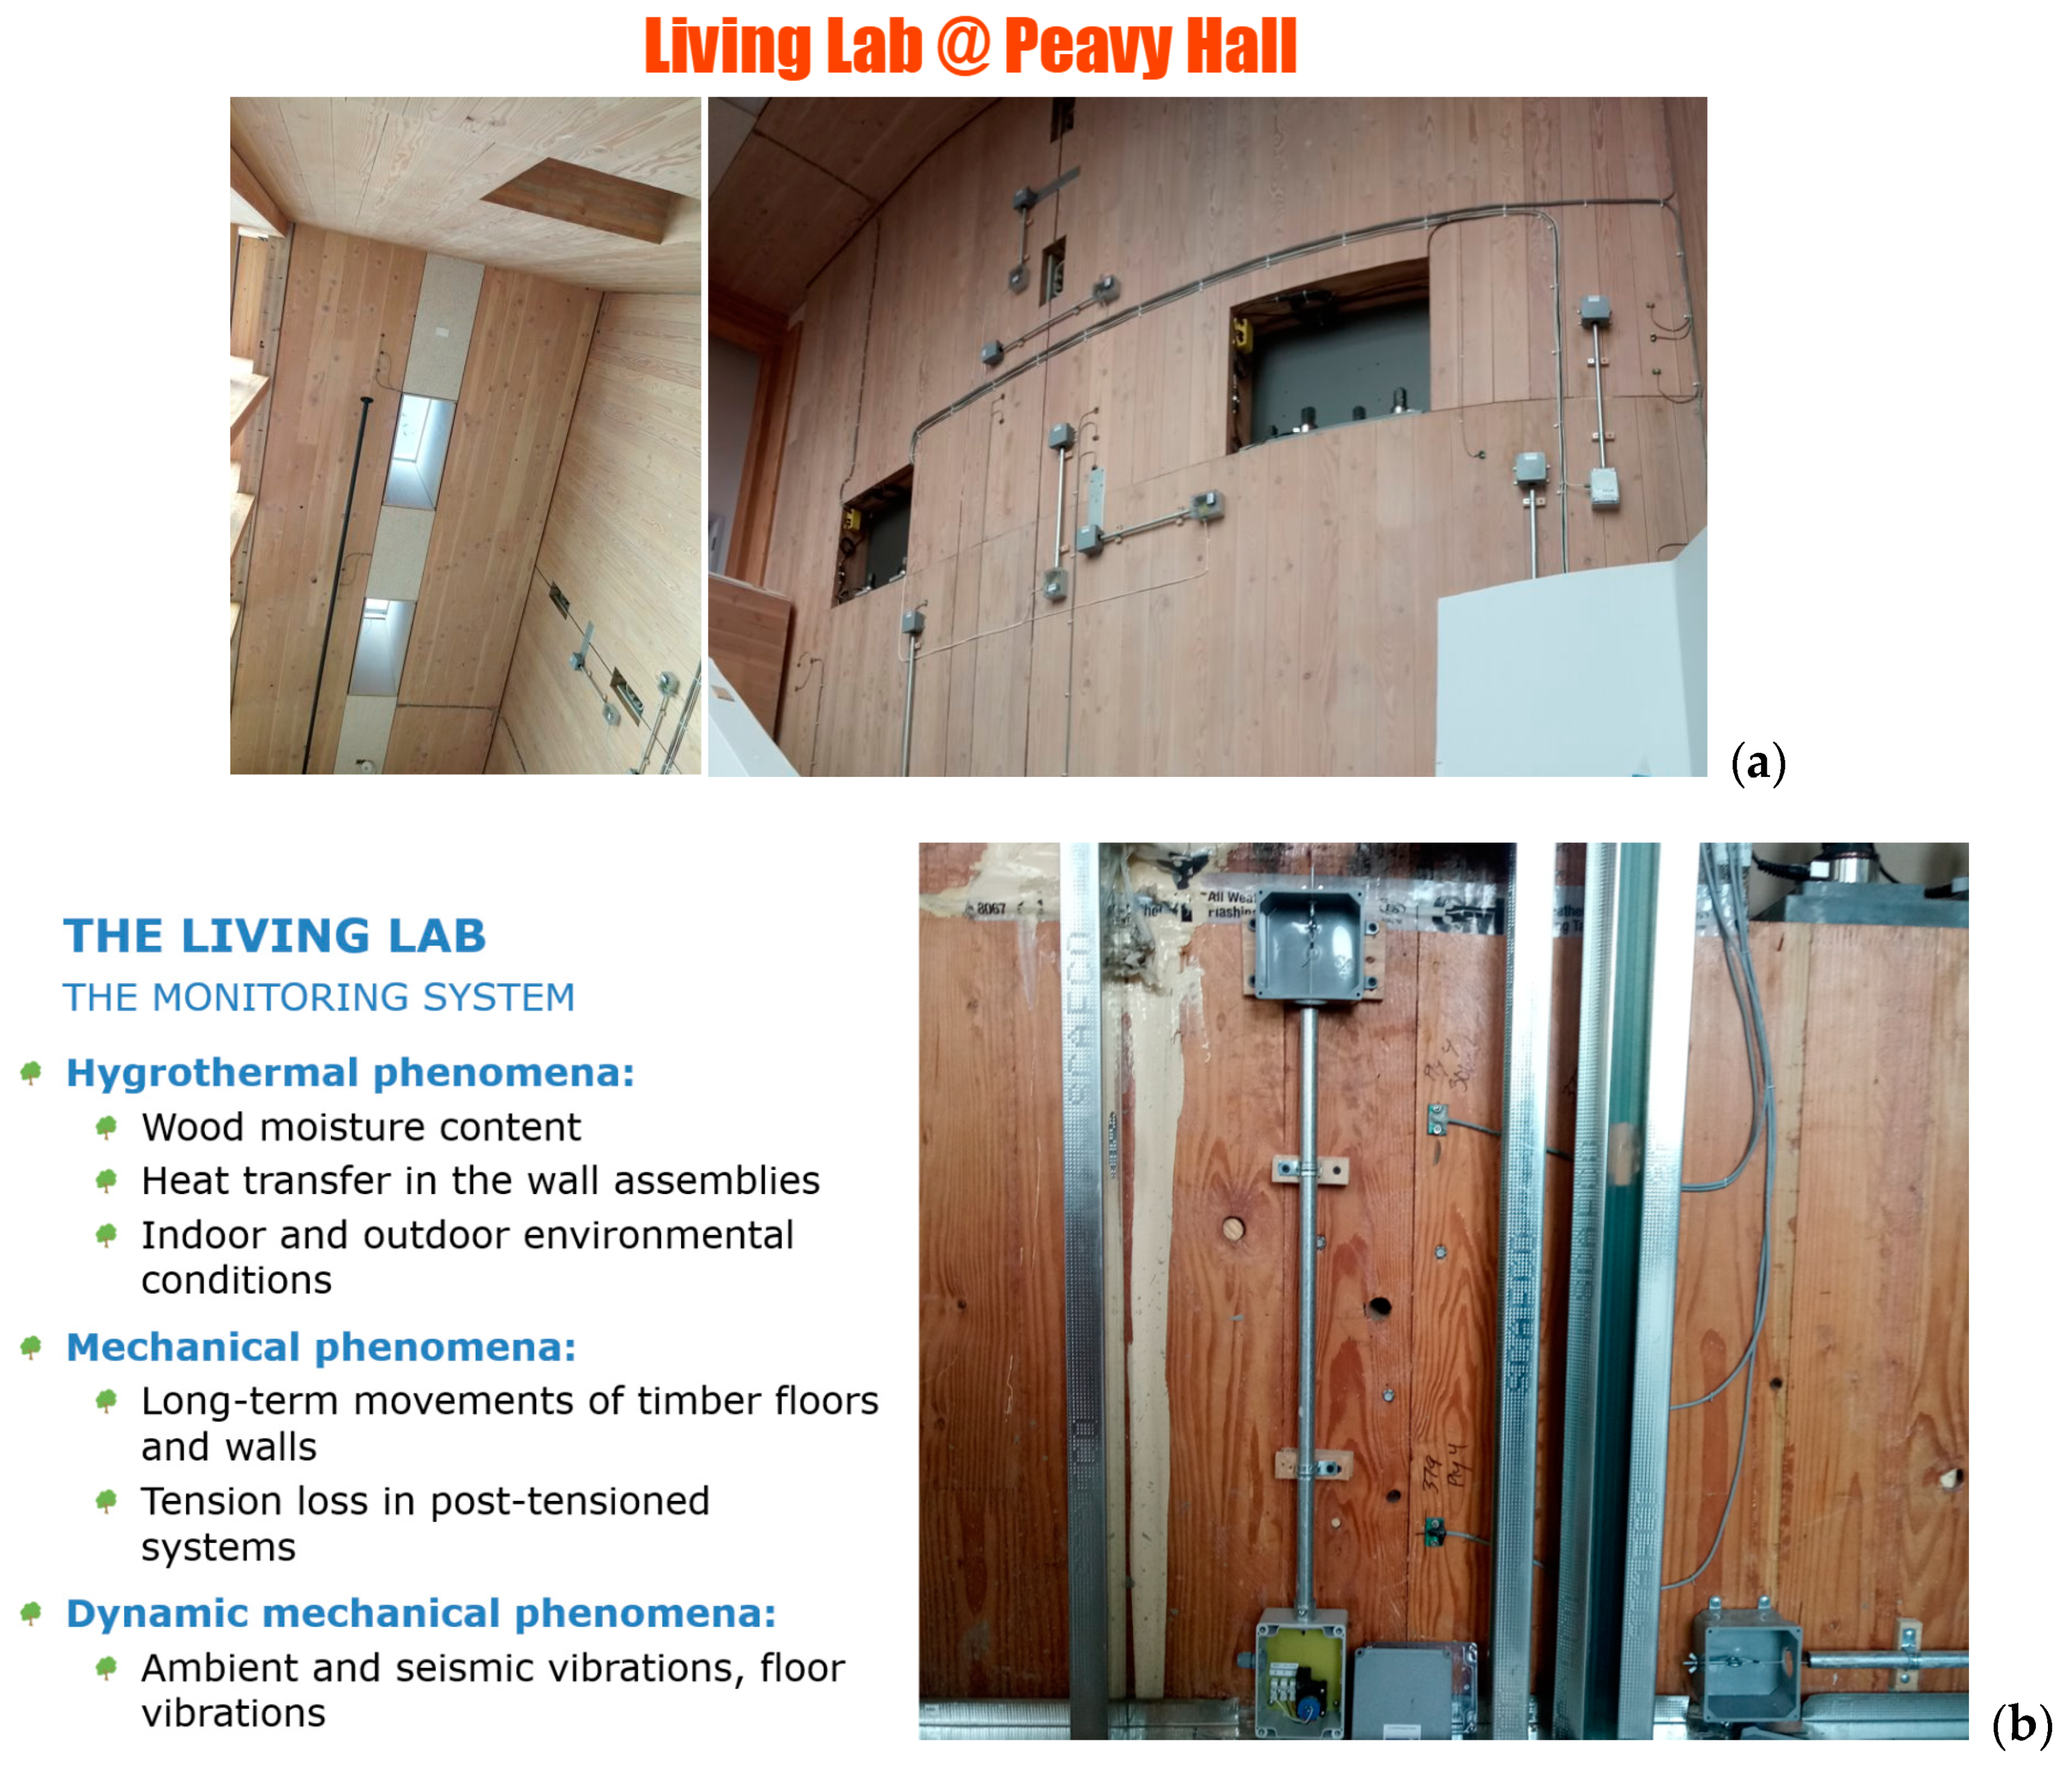
At the time of writing, a research project is on-going at Oregon State University (“Living Lab @ Peavy Hall”) resulting in the development of interactive interfaces to visualize and navigate sensor data from a new smart building on campus. This building is of particular relevance because it features innovative engineered wood products and advanced, earthquake-resistant timber construction systems [82]. While the original intent of the monitoring project was to provide data to experts and interested investors, the developed platform and studied immersive techniques may scaffold data sense-making, laying the foundation for a public, informal learning environment. The use of XR as part of this environment was presented to teachers working in afterschool STEM programming in a 2-h talk, workshop, and tour of the Peavy Hall building as part of their annual professional development activity.
3. Materials and Methods
3.1. Setting and Participants
Data was collected from 33 out of a potential pool of 50 (66% completion rate) adult primary and secondary teachers attending an annual two-day university-based professional development opportunity for STEM afterschool facilitators from a statewide program serving students in rural schools in the Pacific Northwest organized by the Science and Math Investigative Learning Experiences (SMILE) precollege program at Oregon State University. Participants all run afterschool STEM programs in partnership with SMILE program staff, who provide curriculum for club activities, run professional development for the teacher leaders of the clubs, and sponsor annual college-connection events for students participating in the clubs. Each of the teacher club leaders is also a regular classroom teacher in their school and manage the clubs, which may include students from beyond the grade level of their classrooms. Thus, a teacher who teaches 6th grade science may operate a club that includes 6th, 7th, and 8th grade students. The teachers themselves are largely representative of rural K-12 teachers in Oregon: 60% are female, 40% male, with an average of 14 years teaching and 5 years afterschool teaching with the SMILE program. Many of them work in very small, rural schools. Participants were informed of the study, its methods, and its purpose via a research information document sent along with other event materials via email. Additionally, one of the researchers presented the basic information along with opt-out information at the opening and welcome to the event.
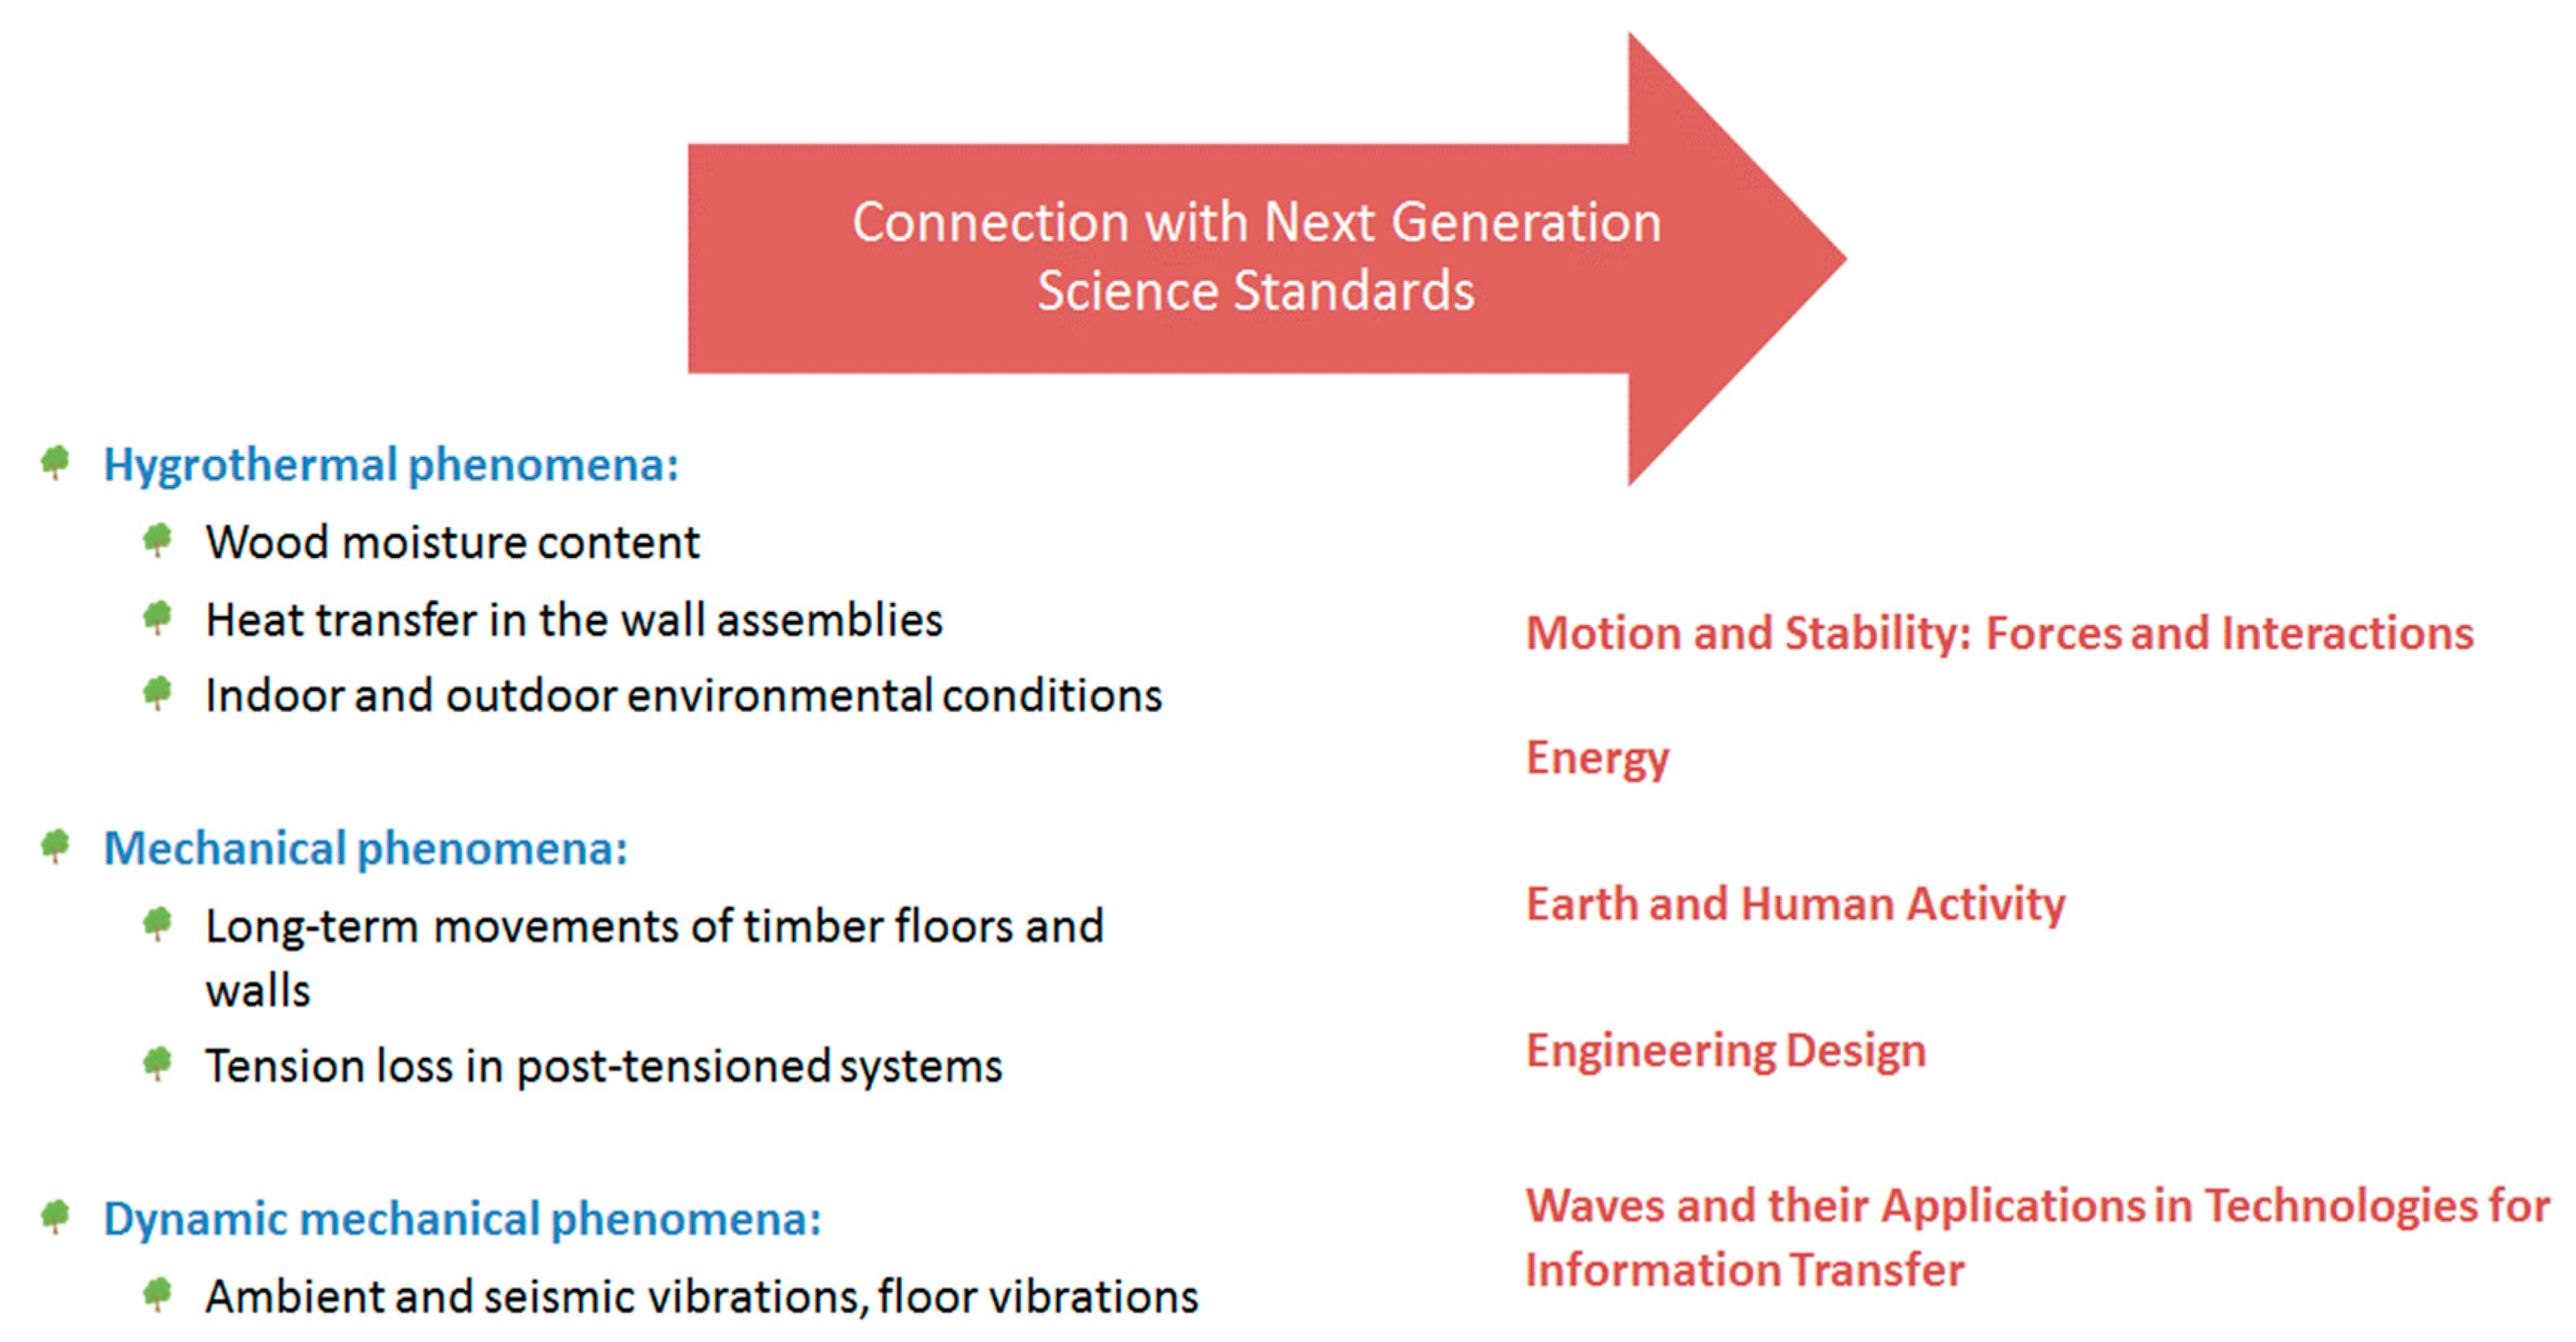
During the event, a presentation of the “Living Lab @ Peavy Hall” project was given, introducing general concepts of SHM, the sensor instrumentation in the building, types of physical phenomena observed and related measured parameters (Figure 1a,b). Connections between monitored phenomena, measured parameters, and the NGSS [1] were also highlighted to the target audience (Figure 2), suggesting possible venues for classroom and afterschool learning experiences within the K-12 science standard framework given to local educators, and aligning these experiences with research-based practices to prepare students for college, BECE and related STEM careers, and general science literacy.
Examples of several sensor data plots were shown to the participants, including static graphs, VR tours of the building and its physical components, interactive navigations of the sensor network, and an interface for visualizing and manipulating the sensor data. In the AR configuration, the participants were shown the possibility of using a handheld viewfinder (i.e., mobile phone, tablet, or laptop) to point at elements from the physical space and visualize sensor and building information integrated into the scene accordingly. Participants were also introduced to the concept of “projection mapping” [24,83], in which a light projector could cast visualizations of sensor data onto relevant physical surfaces, creating a very large XR interface.
3.2. Data Collection
3.2.1. Demographic Data
SMILE maintains demographic data for all teacher and student participants, and data for participating educators were reported to the research team in a spreadsheet by the partner program staff using unique identifiers and included age, gender identification, grades taught, number of years of experience teaching (and subject for secondary educators), number of years working as an afterschool club facilitator with the partner program, degree attainment and discipline, and licensure status and subject.
3.2.2. Knowledge of and Familiarity with Study Content
Information about participants’ knowledge of the study topics was collected via a set of questions added to an existing summative evaluation form administered at the conclusion of the two-day professional development event. These questions used Likert-type scales to address self-perceived familiarity with seven domains:
- Sensor-based monitoring of building performance as demonstrated at the event;
- Advanced wood products such as the ones demonstrated at the event;
- Teaching/learning in XR environments such as those demonstrated at the event;
- Smart buildings such as the one toured at the event as contexts for teaching and learning;
- Basic principles of physics as related to building/construction;
- Basic principles of engineering as related to building/construction;
- Basic principles of design as related to building/construction.
3.2.3. Perceived Pedagogical Value of Study Content
Additional data about the knowledge of and perceived pedagogical value of study content was collected during event presentations. A series of questions adapted from the ARS Heuristic [26], also a Likert-type rubric, asked for level of agreement/disagreement with the following statements:
- The application transforms the sensing data so that difficult concepts are easier to understand.
- The application presents relevant educational information at the appropriate time and place, providing easy access to information and/or reducing extraneous learner tasks.
- The application directs learner attention to important aspects of the educational experience.
- The application enables learners to physically enact, or to feel physically immersed in, the educational concepts supporting them to make sense of spatially challenging phenomena.
4. Results
4.1. Demographics
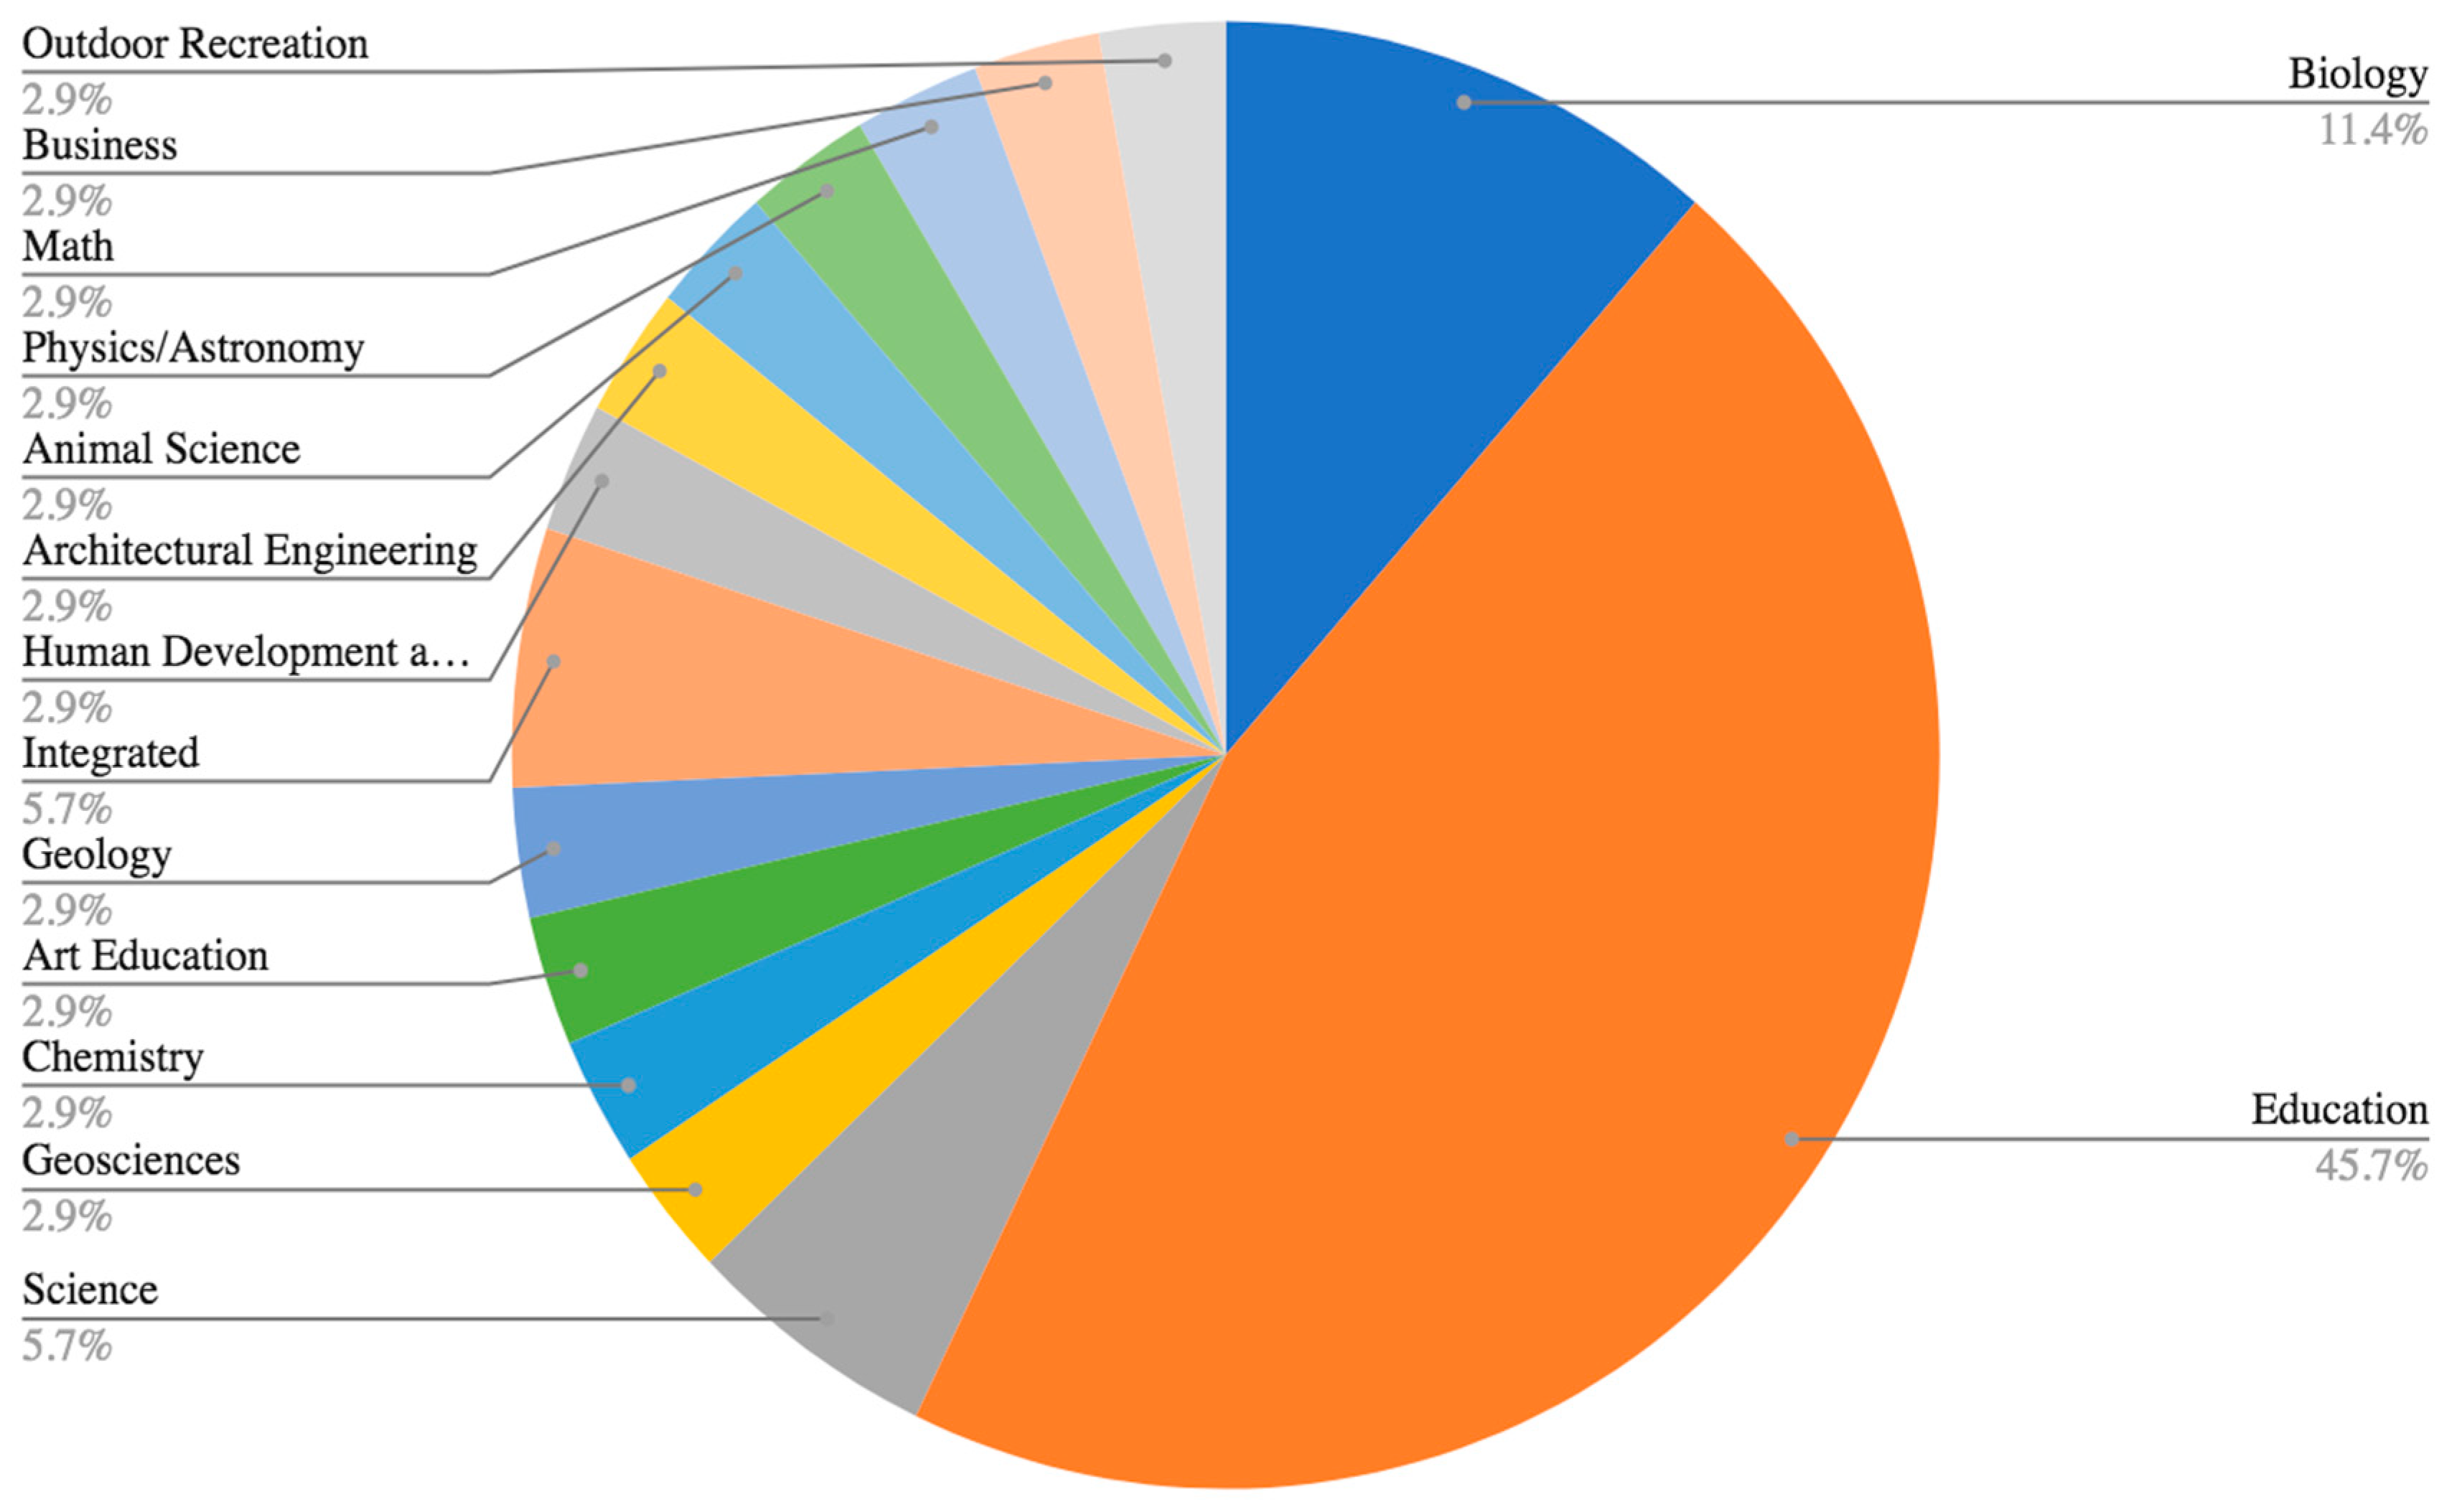
Teachers in the SMILE program are mostly seasoned educators with a median age of 45 years old, 14 years teaching, and 5 years teaching in the afterschool program itself. Sixty percent identify as female and 40% as male. The majority (43%) teach in grades 6–8 (53% female and 47% male), with 37% (77% female and 23% male) teaching elementary grades (1–5), and 23% (50% female and 50% male) teaching high school (grades 9–12). Sixty-six percent hold master’s degrees or higher. Disciplinary backgrounds vary across the group, with the largest percentage having advanced degrees and licensure in education generally (see Figure 3).
4.2. Knowledge of and Familiarity with Study Content
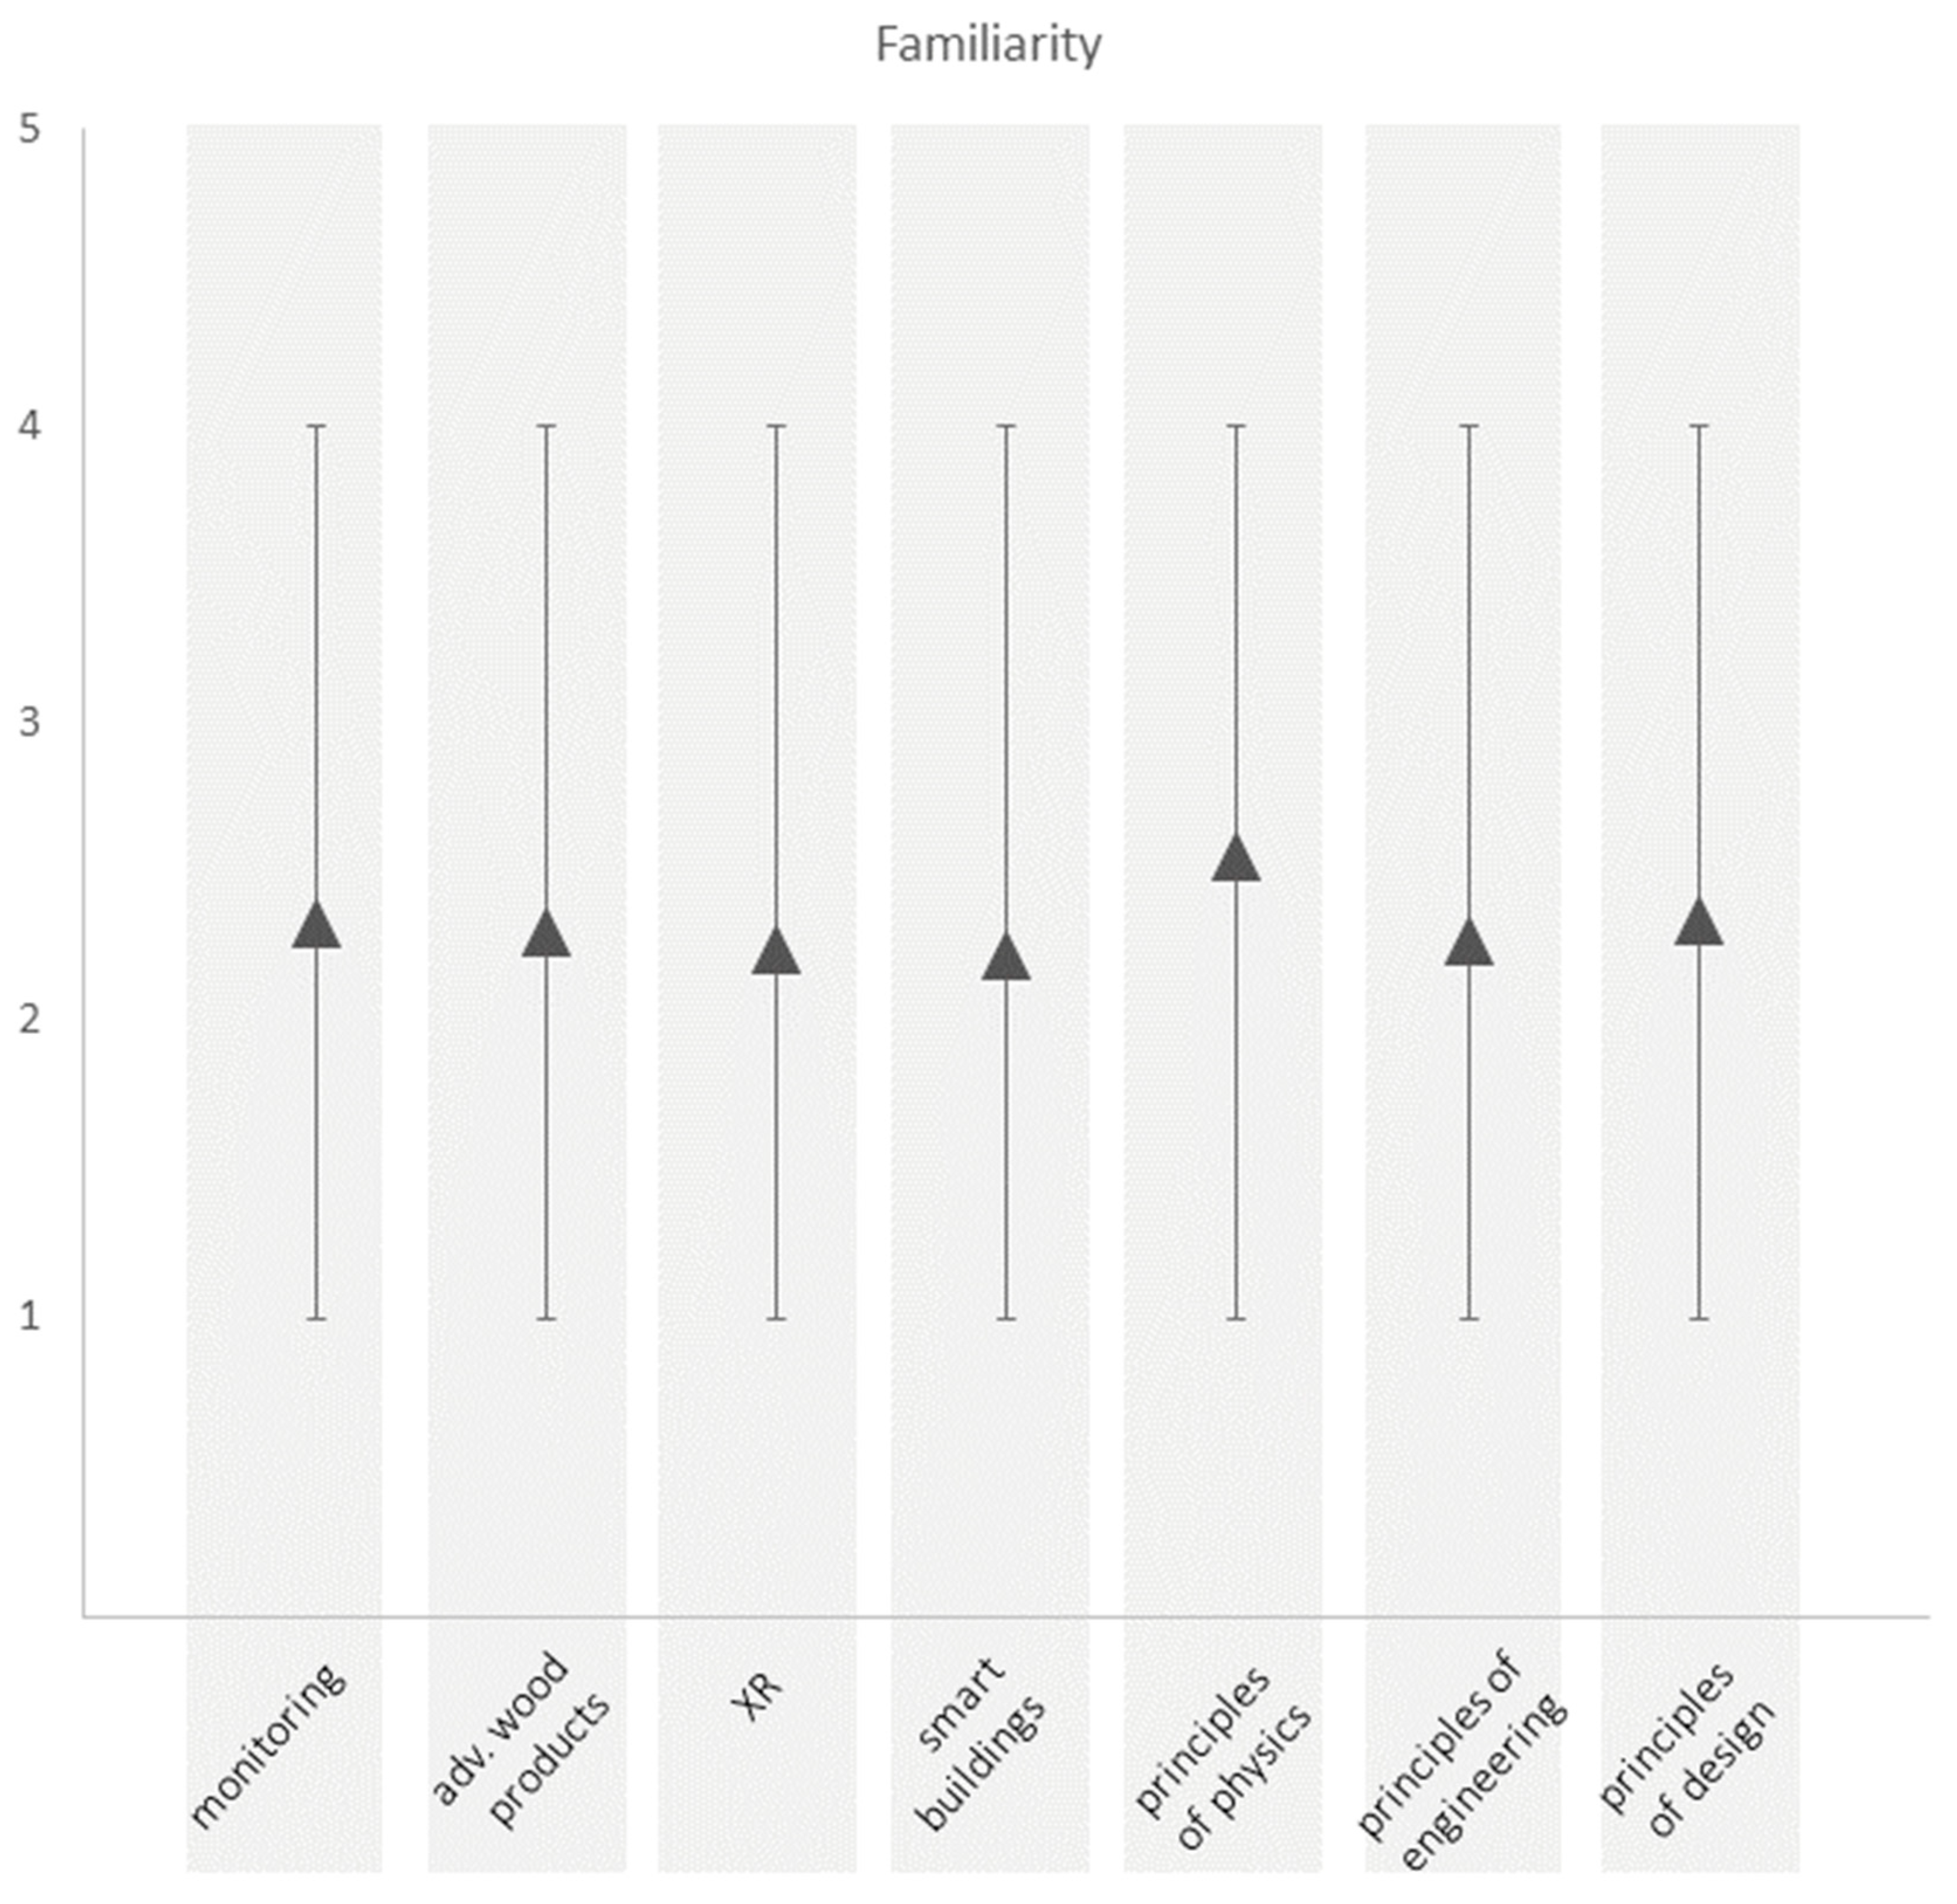
Across the board, participants reported moderate familiarity with the types of sensors used for building monitoring, smart buildings, and use of cross-reality environments for teaching and learning as well as basic principles of physics, engineering, and design relative to BECE and related STEM fields (Figure 4).
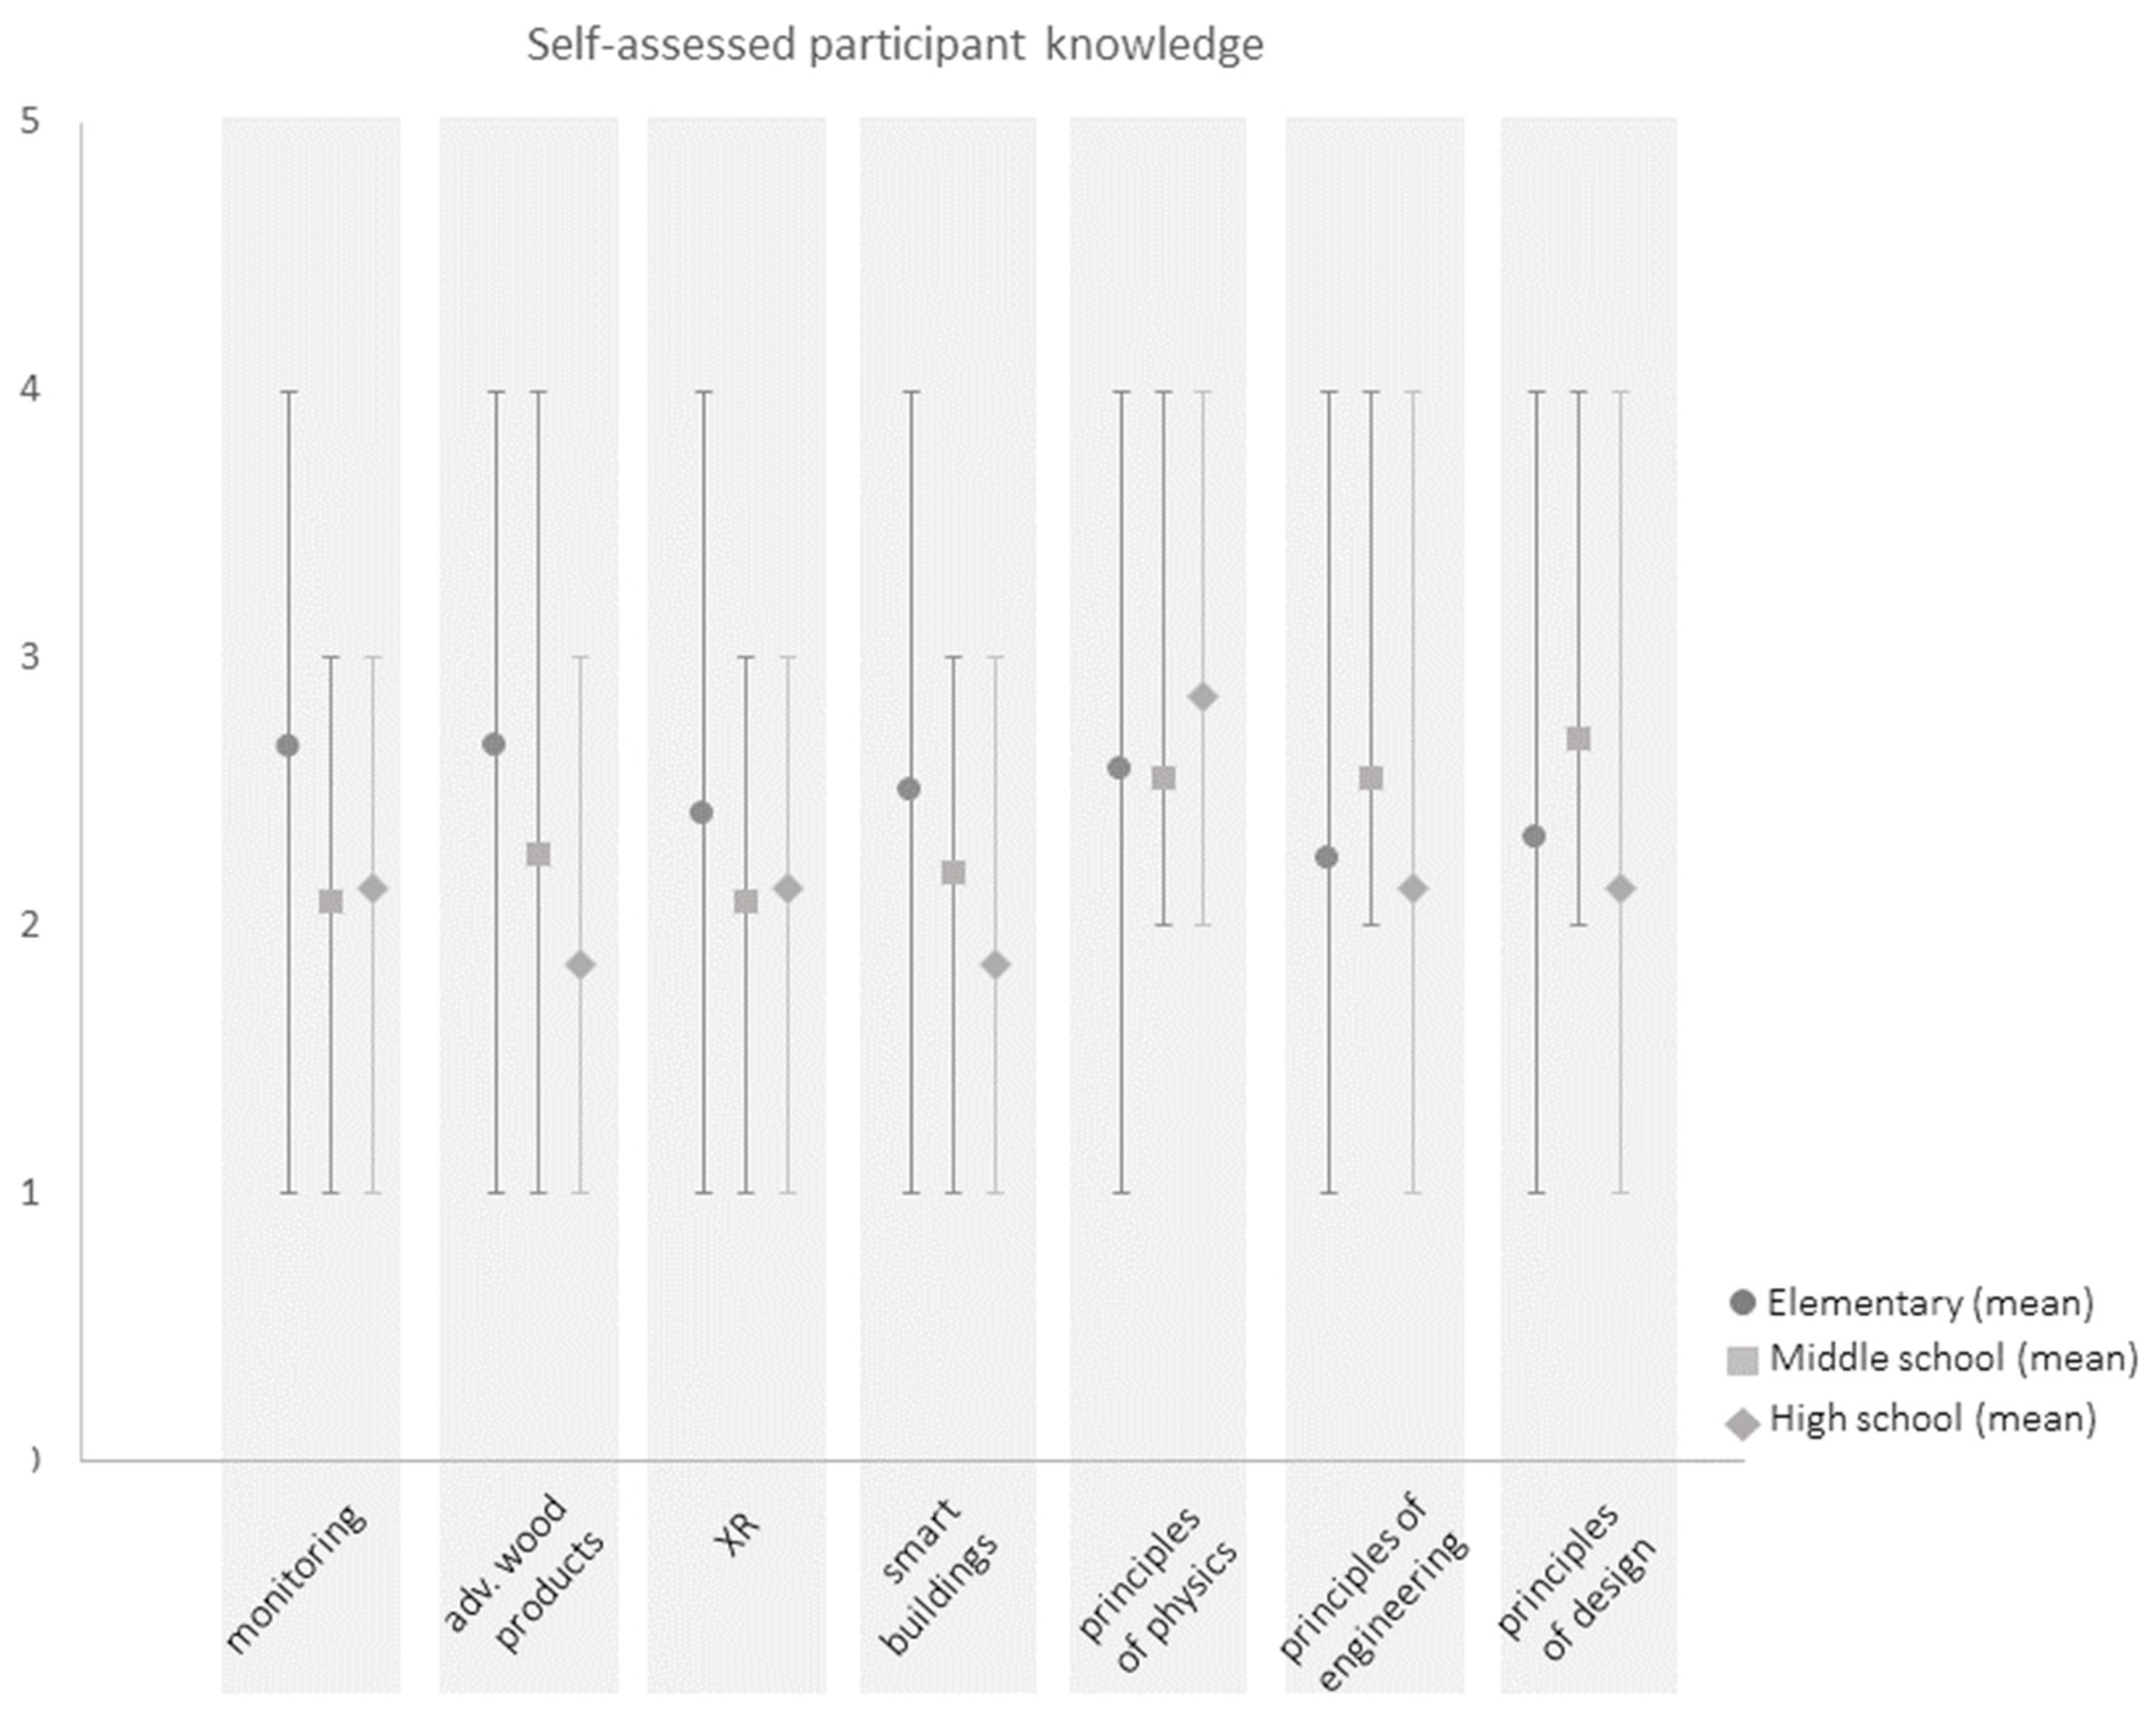
Additionally, across the board, participants reported moderate knowledge of design principles and building/construction principles, as well as basic principles of physics as applied to the built environment and construction projects in general. The same applied to monitoring of building performance, advanced wood products, teaching and learning in cross-reality environments, and smart buildings as contexts for teaching and learning (Figure 5).
4.3. Perceived Pedagogical Value of Study Content
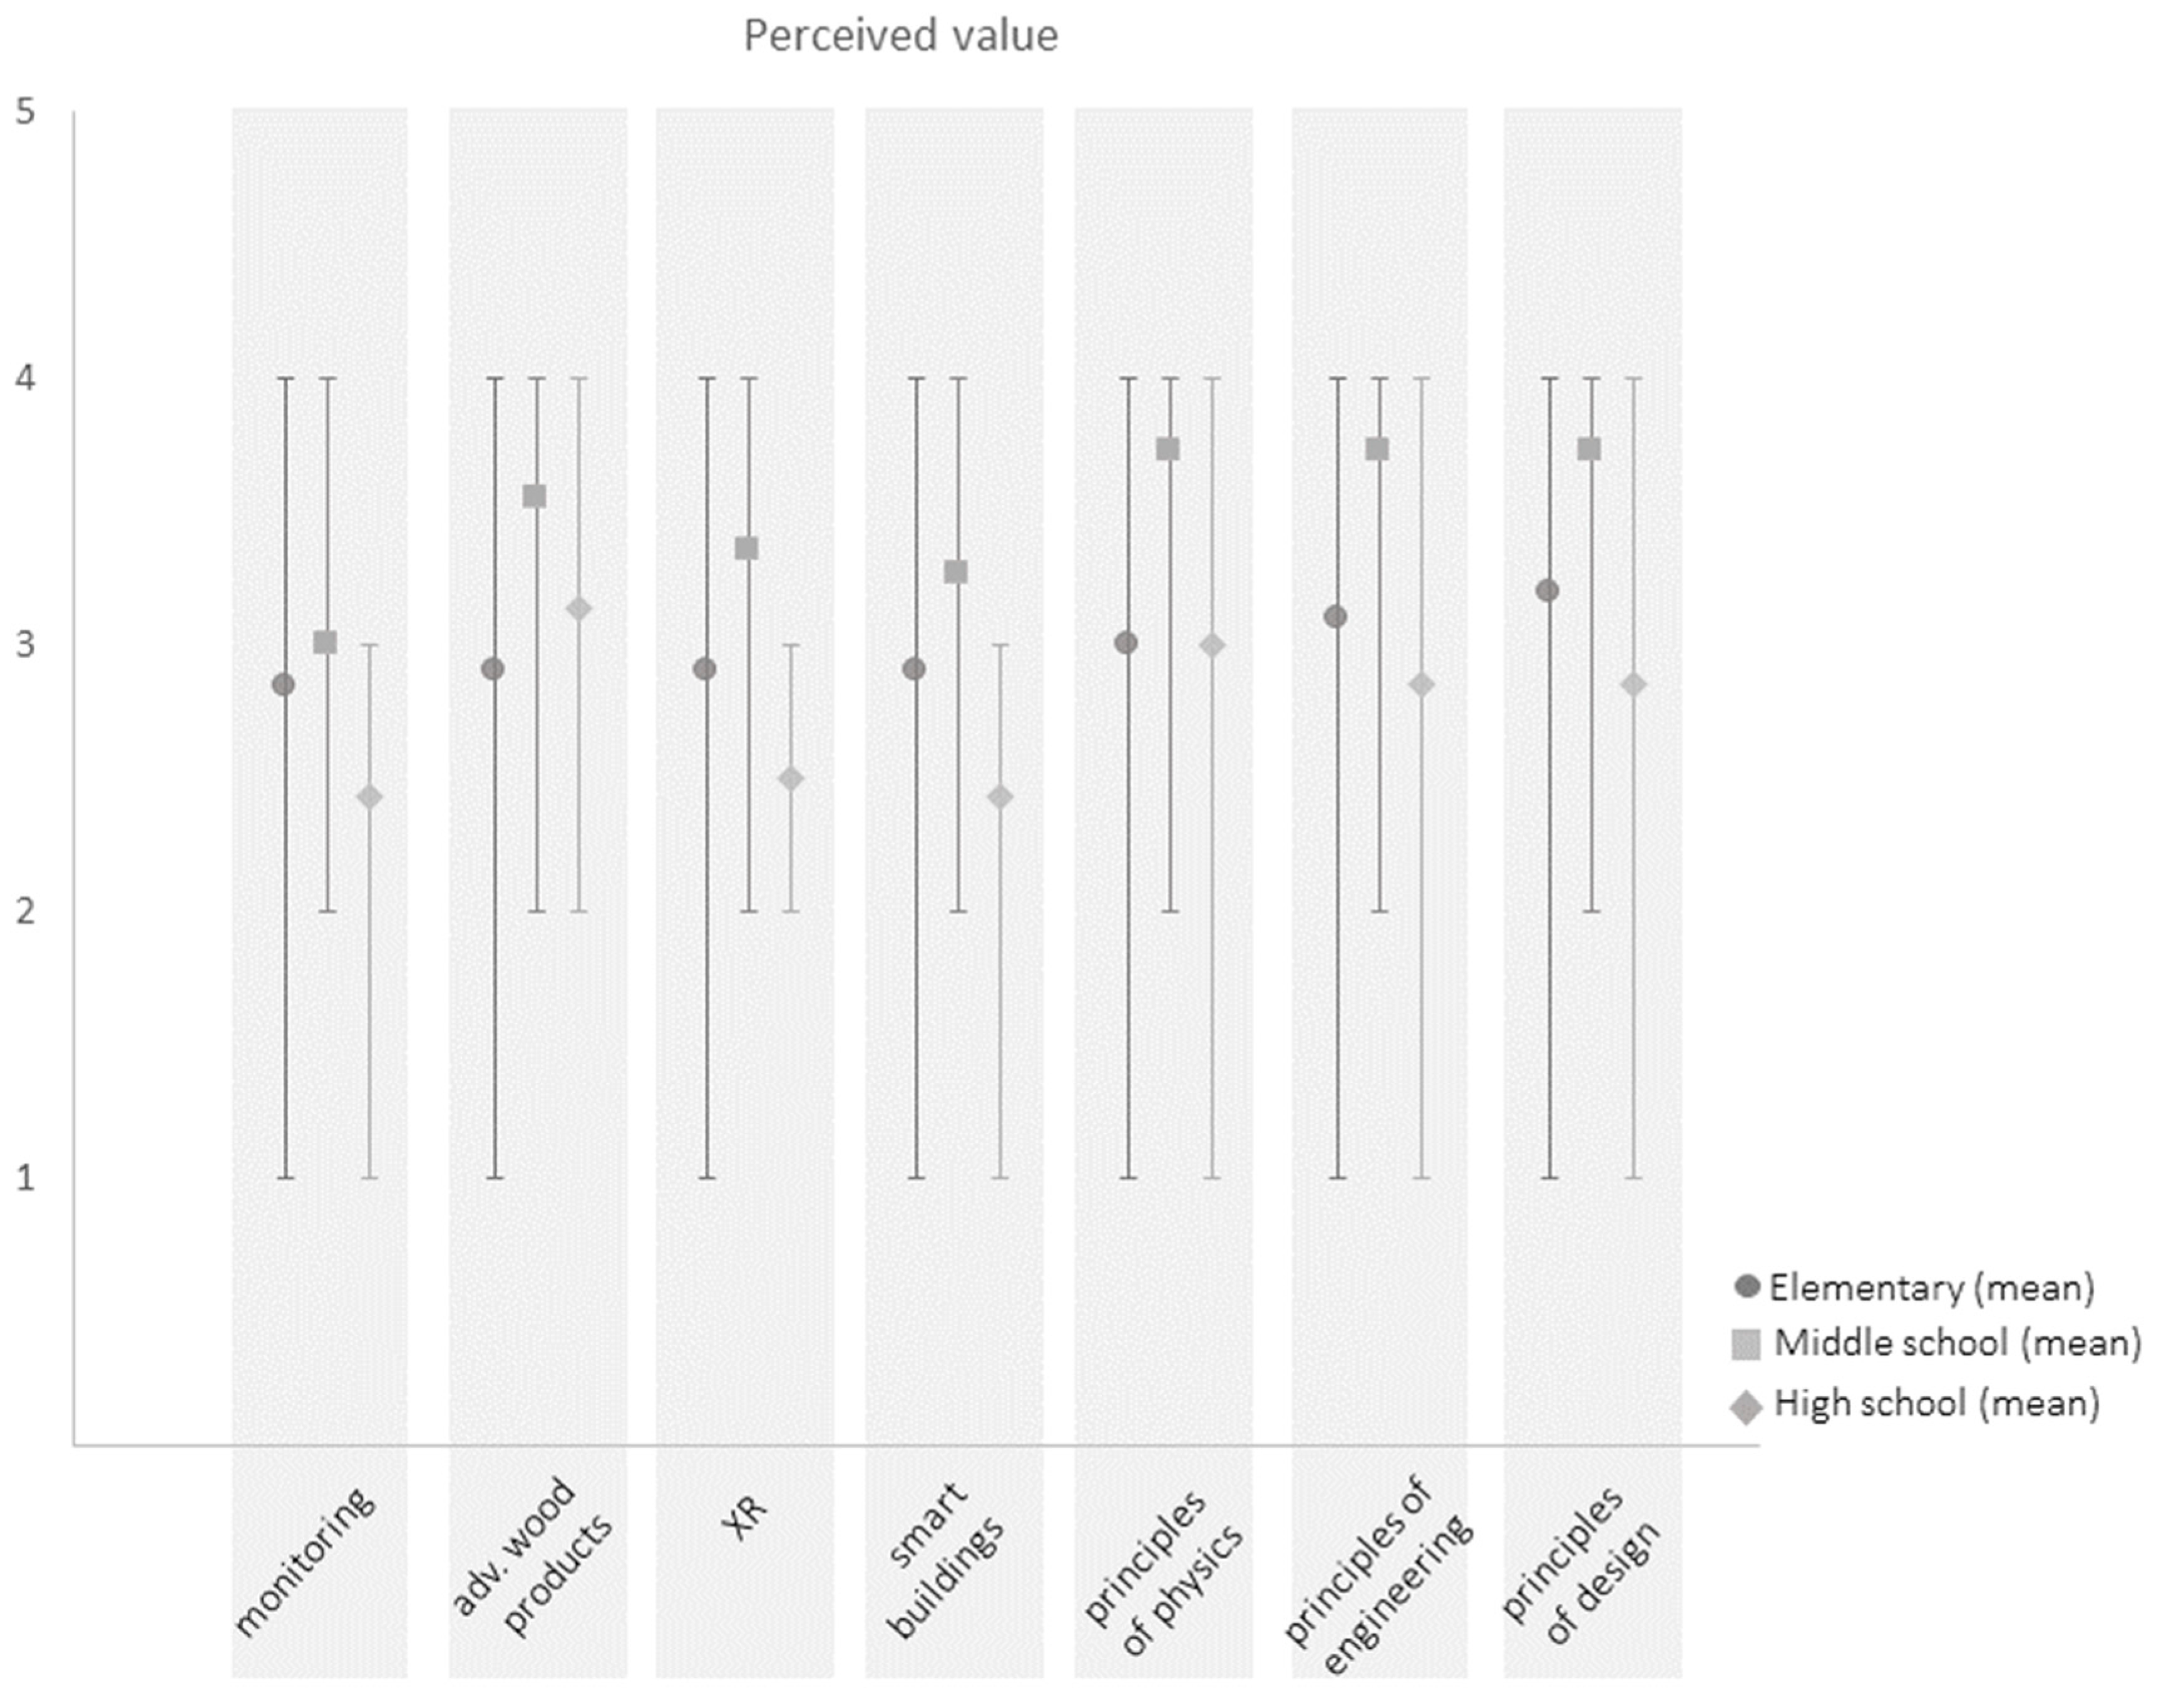
As Figure 6 demonstrates, middle and elementary school teachers in this sample were slightly more likely than high school teachers to see value in the use of sensors, smart building data, or cross-reality platforms in general to their students and to teaching engineering, physics, and design principles though this result was not statistically significant.
Finally, teachers were asked to rank three different cross-reality platforms (e.g., virtual tours, augmented reality view finders, projections of data on physical aspects of the building) in terms of their value in the content areas described in Section 3.2.3. Though not rising to the level of statistical significance in Spearman correlations, across each of the four measures above, middle school teachers ranked all cross-reality platforms (view finders, virtual tours, and projections) more highly (Mean = 3.65) than did elementary (Mean = 3.10) or high school (Mean = 3.11) teachers in terms of their use and value for supporting student learning. While teachers’ ratings express different affordances and constraints for each of the applications in terms of how it might support learning, all teachers, regardless of grade level, showed a preference for the AR View Finder application over the XR Projection of data on building spaces or a VR Tour on all four measures. These findings suggest that handheld AR applications whereby the viewer can see visualizations of data projected on the part of the building seen in the smartphone or tablet window may be seen by teachers as having more value than actual projections of data on the physical space of the building or VR tours of the building, a finding that resonates with industry research, showing that even younger audiences (ages 16–44) are more familiar with and likely to use AR than VR [84].
5. Discussion
Findings of this study have been analyzed to address our original research questions:
- How do grades 4–12 teachers assess their knowledge of the use of basic principles of physics, engineering, and engineering design in teaching BECE content and processes?
- How familiar are grades 4–12 teachers with use of sensors, sensor data from smart buildings, and XR environments in teaching and learning?
- How do grades 4–12 teachers assess their knowledge of the use of sensors, sensor data from SMART buildings, and XR environments in teaching physics, engineering, and engineering design?
- What is the perceived value of sensors, sensor data from smart buildings, and XR environments in teaching and learning physics, engineering and design among grades 4–12 teachers?
To address research question one, in rating their knowledge of the use of basic principles of physics, engineering, and engineering design in teaching BECE content and processes, all teachers reported moderate knowledge in all three disciplinary areas. High school teachers reported higher knowledge relative to basic principles of physics than their elementary or middle school counterparts, while middle school teachers reported higher knowledge relative to the use of basic principles of engineering design. Teachers who demonstrate knowledge of principles of engineering should be able to “analyze data acquisition methods in engineering” [85]. The fact that all the teachers in this sample reported moderate familiarity and knowledge relative to sensor technology and monitoring suggests that there is already a relatively strong foundation in the knowledge base of grade 4–12 instructors for incorporation of XR to teach data literacy skills within the context of BECE topics and careers. Upon this, professional development opportunities can build data acquisition and analysis skills for teachers. Similarly, they can be provided with the pedagogical skills necessary to integrate those into STEM curriculum in their classrooms and informal teaching/learning contexts.
Relative to this finding, professional development programs seeking to build on sensor technology as a way of developing data literacy might benefit from considering ways to integrate engineering content and processes with science and math curriculum. Donna [86], for instance, offers a research-based model of professional development for K-12 Educators that promotes engineering design as an integrated pedagogy “to help educators to apply concepts and processes from within and across STEM domains” (p. 1). Donna’s model suggests professional development activities that are “sustained, job-embedded, and collegial” to foster collaborations, reviewing multiple studies using engineering design in an integrated approach to instruction and synthesizing existing engineering education programs to reach the classroom. If such an approach is widely adopted, we predict an increase in the perceived value of sensors and XR data visualization tools in teaching across multiple STEM domains in high school, which may in turn support greater recruitment of students into STEM majors at the college level.
In terms of questions two and three, all the teachers reported moderate familiarity with the use of sensors for building monitoring and the use of XR platforms for teaching and learning, but elementary teachers assessed their knowledge relative to the use of sensor data from monitoring, the particular study context (advanced wood products in building and construction), and XR platforms more highly than either middle school or high school teachers. One explanation is that the SMILE program elementary teachers might have received previous, additional training relative to XR environments for teaching and learning. SMILE program leadership confirmed, however, that elementary teachers had not received previous additional professional development including XR contexts, so in terms of the program professional development, all teachers should have had the same previous experiences. In this sample, elementary (grade 4) educators were not younger as a group than the whole, but age itself was negatively correlated to familiarity with XR as a teaching and learning context. As “digital natives,” younger teachers may be more familiar with XR contexts from gaming, phone apps, and popular culture including museum exhibits, advertising and marketing, and university classrooms. While exact demographics are hard to come by in the peer-reviewed literature, industry reports suggest that AR/VR awareness and use is definitely higher for people aged 16–44 than for people aged 45–54 or 55–64 [84].
In addressing questions of perceived value for teaching and learning, research question four, all teachers assessed sensor applications, use of the built environment, and XR platforms as moderately to highly valuable for themselves and their students. This suggests that there would be interest in ongoing, more advanced professional development to develop and use curriculum in these areas. There was slightly higher expressed value across grade levels in the use of advanced wood products in building than in sensors themselves or XR environments. This may be because forestry and timber related industry were historically one of the most significant economic drivers for Oregon and remain so for rural Oregon communities like those represented in this sample [87].
Among the three discipline areas (physics, engineering, and design), elementary and middle school teachers appear to see the most value in using sensors in the built environment and XR interfaces for the data across all three, while high-school teachers appear to be primarily interested in the value of using these technologies to teach basic principles of physics. One explanation we explored for this difference was variation in the disciplinary backgrounds between high-school and elementary/middle school teachers on the assumption that more of the high-school teachers might have disciplinary backgrounds and education in STEM areas than elementary or middle school teachers. However, in this sample, there was no correlation between disciplinary background represented by undergraduate or graduate degree discipline and perceived value of the use of sensors, sensor data, or XR tools for teaching and learning.
Middle school teachers were more likely than either elementary or high-school teachers to see value in using XR contexts for teaching and learning. Early exposure to engineering topics has proved to be effective in developing positive engineering identity in preadolescents [88,89]. However, a lack of curricular continuity, especially relative to BECE concepts and careers from elementary to secondary education, could potentially limit exposure of high school students to emerging BECE concepts and methods, thus hindering career awareness and interest among a new generation of professionals in this sector. The present recorded attitudes of teachers are promising indicators that XR technology may be able to address this gap in continuity. By supplying classrooms and out of school contexts with new tools designed to promote engagement and accessibility of real operational contexts, net student engagement with practical data and use-cases for the content they are learning about can be strongly enhanced.
This study was carried out on a small sample of 4th to 12th grade teachers from one particular afterschool STEM program serving primarily rural, low-income communities in the U.S. Pacific Northwest. Many of the teachers have experienced multiple years of professional development in a wide range of STEM topics as part of their participation (participants had worked with the program an average of 5 years at the time of the study). Care should, thus, be taken in extrapolating findings to K-12 teachers in general or afterschool program leaders in general. That said, we believe teachers who also run afterschool programs may represent a valuable audience and context for research related to use of novel technologies for teaching and learning. Afterschool programming is an important component of the STEM education landscape in the US. In 2014 (the last year for which full reports exist), over 15 million US students participated in afterschool programming. This number has historically risen by about 3% every 5 years, so it is reasonable to assume that it has grown to nearly 20 million by 2020. Moreover, 1 in 5 families in the US report that at least one child in the household participates in afterschool programming, and nearly 70% of those programs deliver STEM curricula [90]. Afterschool programs, therefore, represent a substantial contribution for many students, especially students from communities underrepresented in STEM careers [90]. While not all afterschool leaders and facilitators are also trained educators or working teachers, there is evidence to suggest that the professional development teachers receive relative to their afterschool teaching does influence their classroom teaching [91]. Thus, we believe the findings do represent an important element of STEM programming at large as well as point to useful strategies for the incorporation of XR tools for data visualization and use of sensor data from the built environment in classroom and afterschool curricula in ways that can directly benefit learners. Our own future research aims to better understand how teachers and students may put XR data from smart buildings to work developing specific skills relative to big data and STEM as well as what structural constraints and affordances exist for implementing such XR experiences broadly in classrooms at different grade level, teacher experience level, and disciplinary context.
6. Conclusions
As K-12 engineering education evolves, school administrators, educators, and policymakers must consider the capacity of a country’s education system to meet current and anticipated knowledge and training needs for K-12 STEM teachers in order to be effective. This study involving a group of 4th to 12th grade STEM teachers participating in professional development related to their leading afterschool STEM programs for underrepresented youth in rural communities is a contribution in a wider discussion on capacity building in upper elementary through high school engineering education. The study is aimed at understanding teachers’ knowledge of and perceived value attributed to the use of XR and sensor data from the built environment to engage students in STEM learning. The tools were presented as a solution that can synthesize realistic engineering application scenarios and facilitate development of data literacy skills, knowledge of physics principles, and engineering literacy. This is relevant, as engineering education is often presented as a vehicle for integrated STEM learning, contextualizing concepts and contents of the other three STEM subjects [92,93]. In addition, we evaluated possible venues and delivery methods within fourth to twelfth grade programs to improve students’ college and career readiness in BECE-related fields. Findings show that, while all teachers reported relatively high interest in learning about sensor applications and innovative interactive techniques, middle school teachers in the examined sample were most likely to see value in using these applications for teaching. This is relevant as for some students, experiencing engineering in elementary and middle school may be a key determinant for their decisions about career and college education paths [6]. Additionally, the use of immersive visualization environments promotes engagement with educational content, encouraging and supporting learning for students not typically engaged in STEM [94]. Thus, the impacts of XR mediated out-of-school experiences in integrated STEM efforts may be even larger for learners from low-income and rural communities underrepresented in STEM [95,96].
Author Contributions
Conceptualization, all authors; methodology, M.R., S.R.; formal analysis, S.R.; investigation, S.R., M.R., R.D.A.; data curation, S.R., S.R.R.; writing—original draft preparation, M.R., S.R.; writing—review and editing, R.D.A., S.R.R. All authors have read and agreed to the published version of the manuscript.
Funding
The paper has no external funding.
Acknowledgments
We wish to acknowledge the SMILE (Science & Math Investigative Learning Experiences) precollege program at Oregon State University for their logistical support as well as all the teachers who participated.
Conflicts of Interest
The authors declare no conflict of interest.
References
- NGSS Lead States. Next Generation Science Standards: For States, by States; National Academies Press: Washington, DC, USA, 2013. [Google Scholar]
- Ozfidan, B.; de Miranda, M.A. K12 Teacher Credentialing Containing Engineering Content in the USA. Eurasia J. Math. Sci. Technol. Educ. 2018, 14, 3–13. [Google Scholar] [CrossRef]
- Moye, J.J. Technology education teacher supply and demand—A critical situation. Technol. Eng. Teach. 2009, 69, 30–36. [Google Scholar]
- Bybee, R.W.; Loucks-Horsley, S. Achieving technology education: The role of professional development. Technol. Teach. 2000, 60, 31–34. [Google Scholar]
- National Academy of Engineering (NAE); National Research Council (NRC). Engineering in K–12 Education: Understanding the Status and Improving the Prospects; National Academies Press: Washington, DC, USA, 2009. [Google Scholar]
- Tai, R.H.; Liu, C.Q.; Maltese, A.V. Planning Early for Careers in Science. Science 2006, 26, 1143–1144. [Google Scholar] [CrossRef] [PubMed] [Green Version]
- Brown, J.S.; Collins, A.S.; Duguid, P. Situated cognition and the culture of learning. Educ. Res. 1989, 18, 32–42. [Google Scholar] [CrossRef]
- Shulman, L.S. If not now, when? the timeliness of scholarship of the education of engineers. J. Eng. Educ. 2005, 94, 11–12. [Google Scholar] [CrossRef]
- Lattuca, L.R.; Terenzini, P.T.; Volkwein, J.F.; Peterson, G.D. The changing face of engineering education. Bridge Wash. Natl. Acad. Eng. 2006, 36, 5. [Google Scholar]
- Duderstadt, J.J. Engineering for a changing world. In Holistic Engineering Education; Springer: New York, NY, USA, 2010; pp. 17–35. [Google Scholar]
- Hoeg, D.G.; Bencze, J.L. Values underpinning STEM education in the USA: An analysis of the Next Generation Science Standards. Sci. Educ. 2017, 101, 278–301. [Google Scholar] [CrossRef]
- Kjelvik, M.K.; Schultheis, E.H. Getting Messy with Authentic Data: Exploring the Potential of Using Data from Scientific Research to Support Student Data Literacy. CBE Life Sci Educ. 2019, 18, es2. [Google Scholar] [CrossRef]
- Wolff, A.; Wermelingera, M.; Petrea, M. Exploring design principles for data literacy activities to support children’s inquiries from complex data. Int. J. Hum. Comput. Stud. 2019, 129, 41–54. [Google Scholar] [CrossRef] [Green Version]
- Wolff, A.; Gooch, D.; Cavero Montaner, J.J.; Rashid, U.; Kortuem, G. Creating an understanding of data literacy for a data-driven society. J. Community Inform. 2016, 12, 9–26. [Google Scholar]
- Finzer, W. The data science education dilemma. Technol. Innov. Stat. Educ. 2013, 7. [Google Scholar]
- Baumer, B. A data science course for undergraduates: Thinking with data. Am. Stat. 2015, 69, 334–342. [Google Scholar] [CrossRef] [Green Version]
- Claro, M.; Salinas, A.; Cabello-Hutt, T.; San Martín, E.; Preiss, D.D.; Valenzuela, S.; Jara, I. Teaching in a digital environment (TIDE): Defining and measuring teachers’ capacity to develop students’ digital information and communication skills. Comput. Educ. 2018, 121, 162–174. [Google Scholar] [CrossRef]
- National Academies of Sciences, Engineering, and Medicine. Data Science for Undergraduates: Opportunities and Options; National Academies Press: Washington, DC, USA, 2018. [Google Scholar]
- Morrison, J.; McDuffie, A.R. Connecting science and mathematics: Using inquiry investigations to learn about data collection, analysis, and display. Sch. Sci. Math. 2009, 109, 31–44. [Google Scholar] [CrossRef]
- Konold, C.E.; Coulter, R.; Feldman, A. Engaging students with data. Learn. Lead. Technol. 2000, 28, 50–55. [Google Scholar]
- Bowen, G.M.; Roth, W.M. Data and graph interpretation practices among preservice science teachers. J. Res. Sci. Teach. 2005, 42, 1063–1088. [Google Scholar] [CrossRef]
- Cooper, M.M.; Caballero, M.D.; Ebert-May, D.; Fata-Hartley, C.L.; Jardeleza, S.E.; Krajcik, J.S.; Underwood, S.M. Challenge faculty to trans-form STEM learning. Science 2015, 350, 281–282. [Google Scholar] [CrossRef]
- Wilson, S.M. Professional development for science teachers. Science 2013, 340, 310–313. [Google Scholar] [CrossRef]
- De Amicis, R.; Riggio, M.; Shahbaz Badr, A.; Fick, J.; Sanchez, C.A.; Prather, E.A. Cross-reality environments in smart buildings to advance STEM cyberlearning. Int. J. Interact. Des. Manuf. IJIDeM 2019, 13, 331–348. [Google Scholar] [CrossRef]
- Santos, L.; Escudeiro, P.; de Carvalho, C.V. Evaluating virtual experiential learning in engineering. In Proceedings of the 2013 International Conference on Interactive Collaborative Learning (ICL), Kazan, Russia, 25–27 September 2013; pp. 42–48. [Google Scholar] [CrossRef]
- Radu, I. Augmented reality in education: A meta-review and cross-media analysis. Pers. Ubiquit. Comput. 2014, 18, 1533–1543. [Google Scholar] [CrossRef]
- Jowallah, R.; Bennett, L.; Bastedo, K. Leveraging the Affordances of Virtual Reality Systems within K-12 Education: Responding to Future Innovations. FDLA J. 2018, 3, 7. [Google Scholar]
- Sepasgozar, S.M. Digital Twin and Web-Based Virtual Gaming Technologies for Online Education: A Case of Construction Management and Engineering. Appl. Sci. 2020, 10, 4678. [Google Scholar] [CrossRef]
- Maas, M.J.; Hughes, J.M. Virtual, augmented and mixed reality in K–12 education: A review of the literature. Technol. Pedagog. Educ. 2020, 29, 231–249. [Google Scholar] [CrossRef]
- Chou, C.C.; Hoisington, D.A. Promises and Constraints of Virtual Reality Integration: Perceptions from Pre-Service Teachers and K-12 Students. In Proceedings of the 2018 IEEE 18th International Conference on Advanced Learning Technologies (ICALT), Mumbai, India, 9–13 July 2018. [Google Scholar]
- Tinker, R. A History of Probeware. 2002. Available online: https://pdfs.semanticscholar.org/9437/4588f120cb1c73abf7da98a7ff93e0b75991.pdf?_ga=2.127245645.193416509.1594438142-880467758.1594438142 (accessed on 10 July 2020).
- Brassell, H. The effect of real-time laboratory graphing on learning graphic representations of distance and velocity. J. Res. Sci. Teach. 1987, 24, 385–395. [Google Scholar] [CrossRef]
- Mokros, J.; Tinker, R. The impact of microcomputer-based labs on children’s ability to interpret graphs. J. Res. Sci. Teach. 1987, 24, 369–383. [Google Scholar] [CrossRef]
- Russell, D.W.; Lucas, K.B.; McRobbie, C.J. Role of the microcomputer-based laboratory display in supporting the construction of new understandings in thermal physics. J. Res. Sci. Teach. 2004, 4, 165–185. [Google Scholar] [CrossRef]
- Metcalf, S.; Tinker, R.F. Probeware and handhelds in elementary and middle school science. J. Sci. Educ. Technol. 2004, 13, 43–49. [Google Scholar] [CrossRef]
- Zucker, A.A.; Tinker, R.; Staudt, C.; Mansfield, A.; Metcalf, S. Learning Science in Grades 3–8 Using Probeware and Computers: Findings from the TEEMSS II Project. J. Sci. Educ. Technol. 2008, 17, 42–48. [Google Scholar] [CrossRef]
- Martin, F.G.; Greenwood, A. Developing teachers’ understanding of the nature of scientific inquiry with embedded data collection materials. In Proceedings of the Annual meeting of the Association for Science Teacher Education, Clearwater, FL, USA, 8 January 2007. [Google Scholar]
- Espinoza, E. The use of graphical analysis with microcomputer-based laboratories to implement inquiry as the primary mode of learning science. J. Educ. Technol. Syst. 2007, 2007. 36, 315–335. [Google Scholar] [CrossRef]
- Maeng, J.L.; Mulvey, B.K.; Smetana, L.K.; Bell, R.L. Preservice teachers’ TPACK: Using technology to support inquiry instruction. J. Sci. Educ. Technol. 2013, 22, 838–857. [Google Scholar] [CrossRef]
- Cook, D.J.; Holder, L.B. (Eds.) Mining Graph Data; John Wiley & Sons: Hoboken, NJ, USA, 18 December 2006. [Google Scholar]
- Deniz, H.; Dulger, M.F. Supporting Fourth Graders’ Ability to Interpret Graphs through Real-Time Graphing Technology: A Preliminary Study. J. Sci. Educ. Technol. 2012, 21, 652–660. [Google Scholar] [CrossRef]
- Phipps, M.; Rowe, S. Seeing satellite data. Public Underst. Sci. 2010, 19, 311–321. [Google Scholar] [CrossRef] [Green Version]
- Grosslight, L.; Unger, C.; Jay, E.; Smith, C.L. Understanding models and their use in science: Conceptions of middle and high school students and experts. J. Res. Sci. Teach. 1991, 28, 799–822. [Google Scholar] [CrossRef]
- Treagust, D.F.; Chittleborough, G.; Mamiala, T.L. Students’ understanding of the role of scientific models in learning science. Int. J. Sci. Educ. 2002, 24, 357–368. [Google Scholar] [CrossRef]
- Gobert, J.D.; Pallant, A. Fostering students’ epistemologies of models via authentic model-based tasks. J. Sci. Educ. Technol. 2004, 13, 7–22. [Google Scholar] [CrossRef]
- Melendy, R.F. Collegiate Student’s Epistemologies and Conceptual Understanding of the Role of Models in Precalculus Mathematics: A Focus on the Exponential and Logarithmic Functions. Ph.D. Thesis, Oregon State University, Corvallis, OR, USA, 2008. [Google Scholar]
- Barton, R. How Do Computers Affect Graphical Interpretation? Sch. Sci. Rev. 1997, 79, 55. [Google Scholar]
- Nicolaou, C.; Nicolaidou, I.; Zacharia, Z.; Constantinou, C. Fourth graders ability to interpret graphical representations through the use of microcomputer-based labs implemented within an inquiry-based activity sequence. J. Comput. Math. Sci. Teach. 2007, 26, 75–99. [Google Scholar]
- Napolitano, R.; Blyth, A.; Glisic, B. Virtual Environments for Visualizing Structural Health Monitoring Sensor Networks, Data, and Metadata. Sensors 2018, 18, 243. [Google Scholar] [CrossRef] [Green Version]
- Petersen, J.; Murray, M.E.; Platt, G.; Shunturov, V. Using buildings to teach environmental stewardship: Realtime display of environmental performance as a mechanism for educating, motivating and empowering the student body. In Proceedings of the Greening the Campus VI, Ball State University, Muncie, IN, USA, 6–8 September 2007. [Google Scholar]
- Buckman, A.H.; Mayfield, M.; Beck, S.B. What is a Smart Building? Smart Sustain. Built Environ. 2014, 3, 92–109. [Google Scholar] [CrossRef]
- Carlson, L.E.; Sullivan, J.F. Hands-on Engineering: Learning by Doing: Learning by doing in the integrated teaching and learning program. Int. J. Eng. Educ. 1999, 15, 20–31. [Google Scholar]
- Petersen, J.; Frantz, V.; Shammin, R. Using sociotechnical feedback to engage, educate, motivate and empower environmental thought and action. Solutions 2014, 5, 79–87. [Google Scholar]
- Petersen, J.E.; Rosenberg, D.D.; Frantz, C.; Shammin, R. Environmental Dashboard: Fostering pro-environmental and pro-community thought and action through feedback. In Handbook of Theory and Practice of Sustainable Development in Higher Education; Leal, F.W., Skanavis, C., do Paco, A., Rogers, J., Kuznetsova, O., Castro, P., Eds.; Springer: Berlin, Germany, 2017; pp. 149–168. [Google Scholar]
- Flynn, O. Designing for Environmental Stewardship in Formal and Non-Formal Learning. Bachelor’s Thesis, University of Colorado Boulder, Boulder, CO, USA, 2017. [Google Scholar]
- Fickes, M. Campus Buildings that Teach Lessons. Coll. Plan. Manag. 2002, 5, 14–18. [Google Scholar]
- Clark, S.; Petersen, J.E.; Frantz, C.; Roose, D.; Ginn, J.; Rosenberg, D.D. Teaching systems thinking to 4th and 5th graders using Environmental Dashboard display technology. PLoS ONE 2017, 12, e0176322. [Google Scholar] [CrossRef]
- Lehrer, D.; Vasudev, J. Visualizing Information in Commercial Buildings: A Study of Tools, Expert Users, and Building Occupants. In Final Report to California Energy Commission-PIER Program; UC Berkeley: Berkeley, CA, USA, 2011; p. 41. [Google Scholar]
- Chandler, T.; Cordeil, M.; Czauderna, T.; Dwyer, T.; Glowacki, J.; Goncu, C.; Klapperstueck, M.; Klein, K.; Marriott, K.; Schreiber, F.; et al. Immersive Analytics; Institute of Electrical and Electronics Engineers (IEEE): Piscataway, NJ, USA, 2015; pp. 1–8. [Google Scholar]
- Liu, D.; Dede, C.; Huang, R.; Richards, J.; Liu, D.; Dede, C.; Huang, R.; Richards, J. Virtual, Augmented, and Mixed Realities in Education; Springer: Singapore, 2017. [Google Scholar]
- Feiner, S.; MacIntyre, B.; Höllerer, T.; Webster, A. A Touring Machine: Prototyping 3D Mobile Augmented Reality Systems for Exploring the Urban Environment. Pers. Technol. 1997, 1, 208–217. [Google Scholar] [CrossRef] [Green Version]
- Slay, H.; Phillips, M.; Vernik, R.; Thomas, B. Interaction Modes for Augmented Reality Visualization. In Proceedings of the 2001 Asia-Pacific Symposium on Information Visualisation, Sydney, Australia, 3–4 December 2001. [Google Scholar]
- Bell, B.; Höllerer, T.; Feiner, S. An Annotated Situation-Awareness Aid for Augmented Reality. In Proceedings of the 15th Annual ACM Symposium on User Interface Software and Technology, Paris, France, 27–30 October 2002. [Google Scholar]
- Höllerer, T.; Feiner, S. Mobile augmented reality. In Telegeoinformatics: Location-Based Computing and Services; Taylor and Francis Books Ltd.: London, UK; Haarlem, The Netherlands, 2004. [Google Scholar]
- Langlotz, T.; Nguyen, T.; Schmalstieg, D.; Grasset, R. Next-Generation Augmented Reality Browsers: Rich, Seamless, and Adaptive. In Proceedings of the IEEE; Institute of Electrical and Electronics Engineers (IEEE): Piscataway, NJ, USA, 2014. [Google Scholar]
- Drascic, D.; Milgram, P. Perceptual Issues in Augmented Reality. In Stereoscopic Displays and Virtual Reality Systems III.; SPIE: Washington, DC, USA, 1996; Volume 2653, pp. 123–134. [Google Scholar]
- Pirolli, P.; Card, S. The sensemaking process and leverage points for analyst technology as identified through cognitive task analysis. In Proceedings of the 2005 International Conference on Intelligence Analysis, McLean, VA, USA, 2–6 May 2005. [Google Scholar]
- Simões, B.; De Amicis, R.; Barandiaran, I.; Posada, J. Cross reality to enhance worker cognition in industrial assembly operations. Int. J. Adv. Manuf. Technol. 2019, 105, 3965–3978. [Google Scholar] [CrossRef] [Green Version]
- Simões, B.; De Amicis, R.; Barandiaran, I.; Posada, J. x-reality system architecture for industry 4.0 processes. Multimodal Technol. Interact. 2018, 2, 72. [Google Scholar] [CrossRef] [Green Version]
- Paradiso, J.A.; Landay, J.A. Guest Editors’ Introduction: Cross-Reality Environments. IEEE Pervasive Comput. 2009, 8, 14–15. [Google Scholar] [CrossRef]
- Chang, C.Y.; Lai, S.L. Applied Situated Learning Theory to Investigate Effect of Global Warming Awareness Education in College—Quantitative Case Study with Experimental Design. Adv. Mater. Res. 2012, 524, 2490–2495. [Google Scholar] [CrossRef]
- Kakavelakis, K.; Edwards, T. Situated learning theory and agentic orientation: A relational sociology approach. Manag. Learn. 2012, 43, 475–494. [Google Scholar] [CrossRef]
- Kruijff, E.; Swan, E.J.; Feiner, S. Perceptual issues in Augmented Reality Revisited. In Proceedings of the 2010 IEEE International Symposium on Mixed and Augmented Reality, Seoul, Korea, 13–16 October 2010. [Google Scholar]
- Wu, H.-K.; Lee, S.W.-Y.; Chang, H.-Y.; Liang, J.-C. Current Status, Opportunities and Challenges of Augmented Reality in Education. Comput. Educ. 2013, 62, 41–49. [Google Scholar] [CrossRef]
- Kamarainen, A.M.; Metcalf, S.; Grotzer, T.; Browne, A.; Mazzuca, D.; Tutwiler, M.S.; Dede, C. EcoMOBILE: Integrating augmented reality and probeware with environmental education field trips. Comput. Educ. 2013, 68, 545–556. [Google Scholar] [CrossRef] [Green Version]
- Mann, S.; Furness, T.; Yuan, Y.; Iorio, J.; Wang, Z. All Reality: Virtual, Augmented, Mixed (X), Mediated (X, Y), and Multimediated Reality. arXiv 2018, arXiv:1804.08386. [Google Scholar]
- Schnabel, M.A. Interplay Of Domains. In Mixed Reality in Architecture, Design And Construction; Wang, X., Schnabel, M.A., Eds.; Springer: Dordrecht, The Netherlands, 2009; pp. 219–226. [Google Scholar]
- Agarwal, S. Review on Application of Augmented Reality in Civil Engineering. Presented at the International Conference on Inter Disciplinary Research in Engineering and Technology 2016 (ICIDRET 2016). Available online: https://www.researchgate.net/publication/296676040_Review_on_Application_of_Augmented_Reality_in_Civil_Engineering (accessed on 7 July 2020).
- Card, S.K.; Mackinlay, J.D.; Shneiderman, B. Readings in Information Visualization: Using Vision to Think; Morgan Kaufmann: San Francisco, CA, USA, 1999. [Google Scholar]
- Cook, K.A.; Thomas, J.J. Illuminating the Path: The Research and Development Agenda for Visual Analytics; Pacific Northwest National Laboratory (PNNL): Richland, WA, USA, 2005.
- Mustapha, G.; Khondoker, K.; Higgins, J. Structural Performance Monitoring Technology and Data Visualization Tools and Techniques—Featured Case Study: UBC Tallwood House. In Proceedings of the 1st International Conference on New Horizons in Green Civil Engineering (NHICE-01), Victoria, BC, Canada, 25–27 April 2018. [Google Scholar]
- Baas, E.J.; Riggio, M.; Schmidt, E.; Mugabo, I.; Barbosa, A.R. Living lab at Peavy Hall: Structural health monitoring of mass timber buildings. In Proceedings of the 5th International Conference on Structural Health Assessment of Timber Structures, Guimarães, Portugal, 25–27 September 2019. [Google Scholar]
- Yeh, K.C.; Tsai, M.H.; Kang, S.C. On-Site Building Information Retrieval by Using Projection-Based Augmented Reality. J. Comput. Civ. Eng. 2012, 26, 342–355. [Google Scholar] [CrossRef]
- Buckle, C. AR vs. VR: The Challenges and Opportunities in 2019. GlobalWebIndex. Available online: https://blog.globalwebindex.com/chart-of-the-week/augmented-virtual-reality/ (accessed on 20 July 2020).
- Pearson Education. Florida Teacher Certification Examinations: Engineering and Technology Education 6–12—Competencies and Skills and Blueprint. 2018. Available online: www.fl.nesinc.com/studyguide/FL_SG_obj_055.htm (accessed on 17 March 2020).
- Donna, J.D. A Model for Professional Development to Promote Engineering Design as an Integrative Pedagogy within STEM Education. J. Pre-Coll. Eng. Educ. Res. J-PEER 2012, 2, 2. [Google Scholar] [CrossRef] [Green Version]
- Oregon Secretary of State (n.d.). Oregon’s Economy: Employment. Oregon Blue Book; 2020. Available online: https://sos.oregon.gov/blue-book/Pages/facts/economy-employment.aspx (accessed on 21 July 2020).
- Capobianco, B.M.; French, B.F.; Diefes-Dux, H. Engineering Identity Development Among Pre-Adolescent Learners. J. Eng. Educ. 2012, 101, 698–716. [Google Scholar] [CrossRef]
- Yoon, S.Y.; Dyehouse, M.; Lucietto, A.M.; Diefes-Dux, H.A.; Capobianco, B.M. The effects of integrated science, technology, and engineering education on elementary students’ knowledge and identity development. Sch. Sci. Math. 2014, 114, 380–391. [Google Scholar] [CrossRef]
- Afterschool Alliance. America After 3pm: Afterschool Programs in Demand; Afterschool Alliance: Washington, DC, USA, 2014. [Google Scholar]
- Bottoms, S. Inside a School-University Partnership: Participation in a Community of Practice as Professional Growth. Ph.D. Thesis, Oregon State University, Corvallis, OR, USA, 2007. Available online: https://ir.library.oregonstate.edu/concern/graduate_thesis_or_dissertations/8w32r7945 (accessed on 10 August 2020).
- Moore, T.J.; Johnson, C.C.; Peters-Burton, E.E.; Guzey, S.S. The need for a STEM road map. In STEM Road Map: A Framework for Integrated STEM Education; Johnson, C.C., Peters-Burton, E.E., Moore, T.J., Eds.; Routledge: New York, NY, USA, 2015. [Google Scholar]
- Purzer, S.; Goldstein, M.H.; Adams, R.S.; Xie, C.; Nourian, S. An exploratory study of informed engineering design behaviors associated with scientific explanations. Int. J. STEM Educ. 2015, 2, 9. [Google Scholar] [CrossRef]
- Dabney, K.P.; Tai, R.H.; Almarode, J.T.; Miller-Friedmann, J.L.; Sonnert, G.; Sadler, P.M.; Hazari, Z. Out-of-School Time Science Activities and Their Association with Career Interest in STEM. Int. J. Sci. Educ. Part B 2012, 2, 63–79. [Google Scholar] [CrossRef]
- National Research Council (NRC). Learning Science in Informal Environments: People, Places, and Pursuits. In Committee on Learning Science in Informal Environments; National Academies Press: Washington, DC, USA, 2009. [Google Scholar]
- National Research Council (NRC). Division of Behavioral and Social Sciences and Education. Board on Science Education.Committee on Successful Out-of-School STEM Learning. In Identifying and Supporting Productive STEM Programs in Out-of-School Settings; National Academies Press: Washington, DC, USA, 2015. [Google Scholar]
Figure 1.
Sensor installation in Peavy Hall, Oregon State University (a). (b) Description of monitored phenomena and measured parameters (left) and a sensor installation (right).
Figure 1.
Sensor installation in Peavy Hall, Oregon State University (a). (b) Description of monitored phenomena and measured parameters (left) and a sensor installation (right).

Figure 2.
Connection of Structural Health Monitoring (SHM) phenomena and parameters with Next Generation Science Standards.
Figure 2.
Connection of Structural Health Monitoring (SHM) phenomena and parameters with Next Generation Science Standards.

Figure 3.
Disciplinary areas of participants identified by terminal degree subject.

Figure 4.
Familiarity with monitoring of building performance, advanced wood products, teaching and learning in cross-reality environments, smart buildings as contexts for teaching and learning, basic principles of physics as related to building/construction, basic principles of engineering as related to building/construction, and basic principles of design as related to building/construction. Mean, minimum, and maximum answers for all teachers (N = 33).

Figure 5.
Self-assessed participant knowledge of monitoring of building performance, advanced wood products, teaching and learning in cross-reality environments, smart buildings as contexts for teaching and learning, basic principles of physics as related to building/construction, basic principles of engineering as related to building/construction, and basic principles of design as related to building/construction by grade level taught. Mean, minimum, and maximum answers for teachers by grade level (N = 33).

Figure 6.
Perceived value for teachers and students of monitoring of building performance, advanced wood products, teaching and learning in cross-reality environments, smart buildings as contexts for teaching and learning, basic principles of physics as related to building/construction, basic principles of engineering as related to building/construction, and basic principles of design as related to building/construction by grade level taught. Mean, minimum, and maximum answers for teachers by grade level taught (N = 33).

© 2020 by the authors. Licensee MDPI, Basel, Switzerland. This article is an open access article distributed under the terms and conditions of the Creative Commons Attribution (CC BY) license (http://creativecommons.org/licenses/by/4.0/).
Share and Cite
MDPI and ACS Style
Rowe, S.; Riggio, M.; De Amicis, R.; Rowe, S.R. Teacher Perceptions of Training and Pedagogical Value of Cross-Reality and Sensor Data from Smart Buildings. Educ. Sci. 2020, 10, 234. https://doi.org/10.3390/educsci10090234
AMA Style
Rowe S, Riggio M, De Amicis R, Rowe SR. Teacher Perceptions of Training and Pedagogical Value of Cross-Reality and Sensor Data from Smart Buildings. Education Sciences. 2020; 10(9):234. https://doi.org/10.3390/educsci10090234
Chicago/Turabian StyleRowe, Shawn, Mariapaola Riggio, Raffaele De Amicis, and Susan R. Rowe. 2020. "Teacher Perceptions of Training and Pedagogical Value of Cross-Reality and Sensor Data from Smart Buildings" Education Sciences 10, no. 9: 234. https://doi.org/10.3390/educsci10090234
Note that from the first issue of 2016, this journal uses article numbers instead of page numbers. See further details here.