
A Bibliometric Mapping of Cost-Benefit Analysis—Three Decades of Studies


1
Department of Economics and Public Administration, School of Business Administration in Karvina, Silesian University in Opava, 733 40 Karvina, Czech Republic
2
School of Economics and Trade, Lanzhou University of Finance and Economics, Lanzhou 730080, China
*
Author to whom correspondence should be addressed.
Economies 2021, 9(3), 110; https://doi.org/10.3390/economies9030110
Submission received: 24 May 2021
/
Revised: 15 July 2021
/
Accepted: 21 July 2021
/
Published: 10 August 2021
Abstract
:Over time, the cost-benefit analysis has become a method that helps to clarify the pros and cons in many areas of human activity where both investment and non-investment projects are implemented. In researching for this article, we aimed to map the current state of publishing activities in the field of cost-benefit analysis and in order to accomplish this, four research questions had to be determined. For this purpose, the outputs indexed in the database Web of Science Clarivate Analytics were examined and the method of bibliometric analysis within the VOSviewer software was used. It was ascertained that almost six hundred outputs had been published: almost all of them were published in English and generated by more than sixty percent of authors from English-speaking countries. Cost-benefit analysis was most often used in the areas of healthcare, environment and ecology, and economics and social sciences. In terms of co-authorship, it was found that there had been a shift from collaboration among authors from Israel and English-speaking countries to cooperation between mostly Chinese authors and authors from Northern Europe. In the case of co-occurrence, three clusters were identified: the most frequent was the area of terms related to economic financial analysis, the second area was related to health issues, and the third was related to the process of cost-benefit analysis’ application.
1. Introduction
Albeit the theory of cost-benefit analysis (hereinafter CBA) dates back to the nineteenth century, Hammond (1966) claims that the use of CBA goes back to the early twentieth century (1902, US Rivers and Harbor Act)—more precisely, from the time of its amendment in 1920, which explicitly mandated it. Nevertheless, Pearce (1971) states that the first practical use was in the USA as a part of a national appraisal mechanism for dam construction in 1936; within the Flood Control Act, the most systematic use of this method occurred in 1960s (Nas 2016). Sweden also started using CBA in the 1960s, similarly for the evaluation of national road investment projects (Hultkrantz and Svensson 2012). Ellig and McLaughlin (2012) showed that since 1974, all US presidents have issued executive orders requiring regulatory agencies to analyze the anticipated results and economic effects of proposed regulations. In 1975, the World Bank adopted the Trade Policy Approach (as one method of CBA), while in 1990, this institution shifted to the second approach—the Public Finance Method (Ward 2019).
From a theoretical point of view, the traditional approach to the theory of CBA prevailed in 1940s, which defined costs and benefits according to the effect of the projects. On the other hand, the 1970s saw a new, so-called “social” approach come into the force, which made use of social valuation (Ray 1990). According to Torriti and Ikpe (2014), in the 1950s, economists tried to provide a rigorous, consistent set of methods for measuring benefits and costs and for deciding whether a project is worthwhile. In the late 1960s, Musgrave (1969) wrote about CBA, declaring that “a new approach (to the theory of public finance) has emerged…”. In 1987, Drèze and Stern (1987) presented a general theory of CBA by using the theory of shadow prices and the theory of reform. Layard and Glaister (1994) claimed that many studies on the cost-benefit analysis use the Hicks–Kaldor criterion, which asserts that a project can be supported provided the gainers could, in principle, compensate the losers even if they do not. A detailed list of contributions to the theory and practice of CBA by various researchers was also described by Ray (1990).
According to Persky (2001), cost-benefit analysis offers the dominant economic approach by which economists communicate with each other, with government bureaucrats, and with the general public about the desirability of public programs and investment projects. For example, in the European Union, CBA is explicitly required as a basis for decision-making on the co-financing of major projects included in the operational programs of the European Funds. This is an analytical tool used to appraise investment decisions in order to assess the welfare outcomes attributable to such investments and their contribution to EU cohesion policy objectives (European Commission 2014). Brent (2006), Giordano et al. (2012), or Noe and Graham (2020) stated that CBA is a necessary practical guide to social decision making. Abelson (2020) confirmed this by performing reviews of seven contemporary official guidelines to CBA. Turečková and Nevima (2020) add that CBA is based on the analysis of all implicit as well as explicit costs and benefits, which quantifies the investments’ impact on society. In general, this kind of analysis is based on economic fundamentals, i.e., a cost-benefit comparison with variables such as net present value (Pearce and Moran 1994 or Hansjürgens 2004), producer and consumer surplus (Hanley and Spash 1993 or Hanley and Barbier 2009), shadow wage rate (Ray 1990), willingness to pay (Weatherly et al. 2014), internal rate of return or cost ratio (Florio et al. 2016), social discount rate (Abelson 2020), or externalities (Ramos et al. 2020a).
The CBA method is thus applicable to almost all areas of human life, and it is also used in the international research project that this paper is a part of. It was naturally selected as the most suitable tool for determining the effectiveness of using smart technologies in various areas of human life (health, social work, transport, ICT, etc.). Since reviews are often required by research funders to establish the state of existing knowledge (Clarke 2011), we started our quest to determine how and where CBA has been used; we found that there was no publication that gave an overview of the global use of this method in practice. Only ten studies in individual areas have analyzed CBA issues by bibliometric analysis—their overview (including topic and results) is given in the Appendix A (Table A1). Thus, there is no all-encompassing output related to the interrelationships of this method in terms of who, in what area, in which country, which language, co-authorship, and which topic used CBA. In our opinion, the handing over and dissemination of experiences, attitudes, and solutions, possibly their critical analysis, is all very important for the deeper development of cost-benefit approaches, both on the theoretical and practical levels. Researchers, scientists, and policy decision-makers can benefit from the existing general analysis and description of the current developments and applications of the CBA. Performing the missing analysis on the current state of research in this area (through the research questions below) and identifying the gaps and major issues in this field that may be addressed in the future were the main motivations for writing this article.
The aim of this paper is based on the motivation mentioned above, which is to ascertain the current state of publishing activities on the field of cost-benefit analysis in today’s academic world. To do this, it was necessary to select a method, database, and then software, through which the detected data would be processed. We decided that a bibliometric analysis was the most appropriate method, for two reasons. Firstly, this method is used for research evaluation in multiple fields (as shown in Appendix B, Table A2). Secondly, based on Ellegaard and Wallin (2015), in the context of a widespread wish among decision-makers to qualify or quantify the research performed, the bibliometric analysis offers itself naturally as an instrument.
The database Web of Science Clarivate Analytics (WoS) was chosen as our data source. After selecting the database, we proceeded as follows: Firstly, we used advanced search to find documents with all variations of the terms cost-benefit analysis (cost-benefit, benefit-cost, cost benefit, benefit cost) in the title, abstract, or keywords. Secondly, we considered the time period—the occurrences of the abovementioned terms have been determined within the last thirty years, namely in the period from 1990 to 2020. Thirdly, we selected the obtained data according to the country, type of outputs, category, language, and affiliated institutions. These obtained datasets were processed using VOSviewer software, which creates a graphical representation of data outputs from databases in clusters.
Considering our motivation and research objectives (and to meet them), we established four research questions. The answers to the first two questions were found and examined based on the outputs taken from the WoS database. Questions three and four were answered based on a bibliometric analysis performed on the VOSviewer software.
The studies mentioned in Appendix A (Table A1) show that the main interests of specific research were focused on ecology/environment (n = 4), healthcare (n = 3), economic issues (n = 2), and information technologies (n = 1). We believed that it might be interesting to find out whether the categorization results of this small group would be similar or different to the results of the overall analysis below. Based on this, the first research question was identified:
Q1. In which area/research category is CBA most used—can economic dominance be assumed?
The desire for the multinational spread of knowledge associated with the growing importance of citations has resulted in the use of English as lingua franca for academic and research publications (Di Bitetti and Ferreras 2017). Currently, publication in international journals (with high IF and mainly in English) is the main criteria used by most evaluation agencies to assess research productivity and performance (López-Navarro et al. 2015). Flowerdew and Li (2009) give three levels of factors in connection with the choice of language for publication: (i) the macro-sociolinguistic level (institutional constraints, network contacts, community expectations); (ii) the individual level (skills, feelings, ideologies); and (iii) the micro-sociolinguistic level (language management, resources, setting role of relationships, domains and modes of discourse). Nevertheless, researchers still publish their articles in their native language; as Stockemer and Wigginton (2019) state, a third of the articles are published in languages other than English. Based on these, we identified another question:
Q2. Do English outputs also significantly predominate in the area we are researching on and are they mainly written by authors from English-speaking countries?
The use of English as the main academic writing language as well as using citations are indeed important; additionally, collaboration among authors is also desirable. The reason for this is the improved effectiveness, innovativeness, or productivity of researchers (Wuchty et al. 2007). On the other hand, there is the requirement of achieving socio-economic impacts as returns from publicly-funded research (Guston 2000). According to Adams (2012), the advantages of collaboration are access to resources, including funding, facilities, and ideas; it is therefore crucial to have international teams supported by major facilities and rich data in order to encourage the rapid spread of knowledge. The observed thirty-year period thus raises another question in this regard:
Q3. Has there been a change in co-authorship in terms of the structure and development of international cooperation among the researchers?
Each area of research focuses on a specific topic and uses corresponding terms. Their identification is important, not only in terms of understanding the current state, but also finding possible gaps for future research. These reasons led us to the last, but certainly not the least question:
Q4. Which terms are the main research topics of interest and have these co-occurrences undergone any changes over time?
The remainder of this paper is organized as follows: the data and methodology are introduced in the second section. The results of the empirical estimation, discussion, and comparison of results are reported in the third section. Finally, the conclusion and summary of the main findings are described in the last section.
2. Methodology
For the purpose of obtaining answers for the set questions above, the database Web of Science Clarivate Analytics (WoS) was chosen as our data source. The obtained dataset was processed using the VOSviewer software. The decision to use this combination was inspired by Mongeon and Paul-Hus (2016), who noted that most bibliometric analyses emerge from the same data sources. WoS had been the sole tool for citation analysis until the creation of Scopus and Google Scholar in 2004. When deciding which of the above databases to use, we accepted the opinion of Chadegani et al. (2013) that Web of Science had a strong coverage, which goes back to 1960 (in some disciplines, up to 1900), and de Castro e Silva Neto et al. (2016), who preferred the Web of Science database because of its comprehensiveness, organized structure, and scientific robustness. Marsilio et al. (2011) claimed that WoS was the most commonly used and generally accepted source for bibliometric studies. Likewise, Jacso (2005) agreed that WoS as a search source guaranteed the quality of the literature and provided a solid basis for the bibliometric analysis. Our choice was also validated by the opinion of Zhao et al. (2019), who stated that the WoS data, compared with Scopus, was better suited to VOSviewer.
Firstly, data collection and file type selection were performed—the advanced search was used according to the topic, in all languages, and all document types. Because the authors used various combinations of words concerning this kind of analysis, the dataset consisted of documents with an occurrence of the terms “cost-benefit analysis” and “benefit-cost analysis” and “cost benefit analysis” and “benefit cost analysis” in the title, abstract, or keywords. Secondly, the period of the dataset was determined; the years from 1990 to 2020 were selected since 1990 was the first year an output was indexed in the database.
Almost six hundred publications were found and distinguished in all research categories—WoS categories, countries, document type, source title, number of publications in every year of the monitored period, type of outputs, geographical origin, share of countries in all outputs, research areas, and affiliations. In addition, we synthesized the individual output categories to see if they differed from the detailed categories provided by WoS, as shown in Table 1. This table also presents the most used journals, their impact factors (IF) in the last five years, and the h-index to illustrate the fact that research in this area is valuable not only in terms of quantity but also in terms of quality.
A graphical expression of data is possible through knowledge maps. According to Zhao et al. (2019), these maps, as a kind of graphical tool, can show the relationship between the development process and the structure of scientific knowledge, and have thus become more powerful as methods of data visualization. Similarly, Scott (2004) claimed that the visualization of data is a fundamental task in modern statistical practice. Many tools for producing scientific-knowledge maps exist such as BibExcel, CoPalRed, Network Workbench, CiteSpace, or VOSviewer (Cobo et al. 2011).
We processed the obtained data through the software VOSviewer, which is able to graphically depict large bibliometric maps with functions such as zooming and multidimensional scaling, and with a qualitative interpretation of the closed connected clusters in the drawn maps (Van Eck and Waltman 2009). Furthermore, this software has a good manual for constructing and visualizing bibliometric maps of any kind of co-authorship, co-occurrence, or co-citation data.
Therefore, to obtain answers for the third and fourth research questions, we will analyze co-authorship and co-occurrence through network visualization, overlay visualization, and density visualization. In network visualization, the displayed items (names or words) are represented by the size of the bubble—the larger the bubble, the higher the weight of the item. The items are multicolored—the colors of visualization express mutual belonging and form different clusters. The distance between two bubbles indicates the cooperation of the authors or the occurrence of terms as well as lines. Overlay visualization expresses the development of the publication by using the words in the monitored years (from 1990 to 2020). The blue color represents the beginning of the period—the closer the year to the end of the reference period, the lighter (yellow) the color is. Density visualization is an effective technique for depicting the scalar field distribution in 2D space (Feng et al. 2020). The more pronounced the color, the higher the number and weight of the items, and vice versa.
In the case of co-authorship, maps based on bibliographic data were created. Relatedness of items was determined based on the number of co-authorships in documents, and the same weight for each co-authorship was set. The evaluation of co-authorship started with more than two thousand authors (n = 2059), with at least one output per author. We omitted the network visualization because we did not examine the clustering of authorship by individual outputs; we were more interested in their changes over time. For this reason, we only used the overlay and density visualization.
With regard to co-occurrence, each word’s occurrence within another word is analyzed, along with its frequency (Okubo 1997). This method is used to describe the role of a term (in our case CBA) and to consolidate and transform a network in some research areas. In addition to density and overlay visualization, we also used network visualization to analyze the merging of individual concepts into clusters. The methodology of binary counting was used, which means that only the presence or the absence of a term matters (the number of co-occurrences of a term in a document is not taken into account, as in the case of full counting). For the purpose of our paper, the links in which the terms appeared more than 10 times were examined. Almost fifteen thousand terms (n = 14,933) were found, more than three hundred (n = 308) met the threshold, and 60%, which represents the number of outputs (n = 185) as the most relevant terms were selected. The more times the search terms co-occur, the greater their impact and the larger their bubble. The distance between different terms on the map indicates the degree of connection—the shorter it is, the stronger the association between these expressions. Clustered term mapping identifies cluster themes with highly related concepts. Narrow-based clusters indicate a near-field relationship. The thickness of a link between two bubbles indicates the likelihood that they co-occur in the same publication.
3. Results
To obtain the answers to our research questions, we needed to process and analyze data from the WoS database and map the co-authorship and occurrence of terms in relation to the cost-benefit analysis. The results of these activities are presented below.
3.1. Results Based on Web of Science Data
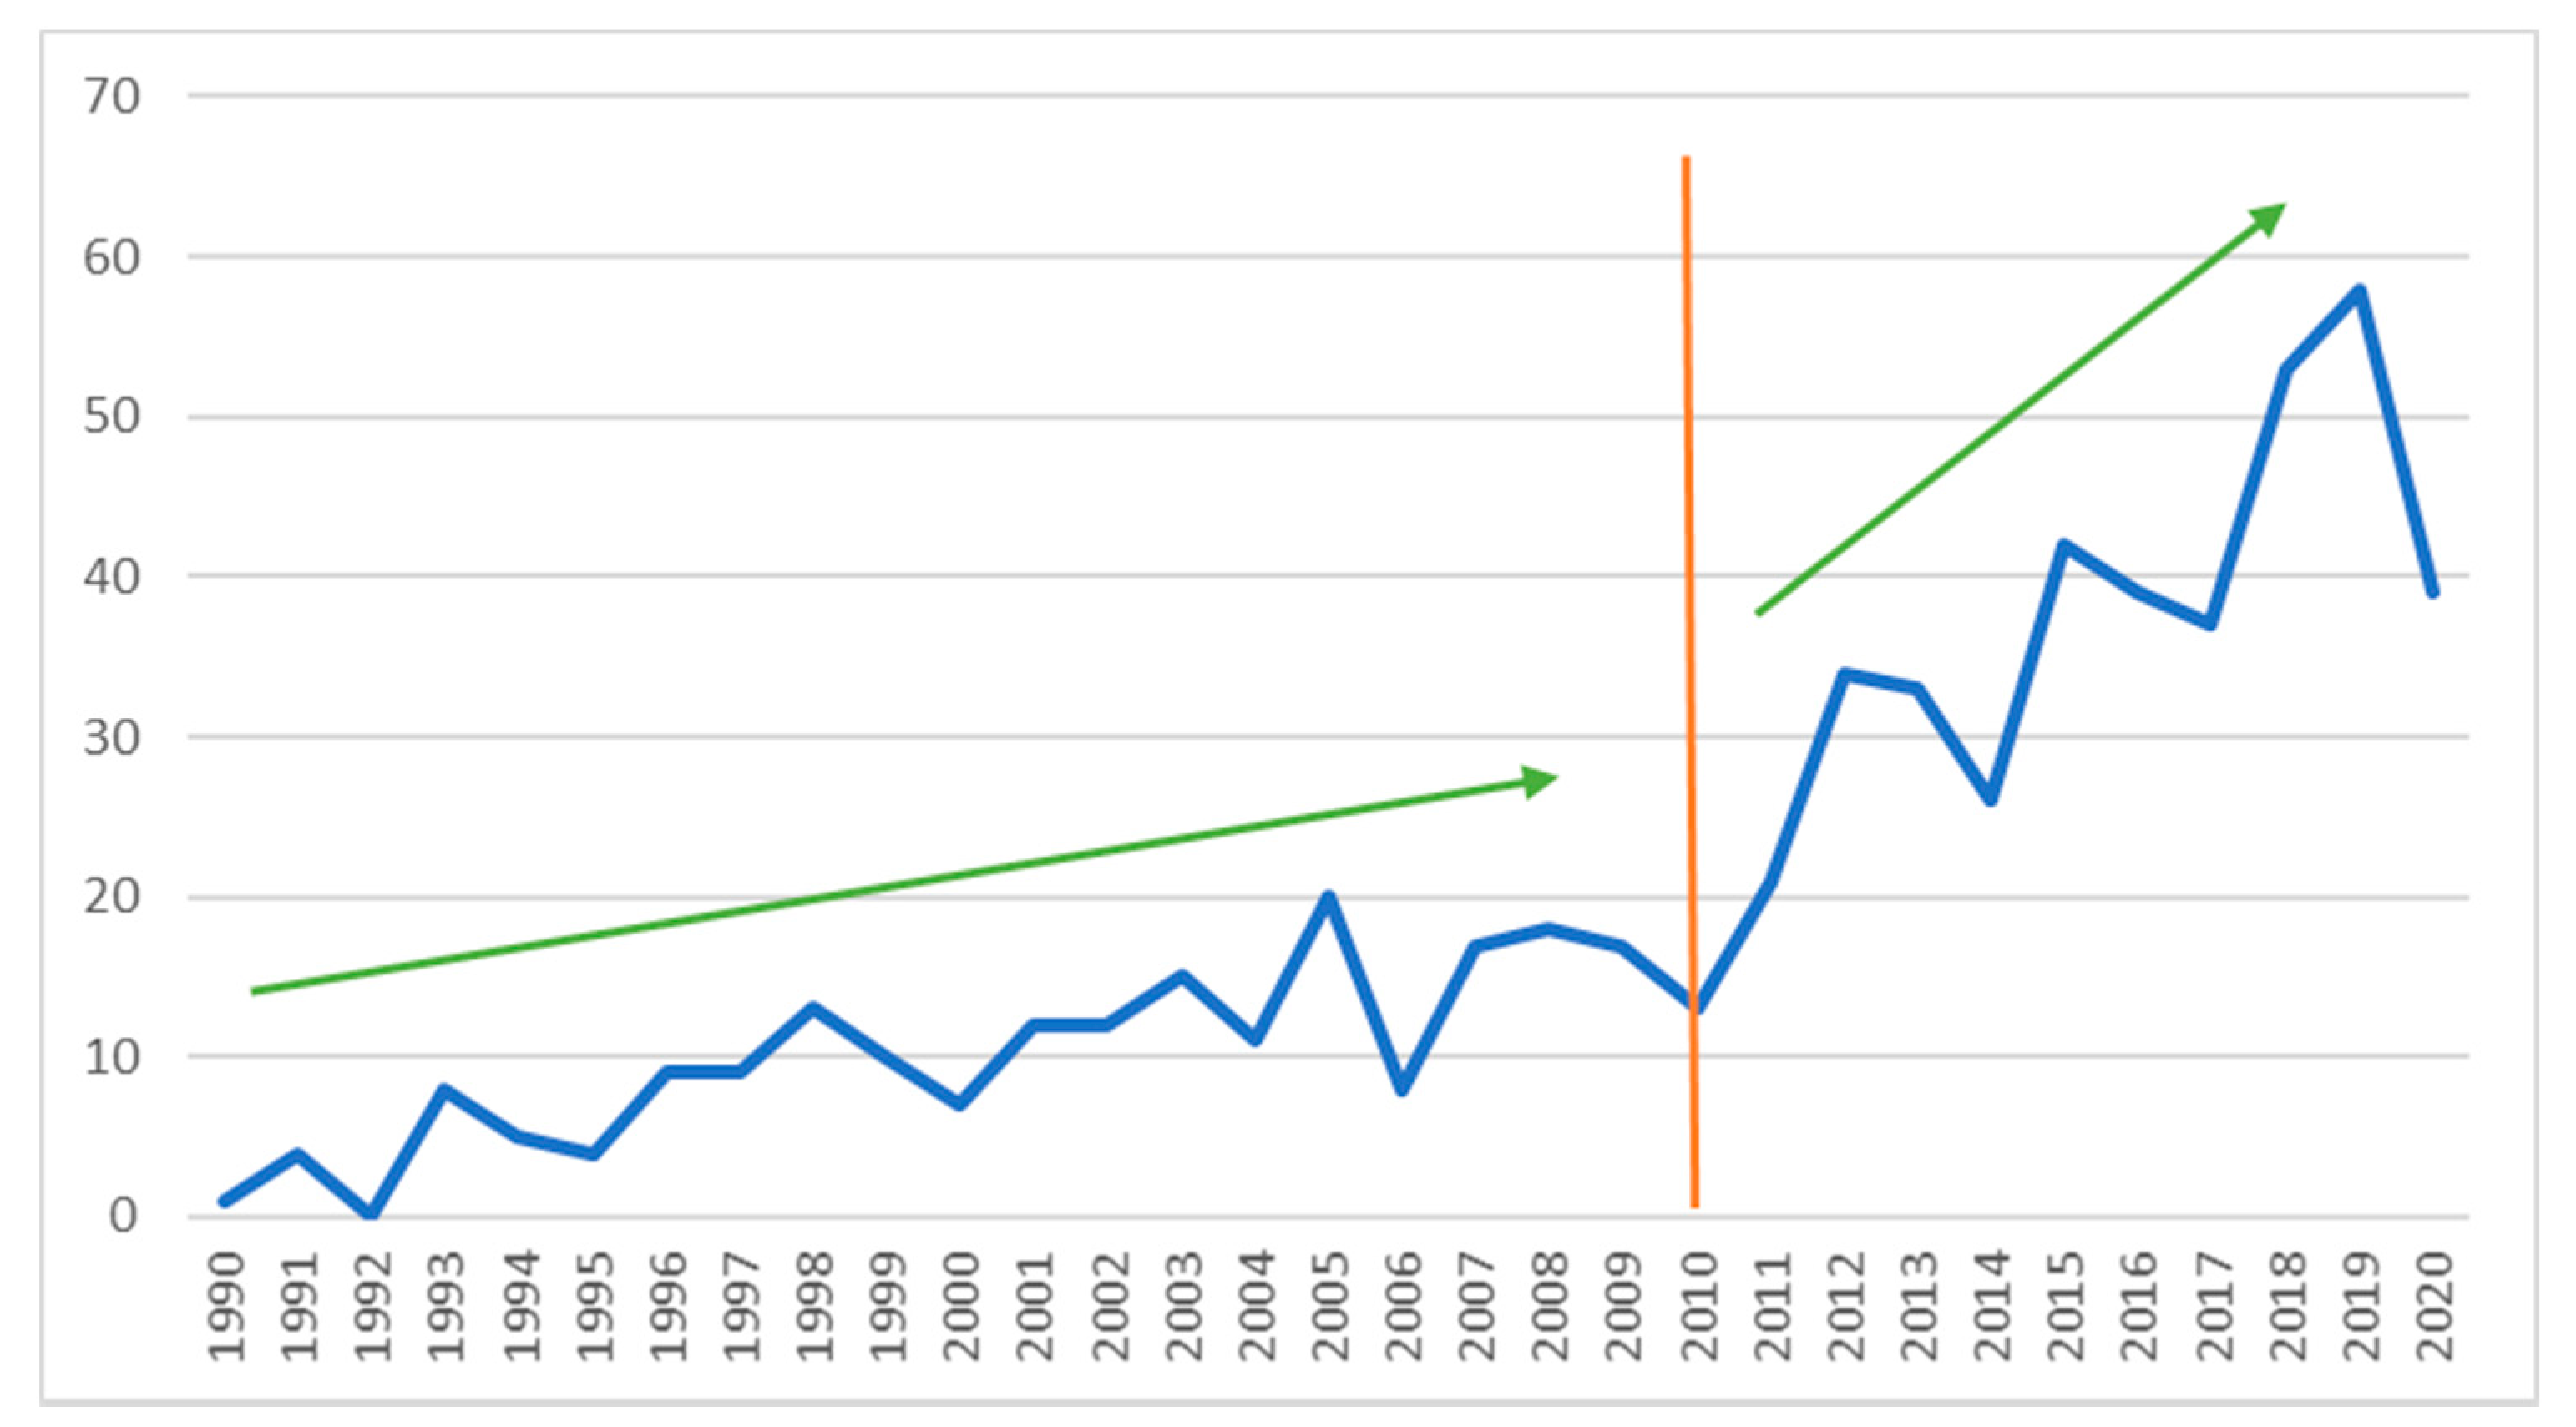
Regarding the number of publications in the monitored period, a significant increase in the output of publications was recorded between 2010 and 2019, with an average of 20 outputs per year (see Figure 1). The development in the first part (from the left line until the year 2009), which can be described as the “starting” phase, is characterized by a slow increase in outputs involving CBA and is somewhere between 1 and 20. The increase in the second period or the “boom” phase, which began in 2010, is much more progressive and more than twice in comparison with the previous sub-period. In 2020, it is possible to observe a decrease to the level of 2016. The causes of this decline can be different and difficult to estimate. It was thought that not all outputs had been indexed yet; the decrease could also have been caused by different research orientations, which might have focused more on other issues such as those related to the COVID-19 pandemic.
As for the kind of outputs, the vast majority of publications are articles (520), which make up 87% of the total outputs, followed by proceedings papers (12%, which represents 73 papers), and reviews (4.5%, or a total of 27 reviews), as shown in Figure 2. The fact that outputs in the form of articles significantly predominate simultaneously proves the predominance of publication quality over quantity.
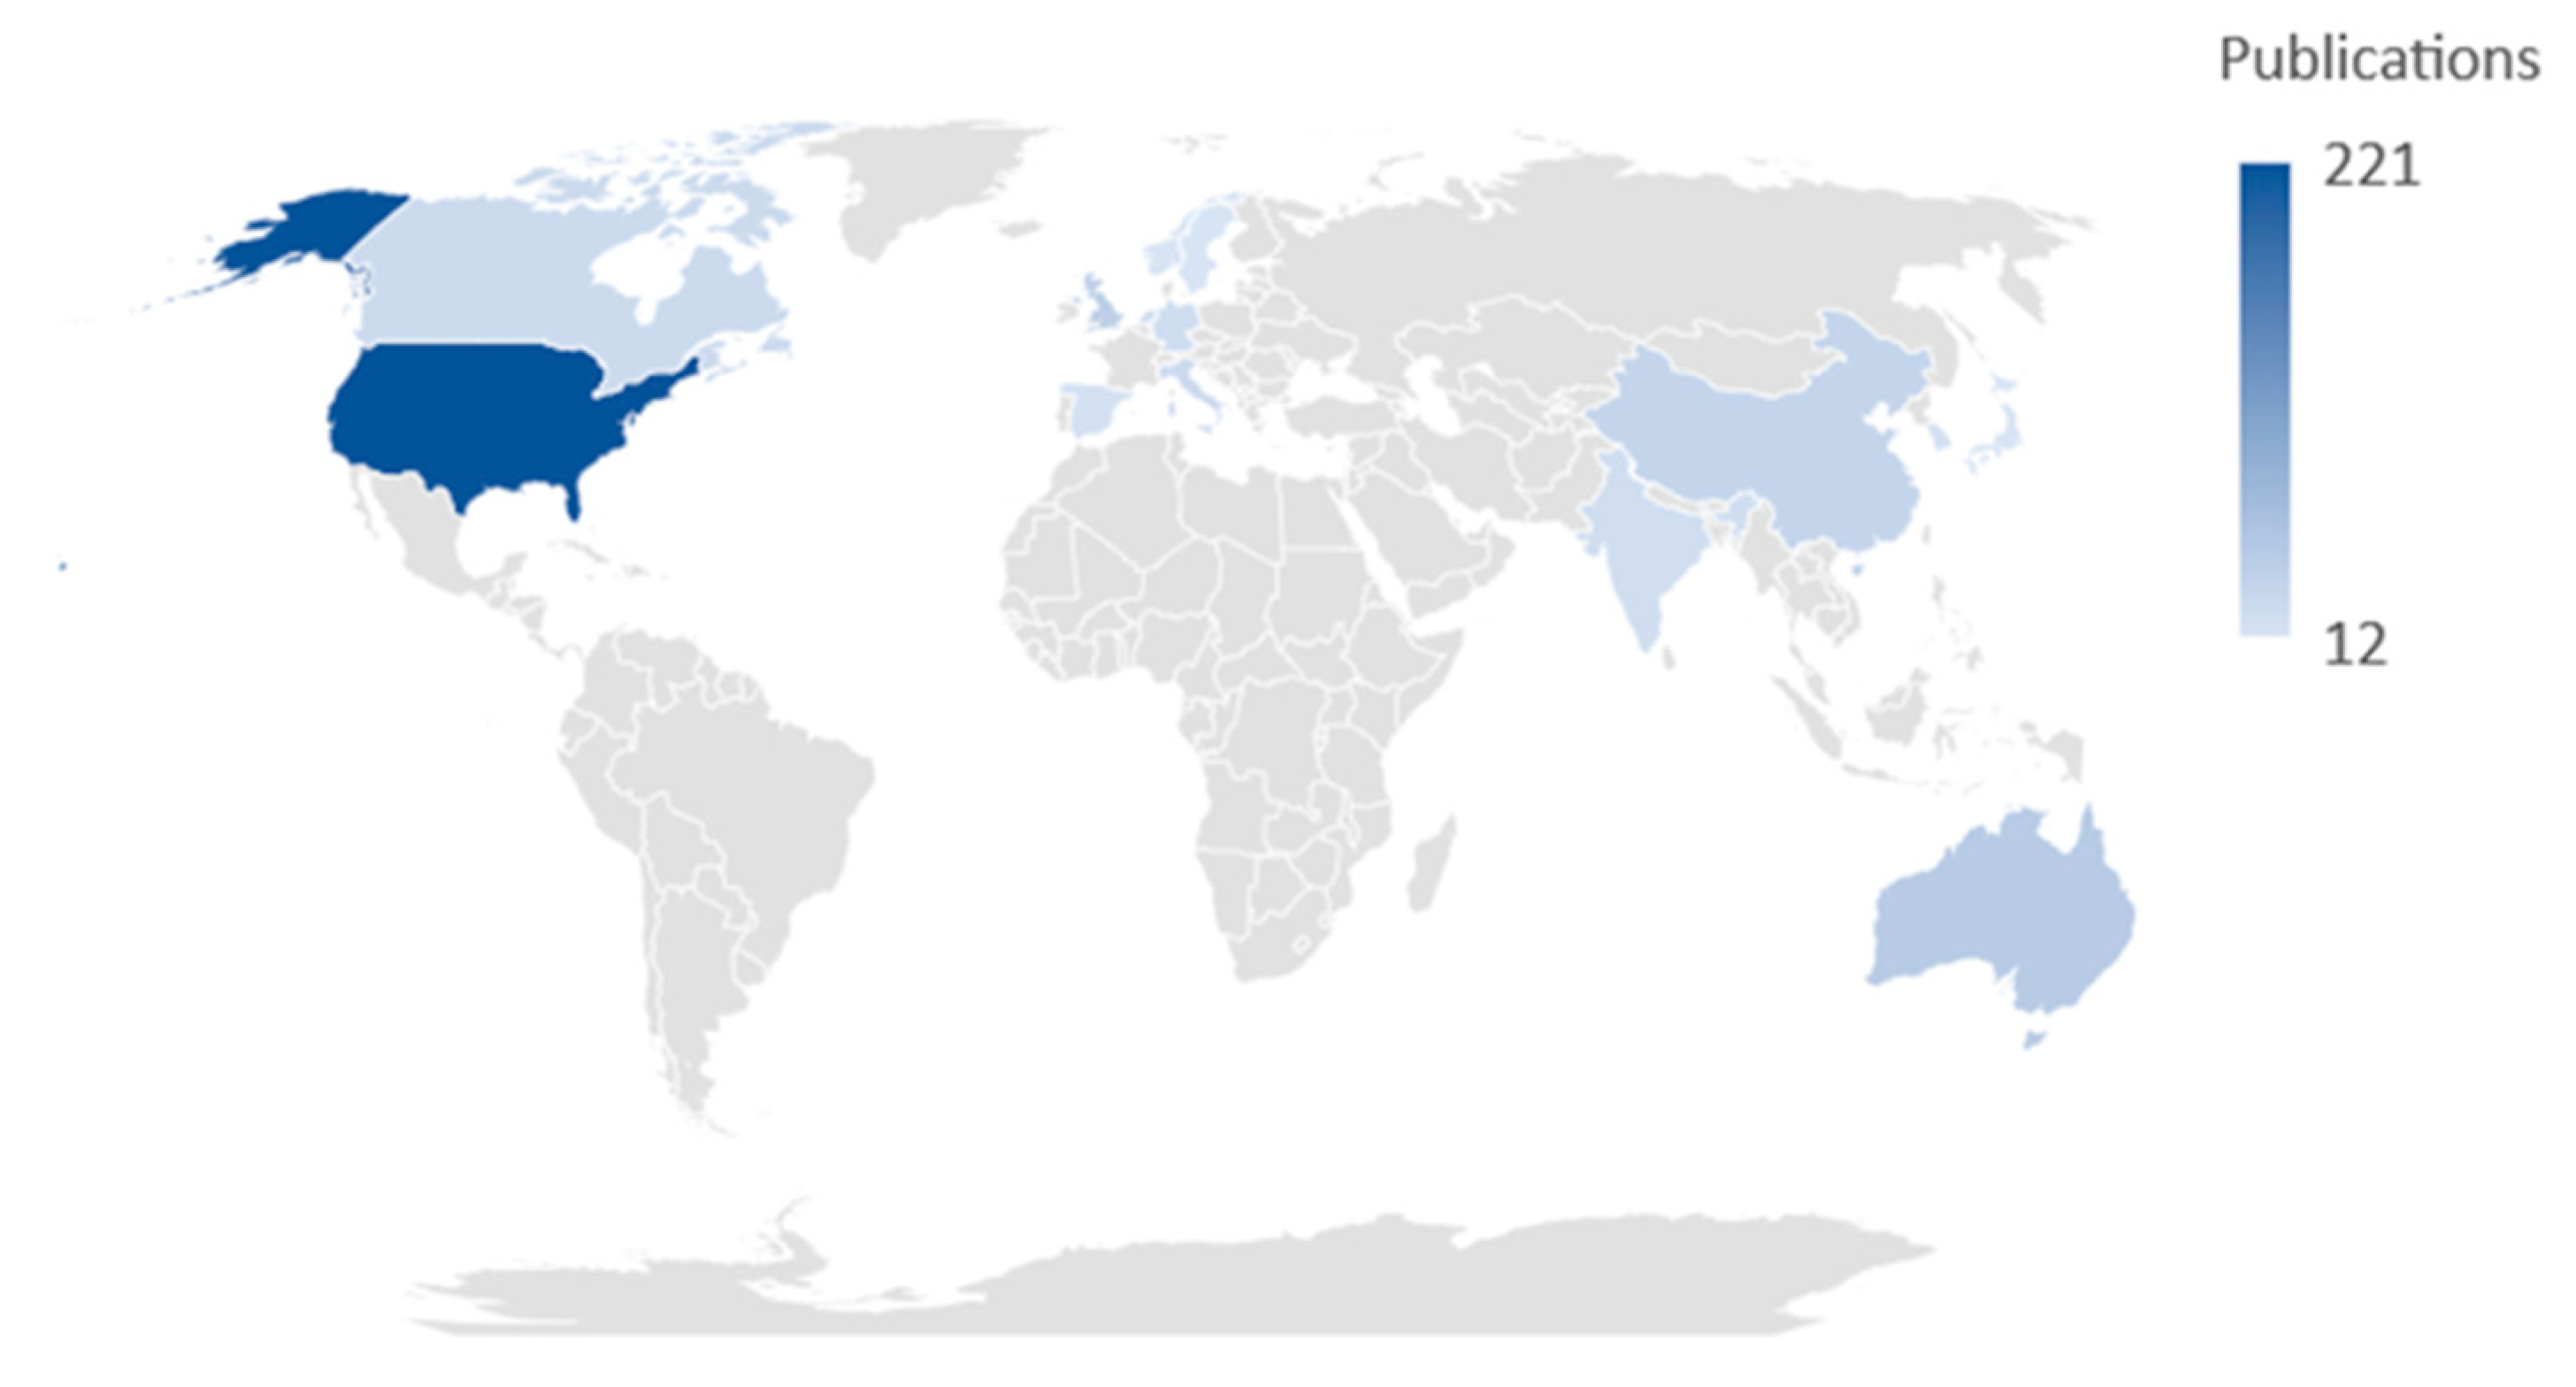
The number of outputs according to the country of origin is graphically displayed on a map (Figure 3). The number of outputs on the map is differentiated according to the color scale, from light to dark blue. The richer the color, the higher the number of publications in a given country (see legend). This shows the clear dominance of the USA, followed by Australia, England, and China.
Out of a total of almost six hundred outputs, over 220 were created in the USA and “only” 49 in Australia, the country in second place in terms of total outputs. The difference between the first and second place is 172 outputs, while there are seven publications between the second and the third place, and between the third and fourth place, the difference is nine outputs. The share of the USA among all countries is 37%, while a ratio of nearly ten percent was reported by authors from Australia (8%) and England (7%).
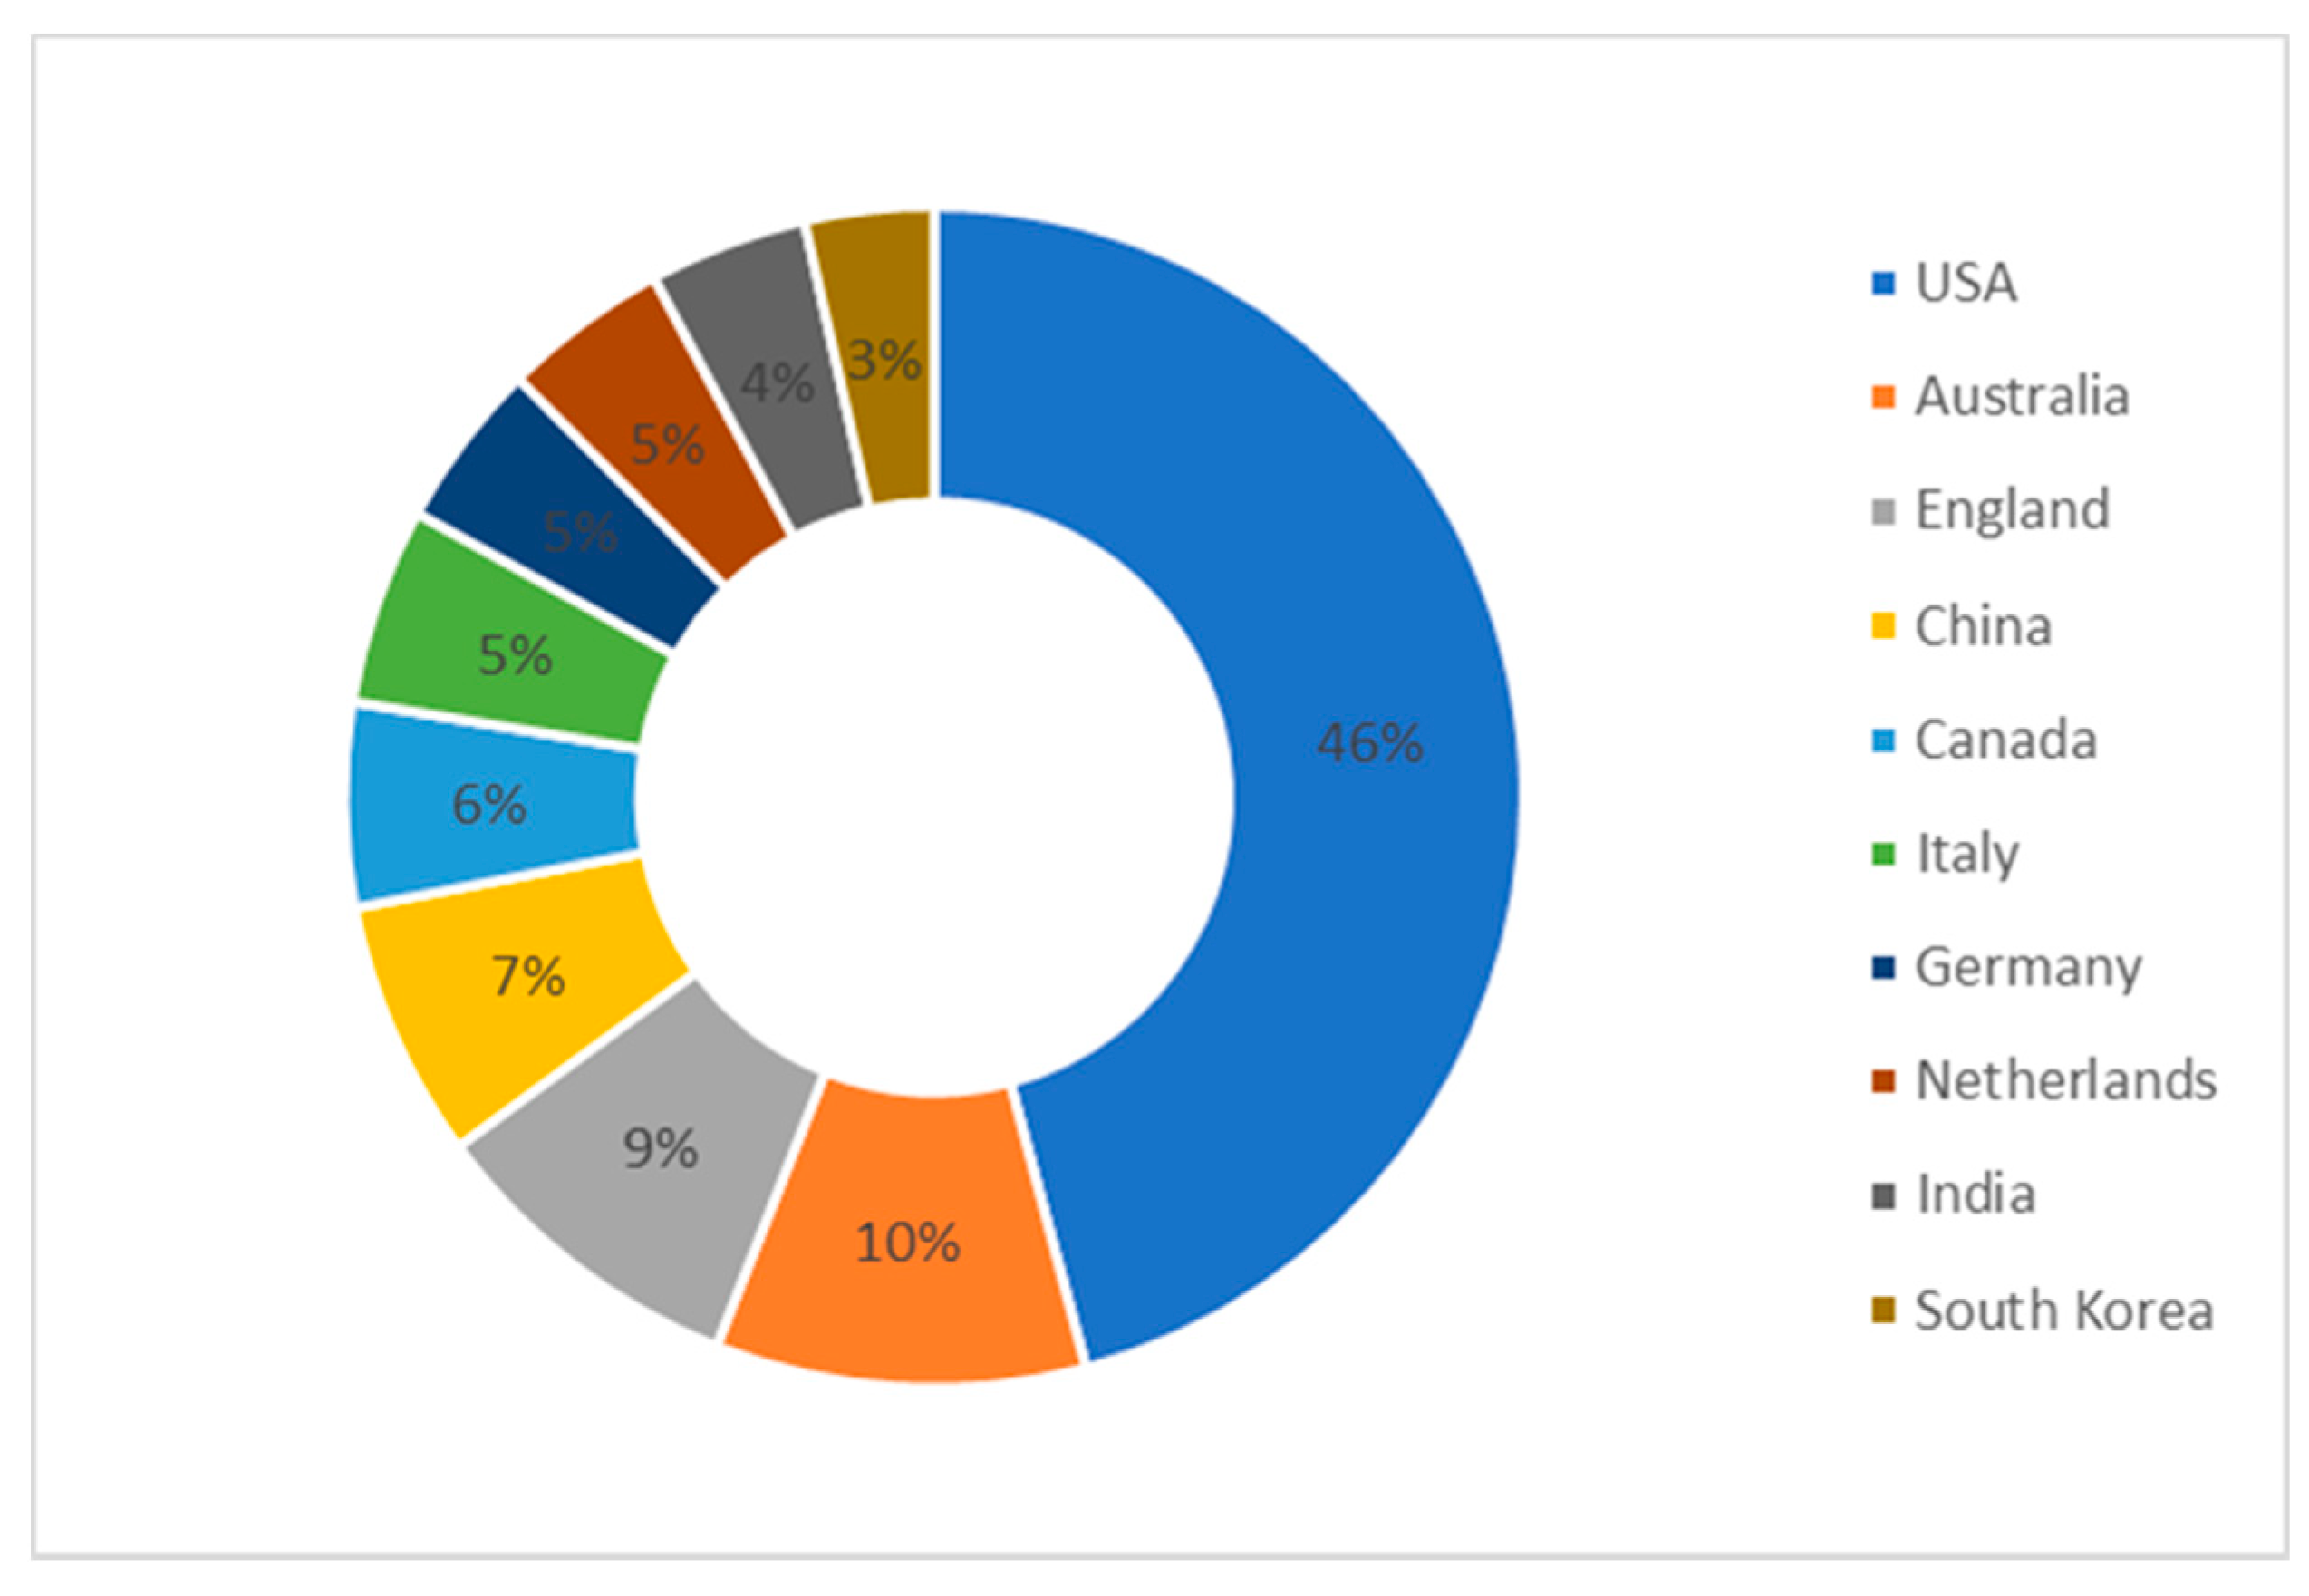
As can be seen from the map above, the leadership of the USA is irrefutable. If we analyze only the first ten countries where the outputs originated, the share of the USA will increase further. In the “top ten”, shown in Figure 4, the leading position of American publications is even more pronounced, accounting for almost half of all outputs; the difference between the first and second best is 36 percent.
The high share of the first three economies, which accounts for a total of 65% of outputs, is also partly related to the language used in the monitored publications—English was used in 580 outputs (97.5%), Spanish in six publications (1%), and the rest of the languages (Afrikaans, French, Korean, Hungarian, German) together make up one and a half percent. Undoubtedly, the use of English as an academic and scientific language plays a significant role here, but on the other hand, it does not automatically mean that the authors come from English-speaking countries.
From the total number of categories that were listed in the WoS outputs in which the CBA method was most often used (these are not the first ten WoS categories shown in Table 1, but all categories that occurred in the database), ten groups of related categories were created by synthesis. As shown in Figure 5, the largest category was the field of healthcare, while the second was environment and ecology. Over 100 outputs taken from the monitored period were in the economics and social sciences category. The difference between the first and third categories was less than 70 outputs, while the difference between the first and tenth categories, was 170 outputs.
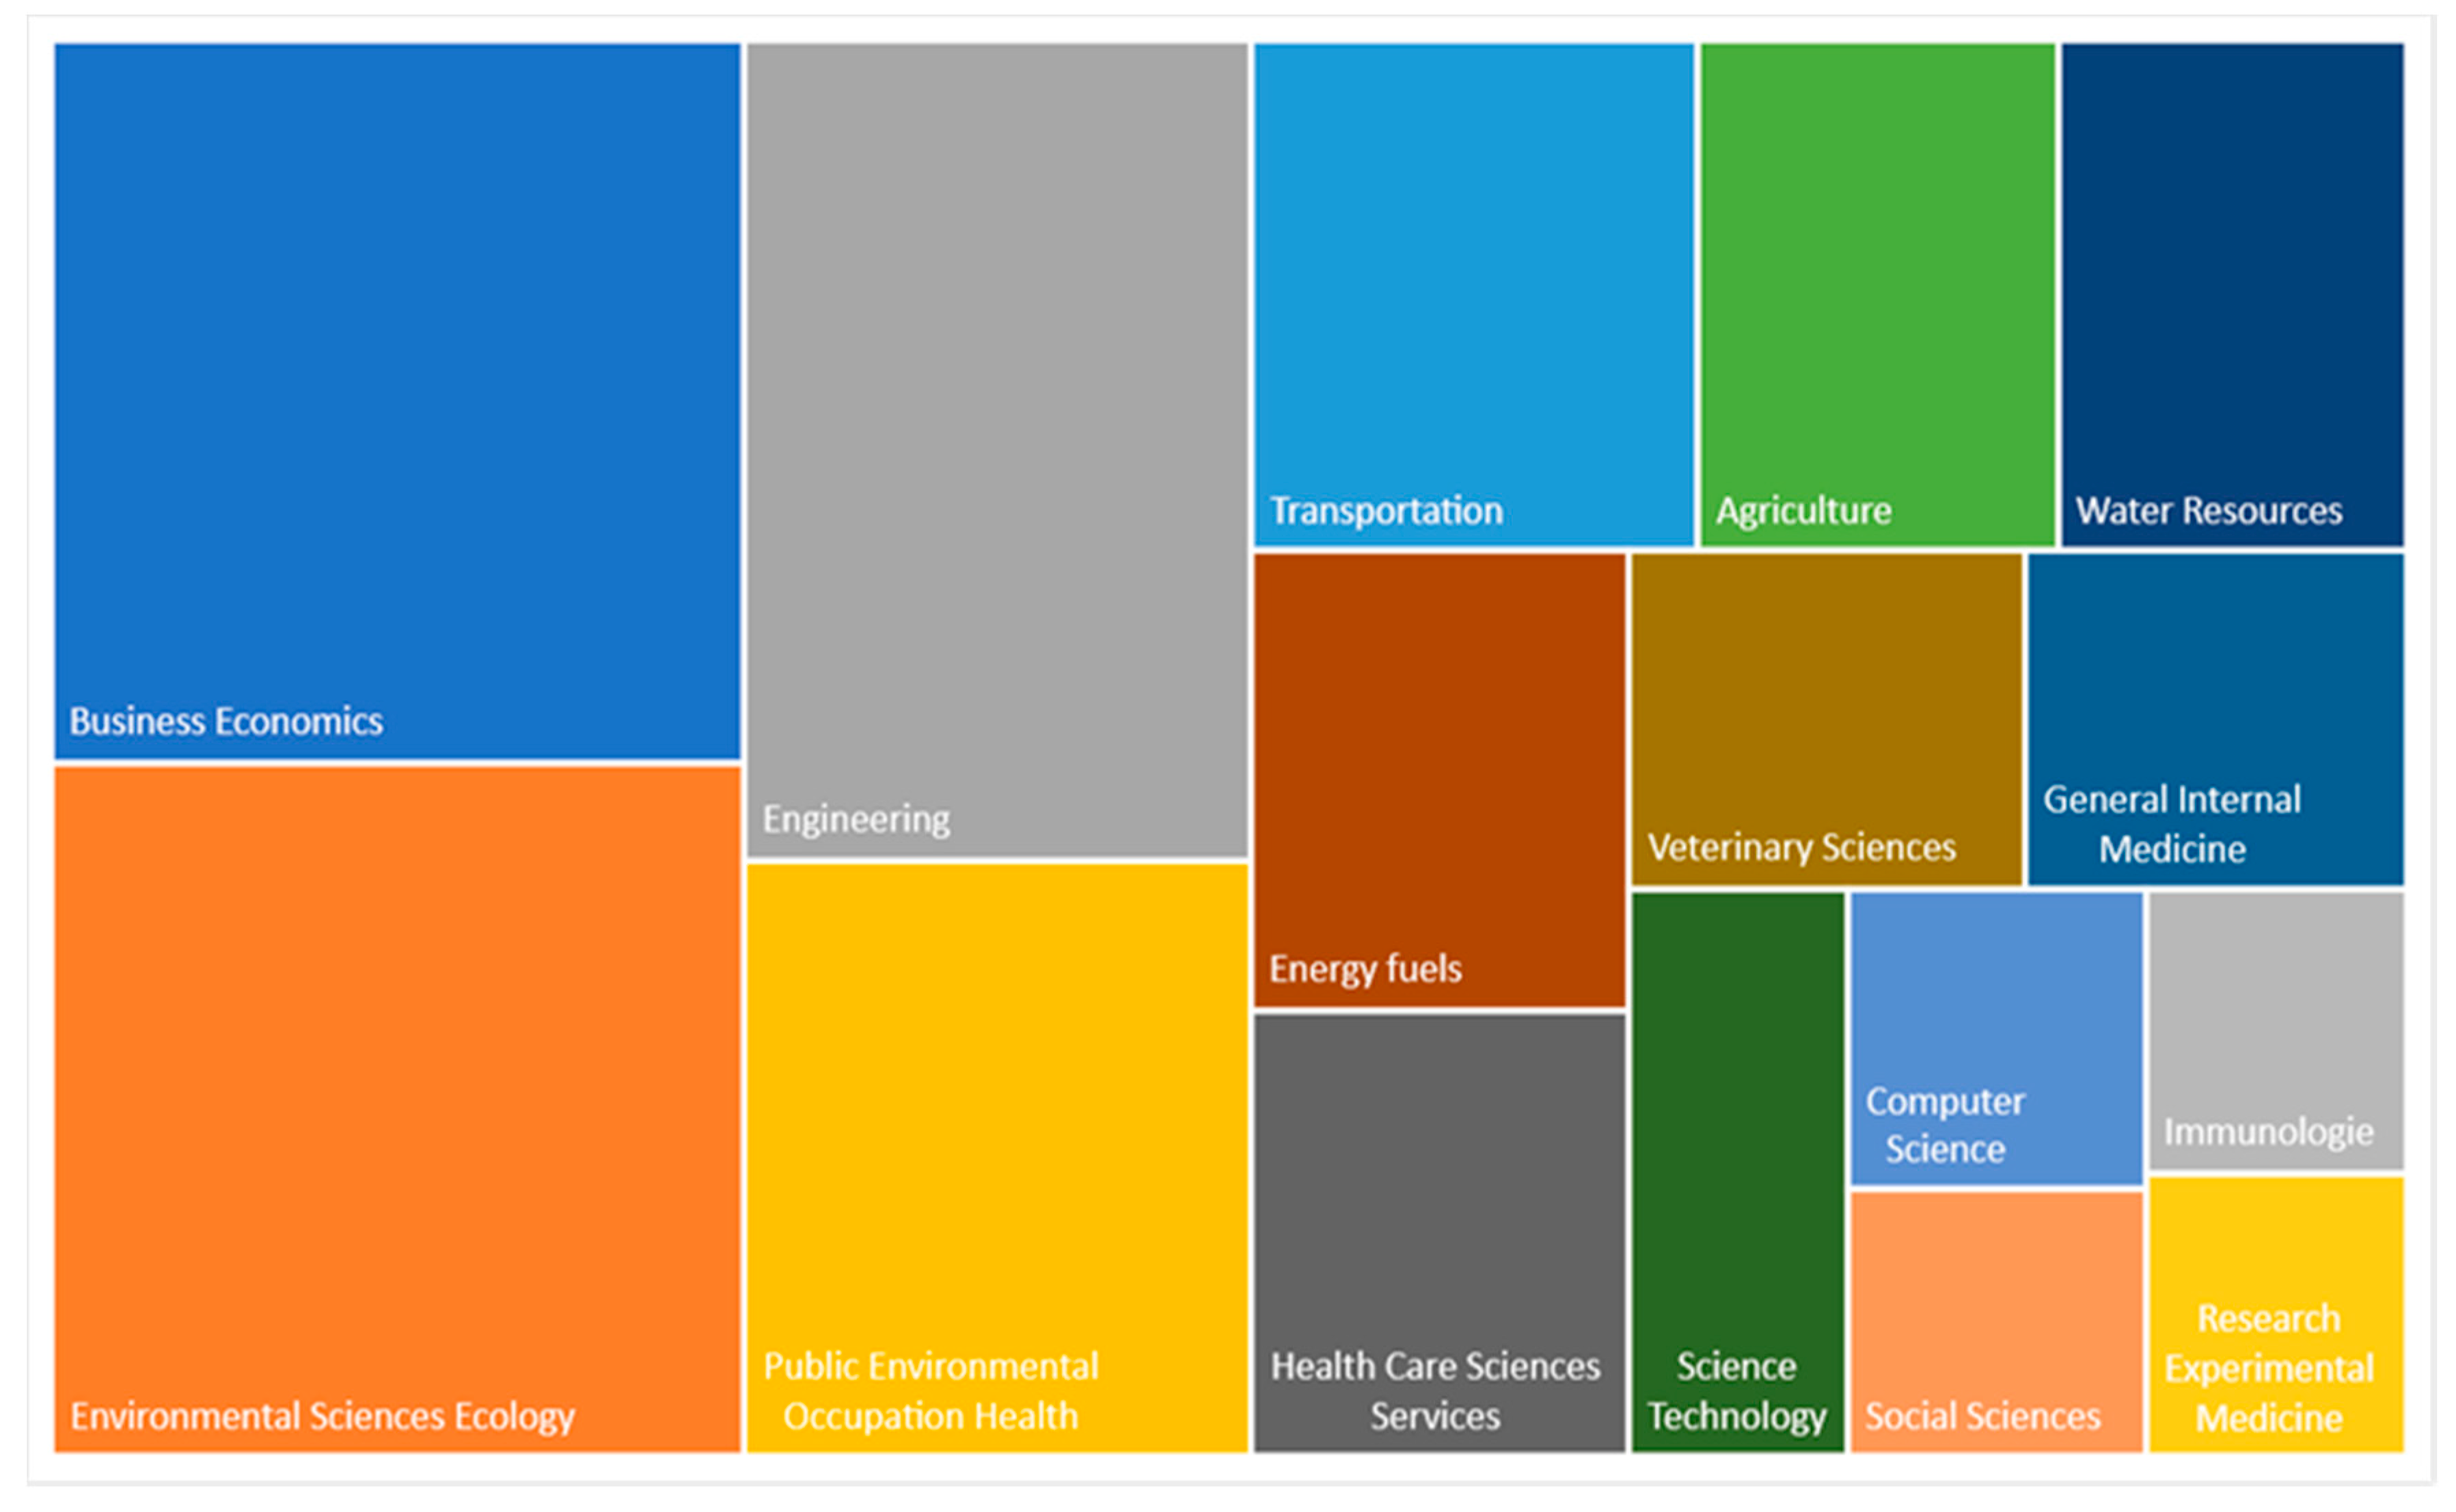
Interestingly, the outputs in the research area do not fully correspond to the outputs in the WoS category. Areas in which more than 15 outputs have been published are shown by the tree map in Figure 6. The number of outputs in each category is made evident by the size of the displayed area. It can be seen that the general categories are divided in more detail, with the highest number of publications coming from the field of Business Economics (101), followed by Ecology (97), Engineering (84), and Public Health (61). Other areas range from 46 to 15 outputs.
Looking at the institutional affiliation of the outputs above, the vast majority is associated with universities or colleges (nearly 97%) from the USA, Australia, Canada, Spain, UK, Denmark, or South Korea. However, from the point of view of individual institutions, the US national institution for public health—Centers for Disease Control and Prevention—has the highest share, making up a total of 2%. The second non-educational institution—the Ministry of Health (of various countries)—represents 1.3% of output cases.
3.2. Results Based on Bibliometric Analysis
As already mentioned, the method of bibliometric analysis was applied using the software VOSviewer. Therefore, to obtain answers for the third and fourth research questions, we analyzed co-authorship and co-occurrence through network visualization, overlay visualization, and density visualization.
As Ponomariov and Boardman (2016) claimed, research collaboration has been the object of interest for academics and evaluators for decades. Although co-authorship does not necessarily entail research collaboration, most outputs use co-authorship data as a proxy for research collaboration (Bordons and Gomez 2000; Yoshikane and Kageura 2004; Adams et al. 2005; Ponomariov and Boardman 2010). To explore the collaboration roots of disciplines, the bibliometrics analysis is examined using the co-occurrence analysis, including the co-authorship and co-word analyses (Leydesdorff and Vaughan 2006; Otte and Rousseau 2002; Owen-Smith et al. 2002). According to Glänzel and Schubert (2004), co-authorship is one of the most tangible and well-documented forms of scientific collaboration.
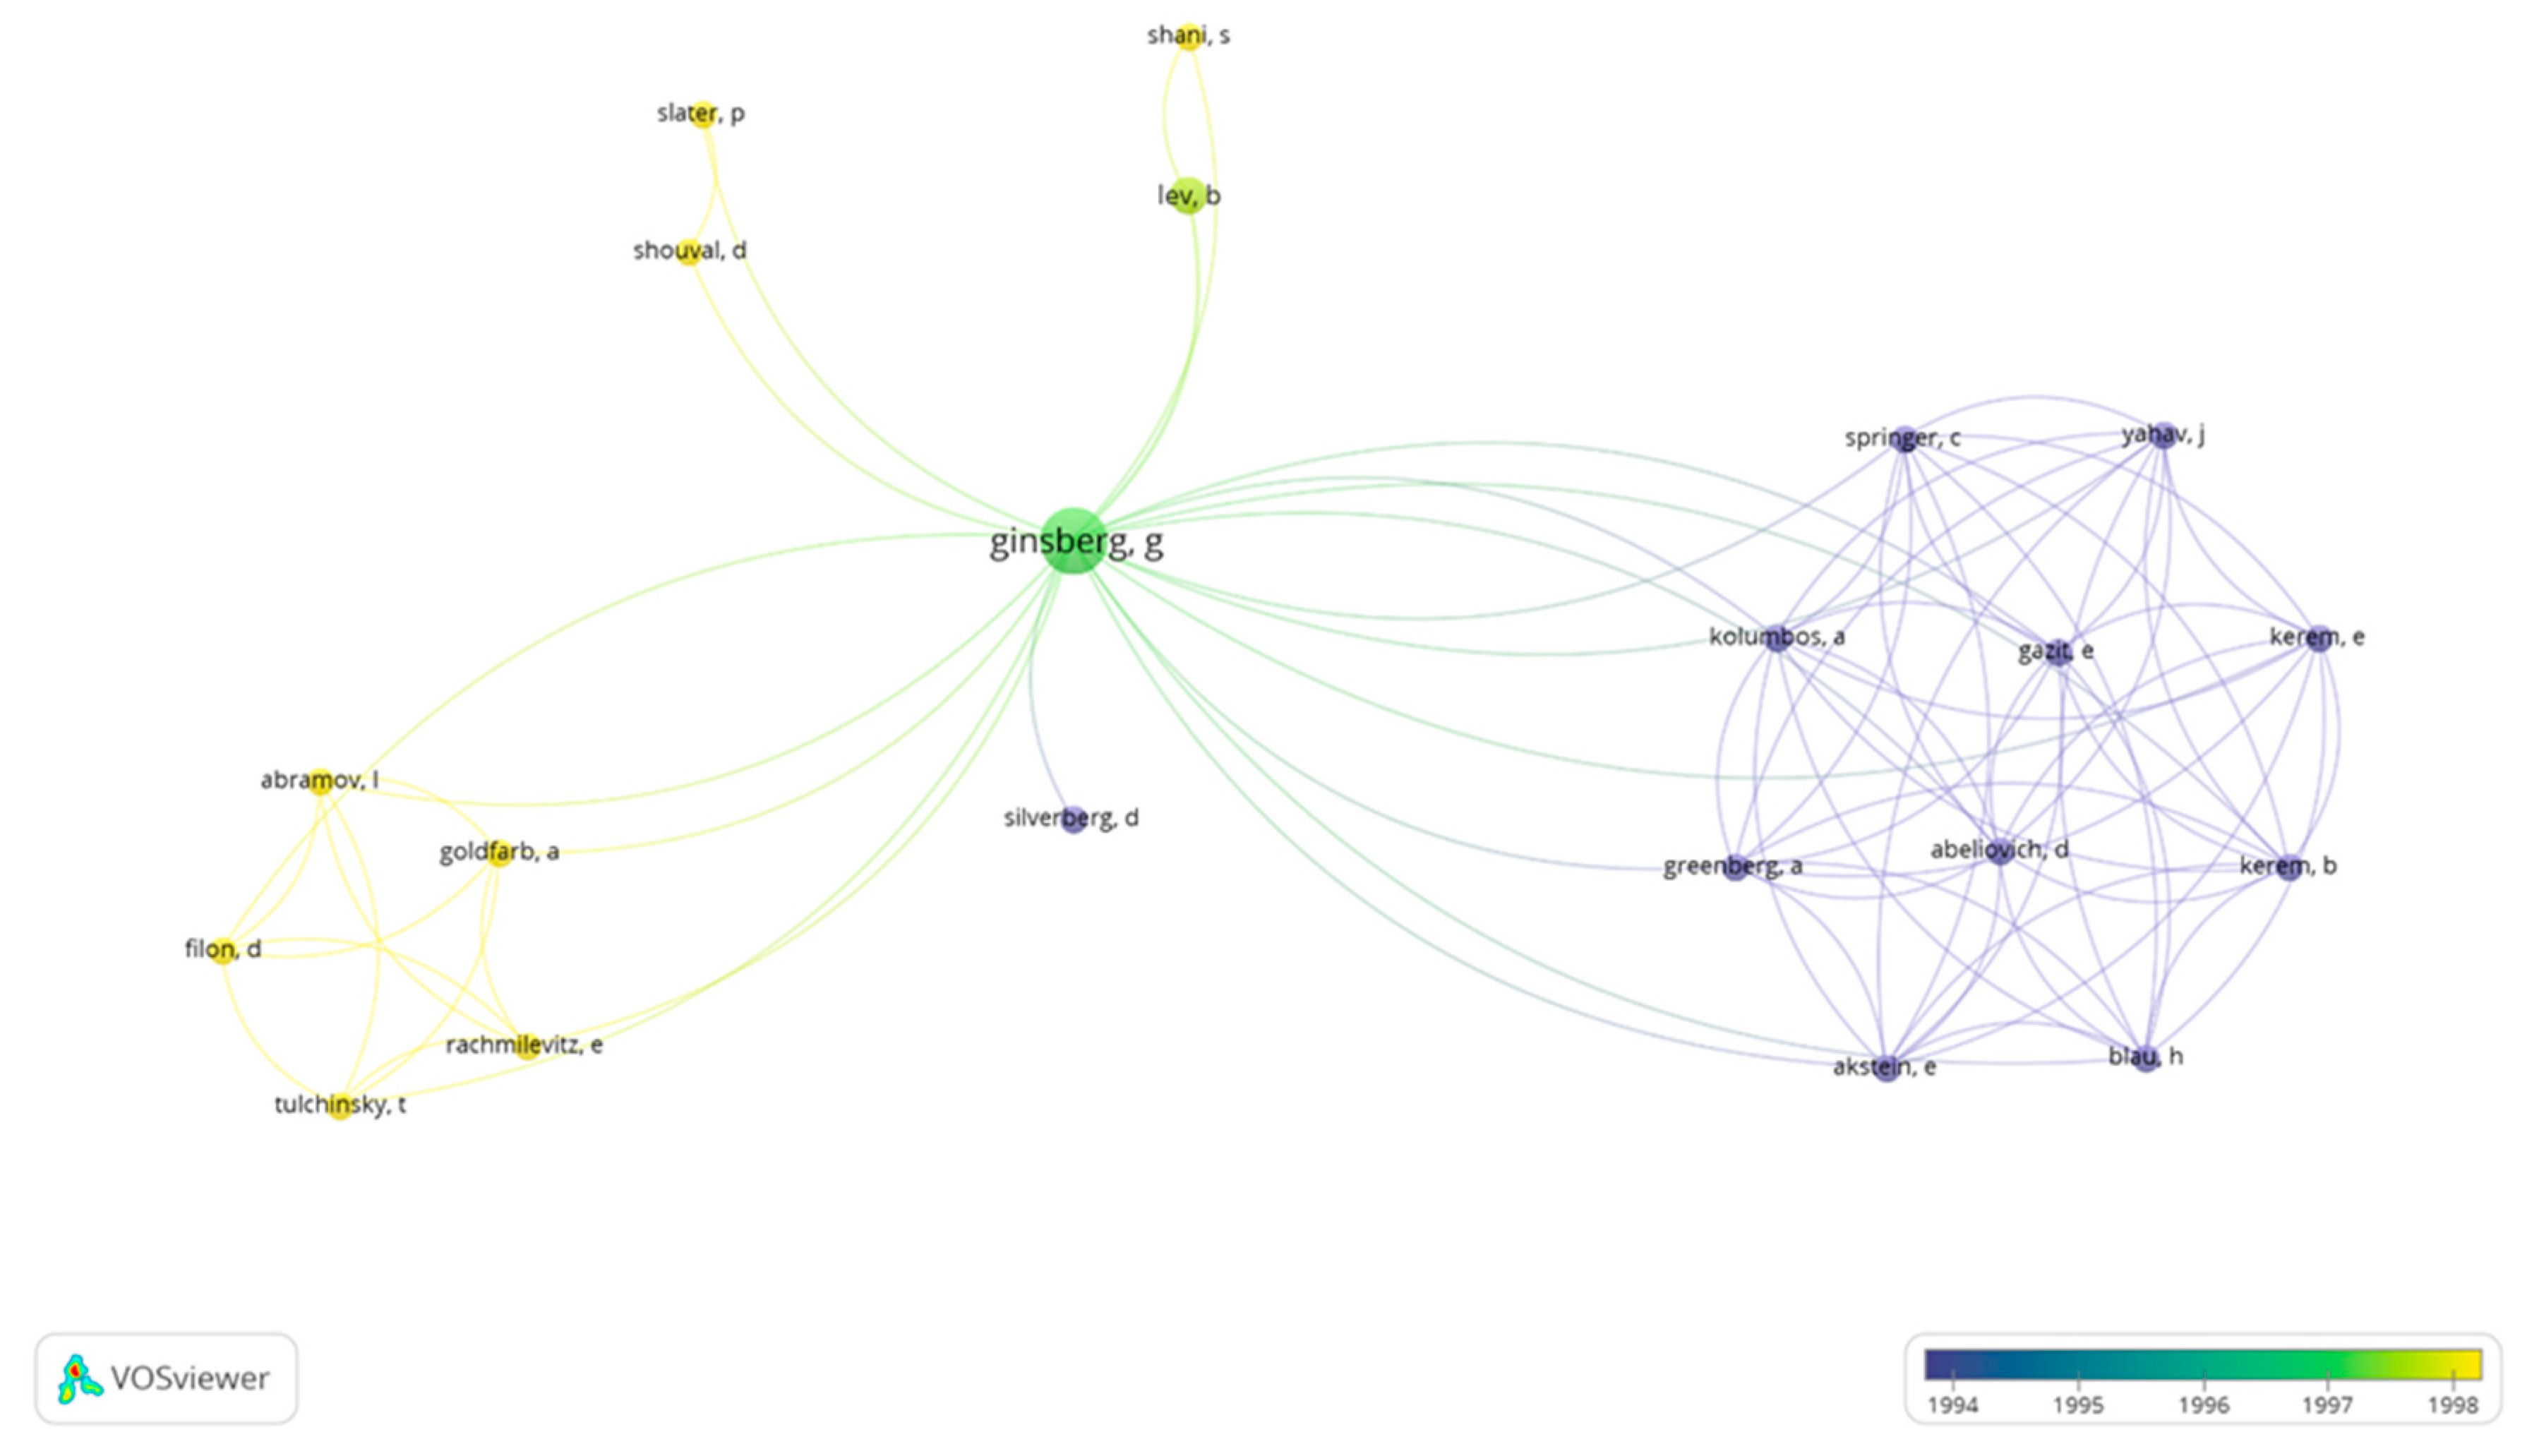
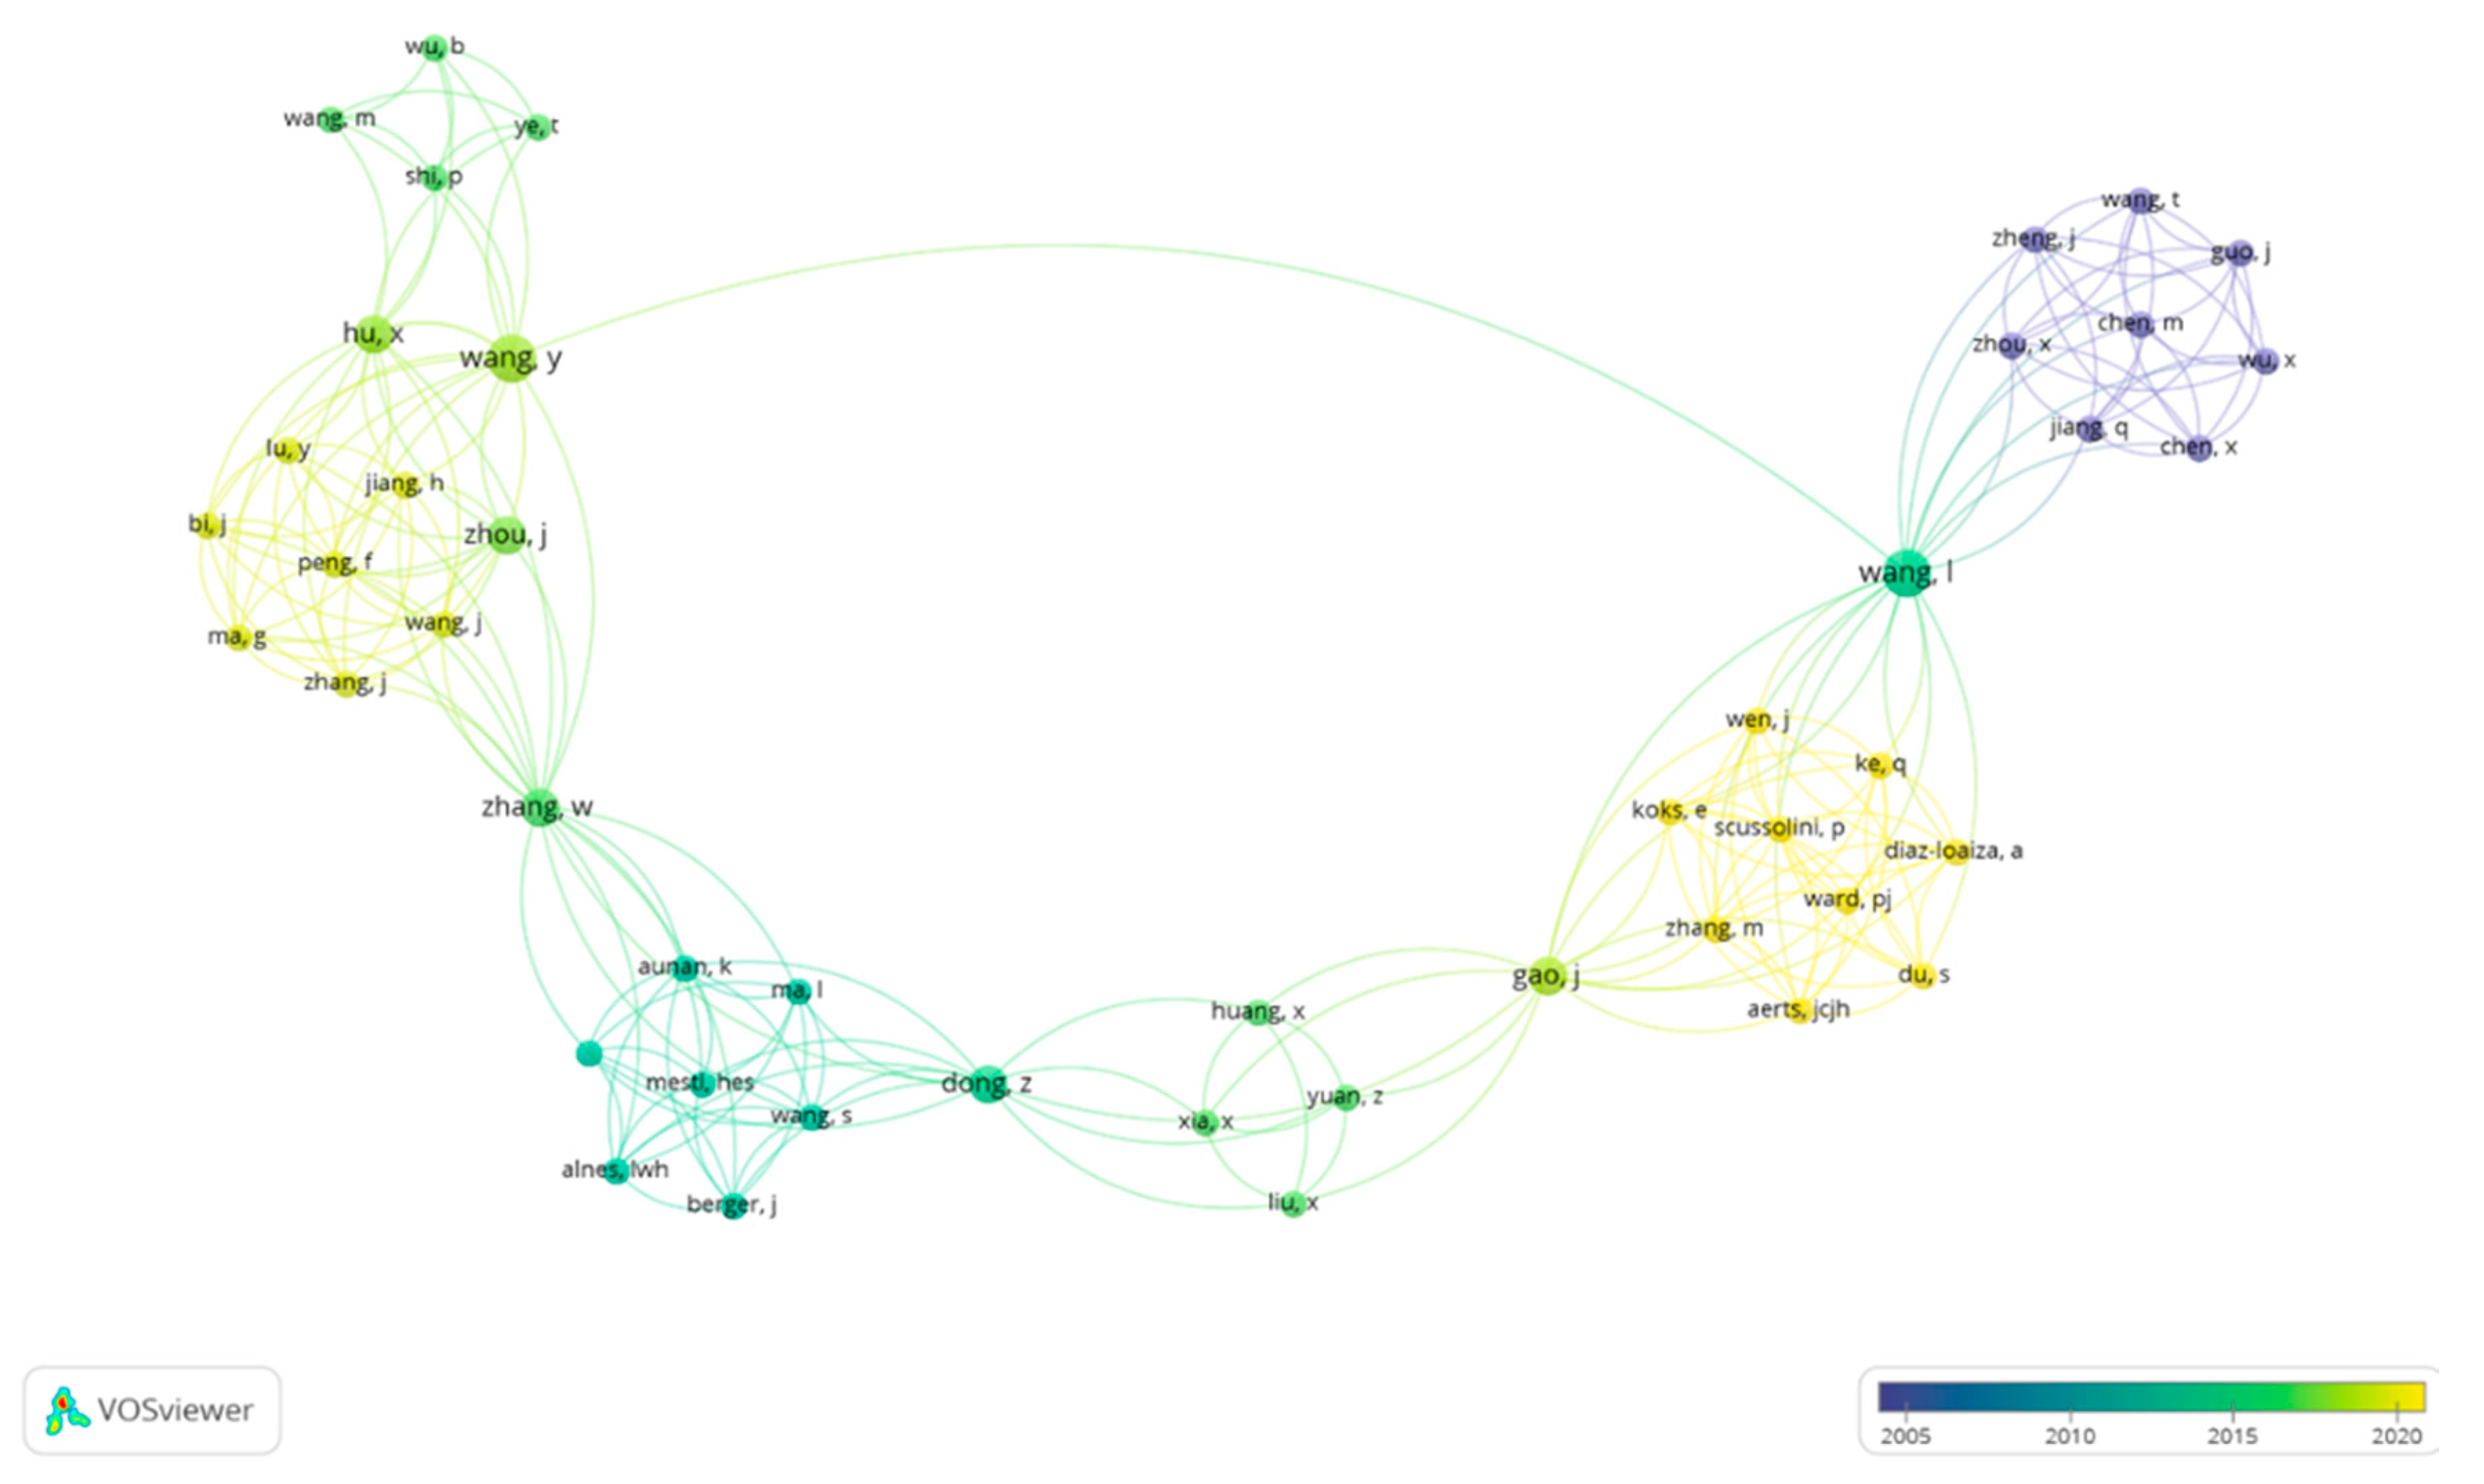
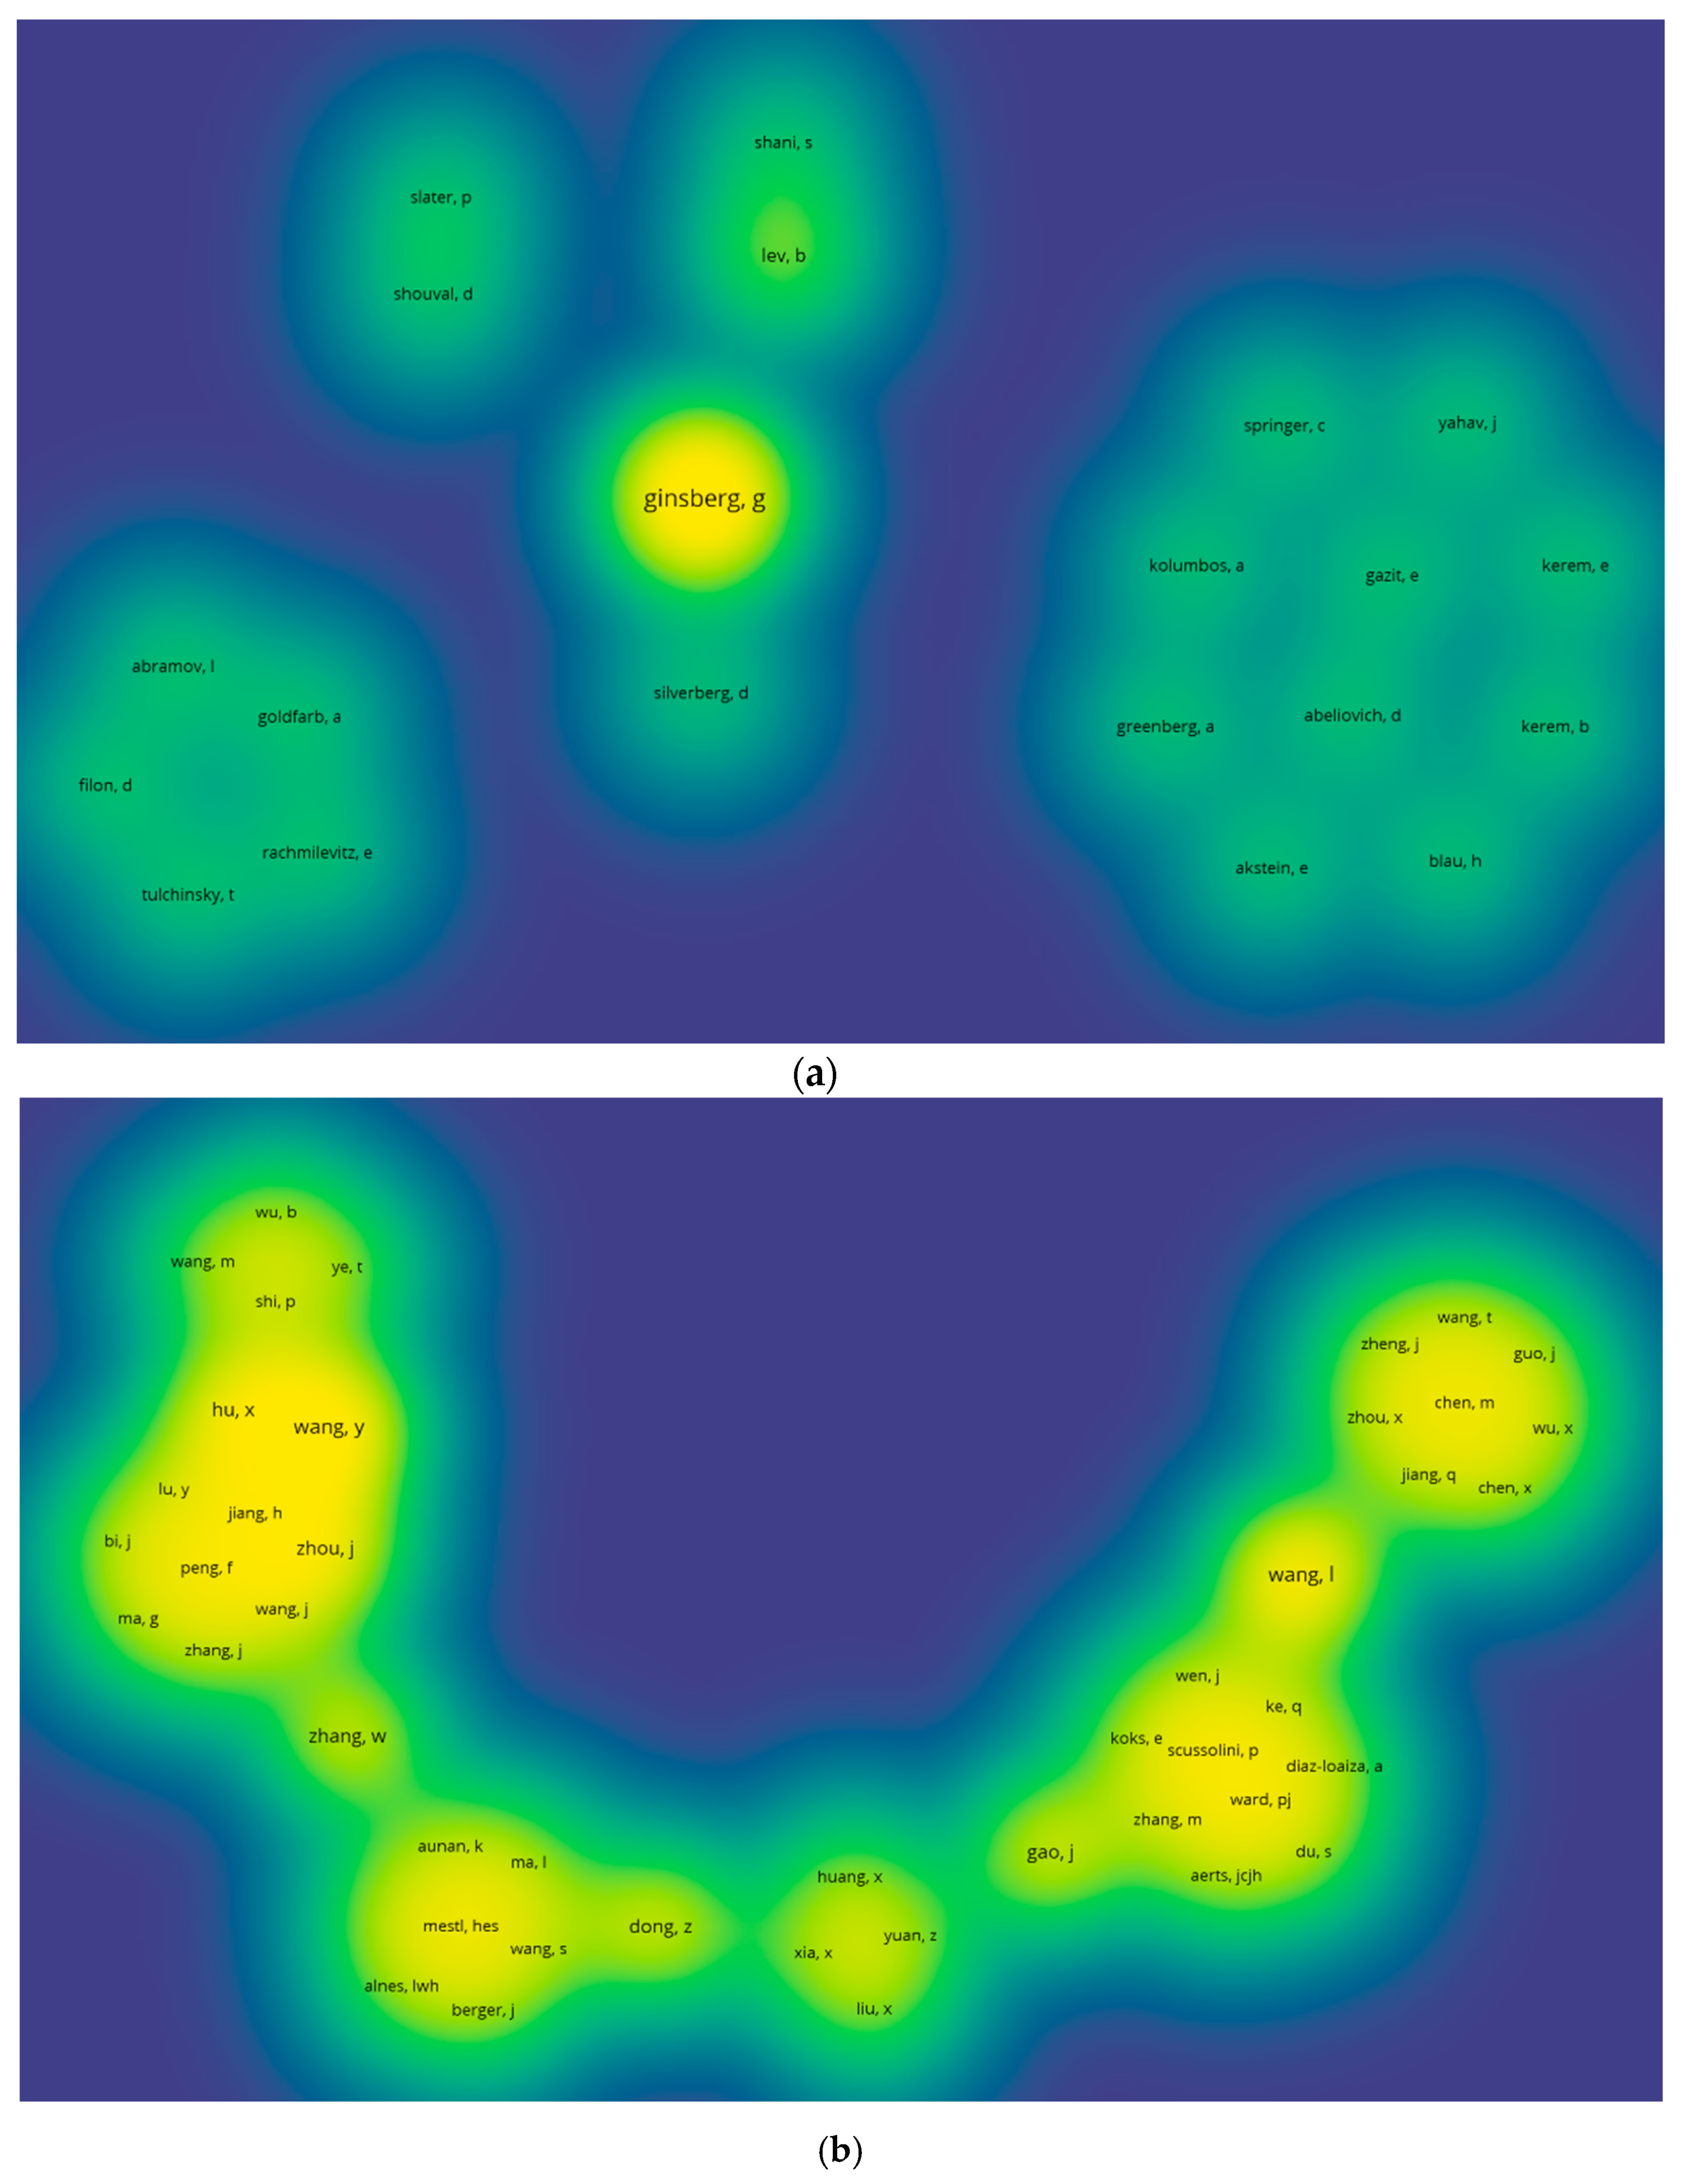
In our paper, using the above-mentioned software, the evaluation of co-authorship started with 2059 authors, with at least one output per author. Only the authors that were connected with each other were selected—from a total of 21 authors (Figure 7) to 46 (Figure 8). Network visualization was omitted because we did not examine the clustering of authorship in individual outputs; we were more interested in their structure and changes over time. For this purpose, we used only the overlay and density visualization.
The change in the shape of the both visualizations is obvious at first glance. This confirms the shift in co-authorship over time—in terms of the dominance of author/s, countries, or research areas.
What changes can be read from both visualizations? The first change led to a kind of “dominance” of certain authors, based on the size of the bubbles. Here, we can trace the shift from the dominance of one co-author: Ginsberg (Ginsberg 1990; Ginsberg and Tulchinsky 1990; Ginsberg et al. 1992; Ginsberg et al. 1998a or Ginsberg et al. 1998b) to non-dominant co-authorship in the new millennium (see also Figure 9). However, another dominance prevails here—in the first part of the observed period, there were co-authors from (predominant) Israel and (individually) the USA, Germany, and the United Kingdom; after 2000, China dominated, with co-authors from Norway and the Netherlands at the same level of dominance. There has also been a shift in research areas—according to outputs of the co-authors, the field of health predominated in the first phase of co-authorship, while the second phase was dominated by researchers in the environmental field and ICT.
In addition to the evaluative bibliometric methods above, the relation techniques, including co-occurrence, are categorized to ascertain the conceptual structure of the discipline/s (Zupic and Čater 2015). This method is used to describe the role of a term (in our case CBA) and to consolidate and transform a network in some research areas.
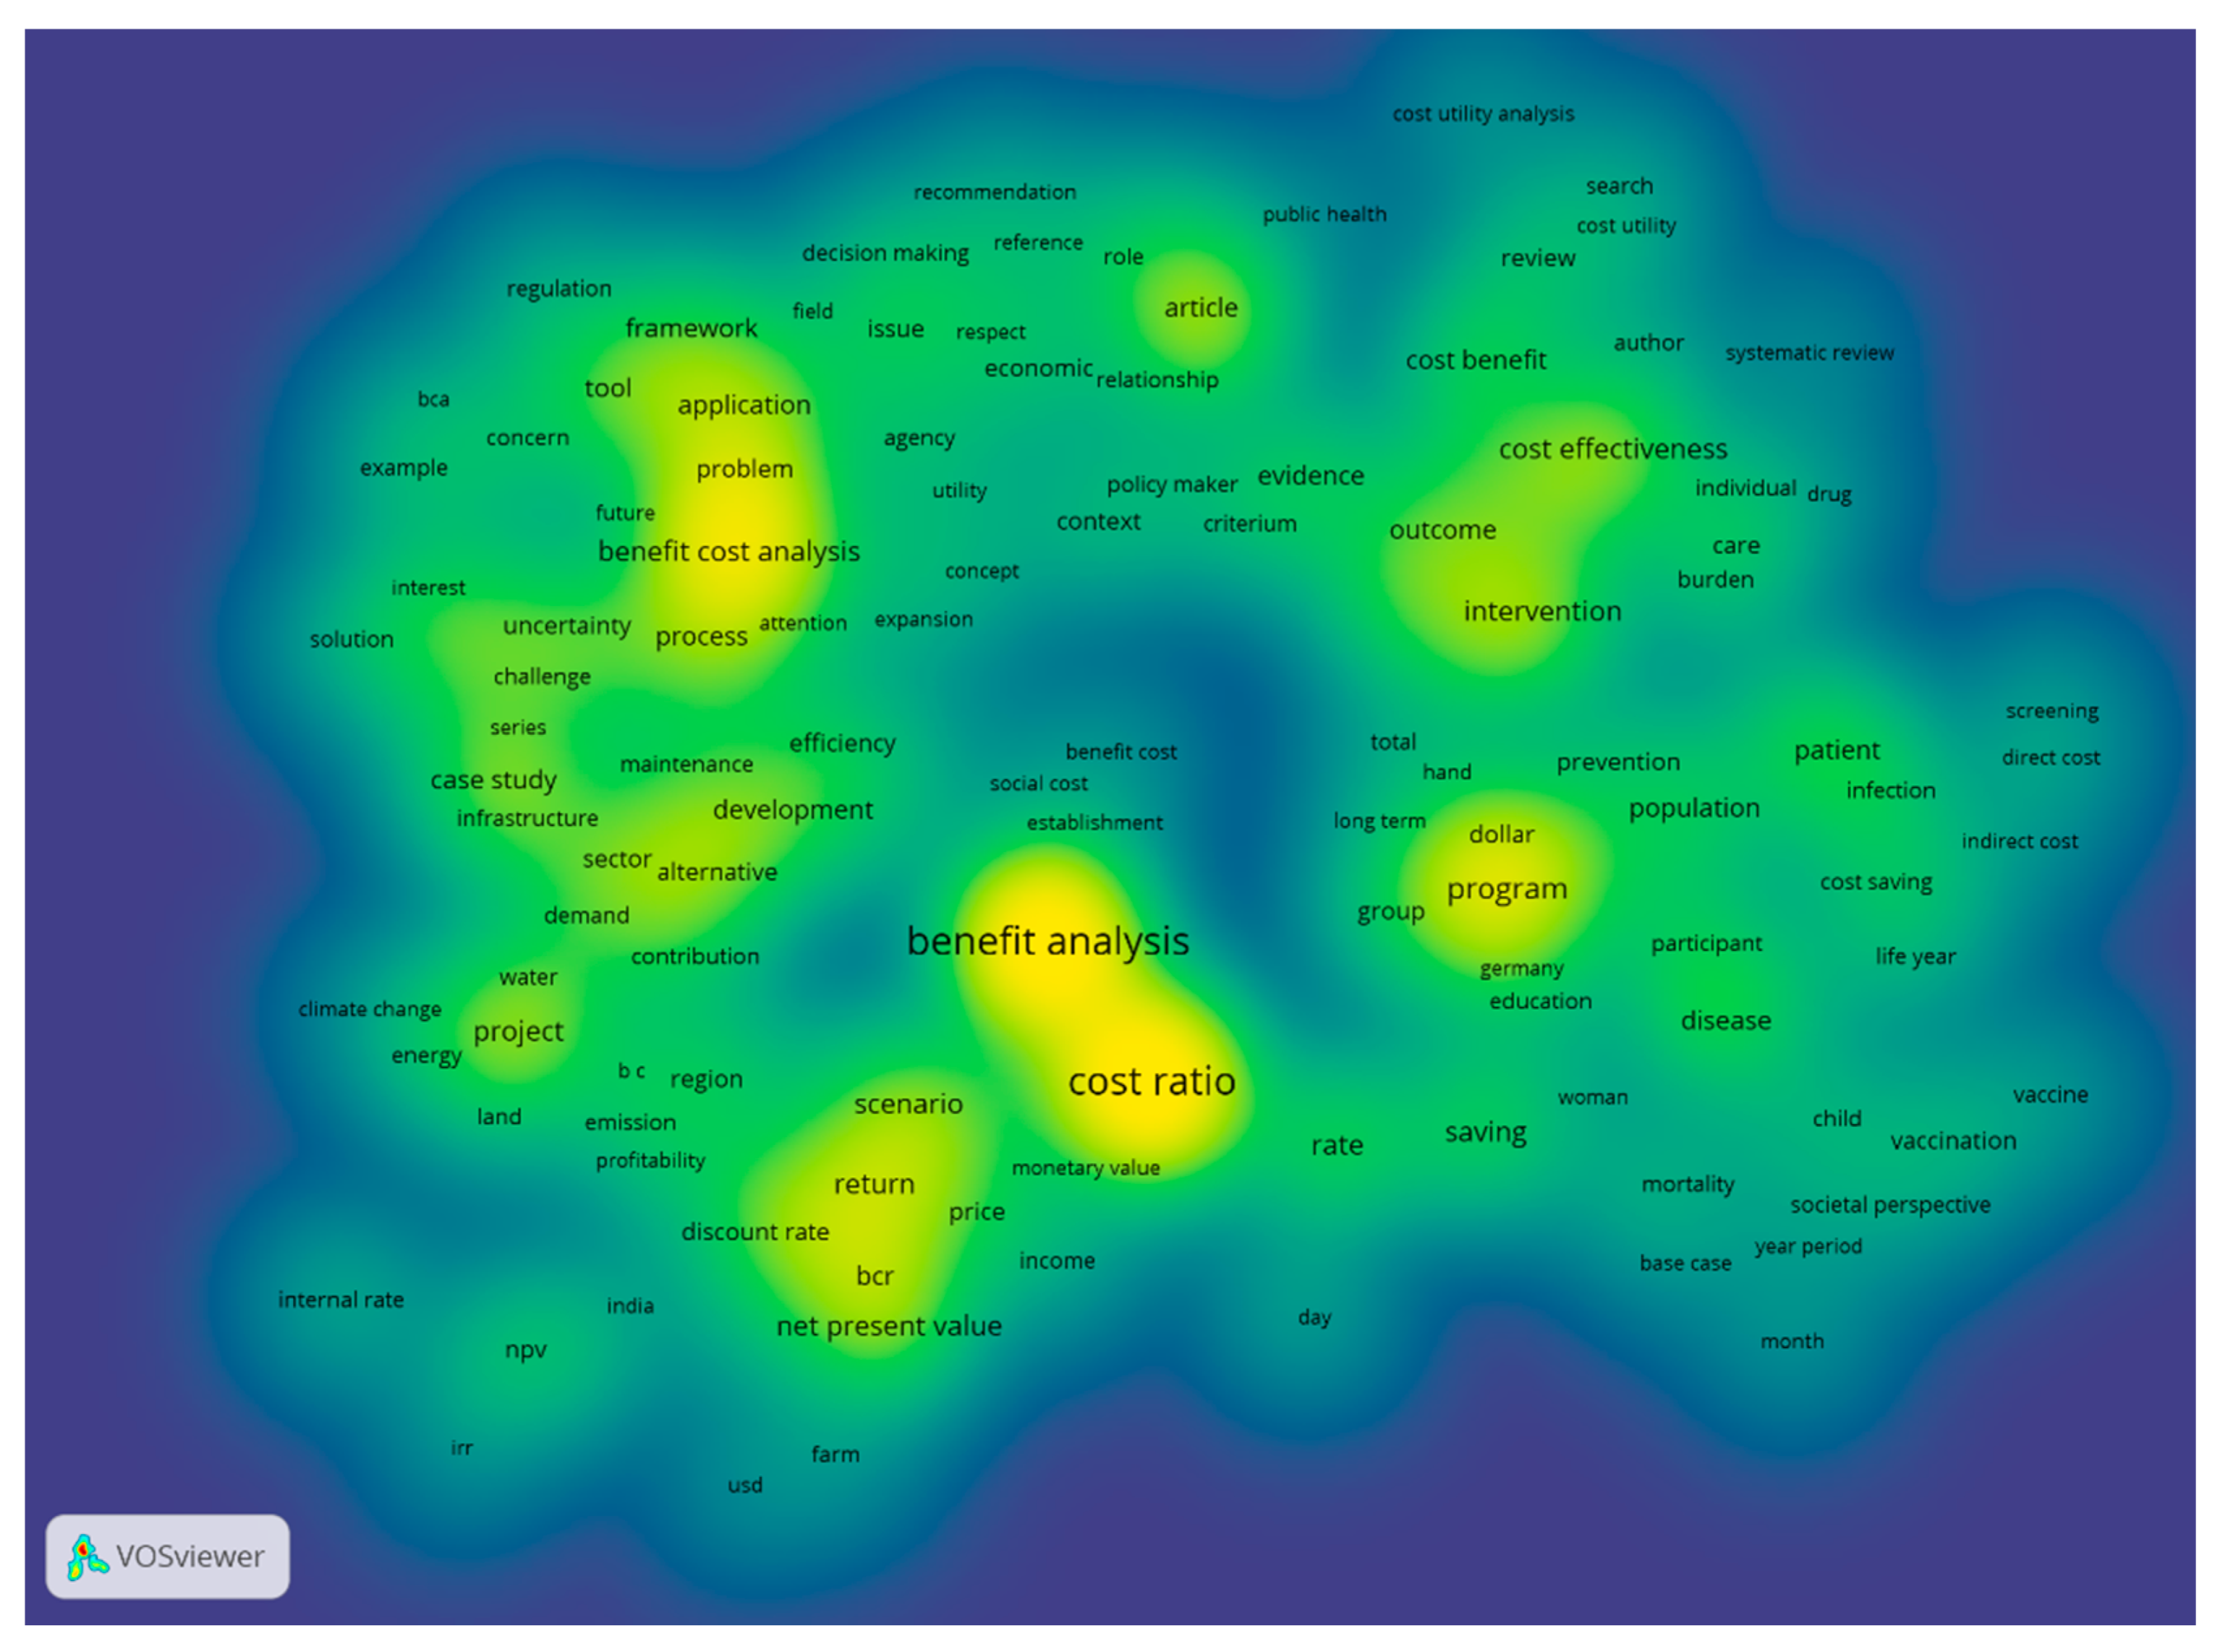
We examined the links in which the terms appeared more than 10 times. The maps were created based on network data, which indicate the number of documents that occurred at least once. A total of 14,933 terms were found, 308 met the threshold, and the 60% were selected, which is equivalent to 185 outputs of the most relevant terms. Just as in the case of the co-authorship, we performed a density analysis for co-occurrence based on document weights (see Figure 10). Our density map is important for the classification of items and for judging where links could potentially be formed. In this case, it is possible to identify the clear dominance of terms such as benefit analysis, cost ratio, benefit cost analysis, and program. Evidently, these frequently used terms correspond to the researched topic.
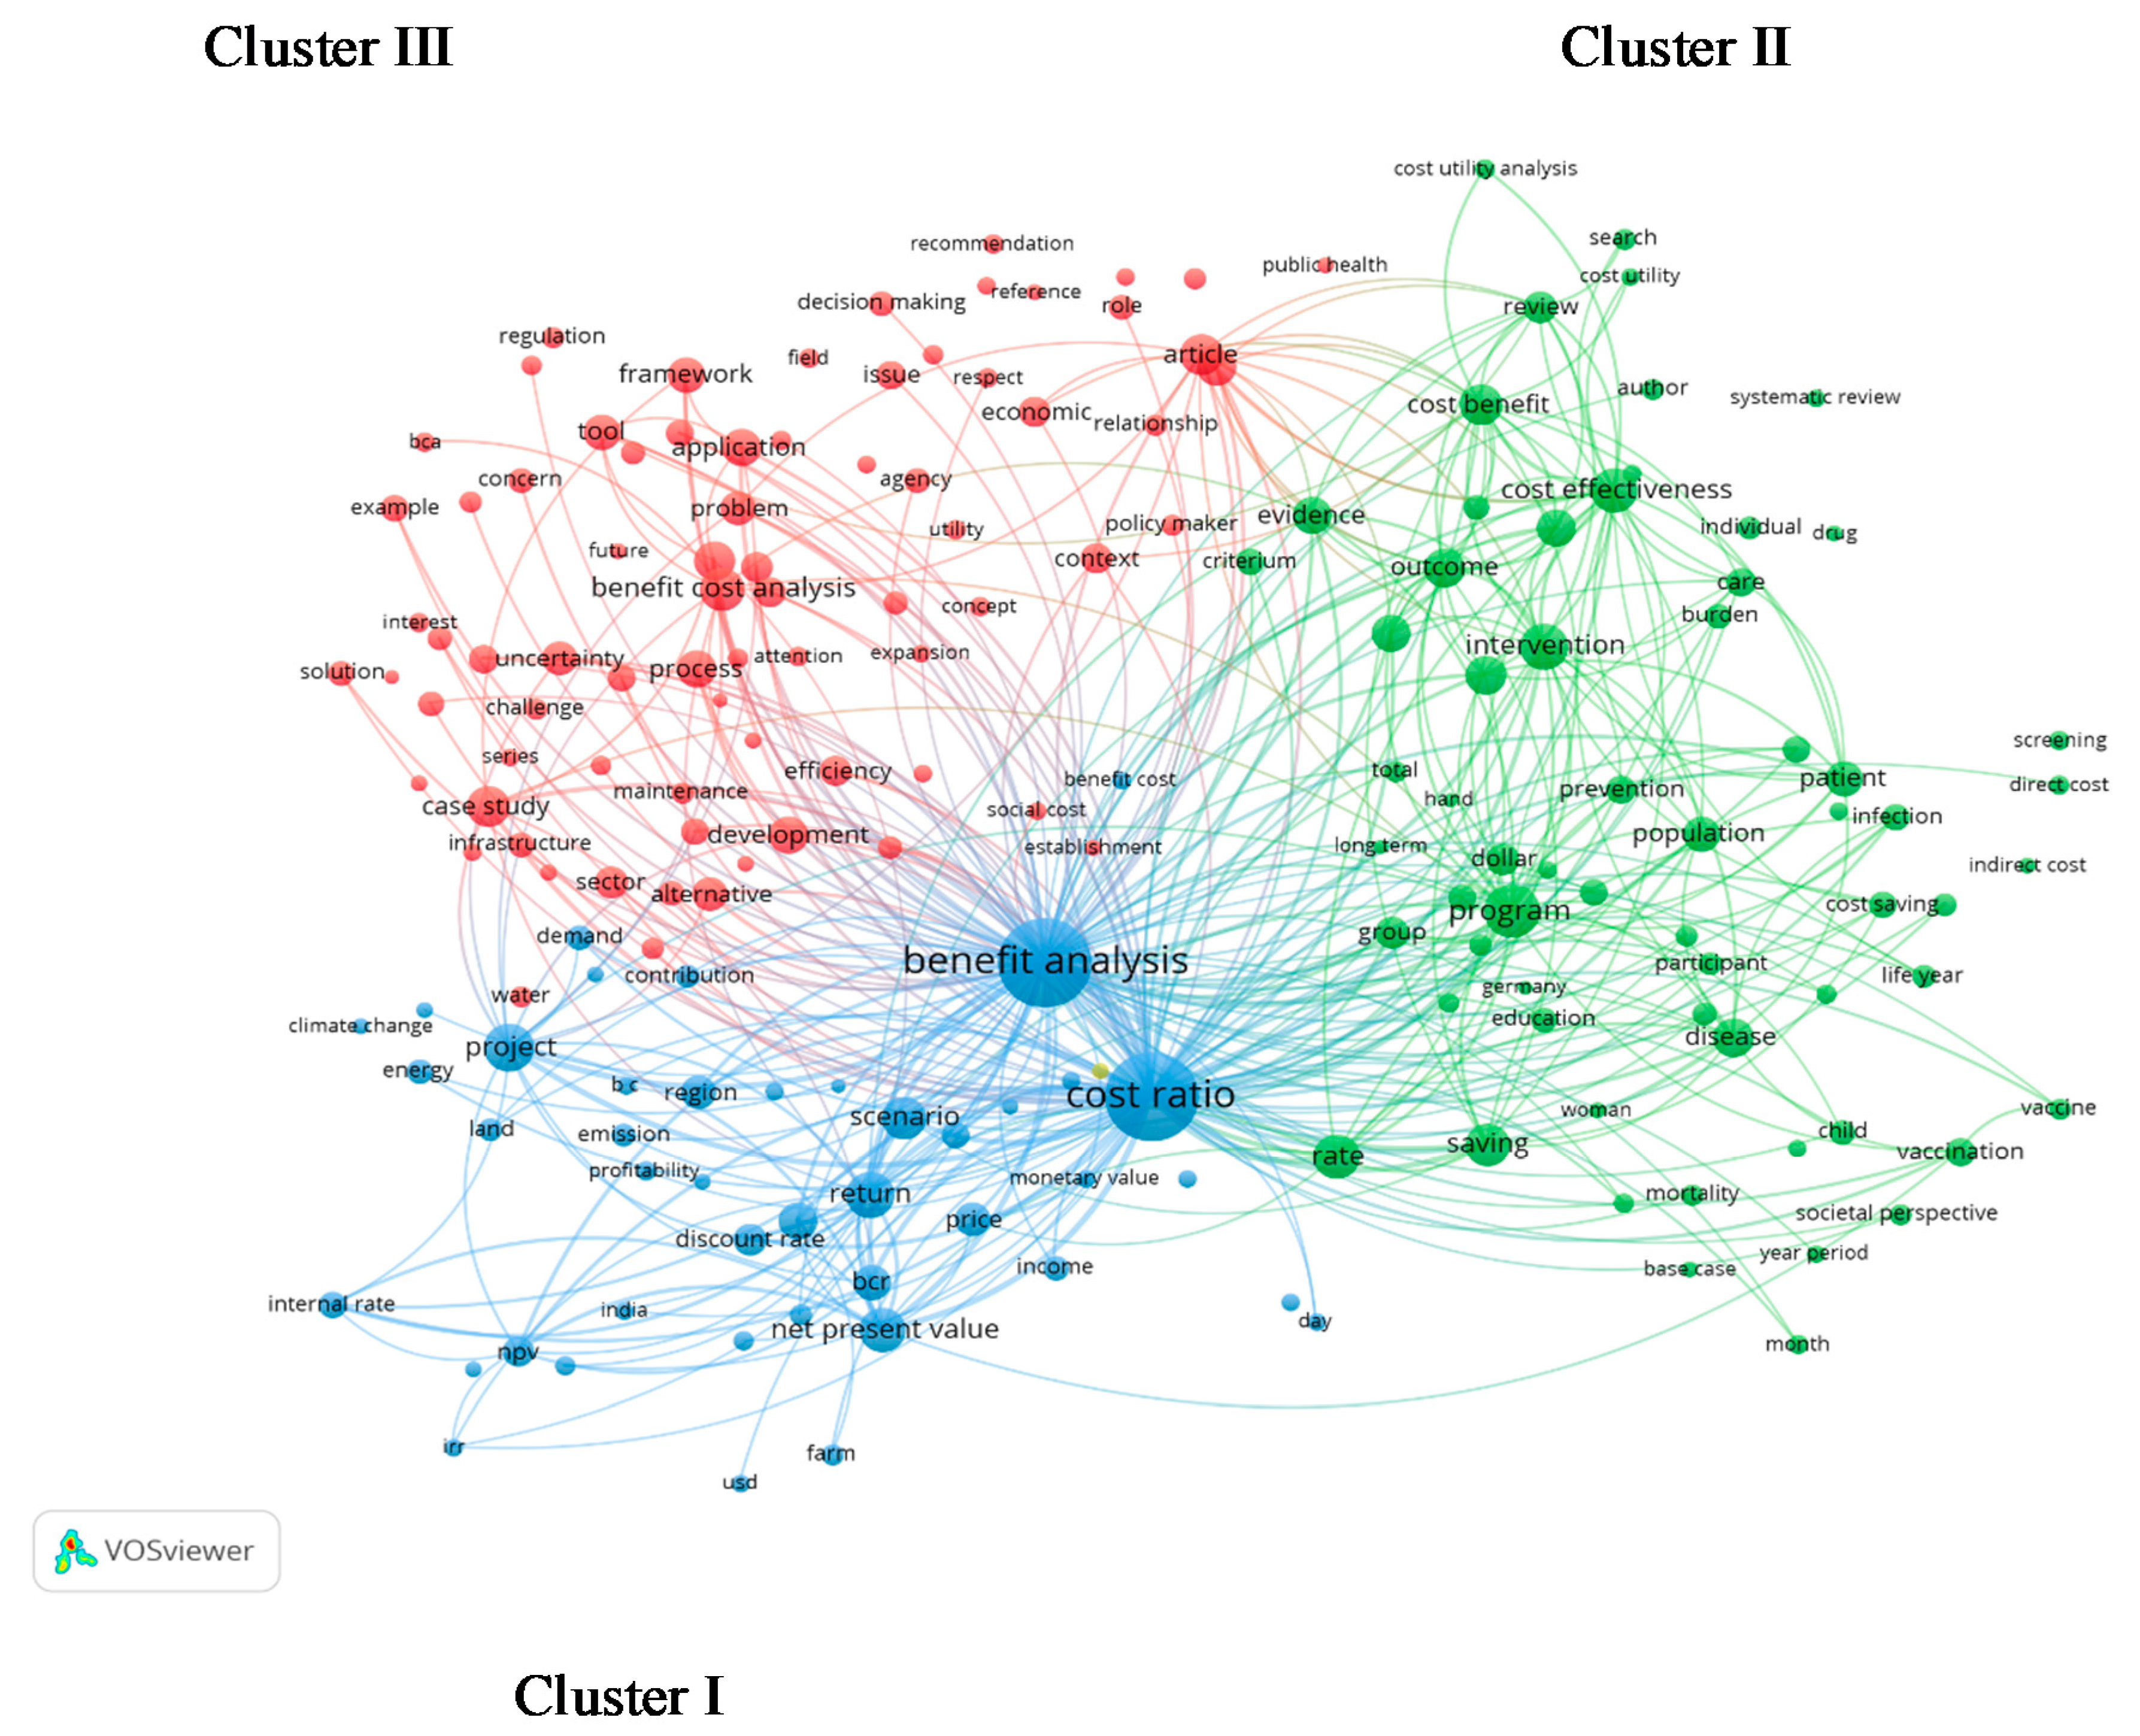
After identifying the most used terms, we then ascertained the links between them through the formation of clusters. For this purpose, the network visualization was created and is displayed in Figure 11. On the map, we can see that the research directions fall into three clusters (I–III) according to the similarities of the items.
Cluster I, represented by the color blue, shows the economic/financial direction and includes the co-occurrence of terms such as benefit analysis, cost ratio, scenario, return, net present value, and project. This cluster is dominant in comparison with others; the terms such as benefit analysis and cost ratio are logically, with respect to the area of focus, the most common items here. The items found in this research direction occurred the most frequently in a comparison of all three clusters, with the lines indicating close links to the other two clusters. However, this cluster consists of the smallest number of terms. Cluster II in green illustrates the medical direction, with the co-occurrence of terms such as program, intervention, cost effectiveness, patient, disease, infection, and care. This cluster is conceptually the most extensive, with most items having closer links to each other, and especially to cluster one. The connection with cluster three can be traced through the terms “program” (with “case study” and “benefit cost analysis”), “intervention”, “outcome”, “cost effectiveness”, “cost benefit”, and “review”, with the single term “article”. Cluster III is in red and is connected with the practical application of CBA, seen in terms such as benefit cost analysis, case study, development, application, efficiency, framework, or article. In this cluster, the terms do not occur in the outputs so often (the bubble size is not so large), and are mainly associated with cluster I, more often than within the same cluster.
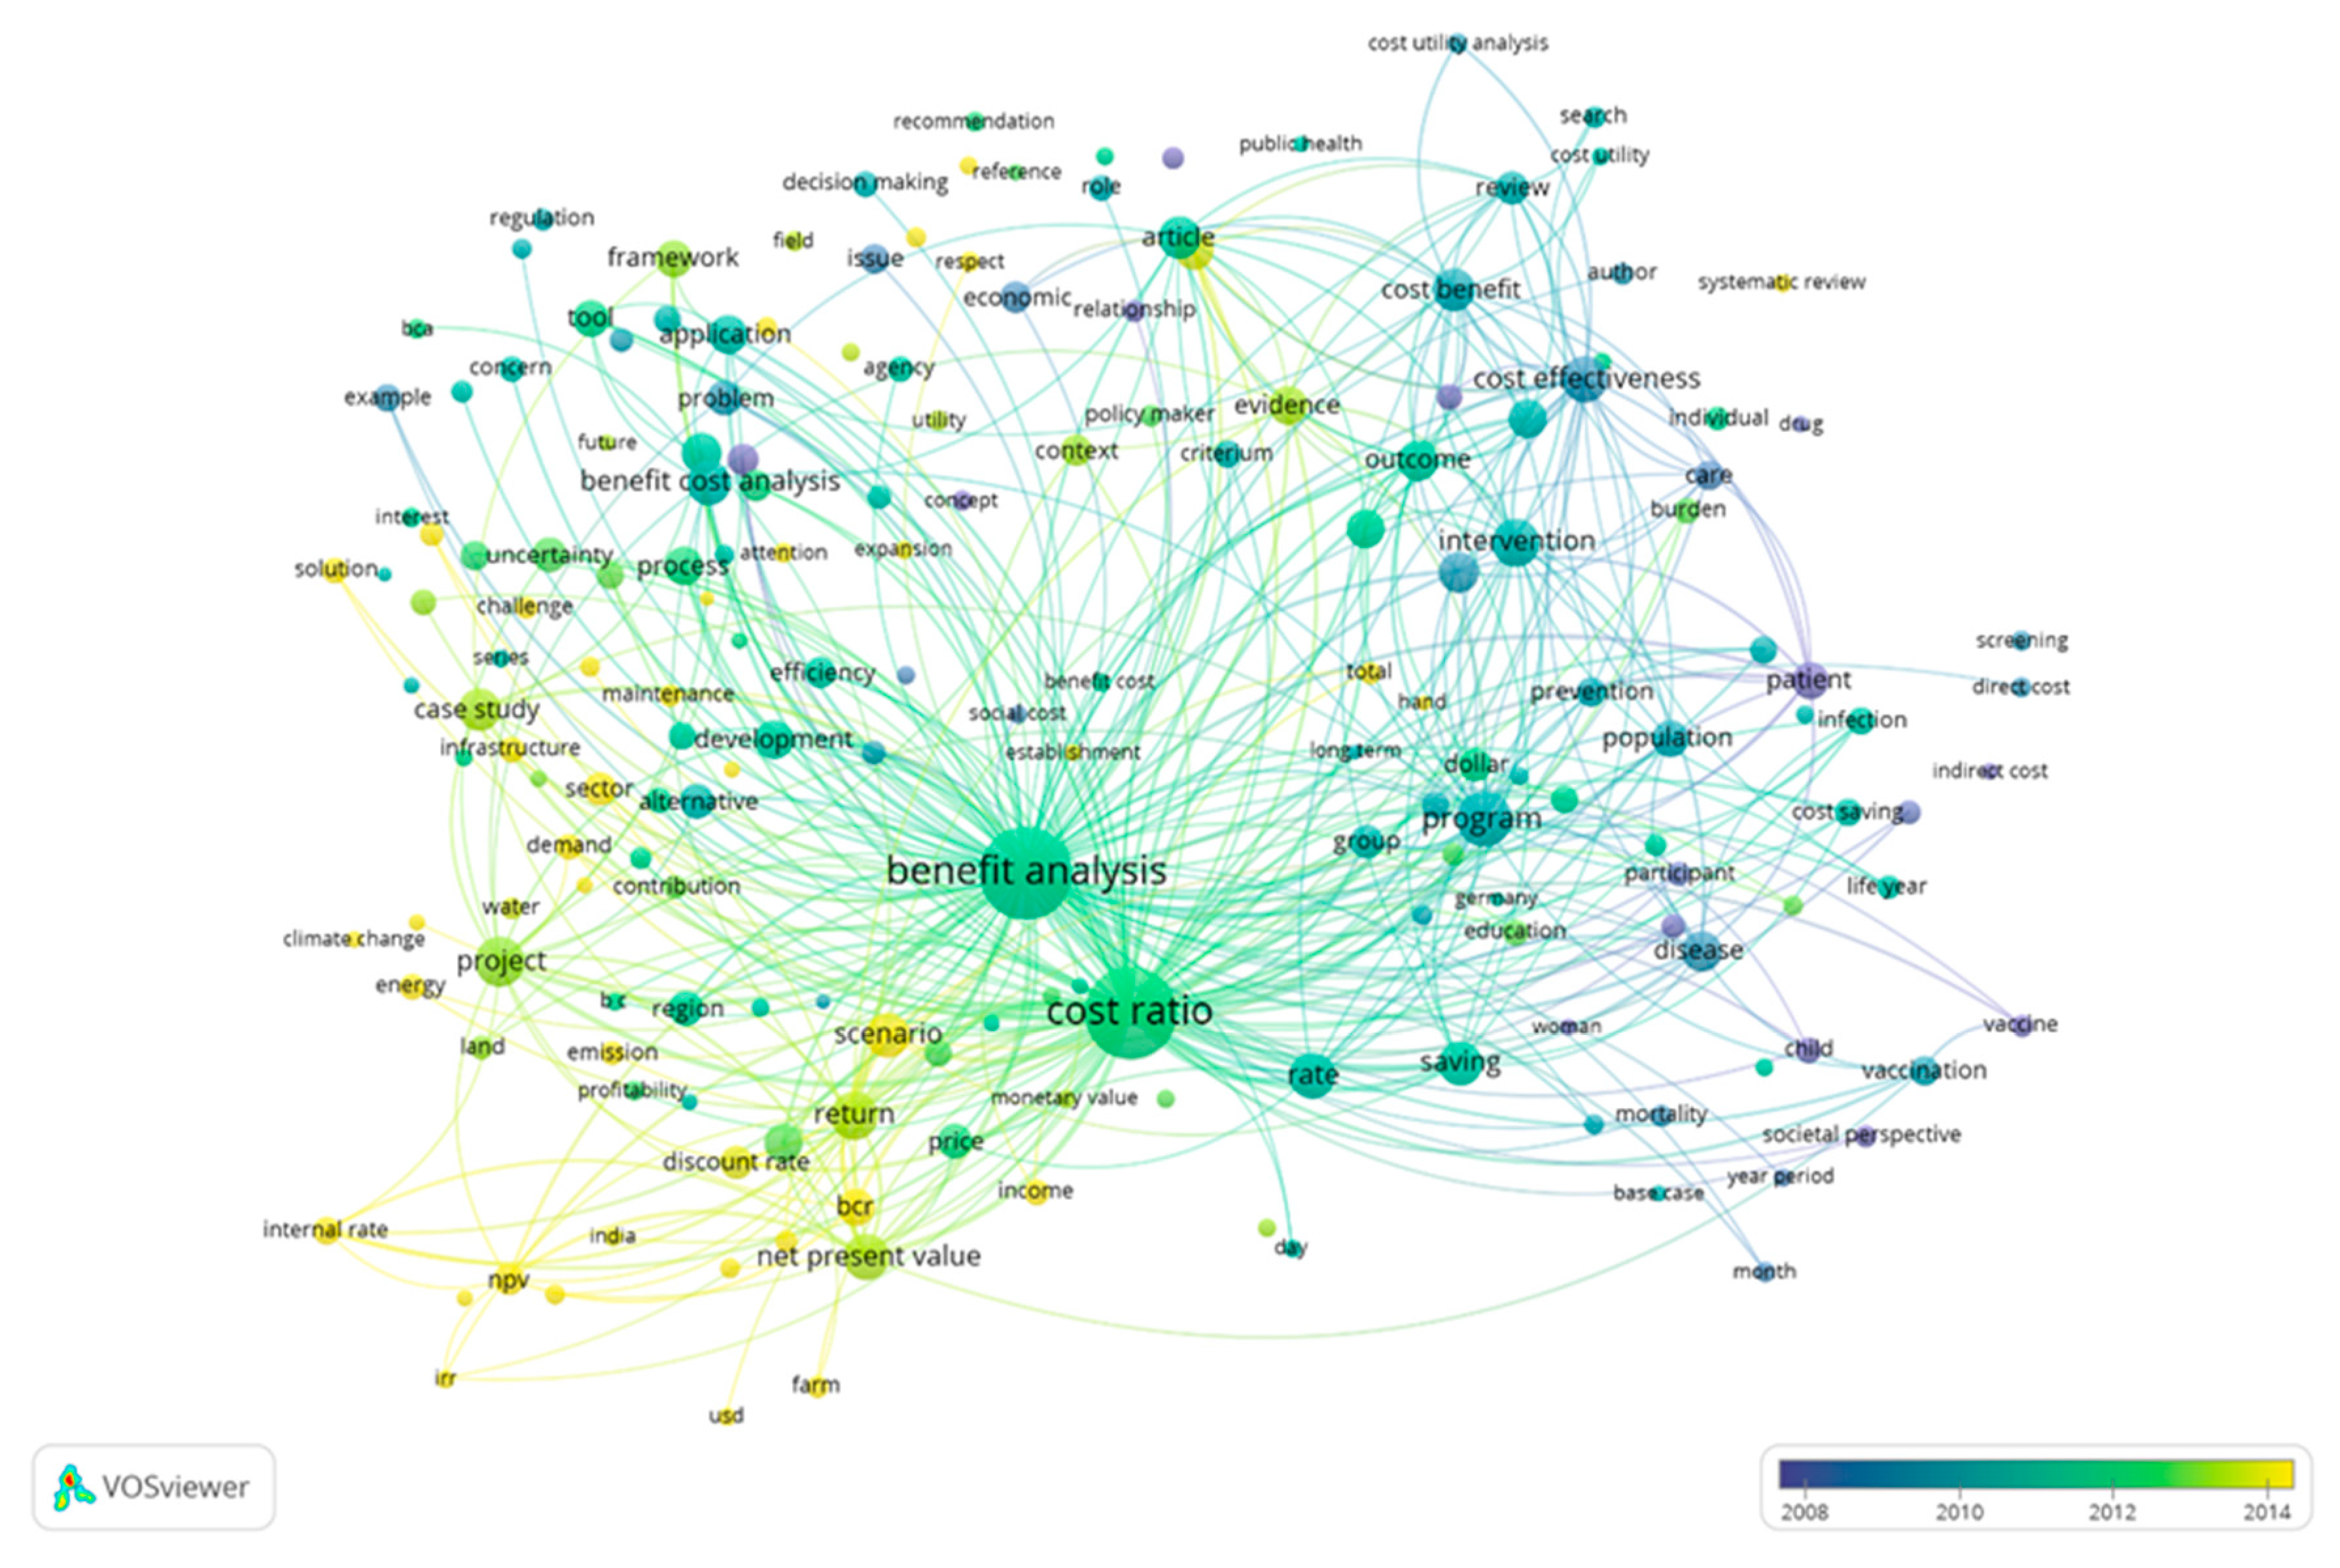
The “movement” of co-occurred terms over the thirty years of the studied period is displayed in Figure 12. In this image, we can observe the shift from the medical field (cluster II) at the beginning of the monitored period to more economic and financial fields (mostly cluster I, accompanied by cluster III, with items such as sector, demand, solution, infrastructure, or case study) in the last ten years.
4. Discussion
Using the advanced search of the term “cost benefit analysis”, 595 outputs were generated between the years 1990 and 2020. There has been an increase in outputs in the last ten years, which indicates a growing interest of experts in this topic. In our opinion, there are two reasons for this increase—a growing need for an economic evaluation of (non)investment projects and pressure on experts to publish the valuable and highly rated results of their research. Most of these outputs were articles, followed by proceedings papers, and then reviews (the difference between these types was more than 400 outputs). The quality of the outputs was high, which is also confirmed by the high impact factors of the journals in which these articles were published. The country where most of the authors came from was the USA, which produced 30% more outputs during the monitored period than the second and third countries (Australia and the United Kingdom). If we include only the “top ten” countries in the statistics, this difference would be as much as six percent more.
In spite of the fact that we cannot compare the results of the bibliometric analysis in the field of CBA in terms of co-occurrences due to the absence of similar publication outputs, we can support some results of previous studies in other research areas in relation to our other findings.
Firstly, with regard to the trend in research interest involving CBA, we found that despite the predominance of economically oriented research (in all areas), environmental issues have come to the fore. This view is also shared by Molinos-Senante et al. (2010) who argued that the use of CBA has three phases of development: 1. traditional (a clear economic) approach, 2. socio-economic approach (equitable income distribution), and 3. environmental approach (environmental externality valuation). This corresponds to both the results of the articles´ analyses published in WoS and the results of the bibliometric analysis.
Secondly, concerning the leading countries in research, Hou et al. (2015) claimed that the US was the most productive country in the field of life cycle assessment; Lindhjem et al. (2015) found the same results in the field of health intervention. Similarly, Acevedo Prins et al. (2017) or Capobianco-Uriarte et al. (2019) stated that the United States was the most productive country in terms of scientific papers about competitiveness. In the field of smart technologies, Fellnhofer (2018) claimed that the USA, Germany, England, the Netherlands, and Australia were the top five countries in terms of outputs, which is very similar to our findings.
Thirdly, the predominance of English, as the lingua franca of science is due to the fact that it is the language most able to transcend national boundaries and enhance research impact. Moreover, English publications in mainstream impact journals have the additional value of fulfilling one of the most important requirements for research assessment. Stockemer and Wigginton (2019) stated that those researchers who agree with the statement that publishing in English increases the reputation of their work submit 63% of their articles in English. Ramírez-Castañeda (2020) mentioned an even higher share—she claimed that 98% of scientific publications are written in English. We found the same result: 98% of CBA-related publications have been published in English. This means that one percent of ENR produced 1.5 percent of the articles on average, in comparison with non-ENR who have written only 0.07% outputs per one percent of persons during the monitored period. These results confirm our assumption set in Q2 and show the publishing gap among ENR and non-ENR. Closing this gap is a challenge, and the reasons are clear—publishing in a prestigious and international range of journals is connected with increasing one’s professional reputation or with institutional requirements for funding.
Fourthly, the issue of co-authorship, which is closely linked to the use of English. With respect to this, we have the same opinion as Perianes-Rodríguez et al. (2010) who claimed that the resulting groups showed not only individual relationships, but rather how these relationships were able to draw authors together in larger structures. We also corroborated the result of Acedo et al. (2006) about the growing tendency of co-authored papers. Adams (2012) claimed that collaborative papers tended to get cited more often because the authors were more likely to be doing excellent research—for example, research papers published jointly by UK and US authors are cited, on average, more often than those published by either nation domestically. The results of our bibliometric analysis support the opinion of Flowerdew and Li (2009) that Chinese scientists are taking an increasingly large share of the total science publications, which is accompanied by co-authorships. In this respect, more intensive cooperation in larger teams is positive, which also brings with it a relevant transfer of information. On the other hand, this brings about some negative aspects—gaps. The first gap is the limited diversification of these teams—at best, it is an entirely bilateral cooperation, with the multinational character missing, the benefits of which were mentioned in the previous section. The second gap is the insufficient level of cooperation between ENR and non-ENR. Most of the outputs are written by ENR, but they have not been among the co-authors in recent papers (they publish mainly separately). There is the possibility, or even the need, for closer cooperation between these two groups of authors in order to increase international cooperation and the amount of quality outputs. Moreover, our findings are similar to the result of Adams (2013), which stated that growth in collaboration has come from bilateral partnerships, and that multinational programs are still marginal (as drivers of performance). In the case of CBA, in the first part of the monitored period (1990–2000), there was cooperation between Israeli and English or American authors. In the second phase (2001–2020), Chinese authors collaborated with either Norwegian or Dutch authors. The share of non-dominant authors is the same in both cases—it is at around 20%. Another claim of Adams (2013) was that 75% of the research output of China has remained entirely domestic, differing slightly from our result, which shows 67% of domestic publications (four of the six co-authorship clusters created are purely Chinese).
Fifthly, the issue of co-occurrence yielded three clusters. Although all were logically connected by a term related to cost-benefit issues, each of them had its own specifics. The first cluster was spatially smaller, but the terms had closer ties and their occurrence was more frequent than in the other two clusters. The second cluster was spatially and conceptually the most extensive, without a significant dominance of any of the concepts and with a narrower time range (at the beginning of the observed period). The third cluster was characterized by the predominance of ties with other clusters rather than within itself. In terms of time, the dynamics of published research areas was evident: at the beginning of the monitored period, medical topics were in the center of attention; over the time, there was an increase in the use of economic and financial terms. This development followed the development of publications in individual research areas—from health issues to environmental issues. This issue of co-occurrence has certain limitations that would be useful to fill or eliminate in future research. It is interesting that there are some items that did not co-occur in any cluster, or that occurred to a very small extent, which in our opinion is very closely related to the issue of CBA. Specifically, there were the expressions of “externality”—which had no co-occurrence, and “profitability”—which had very low co-occurrence in cluster one. Both of these items are necessary for the correct quantification of the cost-benefit analysis; therefore, they should be given due attention, and from the point of view of bibliometric analysis, their occurrence should be more frequent and dominant.
5. Conclusions
In order to more thoroughly describe the current state of using cost-benefit analysis in the scientific literature, and at the same time fill the gap that was found in this direction, data from the Web of Science database were selected and a bibliometric analysis with three kinds of visualizations from the VOSviewer software was used. To meet the above-described objectives, four questions were set.
During of our study we obtained results that helped us to answer these questions. It was first examined whether the economic area of research was most frequented field of CBA outputs (Q1). The answer is ambiguous, depending on the input data; if we analyze the categories and areas in detail, we can answer in the affirmative. However, if we synthesize the categories into larger branch groups, the economic area falls into third place, behind the environmental and health issues. This corresponds to the results of the studies mentioned in the introduction (Appendix A, Table A1). The second question (Q2) concerned to dominance of the English language and English native researchers (ENR) in the area we observed. The results show that almost 98% of outputs published in English are generated by 65% of authors from English-speaking countries.
Based on visualization maps, we can answer another question concerning a change in cooperation between the authors of publications in the monitored period (Q3). There was a change in three directions—geographical, subject of research, and dominance of the authors. In terms of territorial designation, in the sense of shifting from an East-West cooperation (between Israel and English-speaking countries such as the UK and the USA) to a collaboration among non-ENR researchers, such as that between Chinese and North European authors (Norway and Netherlands). A second change was observed in the field of the research topic, which shifted from healthcare to environmental and ICT. This corresponds with the current trend—increasingly more attention is paid to environmental issues, which also brings forth the need for an economic evaluation of related projects that are to be financed with public funds. The last and third change concerns the level of dominance. While the beginning of the observed period is characterized by the model of the predominance, or a central author in collaboration with non-dominant co-authors, the second phase is characterized by the chaining of co-authors without a significant dominance.
The last question (Q4) concerned the similarity and statics of co-occurrence over time. For this purpose, three clusters were created: the most frequent was the cluster connected to the field of the economic financial analysis (with items such as benefit analysis, cost ratio, or net present value). The second cluster had fewer common co-occurred terms related to health issues (with items such as “program”, “intervention”, and “cost benefit/effectiveness”). The third one was related to the application process of CBA, with terms such as “benefit cost analysis”, “case study”, “article”, or “development”.
This paper´s contribution to the theory has two dimensions—originality and utility. The originality of the paper lies in the fact that it presents a collection of publishing activities in the field of cost-benefit analysis in last three decades by using different visualizations of the issue. The utility of our paper could be represented as follows: The findings, including recommendations, can be used as a basis for the outputs of other authors, especially from the perspective of the state of current knowledge, filling the gaps as well as the controversies found. The collaboration of authors from various countries can improve the knowledge on this topic and spread it faster to other researchers and scientists. Similarly, from the perspective of governments and policy makers, the identification of research topics and the support for research teams can be important, not only in terms of finding effective types of publicly funded projects, but also in terms of competitiveness. Increasing competitiveness through R&D, with a focus on multinational projects, and the support of excellent researchers in order to speed up the dissemination of knowledge and skills should be given priority by all policy makers in this field. The findings and results also have practical implications, which are relevant to the content and required results of the project within which this article was created, and in which CBA is the main method used for evaluating the impact of smart technologies in various areas of life and on its quality. Our findings can be used in the pedagogical practice for describing theoretical and practical approaches to cost-benefit analysis, within courses that are focused on the economic evaluation of projects, business plans, or public procurement.
We are aware of the limitations associated with this article, especially with the use of a single source database, one kind of counting in bibliometric analysis, or the use of (only) the CBA. As this is the first mapping of this topic, we will try to perform a deeper analysis in terms of using other source databases (Scopus, grey literature databases) or software in the near future. It may be interesting to compare two methods of bibliometric analyses—while we used binary counting in the case of co-occurrence, subsequent research may be based on the clustering of terms through the method of full counting, which can produce different outputs. We believe that we can find interesting results published by non-ENR and those non-indexed in the Clarivate Analytics database. We would also like to extend our findings to co-citation analysis and compare the related methods such as cost utility or cost effectiveness analysis with CBA, as they can also reveal interesting results or gaps.
Although Barfod and Salling (2015) argued that CBA is inadequate to incorporate and assess multiple and often conflicting objectives, criteria, and attributes, we object to it. Based on a search of the available literature and its use in practice, this method is especially beneficial for determining costs and (social) benefits as well as necessary for the decision-making processes of project implementation. We can thus support the idea of Sen (2000) that although the CBA is a general discipline with foundational principles, which are not altogether controversial, it is nevertheless considered plausible.
Author Contributions
Conceptualization, I.M.; methodology, I.M.; validation, A.A.; formal analysis, I.M.; resources, I.M.; data curation, I.M.; writing—original draft preparation, I.M.; writing—review and editing, A.A.; visualization, I.M. All authors have read and agreed to the published version of the manuscript.
Funding
This research was funded by the grand project “SMART Technologies to Improve the Quality of Life in Cities and Regions”, grant number CZ.02.1.01/0.0/0.0/17_049/0008452.
Institutional Review Board Statement
Not applicable.
Informed Consent Statement
Not applicable.
Data Availability Statement
Not applicable.
Conflicts of Interest
The authors declare no conflict of interest. The funders had no role in the design of the study; in the collection, analyses, or interpretation of data; in the writing of the manuscript, or in the decision to publish the results.
Appendix A

Table A1.
Studies using Cost-Benefit Analysis in bibliometric analysis.
| Authors | Topic | Results | Page/s |
|---|---|---|---|
| Lindhjem et al. (2015) | Preserving forest biodiversity and ecosystem services | Social benefits outweigh costs of the three conservation plans by a large margin. | 202 |
| Pitt et al. (2016) | Economic evaluations of health interventions | A total of 2844 papers were reviewed between 2012 and 2014—5% used CBA for the economic evaluation. | 19 |
| Olawumi et al. (2017) | Building Information Modelling (BIM) processes | CBA was used in more than 10% of BIM processes. | 1067 |
| Tran et al. (2019) | Economic evaluation of the papers and citations on HIV/AIDS | 372 WoS papers were selected and 12 of them used the cost-benefit analyses. | 1 |
| Ayodele and Mustapa (2020) | Articles published with the subject area in (eco)energy | 42 articles (2001–2020) with items CBA, electric vehicles, charging batteries, cost-effectiveness, and cost analysis. | 6 |
| Luo et al. (2020) | Literature review, citation and co-citation analysis of agricultural co-operatives | In the monitored period 2013–2019, the studies focused on cost-benefit issues. | 10 |
| Chen et al. (2020) | Ecosystem services–related literature with economic evaluation | CBA is one of frequently used methods of evaluation in ecosystem services. | 23,509, 23,510 |
| Rezapour et al. (2020) | Health economic evaluation in Iranian journals | 134 articles evaluated in 1998–2017 and 5.2% of them used CBA. | 99 |
| Ramos et al. (2020b) | Review the literature on logistics and supply chain costs | A review of 756 articles published from 2014 to 2019; CBA belongs to the top ten frequent co-occurrences. | 12 |
| Medina-Mijangos and Seguí-Amórtegui (2020) | Economic aspects of municipal solid waste management systems | CBA is the principal method used to analyze the economic aspects of waste management systems. | 11 |
Appendix B
Table A2.
Existing studies using Cost-Benefit Analysis.
| Field of Study | Type of Good/s | Author/s (h-index) | Country of Origin | Title of Publication | Authors (year) | Type of Study and Source |
|---|---|---|---|---|---|---|
| Economic development;Technological change | Multi-generation technology diffusion; Technology evaluation | (31) Sohn, So Y. and (1) Byung J. Ahn | South Korea | Multigeneration diffusion model for economic assessment of new technology. | Sohn and Ahn (2003) | Journal article published in Technological Forecasting and Social Change. 70: 251–264. |
| Education; Science and Engineering | Virtual and remote labs | (12) Heradio, Ruben, (11) de la Torre Luis, (5) Galan, Daniel, (28) Cabrerizo, Francisco J., (88) Herrera-Viedma Enrique and (35) Sebastian Dormido | Spain | Virtual and remote labs in education: A bibliometric analysis. | Heradio et al. (2016) | Journal article published in Computers & Education. 98: 14–38. |
| Engineering | Process system failure and reliability | (7) Amin, Tanjin Md., (61) Khan, F. and (60) Ming J. Zuo | Canada | A bibliometric analysis of process system failure and reliability literature. | Amin et al. (2019) | Journal article published in Engineering Failure Analysis. 106: 104152. |
| Intelligent compaction | (12) Liu, Donghai, (1) Wang, Youle, (5) Chen, Junjie and (0) Yalin Zhang | China | Intelligent compaction practice and development: a bibliometric analysis. | Liu et al. (2019) | Journal article published in Engineering, Construction and Architectural Management. 27: 1213–1232. | |
| Building Information Modelling (BIM) | (11) Olawumi, Timothy O., (2) Chan, Daniel W.M. and (22) Johny K.W. Wong | China, Australia | Evolution in the intellectual structure of BIM research: a bibliometric analysis. | Olawumi et al. (2017) | Journal article published in Journal of Civil Engineering and Management. 23: 1060–1081. | |
| Smart Factory | (21) Strozzi, Fernanda, (14) Colicchia, Claudia, (11) Creazza, Alessandro and (6) Carlo Noè | Italy, UK | Literature review on the ‘Smart Factory’ concept using bibliometric tools. | Strozzi et al. (2017) | Journal article published in International Journal of Production Research. 55: 6572–6591. | |
| Nanotechnology | (4) Rueda, Guillermo, (5) Gerdsri, Pisek and (15) Dundar F. Kocaoglu | USA | Bibliometrics and Social Network Analysis of the Nanotechnology Field. | Rueda et al. (2007) | Conference paper published in PICMET ‘07—2007 Portland International Conference on Management of Engineering & Technology. Portland, OR, USA, 5–9 August 2007, pp. 2905–2911 | |
| Environmental Economics | Ecosystem services | (21) Chen, Wei, (70) Geng, Yong, (12) Zhong, Shaozhuo, (2) Zhuang, Mufan and (11) Hengyu Pan | China | A bibliometric analysis of ecosystem services evaluation from 1997 to 2016. | Chen et al. (2020) | Journal article published in Environmental Science and Pollution Research. 27: 23503–23513. |
| Forest biodiversity; Ecosystem services | (15) Lindhjem, Henrik, (9) Grimsrud, Kristine, (30) Navrud, Stale and (6) Stein O. Kolle | Norway | The social benefits and costs of preserving forest biodiversity and ecosystem services. | Lindhjem et al. (2015) | Journal article published in Journal of Environmental Economics and Policy. 4: 202–222. | |
| Agricultural co-operatives | (4) Luo, Jianli, (1) Han, Huiying, (23) Jia, Fu and (1) Hao Dong | China, UK | Agricultural Co-operatives in the western world: A bibliometric analysis. | Luo et al. (2020) | Journal article published in Journal of Cleaner Production. 273: 122945. | |
| Municipal solid waste | (2) Medina-Mijangos, Rubi and (3) Luis Seguí-Amórtegui | Spain | Research Trends in the Economic Analysis of Municipal Solid Waste Management Systems: A Bibliometric Analysis from 1980 to 2019. | Medina-Mijangos and Seguí-Amórtegui (2020) | Journal article published in Sustainability.12: 8509. | |
| Circular economy;Internet of Things | (3) Nobre, Gustavo C. and (5) Elaine Tavares | Brazil | Scientific literature analysis on big data and internet of things applications on circular economy: a bibliometric study. | Nobre and Tavares (2017) | Journal article published in Scientometrics. 111: 463–492 | |
| Climate change impacts | (43) Ward, Philip J., (22) Jongman, Brenden, (53) Aerts, Jeroen C.J.H., (2)Bates, Paul D., (36) Botzen, Wouter J.W., (4) Loaiza, Andres D., (43)Hallegatte, Stephane, (6)Kind, Jarl M., (21)Kwadijk, Jaap, (13)Scussolini, Paolo and (34) Hessel C. Winsemius | The Netherlands, UK, USA | A global framework for future costs and benefits of river-flood protection in urban areas. | Ward et al. (2017) | Journal article published in Nature Climate Change. 7: 642–646 | |
| Green economy | (11) Loiseau, Eleonore, (14) Saikku, Laura, (22) Antikainen, Riina, (10) Droste, Nils, (20) Hansjürgens, Bernd, (14) Pitkänen, Kati, (26) Leskinen, Pekka, (36) Kuikman, Peter and (30) Marianne Thomsen | France, Finland, Germany, The Netherlands, Denmark | Green economy and related concepts: An overview. | Loiseau et al. (2016) | Journal article published in Journal of Cleaner Production. 139: 361–371. | |
| Environmental policies; National Air Pollution Control Plan | (2) Zhang, Jing, (9) Jiang, Hongqiang, (10) Zhang, Wei, (7) Ma, Guoxia, (3) Wang, Yanchao, (10) Lu, Yaling, Hu, Xi, (6) Zhou, Jia, (6) Peng, Fei, (48) Bi, Jun and (32) Jinnan Wang | China | Cost-benefit analysis of China’s Action Plan for Air Pollution Prevention and Control. | Zhang et al. (2019) | Journal article published in Frontiers of Engineering Management. 6: 524–537 | |
| Residential buildings | (4) Camarasa, Clara, (6) Nägeli, Claudio (11) Ostermeyer, York, (9) Klippel, Michael and (2) Sebastian Botzler | Sweden, Switzerland, Germany | Diffusion of energy efficiency technologies in European residential buildings: A bibliometric analysis. | Camarasa et al. (2019) | Journal article published in Energy and Buildings. 202: 109339. | |
| Smart energy systems; Intelligent technology | (16) Kikuchi, Yasunori | Japan | Simulation-Based Approaches for Design of Smart Energy System: A Review Applying Bibliometric Analysis. | Kikuchi (2017) | Journal article published in Journal of Chemical Engineering of Japan. 50: 385–396 | |
| Smart Grid | (15) Becchio, Cristina, (22) Bottero, Marta, (35) Corgnati, Stefano P. and (11) Frederico Dell’Anna | Italy | Cost-benefit analysis and smart grids projects. | Becchio et al. (2016) | Conference paper published in Proceedings of Conference: SBE16 Towards Post-Carbon Cities, Turin, Italy. 17–19 February 2016, pp. 278–287 | |
| Sustainable Global Sourcing | (29) Jia, Fu and (1) Yan Jiang | China, UK, Italy | Sustainable Global Sourcing: A Systematic Literature Review and Bibliometric Analysis. | Jia and Jiang (2018) | Journal article published in Sustainability. 10(3), 595 | |
| Health Economics | Health economic evaluation | (19) Rezapour, Aziz, (1) Moradpour, Amirali, (6) Panahi, Sirous, Javan-noughabi, (5) Javad and (7) Sajad Vahedi | Iran | Health Economic Evaluation in Iran (1998–2017), a Bibliometrics Analysis. | Rezapour et al. (2020) | Journal article published in International Journal of Pharmaceutical and Phytopharmacological Research. 10: 95–102 |
| HIV/AIDS | (55) Tran, Bach X., (28) Nguyen, Long H., Turner, Hugo C., (17) Nghiem, Son, (23) Vu, Giang T., Nguyen, Cuong T., (61) Latkin Carl A., (4) Ho, Cyrus S. H. and (48) Roger C. M. Ho | Vietnam, Australia, USA, Singapore | Economic evaluation studies in the field of HIV/AIDS: bibliometric analysis on research development and scopes (GAPRESEARCH). | Tran et al. (2019) | Journal article published in BMC Health Serv Res. 19: 834. | |
| Household Finance | Financial literacy | (8) Goyal, Nihit | Singapore | A “review” of policy sciences: bibliometric analysis of authors, references, and topics during 1970–2017. | Goyal (2017) | Journal article published in Policy Sciences. 50: 527–537. |
| Industry studies; Biotechnology | Life cycle assessment; Biorefineries | (1) Lima, Richardson S., (11)de Azevedo Caldeira-Pires, Armando and (1)Alexandre N. Cardoso | Brazil | Uncertainty Analysis in Life Cycle Assessments Applied to Biorefineries Systems: A Critical Review of the Literature. | Lima et al. (2020) | Journal article published in Process Integr Optim Sustain. 4: 1–13. |
| Management | Interlocking directorates | (16) Caiazza, Rosa and (10) Michele Simoni | Italy | Directorate ties: a bibliometric analysis. | Caiazza and Simoni (2019) | Journal article published in Management Decision, Vol. 57 No. 10, pp. 2837–2851. |
| Logistics and supply chain costs | (3) Ramos, Edgar, (1) Dien, Steven, (1) Gonzales, Abel, (1) Chavez, Melissa and (34) Ben Hazen | Peru, USA, Austria | Supply chain cost research: a bibliometric mapping perspective. | Ramos et al. (2020b) | Journal article published in Benchmarking: An International Journal. (Vol. ahead-of-print). | |
| Public Health | Government-sanctioned supervised injection facility; | (28) Andresen, Martin A. and (15) Eshan Jozaghi | Canada | The point of diminishing returns: an examination of expanding Vancouver’s Insite. | Andresen and Jozaghi (2012) | Journal article published in Urban Studies. 49: 3531–3544 |
| Supervised injection facility | (28) Andresen, Martin A. and (4) Neil Boyd | Canada | A cost-benefit and cost-effectiveness analysis of Vancouver’s Safe Injection Facility. | Andresen and Boyd (2010) | Journal article published in International Journal of Drug Policy 21: 70–76. | |
| Health interventions | (3) Drummond, Michael F., (19) Weatherly Helen and (14) Brian Ferguson | UK | Economic evaluation of health interventions: a broader perspective is needed that include potential cost and benefits for all stakeholders. | Drummond et al. (2008) | Journal article published in British Medical Journal. 337: a1204. | |
| Methods of valuing savings in human life | (25) Ginsberg, Gary M. | Israel | Cost-Effectiveness Analysis, Cost-Benefit Analysis and the Value of Life in Health Care and Prevention. | Ginsberg (1990) | Journal article published in Laaser U., Roccella E.J., Rosenfeld J.B., Wenzel H. (eds) Costs and Benefits in Health Care and Prevention. Springer, Berlin, Heidelberg | |
| A policy of immunising | (25) Ginsberg, Gary M. and (18) Theodore H. Tulchinsky | Israel | Costs and benefits of a second measles inoculation of children in Israel, the West Bank, and Gaza. | Ginsberg and Tulchinsky (1990) | Journal article published in Journal of Epidemiology & Community Health. 44: 274–280 | |
| Treating schizophrenia | (25) Ginsberg, Gary, (7) Shani, Segev and (20) Boaz Lev | Israel | Cost-Benefit Analysis of Risperidone and Clozapine in the Treatment of Schizophrenia in Israel. | Ginsberg et al. (1998a) | Journal article published in Pharmacoeconomics.13: 231–241 | |
| Economic valuation | (20) Hansjürgens, Bernd | Germany | Economic valuation through cost-benefit analysis—possibilities and limitations. | Hansjürgens (2004) | Journal article published in Toxicology. 205: 241–252. | |
| Supervised injection facilities | (3) Irwin, Amos, (12) Jozaghi, Ehsan, (39) Bluthenthal, Ricky N. and (45) Alex H. Kral | USA, Canada | A cost-benefit analysis of a potential supervised injection facility in San Francisco, California, USA. | Irwin et al. (2017) | Journal article published in Journal of Drug Issues. 47: 164–184. | |
| Yoga therapy | (9) Jeter, Pamela E., (2) Slutsky, Jeremiah, (11) Singh, Nilkamal and (0) Sat Bir S. Khalsa | USA | Yoga as a Therapeutic Intervention: A Bibliometric Analysis of Published Research Studies from 1967 to 2013. | Jeter et al. (2015) | Journal article published in The Journal of Alternative and Complementary Medicine. 21(10) | |
| Water supply investments and cholera vaccination | (28) Jeuland, Marc and (39) Dale Whittington | USA, UK | Cost-benefit comparisons of investments in improved water supply and cholera vaccination programs. | Jeuland and Whittington (2009) | Journal article published in Vaccine. 27: 3109–3120 | |
| Dengue fever | (1) Maula, Ahmad W., (9) Fuad, Anis and (14) Adi Utarini | Indonesia | Ten-years trend of dengue research in Indonesia and South-east Asian countries: a bibliometric analysis. | Maula et al. (2018) | Journal article published in Global Health Action. 11: 1504398 | |
| CT colonography (CTC) | (8) Mohammed, Mohammed F., (3) Chahal, Tejbir, (11) Gong, Bo, (11) Bhulani, Nizar, (0) O’Keefe, Michael, (2) O’Connell, Timothy, Nikolaou, Sawas and (24) Faisal Khosa | Canada, Saudi Arabia, USA | Trends in CT colonography: bibliometric analysis of the 100 most-cited articles. | 2017 | Journal article published in The British Journal of Radiology. 90: 1080. | |
| Vaccinating | (10) Navas, Encarna, (37) Salleras, Luis, (9) Gisbert Ramón, (35) Domínguez, Angela, (1) Timorer Enrique, (3) Ibánez, Dominique and (13) Andreu A. Prat | Spain | Cost-benefit and cost-effectiveness of the incorporation of the pneumococcal 7-valent conjugated vaccine in the routine vaccination schedule of Catalonia (Spain). | Navas et al. (2005) | Journal article published in Vaccine. 23(17–18): 2342–2348 | |
| Health interventions | (17) Pitt, Catherine, (38) Goodman, Catherine and (41) Kara Hanson | UK | Economic Evaluation in Global Perspective: A Bibliometric Analysis of the Recent Literature. | Pitt et al. (2016) | Journal article published in Health Economics. 25: 9–28. | |
| Transportation Economics | Life cycle cost analysis of electric vehicles | (14) Ayodele, Bamidele V. and (8) Siti I. Mustapa | Malaysia | Life Cycle Cost Assessment of Electric Vehicles: A Review and Bibliometric Analysis. | Ayodele and Mustapa (2020) | Journal article published in Sustainability. 12: 2387. |
| Urban smart mobility and intelligent transport system | (1) Tomaszewska, Ewelina J. and (7) Adrian Florea | Poland, Romania | Urban smart mobility in the scientific literature—Bibliometric analysis. | Tomaszewska and Florea (2018) | Journal article published in Engineering Management in Production and Services. 10: 41–56. | |
| Urban studies | Smart city | (2) Guo, Yi-Ming, (2) Huang, Zhen-Li, (10) Guo, Ji, Hua, Li, (2) Guo, Xing-Rong and (2) Mpeoane J. Nkeli | China | Bibliometric Analysis on Smart Cities Research. | Guo et al. (2019) | Journal article published in Sustainability 2019, 11(13), 3606 |
| Sustainable city; Smart city | (7) Fu, Yang and (47) Xiaoling Zhang | China | Trajectory of urban sustainability concepts: A 35-year bibliometric analysis. | Fu and Zhang (2016) | Journal article published in Cities. 60(A): 113–123. |
References
- Abelson, Peter. 2020. A Partial Review of Seven Official Guidelines for Cost-Benefit Analysis. Journal of Benefit-Cost Analysis 11: 272–93. [Google Scholar] [CrossRef]
- Acedo, Francisco J., Carmen Barroso, Cristóbal Casanueva, and José L. Galán. 2006. Co-authorship in management and organizational studies: An empirical and network analysis. Journal of Management Studies 43: 957–83. [Google Scholar] [CrossRef]
- Acevedo Prins, Natalia M., Luis M. Jiménez-Gómez, and Miguel D. Rojas Lopez. 2017. Análisis bibliométrico de publicaciones sobre competitividad nacional en la base de datos Scopus. Espacios 38: 1–14. Available online: https://www.revistaespacios.com/a17v38n08/a17v38n08p11.pdf (accessed on 7 January 2021).
- Adams, James D., Grant C. Black, Roger Clemmons, and Paula E. Stephan. 2005. Scientific teams and institutional collaborations: Evidence from U.S. universities, 1981–99. Research Policy 34: 259–85. [Google Scholar] [CrossRef]
- Adams, Jonathan. 2012. The rise of research networks. Nature 490: 335–36. [Google Scholar] [CrossRef]
- Adams, Jonathan. 2013. The fourth age of research. Nature 497: 557–60. [Google Scholar] [CrossRef]
- Amin, Tanjin, Faisal Khan, and Ming J. Zuo. 2019. A bibliometric analysis of process system failure and reliability literature. Engineering Failure Analysis 106: 104152. [Google Scholar] [CrossRef]
- Andresen, Martin A., and Neil Boyd. 2010. A cost-benefit and cost-effectiveness analysis of Vancouver’s Safe Injection Facility. International Journal of Drug Policy 21: 70–76. [Google Scholar] [CrossRef] [Green Version]
- Andresen, Martin A., and Eshan Jozaghi. 2012. The point of diminishing returns: An examination of expanding Vancouver’s Insite. Urban Studies 49: 3531–44. [Google Scholar] [CrossRef] [Green Version]
- Ayodele, Bamidele V., and Siti I. Mustapa. 2020. Life Cycle Cost Assessment of Electric Vehicles: A Review and Bibliometric Analysis. Sustainability 12: 2387. [Google Scholar] [CrossRef] [Green Version]
- Barfod, Michael B., and Kim B. Salling. 2015. A new composite decision support framework for strategic and sustainable transport appraisals. Transport Research, Part A: Policy & Practice 72: 1–15. [Google Scholar] [CrossRef] [Green Version]
- Becchio, Cristina, Marta Bottero, Stefano P. Corgnati, and Frederico DellAnna ’. 2016. Cost benefit analysis and smart grids projects. Paper presented at Conference: SBE16,Towards Post-Carbon Cities, Turin, Italy, February 17–19; pp. 278–87. [Google Scholar]
- Bordons, María, and Isabel Gomez. 2000. Collaboration networks in science. In The Web of Knowledge: A Festschrift in Honor of Eugene Garfield. Edited by Blaise Cronin and Helen B. Atkins. Medford: Information Today Inc, pp. 197–213. [Google Scholar]
- Brent, Robert J. 2006. Applied Cost-Benefit Analysis, 2nd ed. Glos: Edward Elgar Publishing. [Google Scholar]
- Caiazza, Rosa, and Michele Simoni. 2019. Directorate ties: A bibliometric analysis. Management Decision 57: 2837–51. [Google Scholar] [CrossRef]
- Camarasa, Clara, Claudio Nägeli, York Ostermeyer, Michael Klippel, and Sebastian Botzler. 2019. Diffusion of energy efficiency technologies in European residential buildings: A bibliometric analysis. Energy and Buildings 202: 109339. [Google Scholar] [CrossRef]
- Capobianco-Uriarte, María d. L. M., María d. P. Casado-Belmonte, Gema M. Marín-Carrillo, and Eduardo Terán-Yépez. 2019. A Bibliometric Analysis of International Competitiveness (1983–2017). Sustainability 11: 1877. [Google Scholar] [CrossRef] [Green Version]
- Chadegani, Arezoo A., Hadi Salehi, Melor Md Yunus, Hadi Farhadi, Masood Fooladi, Maryam Farhadi, and Nader A. Ebrahim. 2013. A Comparison between Two Main Academic Literature Collections: Web of Science and Scopus databases. Asian Social Science 9: 18–26. [Google Scholar] [CrossRef] [Green Version]
- Chen, Wei, Yong Geng, Shaozhuo Zhong, Mufan Zhuang, and Hengyu Pan. 2020. A bibliometric analysis of ecosystem services evaluation from 1997 to 2016. Environmental Science and Pollution Research 27: 23503–13. [Google Scholar] [CrossRef] [PubMed]
- Clarke, Jane. 2011. What is a systematic review? Evidence-Based Nursing 14: 64. [Google Scholar] [CrossRef] [PubMed]
- Cobo, Manuel J., Antonio G. López-Herrera, Herrera-Viedma Enrique, and Francisco Herrera. 2011. Science mapping software tools: Review, analysis, and cooperative study among tools. Journal of the American Society for Information Science and Technology 62: 1382–402. [Google Scholar] [CrossRef]
- de Castro e Silva Neto, Dimas, Carlos O. Cruz, Fernanda Rodrigues, and Paulo Silva. 2016. Bibliometric analysis of PPP and PFI literature: Overview of 25 years of research. Journal of Construction Engineering and Management 142, 142. [Google Scholar] [CrossRef]
- Di Bitetti, Mario S., and Julián A. Ferreras. 2017. Publish (in English) or perish: The effect on citation rate of using languages other than English in scientific publications. Ambio 46: 121–27. [Google Scholar] [CrossRef] [Green Version]
- Drèze, Jean, and Nicholas Stern. 1987. The theory of cost-benefit analysis. In Handbook of Public Economics. Edited by J. Alan Auerbach and Martin Feldstein. Nort-Holland: Elsevier, pp. 909–89. [Google Scholar] [CrossRef]
- Drummond, Michael F., Weatherly Helen, and Brian Ferguson. 2008. Economic evaluation of health interventions: A broader perspective is needed that include potential cost and benefits for all stakeholders. British Medical Journal 337: a1204. [Google Scholar] [CrossRef]
- Ellegaard, Ole, and Johan A. Wallin. 2015. The bibliometric analysis of scholarly production: How great is the impact? Scientometrics 105: 1809–31. [Google Scholar] [CrossRef] [Green Version]
- Ellig, Jerry, and Patric A. McLaughlin. 2012. The Quality and use of Regulatory analysis in 2008. Risk Analysis 32: 855–80. [Google Scholar] [CrossRef] [PubMed]
- European Commission. 2014. Guide to Cost-Benefit Analysis of Investment Projects: Structural Funds, Cohesion Fund and Instrument for Pre-Accession. Brussels: Directorate General for Regional Policy. [Google Scholar]
- Fellnhofer, Katharina. 2018. Visualised bibliometric mapping on smart specialisation: A co-citation analysis. International Journal of Knowledge-Based Development 9: 76–99. [Google Scholar] [CrossRef]
- Feng, Zezheng, Haotian Li, Wei Zeng, Shuang-Hua Yang, and Huamin Qu. 2020. Topology Density Map for Urban Data Visualization and Analysis. In IEEE Transactions on Visualization and Computer Graphics 27: 828–38. [Google Scholar] [CrossRef] [PubMed]
- Florio, Massimo, Stefano Forte, Chiara Pancotti, Emanuela Sirtori, and Silvia Vignetti. 2016. Exploring Cost-Benefit Analysis of Research, Development and Innovation Infrastructures: An Evaluation Framework. (February 2016). Available online: https://ssrn.com/abstract=3202170 (accessed on 10 January 2021).
- Flowerdew, John, and Yongyan Li. 2009. English or Chinese? The trade-off between local and international publication among Chinese academics in the humanities and social sciences. Journal of Second Language Writing 18: 1–16. [Google Scholar] [CrossRef]
- Fu, Yang, and Xiaoling Zhang. 2016. Trajectory of urban sustainability concepts: A 35-year bibliometric analysis. Cities 60: 113–23. [Google Scholar] [CrossRef]
- Ginsberg, Gary M., Simon Berger, and Daniel Shouval. 1992. Cost-benefit analysis of a nationwide inoculation programme against viral hepatitis B in an area of intermediate endemicity. Bulletin of the World Health Organization 70: 757–67. [Google Scholar] [PubMed]
- Ginsberg, Gary, Segev Shani, and Boaz Lev. 1998a. Cost-Benefit Analysis of Risperidone and Clozapine in the Treatment of Schizophrenia in Israel. Pharmacoeconomics 13: 231–41. [Google Scholar] [CrossRef]
- Ginsberg, Gary M., Tulchinsky Theodore, and David Filon. 1998b. Cost-benefit analysis of a national thalassaemia prevention programme in Israel. Journal of Medical Screening 5: 120–26. [Google Scholar] [CrossRef] [Green Version]
- Ginsberg, Gary M., and Theodore H. Tulchinsky. 1990. Costs and benefits of a second measles inoculation of children in Israel, the West Bank, and Gaza. Journal of Epidemiology & Community Health 44: 274–80. [Google Scholar] [CrossRef] [Green Version]
- Ginsberg, Gary M. 1990. Cost-Effectiveness Analysis, Cost-Benefit Analysis and the Value of Life in Health Care and Prevention. In Costs and Benefits in Health Care and Prevention. Edited by Ulrich Laaser, Edward J. Roccella, Jona B. Rosenfeld and Heinrich Wenzel. Berlin/Heidelberg: Springer, pp. 6–19. [Google Scholar] [CrossRef]
- Giordano, Vincenzo, Ijeoma Onyeji, Gianluca Fulli, Manuel S. Jiménez, and Constantina Filiou. 2012. Guidelines for Conducting a Cost-Benefit Analysis of Smart Grid Projects. Reference Report by the Joint Research Center of the European Commission. EUR 25246 EN. Luxembourg: Publications Office of the European Union. [Google Scholar] [CrossRef]
- Glänzel, Wolfgang, and András Schubert. 2004. Analyzing scientific networks through co-authorship. In Handbook of Quantitative Science and Technology Research. Edited by Henk F. Moed, Wolfgang Glänzel and Ulrich Schmoch. Dordrecht: Springer, pp. 257–76. [Google Scholar] [CrossRef]
- Goyal, Nihit. 2017. A “review” of policy sciences: Bibliometric analysis of authors, references, and topics during 1970–2017. Policy Sciences 50: 527–37. [Google Scholar] [CrossRef]
- Guo, Yi-Ming, Zhen-Li Huang, Ji Guo, Li Hua, Xing-Rong Guo, and Mpeoane J. Nkeli. 2019. Bibliometric Analysis on Smart Cities Research. Sustainability 11: 3606. [Google Scholar] [CrossRef] [Green Version]
- Guston, David H. 2000. Between Politics and Science: Assuring the Integrity and Productivity of Research. Cambridge: Cambridge University Press. [Google Scholar] [CrossRef] [Green Version]
- Hammond, Richard J. 1966. Convention and Limitation in Benefit-Cost Analysis. Natural Resources Journal 6: 195–222. [Google Scholar]
- Hanley, Nick, and Edward B. Barbier. 2009. Pricing Nature: Cost-Benefit Analysis and Environmental Policy. Cheltenham: Edward Elgar Publishing. [Google Scholar]
- Hanley, Nick, and Clive L. Spash. 1993. Cost-Benefit Analysis and the Environment. Cheltenham: Edward Elgar Publishing. [Google Scholar]
- Hansjürgens, Bernd. 2004. Economic valuation through cost-benefit analysis—Possibilities and limitations. Toxicology 205: 241–52. [Google Scholar] [CrossRef] [PubMed]
- Heradio, Ruben, Luis de la Torre, Daniel Galan, Francisco J. Cabrerizo, Enrique Herrera-Viedma, and Sebastian Dormido. 2016. Virtual and remote labs in education: A bibliometric analysis. Computers & Education 98: 14–38. [Google Scholar] [CrossRef]
- Hou, Qian, Guozhu Mao, Lin Zhao, Huibin Du, and Jian Zuo. 2015. Mapping the scientific research on life cycle assessment: A bibliometric analysis. The International Journal of Life Cycle Assessment 20: 541–55. [Google Scholar] [CrossRef]
- Hultkrantz, Lars, and Mikael Svensson. 2012. The value of a statistical life in Sweden: A review of the empirical literature. Health Policy 108: 302–10. [Google Scholar] [CrossRef]
- Irwin, Amos, Ehsan Jozaghi, Ricky N. Bluthenthal, and Alex H. Kral. 2017. A cost-benefit analysis of a potential supervised injection facility in San Francisco, California, USA. Journal of Drug Issues 47: 164–84. [Google Scholar] [CrossRef]
- Jacso, Peter. 2005. As We May Search—Comparison of Major Features of the Web of Science, Scopus, and Google Scholar Citation-based and Citation-enhanced Databases. Current Science 89: 1537–547. Available online: http://www.jstor.org/stable/24110924 (accessed on 16 December 2020).
- Jeter, Pamela E., Jeremiah Slutsky, Nilkamal Singh, and Sat Bir S. Khalsa. 2015. Yoga as a Therapeutic Intervention: A Bibliometric Analysis of Published Research Studies from 1967 to 2013. The Journal of Alternative and Complementary Medicine 21: 586–92. [Google Scholar] [CrossRef]
- Jeuland, Marc, and Dale Whittington. 2009. Cost-benefit comparisons of investments in improved water supply and cholera vaccination programs. Vaccine 27: 3109–20. [Google Scholar] [CrossRef]
- Jia, Fu, and Yan Jiang. 2018. Sustainable Global Sourcing: A Systematic Literature Review and Bibliometric Analysis. Sustainability 10: 595. [Google Scholar] [CrossRef] [Green Version]
- Kikuchi, Yasunori. 2017. Simulation-Based Approaches for Design of Smart Energy System: A Review Applying Bibliometric Analysis. Journal of Chemical Engineering of Japan 50: 385–96. [Google Scholar] [CrossRef] [Green Version]
- Layard, Richard, and Stephen Glaister. 1994. Cost-Benefit Analysis, 2nd ed. Cambridge: Cambridge University Press. [Google Scholar] [CrossRef]
- Leydesdorff, Loet, and Liwen Vaughan. 2006. Co-occurrence matrices and their applications in information science: Extending ACA to the Web environment. Journal of the American Society for Information Science and Technology 57: 1616–28. [Google Scholar] [CrossRef] [Green Version]
- Lima, Richardson S., Armando de Azevedo Caldeira-Pires, and Alexandre N. Cardoso. 2020. Uncertainty Analysis in Life Cycle Assessments Applied to Biorefineries Systems: A Critical Review of the Literature. Process Integration and Optimization for Sustainability 4: 1–13. [Google Scholar] [CrossRef] [Green Version]
- Lindhjem, Henrik, Kristine Grimsrud, Stale Navrud, and Stein O. Kolle. 2015. The social benefits and costs of preserving forest biodiversity and ecosystem services. Journal of Environmental Economics and Policy 4: 202–22. [Google Scholar] [CrossRef]
- Liu, Donghai, Youle Wang, Junjie Chen, and Yalin Zhang. 2019. Intelligent compaction practice and development: A bibliometric analysis. Engineering, Construction and Architectural Management 27: 1213–32. [Google Scholar] [CrossRef]
- Loiseau, Eleonore, Laura Saikku, Riina Antikainen, Nils Droste, Bernd Hansjürgens, Kati Pitkänen, Pekka Leskinen, Peter Kuikman, and Marianne Thomsen. 2016. Green economy and related concepts: An overview. Journal of Cleaner Production 139: 361–71. [Google Scholar] [CrossRef]
- López-Navarro, Irene, Anna I. Moreno, Miguel Á Quintanilla, and Jesús Rey-Rocha. 2015. Why do I publish research articles in English instead of my own language? Differences in Spanish researchers’ motivations across scientific domains. Scientometrics 103: 939–76. [Google Scholar] [CrossRef]
- Luo, Jianli, Huiying Han, Fu Jia, and Hao Dong. 2020. Agricultural Co-operatives in the western world: A bibliometric analysis. Journal of Cleaner Production 273: 122945. [Google Scholar] [CrossRef]
- Marsilio, Marta, Giulia Cappellaro, and Corrado Cuccurullo. 2011. The intellectual structure of research into PPPs: A bibliometric analysis. Public Management Review 13: 763–82. [Google Scholar] [CrossRef]
- Maula, Ahmad W., Anis Fuad, and Adi Utarini. 2018. Ten-years trend of dengue research in Indonesia and South-east Asian countries: A bibliometric analysis. Global Health Action 11: 1504398. [Google Scholar] [CrossRef]
- Medina-Mijangos, Rubi, and Luis Seguí-Amórtegui. 2020. Research Trends in the Economic Analysis of Municipal Solid Waste Management Systems: A Bibliometric Analysis from 1980 to 2019. Sustainability 12: 8509. [Google Scholar] [CrossRef]
- Molinos-Senante, María, Francesca Hernández-Sancho, and Ramón Sala-Garrido. 2010. Economic feasibility study for wastewater treatment: A cost-benefit analysis. Science of the Total Environment 408: 4396–402. [Google Scholar] [CrossRef]
- Mongeon, Philippe, and Adéle Paul-Hus. 2016. The journal coverage of Web of Science and Scopus: A comparative analysis. Scientometrics 106: 213–28. [Google Scholar] [CrossRef]
- Musgrave, Richard A. 1969. Cost-Benefit Analysis and the Theory of Public Finance. Journal of Economic Literature 10: 797–806. [Google Scholar]
- Nas, Tevfik F. 2016. Cost-Benefit Analysis: Theory and Application. London: Lexington Books. [Google Scholar]
- Navas, Encarna, Luis Salleras, Domínguez Gisbert Ramón, Timorer Enrique Angela, Dominique Ibánez, and Andreu A. Prat. 2005. Cost-benefit and cost-effectiveness of the incorporation of the pneumococcal 7-valent conjugated vaccine in the routine vaccination schedule of Catalonia (Spain). Vaccine 23: 2342–48. [Google Scholar] [CrossRef]
- Nobre, Gustavo C., and Elaine Tavares. 2017. Scientific literature analysis on big data and internet of things applications on circular economy: A bibliometric study. Scientometrics 111: 463–92. [Google Scholar] [CrossRef]
- Noe, Paul R., and John D. Graham. 2020. The Ascendancy of the Cost-Benefit State? Administrative Law Review 5: 85–151. Available online: http://www.administrativelawreview.org/wp-content/uploads/2020/01/Ascendancy-of-the-Cost-Benefit-State_Accord-5.3_Final.pdf (accessed on 12 January 2021).
- Okubo, Yoshiko. 1997. Bibliometric Indicators and Analysis or Research Systems: Methods and Examples. OECD Science, Technology and Industry Working Papers 1997/01. Paris: OECD Publishing. [Google Scholar] [CrossRef]
- Olawumi, Timothy O., Daniel W.M. Chan, and Johny K.W. Wong. 2017. Evolution in the intellectual structure of BIM research: A bibliometric analysis. Journal of Civil Engineering and Management 23: 1060–81. [Google Scholar] [CrossRef]
- Otte, Evelien, and Ronald Rousseau. 2002. Social network analysis: A powerful strategy, also for the information sciences. Journal of Information Science 28: 441–53. [Google Scholar] [CrossRef]
- Owen-Smith, Jason, Massimo Riccaboni, Fabio Pammolli, and Walter W. Powell. 2002. A comparison of US and European university—industry relations in the life sciences. Management Science 48: 24–43. [Google Scholar] [CrossRef] [Green Version]
- Pearce, David. 1971. Cost-Benefit Analysis. London: Palgrave. [Google Scholar] [CrossRef] [Green Version]
- Pearce, David, and Dominic Moran. 1994. The Economic Value of Biodiversity. London: Earthscan Publications. [Google Scholar]
- Perianes-Rodríguez, Antonio, Carlos Olmeda-Gómez, and Félix Moya-Anegón. 2010. Detecting, identifying and visualizing research groups in co-authorship networks. Scientometrics 82: 307–19. [Google Scholar] [CrossRef]
- Persky, Joseph. 2001. Cost-Benefit Analysis and the Classical Creed. Journal of Economic Perspectives 15: 199–208. [Google Scholar] [CrossRef] [Green Version]
- Pitt, Catherine, Catherine Goodman, and Kara Hanson. 2016. Economic Evaluation in Global Perspective: A Bibliometric Analysis of the Recent Literature. Health Economics 25: 9–28. [Google Scholar] [CrossRef] [Green Version]
- Ponomariov, Branco, and Craig Boardman. 2016. What is co-authorship? Scientometrics 109: 1939–63. [Google Scholar] [CrossRef]
- Ponomariov, Branco L., and Craig P. Boardman. 2010. Influencing scientists’ collaboration and productivity patterns through new institutions: University research centers and scientific and technical human capital. Research Policy 39: 613–24. [Google Scholar] [CrossRef]
- Ramírez-Castañeda, Valeria. 2020. Disadvantages in preparing and publishing scientific papers caused by the dominance of the English language in science: The case of Colombian researchers in biological sciences. PLoS ONE 15: e0238372. [Google Scholar] [CrossRef] [PubMed]
- Ramos, Delfina, Paulo Afonso, and Rosa Costa. 2020a. Cost-Benefit Analysis of Occupational Health and Safety: A Case Study. In Occupational and Environmental Safety and Health II. Studies in Systems, Decision and Control. Edited by Pedro M. Arezes, J. Santos Baptista Mónica, P. Barroso, Paula Carneiro, Patrício Cordeiro, Nélson Costa, Rui B. Melo, A. Sér-gio Miguel and Gonçalo Perestrelo. Cham: Springer, pp. 689–95. [Google Scholar] [CrossRef]
- Ramos, Edgar, Steven Dien, Abel Gonzales, Melissa Chavez, and Ben Hazen. 2020b. Supply chain cost research: A bibliometric mapping perspective. Benchmarking: An International Journal, ahead-of-print. [Google Scholar] [CrossRef]
- Ray, Anandarup. 1990. Cost-Benefit Analysis. Issues and Methodologies. Report No. 11597. Washington, DC: World Bank Publications. [Google Scholar]
- Rezapour, Aziz, Amirali Moradpour, Sirous Panahi, Javad Javan-Noughabi, and Sajad Vahedi. 2020. Health Economic Evaluation in Iran (1998–2017), a Bibliometrics Analysis. International Journal of Pharmaceutical and Phytopharmacological Research 10: 95–102. [Google Scholar]
- Rueda, Guillermo, Pisek Gerdsri, and Dundar F. Kocaoglu. 2007. Bibliometrics and Social Network Analysis of the Nanotechnology Field. Paper presented at PICMET ‘07,2007. Portland International Conference on Management of Engineering & Technology, Portland, OR, USA, August 5–9; pp. 2905–11. [Google Scholar] [CrossRef]
- Scott, David W. 2004. Multivariate Density Estimation and Visualization. Papers No. 2004,16. Berlin: Humboldt-Universität, Center for Applied Statistics and Economics (CASE). [Google Scholar]
- Sen, Amartya. 2000. The discipline of cost-benefit analysis. The Journal of Legal Studies 29: 931–52. [Google Scholar] [CrossRef] [Green Version]
- Sohn, So Y., and Byung J. Ahn. 2003. Multigeneration diffusion model for economic assessment of new technology. Technological Forecasting and Social Change 70: 251–64. [Google Scholar] [CrossRef]
- Stockemer, Daniel, and Michael J. Wigginton. 2019. Publishing in English or another language: An inclusive study of scholar’s language publication preferences in the natural, social and interdisciplinary sciences. Scientometrics 118: 645–52. [Google Scholar] [CrossRef]
- Strozzi, Fernanda, olicchia, laudia, reazza, lessandro, and Carlo Noè. 2017. Literature review on the ‘Smart Factory’ concept using bibliometric tools. International Journal of Production Research 55: 6572–91. [Google Scholar] [CrossRef]
- Tomaszewska, Ewelina J., and Adrian Florea. 2018. Urban smart mobility in the scientific literature -Bibliometric analysis. Engineering Management in Production and Services 10: 41–56. [Google Scholar] [CrossRef] [Green Version]
- Torriti, Jacopo, and Eka Ikpe. 2014. Cost–Benefit Analysis. In Encyclopedia of Law and Economics. Edited by Backhaus J. New York: Springer, pp. 1–8. [Google Scholar] [CrossRef]
- Tran, Bach X., Long H. Nguyen, Hugo C. Turner, Son Nghiem, Giang T. Vu, Cuong T. Nguyen, Carl A. Latkin, Cyrus S. H. Ho, and Roger C. M. Ho. 2019. Economic evaluation studies in the field of HIV/AIDS: Bibliometric analysis on research development and scopes (GAPRESEARCH). BMC Health Services Research 19: 834. [Google Scholar] [CrossRef]
- Turečková, Kamila, and Jan Nevima. 2020. The Cost Benefit Analysis for the Concept of a Smart City: How to Measure the Efficiency of Smart Solutions? Sustainability 12: 2663. [Google Scholar] [CrossRef] [Green Version]
- Van Eck, Nees J., and Ludo Waltman. 2009. Software survey: Vosviewer, a computer program for bibliometric mapping. Scientometrics 84: 523–38. [Google Scholar] [CrossRef] [Green Version]
- Ward, Philip J., Brenden Jongman, Jeroen C. J. H. Aerts, Paul D. Bates, Wouter J. W. Botzen, Andres D. Loaiza, Stephane Hallegatte, Jarl M. Kind, Jaap Kwadijk, Paolo Scussolini, and et al. 2017. A global framework for future costs and benefits of river-flood protection in urban areas. Nature Climate Change 7: 642–46. [Google Scholar] [CrossRef]
- Ward, William A. 2019. Cost-Benefit Analysis Theory versus Practice at the World Bank 1960 to 2015. Journal of Benefit-Cost Analysis 10: 124–44. [Google Scholar] [CrossRef]
- Weatherly, Helen L. A., Richard A. Cookson, and Michael F. Drummond. 2014. Economic evaluation of public health interventions: Methodological challenges. In Encyclopedia of Health Economics. Edited by Anthony J. Culyer. San Diego: Elsevier, pp. 217–23. [Google Scholar]
- Wuchty, Stefan, Benjamin F. Jones, and Brian Uzzi. 2007. The increasing dominance of teams in production of knowledge. Science 316: 1036–39. [Google Scholar] [CrossRef] [Green Version]
- Yoshikane, Fuyuki, and Kyo Kageura. 2004. Comparative analysis of co-authorship networks of different domains: The growth and change of networks. Scientometrics 60: 433–44. [Google Scholar] [CrossRef]
- Zhang, Jing, Hongqiang Jiang, Wei Zhang, Guoxia Ma, Yanchao Wang, Yaling Lu, Xi Hu, Jia Zhou, Fei Peng, Jun Bi, and et al. 2019. Cost-benefit analysis of China’s Action Plan for Air Pollution Prevention and Control. Frontiers of Engineering Management 6: 524–37. [Google Scholar] [CrossRef]
- Zhao, Li, Zhi-Ying Tang, and Xin Zou. 2019. Mapping the Knowledge Domain of Smart-City Research: A Bibliometric and Scientometric Analysis. Sustainability 11: 6648. [Google Scholar] [CrossRef] [Green Version]
- Zupic, Ivan, and Tomaž Čater. 2015. Bibliometric Methods in Management and Organization. Organizational Research Methods 18: 429–72. [Google Scholar] [CrossRef]
Figure 1.
Development of the number of publications. (lines: blue color–development of publications, orange color–breakthrough year, green color–left one: starting phase, right one: boom phase).
Figure 1.
Development of the number of publications. (lines: blue color–development of publications, orange color–breakthrough year, green color–left one: starting phase, right one: boom phase).

Figure 2.
Types of outputs (others: early access, book chapter, data paper, editorial material, etc.).
Figure 2.
Types of outputs (others: early access, book chapter, data paper, editorial material, etc.).

Figure 3.
Geographical origin of articles.

Figure 4.
The share of the first ten countries in outputs.

Figure 5.
The synthesized categories of outputs.

Figure 6.
The research areas of outputs.

Figure 7.
Co-authorship in the first part of the monitored period.

Figure 8.
Co-authorship in the second part of the monitored period.

Figure 9.
Density visualization of co-authorship in the monitored periods; (a) first period, (b) second period.
Figure 9.
Density visualization of co-authorship in the monitored periods; (a) first period, (b) second period.

Figure 10.
Density visualization of co-occurrence.

Figure 11.
Network visualization of co-occurrence.

Figure 12.
Overlay visualization of co-occurrence.

Table 1.
Top ten categories and journals.
| No. | WoS Category | Source Title | 5-Year IF | h-Index |
|---|---|---|---|---|
| 1. | Economics | Journal of Benefit Cost Analysis | Emerging SCI | 8 |
| 2. | Environmental Sciences | Vaccine | 3.192 | 37 |
| 3. | Public Environmental Occupation Health | Ecological Economics | 5.236 | 202 |
| 4. | Environmental Studies | Preventive Veterinary Medicine | 2.469 | 95 |
| 5. | Transportation | Risk Analysis | 3.294 | 130 |
| 6. | Water Resources | American Journal of Preventive Medicine | 5.443 | 216 |
| 7. | Energy Fuels | Energy Policy | 5.693 | 217 |
| 8. | Engineering Civil | Evaluation and Program Planning | 1.504 | 62 |
| 9. | Health Care Sciences Services | Land Use Policy | 4.151 | 115 |
| 10. | Veterinary Sciences | Pharmacoeconomics | 4.571 | 100 |
Publisher’s Note: MDPI stays neutral with regard to jurisdictional claims in published maps and institutional affiliations. |
© 2021 by the authors. Licensee MDPI, Basel, Switzerland. This article is an open access article distributed under the terms and conditions of the Creative Commons Attribution (CC BY) license (https://creativecommons.org/licenses/by/4.0/).
Share and Cite
MDPI and ACS Style
Majerova, I.; Abdrazakova, A. A Bibliometric Mapping of Cost-Benefit Analysis—Three Decades of Studies. Economies 2021, 9, 110. https://doi.org/10.3390/economies9030110
AMA Style
Majerova I, Abdrazakova A. A Bibliometric Mapping of Cost-Benefit Analysis—Three Decades of Studies. Economies. 2021; 9(3):110. https://doi.org/10.3390/economies9030110
Chicago/Turabian StyleMajerova, Ingrid, and Ainur Abdrazakova. 2021. "A Bibliometric Mapping of Cost-Benefit Analysis—Three Decades of Studies" Economies 9, no. 3: 110. https://doi.org/10.3390/economies9030110
Note that from the first issue of 2016, this journal uses article numbers instead of page numbers. See further details here.