Article

Entropy Analysis of RR and QT Interval Variability during Orthostatic and Mental Stress in Healthy Subjects

1
School of Electrical and Electronic Engineering, University of Adelaide, Adelaide SA 5005, Australia
2
Department of Physiology, Jessenius Faculty of Medicine, Comenius University, Mala Hora 4, Martin 036 01, Slovakia
3
School of Medicine, University of Adelaide, Adelaide SA 5005, Australia
4
Institute of Biomedical Engineering, Technical University Dresden, Dresden 01069, Germany
*
Author to whom correspondence should be addressed.
Entropy 2014, 16(12), 6384-6393; https://doi.org/10.3390/e16126384
Submission received: 17 October 2014 / Revised: 24 November 2014 / Accepted: 28 November 2014 / Published: 3 December 2014
(This article belongs to the Special Issue Entropy and Cardiac Physics)

Abstract

:
Autonomic activity affects beat-to-beat variability of heart rate and QT interval. The aim of this study was to explore whether entropy measures are suitable to detect changes in neural outflow to the heart elicited by two different stress paradigms. We recorded short-term ECG in 11 normal subjects during an experimental protocol that involved head-up tilt and mental arithmetic stress and computed sample entropy, cross-sample entropy and causal interactions based on conditional entropy from RR and QT interval time series. Head-up tilt resulted in a significant reduction in sample entropy of RR intervals and cross-sample entropy, while mental arithmetic stress resulted in a significant reduction in coupling directed from RR to QT. In conclusion, measures of entropy are suitable to detect changes in neural outflow to the heart and decoupling of repolarisation variability from heart rate variability elicited by orthostatic or mental arithmetic stress.

1. Introduction

The QT interval of body surface ECG represents a global measure of ventricular electrical activity. Beat-to-beat fluctuations in QT interval, generally referred to as QT variability (QTV), reflect subtle changes in the ventricular repolarisation process. Increased QTV is thought to be caused by a reduced repolarisation reserve, reflecting ventricular repolarisation lability and has been associated with cardiac mortality [1]. In healthy subjects sympathetic activation via orthostatic provocation or pharmacological β-adrenoceptor stimulation was shown to increase QTV [2], while the relationship between sympathetic activity and QTV during rest is less clear. In patients with cardiovascular (co-)morbidities the relationship between sympathetic activity and QTV has been insufficiently explored [36].
One of the main determinants of QTV is heart rate and heart rate variability (HRV), respectively, which affect the action potential of cardiac myocytes and the resulting rate adaptation of the QT interval. Consequently, joint analysis of QTV and HRV has been proposed to delineate HRV independent components of QTV, which may provide better indicators of genuine repolarisation lability, which are not merely a result of the normal, physiological rate adaptation process. In addition to classical cross-spectral analysis [1] multivariate autoregressive models have been proposed to study the degree of decoupling of QTV from HRV [7,8]. Since the dynamics and coupling of both QTV and HRV are complex and nonlinear, approaches based on the theory of linear shift-invariant system may provide incomplete information on the dependency of QTV on HRV. Several techniques have been proposed to assess the complexity of decoupling of QTV from HRV, including symbolic dynamics and information-based measures. We have previously shown that ageing results in the decoupling of QTV from HRV using entropy and symbolic dynamics derived measures in addition to linear techniques [9].
The aim of this study was to assess QTV upon two different stimuli that act on the autonomic nervous system: orthostatic stress elicited by head-up tilt (HUT) and mental stress elicited by an arithmetic task. We hypothesised that entropy analysis provides effective measures to quantify physiological decoupling of QTV from HRV during stress, reflective of changes in autonomic nervous system activity. Entropy was estimated using the sample entropy as well as an approach based on conditional entropy, both of which suitable for relative short time series such as those obtained during our experiments.

2. Experimental Section

2.1. Subjects and Measurement Protocol

We have noninvasively recorded blood pressure (Finometer Pro, FMS, The Netherlands) and ECG (horizontal bipolar thoracic lead, recorded at a sampling rate of 1000 Hz; CardioFax ECG-9620, Nihon Kohden, Japan) signals in 11 volunteers (5 females and 6 males) with average age of 17.75 years and ranging from 16.9 to 18.6 years. All subjects were free of any cardiovascular or respiratory diseases and hormonal disorders and were not currently on any pharmacological treatment.
The experimental protocol consisted of five phases. After instrumentation and at least 10 min of relaxation in the supine position, the first phase commenced with the subject resting quietly in the supine position for 15 min, which was considered as the baseline (bl). The second phase, head-up tilt (tilt), was performed with the subject tilted on a motor-driven table to an angle of 45° for 8 min. The tilt phase was followed by 10 min recovery in the supine position (rec) as phase three. Subsequently, the fourth phase, mental arithmetic (ma), was initiated. Mental arithmetic tasks did not require any verbalisation and was performed in the supine position with random three-digit numbers displayed on the ceiling of the examination room by a data projector. The subject was instructed to sum up the three digits. If the result was a two-digit number, it must be summed up again to get a final one-digit result. After deciding if the final number was odd or even, the subject had to click on the Even or Odd marked box projected to the ceiling by the computer mouse held in dominant hand. During the mental arithmetic task the subject was disturbed by the rhythmic sound of a metronome. The subject was instructed to perform the mental arithmetic task as quickly as possible and minimize the errors rate. Phase five consisted of 10 min of recovery in the supine position (rec). During the whole study protocol, the subject was asked to avoid voluntary movements and speaking.

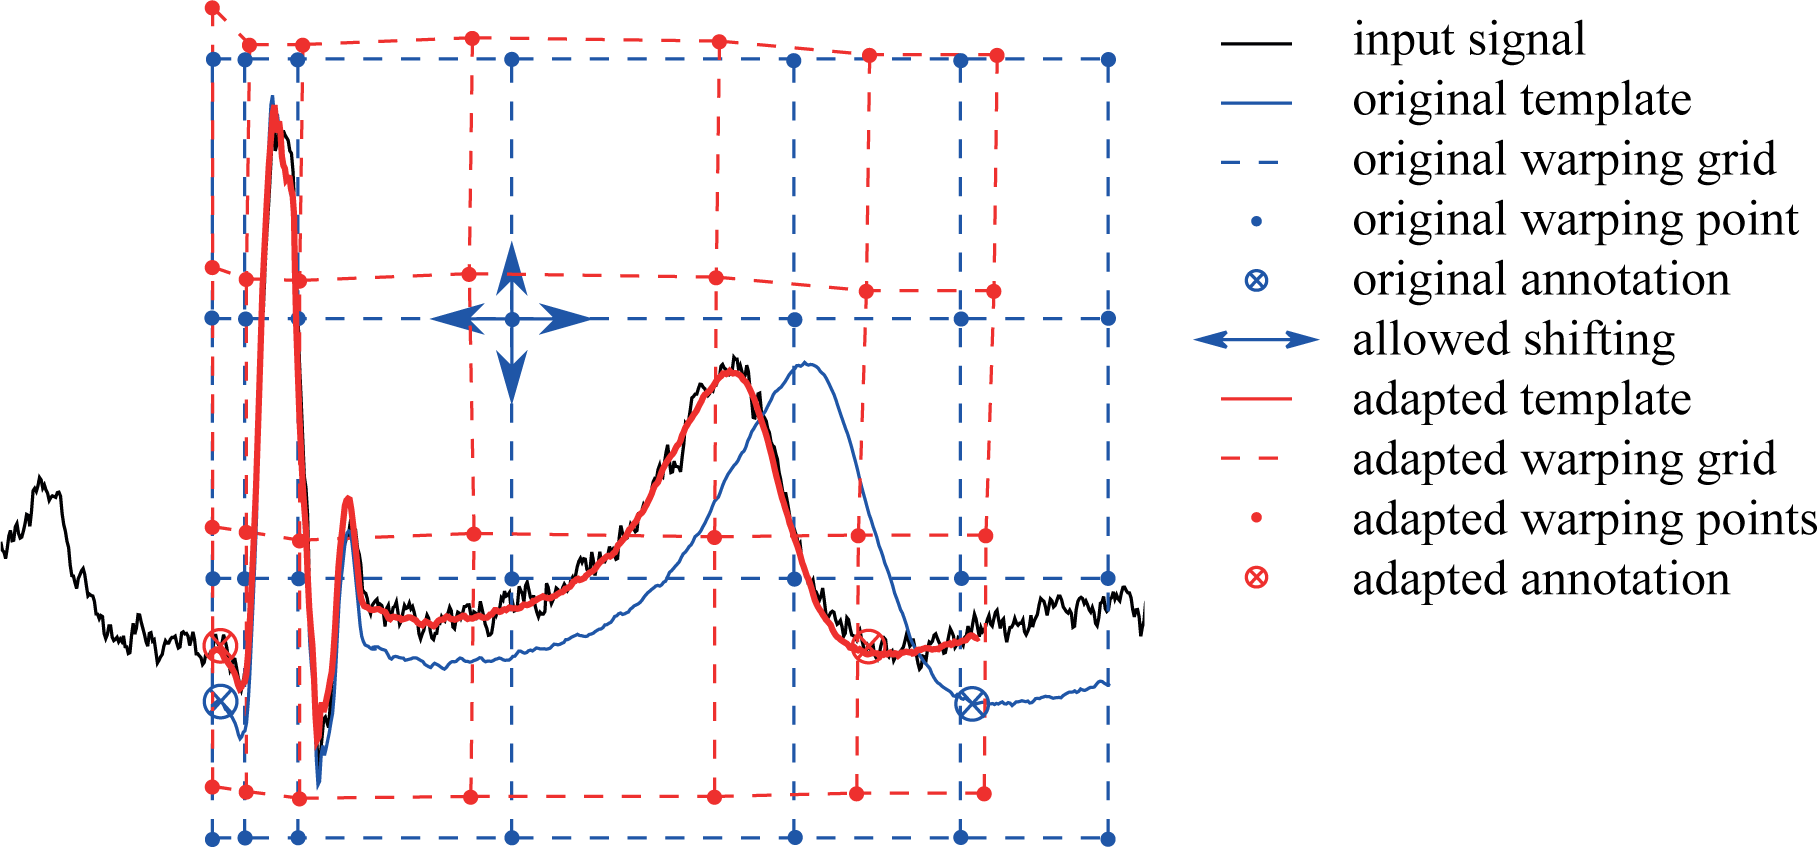
2.2. Beat-to-beat QT Interval Extraction

As beat-to-beat fluctuations in QT interval are relatively small, with a standard deviation below 5 ms under physiological conditions during rest, high precision measurement of the QT interval is of paramount importance and conventional QT delineation techniques might be considered insufficient [10]. For this study, we used a template matching technique that relies on two-dimensional warping (2DSW). The 2DSW algorithm is able to account for complex changes in the morphology of the ECG waveform and was shown to track QT changes with high precision while being robust against signal artefacts [11,12]. Briefly, the algorithm first identifies QRS complexes and uses these fiducial points to generate an averaged template beat, employing an improved version of Woody’s time delay estimation method [13]. The next points of interest such as Q and T end are marked on the template in a semi-automated manner. Using a two-dimensional grid of so-called warping points, the Euclidean distance between the template and the incoming beat is minimized by warping the ECG waveform piece-wise along the warping points (see Figure 1). The relative changes in the QT interval annotated on the warped template are used to measure beat-to-beat QT intervals. Time series were visually checked for missing beats to remove the affected beat-to-beat intervals. We analysed 235 beats from each phase starting 60 s after phase change to avoid transient changes.

2.3. Entropy Estimation

2.3.1. Cross-sample Entropy

From the two normalized (zero mean and unit variance) time series rr and qt (rr = {rr (i), i = 1,…, N} and qt = {qt (i), i = 1,…, N}), vectors rrm (i) and qtm (i) were formed, where rrm (i) = {rr (i + k): 0 ≤ km − 1} and qtm (i) = {qt (i + k): 0 ≤ km − 1} are the vectors of m consecutive data points of the corresponding signal. The distance between two such vectors was defined as d [rrm (i), qtm(j)] = max {| rr (i + k), qt (j + k) |: 0 ≤ km − 1}, i.e., the maximum difference of their corresponding scalar components. The whole set of vector sequences rrm (1), rrm (2), …, rrm (Nm) was used stepwise to calculate values B i m ( r ) ( q t | | r r ) as (Nm)−1 times the number of vectors qtm (j) within distance r of rrm (i), where j ranges from 1 to Nm. Then, Bm (r) was defined as B m ( r ) = ( N m ) 1 i = 1 N m B i m ( r ) ( q t | | r r ). Similarly, A i m ( r ) ( q t | | r r ) was defined as (Nm)−1 times the number of vectors qtm+1(j) within r of rrm+1 (i), where j ranges from 1 to Nm, and set A m ( r ) = ( N m ) 1 i = 1 N m A i m ( r ) ( q t | | r r ). The CrossSampEn (m, r, N) was then defined as C r o s s S a m p E n = ln A m ( r ) B m ( r ) .
In this study, we set r = 0.2 and m = 1, based on previous studies [9,14].

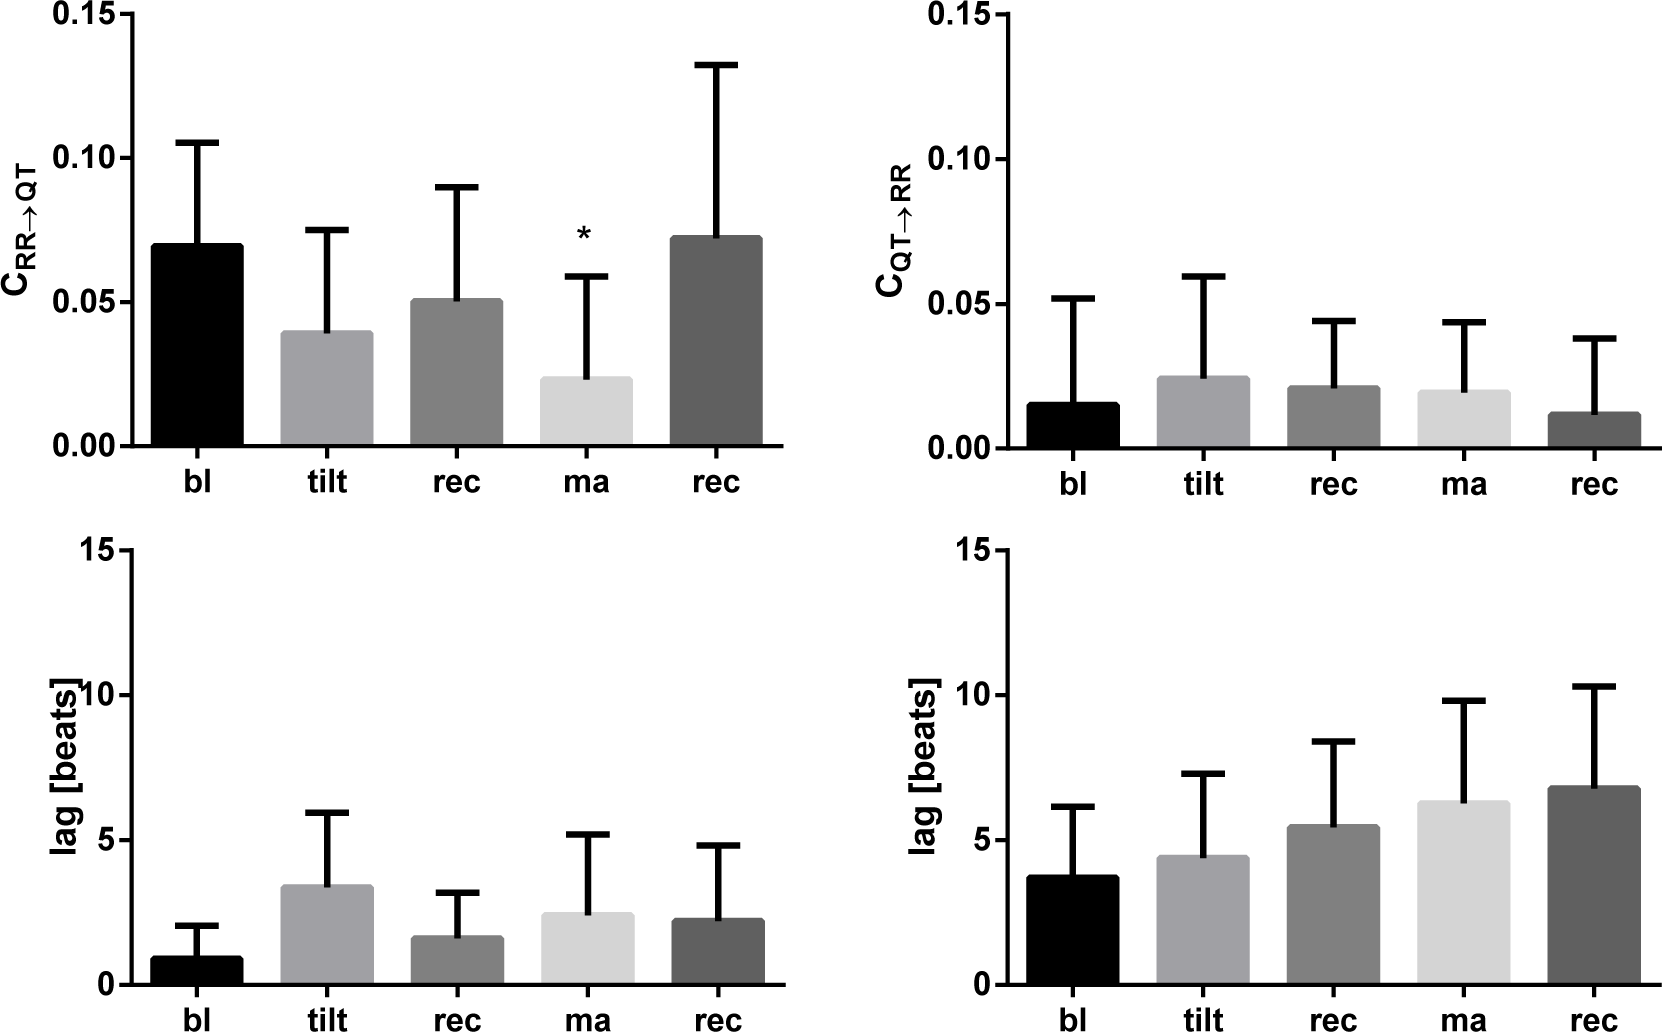
2.3.2. Causality Analysis in the Information Domain

The causality between rr and qt time series in the information domain was assessed by separately quantifying the coupling strength of the causal interactions from rr to qt and from qt to rr by calculation of corrected conditional entropies, using a non-uniform conditioning approach [15,16]. This method separately quantifies the causal coupling from the series rr to the series qt (Crr→qt) and from the series qt to the series rr (Cqt→rr) as the amount of information flowing from the former to the latter signal. For calculation of Crr→qt two conditional entropies should be estimated: Hqt|qt and Hqt|qt,rr. While for the estimation of Hqt|qt the conditioning terms come from the set containing ten preceding samples of the qt time series only, for the estimation of Hqt|qt,rr the set of candidate terms includes the preceding ten samples of both rr and qt time series. The procedure starts with a set of initial candidate terms and then picks up the terms to be used for computing the conditional entropy in a progressive way, selecting at each step the term that leads to the highest reduction in the uncertainty of the time series under analysis, i.e., leads to the minimum conditional entropy. The procedure terminates when a minimum of conditional entropy is reached. Analogously, for calculation of Cqt→rr another two conditional entropies should be estimated: Hrr|rr and Hrr|rr,qt.
To calculate conditional entropy, we employed the symbolisation-based procedure proposed by Porta [17,18] where both time series are coarse-grained into a set of six symbols {0,…, 5}. Here, we used an equiprobable symbolisation approach, where the symbol 0 was used for the first sextile of the given time series’ values distribution, the symbol 1 was used for the second sextile, etc., resulting in an equal number of samples encoded with a given symbol. Considering that relatively short time series are used for analysis, the conditional entropy for the given conditioning vector was calculated using the corrected conditional entropy approach [17]. We employed a non-uniform conditioning method for the selection of the conditioning vector in the entropy calculations. The algorithm selects the samples that are most predictive of the current value in the recordings from the set of candidates with lags 1–10 in an automatic manner. The stepwise selection picks at each step the sample with the highest information contribution to the prediction, independent of the previously selected samples. In the final step, coupling strength indices Crr→qt and Cqt→rr were calculated at the termination of procedure (when a minimum of conditional entropy is reached) as Crr→qt = (Hqt|qt − Hqt|qt,rr) ÷ Hqt|qt and Cqt→rr = (Hrr|rr − Hrr|rr,qt) ÷ Hrr|rr. In addition, respective lags were reported.

2.3.3. Statistical Analysis
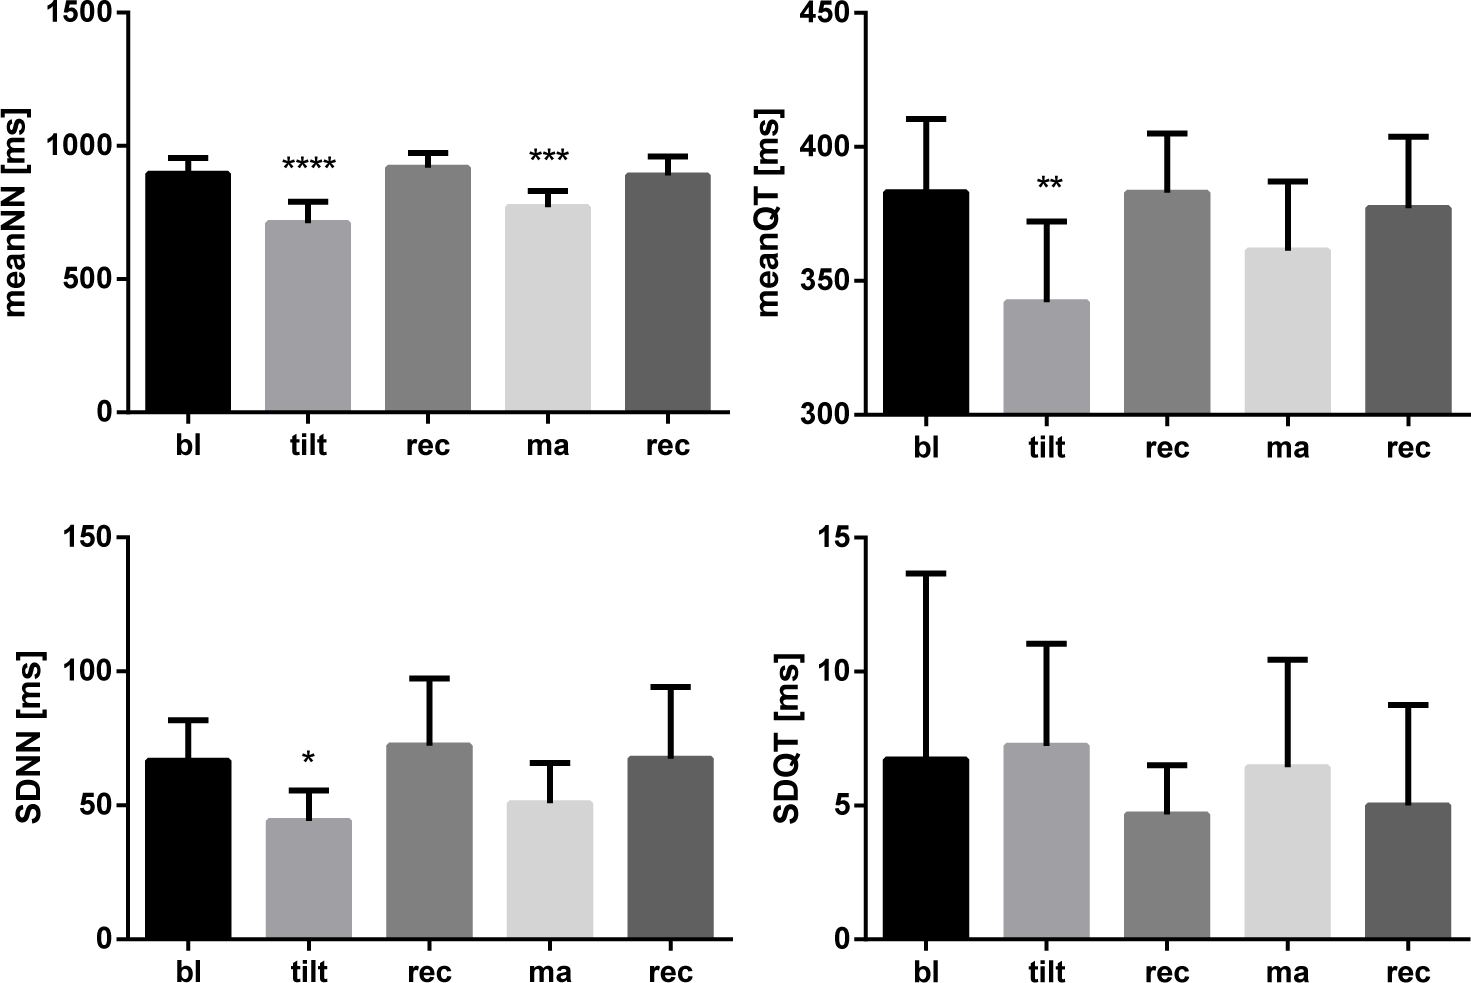
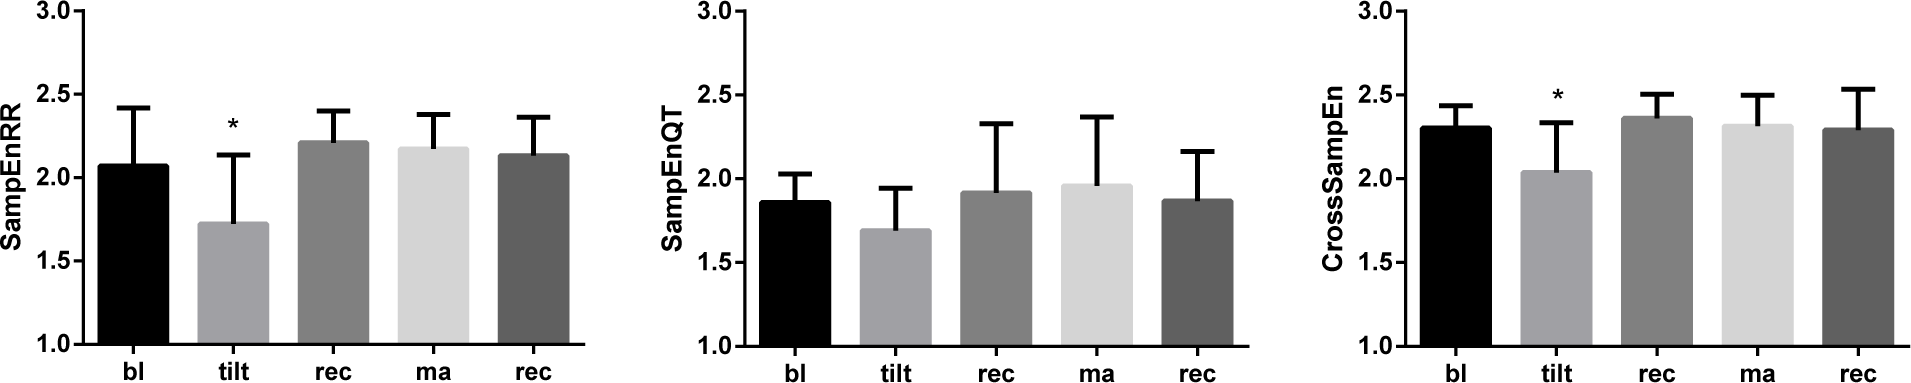
Statistical analyses were conducted using the GrapPad Prism 6 (GrapPad Software, Inc.) software. We computed group mean values and standard deviations and employed one-way analysis of variance (ANOVA) to test for differences in measurement variables across the test protocol. Values were considered statistically significant if p < 0.05. Post-hoc comparisons were carried out with respect to the baseline measurement using Dunnett’s multiple comparison test.

3. Results

The mean values and standard deviations of RR time series (meanNN, SDNN) and QT time series (meanQT, SDQT) across the experimental protocol are shown in Figure 2. The mean RR interval significantly shortened during head-up tilt as well as during mental arithmetic task compared with baseline (ANOVA: p < 0.0001), while the QT interval only shortened significantly during head-up tilt (ANOVA: p = 0.002). The standard deviation of RR interval reduced significantly during tilt compared with baseline (ANOVA: p = 0.006), while changes in the QT interval standard deviation were not statistically significant from baseline.
Sample entropy analyses of RR and QT time series are summarized in Figure 3. The sample entropy of RR was significantly reduced during head-up tilt compared with baseline (ANOVA: p = 0.002) but not affected by mental arithmetic stress. The QT time series did not show significant changes in sample entropy throughout the experimental protocol compared with baseline. Cross-sample entropy was significantly reduced during head-up tilt (ANOVA: p = 0.007), but not during mental arithmetic stress.
The results of causal coupling analysis are displayed in Figure 4. The coupling from RR to QT was significantly higher than that from QT to RR. The experimental protocol induced a significant change in the coupling from RR to QT (ANOVA: p < 0.05), with a reduction during mental arithmetic stress. The time lag was unaffected.

4. Discussion

The main objective of this study was to investigate QTV and its relation to HRV using entropy-based measures during two different paradigms of stress. The RR interval shortening during both the head-up tilt and the mental arithmetic task indicates a shift in neural outflow to the sinoatrial node elicited by orthostatic as well as mental stress. Orthostatic stress is well-known to reduce vagal activity and increase sympathetic activity. Mental stress appears to elicit similar changes [19], albeit to a lesser extent. Significant reduction in SDNN during tilt, but not during the mental arithmetic task, suggests that this stimulus had less effect on heart rate control. QT interval data suggest that only head-up tilt elicited significant changes in autonomic outflow strong enough to affect ventricular repolarisation. The standard deviation of QT intervals appears to be somewhat higher during tilt and mental arithmetic task compared with both recovery phases, while the baseline values seem already elevated. Closer inspection of the baseline data points towards a statistical outlier with a value of SDQT that is four times higher than in the other recordings. Increased QTV during sympathetic activation is in line with several previous reports [2,5,8].
The reduction in the sample entropy of RR time series during tilt indicates increased regularity in HRV and is likely to be the result of reduced vagal activity, dampening the short-term dynamics induced by respiratory sinus arrhythmia among others. Since the sample entropy of QT time series, on the other hand, was not affected by the experimental protocol and the cross-sample entropy values resembled the pattern of RR time series, the changes in RR dynamics rather than QT dynamics are primarily responsible for the reduction in the cross-sample entropy due to head-up tilt. The baseline levels of the sample entropy of QT time series are comparable to those of RR time series. This is somewhat in contrast to reports of relatively higher entropy in QT time series in the literature [2022] and might reflect highly stationary data.
Directionality analysis of the coupling between RR and QT time series demonstrated significantly stronger effects from RR to QT than vice versa, which aligns well with the physiology of the rate adaptation of the QT interval. The low level of coupling from QT to RR intervals, on the other hand, may be well within the noise floor. The lower RR-driven QTV observed during mental stress may indicate that other influences and/or intrinsic noise in the system, possibly higher sympathetic activity directed to the ventricular myocardium, are becoming more important for QTV compared with an influence of RR variations.
This study has several limitations. Firstly, the number of subjects was rather low. Secondly, the ECG recordings during stress were relatively short, which may have affected the reliability of entropy estimation. Thirdly, we recorded only a single horizontal bipolar thoracic lead ECG. The QTV differs among leads [23] and lead II is typically used due to large T waves.

5. Conclusions

Measures of entropy are suitable for detecting changes in neural outflow to the heart and decoupling of repolarisation variability from heart rate variability, elicited by orthostatic or mental arithmetic stress in healthy subjects. Entropy-based measures might provide useful indicators of pathological changes in cardiac activity and be suitable for the early detection of autonomic dysfunction in cardiac as well as non-cardiac patients. Future research needs to establish the extent to which they add independent diagnostic information.

Acknowledgments

Mathias Baumert is supported by a grant from the Australian Research Council (ARC DP110102049). Barbora Czippelova is supported by Project ESF IV The increasing of opportunities for career growth in research and development in the medical sciences, ITMS: 26110230067, Slovakia. Michal Javorka is supported by grants APVV-0235-12, VEGA 1/0059/13 and VEGA 1/0087/14, Slovakia.

Author Contributions

Mathias Baumert processed ECG data, conducted statistical analysis and drafted the manuscript. Barbora Czippelova and Michal Javorka conducted the experiments, computed variability measures and drafted the manuscript. Martin Schmidt and Sebastian Zaunseder developed the QT measurement software and drafted the manuscript. Anand Ganesan drafted the manuscript. All authors have read and approved the final manuscript.

Conflicts of Interest

The authors declare no conflict of interest.

References

  1. Berger, R.D.; Kasper, E.K.; Baughman, K.L.; Marban, E.; Calkins, H.; Tomaselli, G.F. Beat-to-beat QT interval variability novel evidence for repolarization lability in ischemic and nonischemic dilated cardiomyopathy. Circulation 1997, 96, 1557–1565. [Google Scholar]
  2. Yeragani, V.K.; Pohl, R.; Jampala, V.; Balon, R.; Kay, J.; Igel, G. Effect of posture and isoproterenol on beat-to-beat heart rate and QT variability. Neuropsychobiology 2000, 41, 113–123. [Google Scholar]
  3. Baumert, M.; Lambert, G.W.; Dawood, T.; Lambert, E.A.; Esler, M.D.; McGrane, M.; Barton, D.; Nalivaiko, E. QT interval variability and cardiac norepinephrine spillover in patients with depression and panic disorder. Am. J. Physiol. Heart Circ. Physiol. 2008, 295, H962–H968. [Google Scholar]
  4. Baumert, M.; Schlaich, M.P.; Nalivaiko, E.; Lambert, E.; Sari, C.I.; Kaye, D.M.; Elser, M.D.; Sanders, P.; Lambert, G. Relation between QT interval variability and cardiac sympathetic activity in hypertension. Am. J. Physiol. Heart Circ. Physiol. 2011, 300, H1412–H1417. [Google Scholar]
  5. Nayyar, S.; Roberts-Thomson, K.C.; Hasan, M.A.; Sullivan, T.; Harrington, J.; Sanders, P.; Baumert, M. Autonomic modulation of repolarization instability in patients with heart failure prone to ventricular tachycardia. Am. J. Physiol. Heart Circ. Physiol. 2013, 305, H1181–H1188. [Google Scholar]
  6. Sacre, J.W.; Franjic, B.; Coombes, J.S.; Marwick, T.H.; Baumert, M. QT interval variability in type 2 diabetic patients with cardiac sympathetic dysinnervation assessed by 123I-metaiodobenzylguanidine scintigraphy. J. Cardiovasc. Electrophysiol. 2013, 24, 305–313. [Google Scholar]
  7. Porta, A.; Baselli, G.; Caiani, E.; Malliani, A.; Lombardi, F.; Cerutti, S. Quantifying electrocardiogram RT-RR variability interactions. Med. Biol. Eng. Comput. 1998, 36, 27–34. [Google Scholar]
  8. Porta, A.; Tobaldini, E.; Gnecchi-Ruscone, T.; Montano, N. RT variability unrelated to heart period and respiration progressively increases during graded head-up tilt. Am. J. Physiol. Heart Circ. Physiol. 2010, 298, H1406–H1414. [Google Scholar]
  9. Baumert, M.; Czippelova, B.; Porta, A.; Javorka, M. Decoupling of QT interval variability from heart rate variability with ageing. Physiol. Meas. 2013, 34, 1435. [Google Scholar]
  10. Baumert, M.; Starc, V.; Porta, A. Conventional QT variability measurement vs. template matching techniques: comparison of performance using simulated and real ECG. PLOS ONE 2012, 7, e41920. [Google Scholar]
  11. Zaunseder, S.; Schmidt, M.; Malberg, H.; Baumert, M. Measurement of QT variability by two-dimensional warping, Proceedings of 2014 8th Conference of the European Study Group on Cardiovascular Oscillations, Trento, Italy, 25–28 May 2014; pp. 163–164.
  12. Schmidt, M.; Baumert, M.; Porta, A.; Malberg, H.; Zaunseder, S. Two-dimensional warping for one-dimensional signals—Conceptual framework and application to ECG processing. IEEE Trans. Signal Process. 2014, 62, 5577–5588. [Google Scholar]
  13. Cabasson, A.; Meste, O. Time delay estimation: A new insight into the Woody’s method. IEEE Signal Process. Lett. 2008, 15, 573–576. [Google Scholar]
  14. Richman, J.S.; Moorman, J.R. Physiological time-series analysis using approximate entropy and sample entropy. Am. J. Physiol. Heart Circ. Physiol. 2000, 278, H2039–H2049. [Google Scholar]
  15. Faes, L.; Nollo, G.; Porta, A. Information domain approach to the investigation of cardio-vascular, cardio-pulmonary, and vasculo-pulmonary causal couplings. Front. Physiol. 2011, 2. [Google Scholar] [CrossRef]
  16. Faes, L.; Nollo, G.; Porta, A. Mechanisms of causal interaction between short-term RR interval and systolic arterial pressure oscillations during orthostatic challenge. J. Appl. Physiol. 2013, 114, 1657–1667. [Google Scholar]
  17. Porta, A.; Baselli, G.; Lombardi, F.; Montano, N.; Malliani, A.; Cerutti, S. Conditional entropy approach for the evaluation of the coupling strength. Biol. Cybern. 1999, 81, 119–129. [Google Scholar]
  18. Javorka, M.; Czippelova, B.; Chladekova, L.; Turianikova, Z.; Visnovcova, Z.; Lazarova, Z.; Tonhajzerova, I. Cardiovascular control during orthostatic and mental stress: Conditional entropy based analysis. Proceedings of 2014 8th Conference of the European Study Group on Cardiovascular Oscillations, Trento, Italy, 25–28 May 2014; pp. 14–15.
  19. Hjemdahl, P.; Freyschuss, U.; Juhlin-Dannfelt, A.; Linde, B. Differentiated sympathetic activation during mental stress evoked by the Stroop test. Acta Psychiat. Scand. Suppl. 1983, 527, 25–29. [Google Scholar]
  20. Baumert, M.; Javorka, M.; Seeck, A.; Faber, R.; Sanders, P.; Voss, A. Multiscale entropy and detrended fluctuation analysis of QT interval and heart rate variability during normal pregnancy. Comput. Biol. Med. 2012, 42, 347–352. [Google Scholar]
  21. Bari, V.; Valencia, J.F.; Vallverdú, M.; Girardengo, G.; Marchi, A.; Bassani, T.; Caminal, P.; Cerutti, S.; George, A.L., Jr.; Brink, P.A.; et al. Multiscale complexity analysis of the cardiac control identifies asymptomatic and symptomatic patients in long QT syndrome type 1. PLOS ONE 2014, 9, e93808. [Google Scholar]
  22. Lewis, M.; Short, A. Sample entropy of electrocardiographic RR and QT time-series data during rest and exercise. Physiol. Meas. 2007, 28. [Google Scholar] [CrossRef]
  23. Hasan, M.A.; Abbott, D.; Baumert, M. Relation between beat-to-beat QT interval variability and T-wave amplitude in healthy subjects. Ann. Noninvasive Electrocardiol. 2012, 17, 195–203. [Google Scholar]
Figure 1. Illustration of the two-dimensional warping algorithm. The template beat (blue) is mapped to a warping grid (blue), which is adapted to the incoming beat (black) by moving the warping points such that the distance between template and incoming beat is minimized. The optimally fitted template and the corresponding warping points are shown in red.
Entropy 16 06384f1
Figure 2. Mean and standard deviations of beat-to-beat RR and QT interval time series during baseline (bl), head-up tilt (tilt), recovery (rec), mental arithmetic task (ma) and recovery (rec) phases. Data are expressed as group mean values and standard deviations. Asterisks indicate significant changes with respect to baseline measurement. (****p < 0.0001, ***p < 0.001, **p < 0.01, *p < 0.05)
Entropy 16 06384f2
Figure 3. Sample entropy and cross-sample entropy of beat-to-beat RR and QT interval time series during baseline (bl), head-up tilt (tilt), recovery (rec), mental arithmetic task (ma) and recovery (rec) phases. Data are expressed as group mean values and standard deviations. Asterisks indicate significant changes with respect to baseline measurement. (*p < 0.05)
Entropy 16 06384f3
Figure 4. Conditional coupling from RR to QT and from QT to RR, respectively, with lags shown below during baseline (bl), head-up tilt (tilt), recovery (rec), mental arithmetic task (ma) and recovery (rec) phases. Data are expressed as group mean values and standard deviations. Asterisks indicate significant changes with respect to baseline measurement. (*p < 0.05)
Entropy 16 06384f4

