
Phoenix: Aerial Monitoring for Fighting Wildfires

Department of Computer Engineering, Istanbul Technical University, Maslak, 34467 İstanbul, Turkey
*
Author to whom correspondence should be addressed.
Drones 2023, 7(1), 19; https://doi.org/10.3390/drones7010019
Submission received: 30 November 2022
/
Revised: 15 December 2022
/
Accepted: 20 December 2022
/
Published: 27 December 2022
(This article belongs to the Special Issue Recent Advances in Aerial and Ground Robotic Swarm Networks)
Abstract
:Wildfires have become a global problem in recent years. Authorities are looking for various technological and auxiliary solutions to deal with this environmental crisis. One of the advances being utilized in the forest fire field and its aftermath is unmanned aerial vehicles (UAVs). UAVs play a fundamental role in wildfire-fighting solutions due to their ease of use and high accessibility. However, the energy constraints of a single UAV and the fire areas make monitoring challenging. Therefore, to address these issues, we propose a monitoring application called Phoenix. We make three main contributions with the Phoenix application. Firstly, we implement a monitoring application consisting of path planning, graph engine, and modified TSP algorithms to help the UAV’s fire tracking and shorten its route. Secondly, we develop a network architecture to transfer the tracking data we obtained to provide information to the fire brigade and other firefighting units. Thirdly, we provide energy optimization for a single UAV mission. The first part of the application uses the elliptical fire model and simulation. In addition, Phoenix utilizes fuel moisture content () data of the fire zone to analyze the critical fire regions. The simulation results show that our Phoenix application reduces energy consumption by 38 % and enhances coverage by up to 51%.
1. Introduction
Wildfires are conspicuous natural phenomena that the world has had to face in recent years. With the negative effect of global warming, the number of wildfires has increased and become widespread worldwide. In 2019, devastating wildfires started in Australia that caused the death and displacement of 3 billion animals [1] and continued to burn until the first quarter of 2020. Wildfires are one of the most significant natural disasters, threatening both natural life and humanity. The adverse impact of wildfires is not limited to the nearby environment. Other consequences that emerged from the wildfires were abnormally increased phytoplankton blooms and carbon dioxide release that adversely affected marine ecosystems [1].
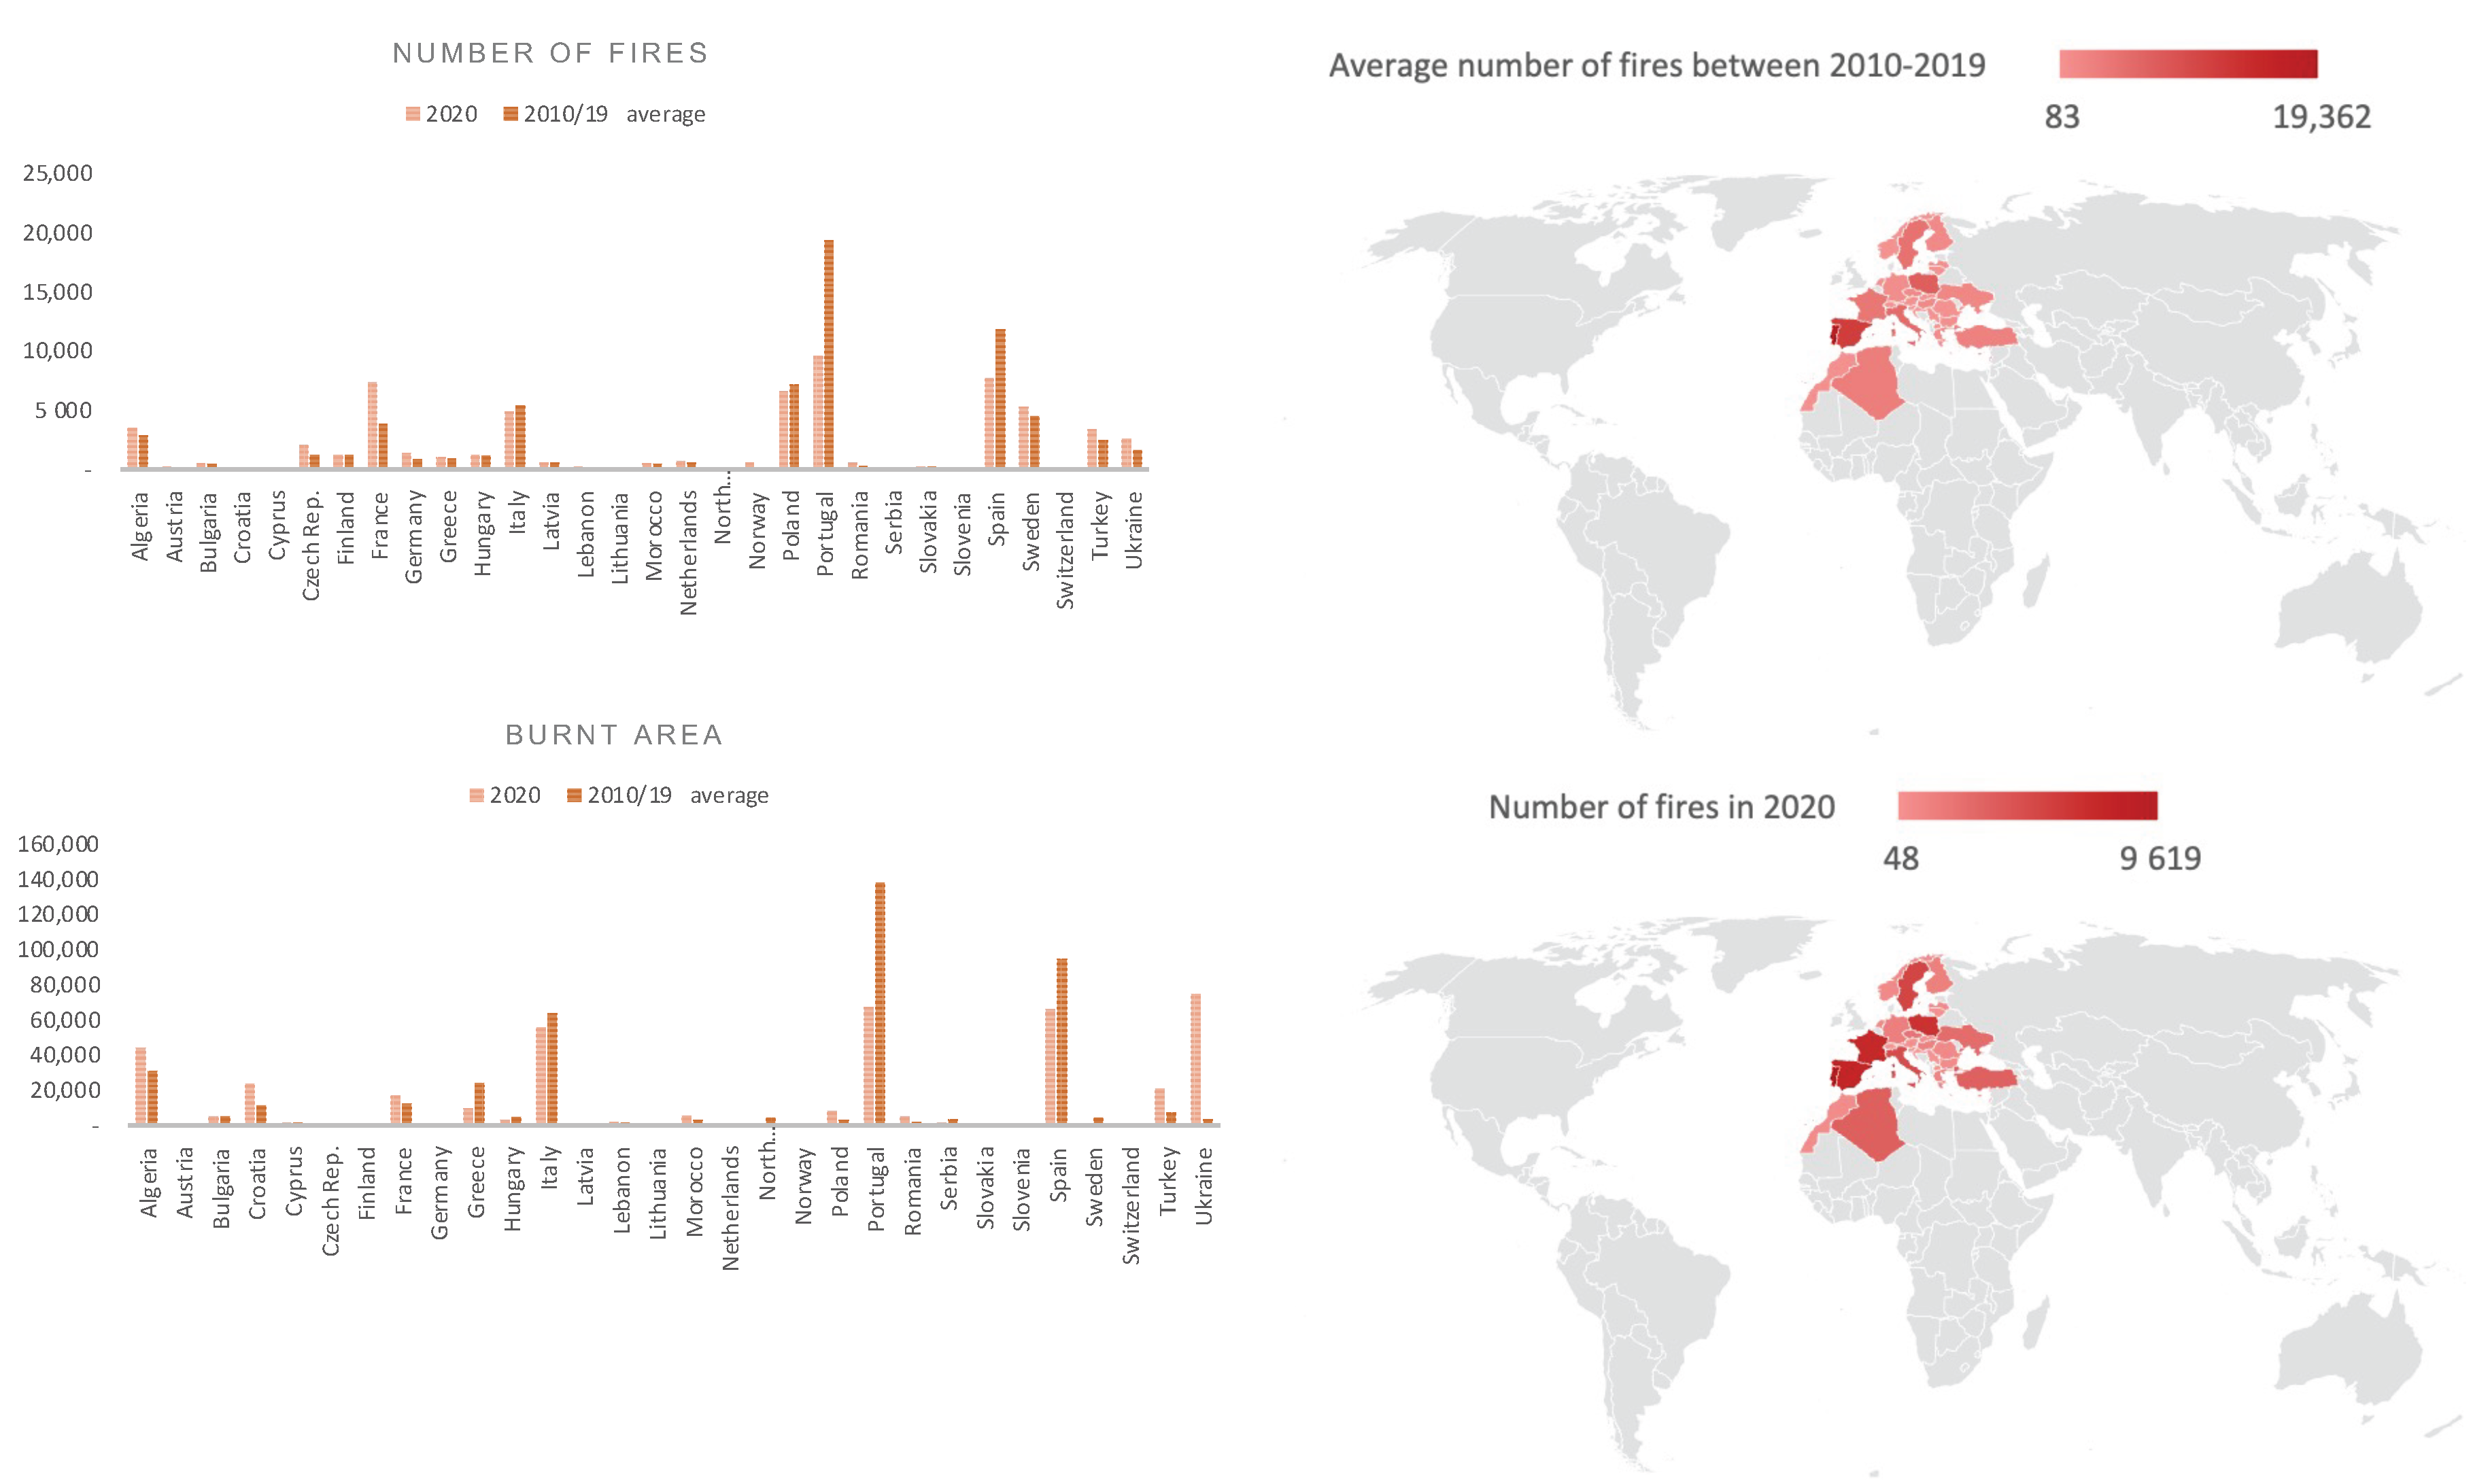
Unfortunately, the Australian wildfires were not the only long-term destructive natural disasters in the last years. California, Turkey, Greece, and Italy suffered from forest fires caused by dry weather and high temperatures [2]. According to the reports, the 2020 and 2021 summers were the hottest recently. It took days and months to extinguish the fires. The results of the report [3] from the European Commission’s Joint Research Center (JRC) state that there is an apparent increase in both the number of fires and the burnt area in 2020, as seen in Figure 1. As the number and severity of the fires increase, the extinguishing efforts are also becoming insufficient. Firefighters are not adequate to control the giant fires in huge areas. Because of these extreme conditions, countries have had to take advantage of ground and aerial support units during the firefighting process.
With the increasing number of fires in recent years, efforts to intervene and control fires have also started to develop rapidly. In particular, while aerial intervention plays a critical role in extinguishing fires, the strategic use of UAVs has increased considerably. UAVs are utilized for various purposes, including data collection for pre-fire forecasting, monitoring, and firefighting. Additionally, UAVs are capable of carrying out activities related to post-fire rehabilitation. Using UAVs in such a crucial role has led to a diversity of wildfire applications being developed. Both industry, academia, and government agencies have increased the use of UAVs in wildfire research.
Figure 1.
Number of fires and burnt areas in 2020 and between 2010 and 2019 according to JRC report for countries [3].
Figure 1.
Number of fires and burnt areas in 2020 and between 2010 and 2019 according to JRC report for countries [3].

Moreover, large-scale forest fires are more challenging to fight than smaller fires. The environmental conditions of forested areas, such as mountainous and hilly terrain, can affect the direct reaction to the fire. In addition, the density of trees can also impede access to the fire area. Because of these factors, UAVs are of great importance in fire monitoring. Additionally, UAVs are cost-effective and physically easy to transport by fire units, which increases their use in wildfires.
The widespread use of UAVs in different domains and the fact that they have been the subject of prominent on-site computation studies have developed several applications. The cost of employing UAVs in aerial networks is dropping, which extends a wider range of applications [4]. However, wireless communication is more vulnerable to attack and data theft than wired communications. In this context, the authors of [5] propose a security solution that uses the DEA window analysis and Malmquist index to prevent data theft that may occur in aerial networks created using drones. In [6], the authors attempted to minimize energy consumption while increasing the coverage area of aerial base stations (ABSs). In this context, the authors used the hidden Markov model (HMM) method to calculate the next state of mobile users. They also used reinforcement learning to reduce energy consumption and position the drones in the right places as aerial base stations. In [7], the authors proposed a framework that utilizes deep reinforcement learning methods to overcome UAV network control issues. The framework contains a programmable control interface and learning engine. The authors of [8] proposed a search-and-rescue application for natural disasters using UAVs. The application monitors disaster areas to detect victims. It modifies the UAVs’ path according to the victims’ locations. It also provides a neural network-based prediction mechanism for future victim detection.
The interest of both academia and industry has shifted towards developing new solutions and technologies in order to cope with drastically increased wildfires around the globe. In this study, we categorize the related literature into two major groups: wildfire monitoring and detection. In order to provide reliable monitoring during disasters such aswildfires, Afghah et al. [9] proposed to employ autonomous UAVs to deal with hard-to-reach sites during a fire. Furthermore, they suggested a distributed model with a framework that provides maximum coverage with a minimum number of UAVs to group many UAVs into several coalitions. Various studies [10,11,12,13] used a cellular automata model to analyze fire propagation. Rashid et al., in [10], proposed a wildfire monitoring model that combines a computational model and social media-driven drone sensing (SDS) methods. Their model utilizes social media signals for a cellular automata-based computational model. They also combined their model with meteorological data to analyze wildfire prediction. Giuseppi et al. in [11] suggested a monitoring application that utilizes satellite data. Another study [12] provided a UAV swarm for a searching and tracking method for wildfires using temperature levels. Yet another study [13] focused on a fire propagation model that employs a geographical information system. Genetic algorithms support the model to verify the results. The authors in [14] suggested an application model for monitoring the evolution of wildfires. Ref. [14] integrated real-life terrain maps, fire propagation models, and wind models to plan trajectories for fixed-wing UAVs. Their model adapts generic variable neighborhood search (VNS) to integrate maps and models. Furthermore, previous studies [15,16] have utilized Kalman filter-based solutions. One study [15] proposed a UAV cooperation method for monitoring wildfire contours. A distributed optimization problem for coverage was formulated using a mathematical model and derivation. In [16], the authors suggested a method that provides a scalar field wildfire model and a Kalman filter-based estimation approach. They aimed to estimate and monitor fire conditions and fire contours during wildfires and collect the related data with a group of UAVs. In [17], the authors suggested an Internet of Things (IoT) application that detects fires and estimates fire intensity employing UAVs. Ref. [17] implemented a convolutional neural network (CNN)-based model, XtinguishNet, for the estimation of fire intensities. Their model categorizes fire images as high, medium, and low intensity. In addition, the application collects weather and wind data from the fire zone using sensors. Zhao et al. proposed a CNN-based saliency detection method that uses UAV imagery in [18]. In [19], the authors utilized 360-degree sensor cameras and a deep CNN to segment smoke and fire images. Ref. [20] proposed an early smoke detection system that uses machine learning-based image segmentation techniques and a cloud-based application. The authors in [21] suggested a forest fire detection and monitoring method to decrease false warnings in wildfires. Their suggestion included code identification, smoke motion detection, and fire classification methods. In [22], Muhammad et al. proposed an early fire detection system based on a CNN for indoor and outdoor locations. Additionally, they developed a cognitive radio channel selection method for cameras. Ref. [23] suggested a CNN-based fire detection from related videos. To decrease the computational complexity, they provided fully connected, non-dense CNN layers. The authors of [24] implemented a CNN-based prediction model to analyze and model forest fires. They trained their model using past forest fire data from Yunnan, China. In addition, they evaluated their results with well-known machine algorithms such as support-vector machines and random forests.
Nevertheless, despite all the advantages of UAV use, the terrain and fire conditions can make fire monitoring challenging. Taking these challenging conditions, including smoke, mountainous fire areas, and dense forests, into account, we propose an application called Phoenix to monitor the fire situation and send the necessary information to the fire departments. This proposed method’s novelty is combining physical and stochastic fire model perspectives and employing them to analyze and monitor fire areas. The proposed Phoenix application consists of two main parts: a monitoring part and an information-sending part for firefighters. To sum up, our contributions in this study are:
- We implement the Phoenix method, which consists of a path planning algorithm, a graph engine algorithm, and a modified TSP algorithm for monitoring. In this part, we utilize the elliptical fire model and fire simulation to map possible fire zones for the UAV to monitor. Then, we identify the critical paths of the fire zone using fuel moisture content data. In the last step, we calculate new flying paths according to the critical path and temperature of the fire area.
- We analyze and optimize energy consumption for a single UAV for a critical wildfire mission according to altitude and prior fire zones.
- We provide performance evaluation for our proposed method, which compares different fire area sizes and several clusters in terms of cost, energy consumption, coverage delay, and coverage ratio.
The rest of the paper is organized as follows. In Section 2, we provide detailed information about our proposed method, where we explain our problem formulation, envisioned network architecture, and developed optimization algorithms. Then, Section 3 outlines the details of our simulation setup and evaluates the performance of the proposed framework. Lastly, we conclude our paper by summarizing our contributions and describing future work in Section 4.
2. Proposed Method and Application
In this section, we explain our proposed method in two parts: Application Architecture and Network Architecture. We give the details of our proposed method and algorithms in the Application Architecture section. The Network Architecture section contains the components of the network topology we propose for fire areas. Then, we provide an energy optimization formulation and its constraints.
2.1. Application Architecture
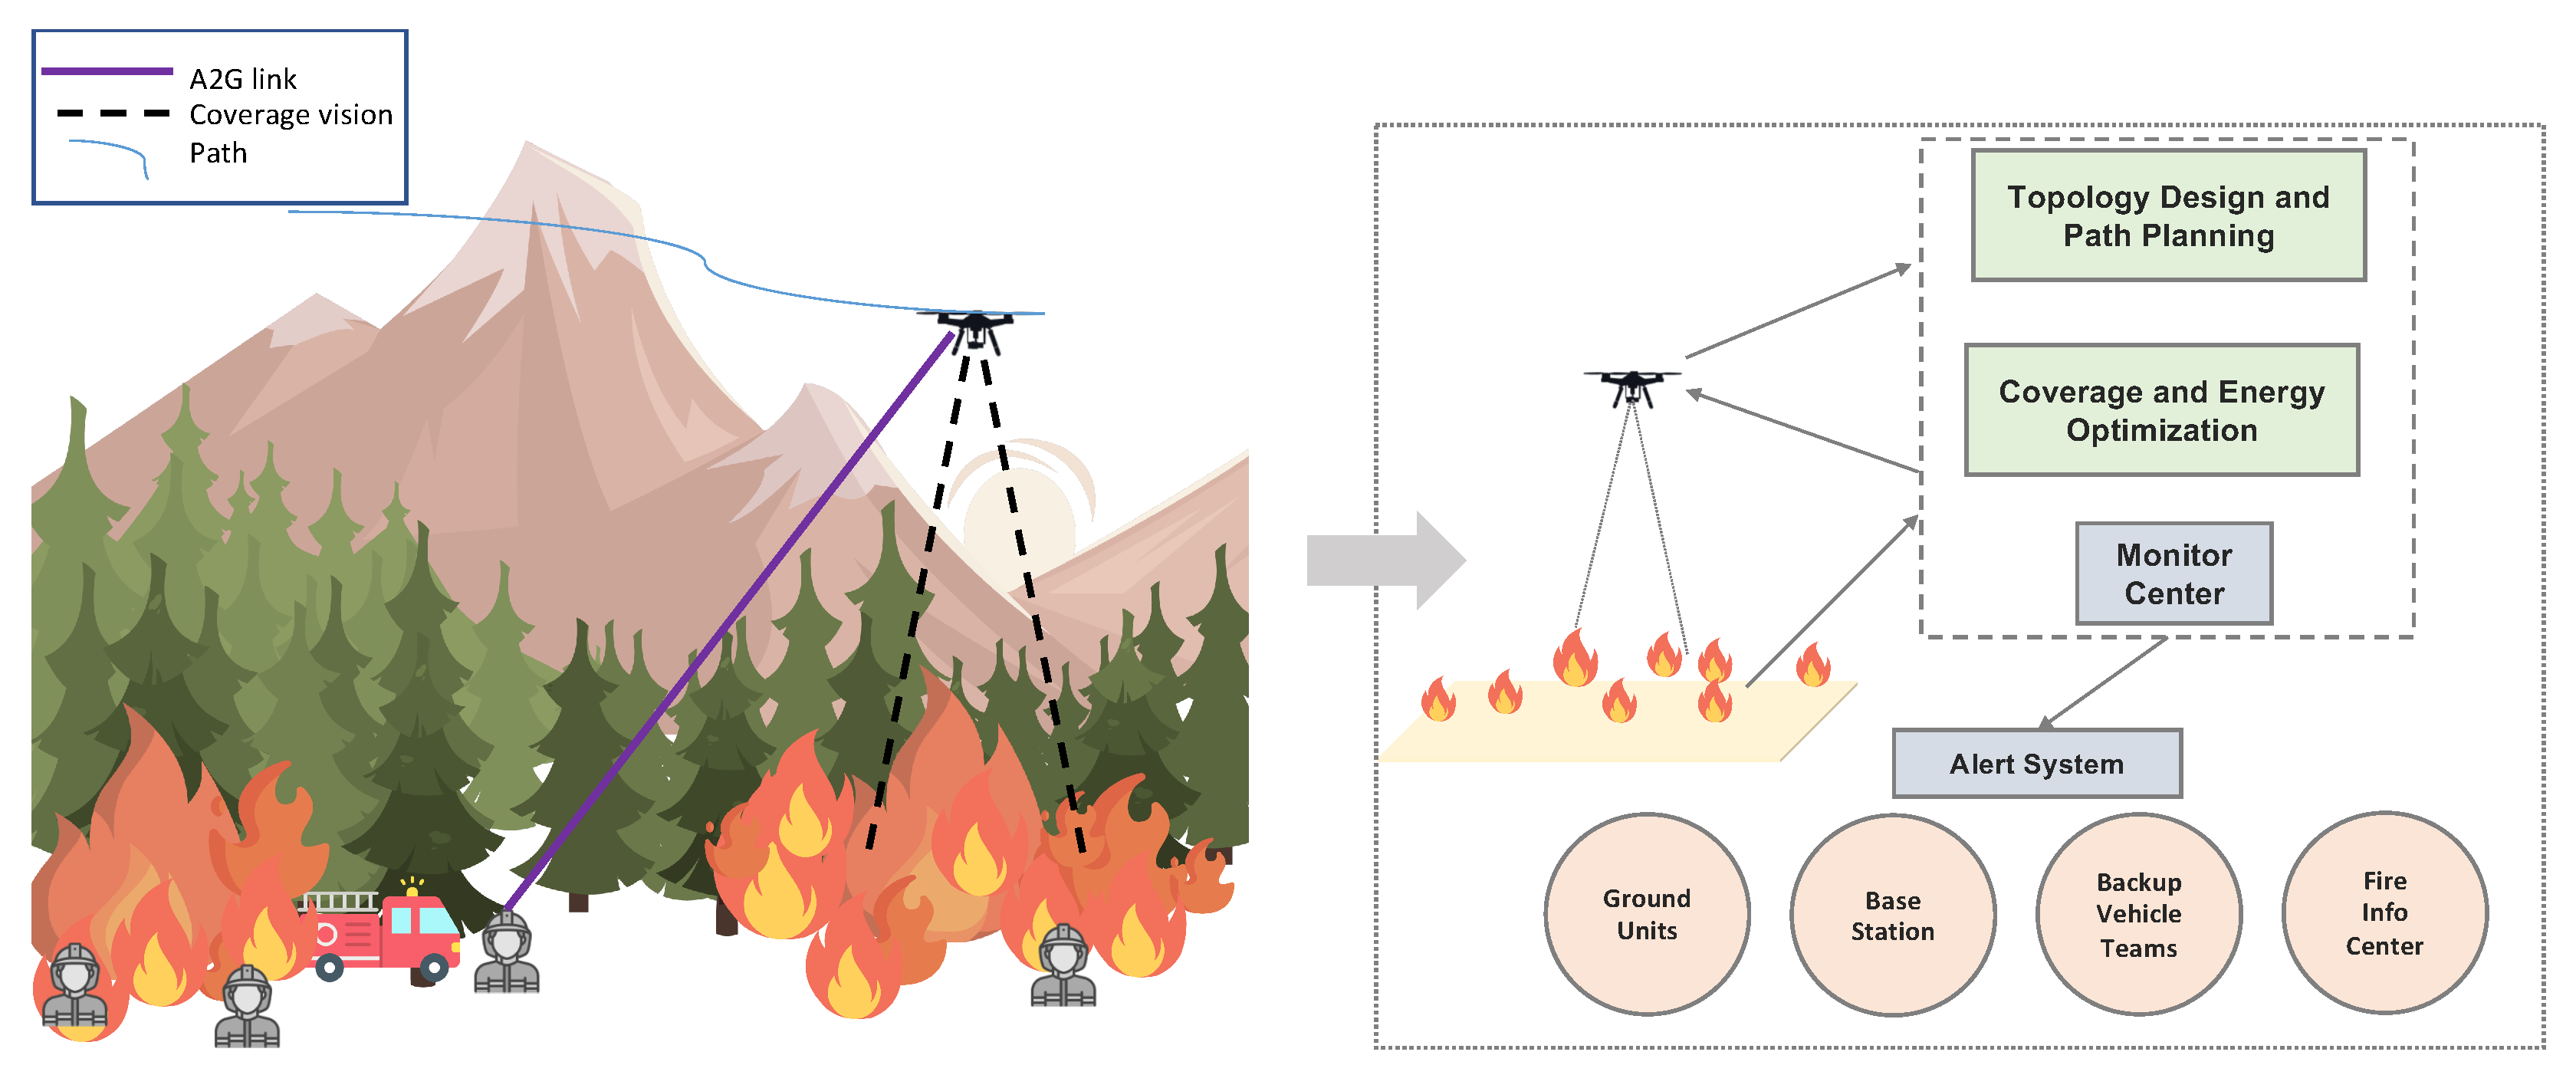
Our proposed application architecture has four main parts: topology design and path planning, a monitoring center, an alert system, and coverage and energy optimization, as shown in Figure 2. The details about the application architecture are given in the below subsections.
Topology Design and Path Planning
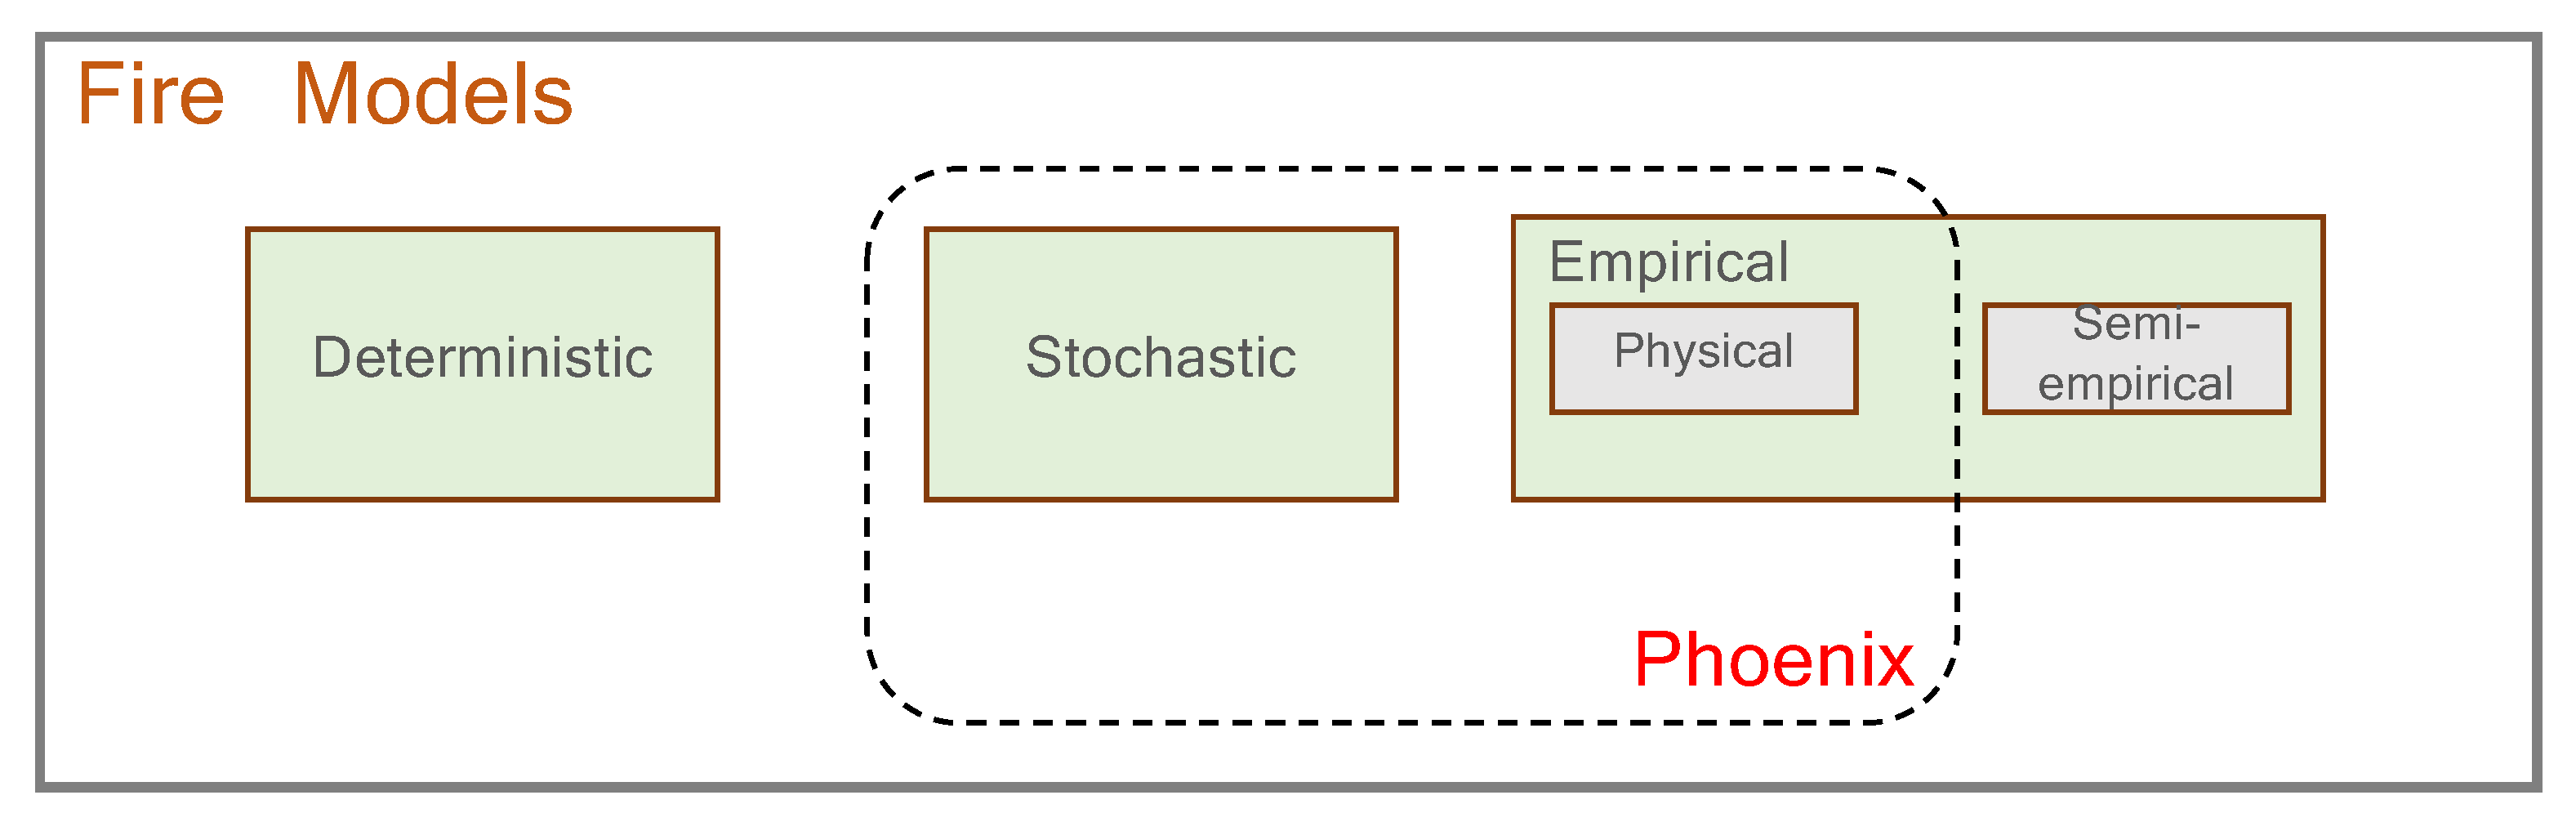
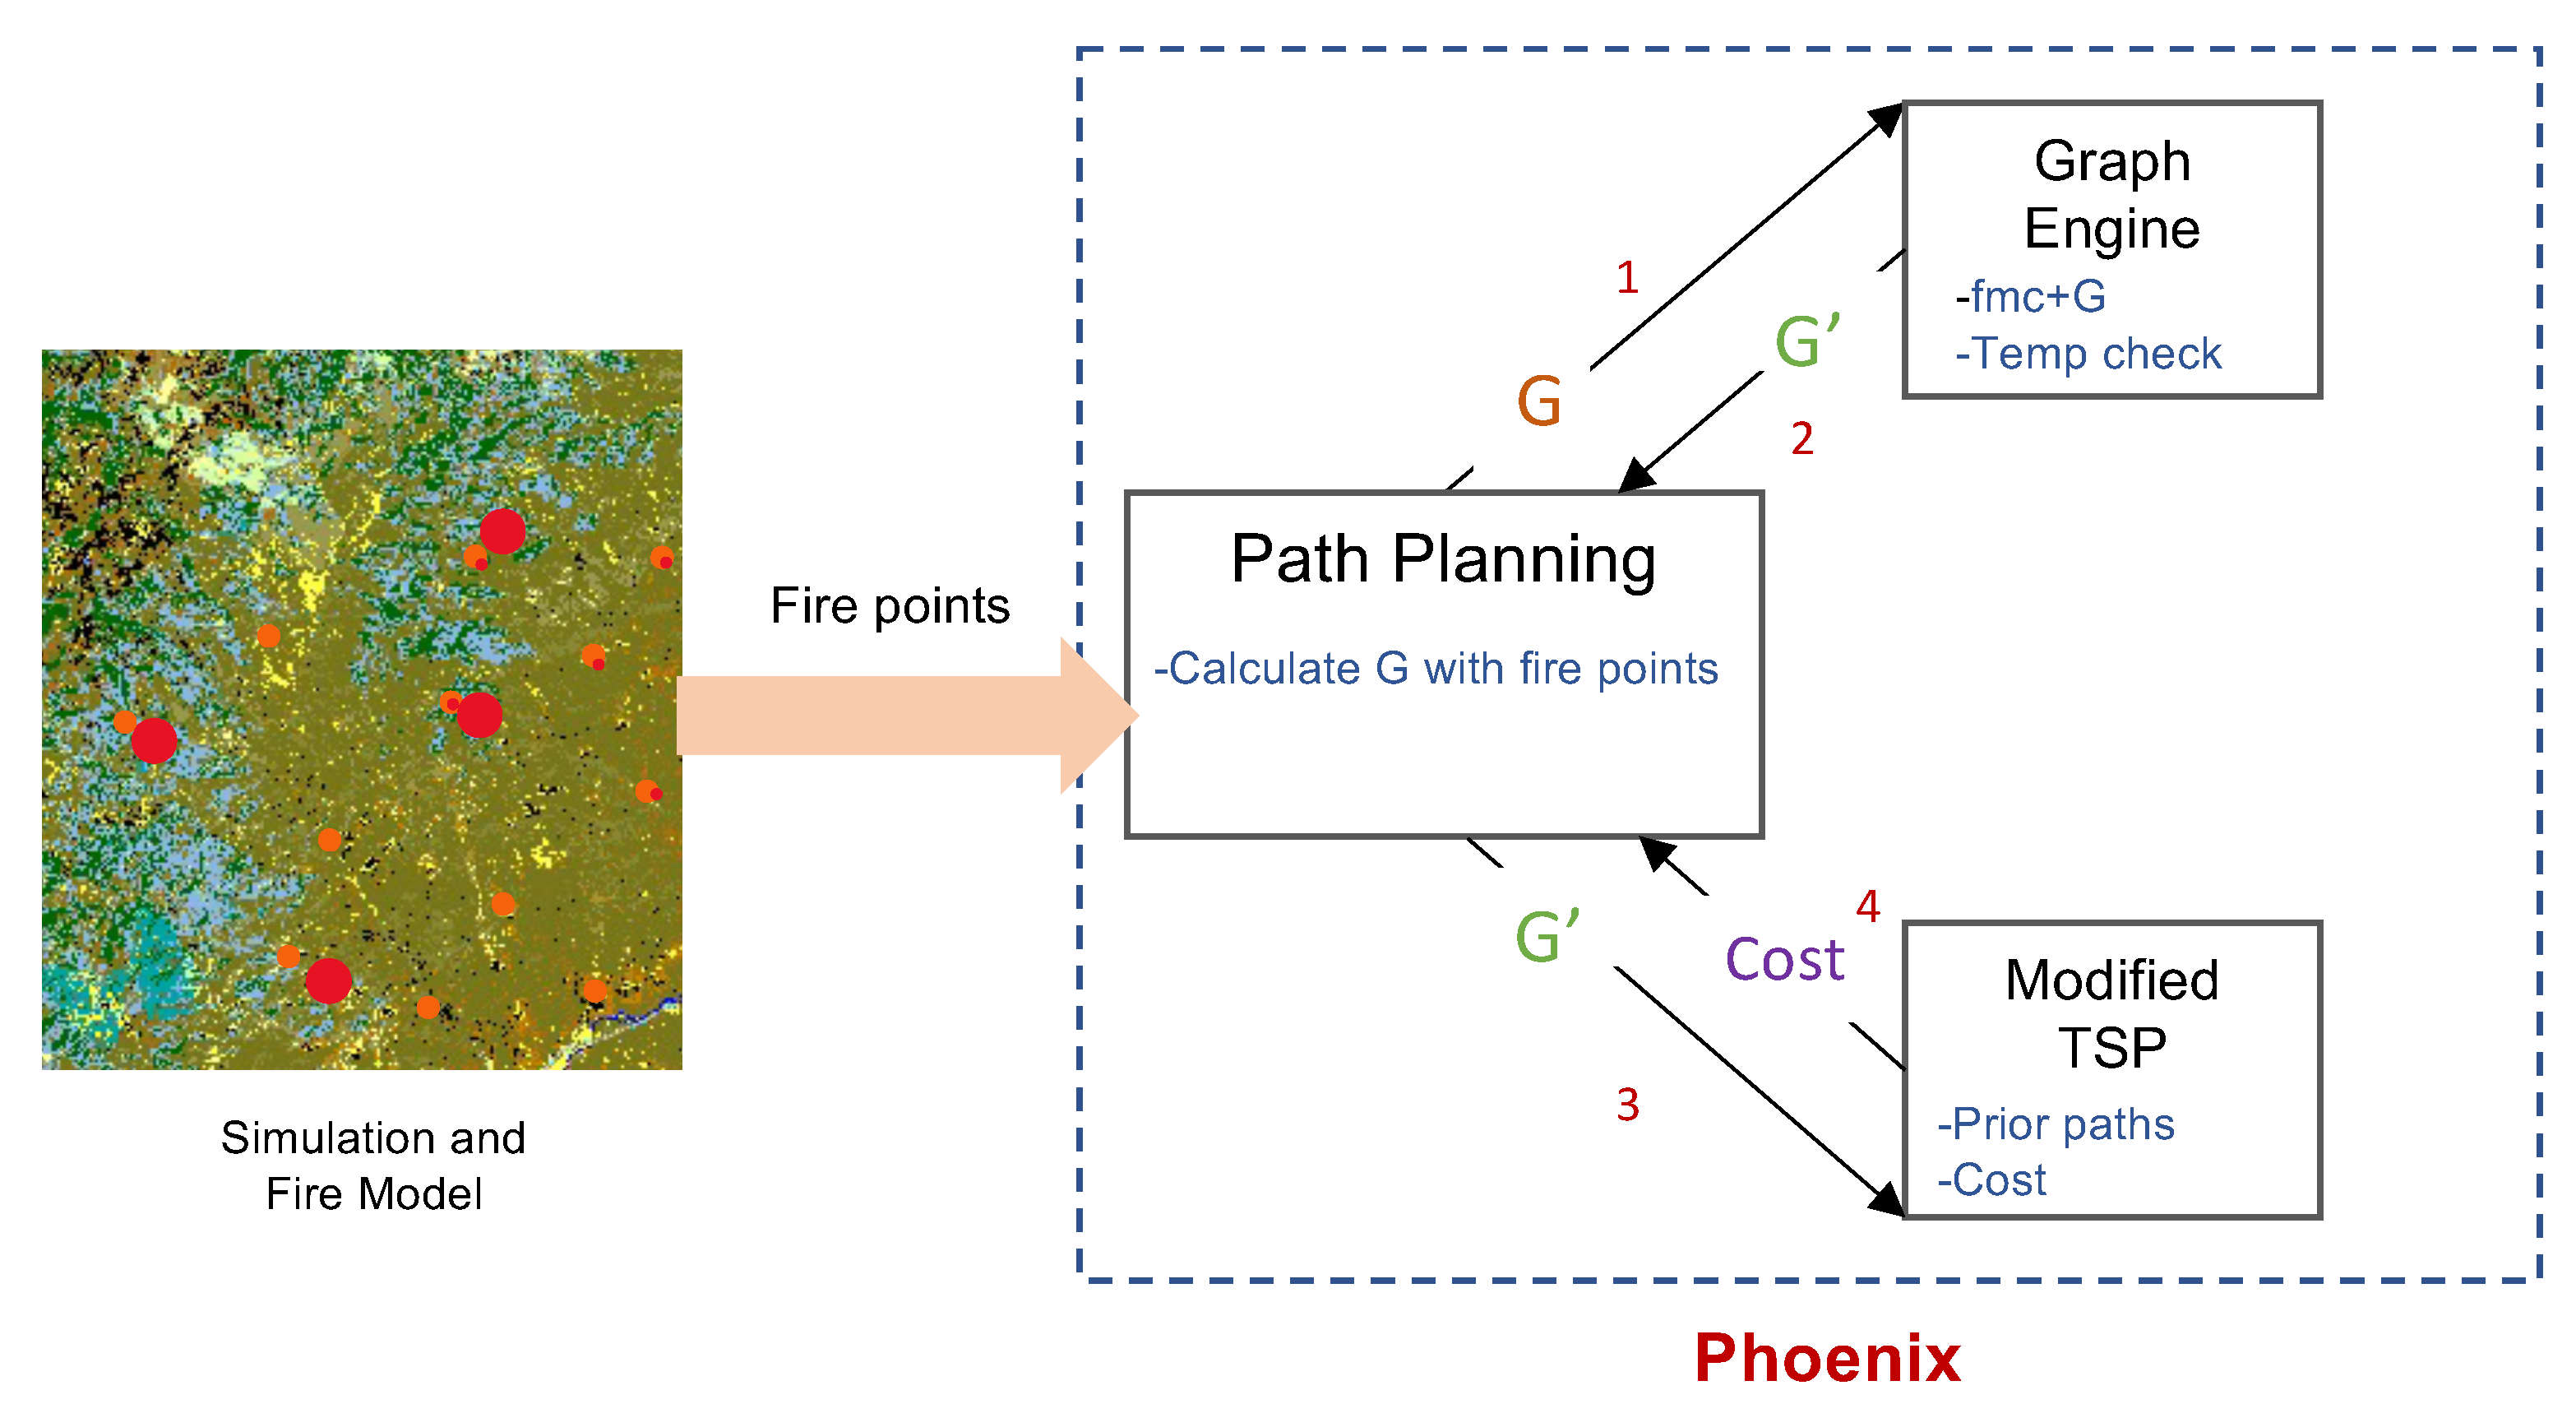
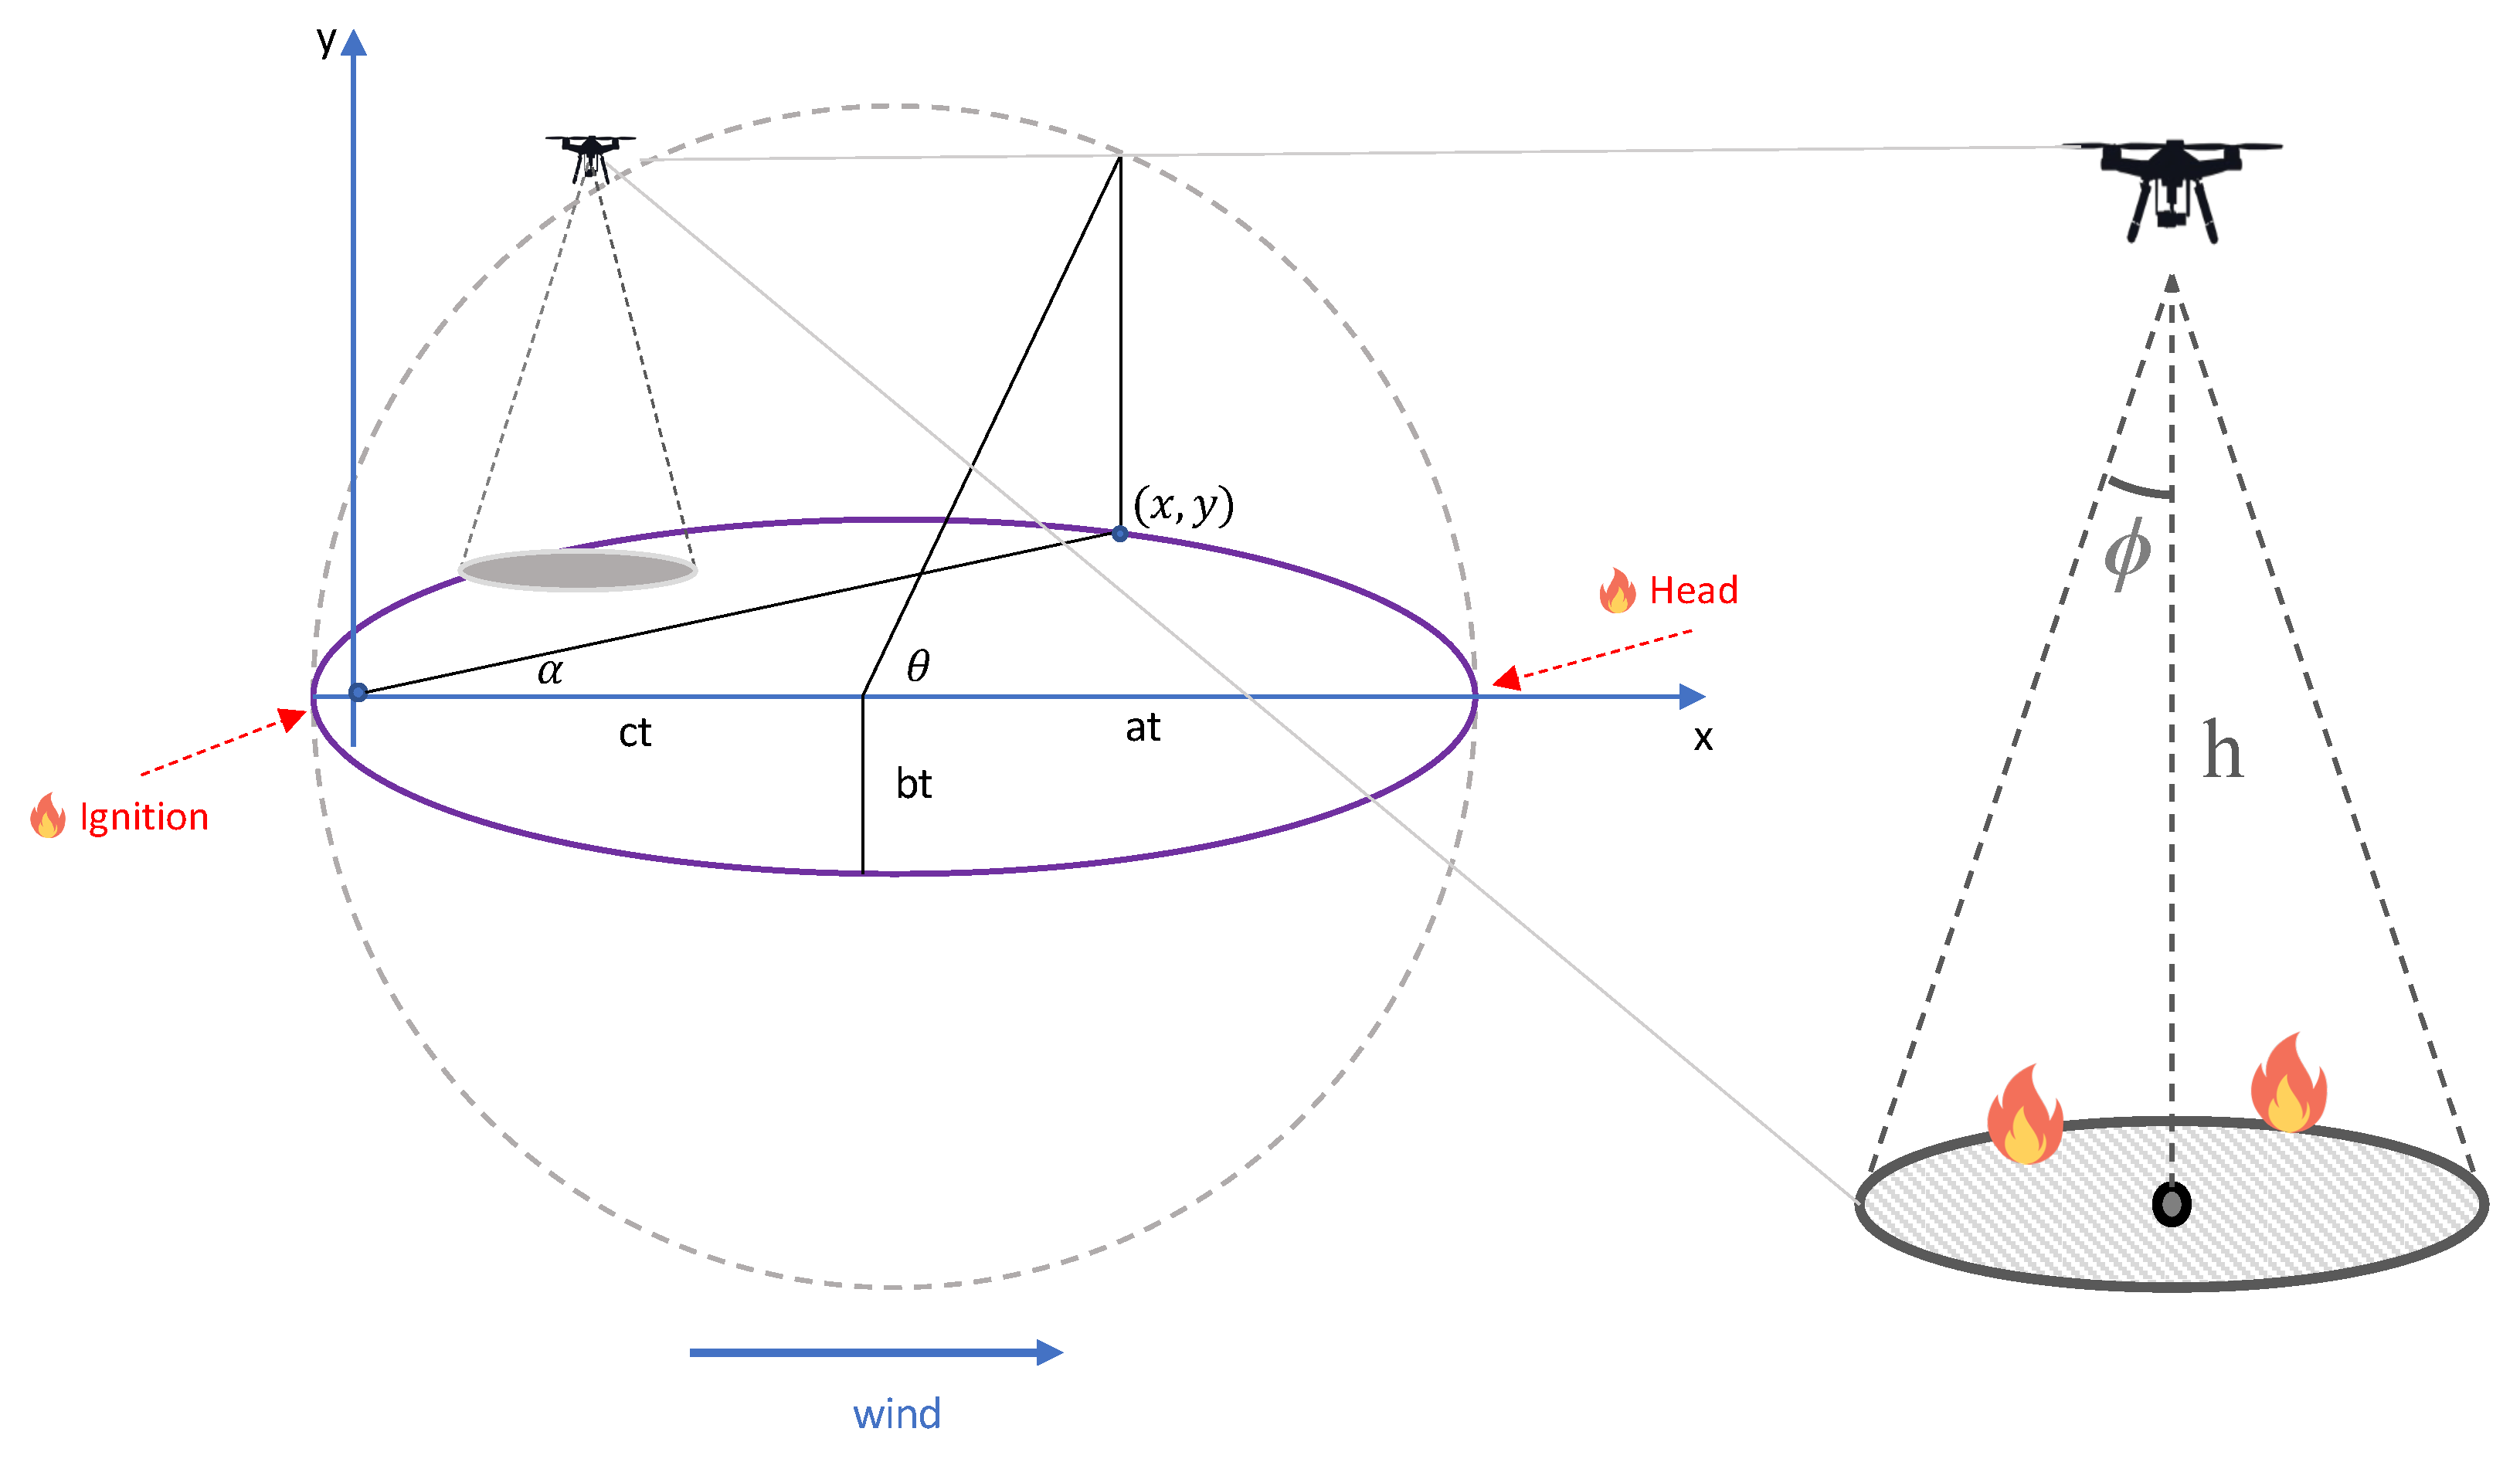
Path Planning Algorithm: In the topology design and path planning module, we implement the path planning algorithm, as shown in Algorithm 1, which consists of two parts: a graph engine and a modified TSP algorithm. Fire models come first when analyzing the spread of fires and the factors affecting them. The main fire models are stochastic, deterministic, and empirical, as seen in Figure 3. The empirical model contains physical and semi-empirical [25] models. We utilize the elliptical fire model [26], this elliptical fire model is a physical fire model approach, in the first phase of the path planning algorithm, as shown in Figure 4. The elliptical fire model is shown in Figure 5. The model describes a fire’s behavior according to physics laws. Fire spreading from other ignition points continues to spread elliptically according to Huygens’ principle [25]. We implement the elliptical fire model in our fire simulation to generate the graph . We use fire points to calculate V, E, and w. is a set of vertices representing fire ignition points and dense fire clusters. is the set of edges and possible paths between two vertices. w is the weight function, which is the set of Euclidean distance values between two adjacent vertices. To calculate V, according to the elliptical fire model [26] shown in Figure 5, a specific fire point coordinates x and y are calculated as follows:
where is the perimeter angle at the X axis, and . is the propagation time from the ignition point to the point .
Moreover, we need to calculate the fire spread rates to predict and analyze the spread of fire points. The maximum fire spread rate and backfire spread rate are calculated as follows:
where a and b are fire spread rates according to the wind direction for the X and Y axes, respectively. c is the constant moving rate of the center of the ellipse. and play a crucial role in mapping the fire clusters and edges between related points.
After the path planning algorithm determines the fire zones using the fire model, it sends the generated G to the graph engine.
![Drones 07 00019 g003]()
![Drones 07 00019 g004]()
![Drones 07 00019 g005]()
Figure 3.
Fire models.

Figure 4.
Phoenix Architecture.

Figure 5.
Elliptical Fire Model [26].
Figure 5.
Elliptical Fire Model [26].

| Algorithm 1: Path Planning Algorithm. |
|
Graph Engine: The graph engine has two objectives. The first one is to map fuel moisture content () values in the region, and the second is to check the temperature values in the area that must be monitored. In other words, the graph engine converts from the path planning algorithm to .
is a value indicating the proportion of water in plants. helps determine a region’s wet and dry mass of vegetation. is one factor that directly affects fire [27]. impacts the distribution, behavior, and growth of fire and also gives an idea about whether the fire will spread to the relevant area [28].
The algorithm starts with mapping the values to the related graph G, as shown in Algorithm 2. The fire area A is divided into small and equal subareas such that . Each subarea has its own value. The value of subarea is calculated as in Equation (5):
where is the wet weight and dry weight of the fuel content of the area .
The average value of the fire point in the area is calculated as follows:
The algorithm checks values of each vertex of G. If the value of the vertex is smaller then , which is the threshold of values, the vertex is marked as prior because in areas where values are low, the growth and spread rate of a fire are higher. The aim of checking the fmc values is to prioritize monitoring areas with high spread and growth risk. Secondly, the algorithm controls the temperature of the paths for a UAV flight during wildfire. There are two main elements to consider for removing the edges:
- Flight distance for safety;
- Energy constraints for a UAV.
If the temperature of the edge is higher than the safe temperature , the algorithm removes the edge from the graph G. The algorithm updates G, taking into account the edges removed, and creates a new graph . Additionally, the graph engine ensures that at least one connection edge remains between vertices.
| Algorithm 2: Graph Engine Algorithm. |
|
Modified TSP Algorithm: In catastrophic environmental events such as wildfires, where a single UAV will be deployed, it is essential to determine the flight path. In fact, in addition to planning the path, ensuring that a single UAV completes the flight without running out of battery requires detailed planning. Because of this, we adapt a three-stage detailed path planing mechanism. The path planning algorithm and graph engine algorithm generate and update the graph for the UAV to monitor the fire area completely and correctly. In the modified TSP algorithm, as shown in Algorithm 3, the goal is to ensure that the UAV moves in a planned manner. Therefore, we adapt the well-known travelling salesman approach to our problem.
| Algorithm 3: Modified TSP Algorithm. |
|
The modified TSP algorithm first determines the initial vertex for the UAV to monitor. This vertex determination is based on the location of the ground station and the location of the nearest vertex. If there are vertices equally distant from the ground station, which can be more than one initial vertex, the modified TSP algorithm selects the vertex with priority as the initial vertex. The modified TSP algorithm repeats the vertex selection until no uncovered vertex exists. The reason for monitoring priority areas at this stage is to cover all vital fire areas within a specific time interval. Less important fire areas, i.e., areas less likely to grow and spread to other areas, can be monitored later. However, fires that spread and grow in risky areas are challenging to recover from.
Moreover, after completing the vertex selection, the modified TSP algorithm calculates the path cost between the vertex where the UAV is located and the selected vertex, which is . After each vertex selection, the modified TSP algorithm calculates the path cost to obtain the total cost. The algorithm evaluates the total cost for benefit in coverage and energy optimization. Some factors that affect the total cost are:
- The size of the fire area;
- The number of fire ignition points;
- The distance of fire clusters from each other.
Additionally, other factors that affect the fire conditions also affect the total cost, such as wind speed and direction.
2.2. Network Architecture
Communication is crucial both during and after natural disasters in many ways, including for disaster assessment and recovery. In order to minimize the damage of the disaster, it should be ensured that communication is not harmed and persists. The natural disaster may have damaged network infrastructure. In such cases, ad hoc networks, where no infrastructure is needed, come into play. However, communication infrastructure might or might not collapse in natural disasters such as wildfires. This is because there may be no extensive network infrastructure to affect communications directly in areas where wildfires occur. Because of all these reasons, we propose a network architecture that contains an ad hoc network in the fire area containing ground units, a base station, and backup vehicle teams, as shown in Figure 2.
Fire Area: Our application uses an ad hoc network to transmit monitored information about the fire in the fire area. The ad hoc topology contains the UAV and the ground station (GS). The UAV and GS connection is the most critical link in our network architecture because the UAV sends the monitoring information about the fire situation to the GS via this link.
In the second phase, the GS can inform the vehicular backup teams about the status of the fire via base stations. Vehicular backup teams are directed according to the growth rate and position of the fire. The GS also provides information to the fire information center, which is the center of the fire brigades. Depending on the severity of the situation, the fire information center contacts the medical units and rescue teams and directs them. There may be no occupants or people in the area, but animals suffer a lot due to the destructive effect of fires.
2.3. Coverage and Energy Optimization
Due to high temperatures in wildfires, UAVs must fly at a certain altitude to safely complete their missions. The fire level may change in some regions, affecting the flight altitude. The flight altitude should be revised for flights in areas with increased fire height. In addition, temperature sensors are useful for calculating unsafe flight altitudes.
However, as the flight altitude of the UAV increases, the energy they consume increases. A flight plan should be made considering terrain and fire conditions if there is only a single UAV. A flight plan should be organized in the most optimal way for the reasons and conditions of the UAVs’ flight mission [29]. This planning should also consider the maximum flight time that can be achieved with the batteries and the energy it will consume when returning to recharge the UAV. The consumed energy of a UAV in time slot is calculated in [30] as follows:
where is the energy loss coefficient during flying, is the energy loss coefficient during ascending, and is the energy loss coefficient of descending. is the flying time in the time slot of the UAV, and h is the flight altitude. The coverage area of a UAV is calculated as:
where is the coverage angle of the UAV.
Increasing the flight altitude increases the UAV’s coverage area. Nevertheless, we cannot directly increase the flight altitude to increase the coverage area. While we can provide the required flight level for high temperatures, we must recognize the negative impact this has on energy consumption. Instead of providing the required coverage, the priority is to ensure a safe flight level and minimize energy consumption. In order to minimize energy consumption, flights with a single drone should be carried out without exceeding the safe flight level.
For all these reasons, we can keep the flight altitude at a minimum and constant as much as is practicable and increase the area that can be covered per unit of time. To do this, we can also use the fire model and heuristics to neglect fewer priority areas in the first stage. Depending on the fire’s characteristics, flight planning can be made in advance for areas with certain splash zone hazards. According to these constraints, we minimize the total consumed energy :
where is the total flight time of the UAV according to battery constrains. The coverage area threshold is calculated according to the safety flight altitude and the minimum flight time. If there are critical fire zones, they should be designated first. The designated crucial fire zones are identified as prior zones and covered accordingly. Temperatures can increase to levels that can be hazardous for UAV equipment and flight in specific fire areas. Therefore, flights over these regions are impractical and should be avoided.
3. Performance Evaluation and Results
In this section, we will evaluate the cost, energy, and coverage improvement ratio results. For this, we first obtained the points of the fire area with the help of a fire simulation. We used Firesite and FlamMap for our fire simulations. In the simulation, the value was equal to 1, and the values of a, b and c were equal to 30, 18, and 2, respectively. After obtaining the fire points, we used this data in the second step of our simulation. In this step, we used Matlab and UAV Toolbox to analyze the results of our proposed method. In this simulation environment, we took as 30m. We also set our flight time as 20 min. We ran the simulation 50 times for each scenario. The obtained results are presented with a confidence interval level of 95%.
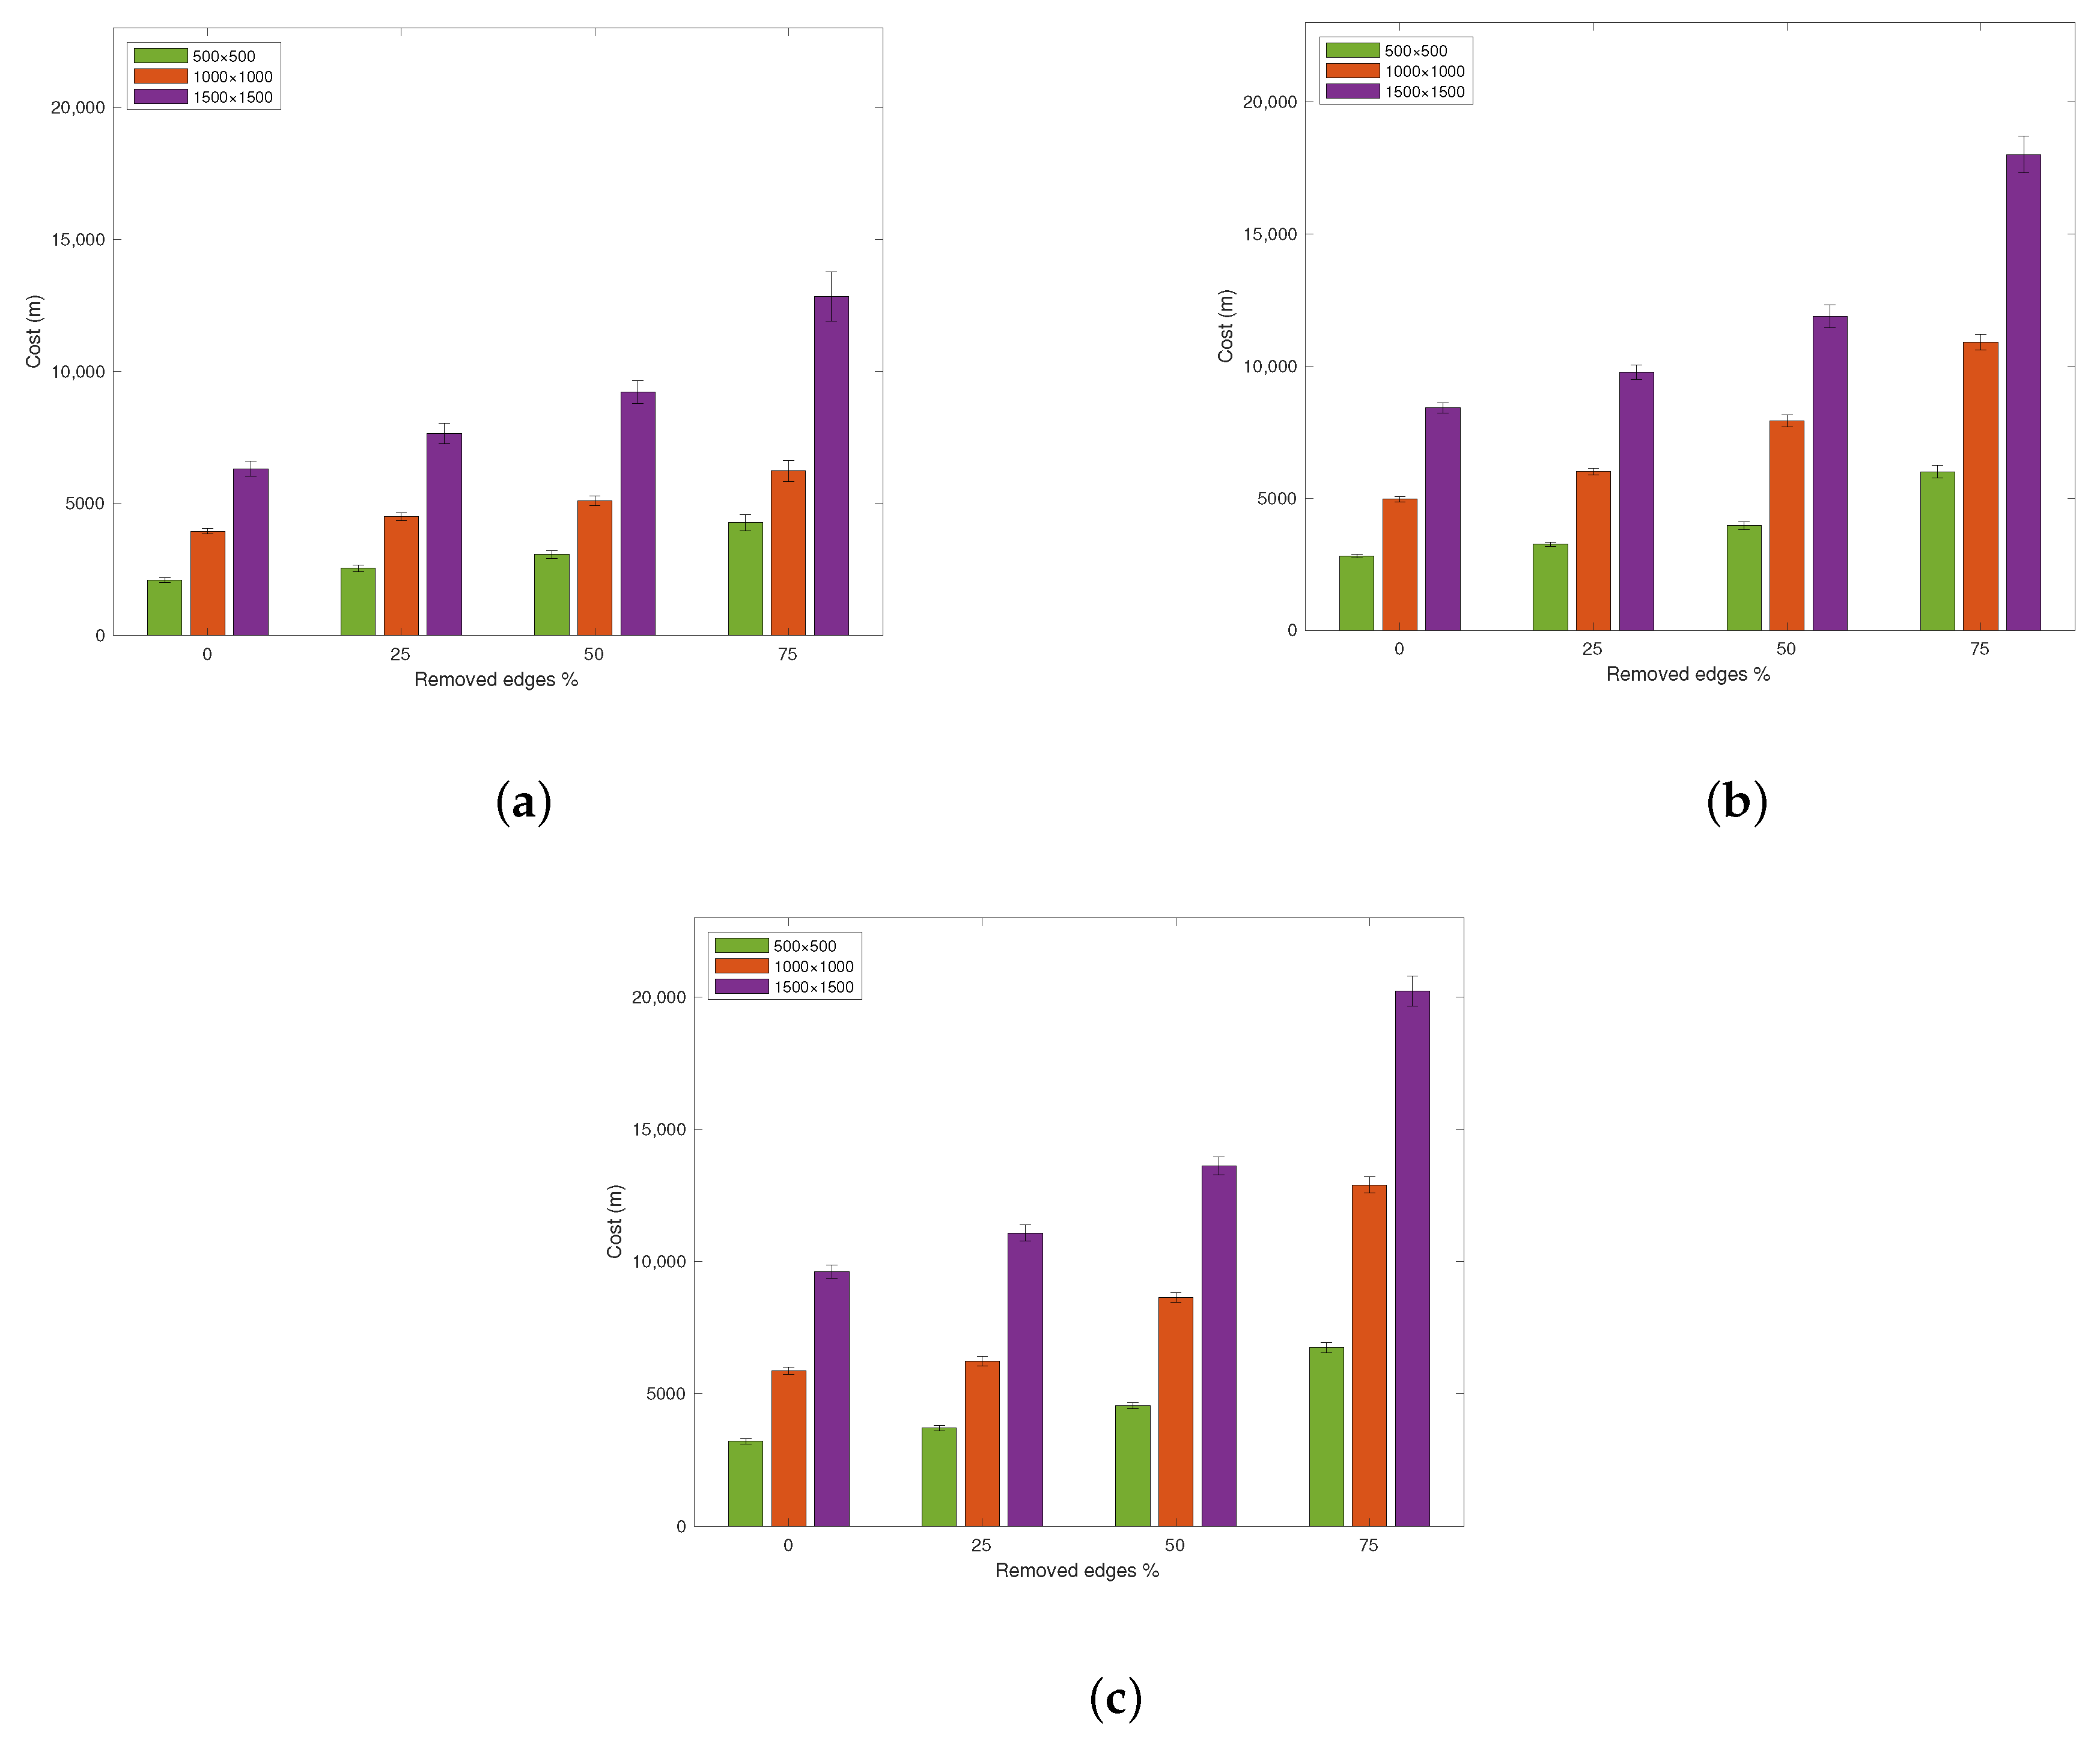
In our first scenario, we took the fire area as m. Then, we assumed that the number of fire clusters was 20. In the other stages, we increased the size of the fire pits and the intensity of the fire. As the fire intensity increased, the safe temperature level increased and is exceeded in most places. This reduced the number of safe routes for the drone to cover the fire clusters. Then, we evaluated detailed cost results, as shown in Figure 6. In the first measurement, 25 percent of usable paths became unusable; in the second measurement, 50 percent became unusable; and in the third, this value was 75 percent. To compare the results we obtained, we enlarged the fire area to m and m. As can be seen in Figure 6a, the cost increases in the m area as the number of useless routes increases. We also observe the steps we applied by increasing the fire clusters. We took fire clusters 40 and 50 for area sizes m, m, and m, as shown in Figure 6b,c, respectively.
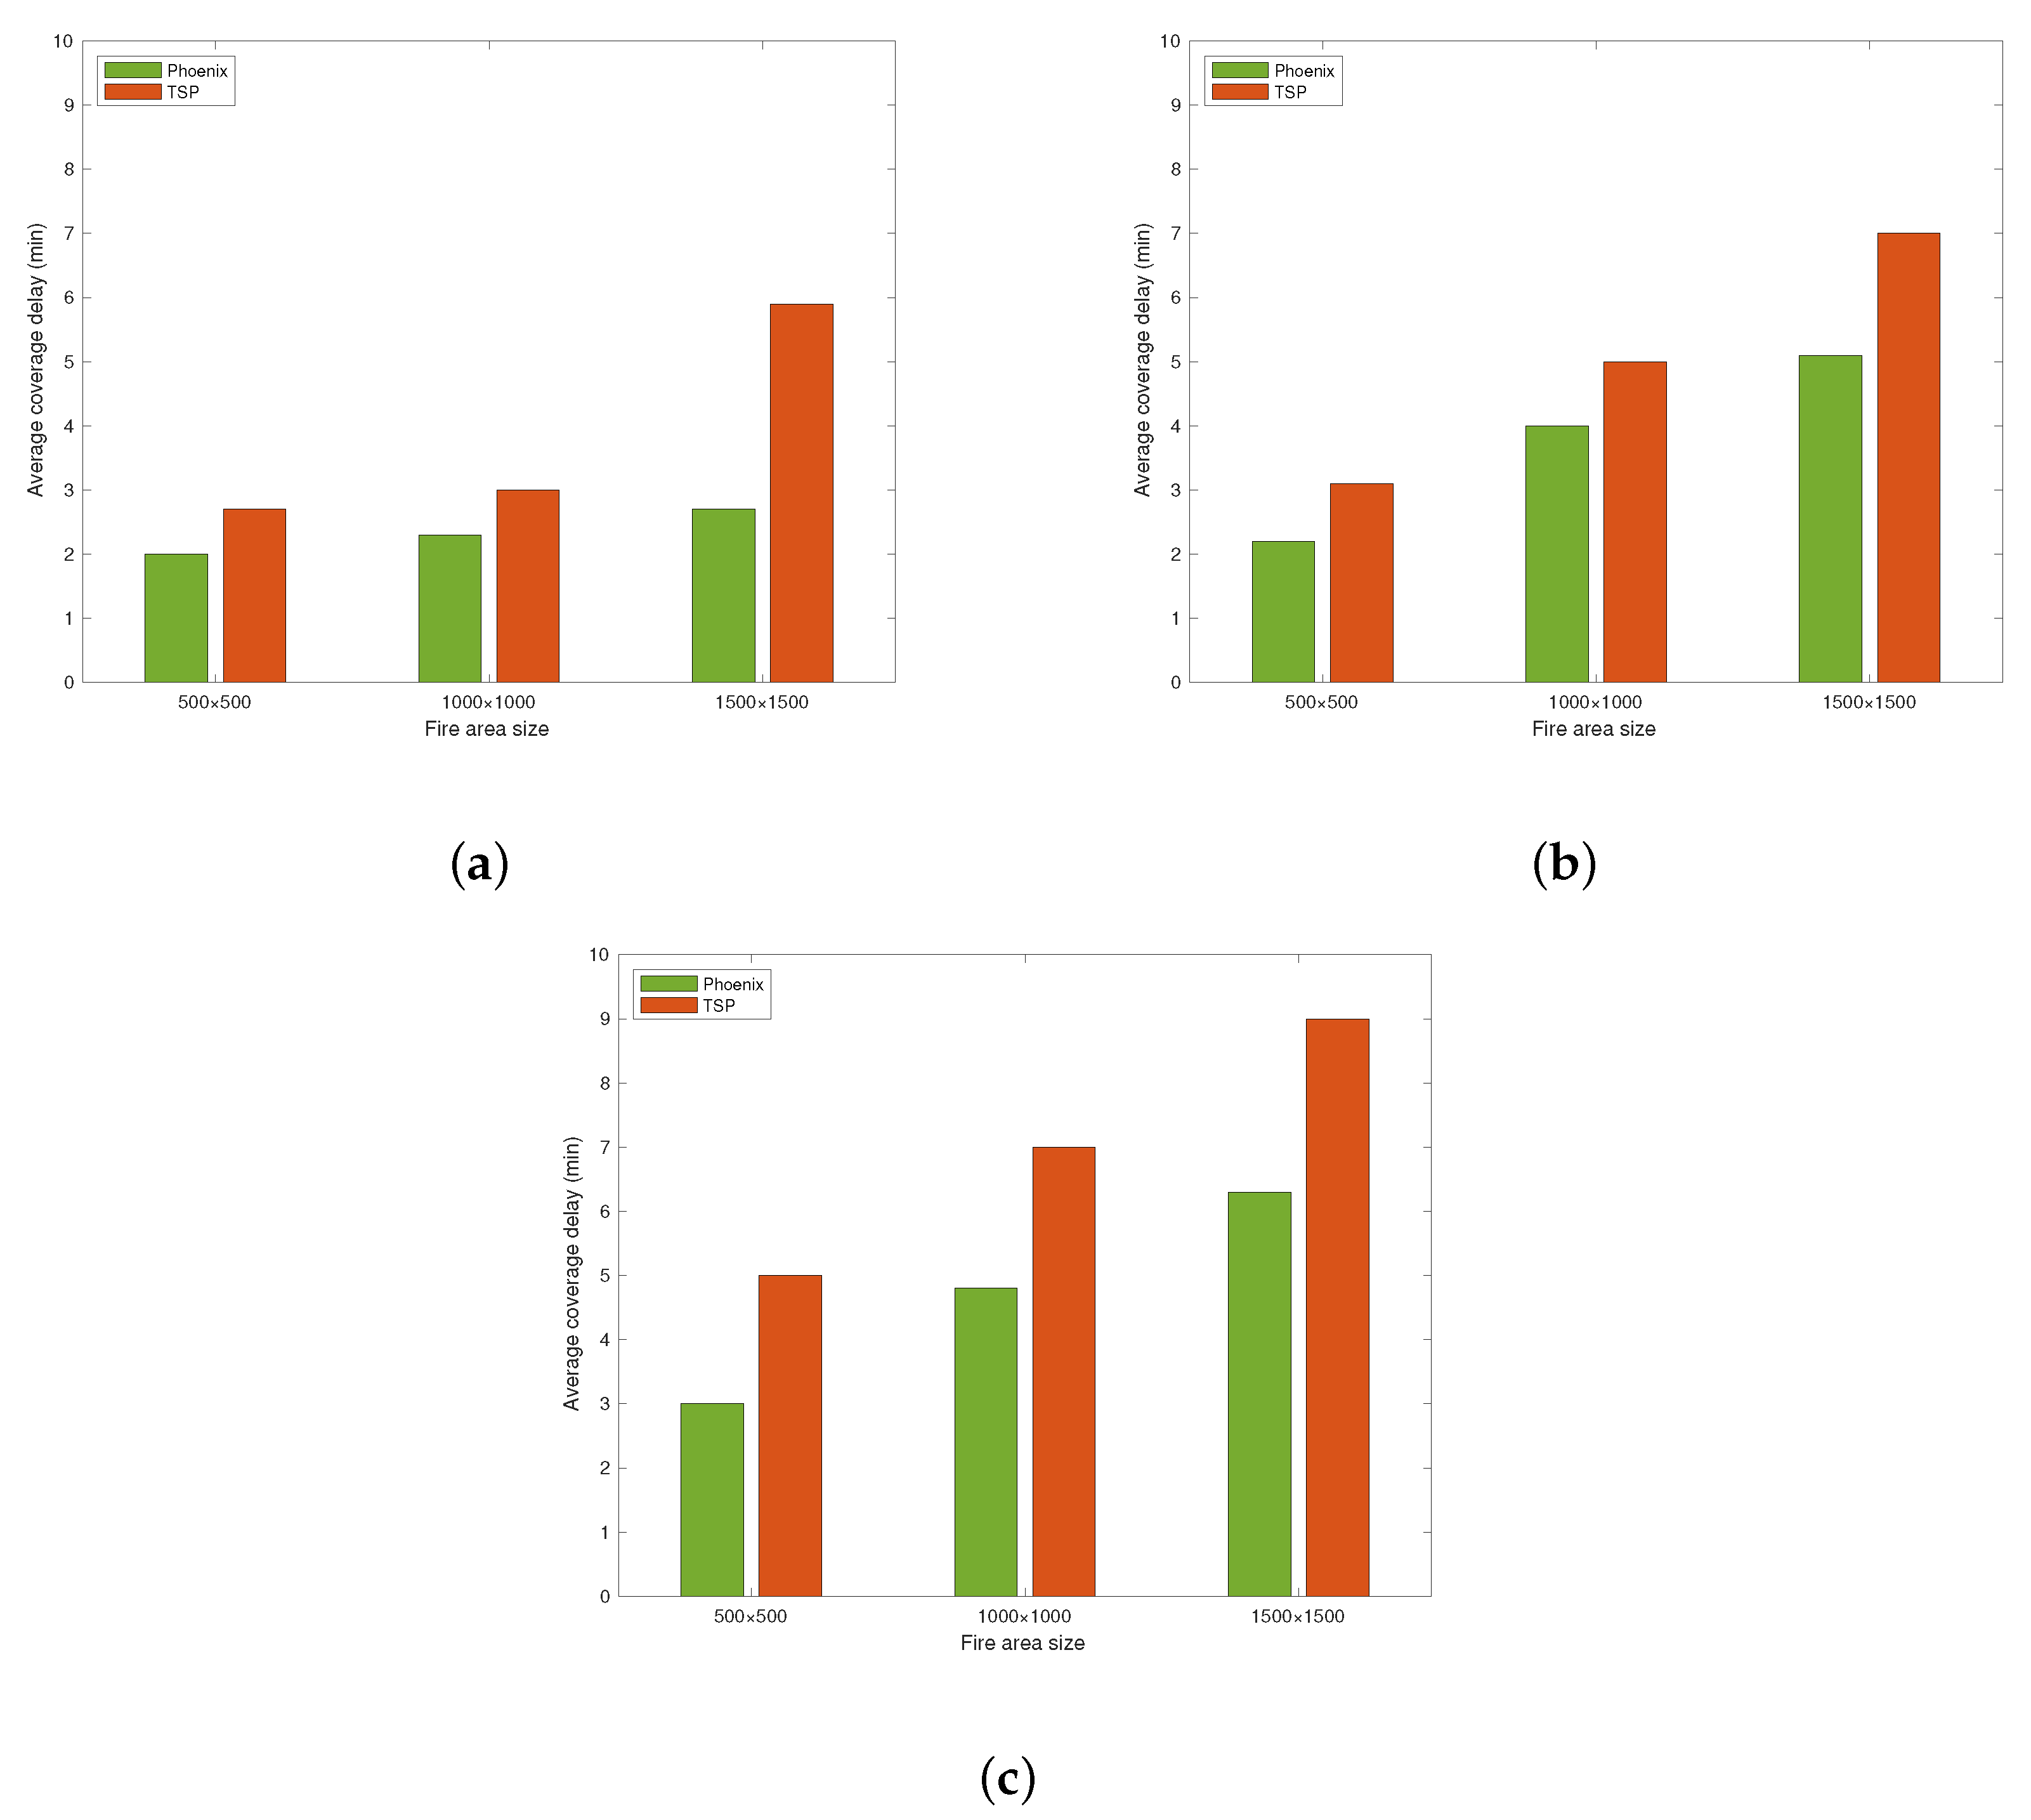
In the next step, we compared our proposed Phoenix and modified TSP algorithms with the traditional TSP algorithm. As shown in Figure 7, we examined the results of these methods in terms of coverage delay on three different fire area sizes. In Figure 7a, we compare the average coverage delay results of 20 fire clusters. The results contain the total average delay result of our base path model, 25% reduced safe paths, 50% reduced safe paths, and 75% reduced safe paths according to our proposed algorithm. In Figure 7b,c, the 40 and 50 fire clusters are compared according to the above criteria. Although our proposed Phoenix method increases the cost by eliminating paths, it shows better results than TSP. The reason for this is that the Phoenix method prioritizes the areas to be monitored according to the fire clusters.
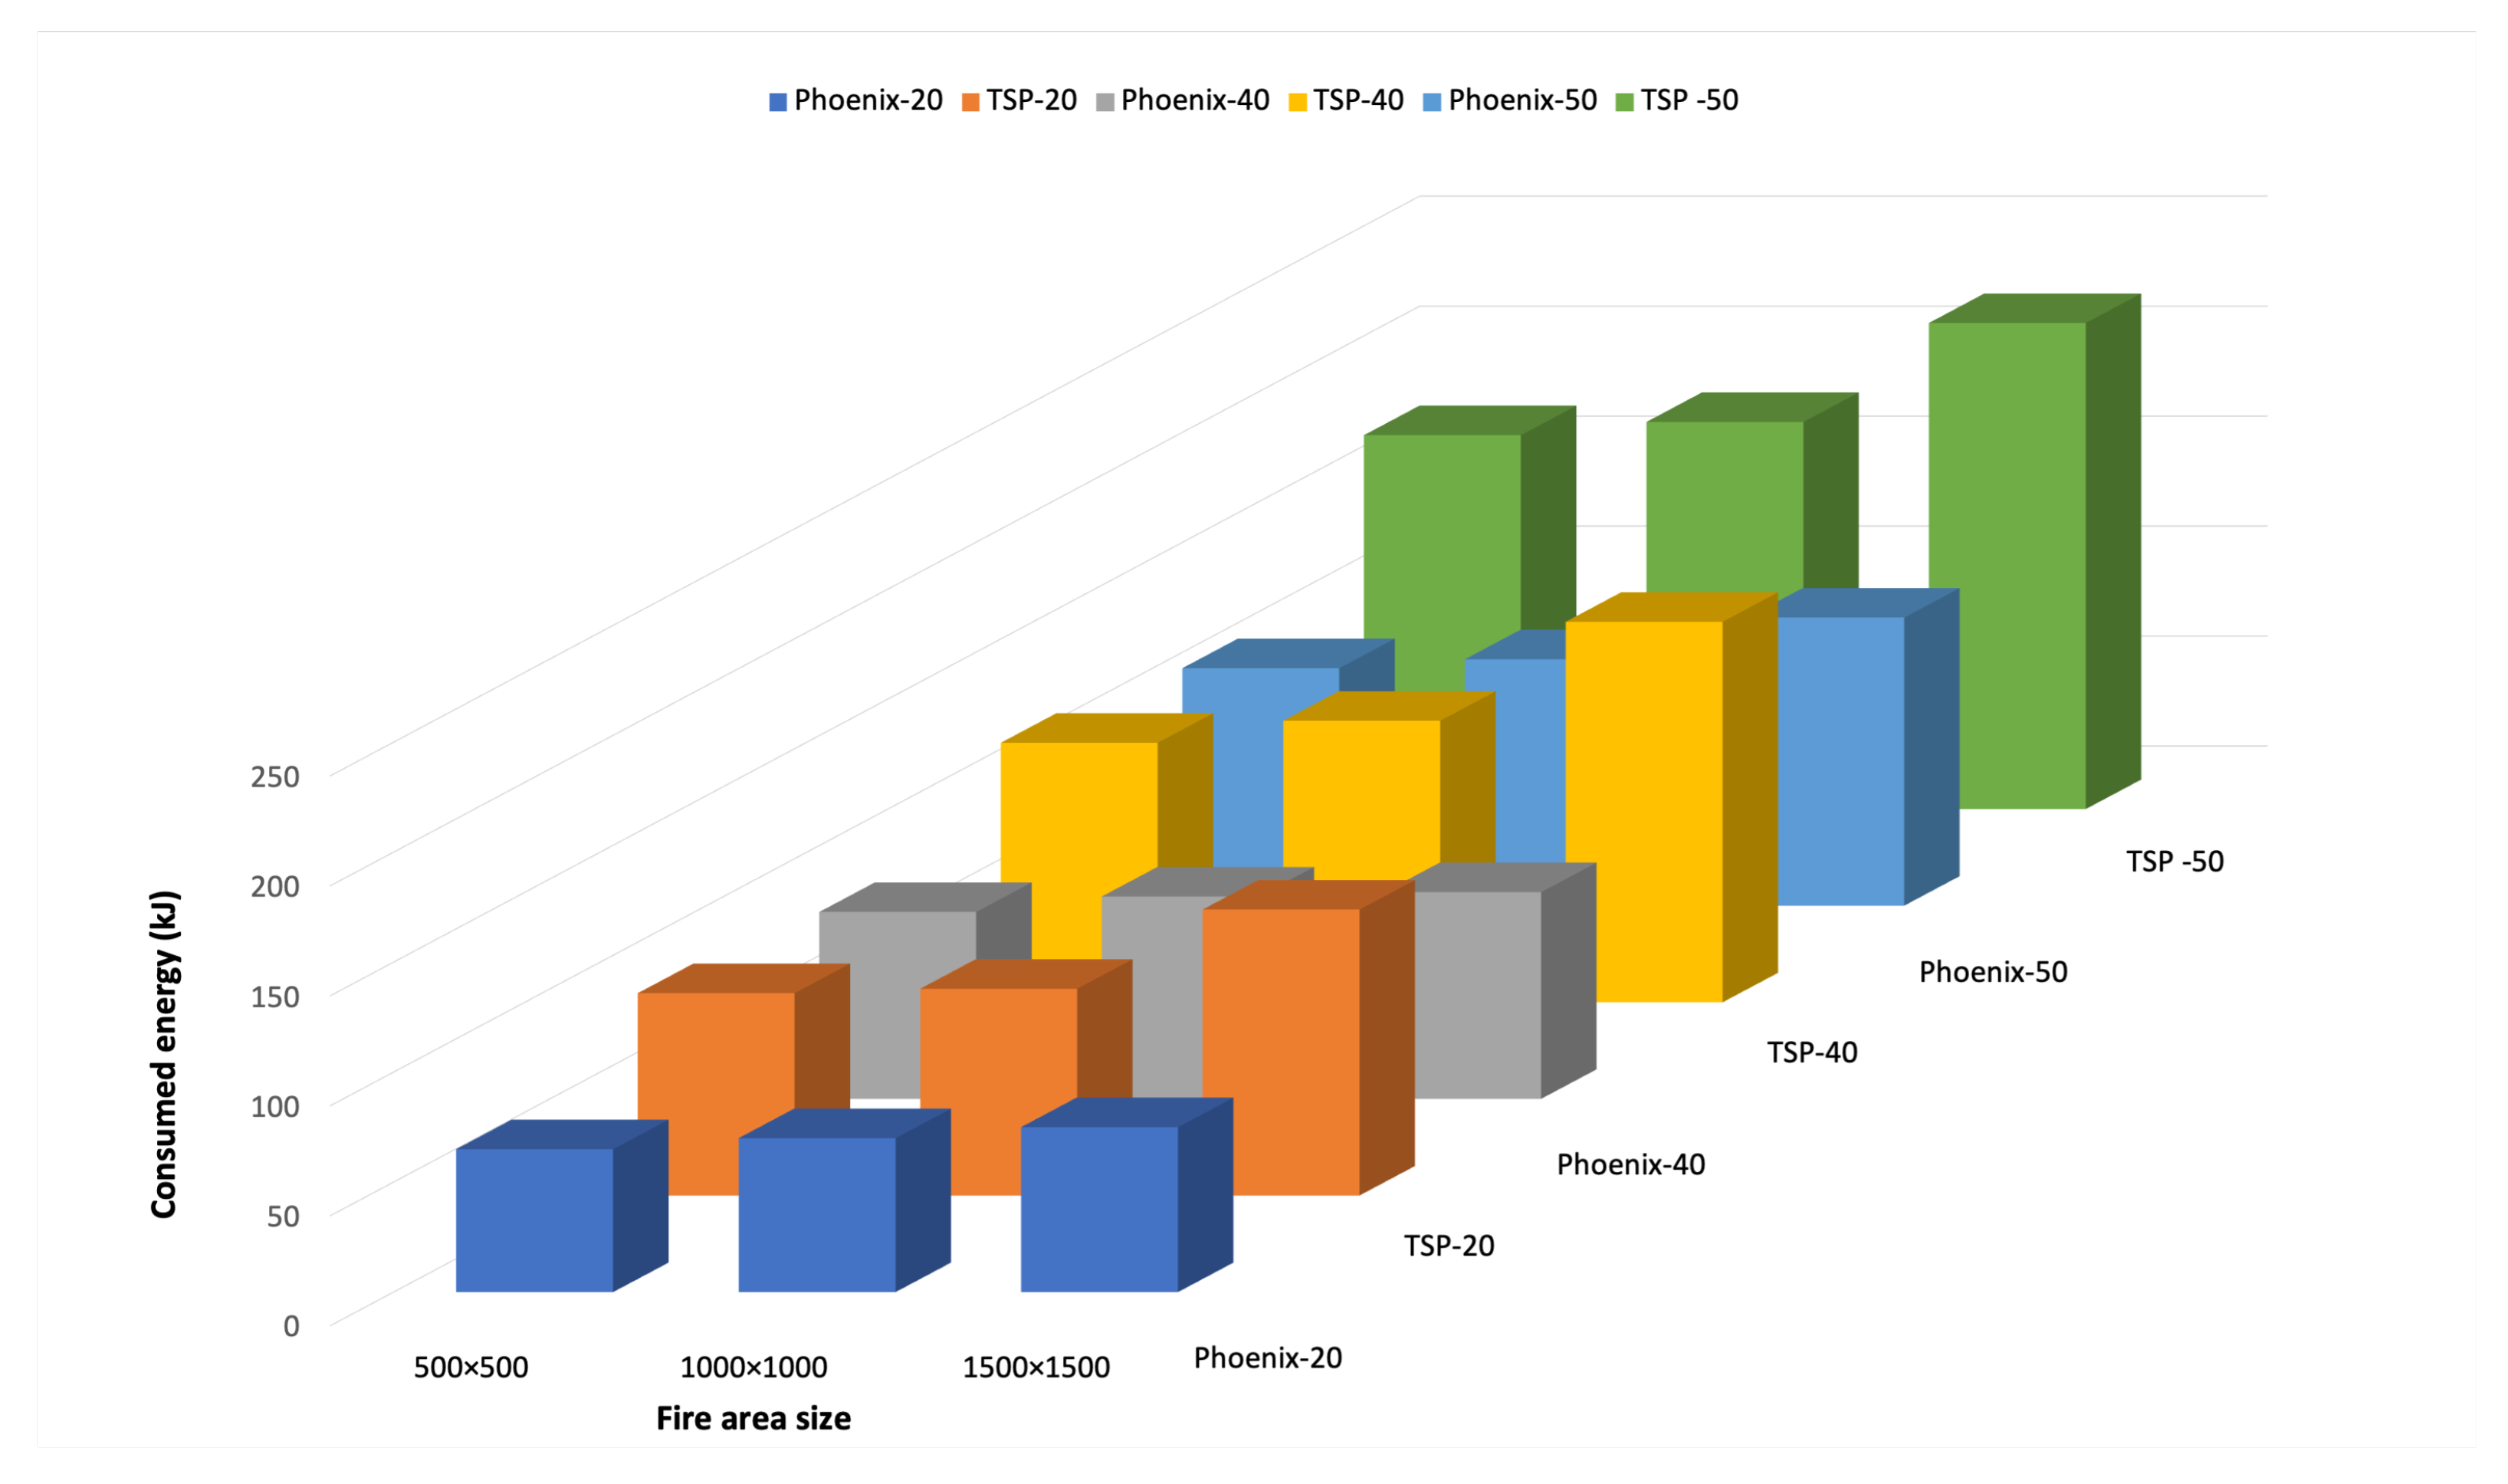
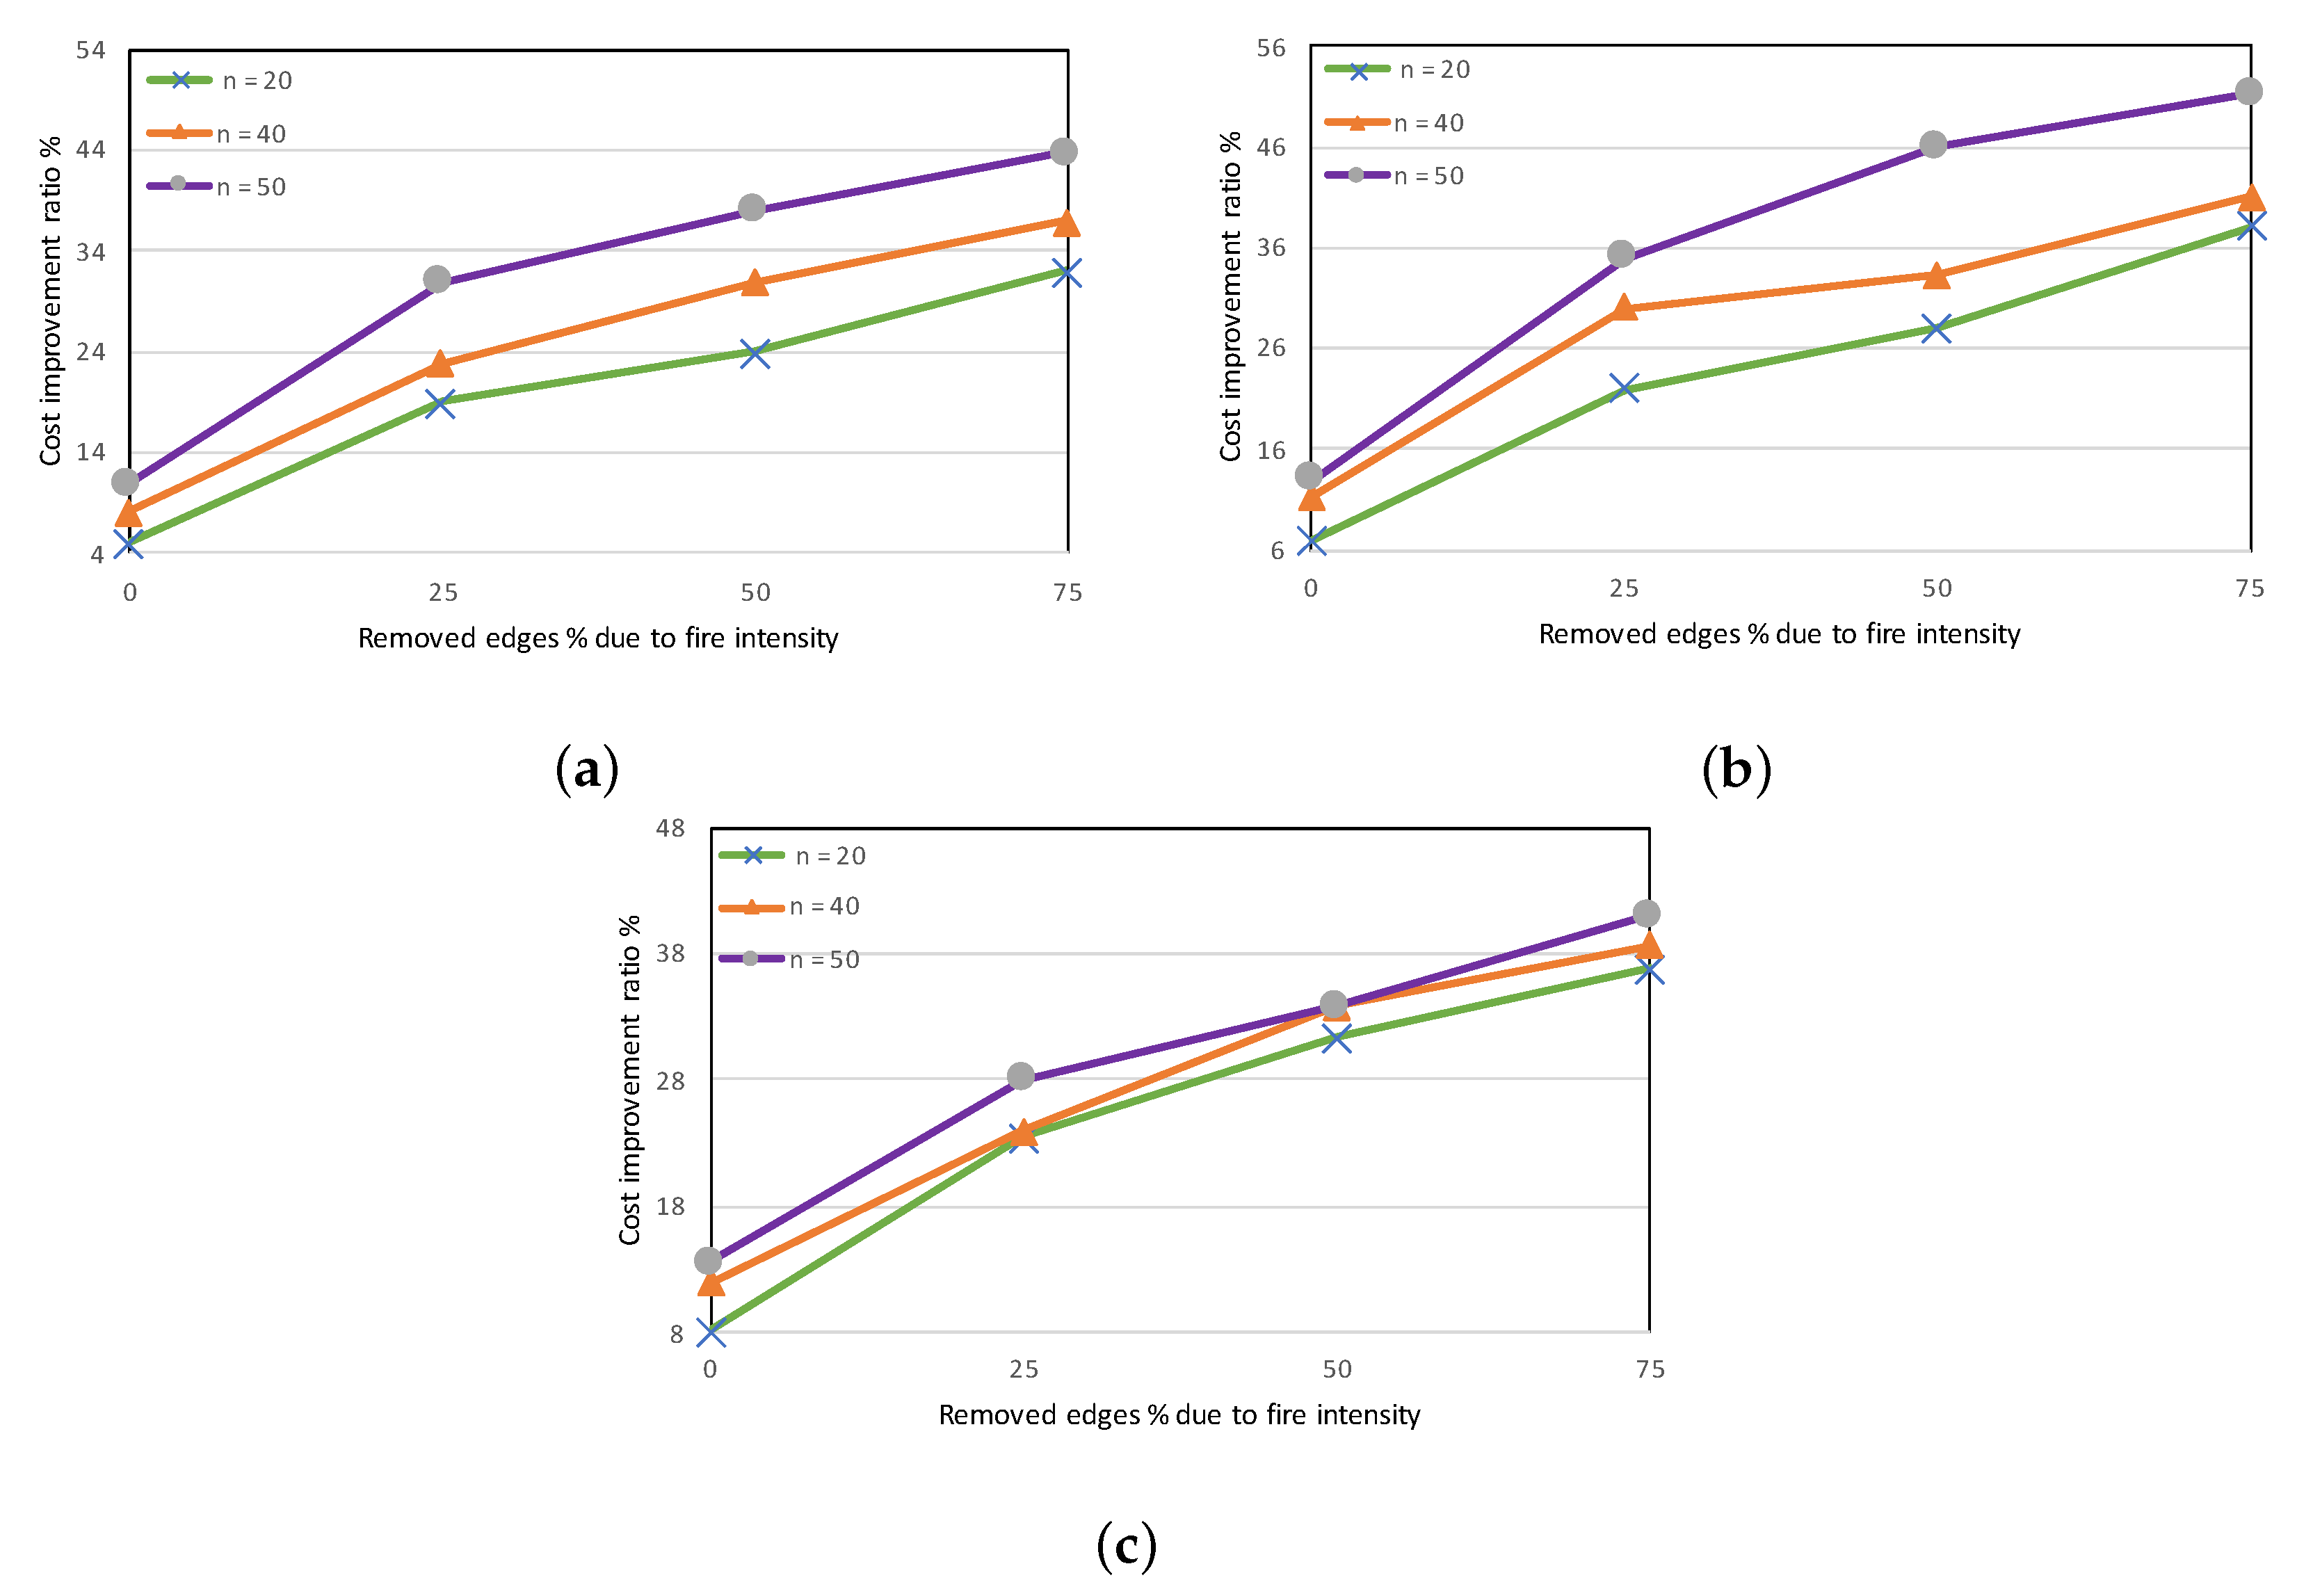
Next, we evaluated our energy optimization and coverage results. For the consumed energy results, we again compared the average results of our baseline model and the models with reduced paths according to the Phoenix method with the traditional TSP. As can be seen in Figure 8, our model does not show a radical increase compared to the Phoenix results both when we increase the fire area and when we increase the number of fire clusters. However, when our proposed algorithm is compared to TSP, we observe a remarkable increase in energy consumption both for increasing the fire area and for increasing the number of fire clusters. Secondly, we discuss our coverage improvement ratio compared to the traditional TSP algorithm in Figure 9. The coverage improvement ratio is calculated by removing re-monitored areas and carrying out a comparison with traditional TSP. Figure 9a shows the results of the base model and the model with reduced safe paths compared to the results of the Phoenix for a 500 × 500 size fire field for fire cluster numbers of 20, 40, and 50, respectively. In Figure 9b,c, we also consider the results for 1000 × 1000 and 1500 × 1500 fire areas. According to the results, the rate of increase in the coverage rate is higher when the number of fire clusters is high and the fire area is small and moderate. The speed of the coverage improvement ratio decreases as the fire area and the number of fire clusters increase.
4. Conclusions
We introduce a new algorithm called Phoenix. We use the results obtained using this algorithm in our modified TSP algorithm. This paper considers the challenges of effectively monitoring wildfires using a single UAV. We optimize our method accordingly to increase energy efficiency and coverage. We compare our simulation results with the traditional TSP algorithm. We obtain improvements in coverage delay results. According to the consumed energy results, we reduced the energy consumed by 33%, 35%, and 38% for 20, 40, and 50 fire clusters on average, respectively. Additionally, we obtain a 51% improvement in coverage with our proposed solution. In future work, we will focus on the network architecture and increase the number of UAVs in the topology. We will also focus on the communication issues in the alert system in the network. Lastly, we will develop a test bed in a joint project with an industrial aviation company in the near future and schedule both quadrocopter and fixed-winged UAV flights over the northern forests of Istanbul, where we can simulate our fire model in conjunction with actual flights to further validate our framework.
Author Contributions
Conceptualization, S.Ç.; methodology, S.Ç.; software, S.Ç.; validation, S.Ç. and G.S.; formal analysis, S.Ç. and G.S.; investigation, S.Ç.; resources, S.Ç. and G.S.; data curation, S.Ç.; writing—original draft preparation, S.Ç.; writing—review and editing, S.Ç. and G.S.; visualization, S.Ç.; supervision, G.S.; project administration, G.S.; funding acquisition, G.S. All authors have read and agreed to the published version of the manuscript.
Funding
During this work, Sultan Çoğay was supported by the Turkcell-Istanbul Technical University researcher funding program.
Data Availability Statement
Not applicable.
Conflicts of Interest
The authors declare no conflict of interest.
References
- Australian Fires Fueled Unprecedented Blooms. Available online: https://earthobservatory.nasa.gov/images/149039/australian-fires-fueled-unprecedented-blooms (accessed on 15 February 2022).
- Wildfires Produced Record-Breaking Emissions this Year from U.S. to Turkey. Available online: https://www.cnbc.com/2021/12/06/wildfires-broke-emissions-records-this-year-in-us-turkey.html (accessed on 28 March 2022).
- Commission, E.; Centre, J.R.; San-Miguel-Ayanz, J.; Durrant, T.; Boca, R.; Maianti, P.; Libertà, G.; Artés Vivancos, T.; Oom, D.; Branco, A.; et al. Forest Fires in Europe, Middle East and North Africa 2021; Publications Office of the European Union: Luxembourg, 2022. [Google Scholar] [CrossRef]
- Trotta, A.; Felice, M.D.; Perilli, L.; Scarselli, E.F.; Cinotti, T.S. BEE-DRONES: Ultra low-power monitoring systems based on unmanned aerial vehicles and wake-up radio ground sensors. Comput. Netw. 2020, 180, 107425. [Google Scholar] [CrossRef]
- Wang, C.N.; Yang, F.C.; Vo, N.T.; Nguyen, V.T.T. Wireless Communications for Data Security: Efficiency Assessment of Cybersecurity Industry—A Promising Application for UAVs. Drones 2022, 6, 363. [Google Scholar] [CrossRef]
- Bozkaya, E.; Özçevik, Y.; Akkoç, M.; Erol, M.R.; Canberk, B. Energy-aware mobility for aerial networks: A reinforcement learning approach. Int. J. Netw. Manag. 2022, 32, e2185. [Google Scholar] [CrossRef]
- Cheng, H.; Bertizzolo, L.; D’oro, S.; Buczek, J.; Melodia, T.; Bentley, E.S. Learning to Fly: A Distributed Deep Reinforcement Learning Framework for Software-Defined UAV Network Control. IEEE Open J. Commun. Soc. 2021, 2, 1486–1504. [Google Scholar] [CrossRef]
- Albanese, A.; Sciancalepore, V.; Costa-Pérez, X. SARDO: An Automated Search-and-Rescue Drone-Based Solution for Victims Localization. IEEE Trans. Mob. Comput. 2022, 21, 3312–3325. [Google Scholar] [CrossRef]
- Afghah, F.; Razi, A.; Chakareski, J.; Ashdown, J. Wildfire Monitoring in Remote Areas using Autonomous Unmanned Aerial Vehicles. In Proceedings of the IEEE INFOCOM 2019—IEEE Conference on Computer Communications Workshops (INFOCOM WKSHPS), Paris, France, 29 April–2 May 2019; pp. 835–840. [Google Scholar] [CrossRef] [Green Version]
- Rashid, M.T.; Zhang, Y.; Zhang, D.; Wang, D. CompDrone: Towards Integrated Computational Model and Social Drone Based Wildfire Monitoring. In Proceedings of the 2020 16th International Conference on Distributed Computing in Sensor Systems (DCOSS), Marina del Rey, CA, USA, 25–27 May 2020; pp. 43–50. [Google Scholar] [CrossRef]
- Giuseppi, A.; Germanà, R.; Fiorini, F.; Delli Priscoli, F.; Pietrabissa, A. UAV Patrolling for Wildfire Monitoring by a Dynamic Voronoi Tessellation on Satellite Data. Drones 2021, 5, 130. [Google Scholar] [CrossRef]
- Saffre, F.; Hildmann, H.; Karvonen, H.; Lind, T. Monitoring and Cordoning Wildfires with an Autonomous Swarm of Unmanned Aerial Vehicles. Drones 2022, 6, 301. [Google Scholar] [CrossRef]
- Gharakhanlou, N.M.; Hooshangi, N. Dynamic simulation of fire propagation in forests and rangelands using a GIS-based cellular automata model. Int. J. Wildland Fire 2021, 30, 652–663. [Google Scholar] [CrossRef]
- Bailon-Ruiz, R.; Lacroix, S.; Bit-Monnot, A. Planning to Monitor Wildfires with a Fleet of UAVs. In Proceedings of the 2018 IEEE/RSJ International Conference on Intelligent Robots and Systems (IROS), Madrid, Spain, 1–5 October 2018; pp. 4729–4734. [Google Scholar] [CrossRef] [Green Version]
- Lin, Z.; Liu, H.H. Topology-based distributed optimization for multi-UAV cooperative wildfire monitoring. Optim. Control Appl. Methods 2018, 39, 1530–1548. [Google Scholar] [CrossRef]
- Lin, Z.; Liu, H.H.T.; Wotton, M. Kalman Filter-Based Large-Scale Wildfire Monitoring With a System of UAVs. IEEE Trans. Ind. Electron. 2019, 66, 606–615. [Google Scholar] [CrossRef]
- Sethuraman, S.C.; Tadkapally, G.R.; Mohanty, S.P.; Subramanian, A. iDrone: IoT-Enabled Unmanned Aerial Vehicles for Detecting Wildfires Using Convolutional Neural Networks. SN Comput. Sci. 2022, 3, 1–13. [Google Scholar] [CrossRef]
- Zhao, Y.; Ma, J.; Li, X.; Zhang, J. Saliency detection and deep learning-based wildfire identification in UAV imagery. Sensors 2018, 18, 712. [Google Scholar] [CrossRef] [Green Version]
- Barmpoutis, P.; Stathaki, T.; Dimitropoulos, K.; Grammalidis, N. Early Fire Detection Based on Aerial 360-Degree Sensors, Deep Convolution Neural Networks and Exploitation of Fire Dynamic Textures. Remote Sens. 2020, 12, 3177. [Google Scholar] [CrossRef]
- Govil, K.; Welch, M.L.; Ball, J.T.; Pennypacker, C.R. Preliminary results from a wildfire detection system using deep learning on remote camera images. Remote Sens. 2020, 12, 166. [Google Scholar] [CrossRef] [Green Version]
- Sudhakar, S.; Vijayakumar, V.; Kumar, C.S.; Priya, V.; Ravi, L.; Subramaniyaswamy, V. Unmanned Aerial Vehicle (UAV) based Forest Fire Detection and monitoring for reducing false alarms in forest-fires. Comput. Commun. 2020, 149, 1–16. [Google Scholar] [CrossRef]
- Muhammad, K.; Ahmad, J.; Baik, S.W. Early fire detection using convolutional neural networks during surveillance for effective disaster management. Neurocomputing 2018, 288, 30–42. [Google Scholar] [CrossRef]
- Muhammad, K.; Khan, S.; Elhoseny, M.; Hassan Ahmed, S.; Wook Baik, S. Efficient Fire Detection for Uncertain Surveillance Environment. IEEE Trans. Ind. Inform. 2019, 15, 3113–3122. [Google Scholar] [CrossRef]
- Zhang, G.; Wang, M.; Liu, K. Forest fire susceptibility modeling using a convolutional neural network for Yunnan province of China. Int. J. Disaster Risk Sci. 2019, 10, 386–403. [Google Scholar] [CrossRef] [Green Version]
- Glasa, J.; Halada, L. On elliptical model for forest fire spread modeling and simulation. Math. Comput. Simul. 2008, 78, 76–88. [Google Scholar] [CrossRef]
- Perry, G.L. Current approaches to modelling the spread of wildland fire: A review. Prog. Phys. Geogr. Earth Environ. 1998, 22, 222–245. [Google Scholar] [CrossRef]
- Chuvieco, E.; Aguado, I.; Salas, J.; García, M.; Yebra, M.; Oliva, P. Satellite remote sensing contributions to wildland fire science and management. Curr. For. Rep. 2020, 6, 81–96. [Google Scholar] [CrossRef]
- Yebra, M.; Quan, X.; Riaño, D.; Larraondo, P.R.; van Dijk, A.I.; Cary, G.J. A fuel moisture content and flammability monitoring methodology for continental Australia based on optical remote sensing. Remote Sens. Environ. 2018, 212, 260–272. [Google Scholar] [CrossRef]
- Beigi, P.; Rajabi, M.S.; Aghakhani, S. An Overview of Drone Energy Consumption Factors and Models. arXiv 2022, arXiv:2206.10775. [Google Scholar] [CrossRef]
- Trotta, A.; Felice, M.D.; Montori, F.; Chowdhury, K.R.; Bononi, L. Joint Coverage, Connectivity, and Charging Strategies for Distributed UAV Networks. IEEE Trans. Robot. 2018, 34, 883–900. [Google Scholar] [CrossRef]
Figure 2.
System Architecture.

Figure 6.
Cost results for (a) 20 fire points, (b) 40 fire points, and (c) 50 fire points.

Figure 7.
Average coverage delay for (a) 20 fire points, (b) 40 fire points, and (c) 50 fire points.
Figure 7.
Average coverage delay for (a) 20 fire points, (b) 40 fire points, and (c) 50 fire points.

Figure 8.
Energy consumption comparison results for Phoenix and TSP.

Figure 9.
Coverage improvement ratio for (a) 500 × 500 area size, (b) 1000 × 1000 area size, and (c) 1500 × 1500 area size.
Figure 9.
Coverage improvement ratio for (a) 500 × 500 area size, (b) 1000 × 1000 area size, and (c) 1500 × 1500 area size.

Disclaimer/Publisher’s Note: The statements, opinions and data contained in all publications are solely those of the individual author(s) and contributor(s) and not of MDPI and/or the editor(s). MDPI and/or the editor(s) disclaim responsibility for any injury to people or property resulting from any ideas, methods, instructions or products referred to in the content. |
© 2022 by the authors. Licensee MDPI, Basel, Switzerland. This article is an open access article distributed under the terms and conditions of the Creative Commons Attribution (CC BY) license (https://creativecommons.org/licenses/by/4.0/).
Share and Cite
MDPI and ACS Style
Çoğay, S.; Seçinti, G. Phoenix: Aerial Monitoring for Fighting Wildfires. Drones 2023, 7, 19. https://doi.org/10.3390/drones7010019
AMA Style
Çoğay S, Seçinti G. Phoenix: Aerial Monitoring for Fighting Wildfires. Drones. 2023; 7(1):19. https://doi.org/10.3390/drones7010019
Chicago/Turabian StyleÇoğay, Sultan, and Gökhan Seçinti. 2023. "Phoenix: Aerial Monitoring for Fighting Wildfires" Drones 7, no. 1: 19. https://doi.org/10.3390/drones7010019