Article

Molecular Imaging of Tumors Using a Quantitative T1 Mapping Technique via Magnetic Resonance Imaging

1
Department of Neurosciences, School of Medicine, Case Western Reserve University, Cleveland, OH 44106, USA
2
Department of Molecular Biology and Microbiology, School of Medicine, Case Western Reserve University, Cleveland, OH 44106, USA
3
Department of Biomedical Engineering, Case Western Reserve University, Cleveland, OH 44106, USA
4
Department of Radiology, School of Medicine, Case Western Reserve University, Cleveland, OH 44106, USA
5
Department of Urology, Case Western Reserve University, Cleveland, OH 44106, USA
6
Department of Macromolecular Science and Engineering, Case Western Reserve University, Cleveland, OH 44106, USA
7
The National Foundation for Cancer Research (NFCR) Center for Molecular Imaging, Case Western Reserve University, Cleveland, OH 44106, USA
8
Department of Pediatrics, Case Western Reserve University, Cleveland, OH 44106, USA
*
Author to whom correspondence should be addressed.
These authors contributed equally to this work.
Diagnostics 2015, 5(3), 318-332; https://doi.org/10.3390/diagnostics5030318
Submission received: 14 May 2015 / Revised: 3 July 2015 / Accepted: 10 July 2015 / Published: 17 July 2015
(This article belongs to the Special Issue NMR in Medicine)

Abstract

:
Magnetic resonance imaging (MRI) of glioblastoma multiforme (GBM) with molecular imaging agents would allow for the specific localization of brain tumors. Prior studies using T1-weighted MR imaging demonstrated that the SBK2-Tris-(Gd-DOTA)3 molecular imaging agent labeled heterotopic xenograft models of brain tumors more intensely than non-specific contrast agents using conventional T1-weighted imaging techniques. In this study, we used a dynamic quantitative T1 mapping strategy to more objectively compare intra-tumoral retention of the SBK2-Tris-(Gd-DOTA)3 agent over time in comparison to non-targeted control agents. Our results demonstrate that the targeted SBK2-Tris-(Gd-DOTA)3 agent, a scrambled-Tris-(Gd-DOTA)3 control agent, and the non-specific clinical contrast agent Optimark™ all enhanced flank tumors of human glioma cells with similar maximal changes on T1 mapping. However, the retention of the agents differs. The non-specific agents show significant recovery within 20 min by an increase in T1 while the specific agent SBK2-Tris-(Gd-DOTA)3 is retained in the tumors and shows little recovery over 60 min. The retention effect is demonstrated by percent change in T1 values and slope calculations as well as by calculations of gadolinium concentration in tumor compared to muscle. Quantitative T1 mapping demonstrates the superior binding and retention in tumors of the SBK2-Tris-(Gd-DOTA)3 agent over time compared to the non-specific contrast agent currently in clinical use.

Graphical Abstract

1. Introduction

While various imaging modalities are used in clinical and surgical settings, magnetic resonance imaging (MRI) is the preferred method of brain tumor imaging prior to surgery. The benefits of MRI include excellent delineation of anatomic detail and multiple available soft tissue contrast mechanisms. To improve MRI assessments of tumors, targeted molecular contrast agents are in development to provide biological specificity in identifying and distinguishing the irregular and indistinct tumor margins of invasive cancers [1,2]. A typical goal for molecular contrast agents is to bind preferentially to molecules specific to the tumor in comparison to the surrounding normal tissue. Therefore, molecules that are enriched in the tumor microenvironment are ideal targets.
Glioblastoma multiforme (GBM) is a highly aggressive tumor that arises in the brain. Patients with GBM survive, on average, one year post-diagnosis [3] despite undergoing surgery, radiation, and chemotherapy. The devastating nature of GBM is due to the highly dispersive and invasive tumor cells that infiltrate the brain and migrate away from the main tumor mass. These distant, migratory cells, often undetectable by conventional MRI methods, make complete surgical resection difficult [4]. The receptor protein tyrosine phosphatase PTPµ is a transmembrane protein that is proteolyzed in tumor tissue to yield an extracellular fragment and a membrane-freed intracellular fragment [5,6]. The proteolyzed extracellular fragment of PTPµ accumulates in aggressive GBM tumors and provides a detectable moiety for molecular imaging [7].
We have previously developed a molecular imaging agent that specifically binds to the PTPµ extracellular fragment, called SBK2 that is linked to a fluorophore, and labels both the main GBM tumor mass [5] and greater than 99% of the dispersing cells up to 3.5 mm away from the main tumor [7]. When conjugated to a gadolinium (Gd) chelate as an MRI contrast agent, the SBK2-Tris-(Gd-DOTA)3 agent showed greater contrast enhancement than the non-specific agent, ProHance, when intravenously injected into mice bearing heterotopic flank tumors of human glioma cells using conventional T1-weighted MR imaging [8]. The SBK2-Tris-(Gd-DOTA)3 agent labeled the tumors within 5 min with a high level of contrast persisting for 2 h post injection, significantly higher than ProHance® alone [8]. One limitation of these prior studies is that conventional T1-weighted imaging techniques rely on relative signal intensity changes over time and are inherently qualitative at each time point. The T1-weighted values of a given region of interest are relative to the values from another area. For example, a comparison of tumor to adjacent muscle at that particular time point is represented as a contrast to noise value for a particular time point. Therefore despite these promising initial results, a rigorously quantitative approach was needed to determine the in vivo binding and retention properties of the SBK2-Tris-(Gd-DOTA)3 agent in comparison to controls over time.
In contrast to T1-weighted imaging, T1 relaxation time mapping is a quantitative approach that allows measurement of T1 values. When acquired dynamically, these T1 relaxation time values allow each time point to be objectively, quantitatively, and longitudinally compared within a single agent as well as among different agents. Furthermore, T1 mapping limits the impact of scanner dependent variation. Quantitative T1 measurements can then be used to calculate contrast agent concentration within each imaging voxel (volume element). This technique is especially important for molecular imaging where the goal is to relate regions of accumulating and/or retained contrast agent to the location of specific disease markers. We hypothesized that T1 mapping could be performed to quantitatively determine contrast agent concentration in tumors as well as evaluate successful specific targeting by contrast agents. Therefore, we conducted a series of experiments comparing the SBK2-Tris-(Gd-DOTA)3 agent to the scrambled-Tris-(Gd-DOTA)3 control as well as a non-specific clinical contrast agent, Optimark™, in mice bearing heterotopic flank tumors of human LN-229 glioma cells. In this study, we dynamically evaluated the extent and duration of tumor enhancement following contrast administration with T1 mapping. We observed that all of the contrast agents achieve similar levels of initial T1 reductions indicating similar delivery to the tumor region between 10 to 15 min after injection. Notably, a large and statistically significant difference was observed in the retention of the specific SBK2-Tris-(Gd-DOTA)3 agent versus the non-specific agents at later time points. We conclude that when evaluating and comparing MR molecular imaging agents, evaluation of retention time as determined with T1 mapping is a robust indicator of agent specificity.

2. Methods and Materials

All reagents were used without further purification unless otherwise stated. Optimark™ was purchased from Mallinckrodt Pharmaceuticals (St. Louis, MO, USA), and saline was obtained from Hospira, Inc. (Lake Forest, IL, USA). The Fmoc-protected amino acids, 2-chlorotrityl chloride resin, and benzotriazol-1-yl-oxy-tris-(pyrrolidino) phosphonium hexafluorophosphate (PyBOP) used for peptide synthesis were purchased from Chem-Impex International, Inc. (Wood Dale, IL, USA), along with anhydrous N,N-diisopropylethyl amine (DIPEA), trifluoroacetic acid (TFA), 1,2-diethanethiol, triisopropylsilane and piperidine from Sigma-Aldrich (St. Louis, MO, USA). N,N-dimethylformamide (DMF), and dichloromethane were purchased from Fisher Scientific (Pittsburgh, PA, USA). Anhydrous 1-hydroxybenzotriazole (HOBt) was obtained from Apex Bio Technology (Houston, TX, USA). The detailed syntheses of maleimido-tris-propargyl [9] and azido-(Gd-DOTA) [10] have been described previously. Gadolinium (III) acetate tetrahydrate was from Strem Chemicals (Newburyport, MA, USA).

2.1. Synthesis and Characterization of SBK2-Tris-(Gd-DOTA)3 and Scrambled-Tris-(Gd-DOTA)3 Agents

The syntheses and characterization of SBK2-Tris-(Gd-DOTA)3 and scrambled-Tris-(Gd-DOTA)3 agents have been described previously [8]. Briefly, the peptides were synthesized using conventional solid-phase synthetic methods and FMOC-protected amino acids. Peptide purity was assessed using LC-MS/MS on a Thermo Finnigan LTQ Linear ion trap mass spectrometer with a Phenomenex Jupiter C18 reversed-phase capillary chromatography column. Peptides were conjugated to maleimido-tris-propargyl by reacting the N-terminal cysteine with the maleimide group. A copper-catalyzed azide-alkyne cycloaddition reaction was then used to couple azido-(Gd-DOTA) to the free alkyne groups of the tris-propargyl peptides. Matrix-assisted laser desorption/ionization time-of-flight (MALDI-TOF; Autoflex Speed, Bruker Corp., Billerica, MA, USA) was used to monitor the conjugation reaction of azido-(Gd-DOTA) to the peptide-tris-propargyl moieties. Gadolinium (Gd) content was measured using inductively coupled plasma optical emission spectroscopy (ICP-OES) (Agilent 730 Axial ICP-OES; Agilent Technologies, Wilmington, DE, USA). T1 relaxation constants for the agents were measured on the Bruker Biospec 9.4T MRI scanner (Bruker Corp., Billerica, MA, USA) at 37 °C.

2.2. Cell Culture and Flank Tumor Implants

The human LN-229 glioma cell line was purchased from American Type Culture Collection (Manassas, VA, USA) and cultured in DMEM medium supplemented with 5% fetal bovine serum. Cells were infected with lentivirus encoding green fluorescent protein (GFP) and stable cultures were established. The cells were diluted in a 1:1 mixture of PBS and BD Matrigel™ Matrix (BD Biosciences, Franklin Lakes, NJ, USA), and injected into the right flank of both male and female nude athymic mice (NCr-nu/+, NCr-nu/nu, 20–25 g each) as previously described [5]. Each flank was implanted with 2 × 10⁶ cells. To correlate tumor position with GFP fluorescence, mice were imaged using the Perkin-Elmer Maestro™ FLEX In Vivo Imaging System as previously described [5].

2.3. Molecular Imaging of Tumors with MRI

The MRI study was performed using a Bruker Biospec 9.4 T preclinical MRI scanner (Bruker Corp., Billerica, MA, USA) with a 35 mm inner diameter mouse body radio frequency (RF) coil. Mice bearing LN-229 flank tumors were imaged at 2–5 weeks post tumor implant. Polyurethane tubing (0.014″ ID × 0.033″ OD) (SAI Infusion Technologies, Lake Villa, IL, USA) was connected to a 1 mL syringe and loaded with the appropriate amount of a given contrast agent dissolved or diluted in saline. All agents were administered an equal Gd concentration of 0.2 mmol·Gd/kg. The total volume of each agent injected was <100 μL, with an additional 50 μL of saline used to flush the line and ensure that the full dose was administered to the animal. After mice were anesthetized with a 2% isoflurane-oxygen mixture in an isoflurane induction chamber, tail veins were catheterized with a 26 gauge veterinary catheter and connected to the pre-loaded tubing described above. The animals were moved into the magnet and kept under inhalation anesthesia with 1.5% isoflurane-oxygen via a nose cone. A respiratory sensor connected to a monitoring system (SA Instruments, Stony Brook, NY, USA) was placed on the back of the animal to monitor rate and depth of respiration. Body temperature was maintained at 35 ± 1 °C by blowing warm air into the magnet through a feedback control system. A group of 5–6 mice was used for each agent.
High-resolution T2-weighted images were first obtained for each mouse using a RARE (Rapid Acquisition with Relaxation Enhancement) acquisition (TR/TE = 5000/40 ms, 20 slices, resolution = 0.117 × 0.117 × 0.5 mm) to select the imaging slice for the dynamic T1 mapping acquisition [11]. The dynamic T1 data were then acquired using a snapshot GRE (Gradient Recalled Echo) acquisition with inversion recovery preparation described previously [12,13] (10 inversion times (263, 775, 1287, 1799, 2311, 2823, 3335, 3847, 4359, and 4871 ms), GRE imaging readout TR/TE = 4.0 ms/1.3 ms, flip angle = 10 degrees, resolution = 0.234 × 0.234 × 1 mm, Field of View (FOV) = 30 × 30 mm, and 10 signal averages). The total acquisition for each T1 mapping scan was 2.5 min. After five baseline/pre-injection T1 mapping scans, Optimark™, the targeted SBK2-Tris-(Gd-DOTA)3 agent, or the non-targeted scrambled-Tris-(Gd-DOTA)3 control was injected at a dose of 0.2 mmol of Gd/kg followed by a 50 µL flush of saline. T1 maps were then consecutively acquired every 2.5 min over 62.5 min.

2.4. Calculation of T1 Mapping Values, Gd Concentration, and Slope Analysis

The MRI data were imported into MATLAB enabling estimation of both pixel-wise T1 relaxation time maps as well as mean intra-tumoral T1 changes using an ROI analysis. The T1 maps were obtained from the T1 mapping acquisition using previously described methods based on mono-exponential models [13]. To compare the multiple imaging agents, the pre- and post-contrast T1 maps were then used to calculate maps of % change in T1, which is directly related to the concentration of each agent within the tumor. To calculate Gd concentrations, T1 relaxivity constants determined at 9.4T were used along with T1 map values.
As the T1 maps and T2-weighted images were co-registered, the ROI analysis was performed by manually drawing the ROI on the T2-weighted images. The same ROI was then applied to all of the T1 mapping images and the average value in the ROI was calculated as a measure of tumor uptake of each imaging agent. Plots of normalized T1 values in the tumor were calculated by dividing the post-contrast injection T1 maps by an average of the 5 baseline (pre-contrast injection) tumor T1 values. This normalization was performed to limit the effects of variation in the pre-contrast tumor T1 values on the comparison of the molecular imaging agents.
As an imaging marker for contrast agent retention, a slope analysis was performed on the normalized T1 values. Slopes were calculated for Optimark™, scrambled-Tris-(Gd-DOTA)3, and SBK2-Tris-(Gd-DOTA)3 by using all of the mean tumor T1 values from 15 to 60 min following agent administration. For each pair of contrast agents, normalized T1 map values at each time point, along with the slopes of post-contrast T1 curves were evaluated for statistical significance using a two-tailed Student’s t-test, assuming statistical significance at p < 0.05. An F-test was also used to determine if the variance was significantly different between the two samples being compared.

3. Results

3.1. Quantitative MRI Contrast Agent Evaluation

To evaluate the efficacy of the specific agent, SBK2-Tris-(Gd-DOTA)3, we compared this targeted agent to the scrambled-Tris-(Gd-DOTA)3, and the non-specific conventional clinical contrast agent Optimark™. We acquired and analyzed 2D axial T1 mapping images in GFP-positive LN-229 human glioma flank tumors heterotopically implanted in athymic (nu/nu) mice at 2–5 weeks post-implantation. Five T1 maps of the tumor region were acquired before injection of contrast agents to serve as baseline measurements, and then at 2.5 min intervals for 62.5 min following intravenous injection of Optimark™, scrambled-Tris-(Gd-DOTA)3, or SBK2-Tris-(Gd-DOTA)
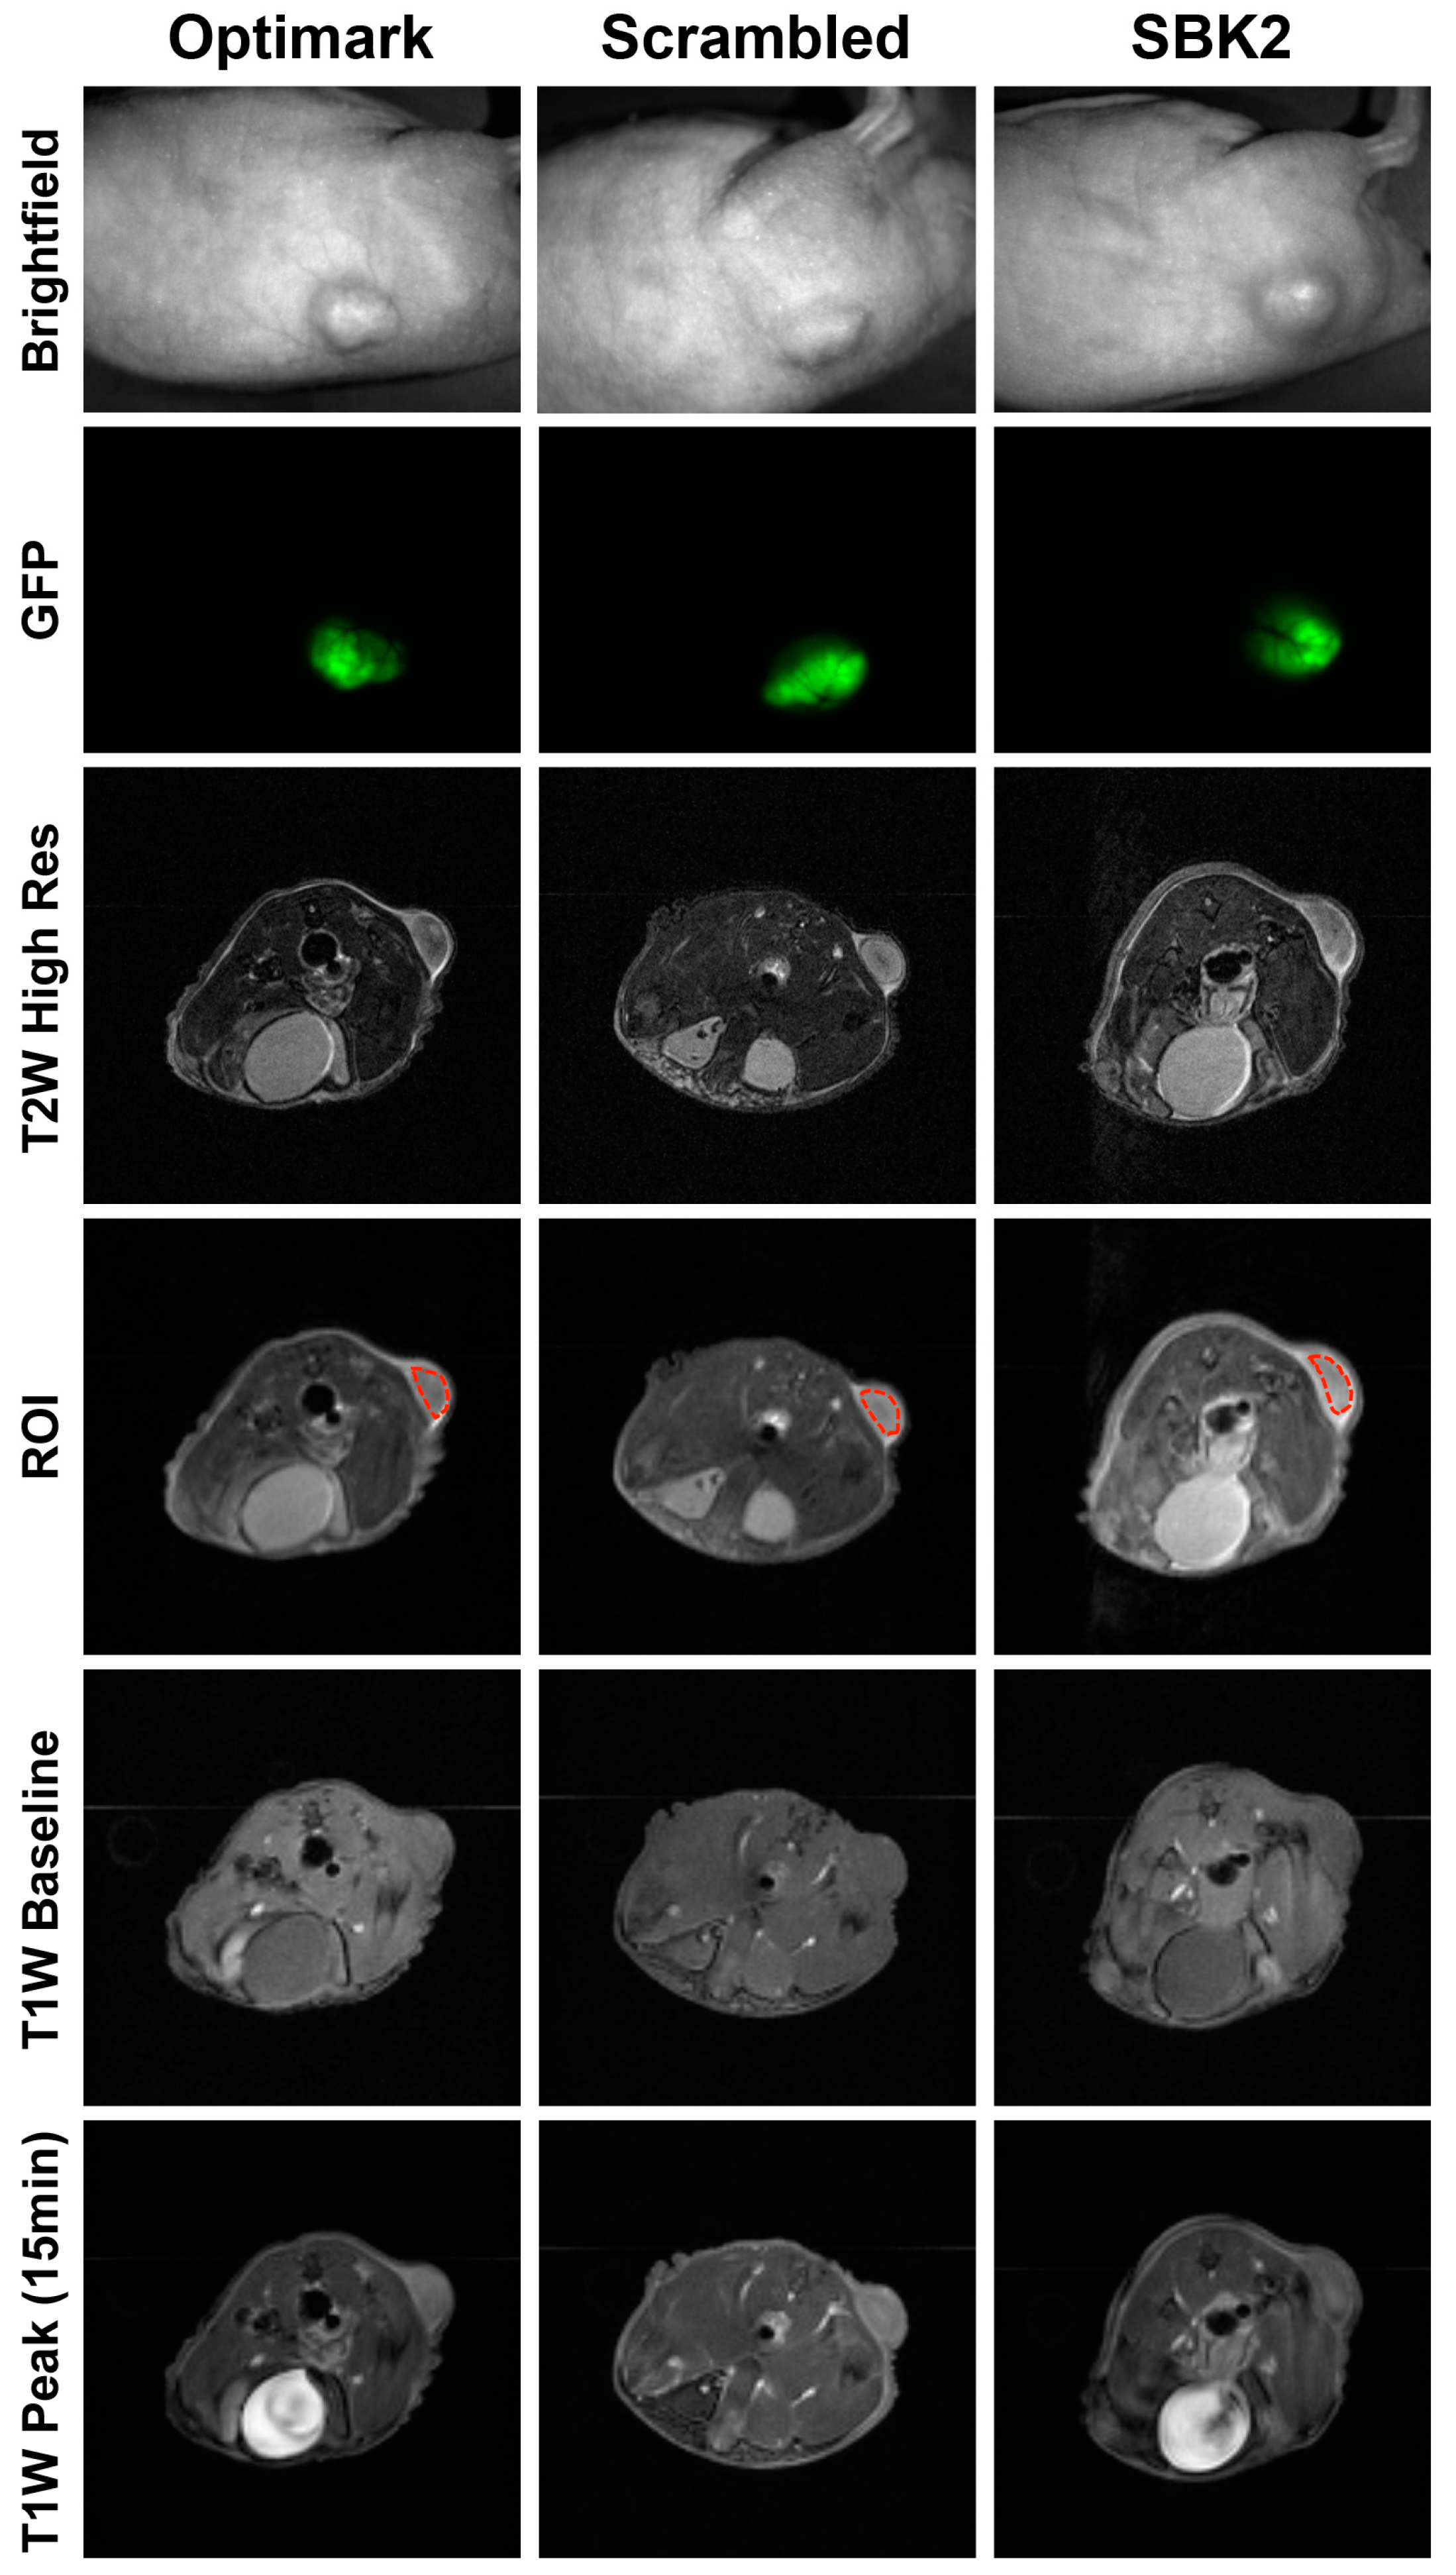
3 agents administered at a dose of 0.2 mmol·Gd/kg. Representative fluorescence and MRI images of mice with the implanted flank tumors are shown in Figure 1 for each contrast agent. Using optical imaging, the physical outline of the flank tumors is evident under brightfield illumination (Figure 1) and the GFP-positive LN-229 glioma cells are also clearly visible in the fluorescence images (Figure 1). For MR imaging, the axial T2-weighted images (Figure 1) are shown with the regions of interest (ROIs) indicated by dashed lines that were used for T1 mapping. In this view, the flank tumors are clearly visible in the T2-weighted images allowing for accurate ROI selection. Figure 1 also shows T1-weighted images acquired from the T1 mapping acquisitions both at baseline (Figure 1) and 15 min following contrast agent injection (Figure 1), respectively. All three contrast agents showed significant contrast uptake as evidenced by the relative change in the T1-weighted images. However, a rigorous quantitative comparison is not possible with these T1-weighted images.

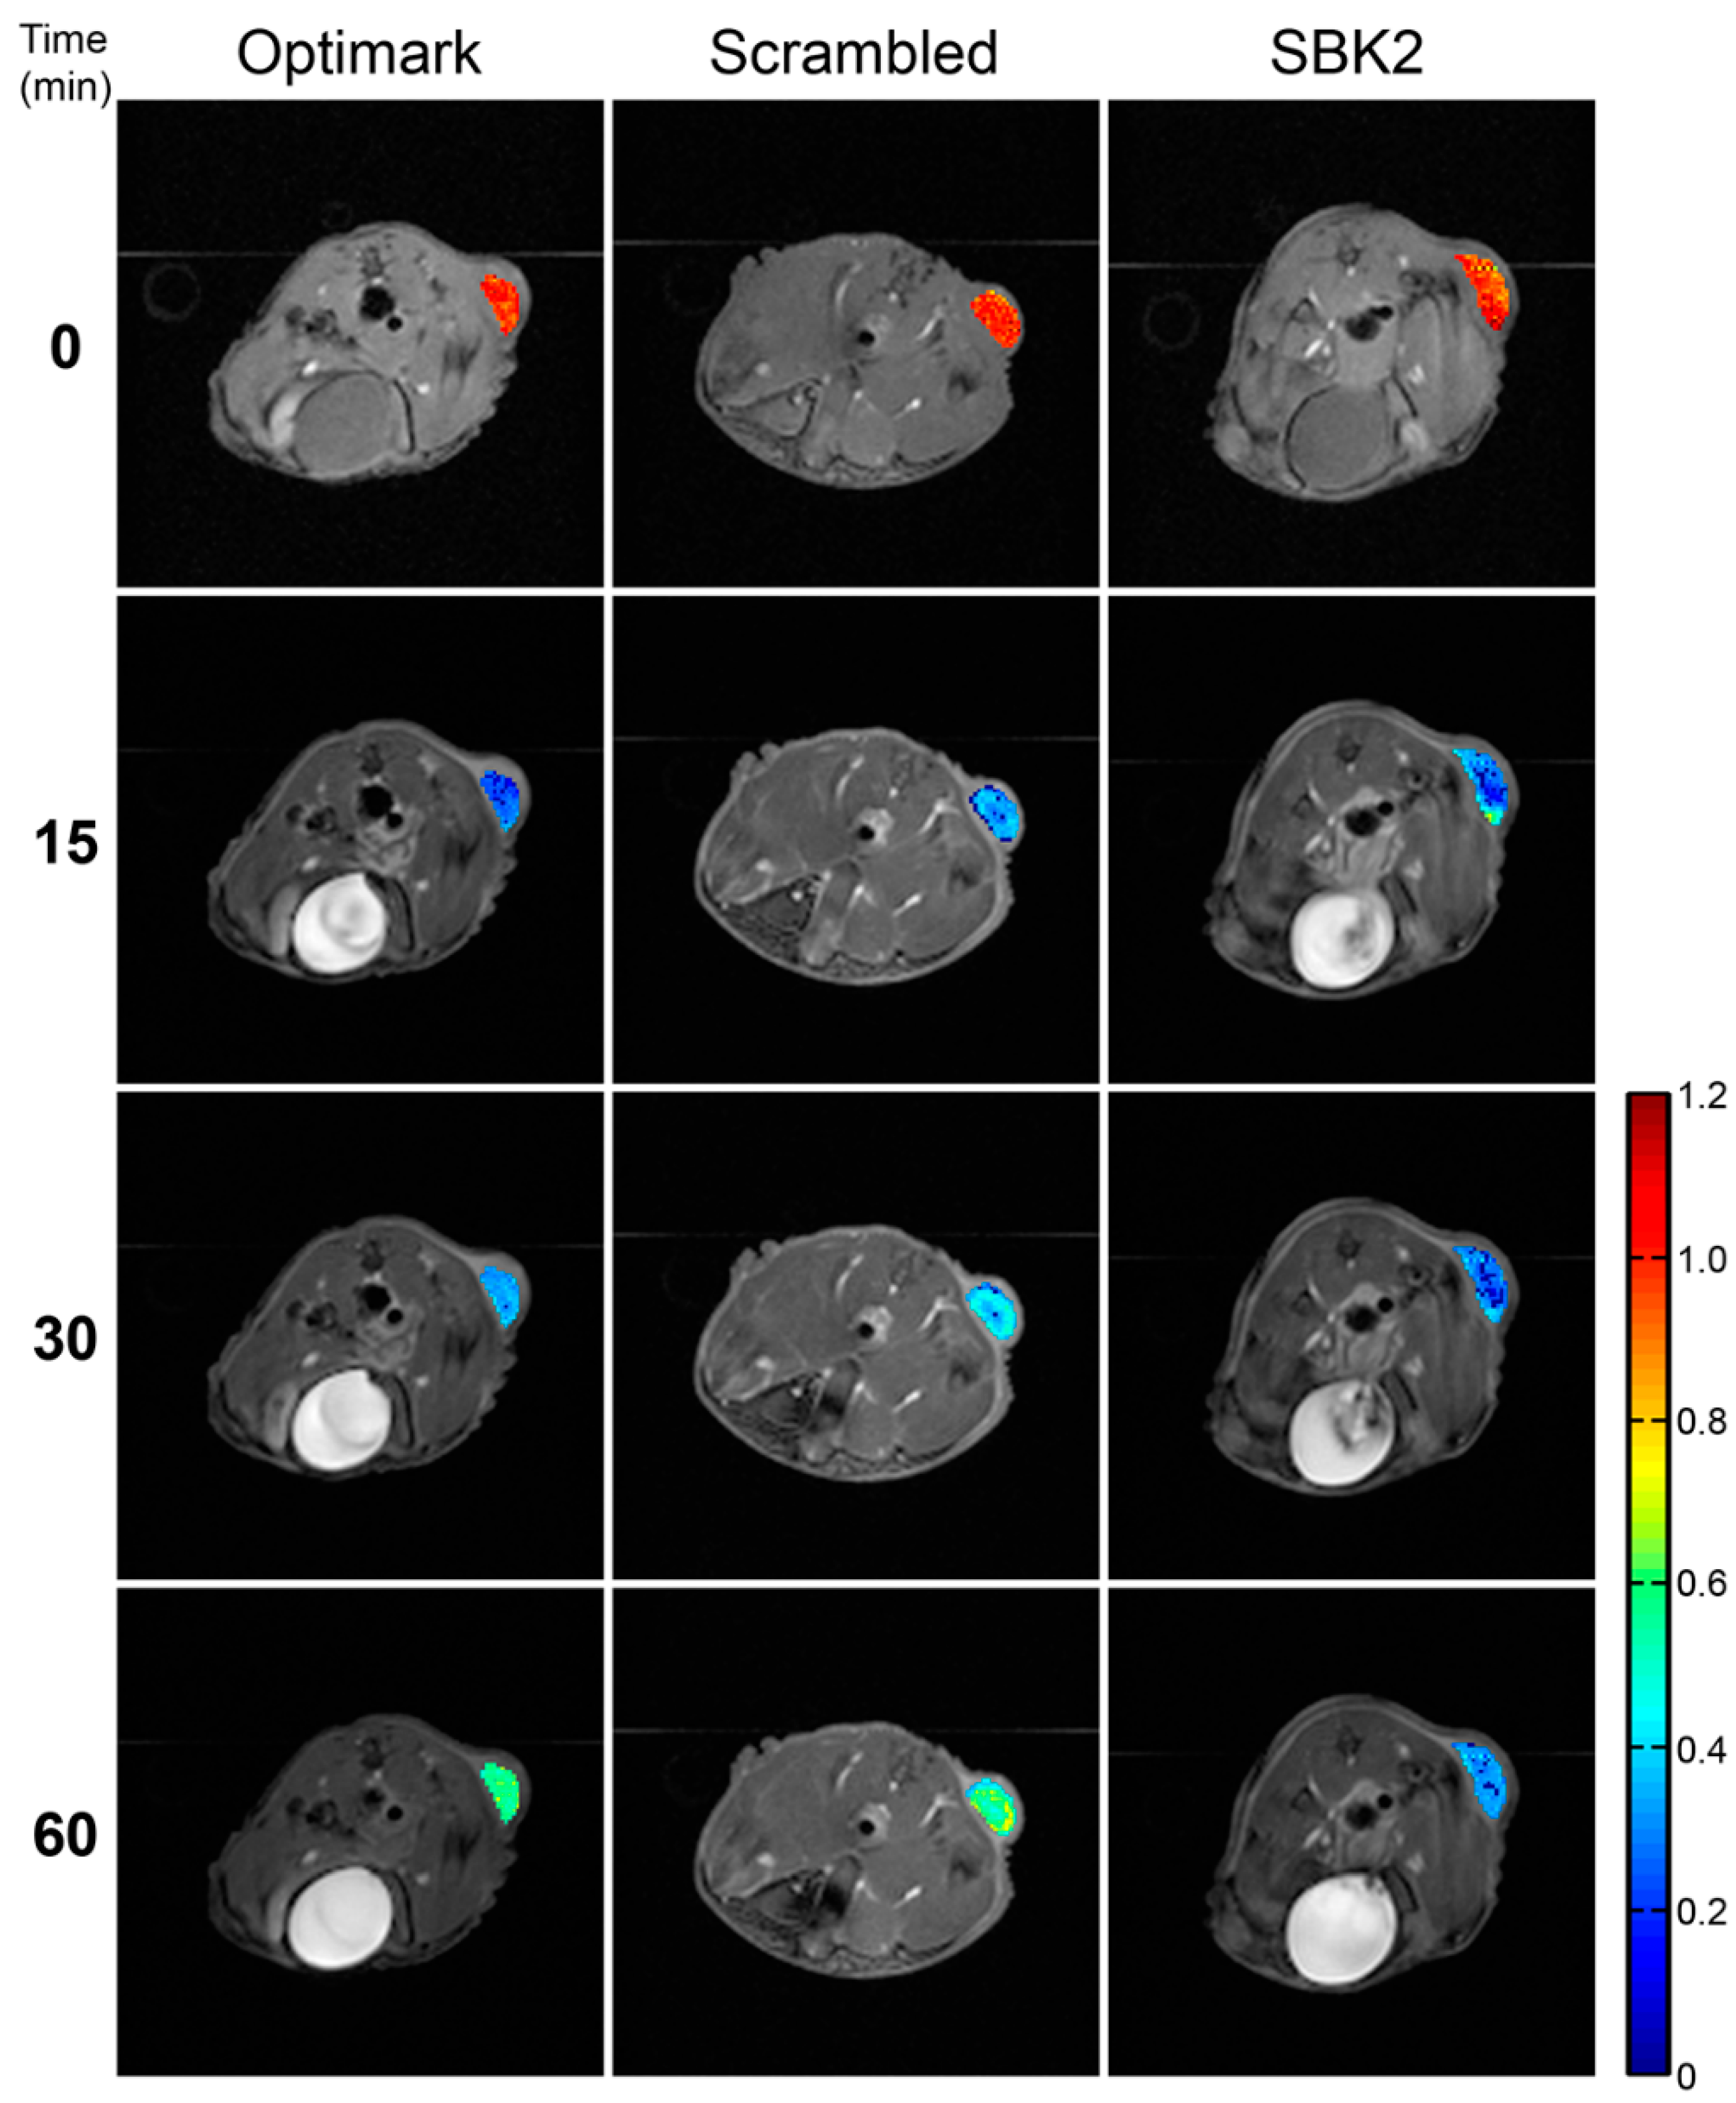
3.2. Quantitative T1 Mapping of MRI Contrast Agent Efficacy in Heterotopic Glioma Flank Tumors

To obtain a quantitative comparison of the difference in tumor enhancement over time between the three contrast agents, T1 mapping was employed to compare the changes in T1 relaxation times in the tumor for each contrast agent over time. Pixel-wise maps of T1 relaxation time were normalized to the mean baseline T1 values and are shown as heat maps overlaying the corresponding gray scale axial images for the indicated time points in Figure 2. The color-coded scale bar indicates the normalized T1 relaxation time from lowest (blue) to highest (red). As expected, all of the contrast agents resulted in a reduction in T1 relaxation time within the first 15 min after agent injection. Importantly, by 30 min post-injection, both the Optimark™ and scrambled-Tris-(Gd-DOTA)3 agents had started to clear from the tumor while the targeted SBK2-Tris-(Gd-DOTA)3 contrast agent was retained within the tumor as evidenced by the limited change in T1 relaxation time relative to that observed at 15 min post-injection (Figure 2). At one-hour post-injection, the normalized T1 relaxation time had returned to ~60% of the pre-contrast values for both Optimark™ and scrambled-Tris-(Gd-DOTA)3 agents (Figure 2).
Figure 1. The SBK2-Tris-(Gd-DOTA)3 molecular imaging agent and the non-specific agents all enhance LN-229 tumors. Representative brightfield image of GFP-positive LN-229 flank tumors for animals where 0.2 mmol Gd/kg of Optimark™, scrambled-Tris-(Gd-DOTA)3, or SBK2-Tris-(Gd-DOTA)3 was administered. N = 6 for Optimark™, N = 5 for scrambled-Tris-(Gd-DOTA)3, and N = 5 for SBK2-Tris-(Gd-DOTA)3. GFP fluorescence image of LN-229 tumor cells for each of the three contrast agents. T2 low-resolution images with Region of Interest (ROI), illustrated by a dashed red line, show the tumor area used for T1 map quantification in Figure 2, Figure 3 and Figure 4. Axial T1-weighted images of LN-229 flank tumor at baseline (before injection of contrast agents) and at time of maximum contrast (15 min) following intravenous injection.
Diagnostics 05 00318 g001
Figure 2. The specific molecular imaging agent SBK2-Tris-(Gd-DOTA)3 results in prolonged decrease in T1 relaxation time in tumors compared to non-specific agents. Normalized T1 maps of the flank tumors overlaid onto T1-weighted images at pre-contrast (0 min); 15 min post-injection; 30 min post-injection; and 60 min post-injection. The color-coded scale bar indicates normalized T1 relaxation time values with dark blue representing the lowest T1 values resulting from the T1 shortening effect of the contrast agents. Note the prolonged decrease in normalized T1 values with the SBK2-Tris-(Gd-DOTA)3 agent resulting in lower T1 map values while the T1 values of the non-specific agents have returned to about 60% of baseline.
Diagnostics 05 00318 g002
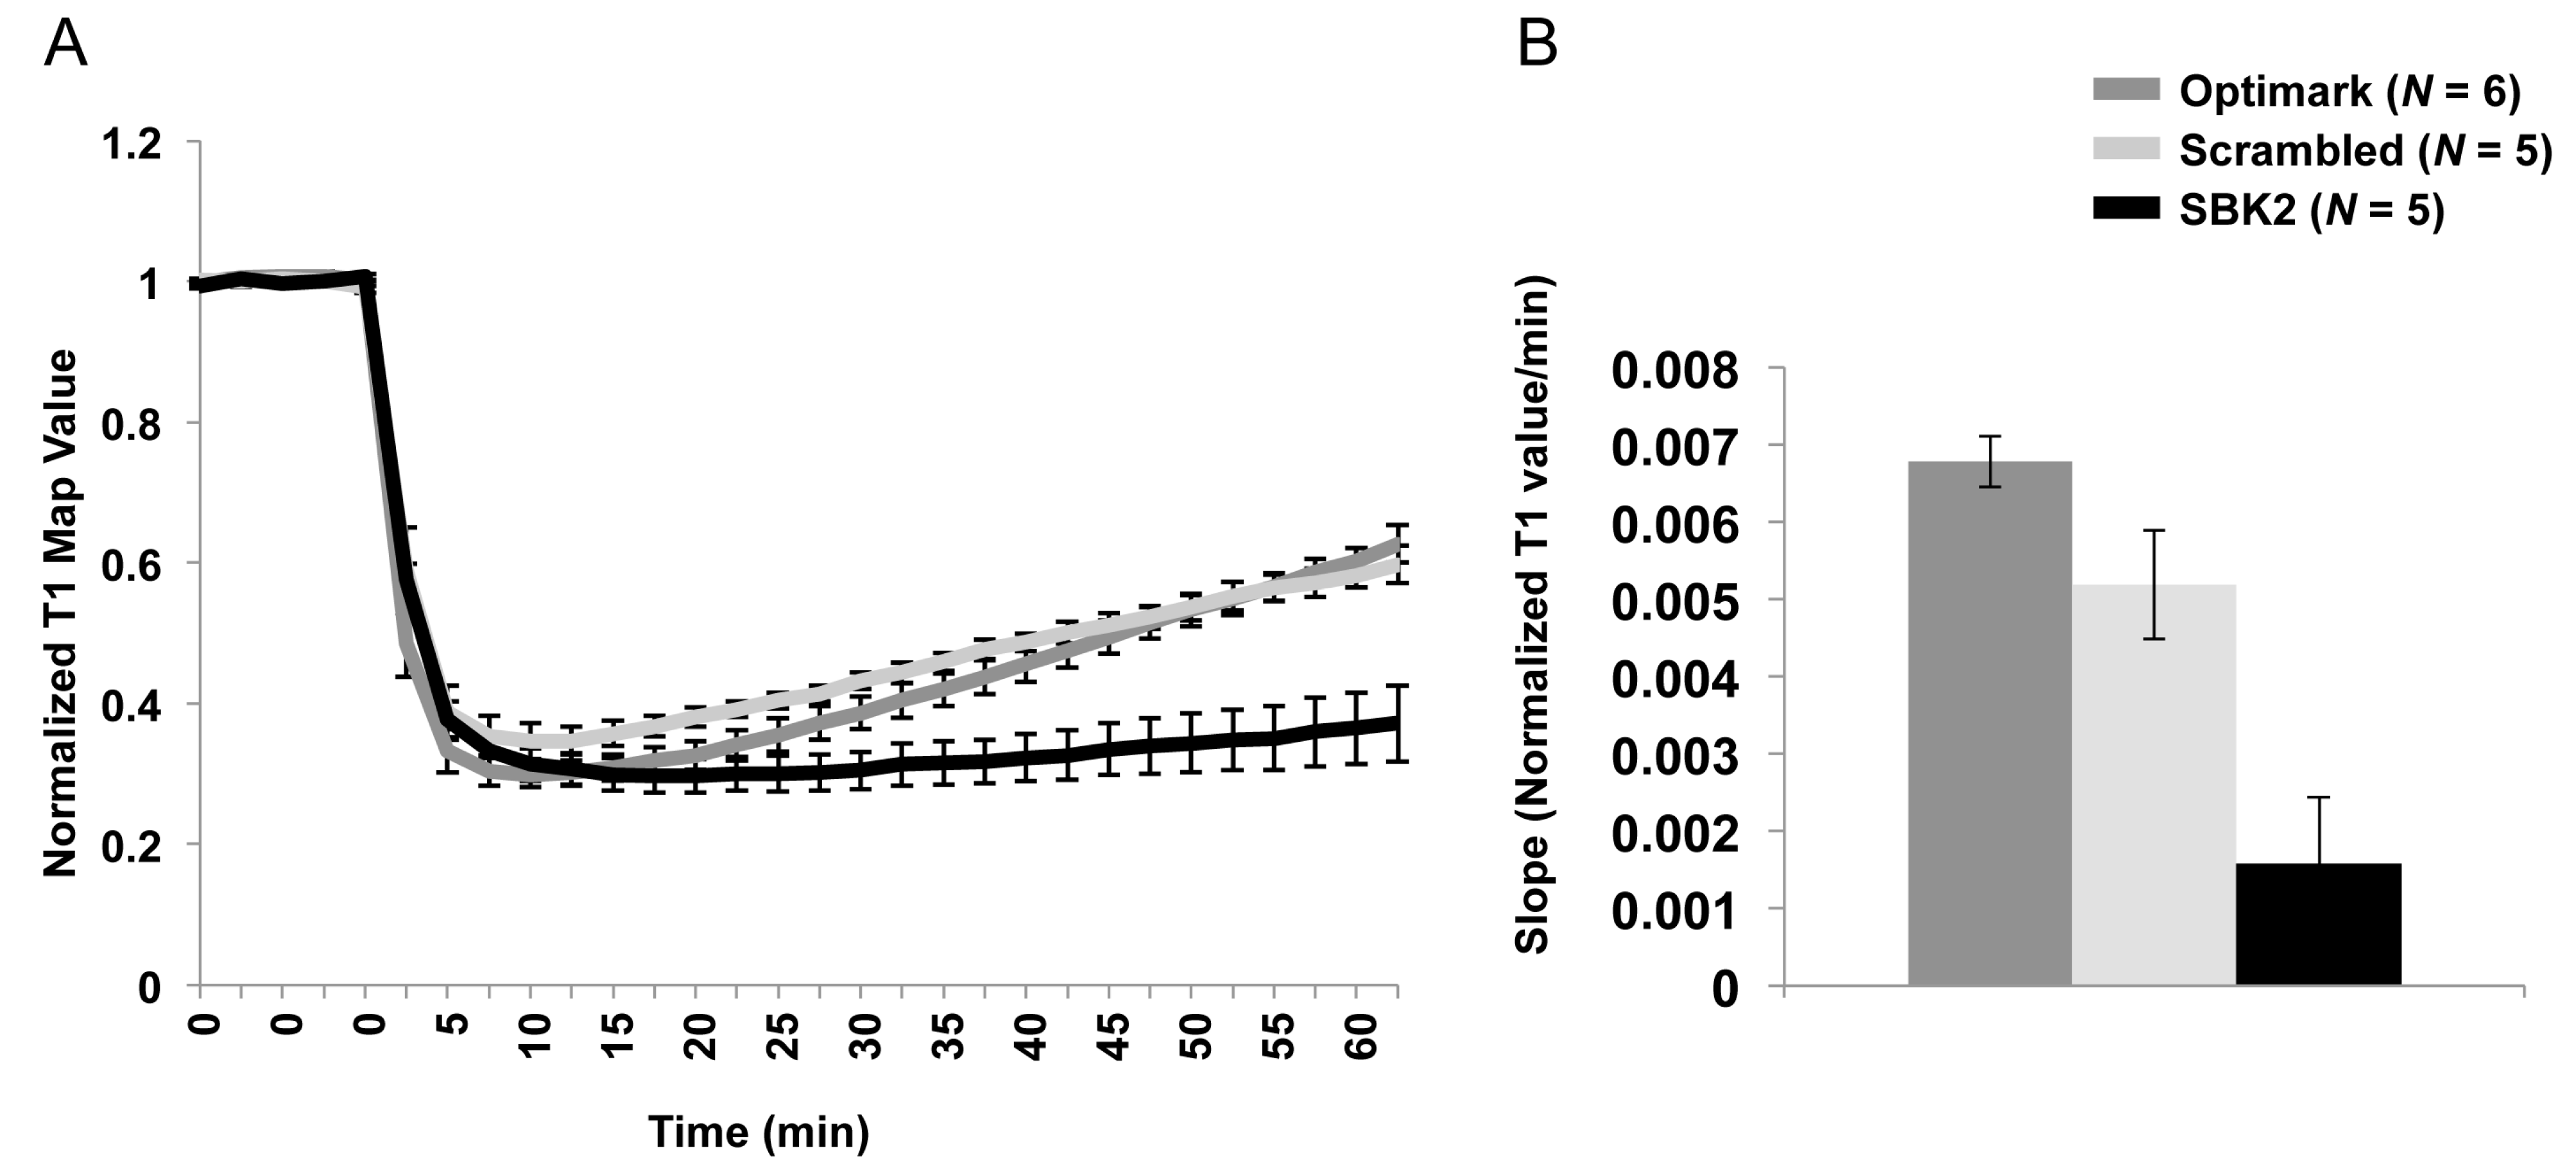
To evaluate the retention of the agents in greater detail, we plotted the mean tumor normalized T1 values for groups of mice administered each contrast agent over the entire scanning session of 62.5 min. We found that the mean tumor normalized T1 values of all three agents showed maximal decreases in T1 between 10 and 15 min following injection (Figure 3). Importantly, the normalized T1 values for the SBK2-Tris-(Gd-DOTA)3 agent remain reduced over the entire 62.5 min scanning session (Figure 3), while the scrambled-Tris-(Gd-DOTA)3 and Optimark™ normalized T1 mapping values begin to return towards baseline levels starting at approximately 20 min. Normalized T1 values are significantly different between SBK2-Tris-(Gd-DOTA)3 and Optimark™ from 30–62.5 min (ranges from p < 0.001 to p < 0.04 depending upon the time point), and between SBK2-Tris-(Gd-DOTA)3 and scrambled-Tris-(Gd-DOTA)3 from 17.5–62.5 min (ranges from p < 0.002 to p < 0.03). The normalized T1 values for the Optimark™ and scrambled-Tris-(Gd-DOTA)3 agents were not significantly different at any time point. The rate of contrast agent clearance from the tumor was calculated by determining the change in mean tumor normalized T1 over time from 15 to 60 min for each agent. The recovery slopes of scrambled-Tris-(Gd-DOTA)3 and Optimark™ were not statistically different from one another. In contrast, the slope of SBK2-Tris-(Gd-DOTA)3 recovery differed significantly from that of both scrambled-Tris-(Gd-DOTA)3 (p < 0.01) and Optimark™ (p < 0.0002) demonstrating quantitatively that SBK2-Tris-(Gd-DOTA)3 is specifically retained in the flank tumors over time.
Figure 3. Mean tumor normalized T1 values and slope analysis following intravenous administration of Optimark™, scrambled-Tris-(Gd-DOTA)3, or SBK2-Tris-(Gd-DOTA)3 contrast agents in cohorts of nu/nu athymic mice bearing glioma flank tumors administered at a dose of 0.2 mmol·Gd/kg. Note the sustained decrease in normalized T1 for SBK2-Tris-(Gd-DOTA)3 as well as the significant difference in slope due to agent clearance between the non-specific agents compared to SBK2-Tris-(Gd-DOTA)3, which showed the highest retention. N = 6 for Optimark™, N = 5 for scrambled-Tris-(Gd-DOTA)3, and N = 5 for SBK2-Tris-(Gd-DOTA)3. Data plotted as means ± standard error. (A) Mean tumor normalized T1 values at baseline and after agent injection measured every 2.5 min for 62.5 min. Normalized T1 values are significantly different between SBK2-Tris-(Gd-DOTA)3 and Optimark™ from 30–62.5 min (ranges from p < 0.001 to p < 0.04 depending upon the time point), and between SBK2-Tris-(Gd-DOTA)3 and scrambled-Tris-(Gd-DOTA)3 from 17.5–62.5 min (ranges from p < 0.002 to p < 0.03). Optimark™ and scrambled-Tris-(Gd-DOTA)3 were not significantly different at any time point. (B) The slopes of the lines were determined between 15 and 60 min post-injection to examine the rate of agent clearance. The slope of SBK2-Tris-(Gd-DOTA)3 recovery was significantly different than that of both Optimark™ (p < 0.0002) and scrambled-Tris-(Gd-DOTA)3 (p < 0.01). The slopes of Optimark™ and scrambled-Tris-(Gd-DOTA)3 were not significantly different from one another.
Diagnostics 05 00318 g003
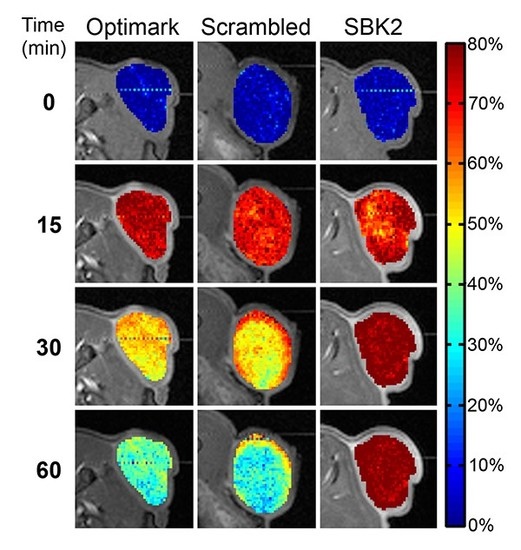
To complement the data presented in Figure 2 and 
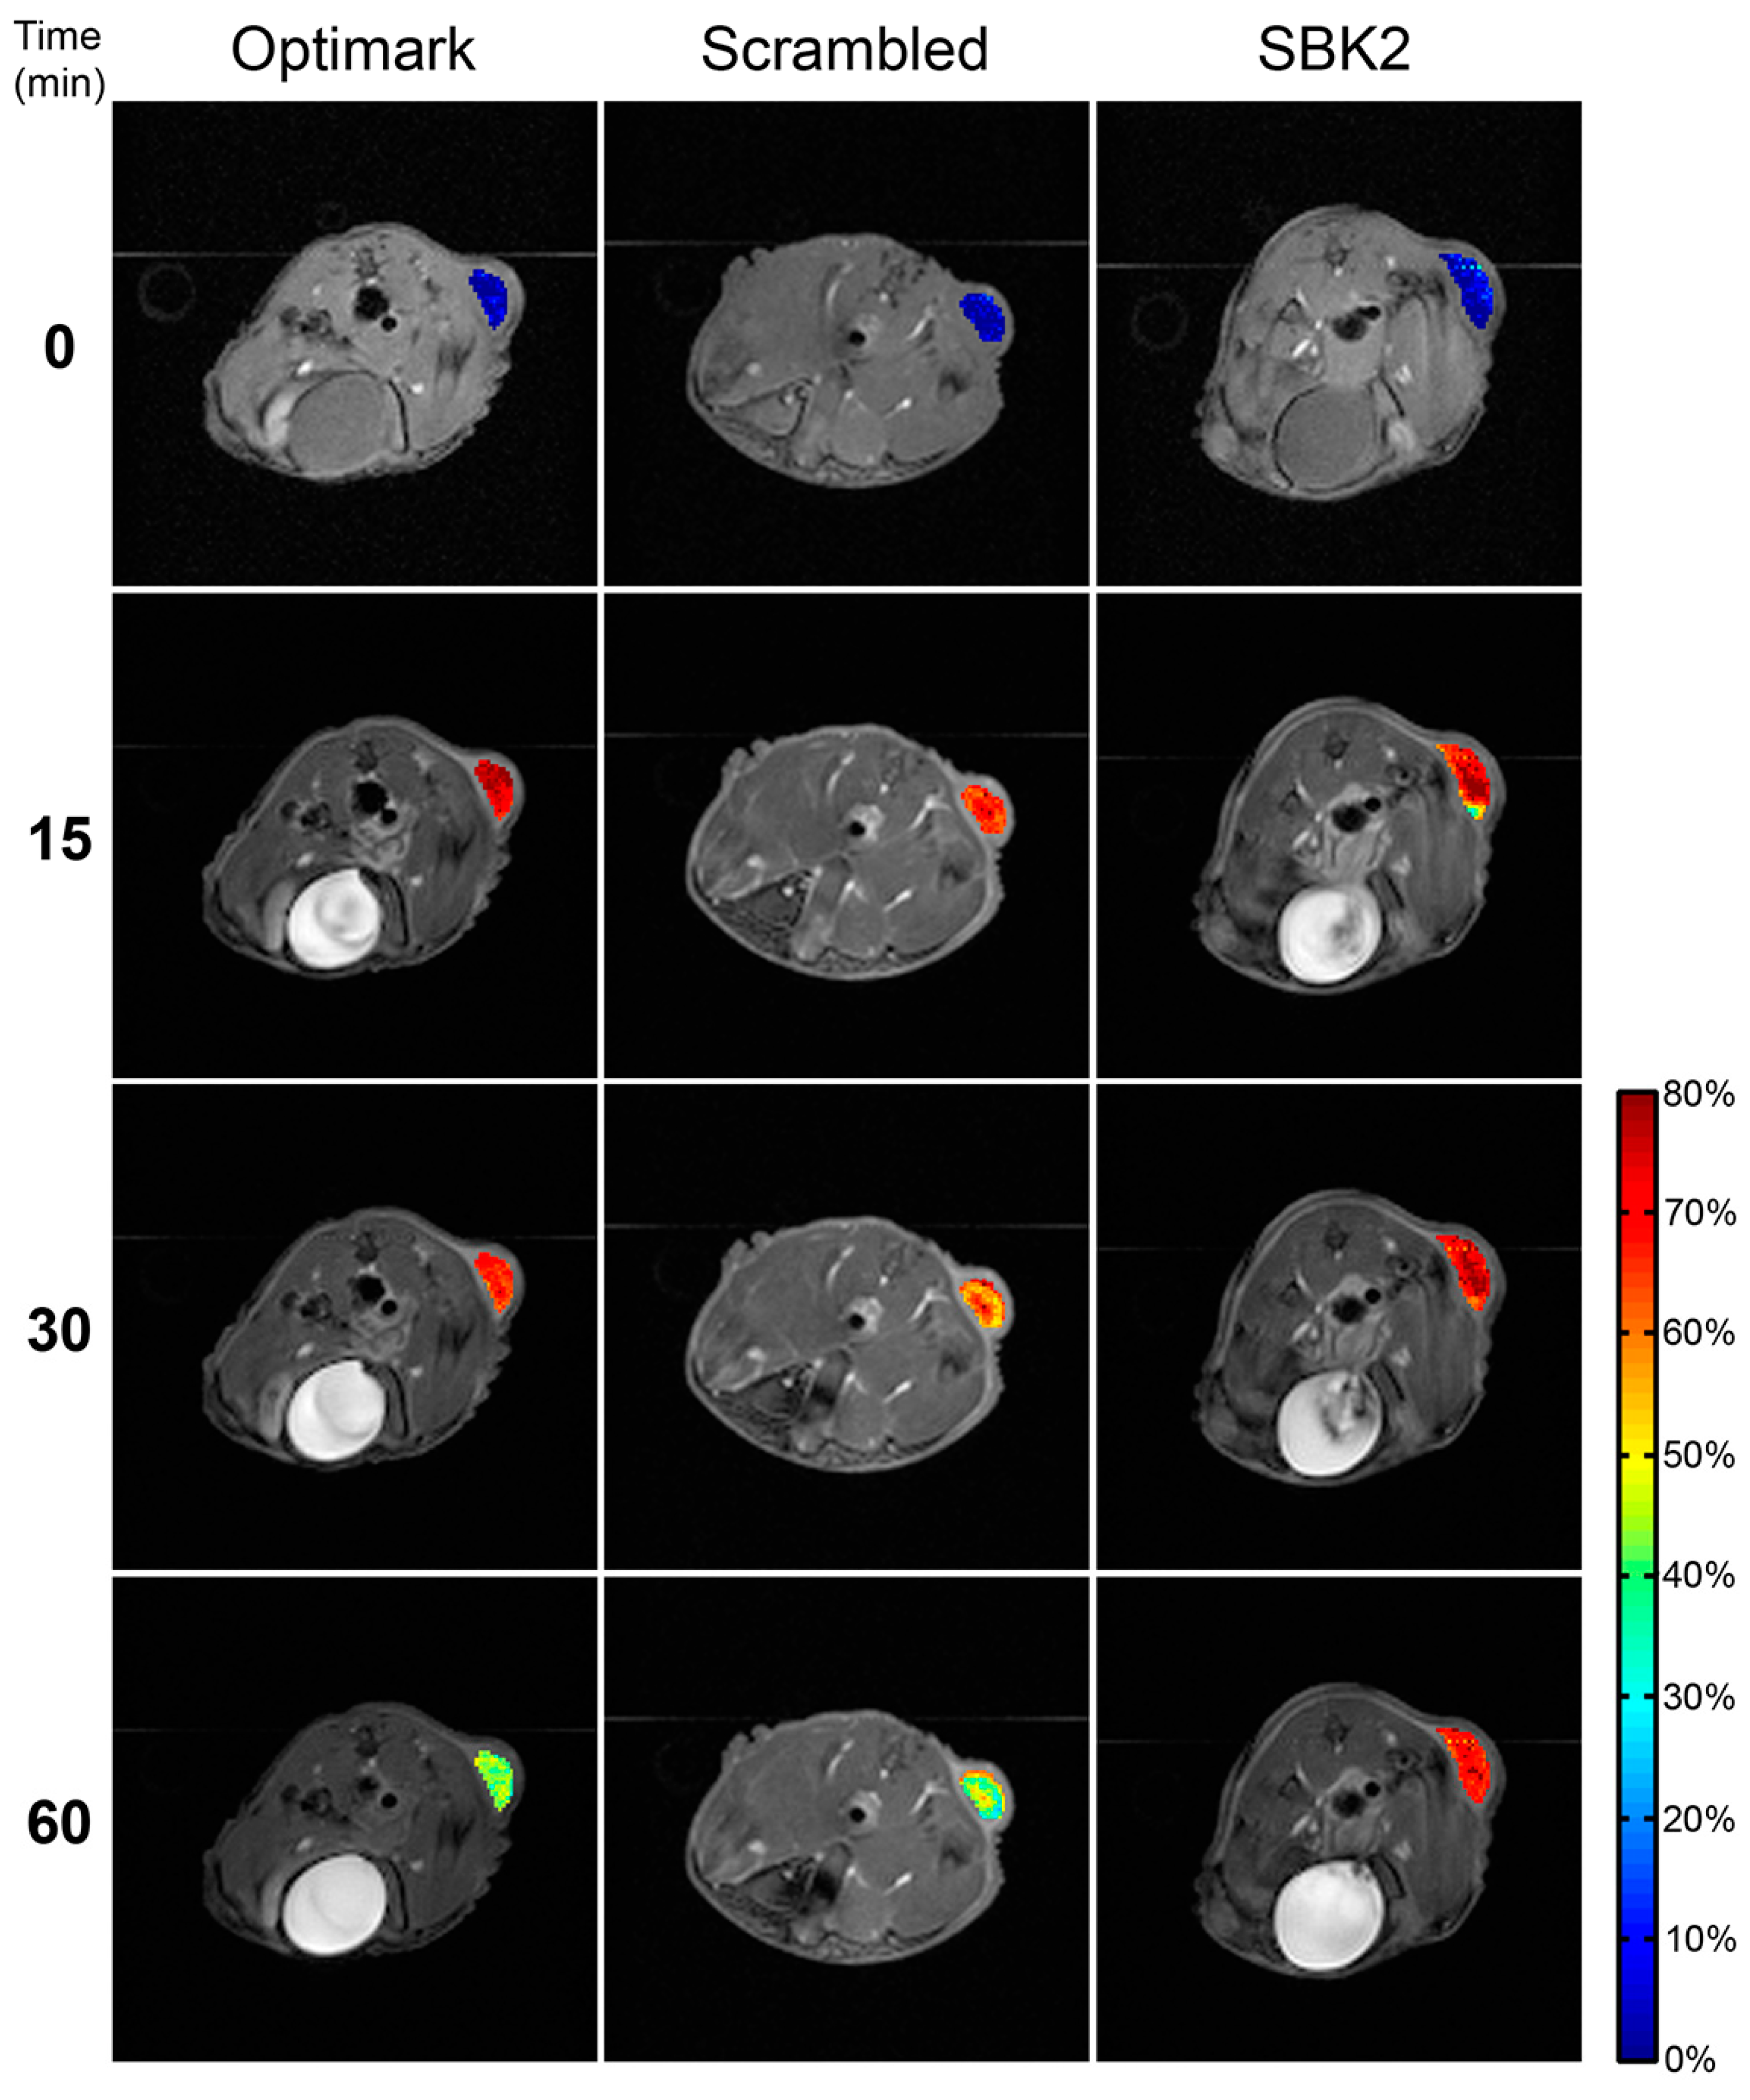
Figure 3, maps of the percent change in T1 values were also calculated at multiple time points for the flank tumors (Figure 4). Baseline (pre-contrast) values are shown in Figure 4 and are near zero, as expected. As anticipated, the percent change in T1 at 15 min post-injection is dramatically increased for all three agents (Figure 4).
Figure 4. Maps of percent change in T1 relaxation time for flank tumors overlaid onto axial T1-weighted images plotted at pre-contrast (0 min); 15 min post-injection; 30 min post-injection; and 60 min post-injection. The percent change in T1 values demonstrate that the agent SBK2-Tris-(Gd-DOTA)3 is retained in the tumor for a longer period of time than either Optimark™ or scrambled-Tris-(Gd-DOTA)3 agents. The color scale indicates percent change in T1 relaxation time on a 0%–80% scale.
Diagnostics 05 00318 g004
By 30 min, the percent change in T1 is showing some initial reduction for the Optimark™ and scrambled-Tris-(Gd-DOTA)3 agents, while the percent change in T1 for the SBK2-Tris-(Gd-DOTA)3 remains essentially unchanged from that at 15 min (Figure 4). By 60 min post-injection, the percent change in T1 values for Optimark™ and scrambled-Tris-(Gd-DOTA)3-treated animals is closer to that observed at baseline. In contrast, percent change in T1 values in the animal administered SBK2-Tris-(Gd-DOTA)3 remains virtually unchanged in comparison to the 15 and 30 min time points (Figure 4).
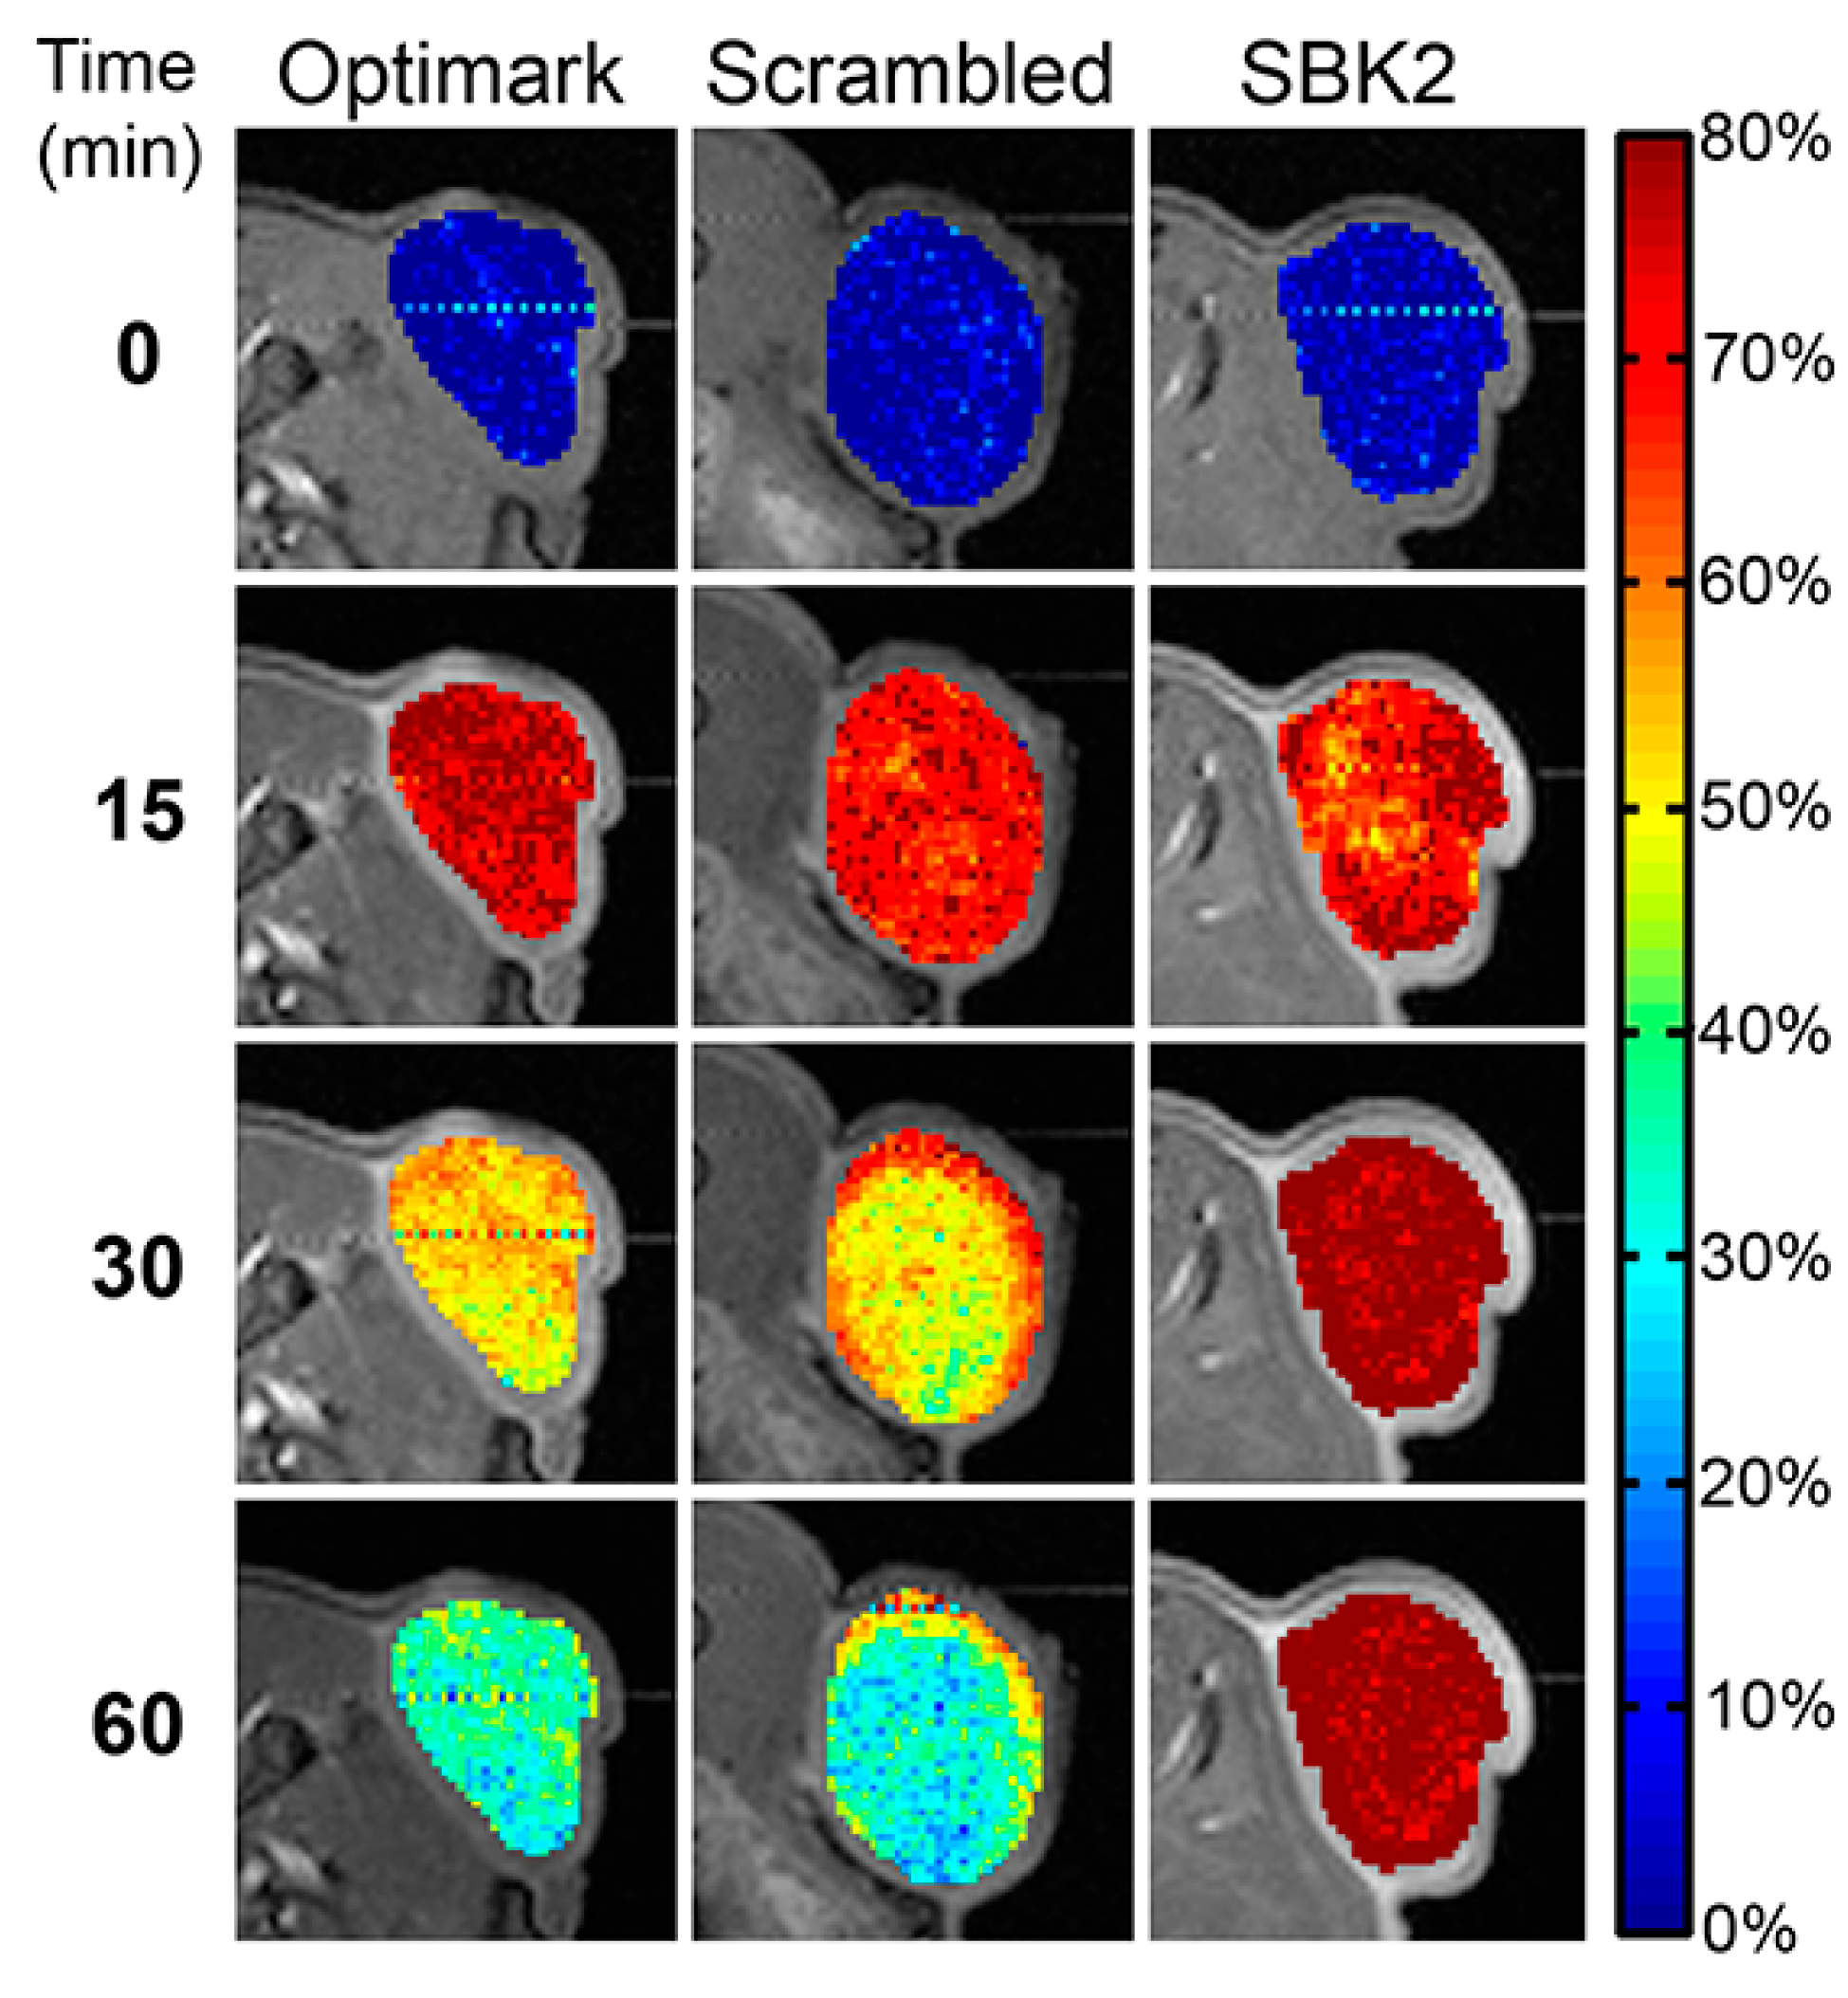
A second group of heterotopic glioma flank tumor bearing mice with larger tumors were also administered Optimark™, scrambled-Tris-(Gd-DOTA)3, and SBK2-Tris-(Gd-DOTA)3 agents as shown in Figure 5 with enlarged images. These images show the non-heterogeneous labeling of the tumors by the non-specific agents, whereas the SBK2-Tris-(Gd-DOTA)3 agent uniformly recognizes the entire tumor. The “rim” or “edge” effect of the non-specific agents is often seen in clinical imaging [14]. A similar result demonstrating this “rim” effect for non-specific agents was also observed in our previous studies [8]. In contrast, the SBK2-Tris-(Gd-DOTA)3 agent exhibits remarkable uniformity across the entire tumor consistent with binding of the PTPµ fragment within the tumors rather than in just the tumor (neo)vasculature.
Figure 5. Maps representing the percent change in T1 values indicates that the tumors of mice at pre-contrast (0 min); 15 min post-injection; 30 min post-injection; and 60 min post-injection show SBK2-Tris-(Gd-DOTA)3 is retained for a much longer period of time than Optimark™ and scrambled-Tris-(Gd-DOTA)3 agents even in larger tumors. Note also that the T1 changes at 30 min and 60 min for the SBK2-Tris-(Gd-DOTA)3 agent are uniformly distributed throughout the tumor while the non-specific agents show rim enhancement typical of conventional agents. The color scale indicates percent change in T1 relaxation time on a 0%–80% scale.
Diagnostics 05 00318 g005
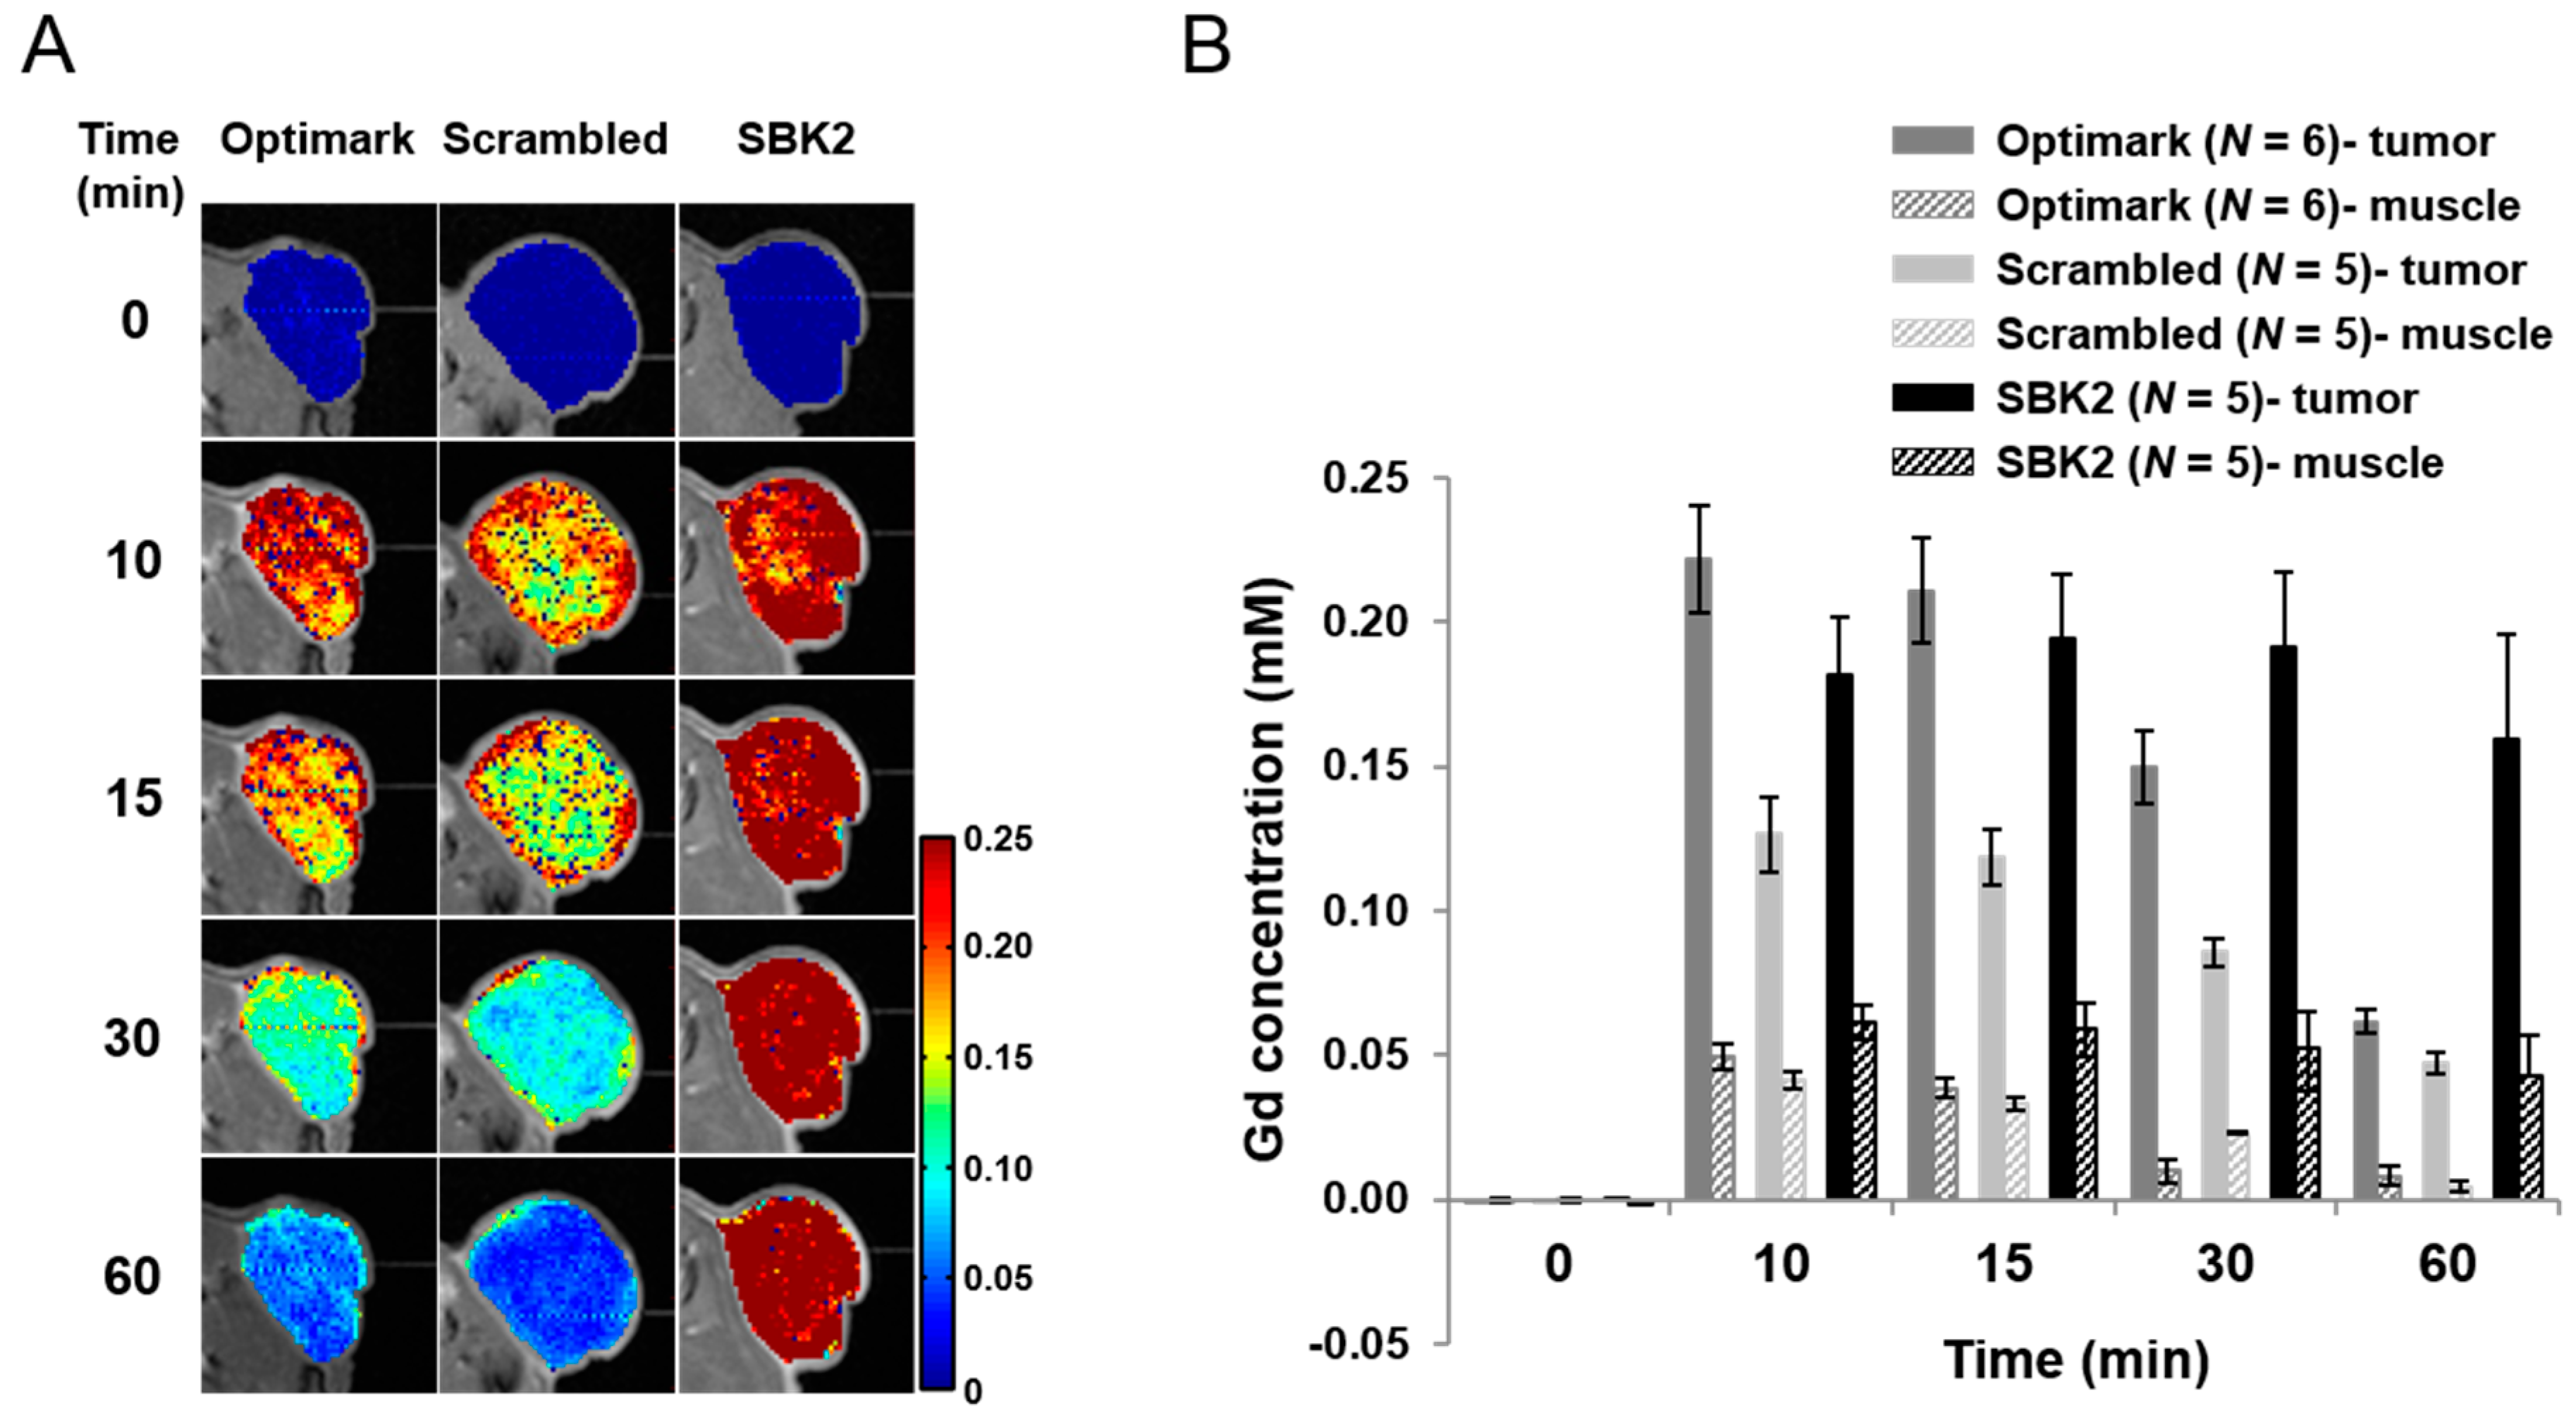
A significant benefit of T1 mapping analysis is that this quantitative imaging method allows for the calculation of contrast agent concentration in any region of interest. As shown in Figure 6, the Gd content in tumors of animals treated with the specific SBK2-Tris-(Gd-DOTA)3 agent remains at peak levels even an hour after treatment while clearance begins to occur before 30 min in the animals treated with the non-specific agents. As expected, the Gd concentration in control areas of muscle is much lower than that of tumor (Figure 6B).
Figure 6. Gadolinium concentrations in tumor and muscle of animals treated with different contrast agents. (A) Maps of gadolinium concentration overlaid onto axial T1-weighted images plotted at pre-contrast (0 min); 10 min post-injection; 15 min post-injection; 30 min post-injection; and 60 min post-injection. Consistent with T1 map values observed for the non-specific contrast agents, Gd concentrations are highest at 10 and 15 min in tumors of animals treated with Optimark™ and scrambled-Tris-(Gd-DOTA)3, and then rapidly decrease at later time points. Gd concentration in tumor of animal receiving SBK2-Tris-(Gd-DOTA)3 remains at near peak levels at 60 min indicating retention of the agent in the tumor. (B) Mean gadolinium concentrations ± SE are plotted for tumor and muscle for groups of animals treated with the indicated contrast agents at different time points. Gd concentrations in tumors of animals treated with Optimark™ and scrambled-Tris-(Gd-DOTA)3 are highest at 10 and 15 min after injection and then decline. In contrast, the Gd concentration in tumors of animals treated with SBK2-Tris-(Gd-DOTA)3 persist at approximately 0.15 mM from 10 to 60 min. Gd concentrations calculated in control muscle regions (hatched bars) are substantially lower than those in tumors.
Diagnostics 05 00318 g006

4. Discussion and Conclusion

We dynamically evaluated the extent and duration of tumor enhancement following contrast administration with T1 mapping. Our study using T1 mapping to evaluate the efficacy of the SBK2-Tris-(Gd-DOTA)3 molecular imaging agent in flank GBM tumors demonstrates that SBK2-Tris-(Gd-DOTA)3 is effective at specifically recognizing and binding GBM tumors compared to non-targeted contrast agents. Three major findings come to light as a result of our study.
The first major finding is that the T1 mapping method can be used to dynamically measure T1 values and determine Gd-based contrast agent concentration over time in tumors using molecular imaging agents. We observed that all of the contrast agents achieve similar levels of initial reductions in T1 relaxation times indicating comparable delivery to the tumor region between 10 to 15 min after injection. Notably, a large and statistically significant difference was observed in the duration of the reduction in T1 relaxation time and the retention of the specific SBK2-Tris-(Gd-DOTA)3 agent versus the non-specific agents. Whereas the T1 relaxation times for the non-specific contrast agents more rapidly returned towards their respective pre-contrast levels, the T1 relaxation times for the SBK2-Tris-(Gd-DOTA)3 agent remained close to the maximum change in T1 relaxation for the entire hour of imaging (Figure 2 and Figure 3). Importantly, T1 mapping provides improved quantification in comparison to conventional T1-weighted imaging. In T1-weighted imaging, the accumulation of contrast agent is associated with increased signal intensity in the T1-weighted images due to the T1 relaxation time reductions imposed by the contrast agent. Unfortunately, the signal intensity changes detected in T1-weighted imaging studies are not quantitative in nature as these signals are also impacted by many other factors including variation in the excitation and detection efficiency of the MRI coils of different scanners. Therefore, quantitative T1-weighted imaging studies require modeling of the signal intensity profile. As a result, the individual time points in a T1-weighted study are only qualitative by nature. As shown herein, dynamic T1 mapping provides quantitative assessments at each imaging time point providing the opportunity to assess both the delivery and retention of the contrast agents (i.e., minimum T1 relaxation time; maximal change in T1) as shown in Figure 3. These data demonstrate the utility of quantitative T1 mapping as opposed to conventional T1-weighted imaging in objectively quantifying the ability of a targeted molecular agent to label tumors and allows for the calculation of clearance rates among different agents.
The second major finding is that T1 mapping allowed us to determine that the extent of initial contrast is approximately the same regardless of agent specificity. Tumor imaging research often focuses on the enhanced permeability and retention (EPR) effect that is observed in tumor tissue due to pathophysiological changes in the vasculature and host environment that promotes the leakage of large macromolecules (>40 kD to 800 kD) into tumor tissue while simultaneously slowing the clearance of macromolecules through the lymphatic system [15]. The initial delivery of these molecules is due to the enhanced permeability of the vessels in tumors, which is supported by our data. Gd-chelates are small molecules that passively leak from the circulation into the extracellular fluid [16]. Due to their small size, Gd-chelates also rapidly diffuse back into the vasculature [17]. An actively targeted small molecular weight contrast agent conjugated to Gd, on the other hand, that specifically binds and recognizes a molecular target should be retained [16,18].
Our third major finding is consistent with the idea of prolonged tumor retention being exhibited only by specifically targeted agents such as SBK2-Tris-(Gd-DOTA)3. Our data show that SBK2-Tris-(Gd-DOTA)3, but not the non-specific agents Optimark™ and scrambled-Tris-(Gd-DOTA)3 produced a sustained decrease in T1 map values. As shown in Figure 3, we observed similar initial contrast due to the passive diffusion of Gd-chelates into tumor tissue. This corresponds to the greatest change in normalized T1 map values at 10 min obtained for the non-specific contrast agents that then rapidly return to baseline over the course of the hour. In our tumor model, the mean normalized T1 map or numerical value for passive targeting, occurring at 10 min, is between 0.30 for Optimark™ and 0.35 for scrambled-Tris-(Gd-DOTA)3. For SBK2-Tris-(Gd-DOTA)3, on the other hand, the normalized T1 map values stabilized at approximately the same maximal decrease for as long as the tumors were imaged, over the course of an hour. Furthermore, T1 mapping allows Gd concentration to be calculated. As shown in Figure 6, Gd concentrations reached maximal levels in tumors of animals treated with non-specific contrast agents between 10 and 15 min post-injection before decreasing, while Gd concentration in the tumors of SBK2-Tris-(Gd-DOTA)3-treated animals persisted at near maximal concentrations for the hour of imaging. The SBK2-Tris-(Gd-DOTA)3 agent binds specifically to PTPµ fragments present in glioma tumors [5,8]. Therefore, in this heterotopic tumor model, the retention of the agent within the tumor results from the specific in vivo binding to PTPµ fragments. Since all three contrast agents lower T1 map values to a similar extent, but differ dramatically in the period of increased Gd concentration and duration of reduced T1 map values in tumor, these data suggest that measurement of agent concentration and retention within this 30–60 min time frame is a powerful tool with which to assess specific recognition of a disease state.
Importantly, the T1 mapping technique is easily translated into evaluation of molecular imaging agents using conventional clinical scanners. We hypothesize that the increased retention of SBK2-Tris-(Gd-DOTA)3 in tumors will allow detection of smaller tumors as the sustained reduction in T1 values will provide the opportunity to acquire T1 maps at high resolution, which requires these longer acquisition times.

Acknowledgments

The authors thank Bruce S. Levison for his expert chemistry advice. We also thank Belinda Willard and Ling Li at the Cleveland Clinic Lerner Research Institute Mass Spectrometry Laboratory for Protein Sequencing for their assistance with peptide analysis. This research was supported by the grant R01 CA179956 from the National Cancer Institute (NCI) of the National Institutes of Health (NIH).

Author Contributions

Kelsey Herrmann, Mette Johansen, Jason Vincent, Michael Howell, Ying Gao, Lan Lu, Bernadette Erokwu and Richard Agnes performed the experiments; Zheng-Rong Lu, Jonathan Pokorski, James Basilion, Vikas Gulani, and Mark Griswold contributed expertise or reagents and revised the manuscript; Chris Flask and Susann Brady-Kalnay conceived and designed the experiments; and Kelsey Herrmann, Mette Johansen, Sonya Craig, Chris Flask and Susann Brady-Kalnay analyzed the data and wrote the paper.

Conflicts of Interest

The authors declare no conflict of interest.

References

  1. Upadhyay, N.; Waldman, A.D. Conventional MRI evaluation of gliomas. Br. J. Radiol. 2011, 84, S107–S111. [Google Scholar] [CrossRef] [PubMed]
  2. Kircher, M.F.; Willmann, J.K. Molecular body imaging: MR imaging, CT and US. Part I. Principles. Radiology 2012, 263, 633–643. [Google Scholar] [CrossRef] [PubMed]
  3. Louis, D.N.; Ohgaki, H.; Wiestler, O.D.; Cavenee, W.K. WHO Classification of Tumours of the Central Nervous System, 4th ed.; IARC: Lyon, France, 2007. [Google Scholar]
  4. Iacob, G.; Dinca, E.B. Current data and strategy in glioblastoma multiforme. J. Med. Life 2009, 2, 386–393. [Google Scholar] [PubMed]
  5. Burden-Gulley, S.M.; Gates, T.J.; Burgoyne, A.M.; Cutter, J.L.; Lodowski, D.T.; Robinson, S.; Sloan, A.E.; Miller, R.H.; Basilion, J.P.; Brady-Kalnay, S.M. A novel molecular diagnostic of glioblastomas: Detection of an extracellular fragment of protein tyrosine phosphatase µ. Neoplasia 2010, 12, 305–316. [Google Scholar] [CrossRef] [PubMed]
  6. Burgoyne, A.M.; Phillips-Mason, P.J.; Burden-Gulley, S.M.; Robinson, S.; Sloan, A.E.; Miller, R.H.; Brady-Kalnay, S.M. Proteolytic cleavage of protein tyrosine phosphatase mu regulates glioblastoma cell migration. Cancer Res. 2009, 69, 6960–6968. [Google Scholar] [CrossRef] [PubMed]
  7. Burden-Gulley, S.M.; Qutaish, M.Q.; Sullivant, K.E.; Tan, M.; Craig, S.E.; Basilion, J.P.; Lu, Z.R.; Wilson, D.L.; Brady-Kalnay, S.M. Single cell molecular recognition of migrating and invading tumor cells using a targeted fluorescent probe to receptor PTPmu. Int. J. Cancer 2012, 132, 1624–1632. [Google Scholar] [CrossRef] [PubMed]
  8. Burden-Gulley, S.M.; Zhou, Z.; Craig, S.E.; Lu, Z.R.; Brady-Kalnay, S.M. Molecular magnetic resonance imaging of tumors with a PTPµ targeted contrast agent. Transl. Oncol. 2013, 6, 329–337. [Google Scholar] [CrossRef] [PubMed]
  9. Zhou, Z.; Wu, X.; Kresak, A.; Griswold, M.; Lu, Z.R. Peptide targeted tripod macrocyclic Gd(III) chelates for cancer molecular MRI. Biomaterials 2013, 34, 7683–7693. [Google Scholar] [CrossRef] [PubMed]
  10. Mastarone, D.J.; Harrison, V.S.; Eckermann, A.L.; Parigi, G.; Luchinat, C.; Meade, T.J. A modular system for the synthesis of multiplexed magnetic resonance probes. J. Am. Chem. Soc. 2011, 133, 5329–5337. [Google Scholar] [CrossRef] [PubMed]
  11. Hennig, J.; Nauerth, A.; Friedburg, H. Rare imaging: A fast imaging method for clinical MR. Magn. Reson. Med. 1986, 3, 823–833. [Google Scholar] [CrossRef] [PubMed]
  12. Deichmann, R.; Haase, A. Quantification of T1 values by SNAPSHOT-FLASH NMR imaging. J. Magn. Reson. 1992, 96, 608–612. [Google Scholar] [CrossRef]
  13. Jakob, P.M.; Hillenbrand, C.M.; Wang, T.; Schultz, G.; Hahn, D.; Haase, A. Rapid quantitative lung 1H T1 mapping. J. Magn. Reson. Imaging 2001, 14, 795–799. [Google Scholar] [CrossRef] [PubMed]
  14. Ali, M.M.; Bhuiyan, M.P.; Janic, B.; Varma, N.R.; Mikkelsen, T.; Ewing, J.R.; Knight, R.A.; Pagel, M.D.; Arbab, A.S. A nano-sized paracest-fluorescence imaging contrast agent facilitates and validates in vivo CEST MRI detection of glioma. Nanomedicine 2012, 7, 1827–1837. [Google Scholar] [CrossRef] [PubMed]
  15. Maeda, H. Toward a full understanding of the EPR effect in primary and metastatic tumors as well as issues related to its heterogeneity. Adv. Drug Deliv. Rev. 2015. [Google Scholar] [CrossRef] [PubMed]
  16. Geraldes, C.F.; Laurent, S. Classification and basic properties of contrast agents for magnetic resonance imaging. Contrast Med. Mol. Imaging 2009, 4, 1–23. [Google Scholar] [CrossRef] [PubMed]
  17. Bertrand, N.; Wu, J.; Xu, X.; Kamaly, N.; Farokhzad, O.C. Cancer nanotechnology: The impact of passive and active targeting in the era of modern cancer biology. Adv. Drug Deliv. Rev. 2014, 66, 2–25. [Google Scholar] [CrossRef] [PubMed]
  18. Bae, Y.H.; Park, K. Targeted drug delivery to tumors: Myths, reality and possibility. J. Control Release 2011, 153, 198–205. [Google Scholar] [CrossRef] [PubMed]

