
Global Profile of tRNA-Derived Small RNAs in Pathological Cardiac Hypertrophy Plasma and Identification of tRF-21-NB8PLML3E as a New Hypertrophy Marker
Abstract
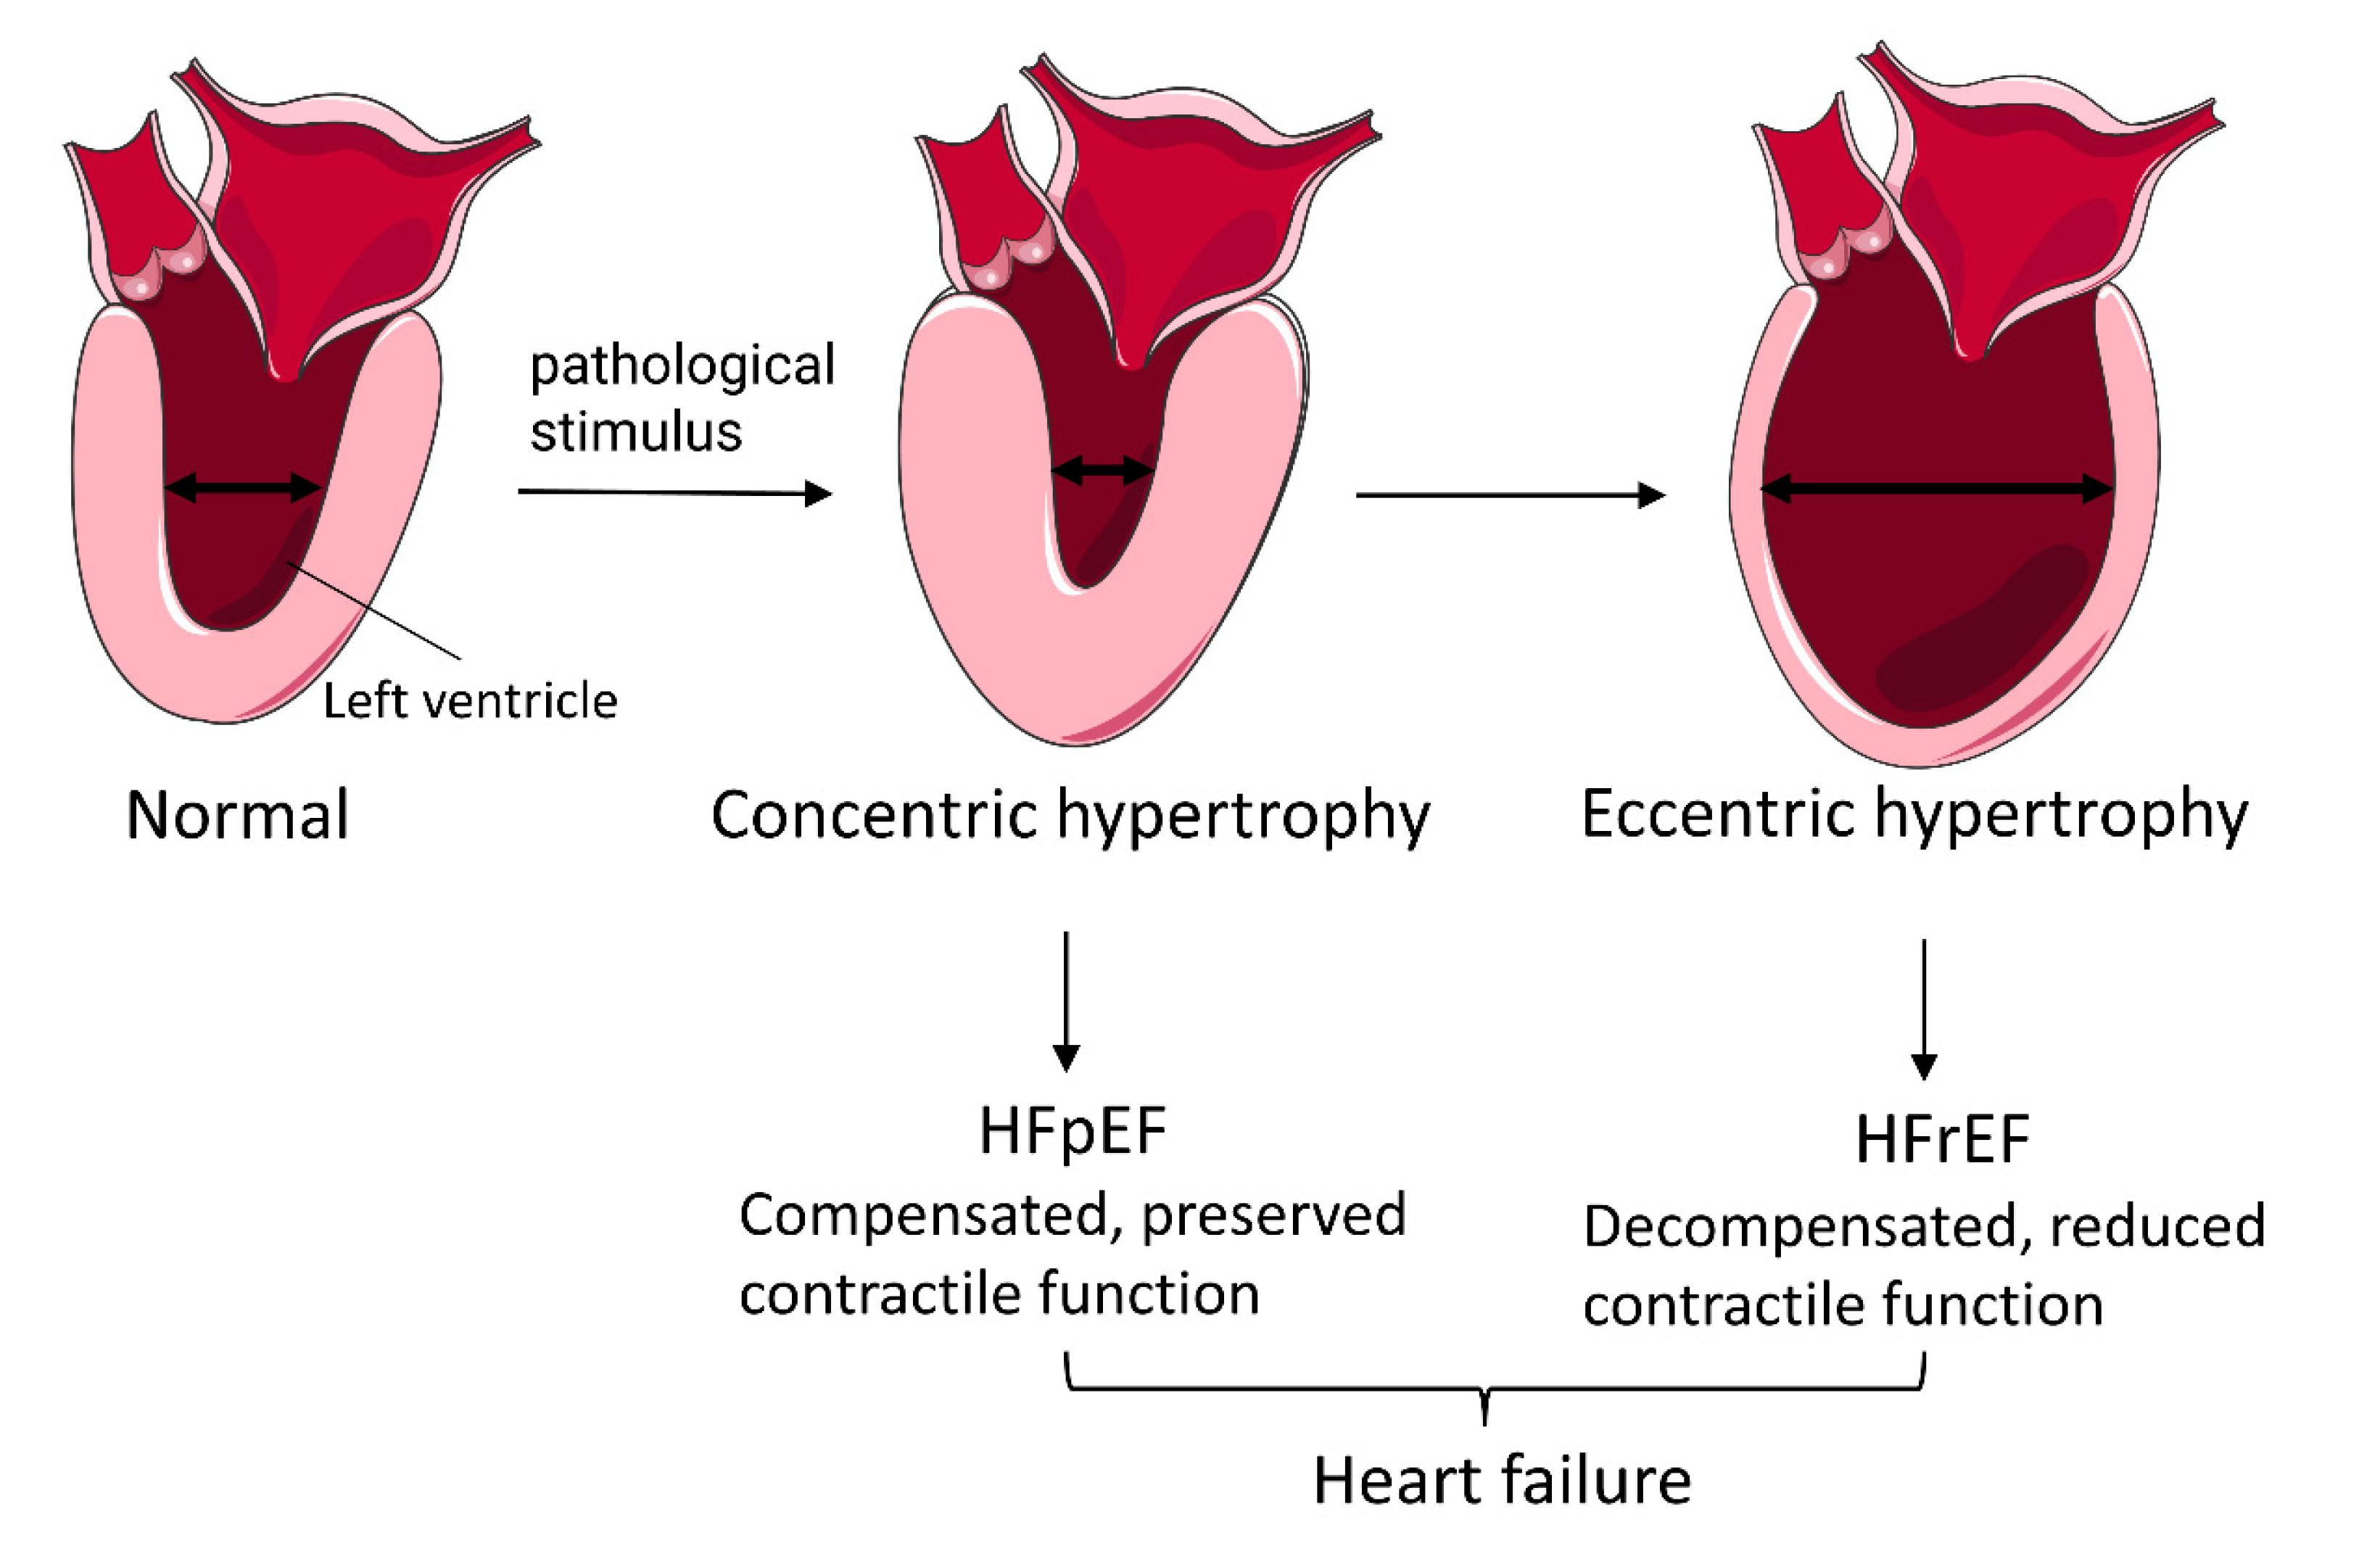
:1. Introduction
2. Materials and Methods
2.1. Clinical Samples Collection
2.2. Collection and Preparation of Plasma Samples
2.3. Library Preparation and tRFs and tiRNAs Sequencing
2.4. Data Analysis of tsRNAs
2.5. Quantitative Real-Time PCR Validation
2.6. Cell Culture and Treatment
2.7. Fluorescence Staining
2.8. Bioinformatic Analysis
2.9. Statistical Analysis
3. Results
3.1. Characteristics of PCH Patients and Healthy Subjects
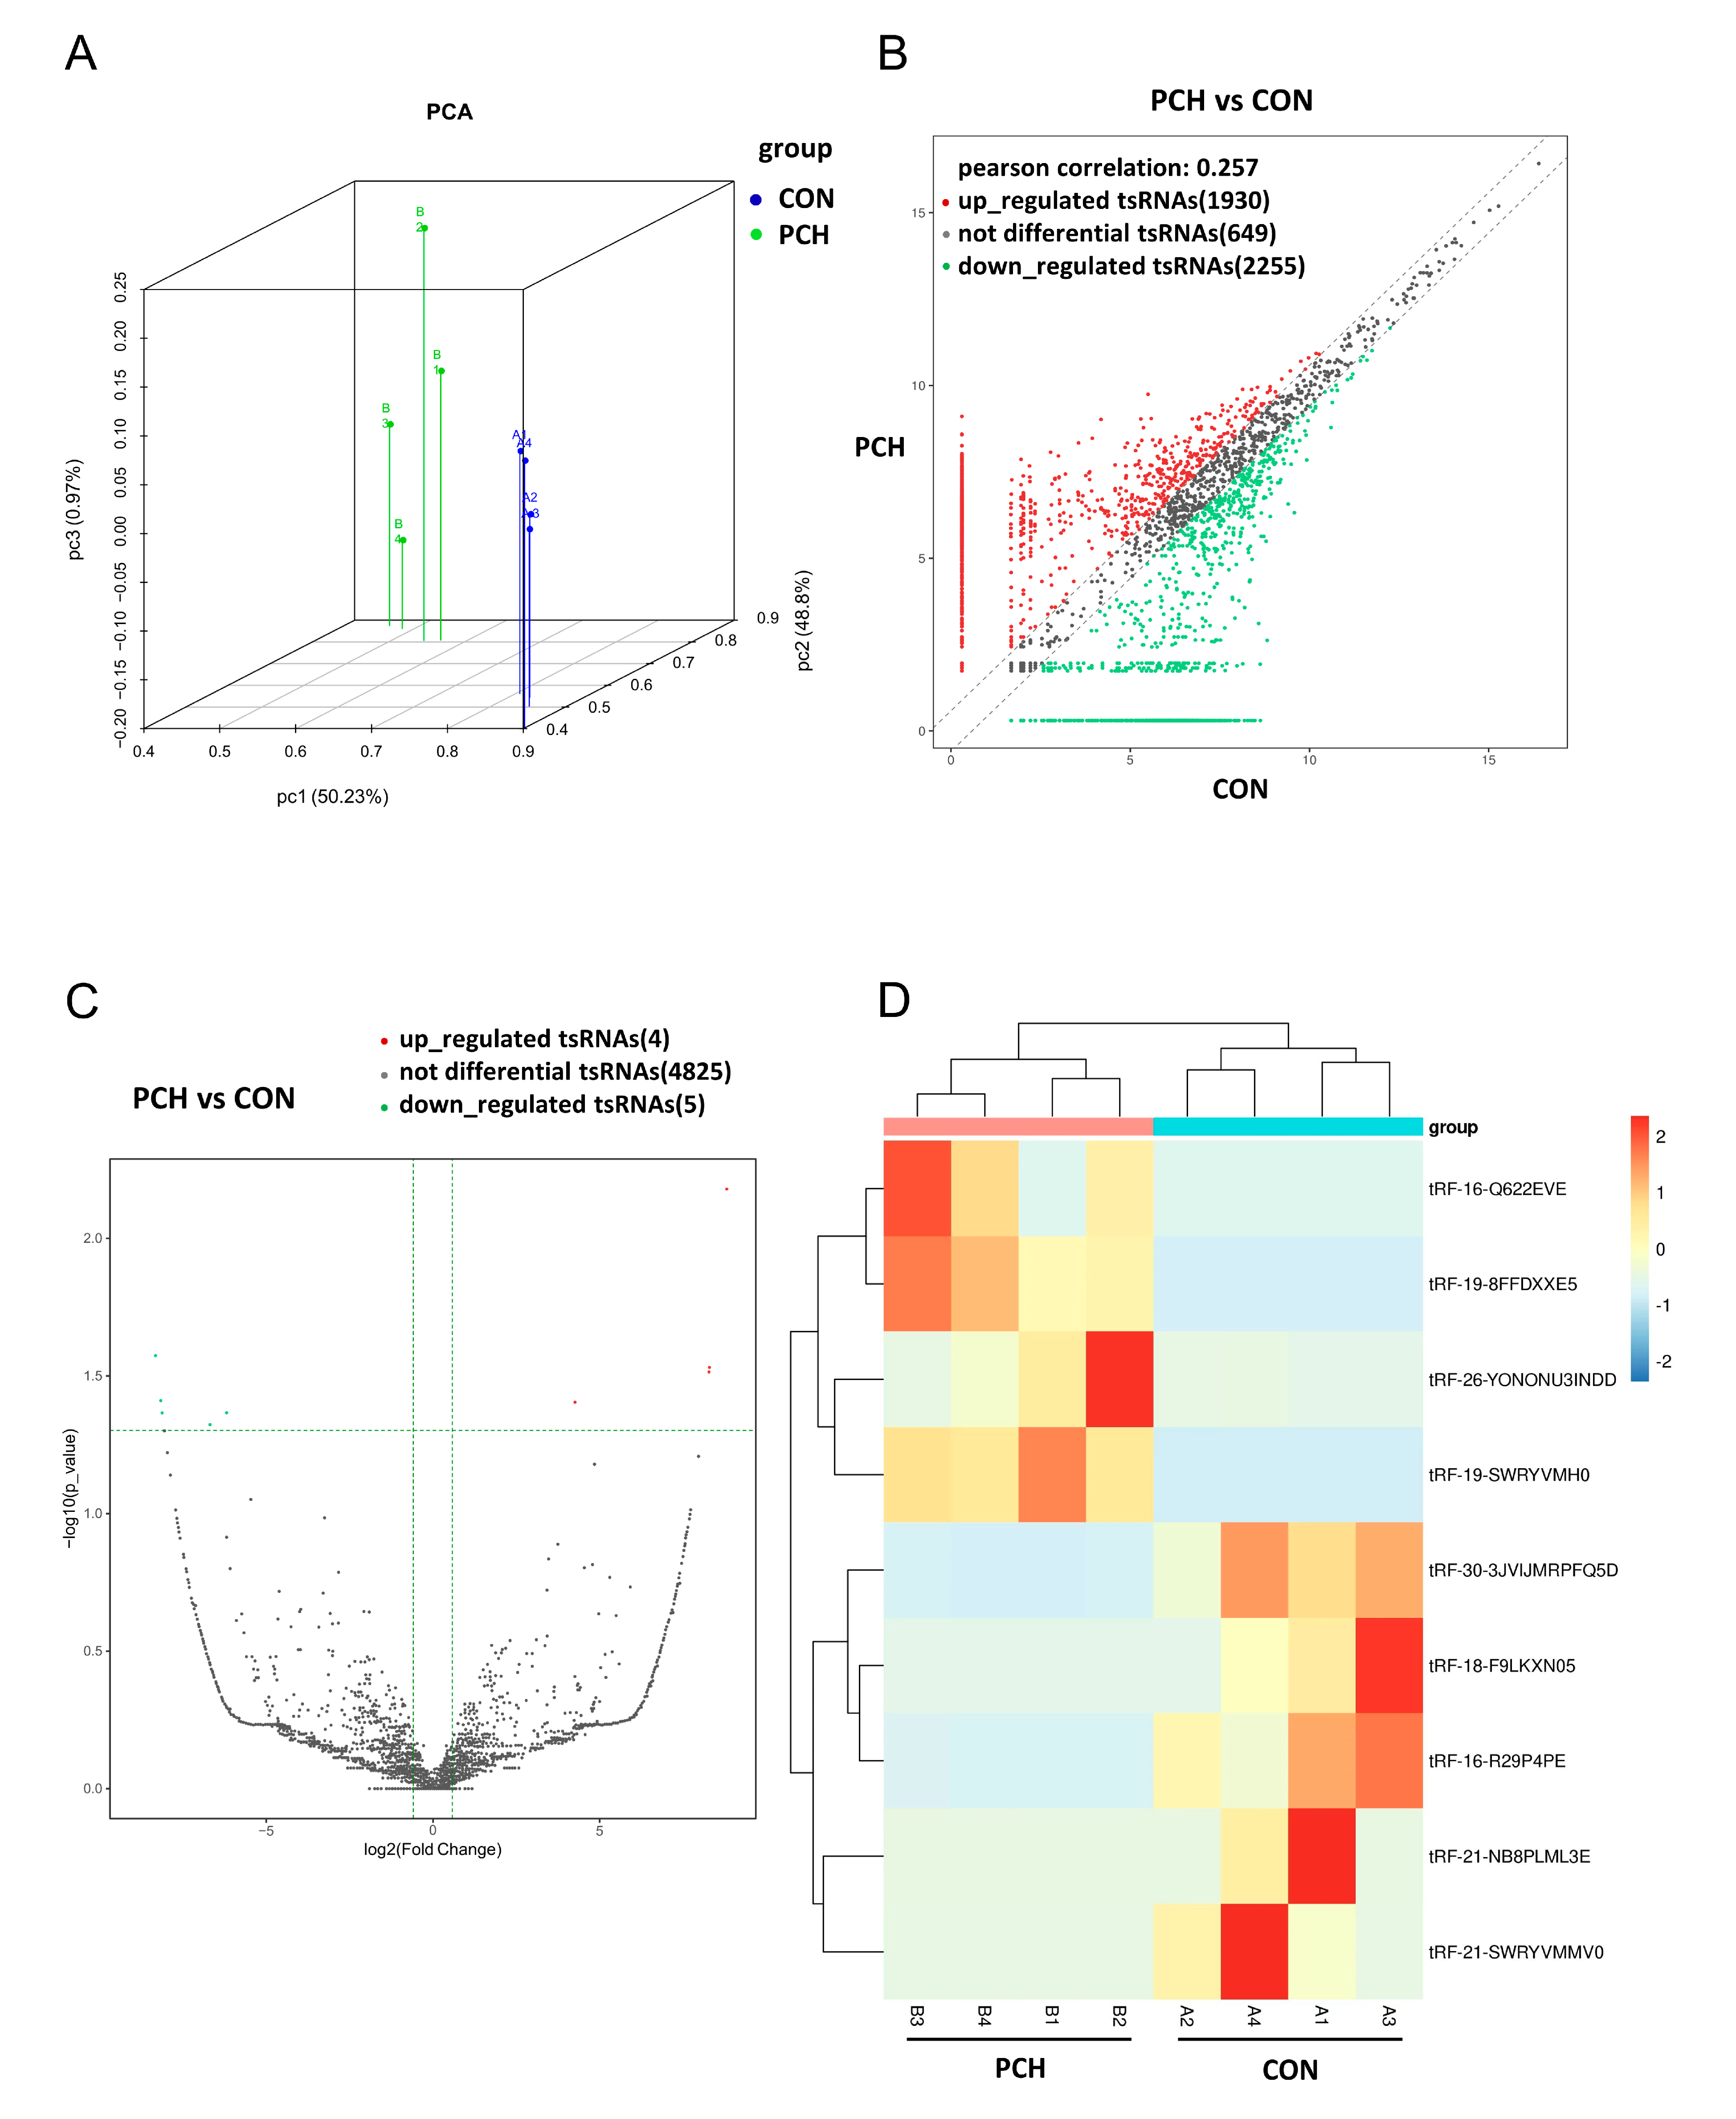
3.2. Overview Expression of tsRNAs in PCH and Control Groups
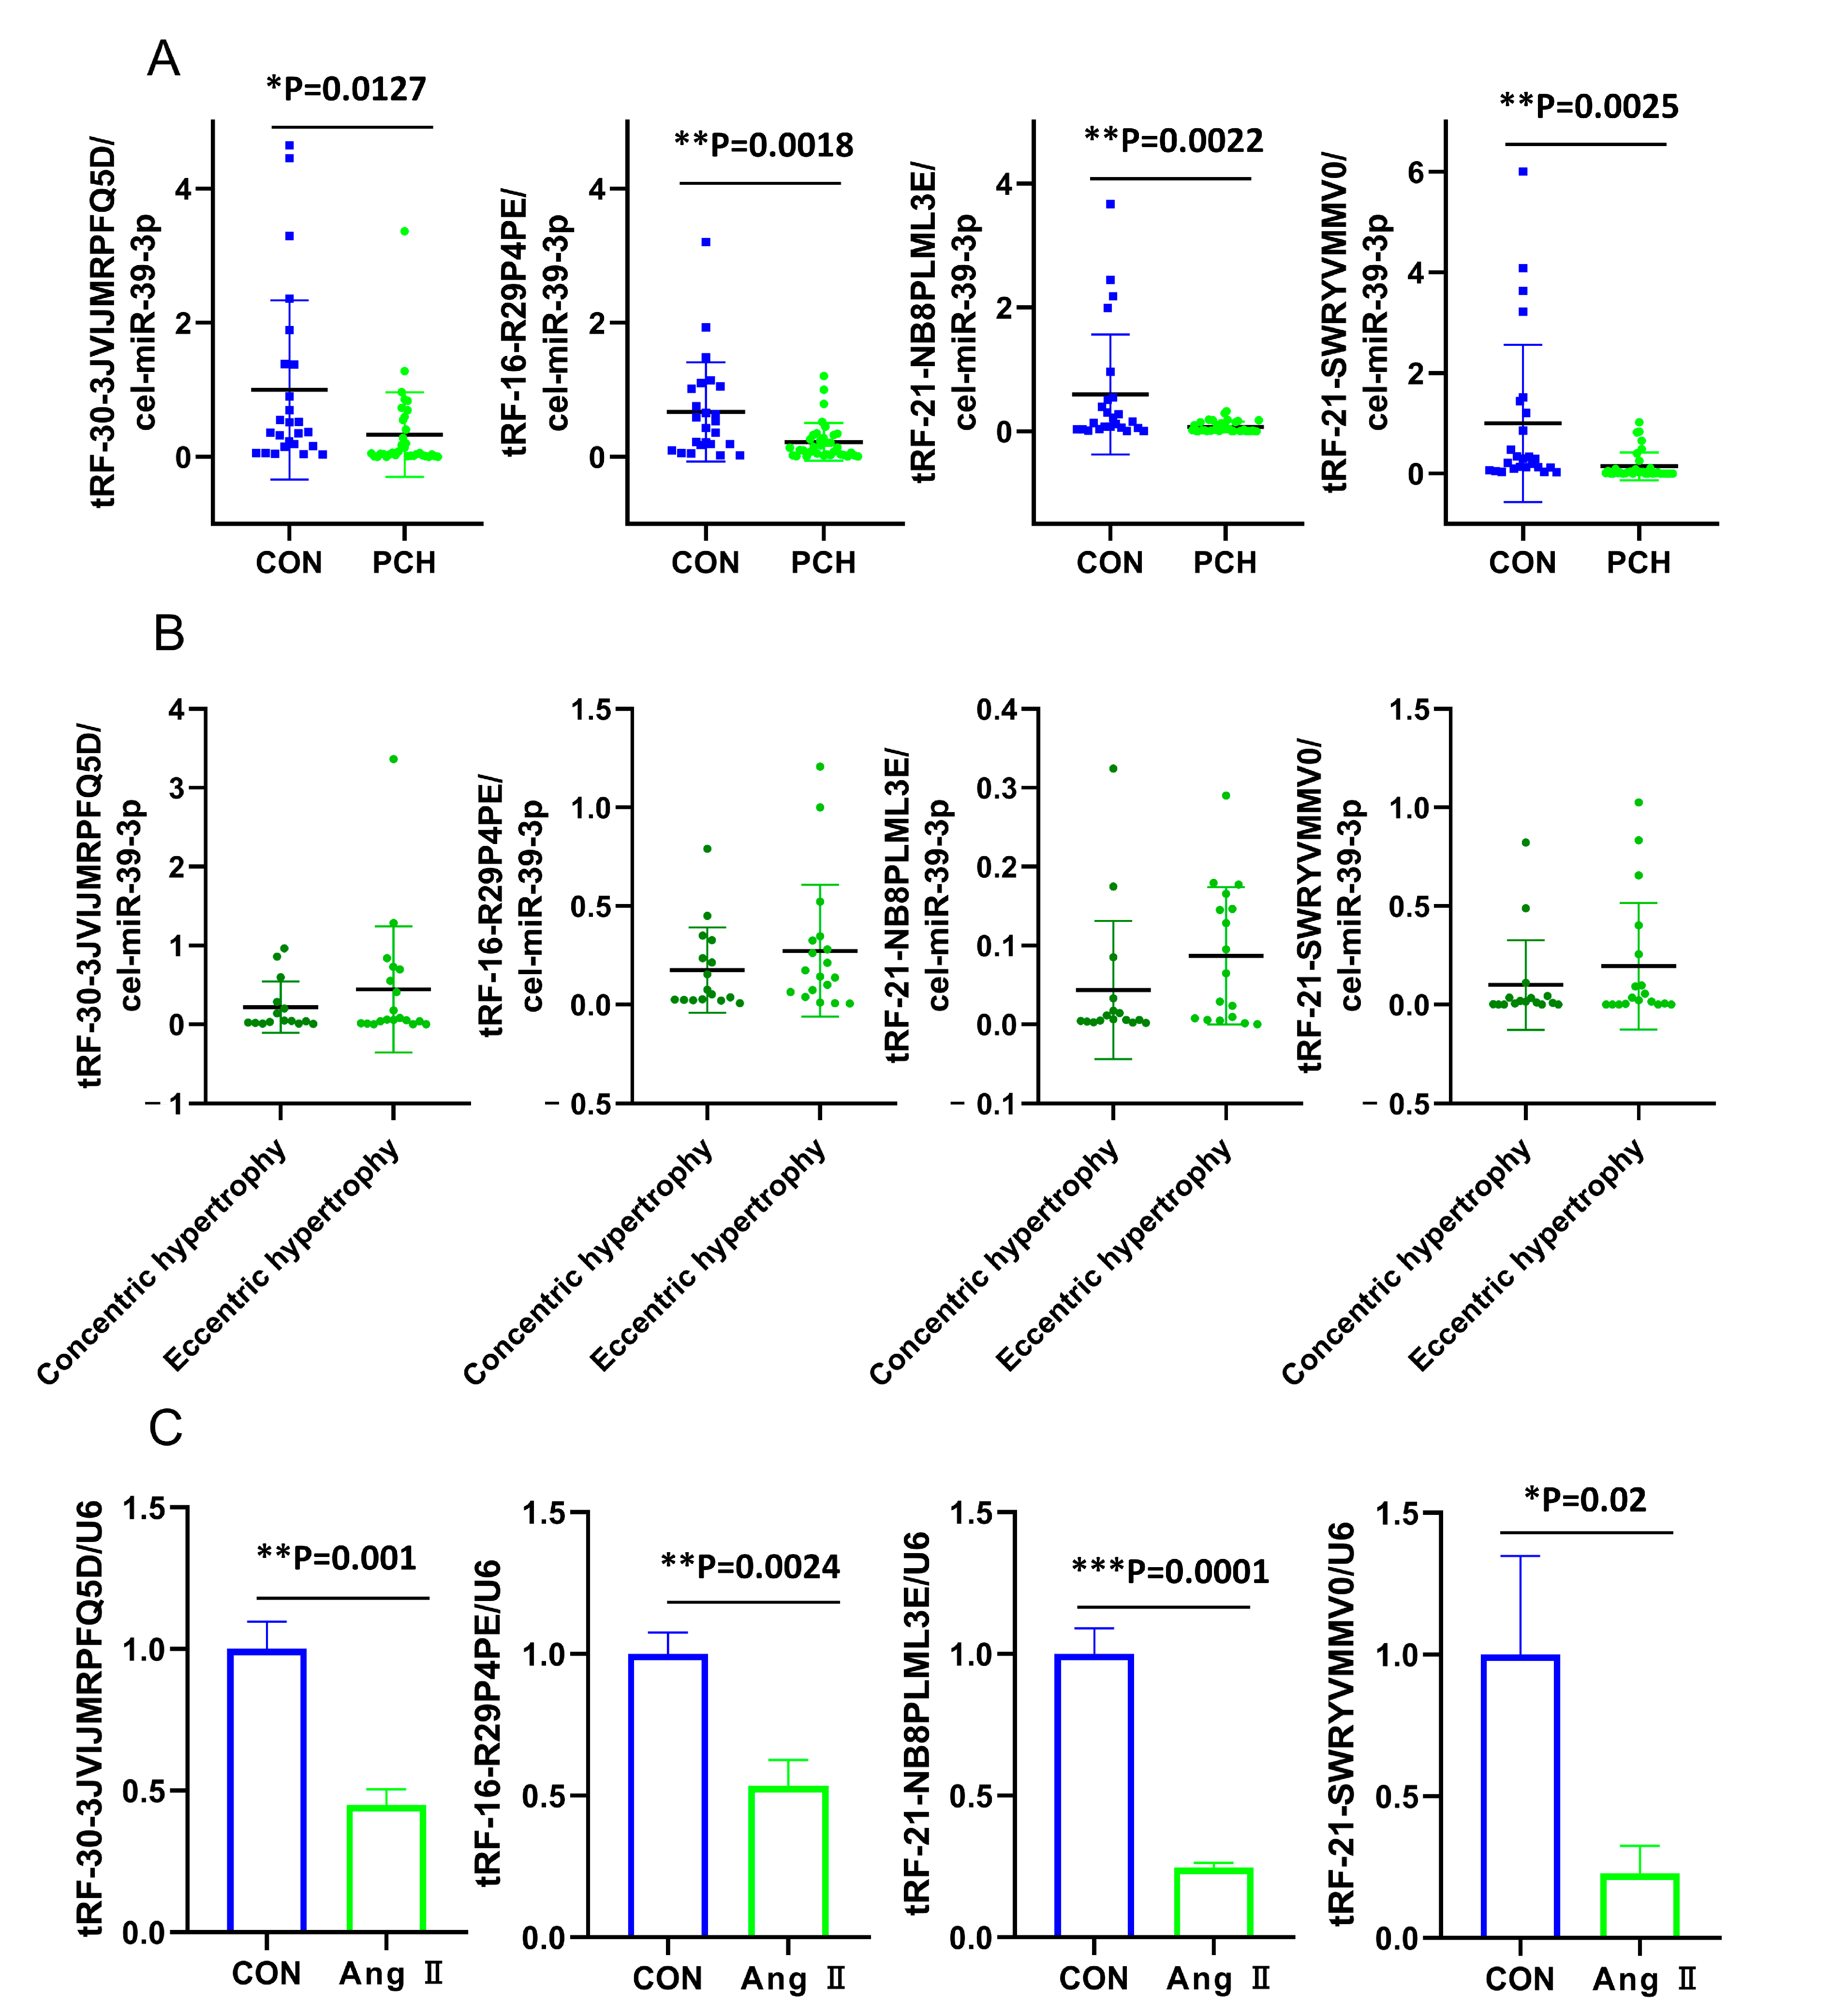
3.3. Validation for the Differentially Dysregulated Expression of tsRNAs
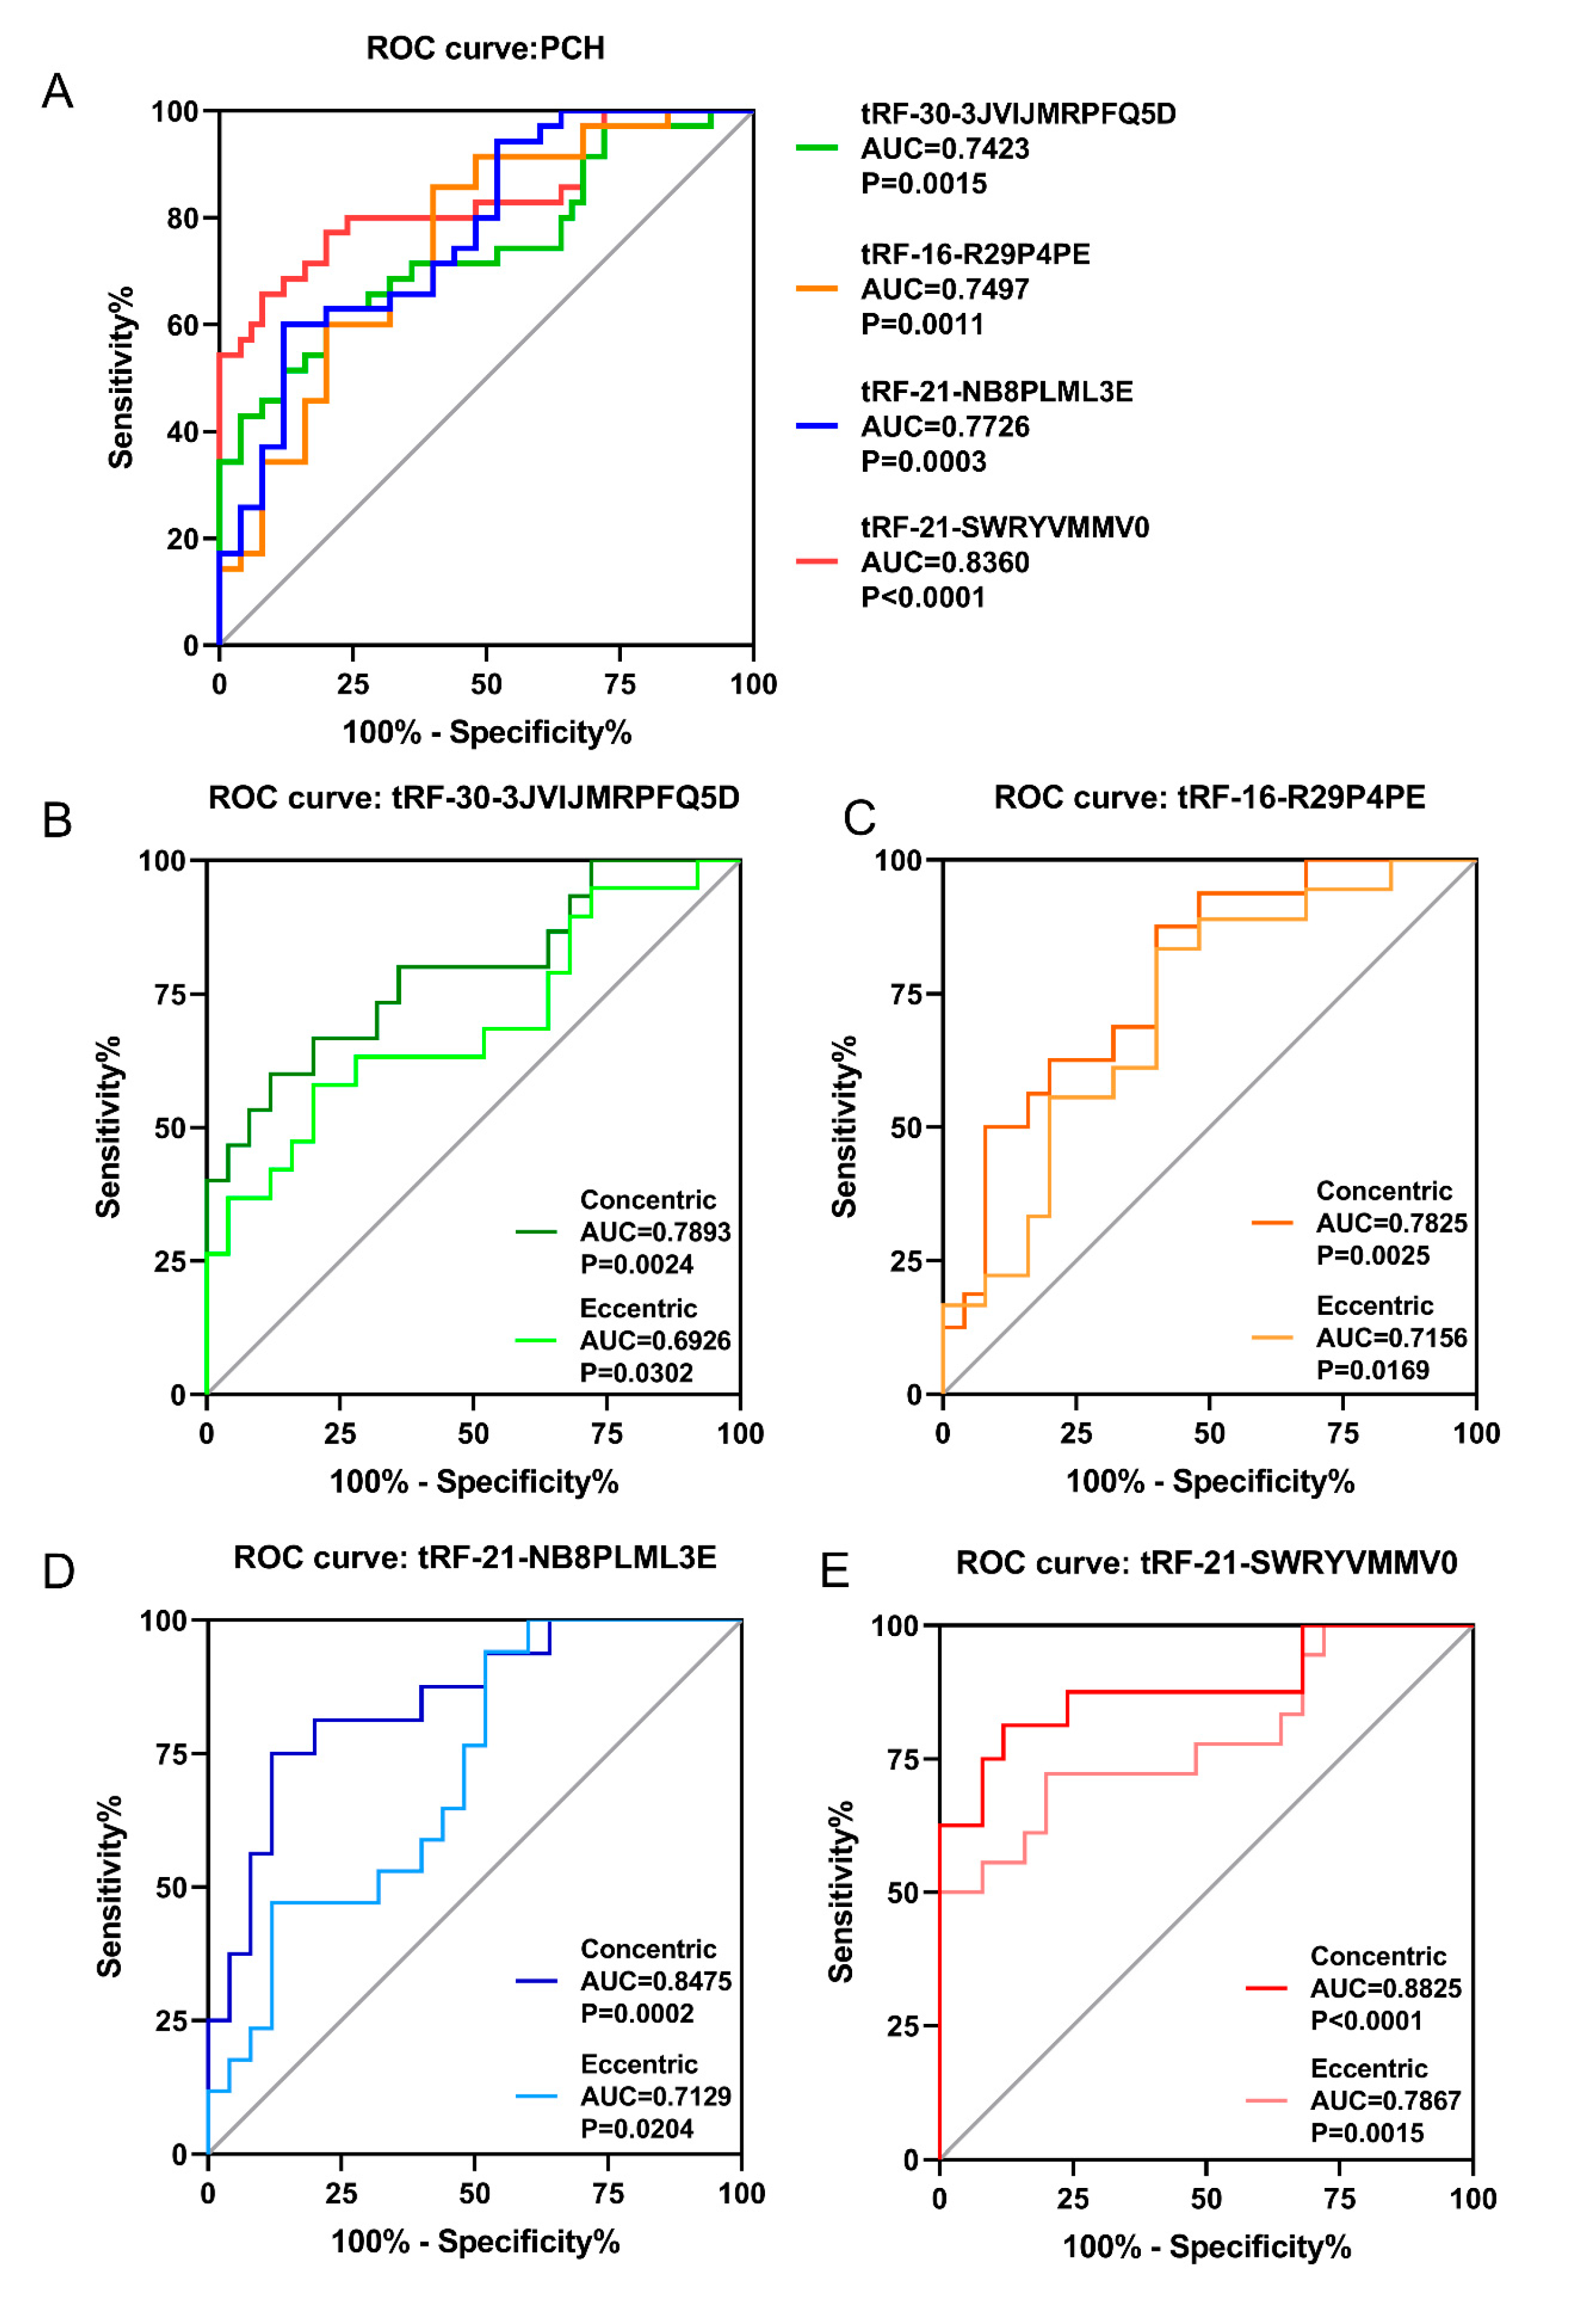
3.4. ROC Analysis of Validated tsRNAs in PCH Patients
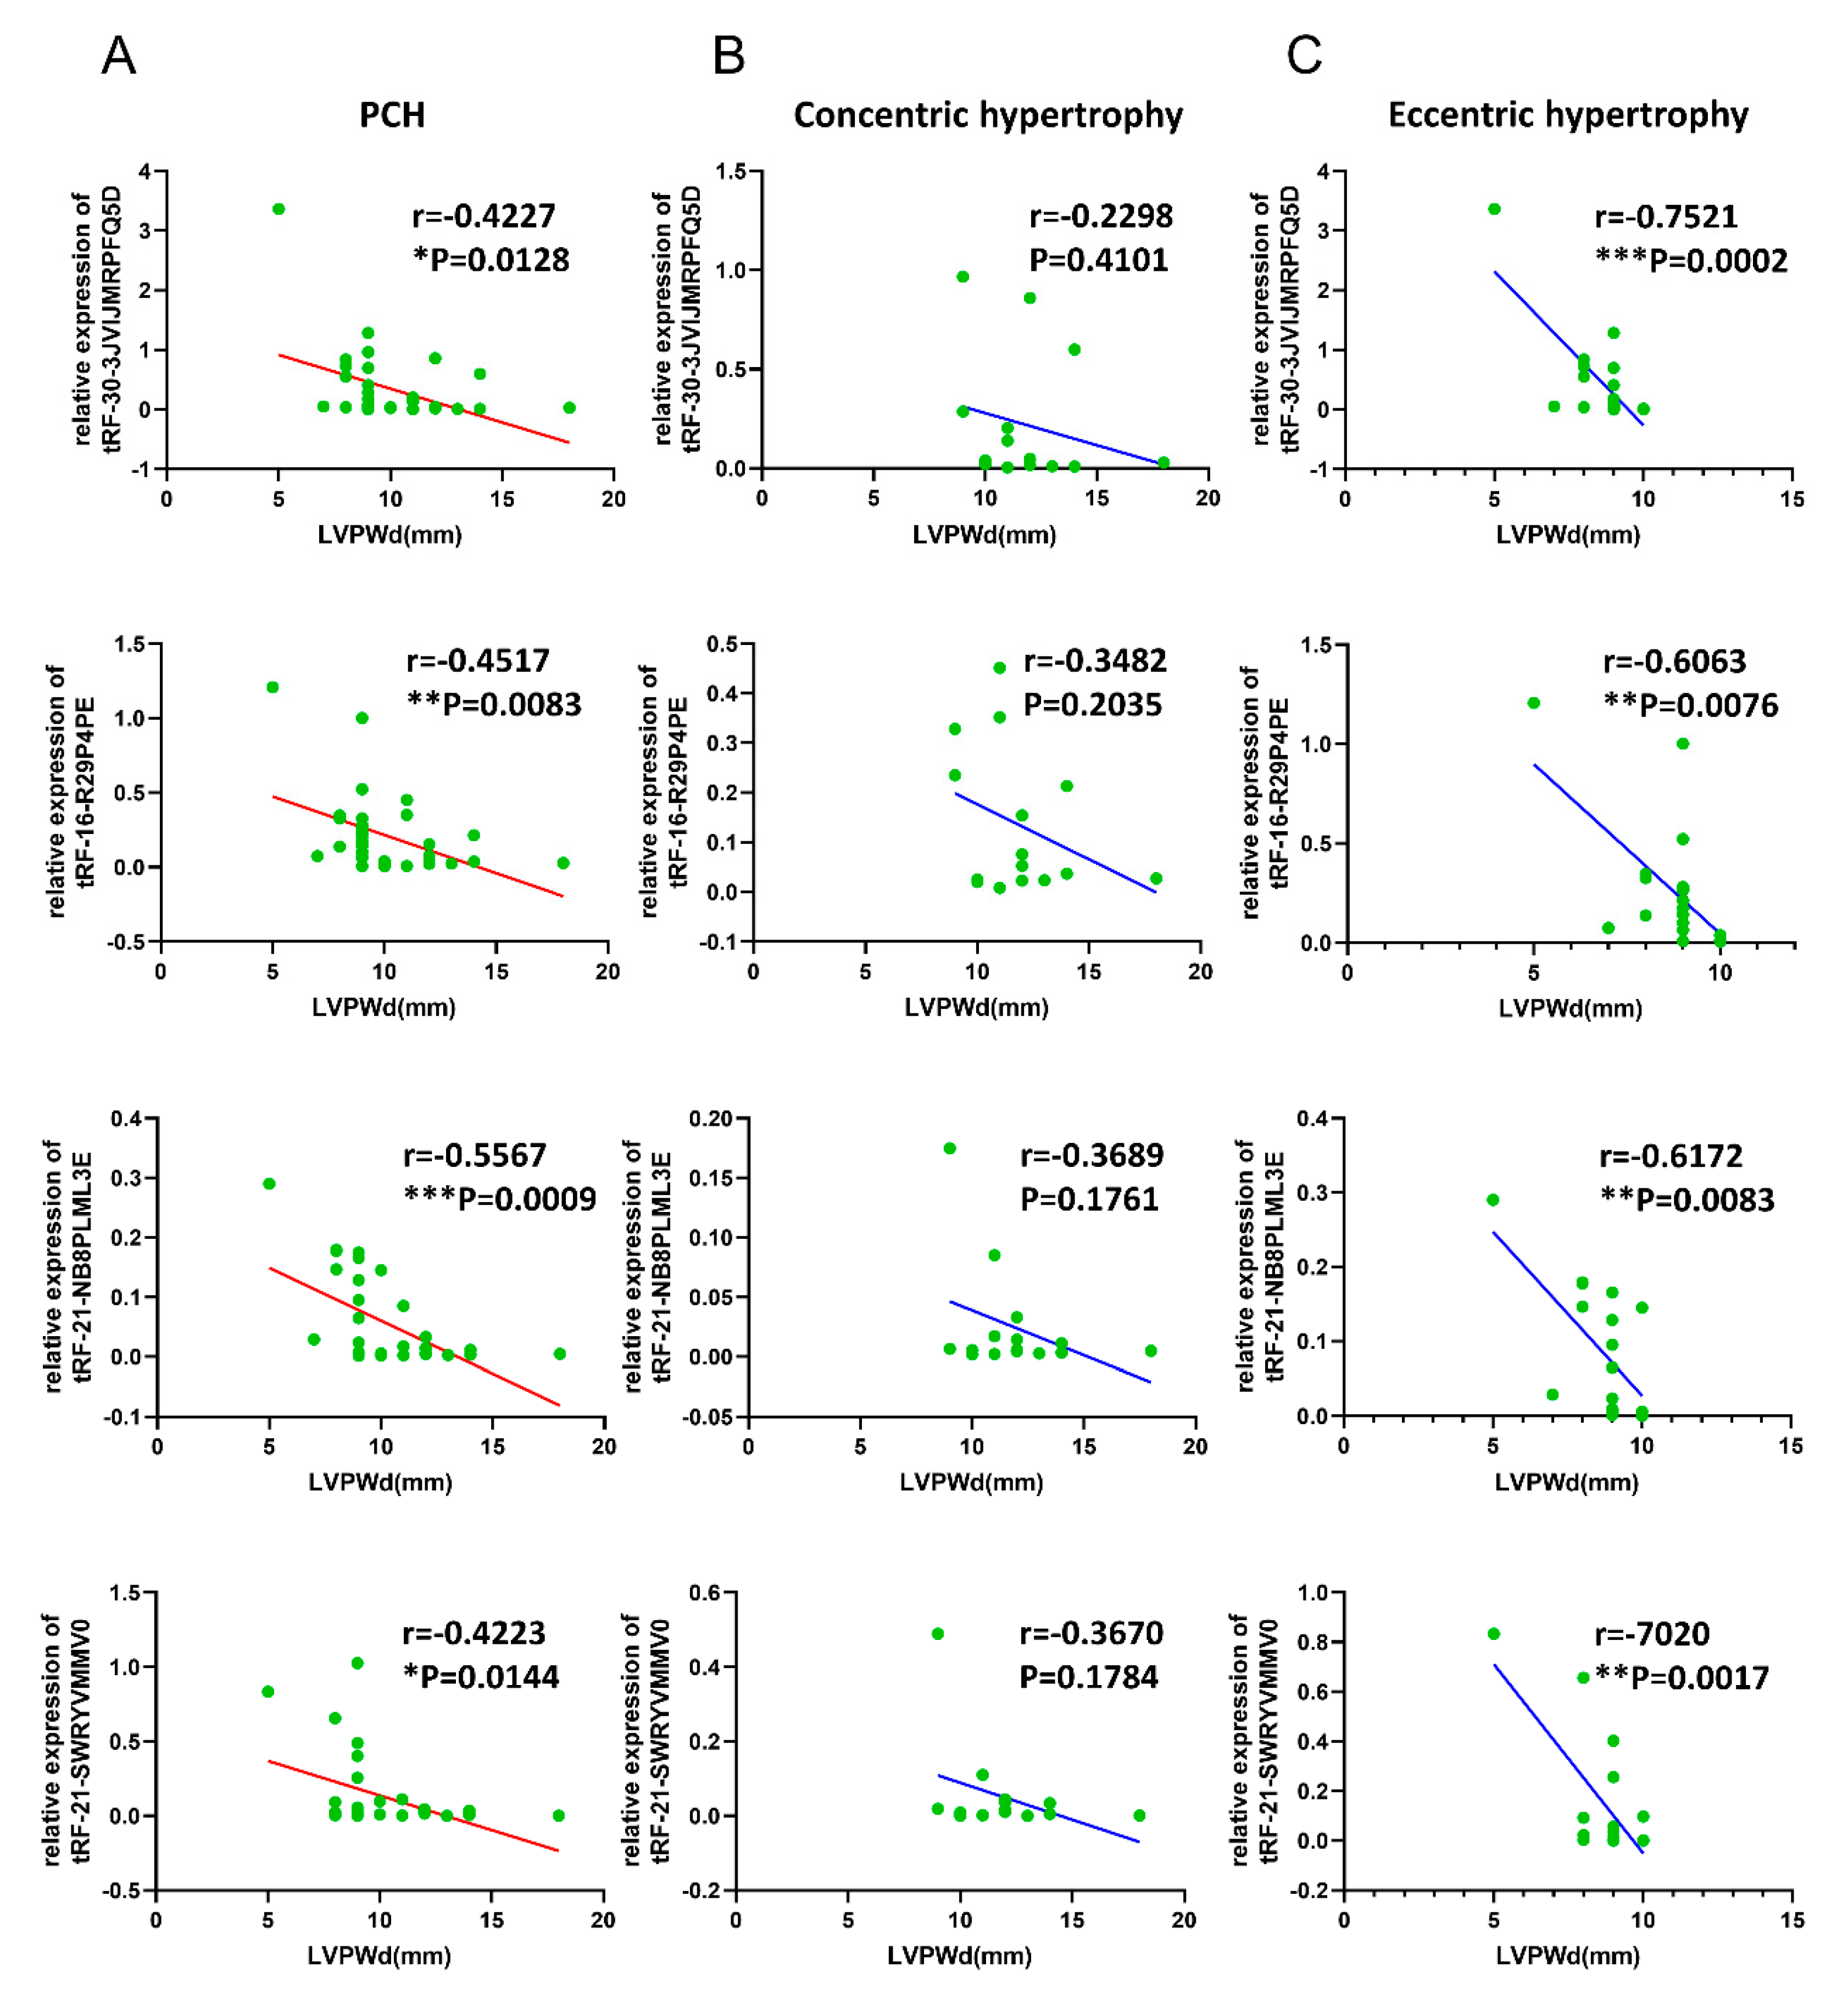
3.5. Correlations of Validated tsRNAs Expression with Disease Phenotypes in PCH Patients
3.6. Effects of tRF-21-NB8PLML3E in Ang II-stimulated H9c2 Cells
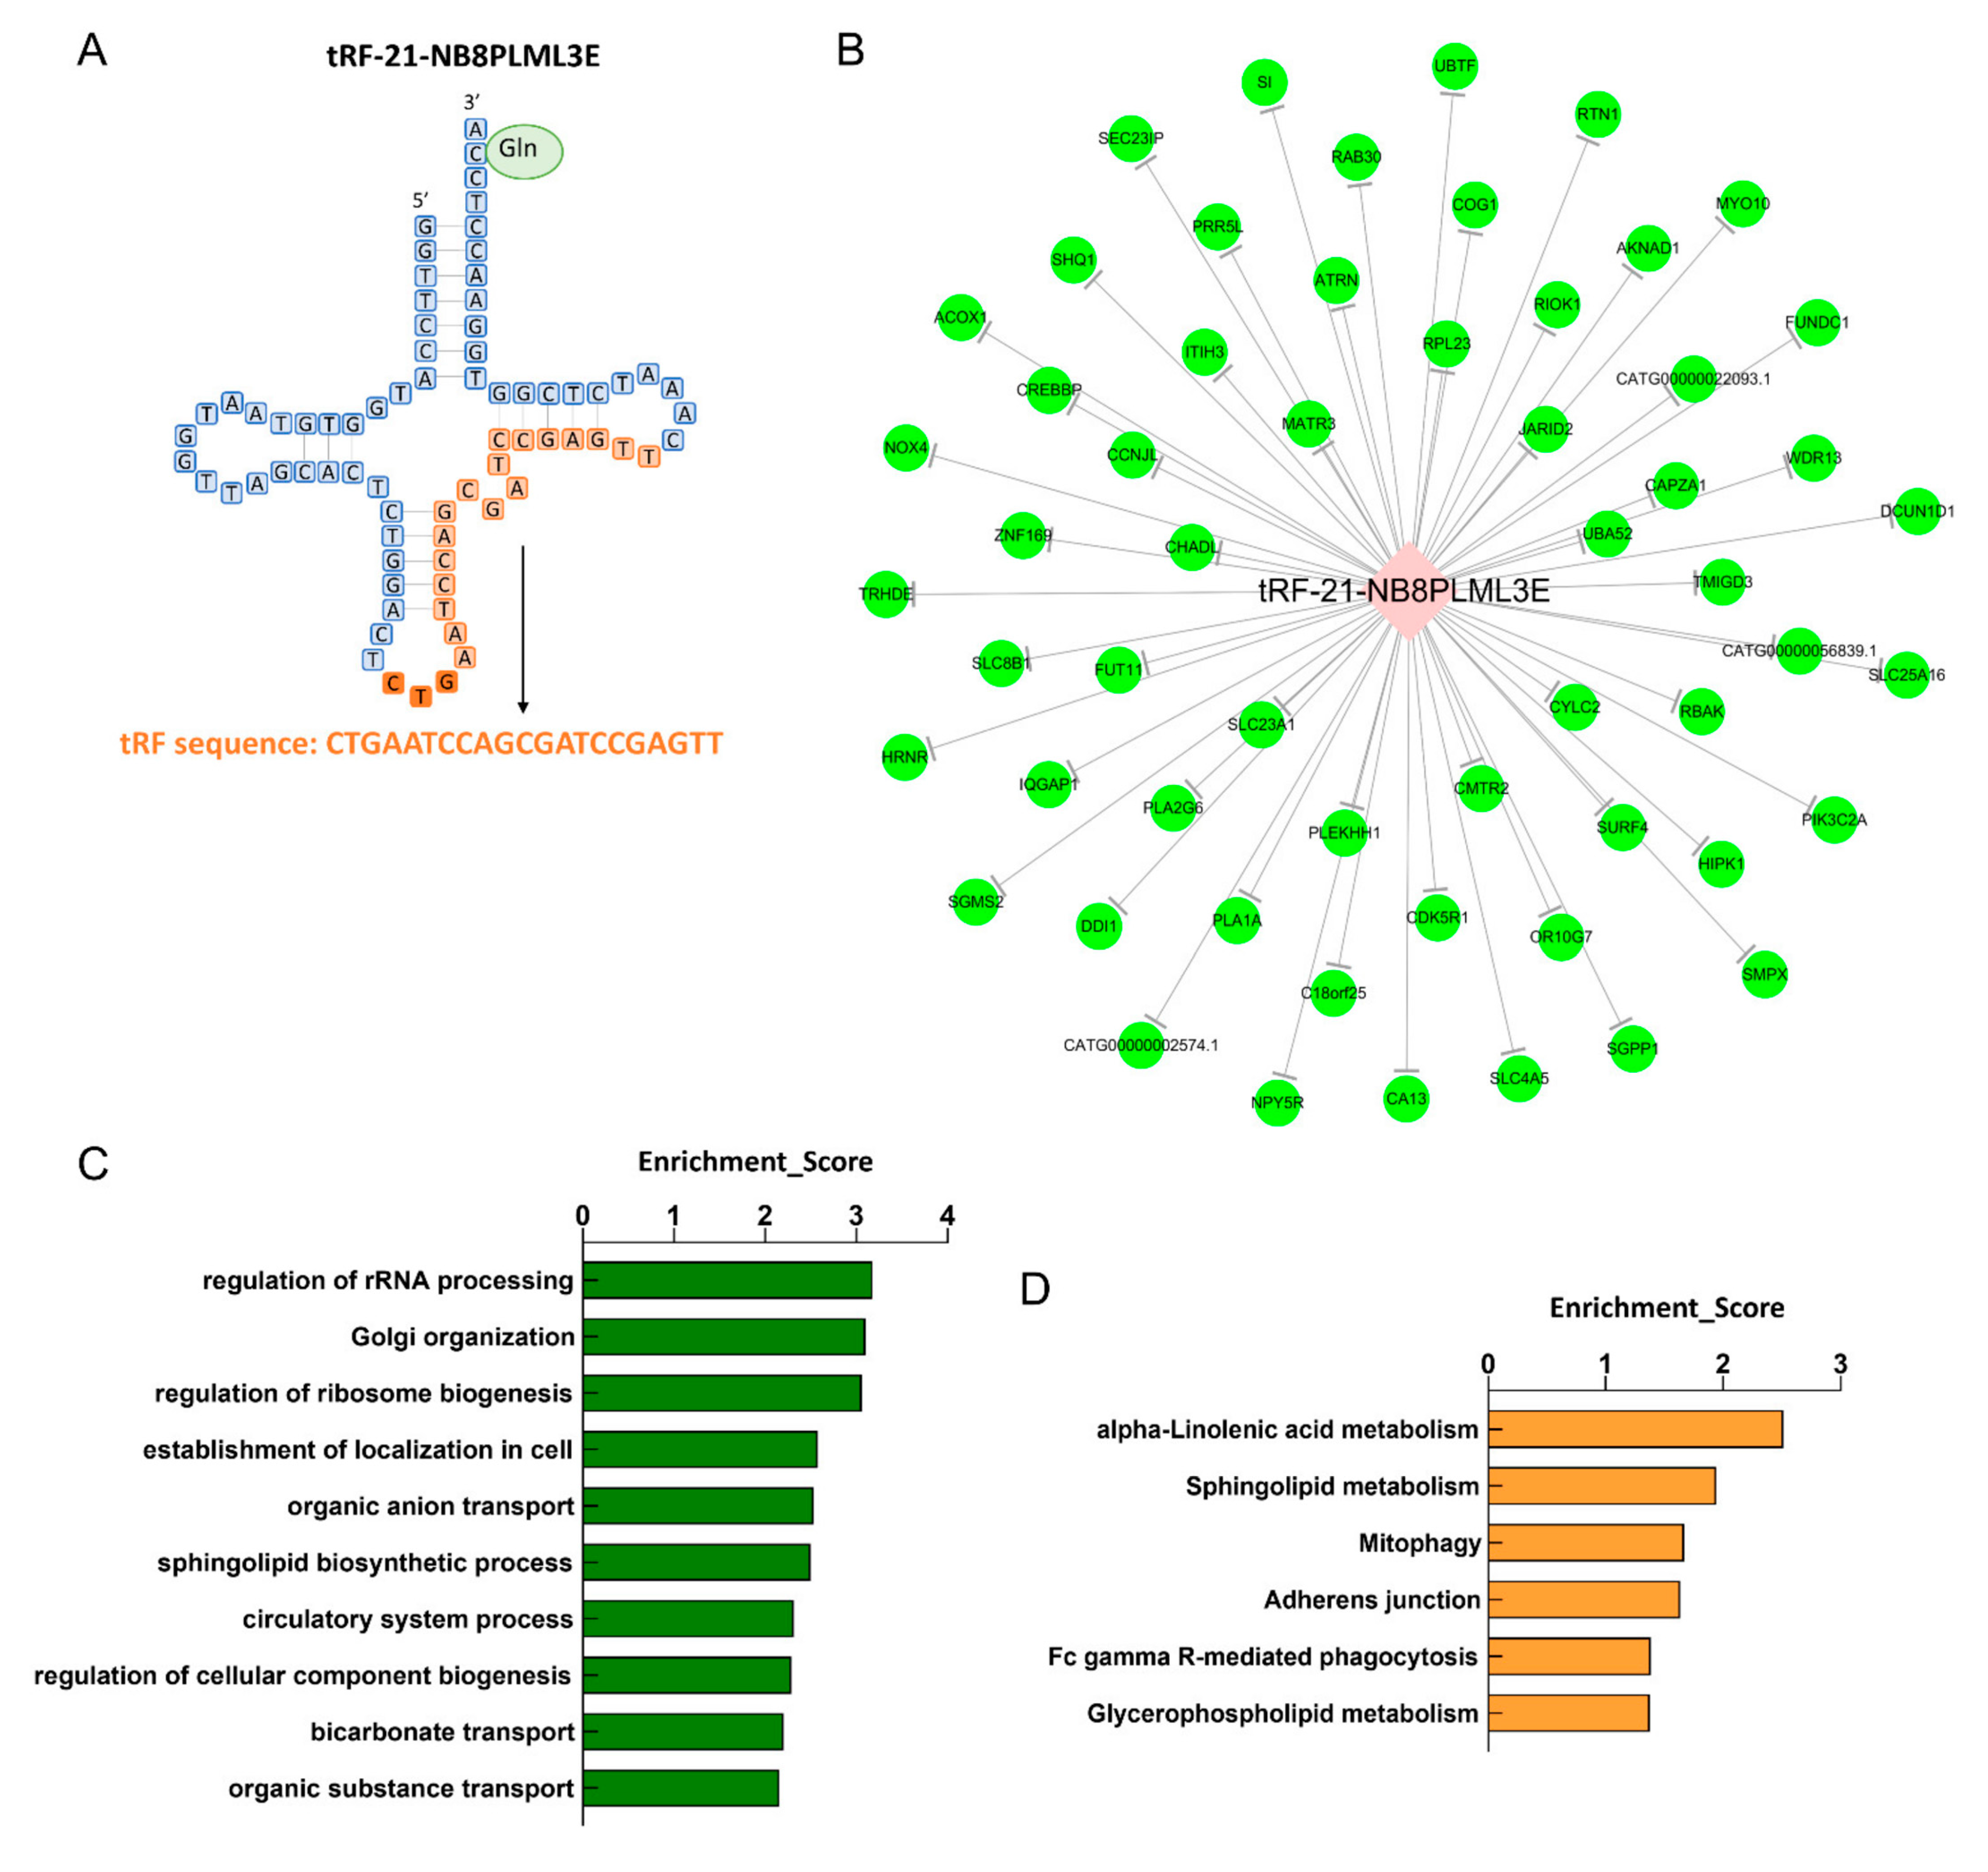
3.7. Biological Information Function Analysis of tsRNAs
4. Discussion
Study Limitations
5. Conclusions
Supplementary Materials
Author Contributions
Funding
Institutional Review Board Statement
Informed Consent Statement
Data Availability Statement
Acknowledgments
Conflicts of Interest
References
- Frey, N.; Olson, E. Cardiac hypertrophy: The good, the bad, and the ugly. Annu. Rev. Physiol. 2003, 65, 45–79. [Google Scholar] [CrossRef] [PubMed]
- Schirone, L.; Forte, M.; Palmerio, S.; Yee, D.; Nocella, C.; Angelini, F.; Pagano, F.; Schiavon, S.; Bordin, A.; Carrizzo, A.; et al. A review of the molecular mechanisms underlying the development and progression of cardiac remodeling. Oxidative Med. Cell. Longev. 2017, 2017, 3920195. [Google Scholar] [CrossRef] [PubMed]
- Nakamura, M.; Sadoshima, J. Mechanisms of physiological and pathological cardiac hypertrophy. Nat. Rev. Cardiol. 2018, 15, 387–407. [Google Scholar] [CrossRef] [PubMed]
- Lu, P.; Ding, F.; Xiang, Y.K.; Hao, L.; Zhao, M. Noncoding RNAs in cardiac hypertrophy and heart failure. Cells 2022, 11, 777. [Google Scholar] [CrossRef] [PubMed]
- Lin, X.; Zhang, L.; Zhang, W.; Lei, X.; Lu, Q.; Ma, A. Circular RNA circ_0001006 aggravates cardiac hypertrophy via miR-214-3p/PAK6 axis. Aging 2022, 14, 2210–2220. [Google Scholar] [CrossRef]
- Jusic, A.; Thomas, P.B.; Wettinger, S.B.; Dogan, S.; Farrugia, R.; Gaetano, C.; Tuna, B.G.; Pinet, F.; Robinson, E.L.; Tual-Chalot, S.; et al. Noncoding RNAs in age-related cardiovascular diseases. Ageing Res. Rev. 2022, 77, 101610. [Google Scholar] [CrossRef]
- Kwon, N.H.; Lee, J.Y.; Kim, S. Role of tRNAs in breast cancer regulation. Adv. Exp. Med. Biol. 2021, 1187, 121–145. [Google Scholar]
- Shen, Y.; Yu, X.; Zhu, L.; Li, T.; Yan, Z.; Guo, J. Transfer RNA-derived fragments and tRNA halves: Biogenesis, biological functions and their roles in diseases. J. Mol. Med. 2018, 96, 1167–1176. [Google Scholar] [CrossRef]
- Lee, Y.S.; Shibata, Y.; Malhotra, A.; Dutta, A. A novel class of small RNAs: tRNA-derived RNA fragments (tRFs). Genes Dev. 2009, 23, 2639–2649. [Google Scholar] [CrossRef] [Green Version]
- Chen, H.; Xu, Z.; Liu, D. Small non-coding RNA and colorectal cancer. J. Cell. Mol. Med. 2019, 23, 3050–3057. [Google Scholar] [CrossRef]
- Li, S.; Xu, Z.; Sheng, J. tRNA-derived small RNA: A novel regulatory small non-coding RNA. Genes 2018, 9, 246. [Google Scholar] [CrossRef] [Green Version]
- Kumar, P.; Kuscu, C.; Dutta, A. Biogenesis and function of transfer RNA-related fragments (tRFs). Trends Biochem. Sci. 2016, 41, 679–689. [Google Scholar] [CrossRef] [Green Version]
- Kim, H.K.; Fuchs, G.; Wang, S.; Wei, W.; Zhang, Y.; Park, H.; Roy-Chaudhuri, B.; Li, P.; Xu, J.; Chu, K.; et al. A transfer-RNA-derived small RNA regulates ribosome biogenesis. Nature 2017, 552, 57–62. [Google Scholar] [CrossRef]
- Zheng, L.L.; Xu, W.L.; Liu, S.; Sun, W.J.; Li, J.H.; Wu, J.; Yang, J.H.; Qu, L.H. tRF2Cancer: A web server to detect tRNA-derived small RNA fragments (tRFs) and their expression in multiple cancers. Nucleic Acids Res. 2016, 44, W185–W193. [Google Scholar] [CrossRef]
- Xiao, L.; Wang, J.; Ju, S.; Cui, M.; Jing, R. Disorders and roles of tsRNA, snoRNA, snRNA and piRNA in cancer. J. Med Genet. 2022, 59, 623–631. [Google Scholar] [CrossRef]
- Peng, G.; Sun, Q.; Chen, Y.; Wu, X.; Guo, Y.; Ji, H.; Yang, F.; Dong, W. A comprehensive overview of ovarian small non-coding RNAs in the late overwintering and breeding periods of Onychostoma macrolepis. Comp. Biochem. Physiol. Part D Genom. Proteom. 2022, 42, 100967. [Google Scholar] [CrossRef]
- Peng, R.; Santos, H.J.; Nozaki, T. Transfer RNA-derived small RNAs in the pathogenesis of parasitic protozoa. Genes 2022, 13, 286. [Google Scholar] [CrossRef]
- Guzzi, N.; Cieśla, M.; Ngoc, P.C.T.; Lang, S.; Arora, S.; Dimitriou, M.; Pimková, K.; Sommarin, M.N.; Munita, R.; Lubas, M.; et al. Pseudouridylation of tRNA-derived fragments steers translational control in stem cells. Cell 2018, 173, 1204–1216.e26. [Google Scholar] [CrossRef] [Green Version]
- Zhong, F.; Hu, Z.; Jiang, K.; Lei, B.; Wu, Z.; Yuan, G.; Luo, H.; Dong, C.; Tang, B.; Zheng, C.; et al. Complement C3 activation regulates the production of tRNA-derived fragments Gly-tRFs and promotes alcohol-induced liver injury and steatosis. Cell Res. 2019, 29, 548–561. [Google Scholar] [CrossRef] [Green Version]
- Chen, Q.; Zhang, X.; Shi, J.; Yan, M.; Zhou, T. Origins and evolving functionalities of tRNA-derived small RNAs. Trends Biochem. Sci. 2021, 46, 790–804. [Google Scholar] [CrossRef]
- Godoy, P.M.; Bhakta, N.R.; Barczak, A.J.; Cakmak, H.; Fisher, S.; MacKenzie, T.C.; Patel, T.; Price, R.W.; Smith, J.F.; Woodruff, P.G.; et al. Large differences in small RNA composition between human biofluids. Cell Rep. 2018, 25, 1346–1358. [Google Scholar] [CrossRef] [PubMed] [Green Version]
- Zhang, Y.; Zhang, Y.; Shi, J.; Zhang, H.; Cao, Z.; Gao, X.; Ren, W.; Ning, Y.; Ning, L.; Cao, Y.; et al. Identification and characterization of an ancient class of small RNAs enriched in serum associating with active infection. J. Mol. Cell Biol. 2014, 6, 172–174. [Google Scholar] [CrossRef] [PubMed] [Green Version]
- Zhu, C.; Sun, B.; Nie, A.; Zhou, Z. The tRNA-associated dysregulation in immune responses and immune diseases. Acta Physiol. 2020, 228, e13391. [Google Scholar] [CrossRef] [PubMed]
- Zong, T.; Yang, Y.; Lin, X.; Jiang, S.; Zhao, H.; Liu, M.; Meng, Y.; Li, Y.; Zhao, L.; Tang, G.; et al. 5’-tiRNA-Cys-GCA regulates VSMC proliferation and phenotypic transition by targeting STAT4 in aortic dissection. Mol. Ther. Nucleic Acids 2021, 26, 295–306. [Google Scholar] [CrossRef]
- Zhu, X.L.; Li, T.; Cao, Y.; Yao, Q.P.; Liu, X.; Li, Y.; Guan, Y.Y.; Deng, J.J.; Jiang, R.; Jiang, J.; et al. tRNA-derived fragments tRF(GlnCTG) induced by arterial injury promote vascular smooth muscle cell proliferation. Mol. Ther. Nucleic Acids 2021, 23, 603–613. [Google Scholar] [CrossRef]
- Wang, J.; Han, B.; Yi, Y.; Wang, Y.; Zhang, L.; Jia, H.; Lv, J.; Yang, X.; Jiang, D.; Zhang, J.; et al. Expression profiles and functional analysis of plasma tRNA-derived small RNAs in children with fulminant myocarditis. Epigenomics 2021, 13, 1057–1075. [Google Scholar] [CrossRef]
- Kumar, P.; Anaya, J.; Mudunuri, S.B.; Dutta, A. Meta-analysis of tRNA derived RNA fragments reveals that they are evolutionarily conserved and associate with AGO proteins to recognize specific RNA targets. BMC Biol. 2014, 12, 78. [Google Scholar] [CrossRef]
- Schorn, A.J.; Gutbrod, M.J.; LeBlanc, C.; Martienssen, R. LTR-retrotransposon control by tRNA-derived small RNAs. Cell 2017, 170, 61–71.e11. [Google Scholar] [CrossRef] [Green Version]
- Osaka, N.; Mori, Y.; Terasaki, M.; Hiromura, M.; Saito, T.; Yashima, H.; Shiraga, Y.; Kawakami, R.; Ohara, M.; Fukui, T.; et al. Luseogliflozin inhibits high glucose-induced TGF-beta2 expression in mouse cardiomyocytes by suppressing NHE-1 activity. J. Int. Med. Res. 2022, 50, 3000605221097490. [Google Scholar] [CrossRef]
- Sun, W.; Zhou, Y.; Xue, H.; Hou, H.; He, G.; Yang, Q. Endoplasmic reticulum stress mediates homocysteine-induced hypertrophy of cardiac cells through activation of cyclic nucleotide phosphodiesterase 1C. Acta Biochim. Biophys. Sin. 2022, 54, 388–399. [Google Scholar] [CrossRef]
- Doenst, T.; Nguyen, T.D.; Abel, E.D. Cardiac metabolism in heart failure: Implications beyond ATP production. Circ. Res. 2013, 113, 709–724. [Google Scholar] [CrossRef] [Green Version]
- Boudina, S.; Bugger, H.; Sena, S.; O’Neill, B.T.; Zaha, V.G.; Ilkun, O.; Wright, J.J.; Mazumder, P.K.; Palfreyman, E.; Tidwell, T.J.; et al. Contribution of impaired myocardial insulin signaling to mitochondrial dysfunction and oxidative stress in the heart. Circulation 2009, 119, 1272–1283. [Google Scholar] [CrossRef] [Green Version]
- Yagyu, H.; Chen, G.; Yokoyama, M.; Hirata, K.; Augustus, A.; Kako, Y.; Seo, T.; Hu, Y.; Lutz, E.P.; Merkel, M.; et al. Lipoprotein lipase (LpL) on the surface of cardiomyocytes increases lipid uptake and produces a cardiomyopathy. J. Clin. Investig. 2003, 111, 419–426. [Google Scholar] [CrossRef] [Green Version]
- Chiu, H.-C.; Kovacs, A.; Blanton, R.M.; Han, X.; Courtois, M.; Weinheimer, C.J.; Yamada, K.A.; Brunet, S.; Xu, H.; Nerbonne, J.M.; et al. Transgenic expression of fatty acid transport protein 1 in the heart causes lipotoxic cardiomyopathy. Circ. Res. 2005, 96, 225–233. [Google Scholar] [CrossRef] [Green Version]
- Cheng, L.; Ding, G.; Qin, Q.; Huang, Y.; Lewis, W.; He, N.; Evans, R.M.; Schneider, M.D.; Brako, F.A.; Xiao, Y.; et al. Cardiomyocyte-restricted peroxisome proliferator-activated receptor-delta deletion perturbs myocardial fatty acid oxidation and leads to cardiomyopathy. Nat. Med. 2004, 10, 1245–1250. [Google Scholar] [CrossRef]


| Characteristics | Sequencing Samples | All Clinical Samples Collected | |||
|---|---|---|---|---|---|
| PCH (Average, n = 4) | Concentric Hypertrophy (n = 12–16) | Eccentric Hypertrophy (n = 11–19) | p Value | ||
| LV structure and function | |||||
| LVEDD (mm) | 45.5 | 49.375 ± 9.6116 | 61.9474 ± 7.9055 | 0.0002 | |
| LVESD (mm) | 31 | 36.375 ± 10.6701 | 51.5263 ± 8.8404 | 0.0001 | |
| IVS (mm) | 15.5 | 14.325 ± 3.9408 | 8.3 ± 1.6496 | <0.0001 | |
| LVPWd (mm) | 13 | 12 ± 2.2804 | 8.6316 ± 1.1648 | <0.0001 | |
| LVEF (%) | 57.5 | 50.5625 ± 12.0884 | 35.2632 ± 8.6207 | 0.0001 | |
| RV structure and function | |||||
| RV diameter (mm) | 29.25 | 31.1538 ± 4.2787 | 38.875 ± 8.123 | 0.0032 | |
| TAPSE (mm) | 19.25 | 20.3917 ± 6.1278 | 16.4786 ± 2.121 | 0.0547 | |
| TAPSV (cm/s) | 12.475 | 16.0417 ± 5.979 | 15.0714 ± 3.1146 | 0.6195 | |
| Diastolic function | |||||
| Mitral E wave (cm/s) | 3.1222 | 4.2258 ± 2.7983 | 3.3364 ± 2.2869 | 0.4159 | |
| Mitral annular e′(cm/s) | 4.425 | 5.0083 ± 1.9365 | 5.2182 ± 1.4084 | 0.7711 | |
| E/e′ ratio | 13 | 17.6333 ± 8.9467 | 15.5 ± 5.9564 | 0.4989 | |
| E/A ratio | 0.6875 | 1.2875 ± 0.5633 | 1.4458 ± 0.9514 | 0.6248 | |
| TR velocity (m/s) | 220 | 217.5 ± 51.93 | 266.3571 ± 52.9639 | 0.0351 | |
| heart failure marker | |||||
| BNP (pg/mL) | 80.5 | 433.8 ± 461.3022 (n = 5) | 950.9167 ± 727.2138 (n = 12) | 0.1657 | |
| NT-proBNP (pg/mL) | / | 3236.9231 ± 4410.0705 (n = 13) | 9525.6667 ± 9690.4966 (n = 9) | 0.0977 | |
Disclaimer/Publisher’s Note: The statements, opinions and data contained in all publications are solely those of the individual author(s) and contributor(s) and not of MDPI and/or the editor(s). MDPI and/or the editor(s) disclaim responsibility for any injury to people or property resulting from any ideas, methods, instructions or products referred to in the content. |
© 2023 by the authors. Licensee MDPI, Basel, Switzerland. This article is an open access article distributed under the terms and conditions of the Creative Commons Attribution (CC BY) license (https://creativecommons.org/licenses/by/4.0/).
Share and Cite
Xu, J.; Qian, B.; Wang, F.; Huang, Y.; Yan, X.; Li, P.; Zhang, Q.; Li, Y.; Sun, K. Global Profile of tRNA-Derived Small RNAs in Pathological Cardiac Hypertrophy Plasma and Identification of tRF-21-NB8PLML3E as a New Hypertrophy Marker. Diagnostics 2023, 13, 2065. https://doi.org/10.3390/diagnostics13122065
Xu J, Qian B, Wang F, Huang Y, Yan X, Li P, Zhang Q, Li Y, Sun K. Global Profile of tRNA-Derived Small RNAs in Pathological Cardiac Hypertrophy Plasma and Identification of tRF-21-NB8PLML3E as a New Hypertrophy Marker. Diagnostics. 2023; 13(12):2065. https://doi.org/10.3390/diagnostics13122065
Chicago/Turabian StyleXu, Jingyi, Buyun Qian, Feng Wang, Ying Huang, Xinxin Yan, Ping Li, Qian Zhang, Yuan Li, and Kangyun Sun. 2023. "Global Profile of tRNA-Derived Small RNAs in Pathological Cardiac Hypertrophy Plasma and Identification of tRF-21-NB8PLML3E as a New Hypertrophy Marker" Diagnostics 13, no. 12: 2065. https://doi.org/10.3390/diagnostics13122065