
L-Tetrolet Pattern-Based Sleep Stage Classification Model Using Balanced EEG Datasets

 ,
,  ,
,  ,
,  , , and
Abstract
:1. Introduction
- L-tetrolet pattern: a new, Tetris-inspired, textural feature generation function;
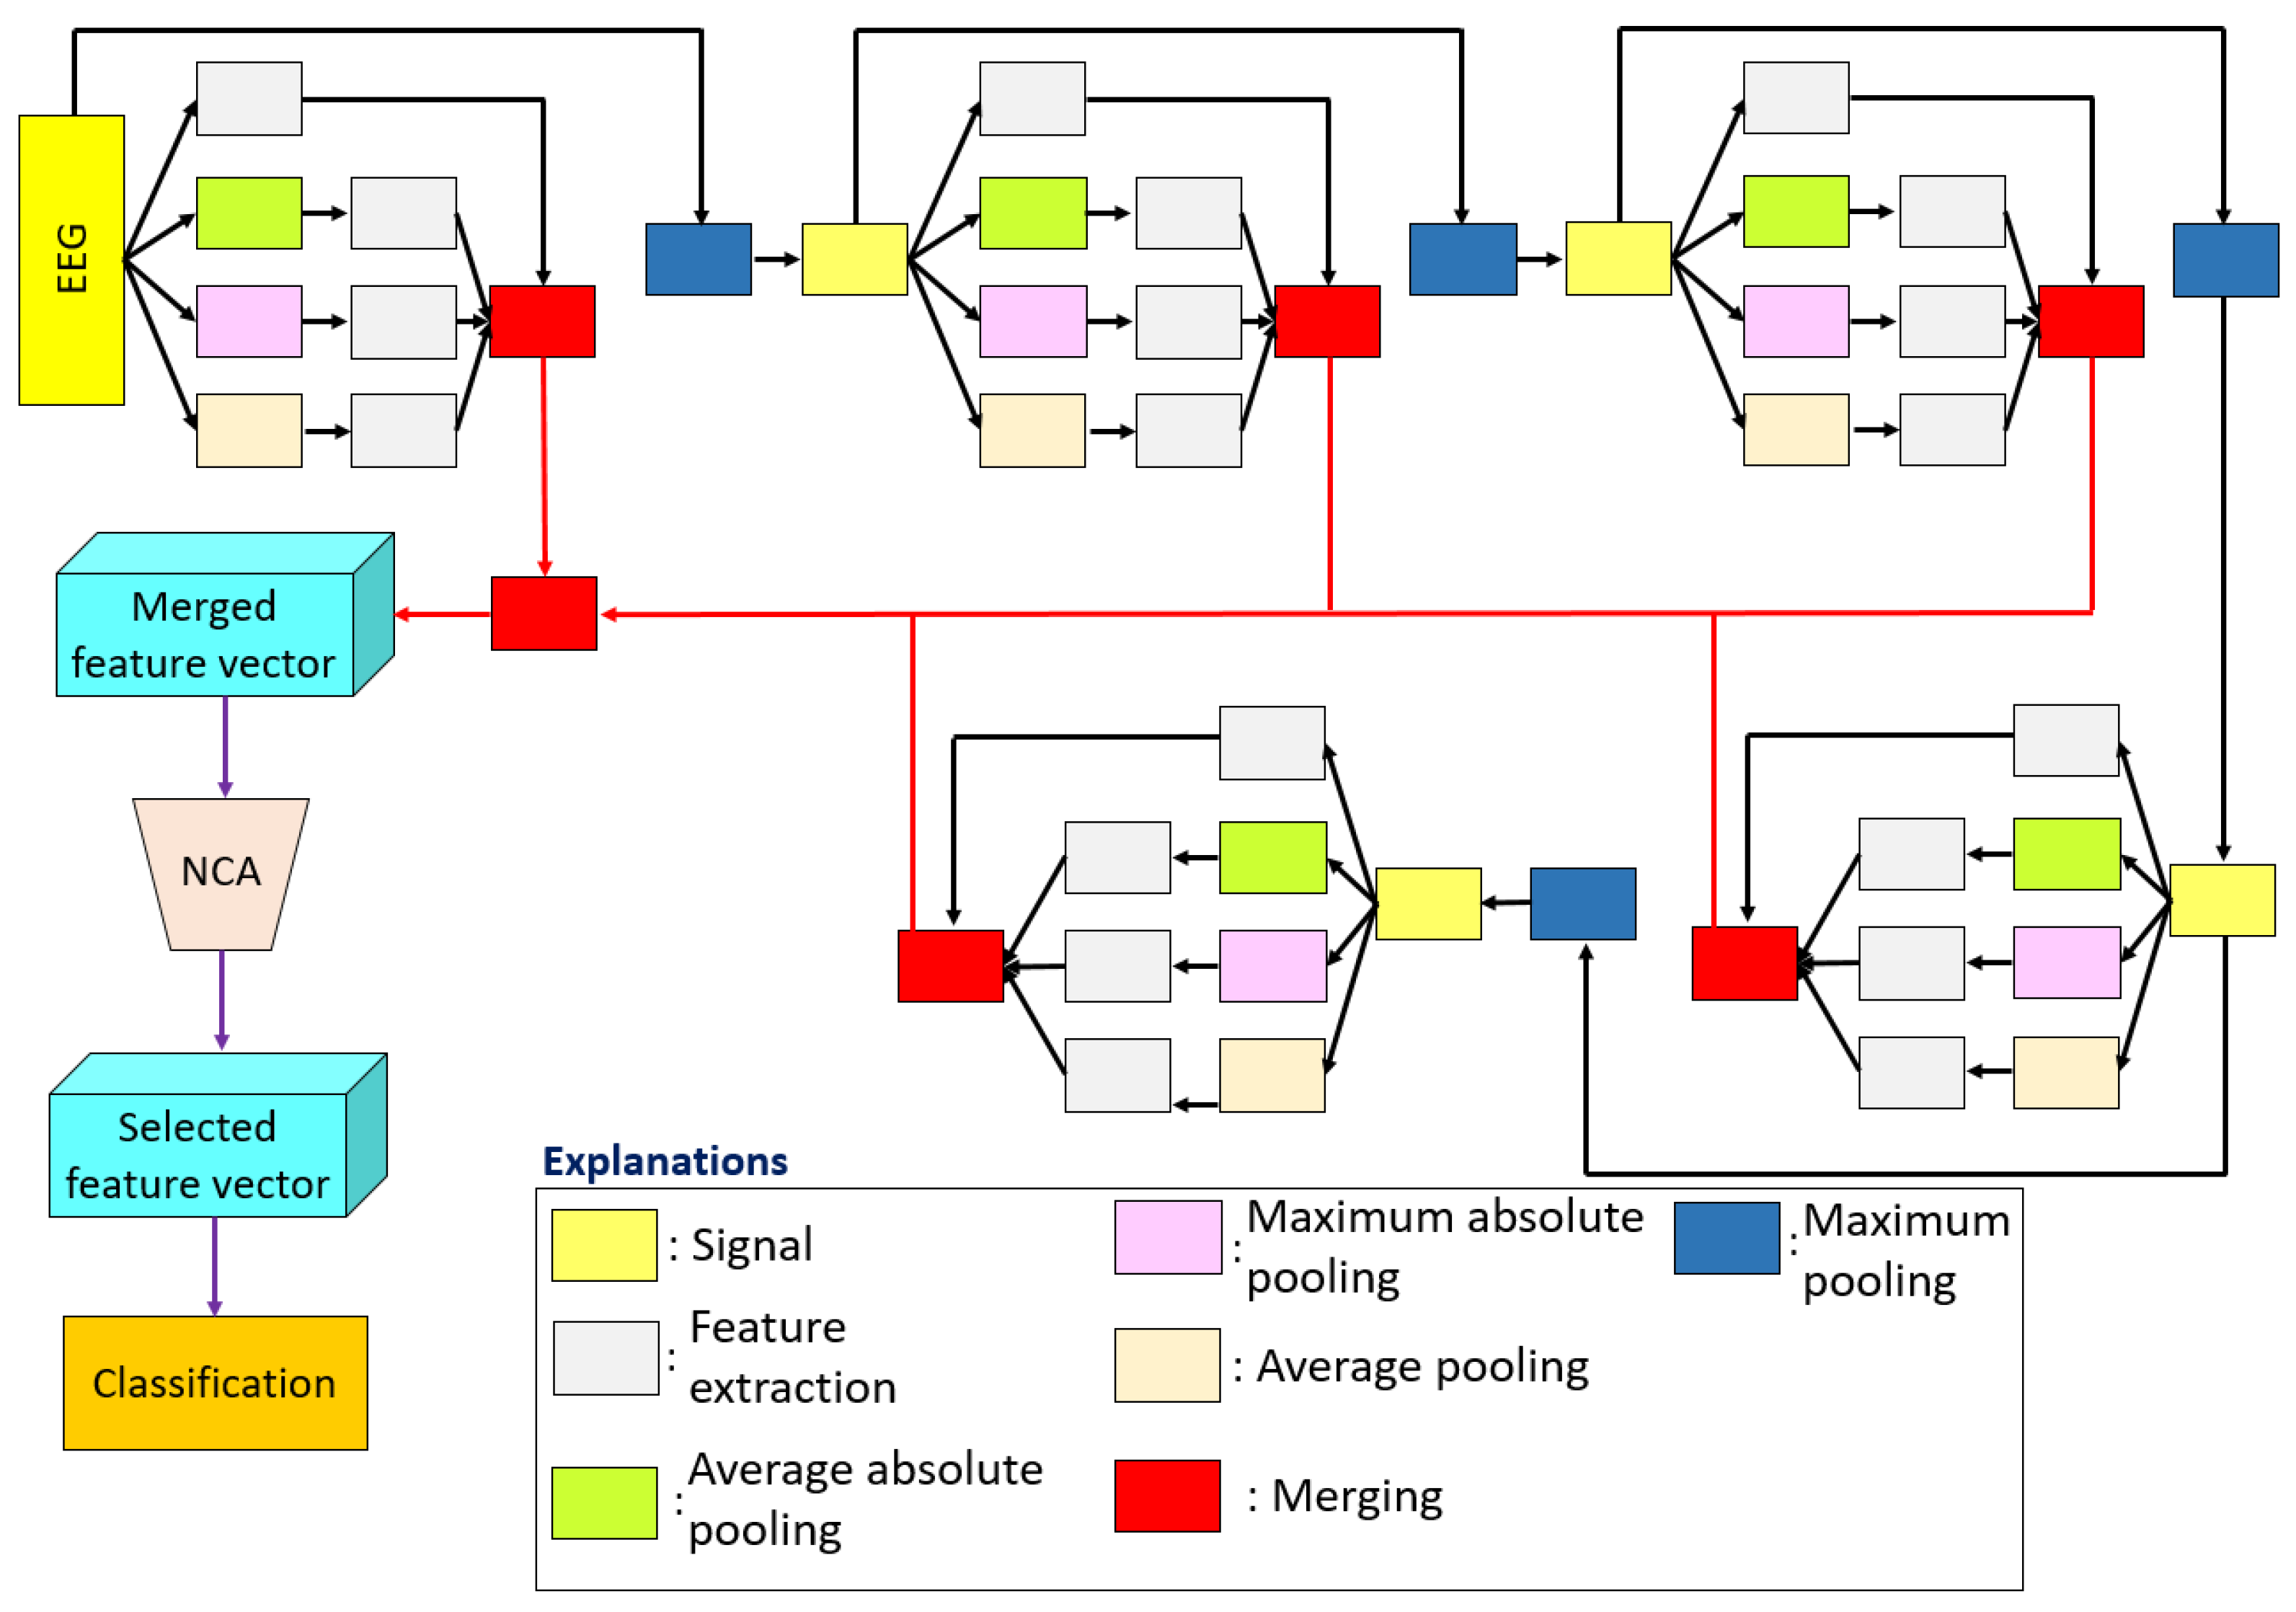
- Statistical feature generator: created by fusing multiple pooling decomposers;
- TSRFINCA: a three-leveled hybrid and iterative feature selector.
- A new feature engineering model has been created by proposing new generation feature extraction, decomposition, and feature selection methods. The essential purpose of the proposed feature engineering model is to extract the most informative features from the used signals to obtain high classification performance with low time complexity.
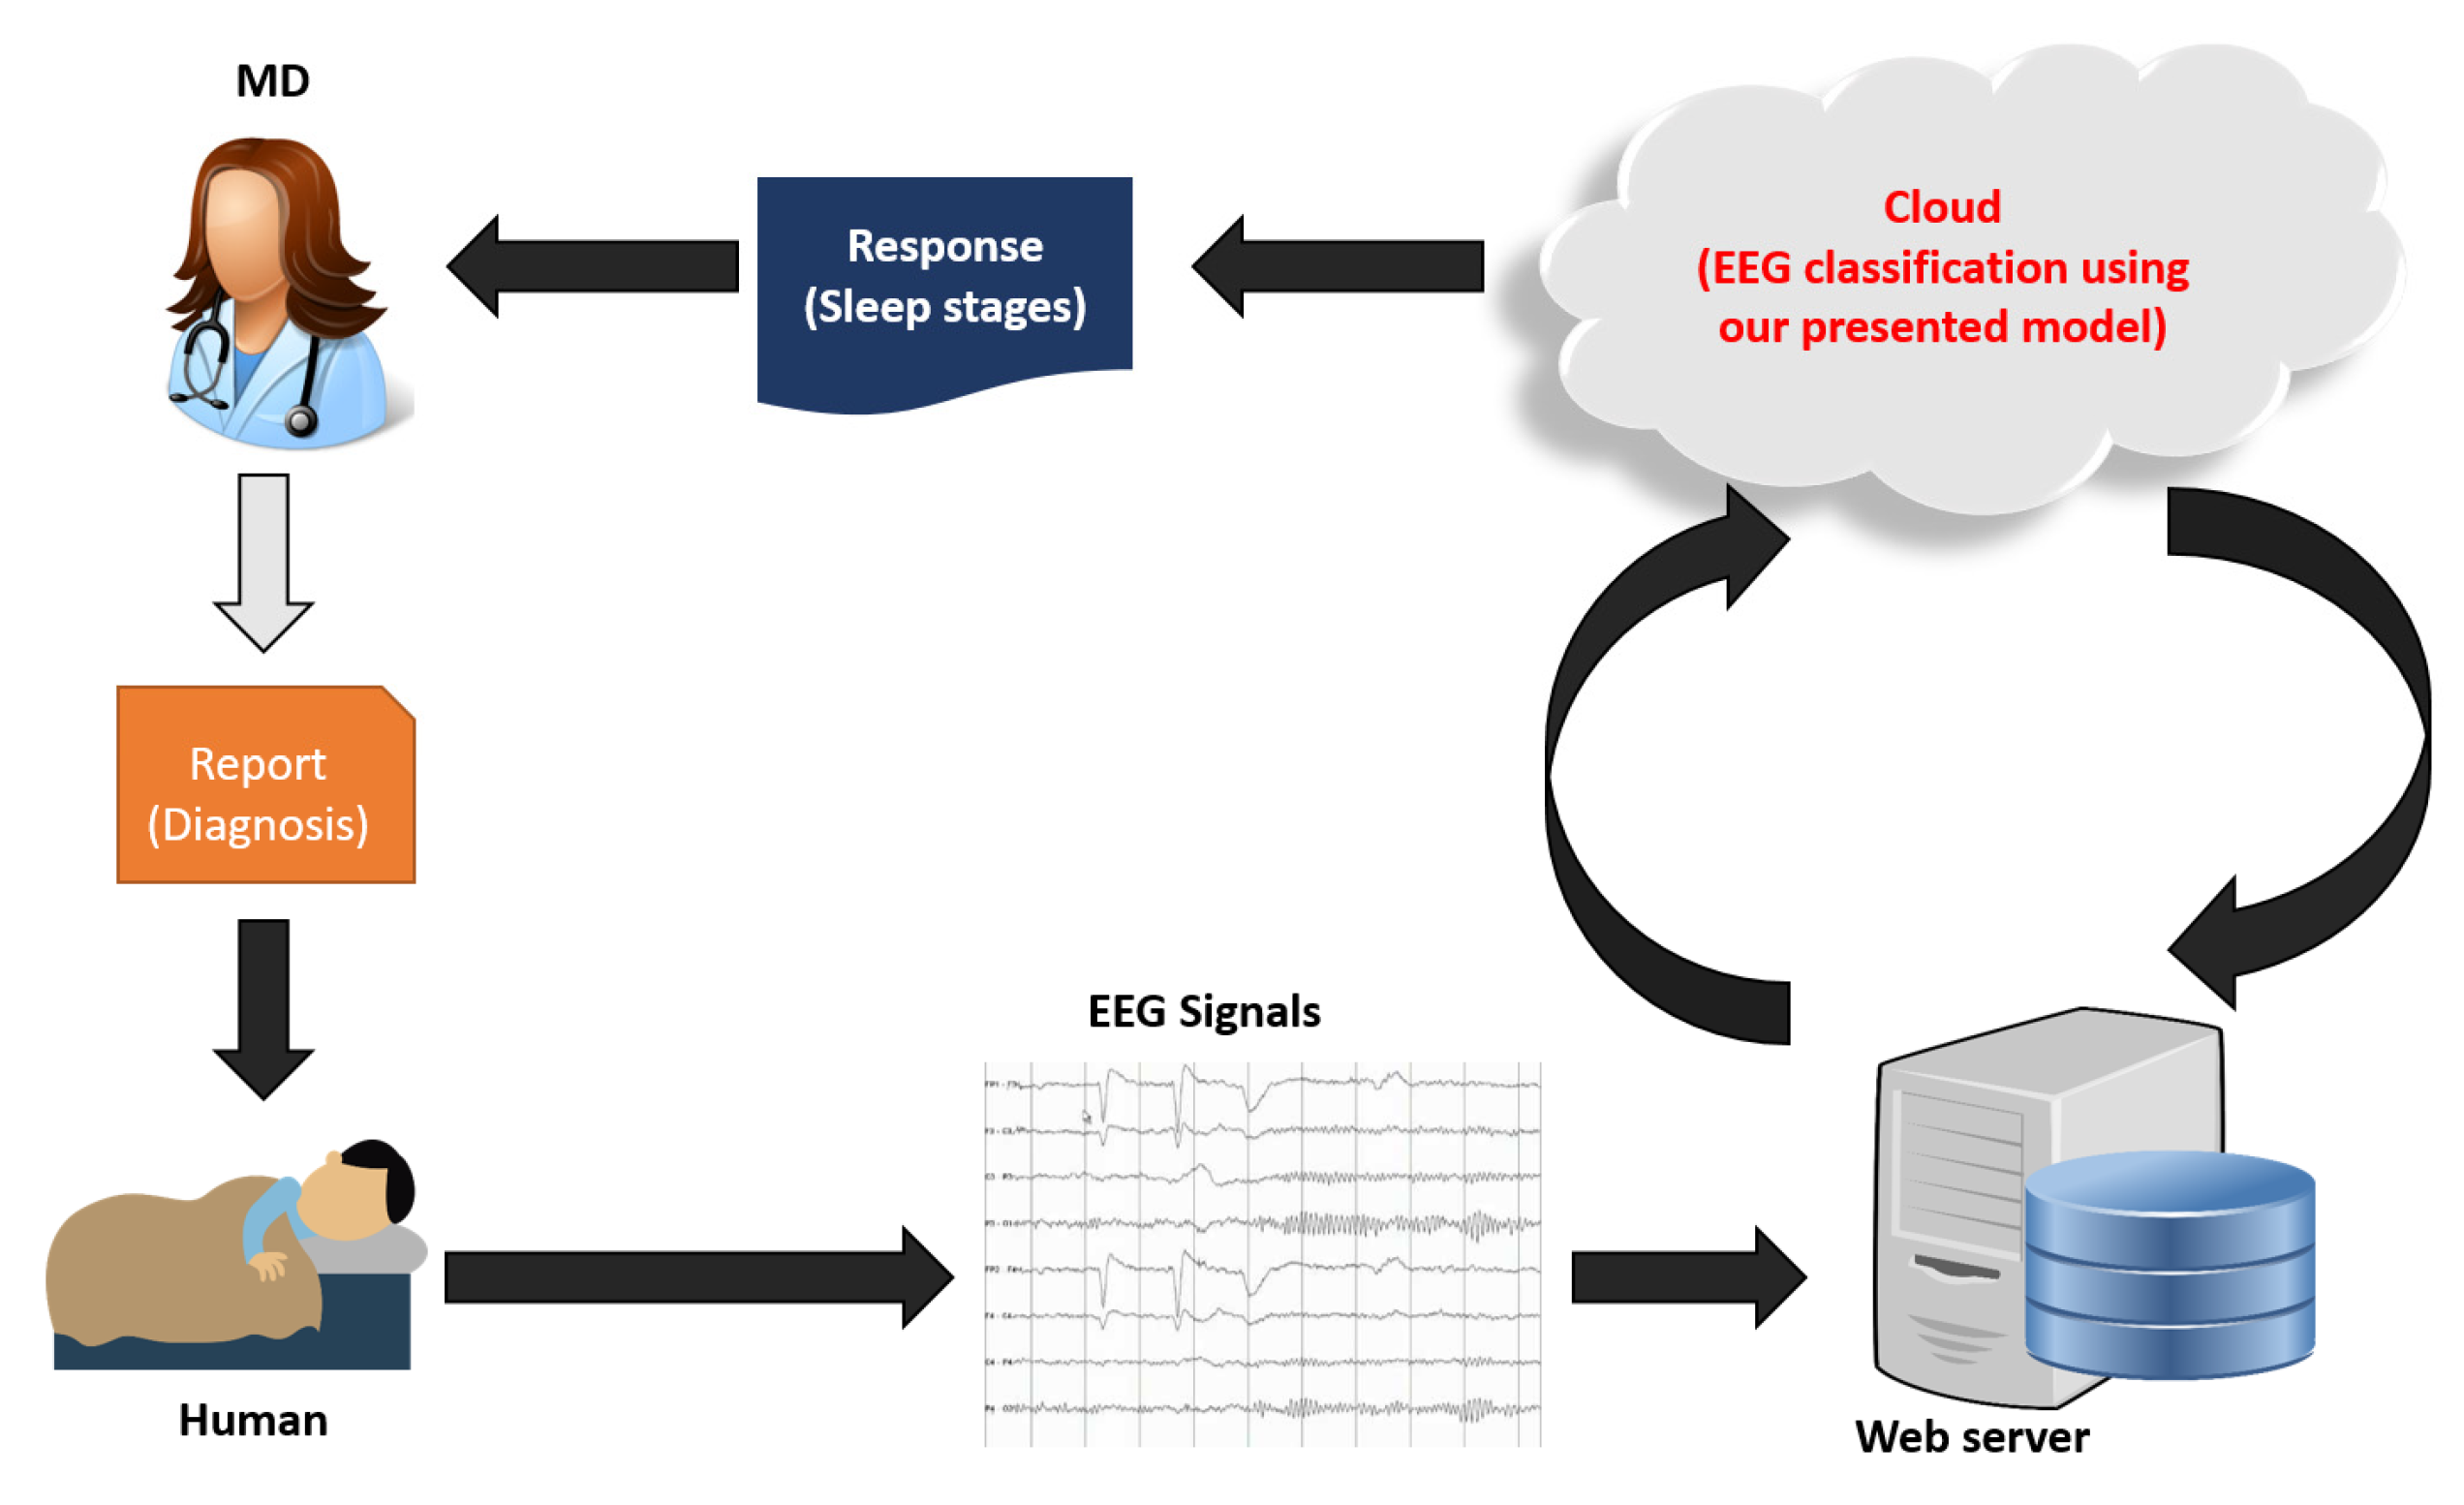
- This research presents a highly accurate EEG classification model for sleep stage detection. By deploying the presented classification model, sleep stage classification results of the CAP sleep dataset are presented using three cases. Our proposal denotes general high classification performance since we applied this model to three different datasets.
2. Material and Method
2.1. Material
2.2. Method
2.2.1. L-Tetrolet Pattern and Statistical Features Based Multileveled Feature Generation Method
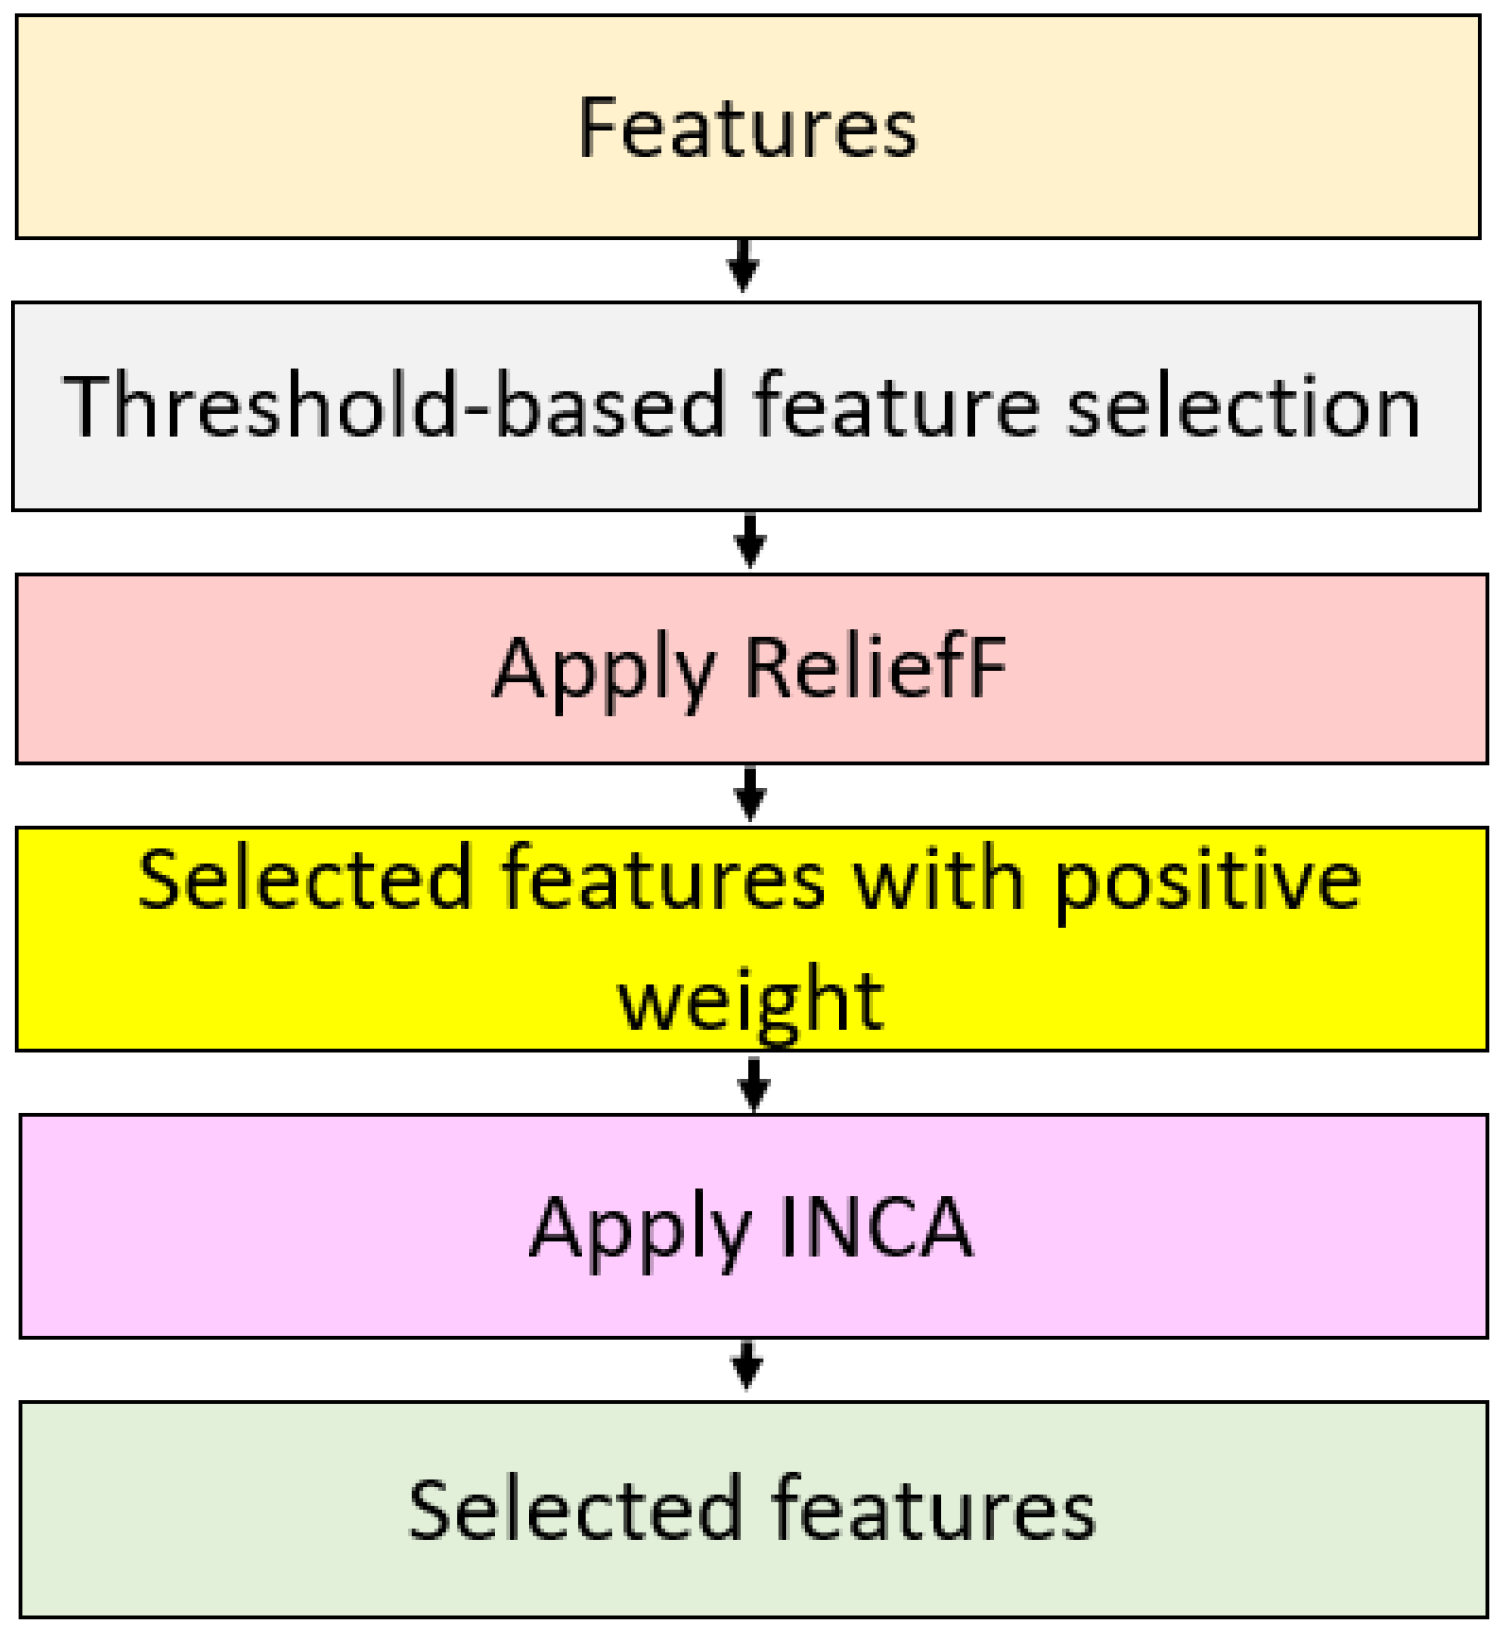
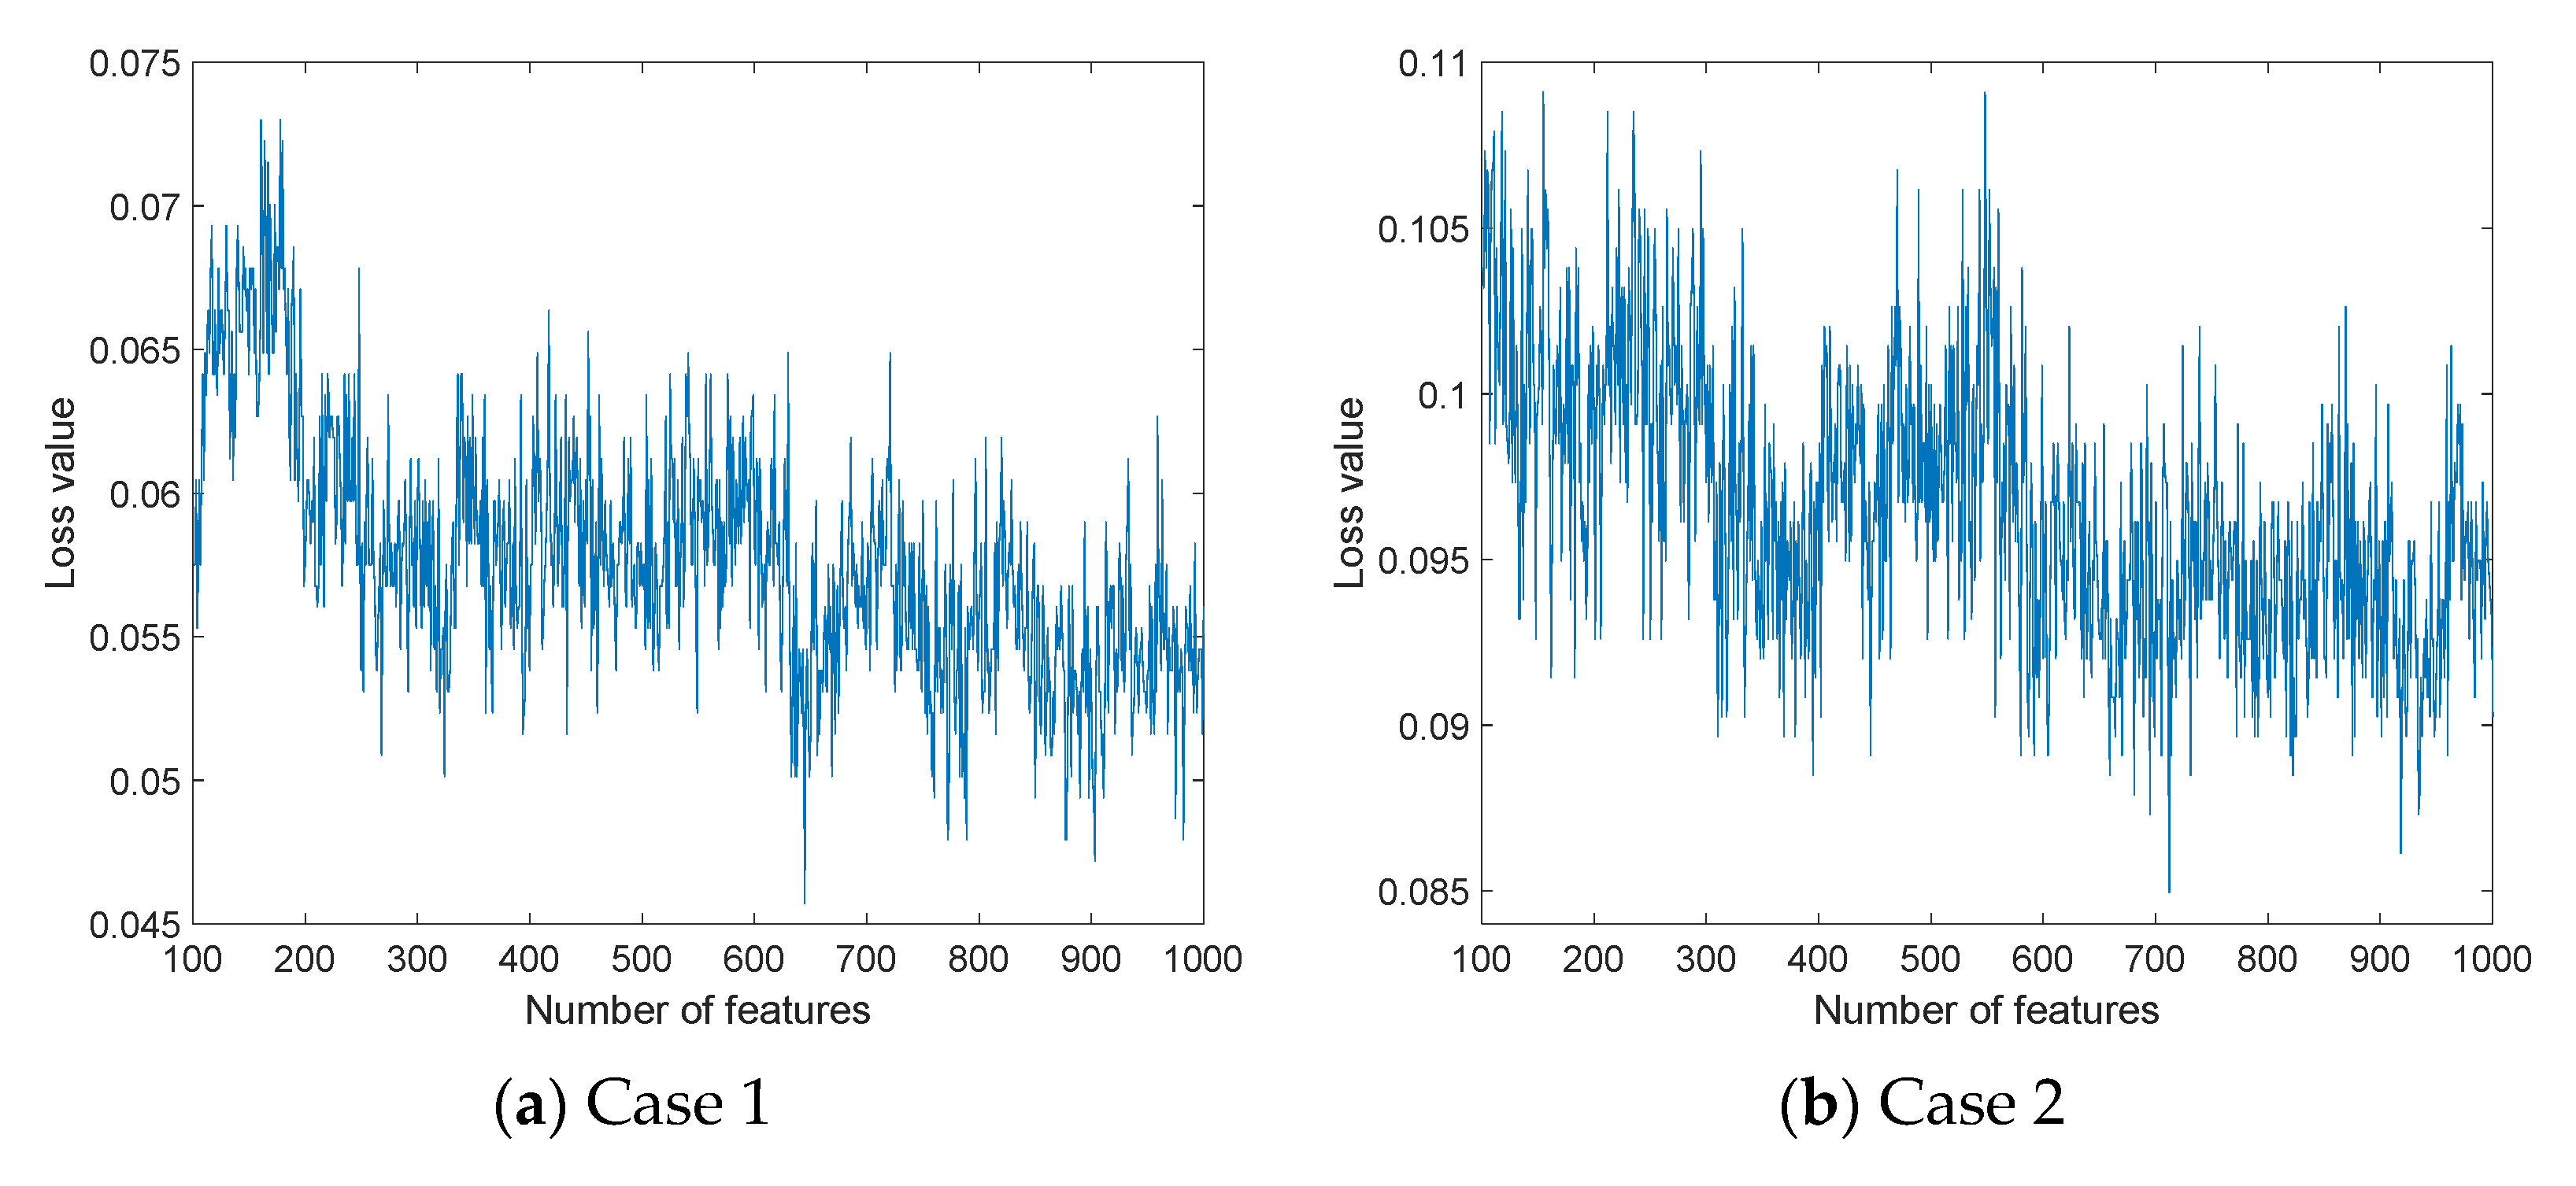
2.2.2. Threshold Selection Based Relieff and Iterative Neighborhood Component Analysis
- Present an effective feature selector;
- Use advantages of the three feature selection methods together;
- Select the most appropriate features automatically.
2.2.3. Classification
- Training and testing method: 10-fold cross-validation;
- Kernel: Third-degree polynomial order (Cubic);
- Box constraint level (C value): One;
- Multiclass method: One-vs-one.
3. Results
3.1. Experimental Setup
3.2. Results
3.3. Computational Complexity Analysis
4. Discussion
- A new game-inspired feature generation model is presented, and the effectiveness of this approach is established through EEG-based sleep stage classification;
- To overcome the routing problem of the pooling method, a multiple pooling decomposer-based feature generation strategy was used;
- A three-layered feature selector is presented;
- By applying these methods and CSVM, a highly accurate sleep stage classification model is presented;
- The recommended model outperformed;
- The proposed model can be applied to a computer with basic system configurations.
- The presented TSRFINCA is a hybrid and iterative feature selector, but the computational complexity is high. Moreover, we have used a shallow classifier. In this work, deep classifiers can be used to increase the classification ability, or a metaheuristic optimization model can be used to tune the hyperparameters of the used classifier;
- The datasets used are small. Therefore, when we used one dataset for training and the other datasets for testing, we achieved a classification accuracy of about 50%. Since these EEG signals have sick subjects (each case defines a disorder).
5. Conclusions
- -
- Propose new game-based feature extraction functions;
- -
- Purpose self-organized feature engineering models;
- -
- Propose a new generation of pooling/decomposition methods by using quantum computing and superposition;
- -
- Develop a new sleep stage classification application, which will be used in medical centers.
Author Contributions
Funding
Institutional Review Board Statement
Informed Consent Statement
Data Availability Statement
Conflicts of Interest
References
- Santaji, S.; Desai, V. Analysis of EEG Signal to Classify Sleep Stages Using Machine Learning. Sleep Vigil. 2020, 4, 145–152. [Google Scholar] [CrossRef]
- Taran, S.; Sharma, P.C.; Bajaj, V. Automatic sleep stages classification using optimize flexible analytic wavelet transform. Knowl.-Based Syst. 2020, 192, 105367. [Google Scholar] [CrossRef]
- Sharma, M.; Goyal, D.; Achuth, P.; Acharya, U.R. An accurate sleep stages classification system using a new class of optimally time-frequency localized three-band wavelet filter bank. Comput. Biol. Med. 2018, 98, 58–75. [Google Scholar] [CrossRef]
- Urtnasan, E.; Park, J.-U.; Joo, E.Y.; Lee, K.-J. Deep Convolutional Recurrent Model for Automatic Scoring Sleep Stages Based on Single-Lead ECG Signal. Diagnostics 2022, 12, 1235. [Google Scholar] [CrossRef]
- Ahmadi, A.; Bazregarzadeh, H.; Kazemi, K. Automated detection of driver fatigue from electroencephalography through wavelet-based connectivity. Biocybern. Biomed. Eng. 2021, 41, 316–332. [Google Scholar] [CrossRef]
- Xu, S.; Faust, O.; Silvia, S.; Chakraborty, S.; Barua, P.D.; Loh, H.W.; Elphick, H.; Molinari, F.; Acharya, U.R. A review of automated sleep disorder detection. Comput. Biol. Med. 2022, 150, 106100. [Google Scholar] [CrossRef] [PubMed]
- Cai, Q.; An, J.; Gao, Z. A multiplex visibility graph motif-based convolutional neural network for characterizing sleep stages using EEG signals. Brain Sci. Adv. 2020, 6, 355–363. [Google Scholar] [CrossRef]
- Aboalayon, K.A.; Ocbagabir, H.T.; Faezipour, M. Efficient sleep stage classification based on EEG signals. In Proceedings of the IEEE Long Island Systems, Applications and Technology (LISAT) Conference, Farmingdale, NY, USA, 2 May 2014; pp. 1–6. [Google Scholar]
- Hassan, A.R.; Subasi, A. A decision support system for automated identification of sleep stages from single-channel EEG signals. Knowl.-Based Syst. 2017, 128, 115–124. [Google Scholar] [CrossRef]
- Malhotra, R.K.; Avidan, A.Y. Sleep stages and scoring technique. In Atlas of Sleep Medicine; Elsevier: Amsterdam, The Netherlands, 2013; pp. 77–99. ISBN 9781455712687. [Google Scholar]
- Berry, R.B.; Brooks, R.; Gamaldo, C.E.; Harding, S.M.; Marcus, C.; Vaughn, B.V. The AASM manual for the scoring of sleep and associated events. Rules Terminol. Tech. Specif. Darien Ill. Am. Acad. Sleep Med. 2012, 176, 2012. [Google Scholar]
- Moser, D.; Anderer, P.; Gruber, G.; Parapatics, S.; Loretz, E.; Boeck, M.; Kloesch, G.; Heller, E.; Schmidt, A.; Danker-Hopfe, H. Sleep classification according to AASM and Rechtschaffen & Kales: Effects on sleep scoring parameters. Sleep 2009, 32, 139–149. [Google Scholar] [PubMed]
- Fraiwan, L.; Lweesy, K.; Khasawneh, N.; Wenz, H.; Dickhaus, H. Automated sleep stage identification system based on time–frequency analysis of a single EEG channel and random forest classifier. Comput. Methods Programs Biomed. 2012, 108, 10–19. [Google Scholar] [CrossRef]
- Loh, H.W.; Ooi, C.P.; Seoni, S.; Barua, P.D.; Molinari, F.; Acharya, U.R. Application of Explainable Artificial Intelligence for Healthcare: A Systematic Review of the Last Decade (2011–2022). Comput. Methods Programs Biomed. 2022, 226, 107161. [Google Scholar] [CrossRef]
- Ebrahimi, F.; Mikaeili, M.; Estrada, E.; Nazeran, H. Automatic sleep stage classification based on EEG signals by using neural networks and wavelet packet coefficients. In Proceedings of the 2008 30th Annual International Conference of the IEEE Engineering in Medicine and Biology Society, Vancouver, BC, Canada, 20–25 August 2008; pp. 1151–1154. [Google Scholar]
- Tzimourta, K.D.; Tsilimbaris, A.; Tzioukalia, K.; Tzallas, A.T.; Tsipouras, M.G.; Astrakas, L.G.; Giannakeas, N. EEG-based automatic sleep stage classification. Biomed. J. 2018, 1, 6. [Google Scholar]
- Sun, C.; Fan, J.; Chen, C.; Li, W.; Chen, W. A two-stage neural network for sleep stage classification based on feature learning, sequence learning, and data augmentation. IEEE Access 2019, 7, 109386–109397. [Google Scholar] [CrossRef]
- Alickovic, E.; Subasi, A. Ensemble SVM method for automatic sleep stage classification. IEEE Trans. Instrum. Meas. 2018, 67, 1258–1265. [Google Scholar] [CrossRef] [Green Version]
- Faust, O.; Razaghi, H.; Barika, R.; Ciaccio, E.J.; Acharya, U.R. A review of automated sleep stage scoring based on physiological signals for the new millennia. Comput. Methods Programs Biomed. 2019, 176, 81–91. [Google Scholar] [CrossRef] [PubMed]
- Acharya, U.R.; Bhat, S.; Faust, O.; Adeli, H.; Chua, E.C.-P.; Lim, W.J.E.; Koh, J.E.W. Nonlinear dynamics measures for automated EEG-based sleep stage detection. Eur. Neurol. 2015, 74, 268–287. [Google Scholar] [CrossRef] [PubMed]
- Baygin, M.; Yaman, O.; Tuncer, T.; Dogan, S.; Barua, P.D.; Acharya, U.R. Automated accurate schizophrenia detection system using Collatz pattern technique with EEG signals. Biomed. Signal Process. Control 2021, 70, 102936. [Google Scholar] [CrossRef]
- Barua, P.D.; Dogan, S.; Tuncer, T.; Baygin, M.; Acharya, U.R. Novel automated PD detection system using aspirin pattern with EEG signals. Comput. Biol. Med. 2021, 137, 104841. [Google Scholar] [CrossRef]
- Kobat, M.A.; Kivrak, T.; Barua, P.D.; Tuncer, T.; Dogan, S.; Tan, R.-S.; Ciaccio, E.J.; Acharya, U.R. Automated COVID-19 and Heart Failure Detection Using DNA Pattern Technique with Cough Sounds. Diagnostics 2021, 11, 1962. [Google Scholar] [CrossRef] [PubMed]
- Goldberger, A.L.; Amaral, L.A.; Glass, L.; Hausdorff, J.M.; Ivanov, P.C.; Mark, R.G.; Mietus, J.E.; Moody, G.B.; Peng, C.-K.; Stanley, H.E. PhysioBank, PhysioToolkit, and PhysioNet: Components of a new research resource for complex physiologic signals. Circulation 2000, 101, e215–e220. [Google Scholar] [CrossRef] [PubMed] [Green Version]
- Mariani, S.; Bianchi, A.M.; Manfredini, E.; Rosso, V.; Mendez, M.O.; Parrino, L.; Matteucci, M.; Grassi, A.; Cerutti, S.; Terzano, M.G. Automatic detection of A phases of the Cyclic Alternating Pattern during sleep. In Proceedings of the 2010 Annual International Conference of the IEEE Engineering in Medicine and Biology, Buenos Aires, Argentina, 31 August–4 September 2010; pp. 5085–5088. [Google Scholar]
- Mariani, S.; Grassi, A.; Mendez, M.O.; Milioli, G.; Parrino, L.; Terzano, M.G.; Bianchi, A.M. EEG segmentation for improving automatic CAP detection. Clin. Neurophysiol. 2013, 124, 1815–1823. [Google Scholar] [CrossRef]
- Machado, F.; Teixeira, C.; Santos, C.; Bento, C.; Sales, F.; Dourado, A. A-phases subtype detection using different classification methods. In Proceedings of the 2016 38th Annual International Conference of the IEEE Engineering in Medicine and Biology Society (EMBC), Orlando, FL, USA, 16–20 August 2016; pp. 1026–1029. [Google Scholar]
- Mostafa, S.S.; Mendonça, F.; Ravelo-García, A.; Morgado-Dias, F. Combination of deep and shallow networks for cyclic alternating patterns detection. In Proceedings of the 2018 13th APCA International Conference on Automatic Control and Soft Computing (CONTROLO), Ponta Delgada, Portugal, 4–6 June 2018; pp. 98–103. [Google Scholar]
- Hartmann, S.; Baumert, M. Automatic a-phase detection of cyclic alternating patterns in sleep using dynamic temporal information. IEEE Trans. Neural Syst. Rehabil. Eng. 2019, 27, 1695–1703. [Google Scholar] [CrossRef]
- Hartmann, S.; Baumert, M. Improved A-phase Detection of Cyclic Alternating Pattern Using Deep Learning. In Proceedings of the 2019 41st Annual International Conference of the IEEE Engineering in Medicine and Biology Society (EMBC), Berlin, Germany, 23–27 July 2019; pp. 1842–1845. [Google Scholar]
- Mendonça, F.; Mostafa, S.S.; Morgado-Dias, F.; Juliá-Serdá, G.; Ravelo-García, A.G. A Method for Sleep Quality Analysis Based on CNN Ensemble With Implementation in a Portable Wireless Device. IEEE Access 2020, 8, 158523–158537. [Google Scholar] [CrossRef]
- Dimitriadis, S.I.; Salis, C.I.; Liparas, D. A Sleep Disorder Detection Model based on EEG Cross-Frequency Coupling and Random Forest. medRxiv 2020, 18. [Google Scholar] [CrossRef]
- Arce-Santana, E.R.; Alba, A.; Mendez, M.O.; Arce-Guevara, V. A-phase classification using convolutional neural networks. Med. Biol. Eng. Comput. 2020, 58, 1003–1014. [Google Scholar] [CrossRef] [Green Version]
- Abbasi, S.F.; Jamil, H.; Chen, W. EEG-based neonatal sleep stage classification using ensemble learning. Comput. Mater. Contin 2022, 70, 4619–4633. [Google Scholar]
- Li, C.; Qi, Y.; Ding, X.; Zhao, J.; Sang, T.; Lee, M. A Deep Learning Method Approach for Sleep Stage Classification with EEG Spectrogram. Int. J. Environ. Res. Public Health 2022, 19, 6322. [Google Scholar] [CrossRef] [PubMed]
- Zhang, G.-Q.; Cui, L.; Mueller, R.; Tao, S.; Kim, M.; Rueschman, M.; Mariani, S.; Mobley, D.; Redline, S. The National Sleep Research Resource: Towards a sleep data commons. J. Am. Med. Inform. Assoc. 2018, 25, 1351–1358. [Google Scholar] [CrossRef] [Green Version]
- Zaidi, T.F.; Farooq, O. EEG Sub-bands based Sleep Stages Classification using Fourier Synchrosqueezed Transform Features. Expert Syst. Appl. 2022, 212, 118752. [Google Scholar] [CrossRef]
- Sors, A.; Bonnet, S.; Mirek, S.; Vercueil, L.; Payen, J.-F. A convolutional neural network for sleep stage scoring from raw single-channel EEG. Biomed. Signal Process. Control 2018, 42, 107–114. [Google Scholar] [CrossRef]
- Quan, S.F.; Howard, B.V.; Iber, C.; Kiley, J.P.; Nieto, F.J.; O’Connor, G.T.; Rapoport, D.M.; Redline, S.; Robbins, J.; Samet, J.M. The sleep heart health study: Design, rationale, and methods. Sleep 1997, 20, 1077–1085. [Google Scholar]
- Goshtasbi, N.; Boostani, R.; Sanei, S. SleepFCN: A Fully Convolutional Deep Learning Framework for Sleep Stage Classification Using Single-Channel Electroencephalograms. IEEE Trans. Neural Syst. Rehabil. Eng. 2022, 30, 2088–2096. [Google Scholar] [CrossRef] [PubMed]
- Shahbakhti, M.; Beiramvand, M.; Eigirdas, T.; Solé-Casals, J.; Wierzchon, M.; Broniec-Wójcik, A.; Augustyniak, P.; Marozas, V. Discrimination of Wakefulness from Sleep Stage I Using Nonlinear Features of a Single Frontal EEG Channel. IEEE Sens. J. 2022, 22, 6975–6984. [Google Scholar] [CrossRef]
- Devuyst, S.; Dutoit, T.; Kerkhofs, M. The DREAMS Databases and Assessment Algorithm; Zenodo: Geneva, Switzerland, 2005. [Google Scholar]
- Zhao, C.; Li, J.; Guo, Y. SleepContextNet: A temporal context network for automatic sleep staging based single-channel EEG. Comput. Methods Programs Biomed. 2022, 220, 106806. [Google Scholar] [CrossRef]
- Terzano, M.G.; Parrino, L.; Sherieri, A.; Chervin, R.; Chokroverty, S.; Guilleminault, C.; Hirshkowitz, M.; Mahowald, M.; Moldofsky, H.; Rosa, A. Atlas, rules, and recording techniques for the scoring of cyclic alternating pattern (CAP) in human sleep. Sleep Med. 2001, 2, 537–553. [Google Scholar] [CrossRef]
- Eldele, E.; Chen, Z.; Liu, C.; Wu, M.; Kwoh, C.-K.; Li, X.; Guan, C. An attention-based deep learning approach for sleep stage classification with single-channel eeg. IEEE Trans. Neural Syst. Rehabil. Eng. 2021, 29, 809–818. [Google Scholar] [CrossRef]
- Yang, B.; Zhu, X.; Liu, Y.; Liu, H. A single-channel EEG based automatic sleep stage classification method leveraging deep one-dimensional convolutional neural network and hidden Markov model. Biomed. Signal Process. Control 2021, 68, 102581. [Google Scholar] [CrossRef]
- Kemp, B.; Värri, A.; Rosa, A.C.; Nielsen, K.D.; Gade, J. A simple format for exchange of digitized polygraphic recordings. Electroencephalogr. Clin. Neurophysiol. 1992, 82, 391–393. [Google Scholar] [CrossRef]
- Physionet. CAP Sleep Database. 2012. Available online: https://physionet.org/content/capslpdb/1.0.0 (accessed on 27 August 2020).
- Sharma, M.; Tiwari, J.; Acharya, U.R. Automatic sleep-stage scoring in healthy and sleep disorder patients using optimal wavelet filter bank technique with EEG signals. Int. J. Environ. Res. Public Health 2021, 18, 3087. [Google Scholar] [CrossRef]
- Lai, D.; Heyat, M.B.B.; Khan, F.I.; Zhang, Y. Prognosis of sleep bruxism using power spectral density approach applied on EEG signal of both EMG1-EMG2 and ECG1-ECG2 channels. IEEE Access 2019, 7, 82553–82562. [Google Scholar] [CrossRef]
- Urbanowicz, R.J.; Meeker, M.; La Cava, W.; Olson, R.S.; Moore, J.H. Relief-based feature selection: Introduction and review. J. Biomed. Inform. 2018, 85, 189–203. [Google Scholar] [CrossRef] [PubMed]
- Tuncer, T.; Dogan, S.; Özyurt, F.; Belhaouari, S.B.; Bensmail, H. Novel Multi Center and Threshold Ternary Pattern Based Method for Disease Detection Method Using Voice. IEEE Access 2020, 8, 84532–84540. [Google Scholar] [CrossRef]
- Patsis, G.; Sahli, H.; Verhelst, W.; Troyer, O.D. Evaluation of attention levels in a tetris game using a brain computer interface. In Proceedings of the International Conference on User Modeling, Adaptation, and Personalization, Rome, Italy, 10–14 June 2013; pp. 127–138. [Google Scholar]
- Krommweh, J. Tetrolet transform: A new adaptive Haar wavelet algorithm for sparse image representation. J. Vis. Commun. Image Represent. 2010, 21, 364–374. [Google Scholar] [CrossRef]
- Kuncan, F.; Kaya, Y.; Kuncan, M. Sensör işaretlerinden cinsiyet tanıma için yerel ikili örüntüler tabanlı yeni yaklaşımlar. J. Fac. Eng. Archit. Gazi Univ. 2019, 34, 2173–2185. [Google Scholar] [CrossRef] [Green Version]
- Chivers, I.; Sleightholme, J. An introduction to Algorithms and the Big O Notation. In Introduction to Programming with Fortran; Springer: Berlin/Heidelberg, Germany, 2015; pp. 359–364. [Google Scholar]
- Rubinstein-Salzedo, S. Big o notation and algorithm efficiency. In Cryptography; Springer: Berlin/Heidelberg, Germany, 2018; pp. 75–83. [Google Scholar]
- Safavian, S.R.; Landgrebe, D. A survey of decision tree classifier methodology. IEEE Trans. Syst. Man Cybern. 1991, 21, 660–674. [Google Scholar] [CrossRef] [Green Version]
- Kim, K.S.; Choi, H.H.; Moon, C.S.; Mun, C.W. Comparison of k-nearest neighbor, quadratic discriminant and linear discriminant analysis in classification of electromyogram signals based on the wrist-motion directions. Curr. Appl. Phys. 2011, 11, 740–745. [Google Scholar] [CrossRef]
- Rish, I. An empirical study of the naive Bayes classifier. In Proceedings of the IJCAI 2001 Workshop on Empirical Methods in Artificial Intelligence, Seattle, WA, USA, 4–10 August 2001; pp. 41–46. [Google Scholar]
- Chang, Y.-W.; Lin, C.-J. Feature ranking using linear SVM. In Proceedings of the Causation and Prediction Challenge, Hong-Kong, China, 15 December 2007–30 April 2008; pp. 53–64. [Google Scholar]
- Jain, U.; Nathani, K.; Ruban, N.; Raj, A.N.J.; Zhuang, Z.; Mahesh, V.G. Cubic SVM classifier based feature extraction and emotion detection from speech signals. In Proceedings of the 2018 International Conference on Sensor Networks and Signal Processing (SNSP), Xi’an, China, 28–31 October 2018; pp. 386–391. [Google Scholar]
- Horton, P.; Nakai, K. Better Prediction of Protein Cellular Localization Sites with the it k Nearest Neighbors Classifier. In Proceedings of the Ismb, Halkidiki, Greece, 12–15 June 1997; pp. 147–152. [Google Scholar]
- Widasari, E.R.; Tanno, K.; Tamura, H. Automatic Sleep Disorders Classification Using Ensemble of Bagged Tree Based on Sleep Quality Features. Electronics 2020, 9, 512. [Google Scholar] [CrossRef] [Green Version]
- Bajaj, V.; Pachori, R.B. Automatic classification of sleep stages based on the time-frequency image of EEG signals. Comput. Methods Programs Biomed. 2013, 112, 320–328. [Google Scholar] [CrossRef]
- Kemp, B.; Zwinderman, A.H.; Tuk, B.; Kamphuisen, H.A.; Oberye, J.J. Analysis of a sleep-dependent neuronal feedback loop: The slow-wave microcontinuity of the EEG. IEEE Trans. Biomed. Eng. 2000, 47, 1185–1194. [Google Scholar] [CrossRef]
- Hassan, A.R.; Bhuiyan, M.I.H. Computer-aided sleep staging using complete ensemble empirical mode decomposition with adaptive noise and bootstrap aggregating. Biomed. Signal Process. Control 2016, 24, 1–10. [Google Scholar] [CrossRef]
- Jiang, D.; Lu, Y.-n.; Yu, M.; Yuanyuan, W. Robust sleep stage classification with single-channel EEG signals using multimodal decomposition and HMM-based refinement. Expert Syst. Appl. 2019, 121, 188–203. [Google Scholar] [CrossRef]
- Kanwal, S.; Uzair, M.; Ullah, H.; Khan, S.D.; Ullah, M.; Cheikh, F.A. An image based prediction model for sleep stage identification. In Proceedings of the 2019 IEEE International Conference on Image Processing (ICIP), Taipei, Taiwan, 22–25 September 2019; pp. 1366–1370. [Google Scholar]
- Basha, A.J.; Balaji, B.S.; Poornima, S.; Prathilothamai, M.; Venkatachalam, K. Support vector machine and simple recurrent network based automatic sleep stage classification of fuzzy kernel. J. Ambient Intell. Humaniz. Comput. 2020, 7191860. [Google Scholar] [CrossRef]
- Jadhav, P.; Rajguru, G.; Datta, D.; Mukhopadhyay, S. Automatic sleep stage classification using time–frequency images of CWT and transfer learning using convolution neural network. Biocybern. Biomed. Eng. 2020, 40, 494–504. [Google Scholar] [CrossRef]
- Michielli, N.; Acharya, U.R.; Molinari, F. Cascaded LSTM recurrent neural network for automated sleep stage classification using single-channel EEG signals. Comput. Biol. Med. 2019, 106, 71–81. [Google Scholar] [CrossRef]
- Huang, J.; Ren, L.; Zhou, X.; Yan, K. An improved neural network based on SENet for sleep stage classification. IEEE J. Biomed. Health Inform. 2022, 26, 4948–4956. [Google Scholar] [CrossRef]
- Kim, J.; Lee, J.; Shin, M. Sleep stage classification based on noise-reduced fractal property of heart rate variability. Procedia Comput. Sci. 2017, 116, 435–440. [Google Scholar] [CrossRef]
- Shahin, M.; Ahmed, B.; Hamida, S.T.-B.; Mulaffer, F.L.; Glos, M.; Penzel, T. Deep learning and insomnia: Assisting clinicians with their diagnosis. IEEE J. Biomed. Health Inform. 2017, 21, 1546–1553. [Google Scholar] [CrossRef]
- Karimzadeh, F.; Boostani, R.; Seraj, E.; Sameni, R. A distributed classification procedure for automatic sleep stage scoring based on instantaneous electroencephalogram phase and envelope features. IEEE Trans. Neural Syst. Rehabil. Eng. 2017, 26, 362–370. [Google Scholar] [CrossRef]
- Seifpour, S.; Niknazar, H.; Mikaeili, M.; Nasrabadi, A.M. A new automatic sleep staging system based on statistical behavior of local extrema using single channel EEG signal. Expert Syst. Appl. 2018, 104, 277–293. [Google Scholar] [CrossRef]
- Zhou, J.; Wang, G.; Liu, J.; Wu, D.; Xu, W.; Wang, Z.; Ye, J.; Xia, M.; Hu, Y.; Tian, Y. Automatic Sleep Stage Classification With Single Channel EEG Signal Based on Two-Layer Stacked Ensemble Model. IEEE Access 2020, 8, 57283–57297. [Google Scholar] [CrossRef]
- Zhang, J.; Yao, R.; Ge, W.; Gao, J. Orthogonal convolutional neural networks for automatic sleep stage classification based on single-channel EEG. Comput. Methods Programs Biomed. 2020, 183, 105089. [Google Scholar] [CrossRef] [PubMed]
- Liu, G.-R.; Lo, Y.-L.; Malik, J.; Sheu, Y.-C.; Wu, H.-T. Diffuse to fuse EEG spectra–Intrinsic geometry of sleep dynamics for classification. Biomed. Signal Process. Control 2020, 55, 101576. [Google Scholar] [CrossRef]
- Cai, Q.; Gao, Z.; An, J.; Gao, S.; Grebogi, C. A Graph-Temporal fused dual-input Convolutional Neural Network for Detecting Sleep Stages from EEG Signals. IEEE Trans. Circuits Syst. II Express Briefs 2020, 68, 777–781. [Google Scholar] [CrossRef]
- Loh, H.W.; Ooi, C.P.; Dhok, S.G.; Sharma, M.; Bhurane, A.A.; Acharya, U.R. Automated detection of cyclic alternating pattern and classification of sleep stages using deep neural network. Appl. Intell. 2021, 52, 2903–2917. [Google Scholar] [CrossRef]
- Dhok, S.; Pimpalkhute, V.; Chandurkar, A.; Bhurane, A.A.; Sharma, M.; Acharya, U.R. Automated phase classification in cyclic alternating patterns in sleep stages using Wigner–Ville distribution based features. Comput. Biol. Med. 2020, 119, 103691. [Google Scholar] [CrossRef]
- Sharma, M.; Patel, V.; Tiwari, J.; Acharya, U.R. Automated characterization of cyclic alternating pattern using wavelet-based features and ensemble learning techniques with eeg signals. Diagnostics 2021, 11, 1380. [Google Scholar] [CrossRef]


| Studies | Method | Classifier | Dataset | Channels | The Results (%) |
|---|---|---|---|---|---|
| Abbasi et al. [34] | Convolutional Neural Network | Ensemble | Collected data | Multiple channels | Sensitivity: 78.44 Specificity: 96.49 Accuracy: 94.27 |
| Li et al. [35] | Multi-Layer Convolutional Neural Networks | Auxiliary | SHHS dataset [36] | C3-A2, C4-A1, EOG | Accuracy: 85.12 |
| Zaidi and Farooq [37] | Fourier Synchrosqueezed Transform Features | Support vector machine | DREAMS dataset | Cz-A1 | Accuracy: 82.60 |
| Sors et al. [38] | Deep Convolutional Neural Network | Convolutional Neural Network | The Sleep Heart Health Study dataset [39] | C4-A1, C3-A2 | Accuracy: 87.00 |
| Goshtasbi et al. [40] | Convolutional Neural Network | Softmax | SHHS dataset [36] | C4-A1, C3-A2 | Accuracy: 81.30 Kappa: 74.00 |
| Shahbakhti et al. [41] | Nonlinear Analysis | Linear discriminant analysis | DREAMS dataset [42] | Fp1, O1, and CZ or C3 | Accuracy: 92.50 Sensitivity: 89.90 Specificity: 94.50 |
| Zhao et al. [43] | SleepContextNet | Softmax | 1. SHHS dataset [36] 2. CAP dataset [24,44] | C4-A1 and C3-A2 | 1. Accuracy: 86.40 Kappa: 81.00 2. Accuracy: 78.80 Kappa: 71.00 |
| Eldele et al. [45] | Multi-Resolution Convolutional Neural Network, Adaptive Feature Recalibration | Softmax | SHHS dataset [36] | C4-A1 | Accuracy: 84.20 Kappa: 78.00 |
| Yang et al. [46] | One-Dimensional Convolutional Neural Network, Hidden Markov model | One-Dimensional Convolutional Neural Network, Hidden Markov model | DRM-SUB dataset [42] | Pz-Oz | Accuracy: 83.23 Kappa: 76.00 |
| The Neurological Status | F | M | Age: Min–Max (Average) | Number of Patients |
|---|---|---|---|---|
| No pathology (controls/normal) | 9 | 7 | 23–42 (32.18) | 16 |
| Nocturnal frontal lobe epilepsy (NFLE) | 19 | 21 | 14–67 (30.27) | 40 |
| REM behavior disorder (RBD) | 3 | 19 | 58–82 (70.72) | 22 |
| Periodic leg movements (PLM) | 3 | 7 | 40–62 (55.10) | 10 |
| Insomnia | 5 | 4 | 47–82 (60.88) | 9 |
| Narcolepsy | 3 | 2 | 18–44 (31.60) | 5 |
| Sleep-disordered breathing (SDB) | - | 4 | 65–78(71.25) | 4 |
| Bruxism | - | 2 | 23–34 (28.50) | 2 |
| Total number of pathologies | 33 | 59 | 14–82 (49.19) | 92 |
| Num | Equation | Num | Equation |
|---|---|---|---|
| 1 | 10 | ||
| 2 | 11 | ||
| 3 | 12 | ||
| 4 | 13 | ||
| 5 | 14 | ||
| 6 | 15 | ||
| 7 | 16 | ||
| 8 | 17 | ||
| 9 | 18 |
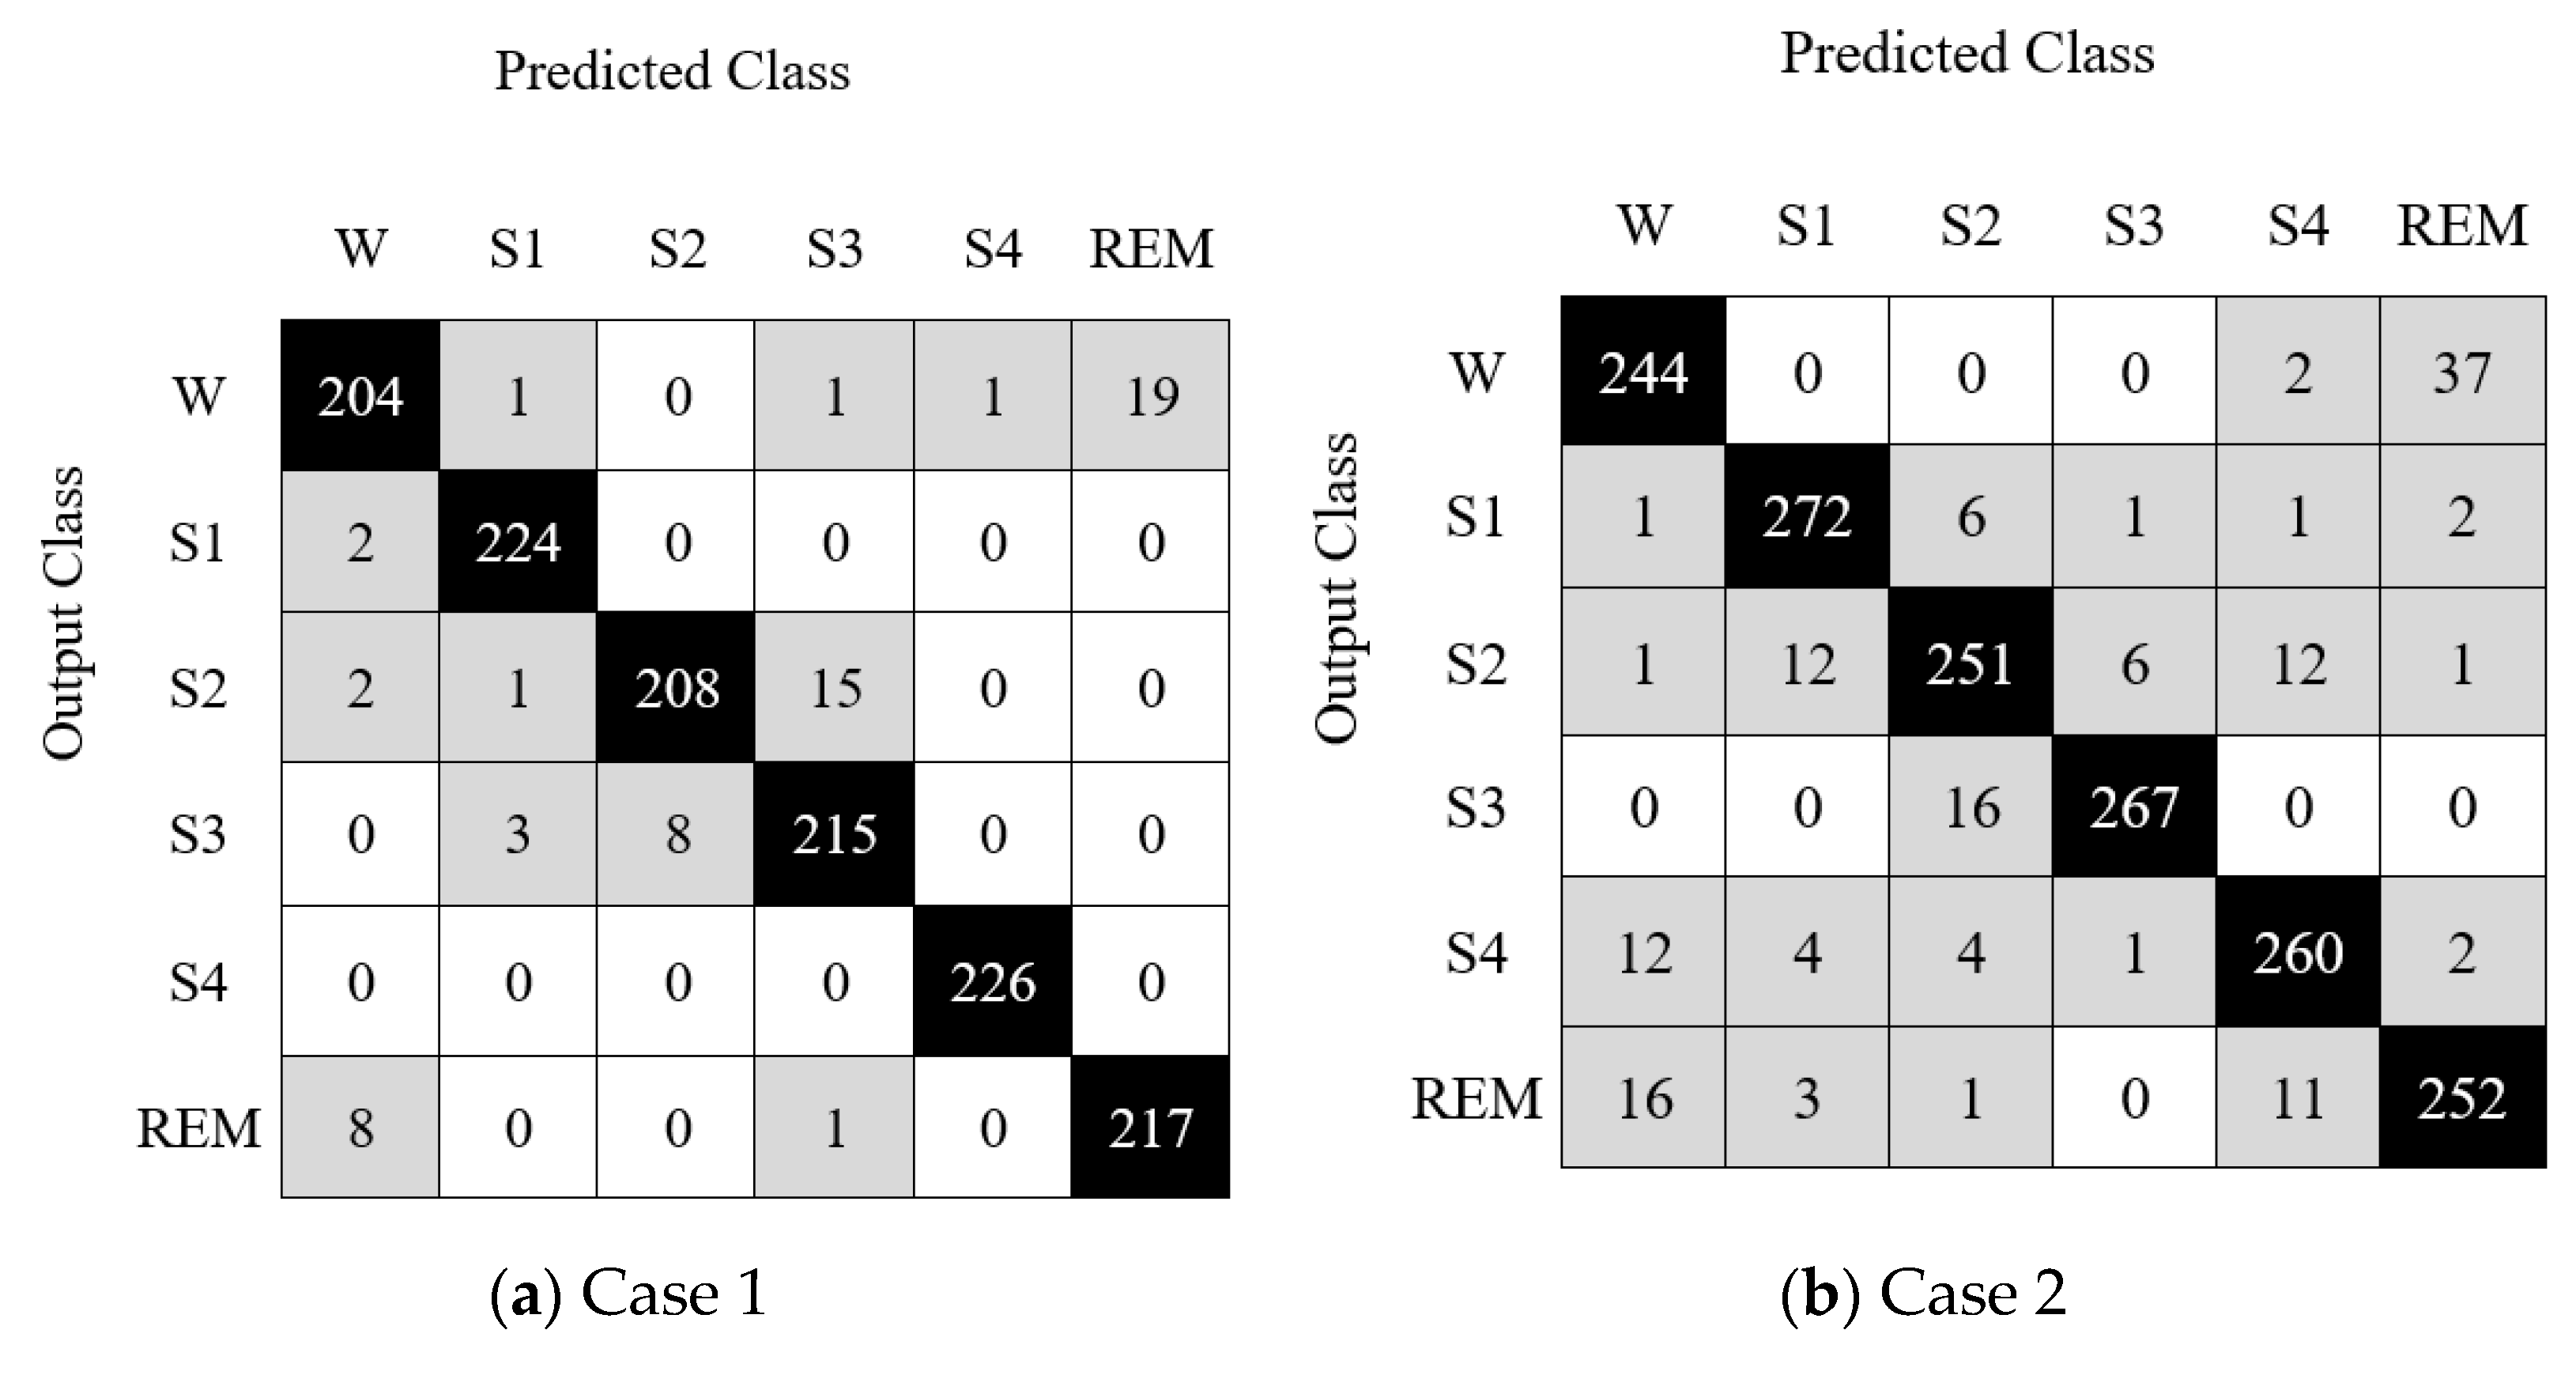
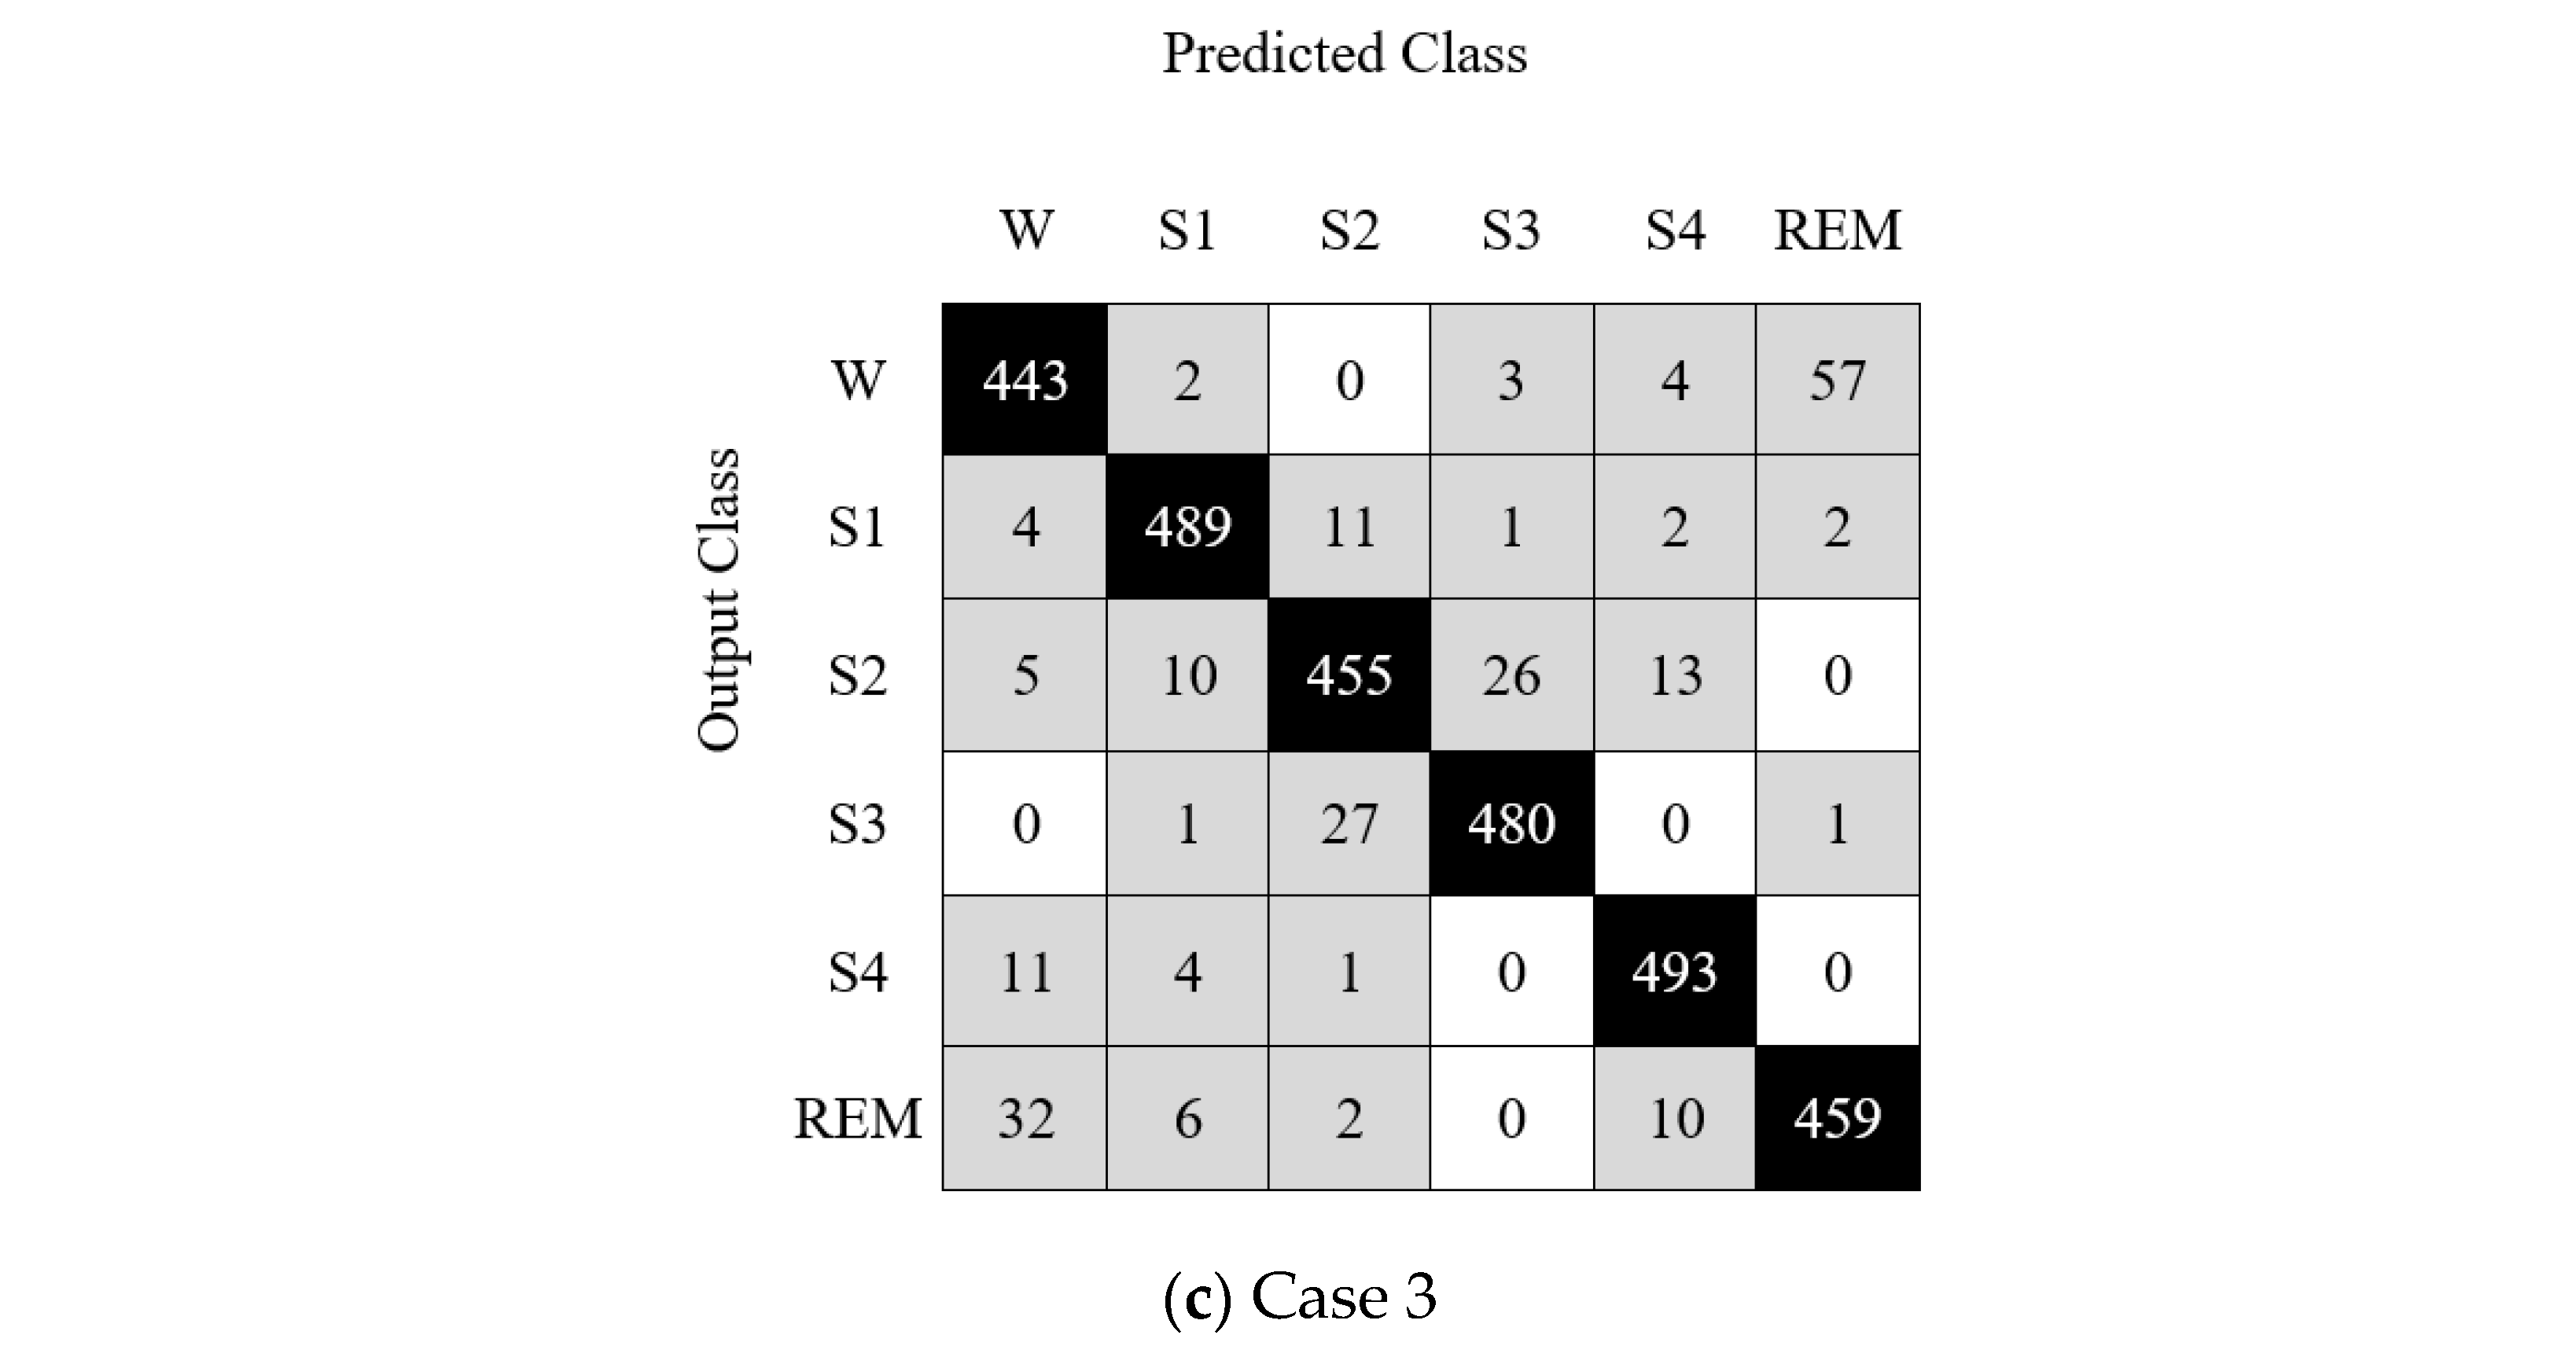
| Case | Accuracy | F1-Score | Average Precision | Geometric Mean | Sensitivity | Specificity |
|---|---|---|---|---|---|---|
| Case 1 | 95.43% | 95.42% | 95.46% | 95.36% | 90.27 | 98.94 |
| Case 2 | 91.05% | 90.01% | 90.08% | 89.95% | 86.22 | 97.17 |
| Case 3 | 92.31% | 92.29% | 92.29% | 92.23% | 87.03 | 97.96 |
| Fold | Case 1 | Case 2 | Case 3 |
|---|---|---|---|
| Fold-1 | 86.03 | 80.59 | 84.26 |
| Fold-2 | 97.06 | 94.12 | 92.46 |
| Fold-3 | 100.0 | 98.24 | 95.74 |
| Fold-4 | 88.97 | 93.53 | 93.77 |
| Fold-5 | 97.06 | 85.29 | 87.87 |
| Fold-6 | 94.85 | 95.88 | 95.08 |
| Fold-7 | 97.06 | 86.47 | 91.80 |
| Fold-8 | 100.0 | 95.88 | 98.36 |
| Fold-9 | 98.53 | 90.00 | 91.48 |
| Fold-10 | 94.70 | 90.48 | 92.23 |
| Overall | 95.43 | 91.05 | 92.31 |
| Phase | Steps | Computational Complexity |
|---|---|---|
| Feature generation | Pooling-based decomposition | |
| Statistical feature generation | ||
| Textural feature generation (L-tetrolet pattern) | ||
| Statistical features extraction of the textural features | ||
| TSRFINCA | Threshold feature selection | |
| ReliefF-based selection | ||
| INCA | ||
| Classification | SVM | |
| Total | ||
| Study | Dataset | Accuracy Result (%) |
|---|---|---|
| Bajaj and Pachori [65] | Sleep-EDF dataset [24,66] | 88.47 (Pz-Oz) |
| Hassan et al. [67] | Sleep-EDF database [24,66] | 90.69 (Pz-Oz) |
| Jiang et al. [68] | 1. Sleep-EDF database [24,66] 2. Sleep-EDF Expanded database [24] | 89.40 (Fpz-Cz) 88.30 (Pz-Oz) |
| Kanwal et al. [69] | Sleep-EDF database [24,66] | 93.00 (Pz-Oz, PFz-Cz, EOG) |
| Basha et al. [70] | Sleep-EDF database [24,66] | 90.20 (PFz-Cz) |
| Jadhav et al. [71] | Sleep-EDF Expanded database [24] | 85.07 (PFz-Cz) 82.92 (Pz-Oz) |
| Michielli et al. [72] | Sleep-EDF database [24,66] | 90.80 (Pz-Oz) |
| Huang et al. [73] | Sleep-EDF Expanded database [24] | 84.60 (Fpz-Cz) 82.30 (Pz-Oz) |
| Kim et al. [74] | CAP Sleep Database on PhysioNet [24] | 73.60 (unspecified) |
| Shanin et al. [75] | Collected data | 92.00 (C3-C4) |
| Karimzadeh et al. [76] | Sleep-EDF dataset [24,66] | 88.97 (Pz-Oz) |
| Seifpour et al. [77] | Sleep-EDF dataset [24,66] | 90.60 (Fpz-Cz) 88.60 (Pz-Oz) |
| Sharma et al. [3] | Sleep-EDF dataset [24,66] | 91.50 (Pz-Oz) |
| Zhou et al. [78] | 1. Sleep-EDF database [24,66] 2. Sleep-EDF Expanded database [24] | 1. 91.80 (Fpz-Cz) 2. 85.30 (Pz-Oz) |
| Zhang et al. [79] | 1. UCD dataset [24] 2. MIT-BIH polysomnographic database [24] | 1. 88.40 (C3-A2 + C4-A1) 2. 87.60 (C3-A2 + C4-A1) |
| Liu et al. [80] | Sleep-EDF Expanded database [24] | 84.44 (Fpz-Cz + Pz-Oz) |
| Cai et al. method [81] | Sleep-EDF database [24,66] | 87.21 (Fpz-Cz) |
| Loh et al. [82] | CAP Sleep Database [24,44] | 90.46 (C4-A1/C3-A2) |
| Sharma et al. [49] | CAP Sleep Database [24,44] | 85.10 (F4-C4 + C4-A1) |
| Dhok et al. [83] | CAP Sleep Database [24,44] | 87.45 (C4-C1/C3-A2) |
| Sharma et al. [84] | CAP Sleep Database [24,44] | 83.30 (C4-A1 + F4-C4) |
| The proposed method | CAP Sleep Database on PhysioNet [24] | Case1: 95.43 (F4-C4) Case2: 91.05 (F4-C4) Case3: 92.31 (F4-C4) |
Publisher’s Note: MDPI stays neutral with regard to jurisdictional claims in published maps and institutional affiliations. |
© 2022 by the authors. Licensee MDPI, Basel, Switzerland. This article is an open access article distributed under the terms and conditions of the Creative Commons Attribution (CC BY) license (https://creativecommons.org/licenses/by/4.0/).
Share and Cite
Barua, P.D.; Tuncer, I.; Aydemir, E.; Faust, O.; Chakraborty, S.; Subbhuraam, V.; Tuncer, T.; Dogan, S.; Acharya, U.R. L-Tetrolet Pattern-Based Sleep Stage Classification Model Using Balanced EEG Datasets. Diagnostics 2022, 12, 2510. https://doi.org/10.3390/diagnostics12102510
Barua PD, Tuncer I, Aydemir E, Faust O, Chakraborty S, Subbhuraam V, Tuncer T, Dogan S, Acharya UR. L-Tetrolet Pattern-Based Sleep Stage Classification Model Using Balanced EEG Datasets. Diagnostics. 2022; 12(10):2510. https://doi.org/10.3390/diagnostics12102510
Chicago/Turabian StyleBarua, Prabal Datta, Ilknur Tuncer, Emrah Aydemir, Oliver Faust, Subrata Chakraborty, Vinithasree Subbhuraam, Turker Tuncer, Sengul Dogan, and U. Rajendra Acharya. 2022. "L-Tetrolet Pattern-Based Sleep Stage Classification Model Using Balanced EEG Datasets" Diagnostics 12, no. 10: 2510. https://doi.org/10.3390/diagnostics12102510