
SARS-CoV-2 Antigen Test Results to Infer Active or Non-Active Virus Replication Status in COVID-19 Patients

 ,
, 
Abstract
:1. Introduction
2. Materials and Methods
3. Results

| Standard Q | Standard F | Lumipulse | sgRNA | ||||||||||
|---|---|---|---|---|---|---|---|---|---|---|---|---|---|
| Characteristic | Total | Positive | Negative | p-Value | Positive | Negative | p-Value | Positive | Negative | p-Value | Positive | Negative | p-Value |
| Total no. (%) | 102 (100) | 50 (49.0) | 52 (51.0) | 66 (64.7) | 36 (35.3) | 95 (93.1) | 7 (6.9) | 63 (61.8) | 39 (38.2) | ||||
| Patients, n = 102 | |||||||||||||
| Age | 62.8 (45.7–78.8) | 64.4 (52.8–79.1) | 61.5 (42.5–75.1) | 0.18 | 64.5 (52.8–79.5) | 60.4 (38.3–68.4) | 0.01 | 62.7 (45.7–78.8) | 64.7 (28.9–80.8) | 0.66 | 61.5 (49.1–76.0) | 64.7 (42.7–80.2) | 0.85 |
| Male sex | 53 (52.0) | 23 (46.0) | 30 (57.7) | 0.24 | 34 (51.5) | 19 (52.8) | 0.90 | 49 (51.6) | 4 (57.1) | 0.77 | 29 (46.0) | 24 (61.5) | 0.13 |
| Type of illness | |||||||||||||
| Asymptomatic | 20 (19.6) | 8 (16.0) | 12 (23.1) | 0.37 | 10 (15.2) | 10 (27.7) | 0.13 | 18 (19.0) | 2 (28.6) | 0.54 | 12 (19.1) | 8 (20.5) | 0.85 |
| Mild | 14 (13.7) | 5 (10.0) | 9 (17.3) | 0.28 | 5 (7.5) | 9 (25.0) | 0.01 | 12 (12.6) | 2 (28.6) | 0.24 | 6 (9.5) | 8 (20.5) | 0.11 |
| Moderate | 17 (16.7) | 6 (12.0) | 11 (21.1) | 0.21 | 12 (18.2) | 5 (13.9) | 0.58 | 17 (17.9) | 0 (0.0) | 0.22 | 10 (15.9) | 7 (18.0) | 0.78 |
| Severe | 32 (31.4) | 19 (38.0) | 13 (25.0) | 0.15 | 26 (39.4) | 6 (16.7) | 0.01 | 31 (32.6) | 1 (14.2) | 0.31 | 21 (33.3) | 11 (28.2) | 0.58 |
| Critical | 19 (18.6) | 12 (24.0) | 7 (13.5) | 0.17 | 13 (19.7) | 6 (16.7) | 0.70 | 17 (17.9) | 2 (28.6) | 0.48 | 14 (22.2) | 5 (12.8) | 0.23 |
| Samples, n = 102 | |||||||||||||
| Diagnostic RT-PCR Ct | 24.6 (18.6–30.2) | 18.6 (16.3–21.0) | 30.1 (27.1–33.6) | <0.001 | 19.6 (17.1–24.4) | 32.2 (29.3–35.0) | <0.001 | 24.1 (18.5–29.2) | 35.1 (32.8–35.5) | <0.001 | 19.5 (17.0–24.1) | 32.4 (28.9–35.1) | <0.001 |
| sgRNA RT-PCR Ct b | 33.0 (28.4–36.4) | 30.5 (28.0–34.1) | 37.4 (33.0–38.9) | <0.001 | 31.9 (28.0–36.1) | 37.0 (35.0–39.9) | 0.008 | 33.0 (28.4–36.4) | 33.0 (28.4–36.4) | ||||
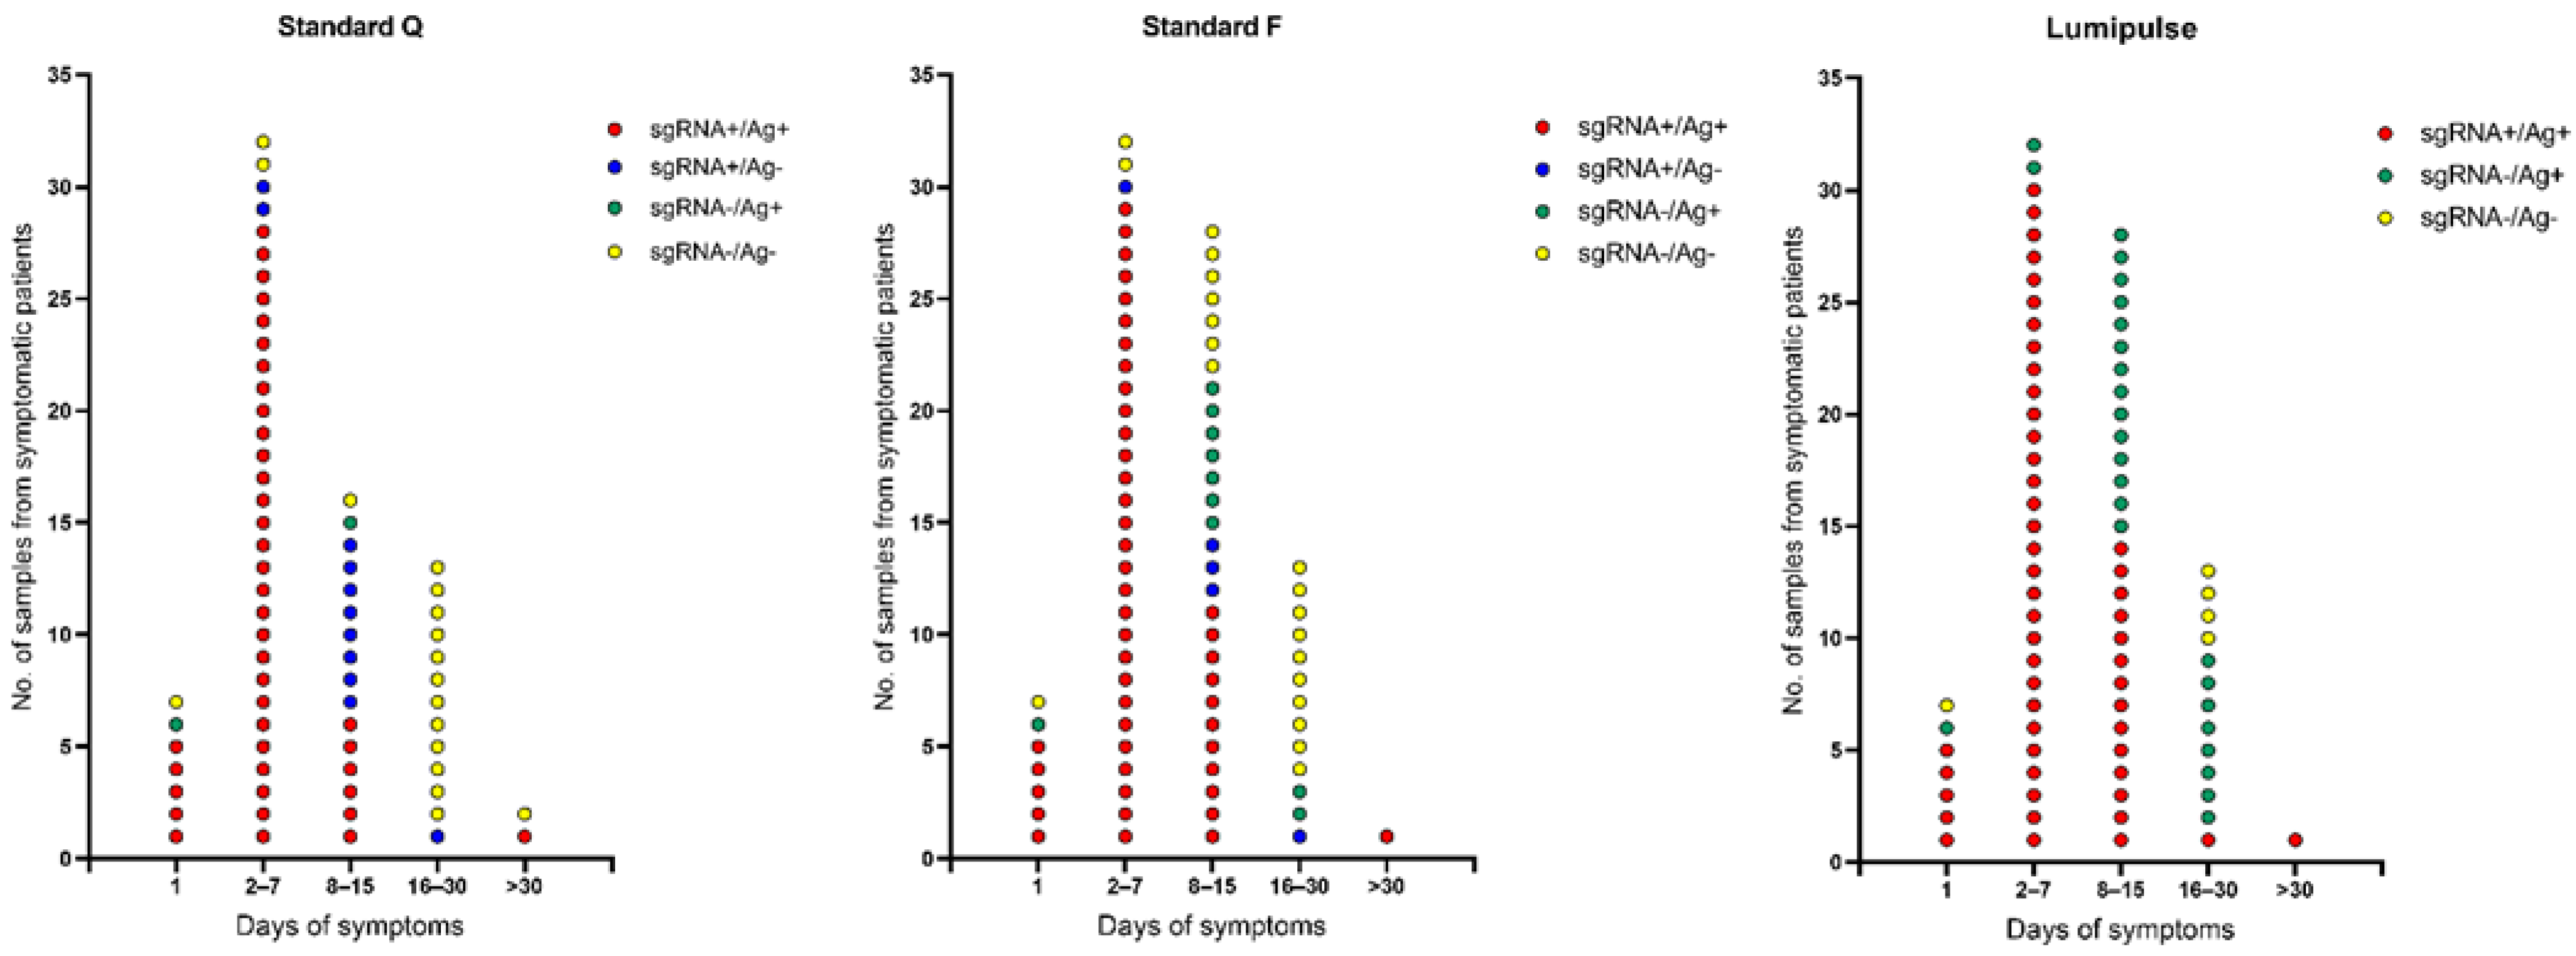
| Days after onset of symptoms when sample was collected, n = 82 | |||||||||||||
| 1 | 7 (6.9) | 6 (12.0) | 1 (1.9) | 0.04 | 6 (9.1) | 1 (2.8) | 0.23 | 6 (6.3) | 1 (14.3) | 0.42 | 5 (7.9) | 2 (5.1) | 0.58 |
| 2–7 | 32 (31.4) | 28 (56.0) | 4 (7.7) | <0.001 | 29 (43.9) | 3 (8.3) | <0.001 | 32 (33.7) | 0 (0.0) | 0.06 | 30 (47.6) | 2 (5.1) | <0.001 |
| 8–15 | 28 (27.4) | 7 (14.0) | 21 (40.4) | 0.003 | 18 (27.3) | 10 (27.8) | 0.96 | 28 (29.5) | 0 (0.0) | 0.09 | 14 (22.2) | 14 (35.9) | 0.13 |
| 16–30 | 13 (12.7) | 0 (0.0) | 13 (25.0) | <0.001 | 2 (3.0) | 11 (30.6) | <0.001 | 9 (9.5) | 4 (57.1) | <0.001 | 1 (1.6) | 12 (30.8) | <0.001 |
| >30 | 2 (2.0) | 1 (2.0) | 1 (1.9) | 0.97 | 1 (1.5) | 1 (2.8) | 0.66 | 2 (2.1) | 0 (0.0) | 0.69 | 1 (1.6) | 1 (2.6) | 0.73 |
| Day(s) of Symptoms to Antigen Testing | No. Samples with Results | Agreement between Antigen and sgRNA Results (95% Confidence Interval) | |||||
|---|---|---|---|---|---|---|---|
| Total | Antigen Positive/ sgRNA Positive | Antigen Negative/ sgRNA Negative | Antigen Positive/ sgRNA Negative | Antigen Negative/ sgRNA Positive | Positive Percent Agreement | Negative Percent Agreement | |
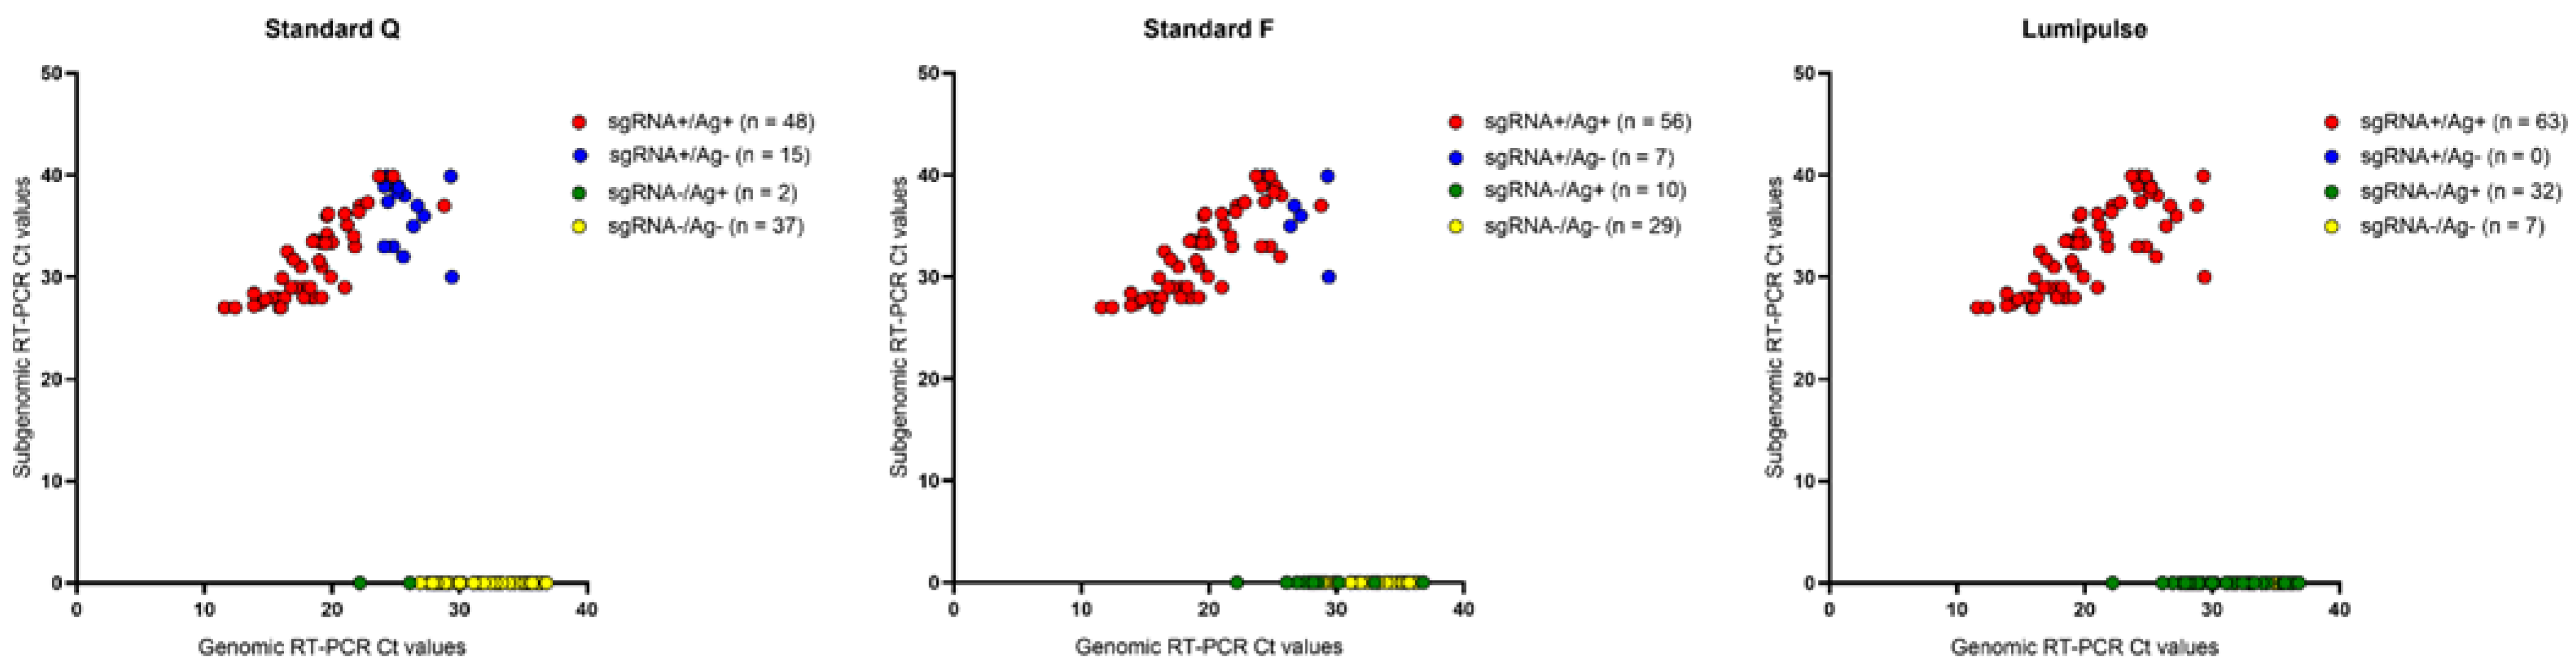
| Standard Q (all samples) | 102 | 48 | 37 | 2 | 15 | 76.2 (63.8–86.0) | 94.9 (82.7–99.4) |
| Asymptomatic | 20 | 8 | 8 | 0 | 4 | 66.7 (34.9–90.1) | 100.0 (63.1–100) |
| 1 day | 7 | 5 | 1 | 1 | 0 | 100 (47.8–100) | 50.0 (1.3–98.7) |
| 2–7 days | 32 | 28 | 2 | 0 | 2 | 93.3 (77.9–99.2) | 100 (15.8–100) |
| 8–15 days | 28 | 6 | 13 | 1 | 8 | 42.9 (17.7–71.1) | 92.9 (66.1–99.8) |
| 16–30 days | 13 | 0 | 12 | 0 | 1 | 0.0 (0.0–97.5) | 100 (73.0–100) |
| >30 days | 2 | 1 | 1 | 0 | 0 | 100 (2.5–100) | 100 (2.5–100) |
| Standard F (all samples) | 102 | 56 | 29 | 10 | 7 | 88.9 (78.4–95.4) | 74.4 (57.9–87.0) |
| Asymptomatic | 20 | 10 | 8 | 0 | 2 | 83.3 (51.6–97.9) | 100 (63.1–100) |
| 1 day | 7 | 5 | 1 | 1 | 0 | 100 (47.8–100) | 50.0 (1.3–98.7) |
| 2–7 days | 32 | 29 | 2 | 0 | 1 | 96.7 (82.8–99.9) | 100 (15.8–100) |
| 8–15 days | 28 | 11 | 7 | 7 | 3 | 78.6 (49.2–95.3) | 50.0 (23.0–77.0) |
| 16–30 days | 13 | 0 | 10 | 2 | 1 | 0.0 (0.0–97.5) | 83.3 (51.6–97.9) |
| >30 days | 2 | 1 | 1 | 0 | 0 | 100 (2.5–100) | 100 (2.5–100) |
| Lumipulse (all samples) | 102 | 63 | 7 | 32 | 0 | 100 (94.3–100) | 17.9 (7.5–33.5) |
| Asymptomatic | 20 | 12 | 2 | 6 | 0 | 100 (73.5–100) | 25.0 (3.2–65.1) |
| 1 day | 7 | 5 | 1 | 1 | 0 | 100 (47.8–100) | 50.0 (1.3–98.7) |
| 2–7 days | 32 | 30 | 0 | 2 | 0 | 100 (88.4–100) | 0.0 (0.0–84.2) |
| 8–15 days | 28 | 14 | 0 | 14 | 0 | 100 (76.8–100) | 0.0 (0.0–23.29) |
| 16–30 days | 13 | 1 | 4 | 8 | 0 | 100 (2.5–100) | 33.3 (9.9–65.1) |
| >30 days | 2 | 1 | 0 | 1 | 0 | 100 (2.5–100) | 0.0 (0.0–97.5) |

4. Discussion
Author Contributions
Funding
Institutional Review Board Statement
Informed Consent Statement
Data Availability Statement
Conflicts of Interest
References
- van Kasteren, P.B.; van Der Veer, B.; van den Brink, S.; Wijsman, L.; de Jonge, J.; van den Brandt, A.; Molenkamp, R.; Reusken, C.B.; Meijer, A. Comparison of seven commercial RT-PCR diagnostic kits for COVID-19. J. Clin. Virol. 2020, 128, 104412. [Google Scholar] [CrossRef] [PubMed]
- Binnicker, M.J. Can testing predict SARS-CoV-2 infectivity? The potential for certain methods to be surrogates for replication-competent virus. J. Clin. Microbiol. 2021, 59, e0046921. [Google Scholar] [CrossRef] [PubMed]
- Stelzer-Braid, S.; Walker, G.J.; Aggarwal, A.; Isaacs, S.R.; Yeang, M.; Naing, Z.; Stella, A.O.; Turville, S.G.; Rawlinson, W.D. Virus isolation of severe acute respiratory syndrome coronavirus 2 (SARS-CoV-2) for diagnostic and research purposes. Pathology 2020, 52, 760–763. [Google Scholar] [CrossRef] [PubMed]
- Wölfel, R.; Corman, V.M.; Guggemos, W.; Seilmaier, M.; Zange, S.; Müller, M.A.; Niemeyer, D.; Jones, T.C.; Vollmar, P.; Rothe, C.; et al. Virological assessment of hospitalized patients with COVID-2019. Nature 2020, 581, 465–469. [Google Scholar] [CrossRef] [PubMed] [Green Version]
- Perera, R.A.; Tso, E.; Tsang, O.T.; Tsang, D.N.; Fung, K.; Leung, Y.W.; Chin, A.W.; Chu, D.K.; Cheng, S.M.; Poon, L.L.; et al. SARS-CoV-2 virus culture and subgenomic RNA for respiratory specimens from patients with mild coronavirus disease. Emerg. Infect. Dis. 2020, 26, 2701–2704. [Google Scholar] [CrossRef] [PubMed]
- Santos Bravo, M.; Berengua, C.; Marín, P.; Esteban, M.; Rodriguez, C.; Del Cuerpo, M.; Miró, E.; Cuesta, G.; Mosquera, M.; Sánchez-Palomino, S.; et al. Viral culture confirmed SARS-CoV-2 subgenomic RNA value as a good surrogate marker of infectivity. J. Clin. Microbiol. 2022, 60, e0160921. [Google Scholar] [CrossRef] [PubMed]
- Hanson, K.E.; Altayar, O.; Caliendo, A.M.; Arias, C.A.; Englund, J.A.; Hayden, M.K.; Lee, M.J.; Loeb, M.; Patel, R.; El Alayli, A.; et al. The Infectious Diseases Society of America guidelines on the diagnosis of COVID-19: Antigen testing. Clin. Infect. Dis. 2021, ciab557. [Google Scholar] [CrossRef] [PubMed]
- Fragkou, P.C.; De Angelis, G.; Menchinelli, G.; Can, F.; Garcia, F.; Morfin-Sherpa, F.; Dimopoulou, D.; Mack, E.; de Salazar, A.; Grossi, A.; et al. ESCMID COVID-19 guidelines: Diagnostic testing for SARS-CoV-2. Clin. Microbiol. Infect. 2022, 28, 812–822. [Google Scholar] [CrossRef] [PubMed]
- Immergluck, K.; Gonzalez, M.D.; Frediani, J.K.; Levy, J.M.; Figueroa, J.; Wood, A.; Rogers, B.B.; O’Neal, J.; Elias-Marcellin, R.; Suessmith, A.; et al. Correlation of SARS-CoV-2 subgenomic RNA with antigen detection in nasal midturbinate swab specimens. Emerg. Infect. Dis. 2021, 27, 2887–2891. [Google Scholar] [CrossRef] [PubMed]
- Liotti, F.M.; Menchinelli, G.; Marchetti, S.; Morandotti, G.A.; Sanguinetti, M.; Posteraro, B.; Cattani, P. Evaluation of three commercial assays for SARS-CoV-2 molecular detection in upper respiratory tract samples. Eur. J. Clin. Microbiol. Infect. Dis. 2021, 40, 269–277. [Google Scholar] [CrossRef] [PubMed]
- Liotti, F.M.; Menchinelli, G.; Marchetti, S.; Posteraro, B.; Landi, F.; Sanguinetti, M.; Cattani, P. Assessment of SARS-CoV-2 RNA test results among patients who recovered from COVID-19 with prior negative results. JAMA Intern. Med. 2021, 181, 702–704. [Google Scholar] [CrossRef] [PubMed]
- Menchinelli, G.; Bordi, L.; Liotti, F.M.; Palucci, I.; Capobianchi, M.R.; Sberna, G.; Lalle, E.; Romano, L.; De Angelis, G.; Marchetti, S.; et al. Lumipulse G SARS-CoV-2 Ag assay evaluation using clinical samples from different testing groups. Clin. Chem. Lab. Med. 2021, 59, 1468–1476. [Google Scholar] [CrossRef] [PubMed]
- Scheiblauer, H.; Filomena, A.; Nitsche, A.; Puyskens, A.; Corman, V.M.; Drosten, C.; Zwirglmaier, K.; Lange, C.; Emmerich, P.; Müller, M.; et al. Comparative sensitivity evaluation for 122 CE-marked rapid diagnostic tests for SARS-CoV-2 antigen, Germany, September 2020 to April 2021. Eurosurveillance 2021, 26, 2100441. [Google Scholar] [CrossRef] [PubMed]
- He, X.; Lau, E.H.; Wu, P.; Deng, X.; Wang, J.; Hao, X.; Lau, Y.C.; Wong, J.Y.; Guan, Y.; Tan, X.; et al. Temporal dynamics in viral shedding and transmissibility of COVID-19. Nat. Med. 2020, 26, 672–675. [Google Scholar] [CrossRef] [PubMed] [Green Version]
- Pekosz, A.; Parvu, V.; Li, M.; Andrews, J.C.; Manabe, Y.C.; Kodsi, S.; Gary, D.S.; Roger-Dalbert, C.; Leitch, J.; Cooper, C.K. Antigen-based testing but not real-time polymerase chain reaction correlates with severe acute respiratory syndrome coronavirus 2 viral culture. Clin. Infect. Dis. 2021, 73, e2861–e2866. [Google Scholar] [CrossRef] [PubMed]
- Kohmer, N.; Toptan, T.; Pallas, C.; Karaca, O.; Pfeiffer, A.; Westhaus, S.; Widera, M.; Berger, A.; Hoehl, S.; Kammel, M.; et al. The comparative clinical performance of four SARS-CoV-2 rapid antigen tests and their correlation to infectivity in vitro. J. Clin. Med. 2021, 10, 328. [Google Scholar] [CrossRef] [PubMed]
- Mencacci, A.; Gili, A.; Gidari, A.; Schiaroli, E.; Russo, C.; Cenci, E.; Camilloni, B.; Graziani, A.; Melelli-Roia, A.; Francisci, D.; et al. Role of nucleocapsid protein antigen detection for safe end of isolation of SARS-CoV-2 infected patients with long persistence of viral RNA in respiratory samples. J. Clin. Med. 2021, 10, 4037. [Google Scholar] [CrossRef] [PubMed]

Publisher’s Note: MDPI stays neutral with regard to jurisdictional claims in published maps and institutional affiliations. |
© 2022 by the authors. Licensee MDPI, Basel, Switzerland. This article is an open access article distributed under the terms and conditions of the Creative Commons Attribution (CC BY) license (https://creativecommons.org/licenses/by/4.0/).
Share and Cite
De Angelis, G.; Menchinelli, G.; Liotti, F.M.; Marchetti, S.; Salustri, A.; Vella, A.; Santangelo, R.; Posteraro, B.; Sanguinetti, M. SARS-CoV-2 Antigen Test Results to Infer Active or Non-Active Virus Replication Status in COVID-19 Patients. Diagnostics 2022, 12, 1338. https://doi.org/10.3390/diagnostics12061338
De Angelis G, Menchinelli G, Liotti FM, Marchetti S, Salustri A, Vella A, Santangelo R, Posteraro B, Sanguinetti M. SARS-CoV-2 Antigen Test Results to Infer Active or Non-Active Virus Replication Status in COVID-19 Patients. Diagnostics. 2022; 12(6):1338. https://doi.org/10.3390/diagnostics12061338
Chicago/Turabian StyleDe Angelis, Giulia, Giulia Menchinelli, Flora Marzia Liotti, Simona Marchetti, Alessandro Salustri, Antonietta Vella, Rosaria Santangelo, Brunella Posteraro, and Maurizio Sanguinetti. 2022. "SARS-CoV-2 Antigen Test Results to Infer Active or Non-Active Virus Replication Status in COVID-19 Patients" Diagnostics 12, no. 6: 1338. https://doi.org/10.3390/diagnostics12061338