
Biasing Influence of ‘Mental Shortcuts’ on Diagnostic Decision-Making: Radiologists Can Overlook Breast Cancer in Mammograms When Prior Diagnostic Information Is Available


Abstract
:1. Introduction
2. Materials and Methods
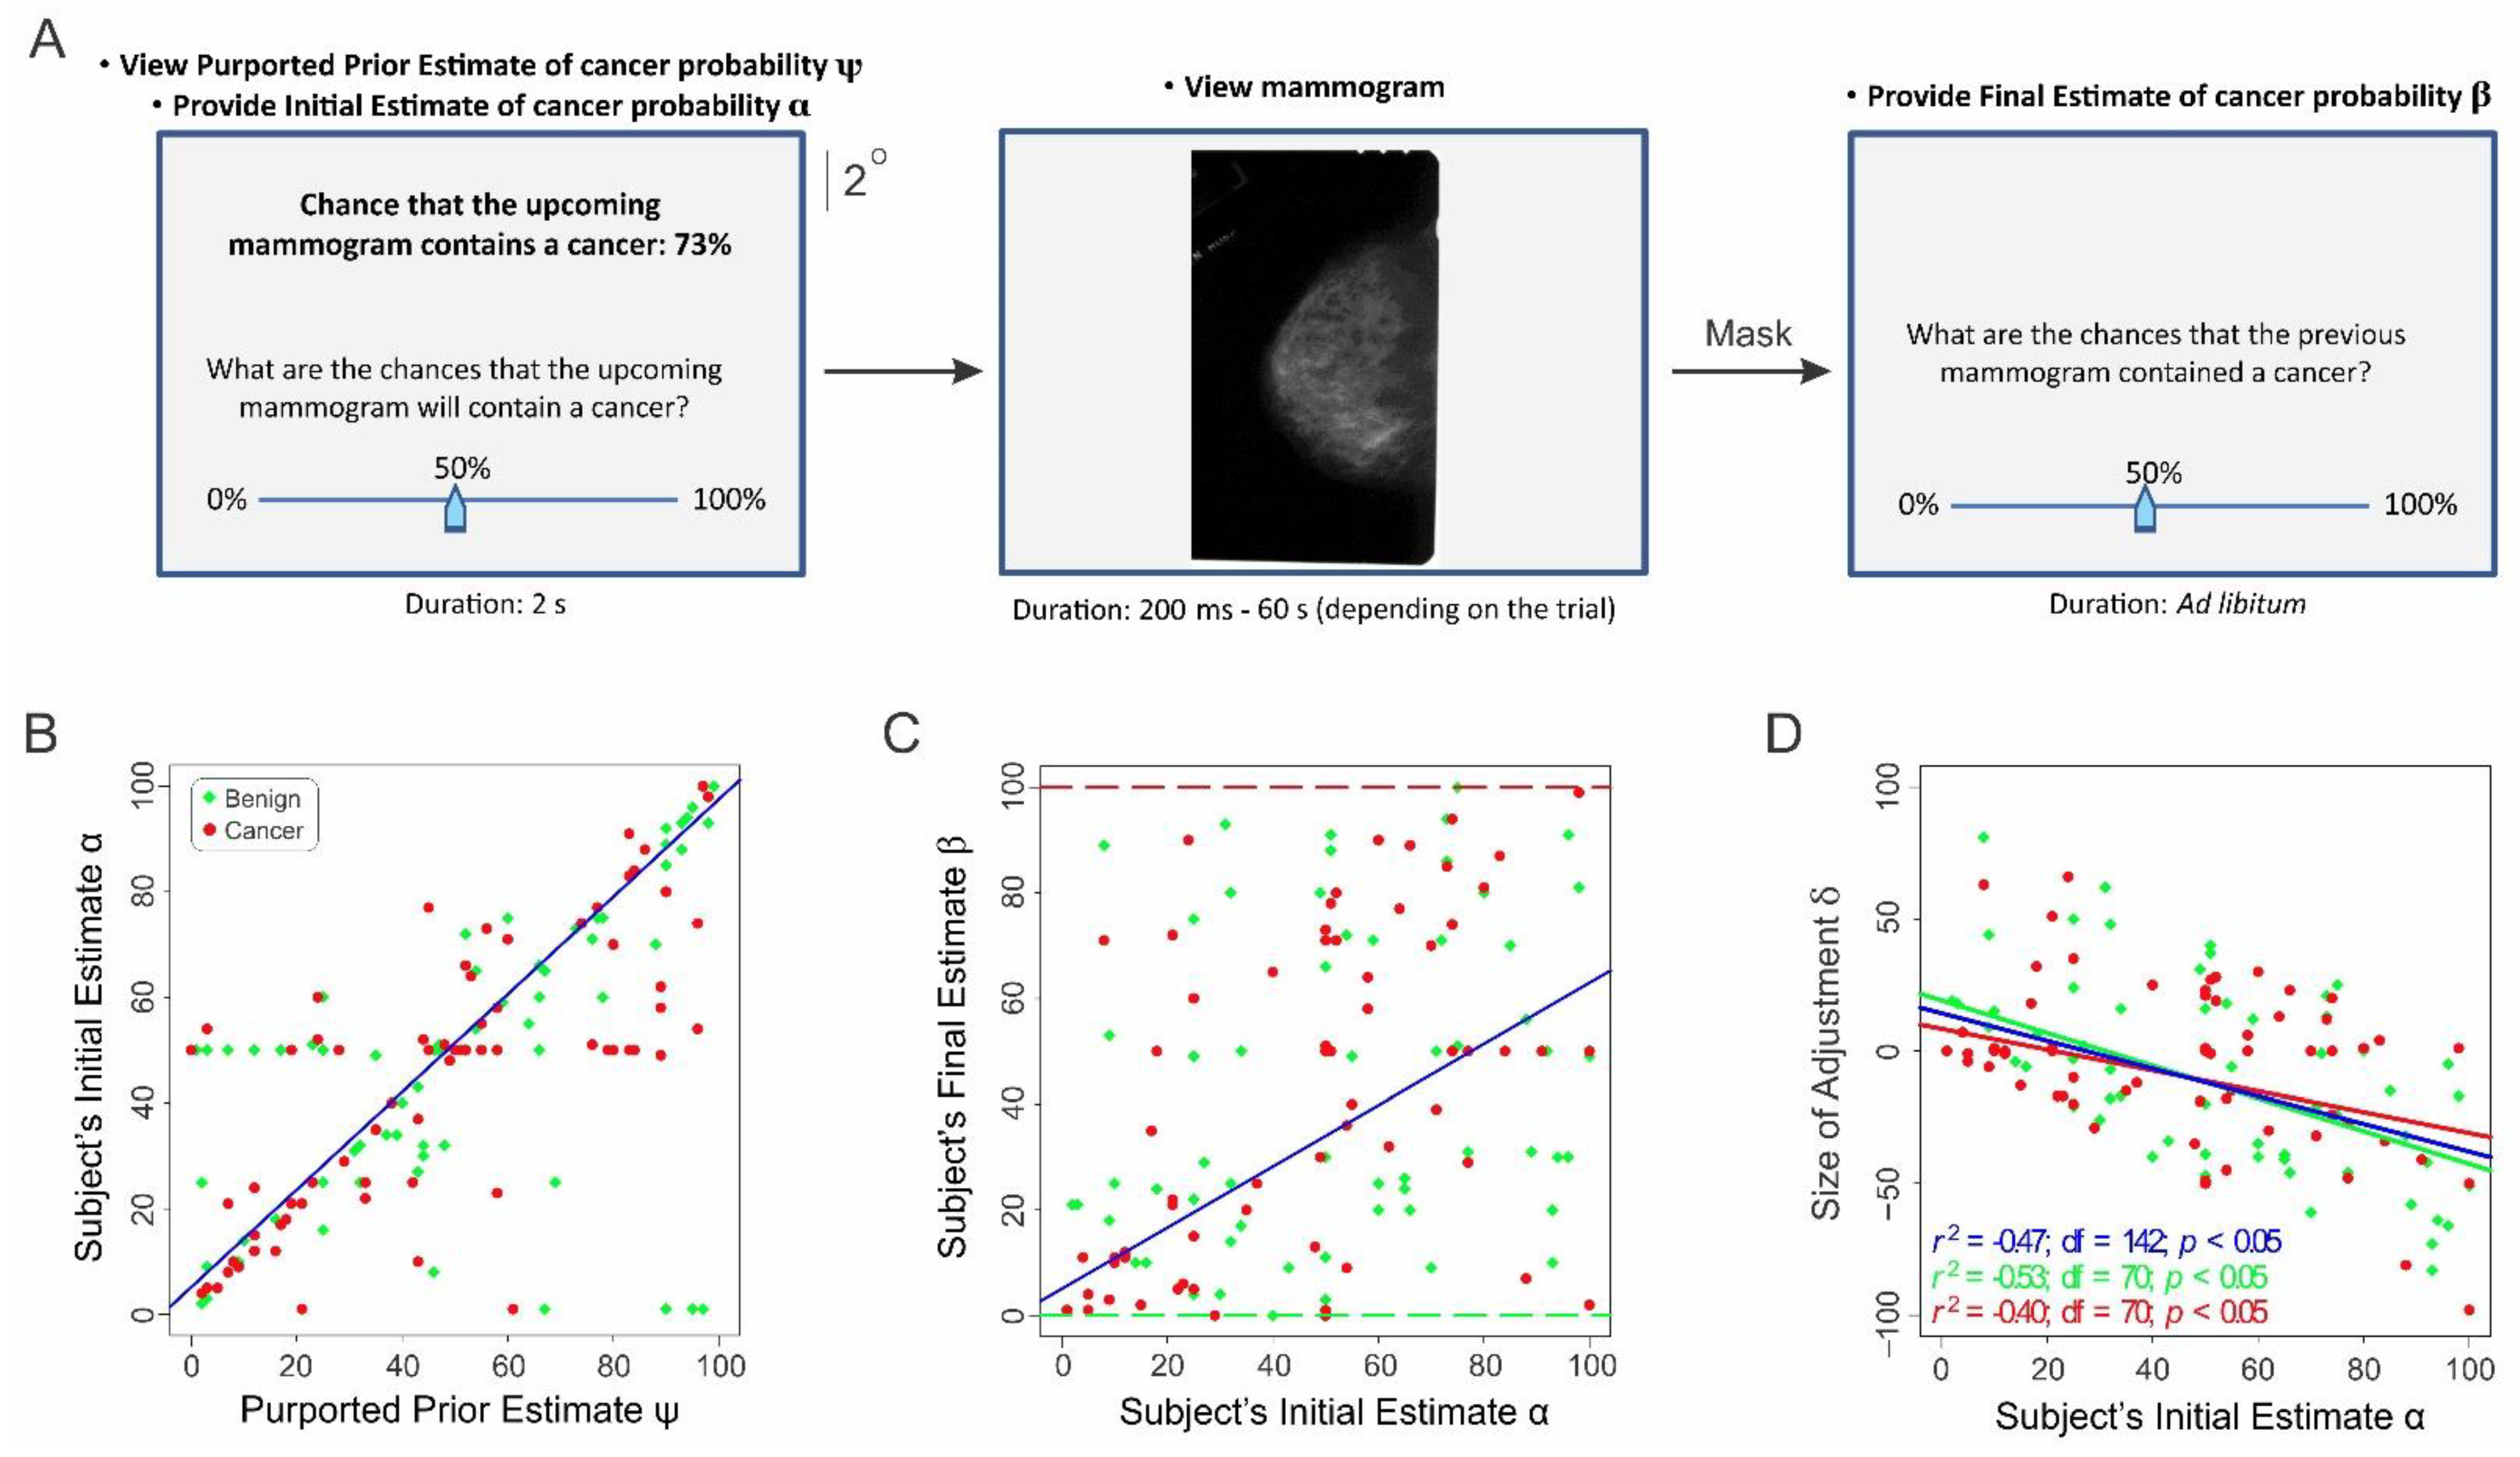
2.1. Study 1
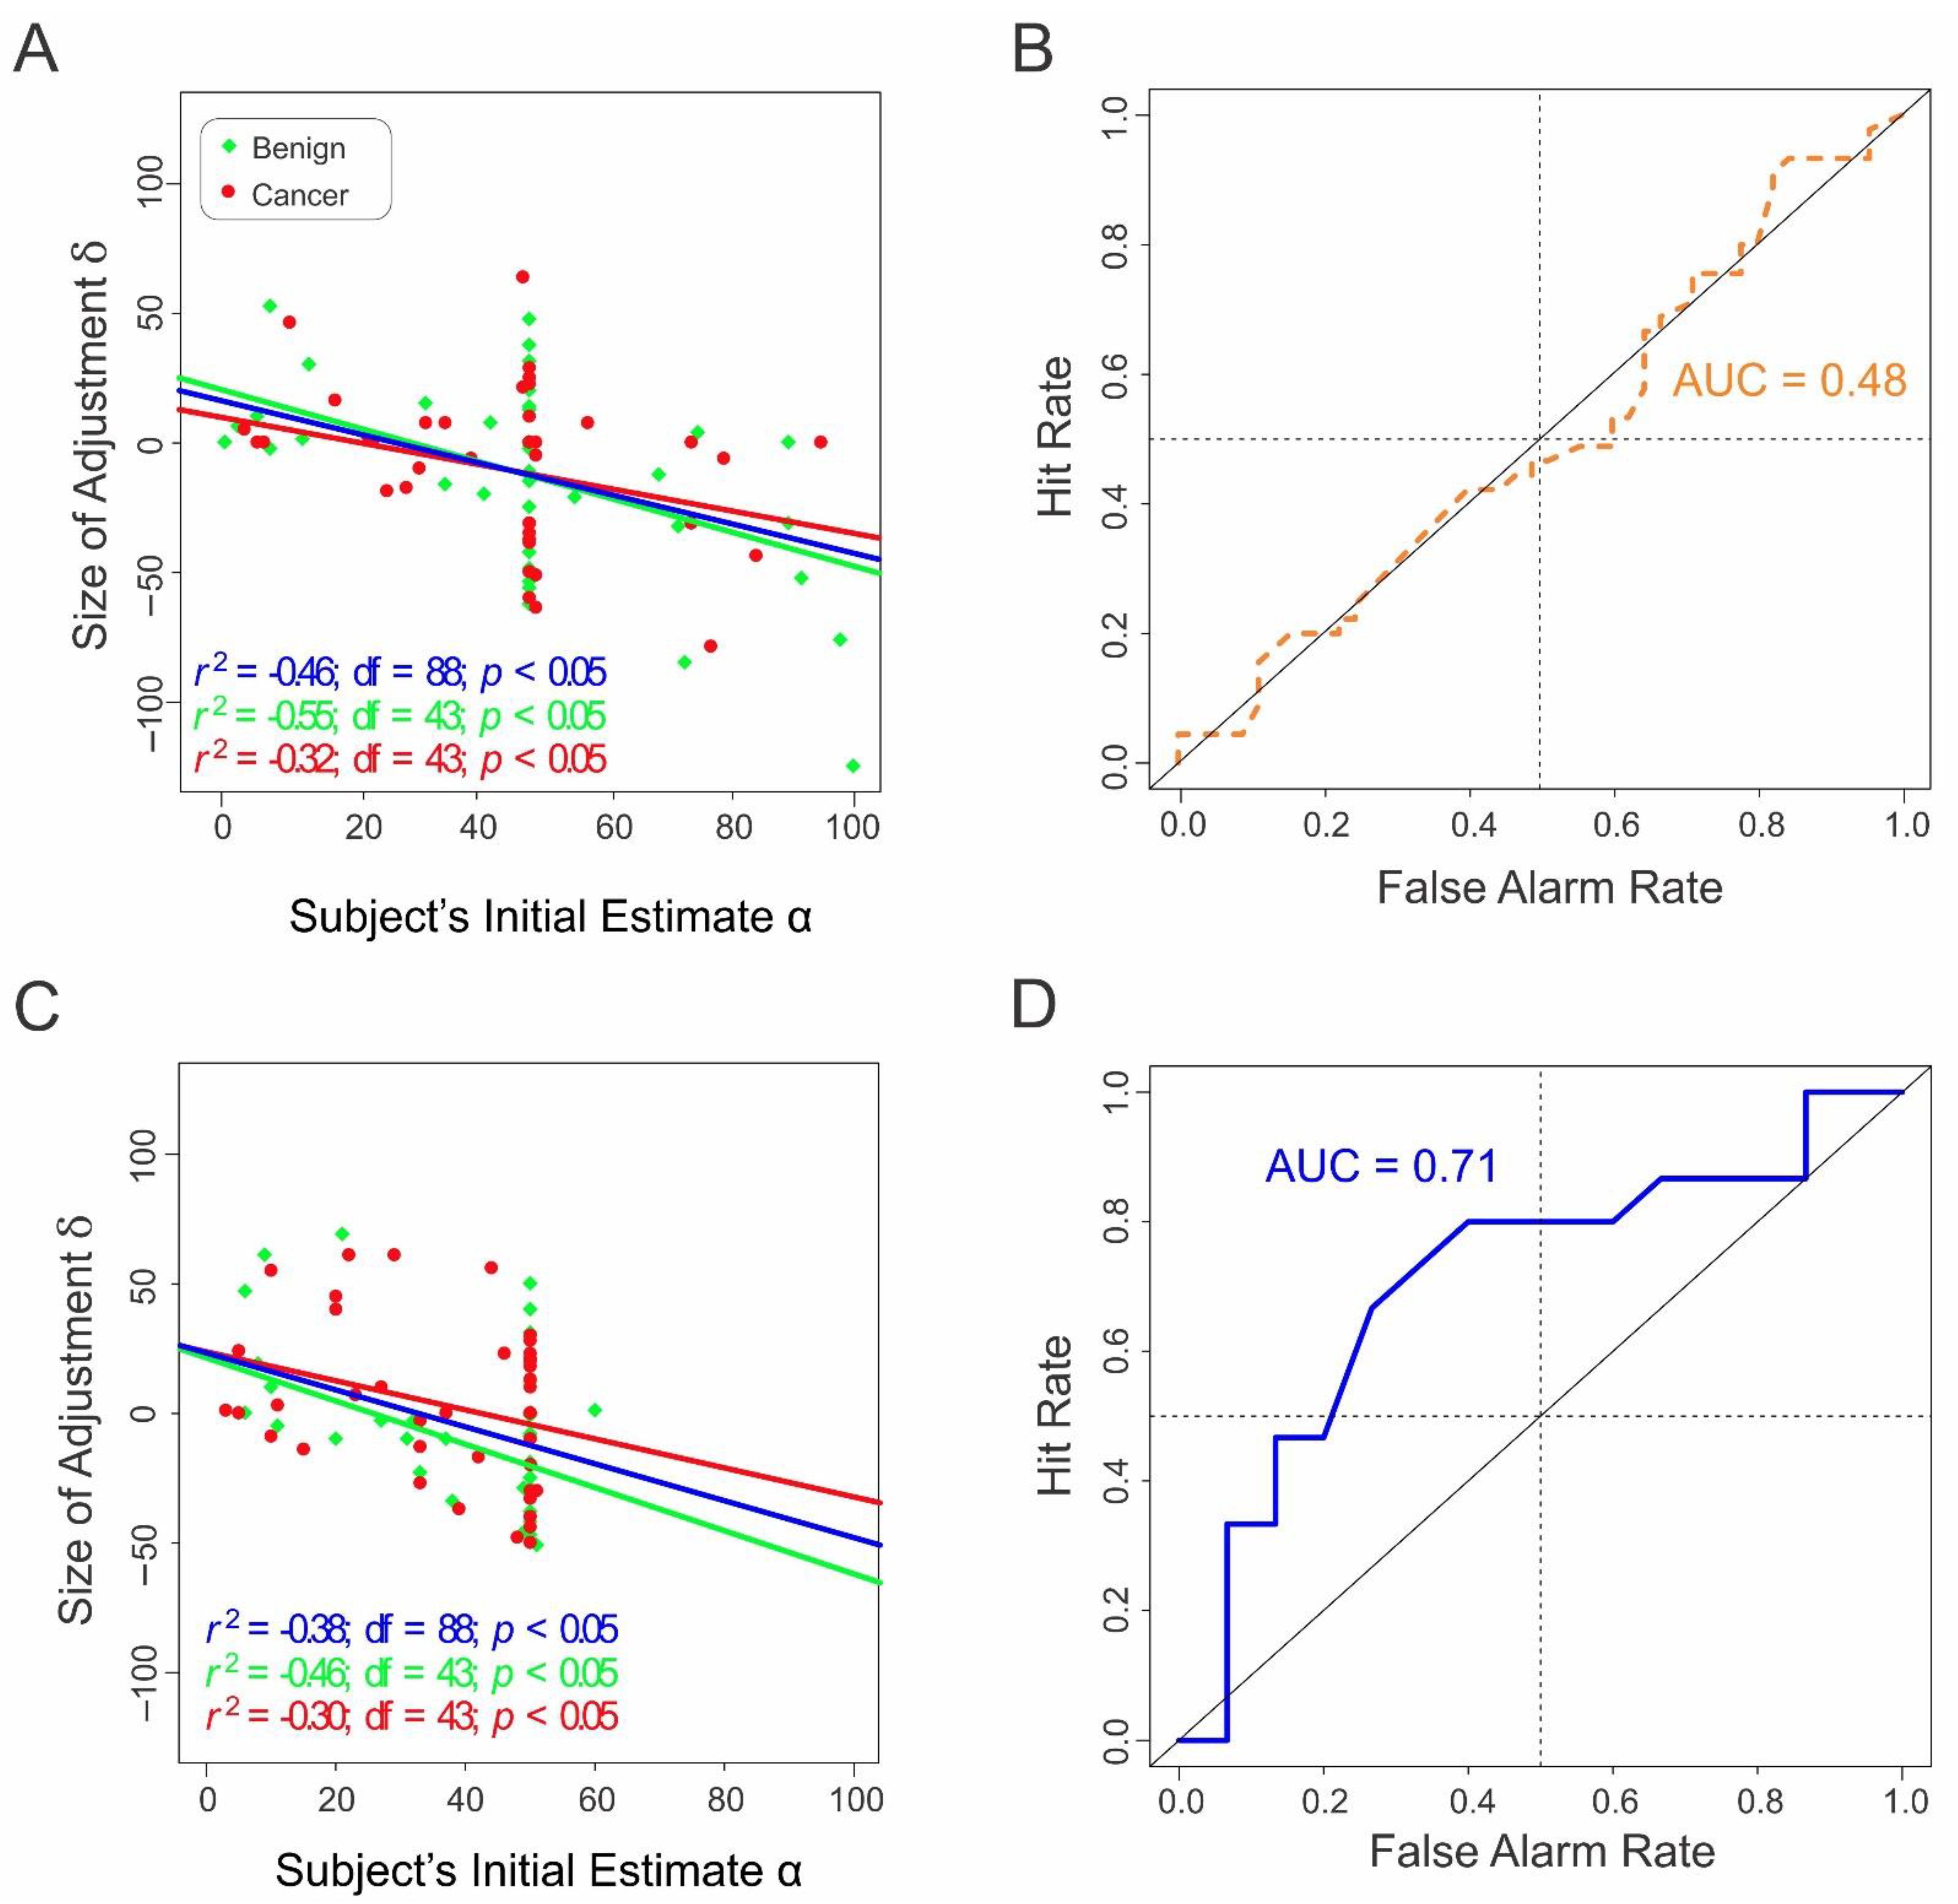
2.2. Study 2
3. Results
Radiologists’ Final Estimates Are Adjusted Versions of Their Initial Estimates
4. Discussion
4.1. Interaction of Top-Down vs. Bottom-Up Factors during Diagnostic Decision-Making
4.2. Effects of the Anchoring Information on the Final Estimates
4.3. Important Caveats and Future Directions
Supplementary Materials
Author Contributions
Funding
Institutional Review Board Statement
Informed Consent Statement
Data Availability Statement
Acknowledgments
Conflicts of Interest
References
- Simon, H.A. Models of Bounded Rationality; MIT Press: Cambridge, MA, USA, 1982. [Google Scholar]
- Kahneman, D.; Slovic, P.; Tversky, A. Judgment under Uncertainty: Heuristics and Biases; Cambridge University Press: Cambridge, NY, USA, 1982; Volume xiii, 555p. [Google Scholar]
- Kahneman, D. Thinking, Fast and Slow, 1st ed.; Farrar, Straus and Giroux: New York, NY, USA, 2013; 499p. [Google Scholar]
- Tversky, A.; Kahneman, D. Judgment under Uncertainty: Heuristics and Biases. Science 1974, 185, 1124–1131. [Google Scholar] [CrossRef]
- Gigerenzer, G. Simply Rational: Decision Making in the Real World; Oxford University Press: New York, NY, USA, 2015. [Google Scholar]
- Thaler, R.H. Misbehaving: The Making of Behavioral Economics, 1st ed.; W.W. Norton & Company: New York, NY, USA, 2015; Volume xvi, 415p. [Google Scholar]
- Ericsson, K.A. The Cambridge Handbook of Expertise and Expert Performance, 2nd ed.; Cambridge University Press: Cambridge, UK; New York, NY, USA, 2018; Volume xiii, 969p. [Google Scholar]
- Eddy, D.M. Probabilistic reasoning in clinical medicine: Problems and opportunities. In Judgment under Uncertainty: Heuristics and Biases; Kahneman, D., Amos, P.T., Eds.; Cambridge University Press: New York, NY, USA, 1982; pp. 249–267. [Google Scholar]
- Marewski, J.N.; Gigerenzer, G. Heuristic decision making in medicine. Dialogues Clin. Neurosci. 2012, 14, 77–89. [Google Scholar]
- O’Sullivan, E.D.; Schofield, S.J. Cognitive bias in clinical medicine. J. R. Coll. Physicians Edinb. 2018, 48, 225–232. [Google Scholar] [CrossRef] [PubMed]
- Whelehan, D.F.; Conlon, K.C.; Ridgway, P.F. Medicine and heuristics: Cognitive biases and medical decision-making. Ir. J. Med. Sci. 2020, 189, 1477–1484. [Google Scholar] [CrossRef] [PubMed]
- Blumenthal-Barby, J.S.; Krieger, H. Cognitive biases and heuristics in medical decision making: A critical review using a systematic search strategy. Med. Decis. Mak. 2015, 35, 539–557. [Google Scholar] [CrossRef] [PubMed]
- Eddy, D.M. The origins of evidence-based medicine—a personal perspective. Virtual Mentor 2011, 13, 55–60. [Google Scholar] [PubMed]
- Epley, N.; Gilovich, T. Putting adjustment back in the anchoring and adjustment heuristic: Differential processing of self-generated and experimenter-provided anchors. Psychol. Sci. 2001, 12, 391–396. [Google Scholar] [CrossRef]
- Epley, N.; Gilovich, T. The anchoring-and-adjustment heuristic: Why the adjustments are insufficient. Psychol. Sci. 2006, 17, 311–318. [Google Scholar] [CrossRef]
- Eddy, D.M. Evidence-based medicine: A unified approach. Health Aff. 2005, 24, 9–17. [Google Scholar] [CrossRef]
- Djulbegovic, B.; Guyatt, G.H. Progress in evidence-based medicine: A quarter century on. Lancet 2017, 390, 415–423. [Google Scholar] [CrossRef]
- Heath, M.; Bowyer, K.; Kopans, D.; Moore, R.; Kegelmeyer, W. The Digital Database for Screening Mammography. In Proceedings of the Fifth International Workshop on Digital Mammography; Yaffe, M.J., Ed.; Medical Physics Publishing: Madison, WI, USA, 2001; pp. 212–218. [Google Scholar]
- Hoffrage, U.; Gigerenzer, G. Using natural frequencies to improve diagnostic inferences. Acad. Med. 1998, 73, 538–540. [Google Scholar] [CrossRef]
- Hoffrage, U.; Krauss, S.; Martignon, L.; Gigerenzer, G. Natural frequencies improve Bayesian reasoning in simple and complex inference tasks. Front. Psychol. 2015, 6, 1473. [Google Scholar] [CrossRef] [Green Version]
- Branch, F.B.; Hegdé, J. Role of the Anchoring and Adjustment Heuristic in Radiological Decision-Making. In Radiological Society of North America (RSNA) 2019 Annual Meeting; Radiological Society of North America (RSNA): Chicago, IL, USA, 2019. [Google Scholar]
- Epley, N.; Gilovich, T. Are adjustments insufficient? Personal. Soc. Psychol. Bull. 2004, 30, 447–460. [Google Scholar] [CrossRef]
- Epley, N.; Keysar, B.; Van Boven, L.; Gilovich, T. Perspective Taking as Egocentric Anchoring and Adjustment. J. Pers. Soc. Psychol. 2004, 87, 327–339. [Google Scholar] [CrossRef] [PubMed] [Green Version]
- R_Core_Team. R: A Language and Environment for Statistical Computing; R Foundation for Statistical Computing: Vienna, Austria, 2019. [Google Scholar]
- Bashier, E.B.M. Practical Numerical and Scientific Computing with MATLAB® and Python; CRC Press: Boca Raton, FL, USA, 2020. [Google Scholar]
- Swets, J.A. Signal Detection Theory and ROC Analysis in Psychology and Diagnostics: Collected Papers; Scientific Psychology Series; L. Erlbaum Associates: Mahwah, NJ, USA, 1996; Volume xv, 308p. [Google Scholar]
- Signorell, A.; Aho, K.; Alfons, A.; Anderegg, N.; Aragon, T.; Arppe, A. DescTools: Tools for Descriptive Statistics; The R Foundation for Statistical Computing: Vienna, Austria, 2020. [Google Scholar]
- Thaler, R.H. Advances in Behavioral Finance; The Roundtable Series in Behavioral Economics; Russell Sage Foundation: New York, NY, USA, 1993; Volumes 1–2. [Google Scholar]
- Ruetters, D.; Keinki, C.; Schroth, S.; Liebl, P.; Huebner, J. Is there evidence for a better health care for cancer patients after a second opinion? A systematic review. J. Cancer Res. Clin. Oncol. 2015, 142, 1521–1528. [Google Scholar] [CrossRef]
- Shaikh, S.; Bafana, R.; Halabi, S.S. Concierge and Second-Opinion Radiology: Review of Current Practices. Curr. Probl. Diagn. Radiol. 2016, 45, 111–114. [Google Scholar] [CrossRef] [PubMed]
- Geisler, W.S.; Kersten, D. Illusions, perception and Bayes. Nat. Neurosci. 2002, 5, 508–510. [Google Scholar] [CrossRef]
- Króliczak, G.; Heard, P.; Goodale, M.A.; Gregory, R.L. Dissociation of perception and action unmasked by the hollow-face illusion. Brain Res. 2006, 1080, 9–16. [Google Scholar] [CrossRef] [PubMed]
- Hartung, B.; Schrater, P.R.; Bülthoff, H.H.; Kersten, D.; Franz, V.H. Is prior knowledge of object geometry used in visually guided reaching? J. Vis. 2005, 5, 504–514. [Google Scholar] [CrossRef]
- Harding, C.; Pompei, F.; Burmistrov, D.; Welch, H.G.; Abebe, R.; Wilson, R. Breast Cancer Screening, Incidence, and Mortality Across US Counties. JAMA Intern. Med. 2015, 175, 1483–1489. [Google Scholar] [CrossRef] [Green Version]
- Bleyer, A.; Welch, H.G. Effect of Three Decades of Screening Mammography on Breast-Cancer Incidence. N. Engl. J. Med. 2012, 367, 1998–2005. [Google Scholar] [CrossRef] [PubMed] [Green Version]


| Condition # | Anchoring Information | Cancer Status of the Mammogram |
|---|---|---|
| 1 | Provided | Negative |
| 2 | Provided | Positive |
| Condition # | Anchoring Information | Cancer Status of the Mammogram |
|---|---|---|
| 1 | Provided | Negative |
| 2 | Provided | Positive |
| 3 | Not provided | Negative |
| 4 | Not provided | Positive |
| Row # | Explanatory Variable | Estimated Coefficient | Standard Error | t Value | p-Value |
|---|---|---|---|---|---|
| 1 | Subjects’ initial estimate α | 0.48 | 0.11 | 4.40 | 3.15 × 10⁻⁵ |
| 2 | Cancer status of the mammogram (−ve vs. +ve for cancer) θ | 0.54 | 4.63 | 0.12 | 0.91 |
| 3 | Reaction time r | 1.94 × 10⁻⁴ | 1.87 × 10⁻⁴ | 1.04 | 0.30 |
| 4 | Radiological specialty of the subject | 10.56 | 14.36 | 0.74 | 0.46 |
| 5 | Length of radiological experience of the subject | −0.38 | 0.22 | −1.72 | 0.09 |
| Row # | Explanatory Variable | Estimated Coefficient | Standard Error | t Value | p-Value |
|---|---|---|---|---|---|
| 1 | Subjects’ initial estimate α | 0.34 | 0.19 | 1.83 | 0.07 |
| 2 | Cancer status of the mammogram (−ve vs. +ve for cancer) θ | 9.16 | 5.77 | 1.59 | 0.12 |
| 3 | Reaction time r | −7.14 × 10⁻⁴ | 3.37 × 10⁻⁴ | −2.12 | 0.04 |
| 4 | Radiological specialty of the subject | 5.69 | 18.08 | 0.32 | 0.75 |
| 5 | Length of radiological experience of the subject | −0.28 | 0.29 | −0.98 | 0.33 |
Publisher’s Note: MDPI stays neutral with regard to jurisdictional claims in published maps and institutional affiliations. |
© 2022 by the authors. Licensee MDPI, Basel, Switzerland. This article is an open access article distributed under the terms and conditions of the Creative Commons Attribution (CC BY) license (https://creativecommons.org/licenses/by/4.0/).
Share and Cite
Branch, F.; Santana, I.; Hegdé, J. Biasing Influence of ‘Mental Shortcuts’ on Diagnostic Decision-Making: Radiologists Can Overlook Breast Cancer in Mammograms When Prior Diagnostic Information Is Available. Diagnostics 2022, 12, 105. https://doi.org/10.3390/diagnostics12010105
Branch F, Santana I, Hegdé J. Biasing Influence of ‘Mental Shortcuts’ on Diagnostic Decision-Making: Radiologists Can Overlook Breast Cancer in Mammograms When Prior Diagnostic Information Is Available. Diagnostics. 2022; 12(1):105. https://doi.org/10.3390/diagnostics12010105
Chicago/Turabian StyleBranch, Fallon, Isabella Santana, and Jay Hegdé. 2022. "Biasing Influence of ‘Mental Shortcuts’ on Diagnostic Decision-Making: Radiologists Can Overlook Breast Cancer in Mammograms When Prior Diagnostic Information Is Available" Diagnostics 12, no. 1: 105. https://doi.org/10.3390/diagnostics12010105