
Walk Your Talk: Real-World Adherence to Guidelines on the Use of MRI in Multiple Sclerosis

 , , , , , , ,
Abstract
:1. Introduction
2. Materials and Methods
3. Results
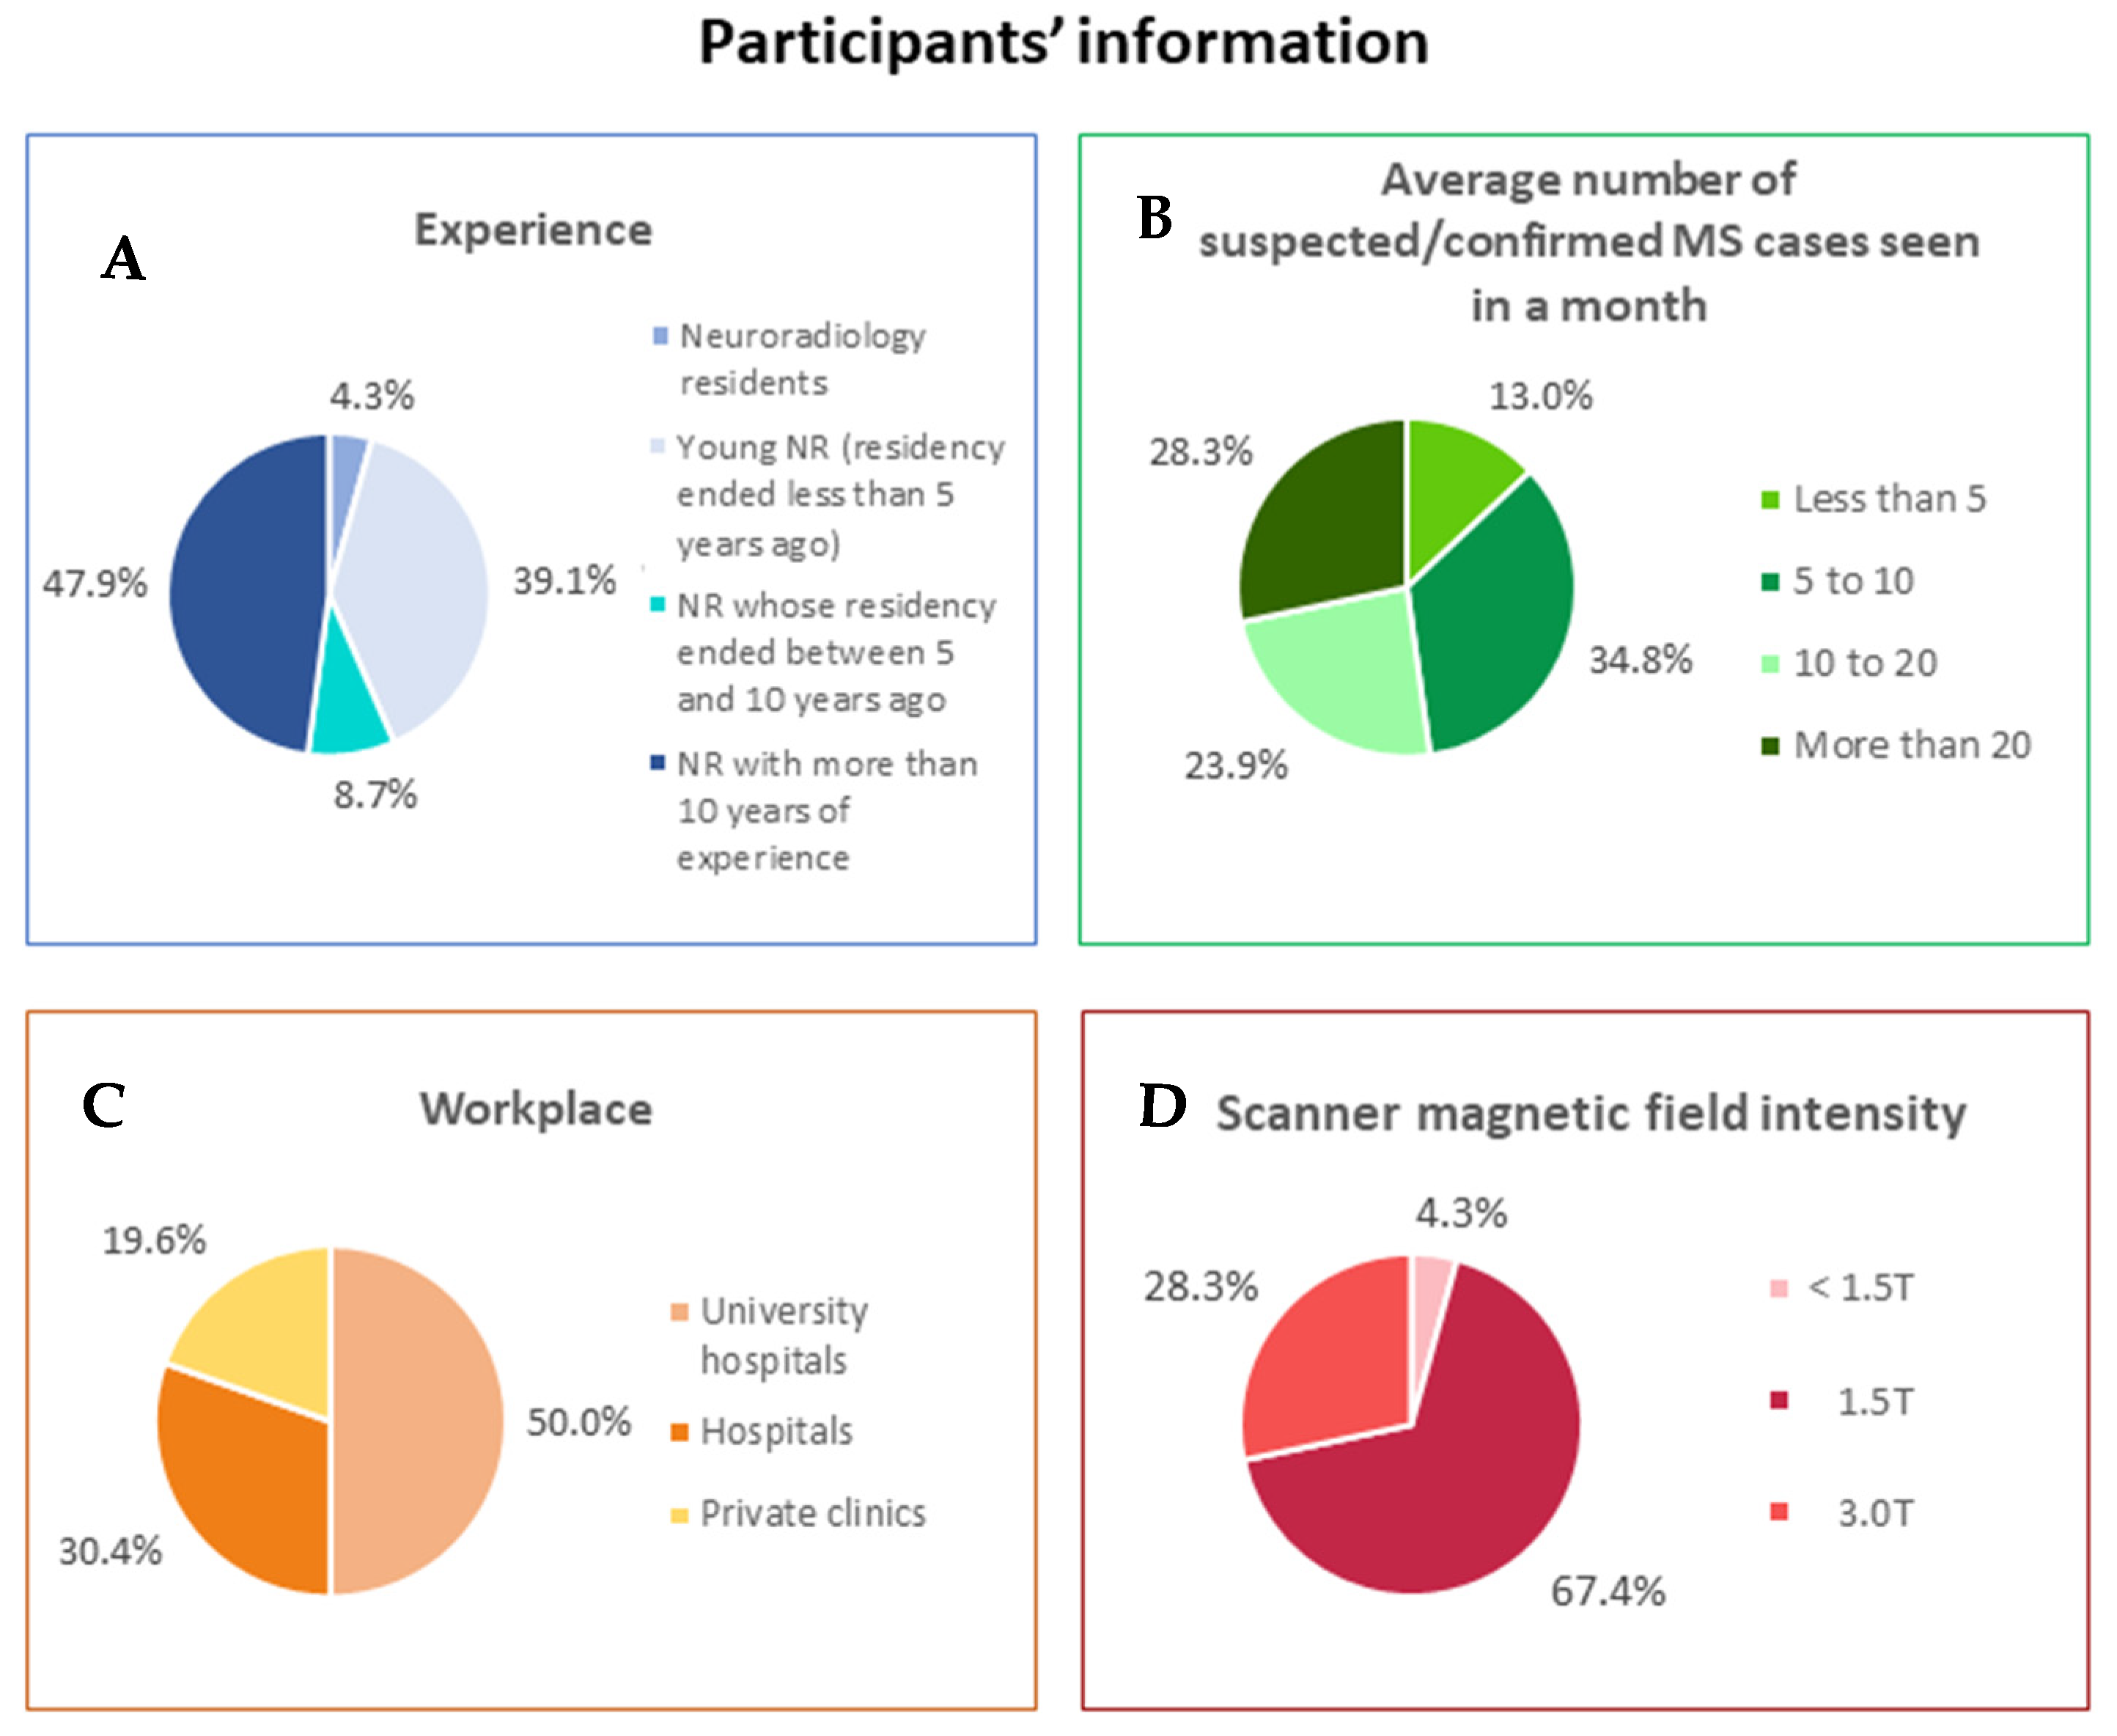
3.1. Participants
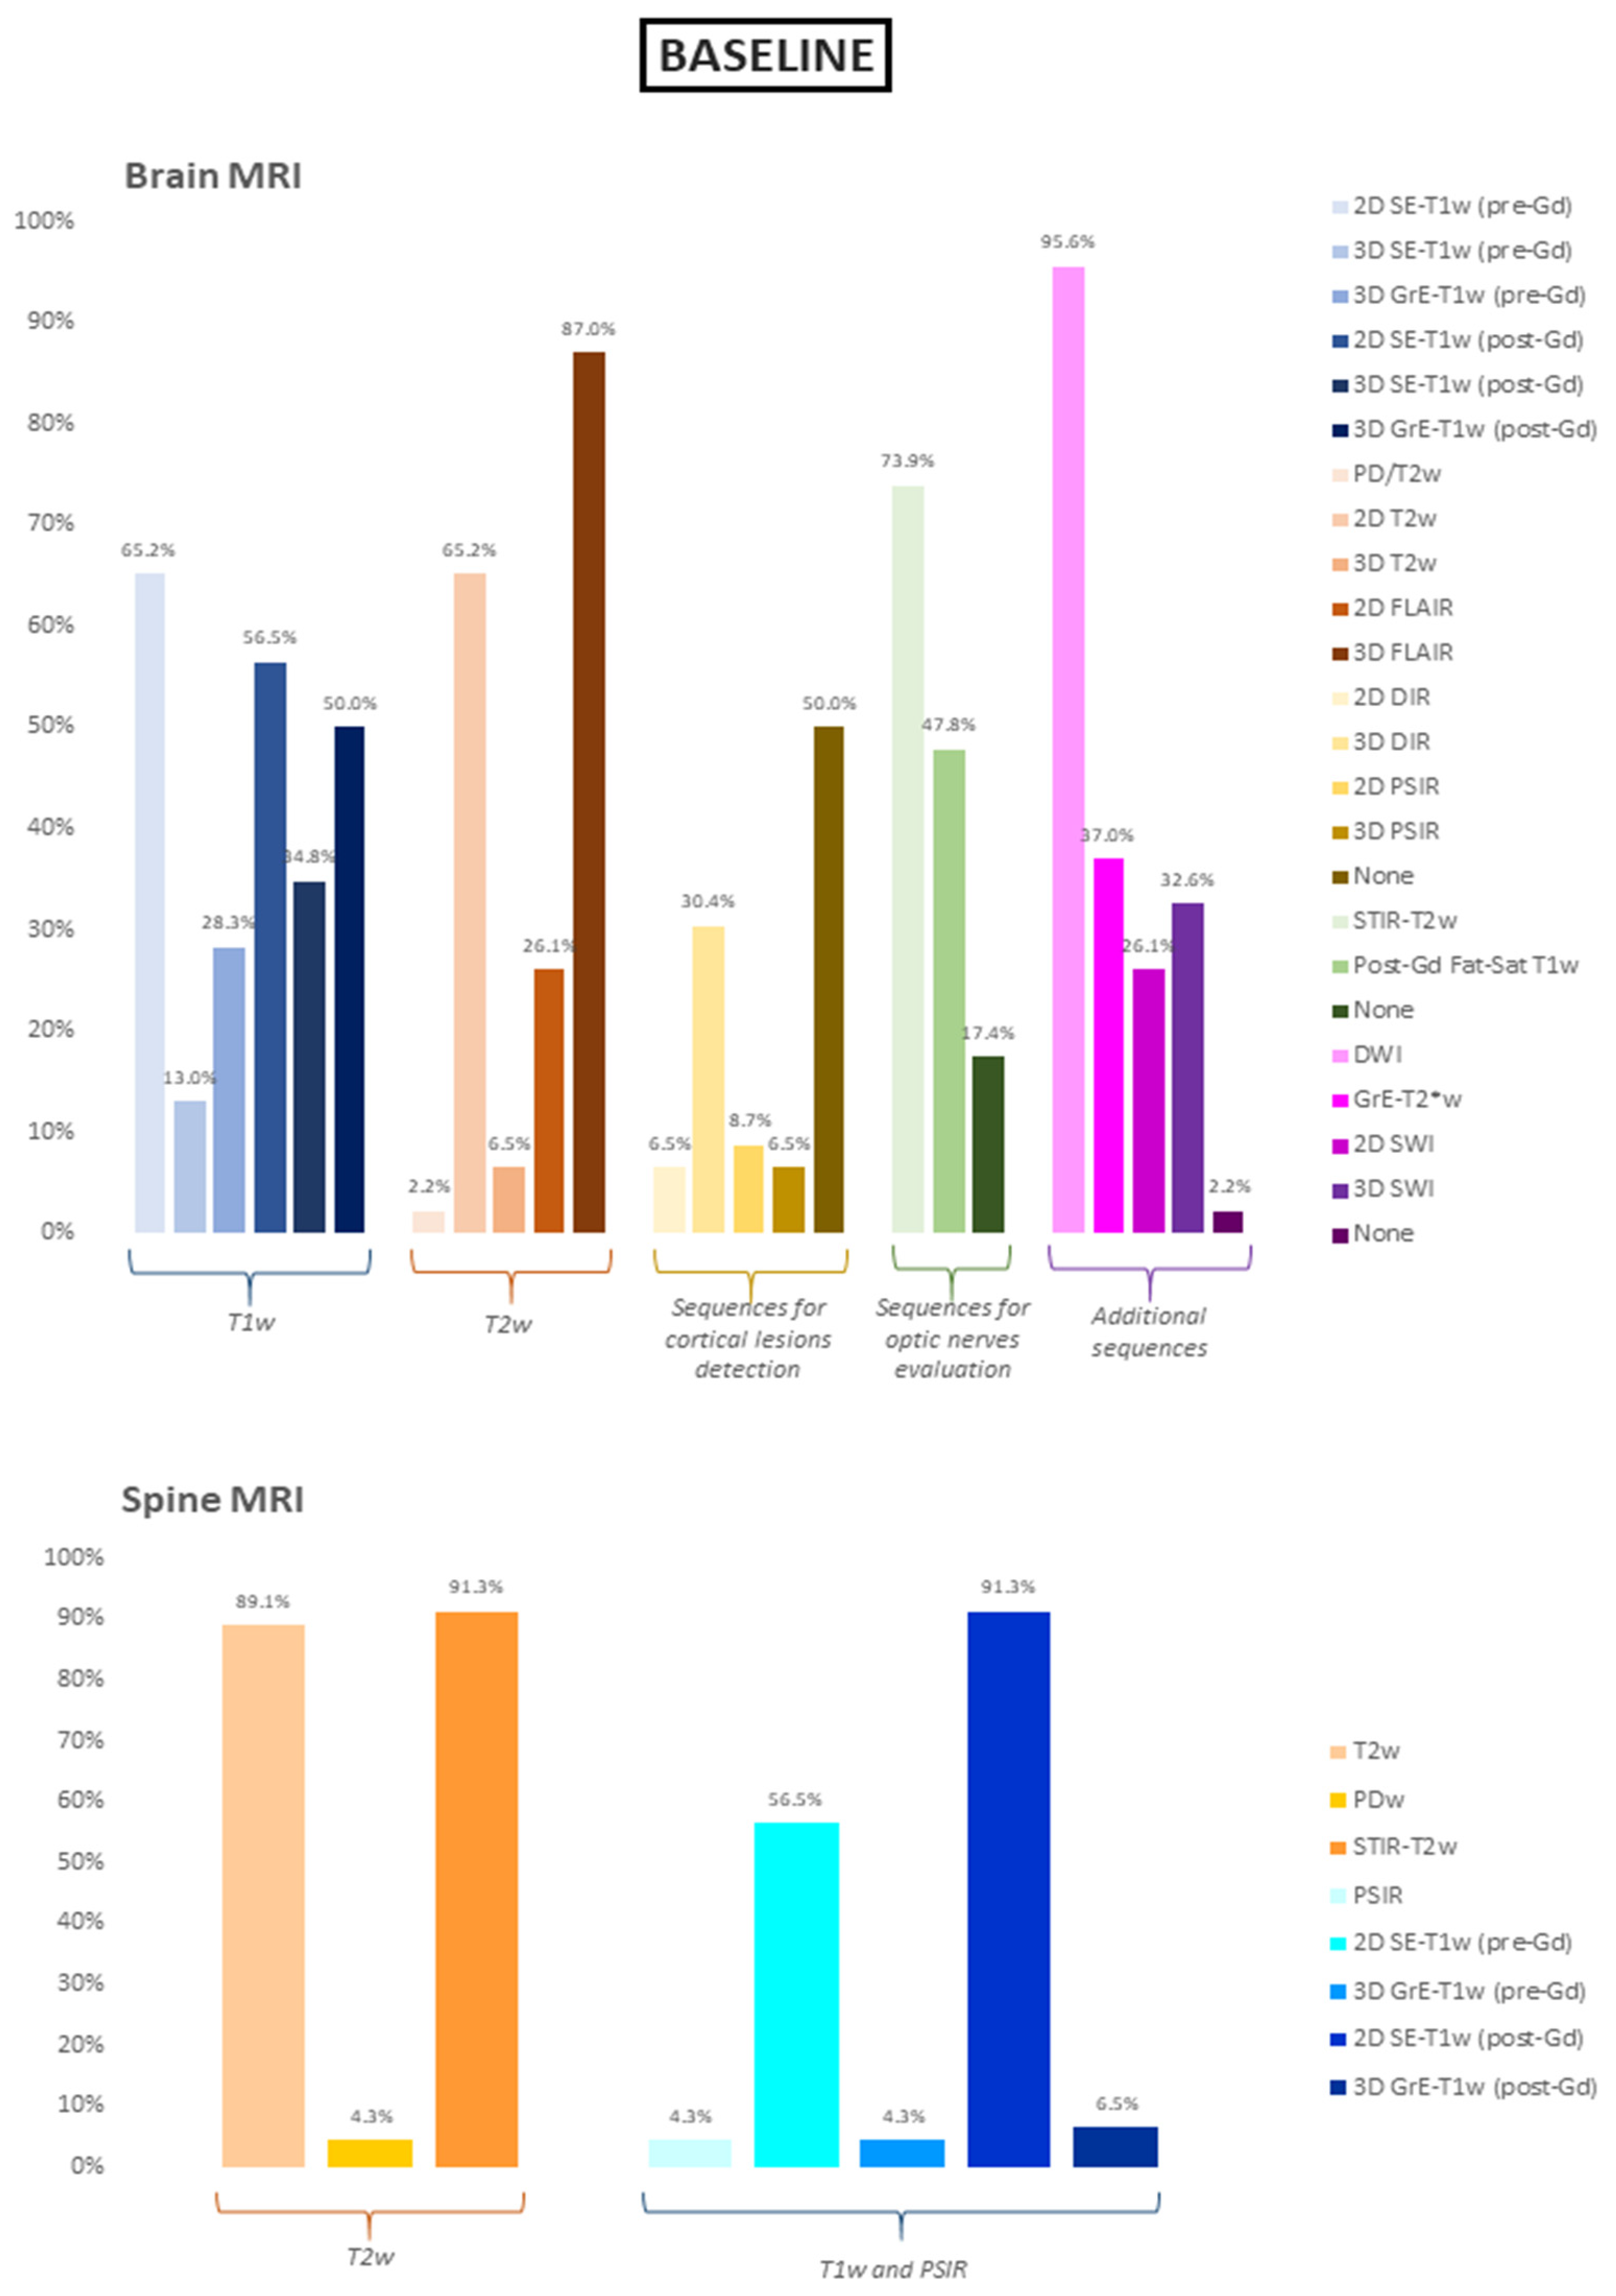
3.2. Brain and Spine MRI Protocols—Baseline
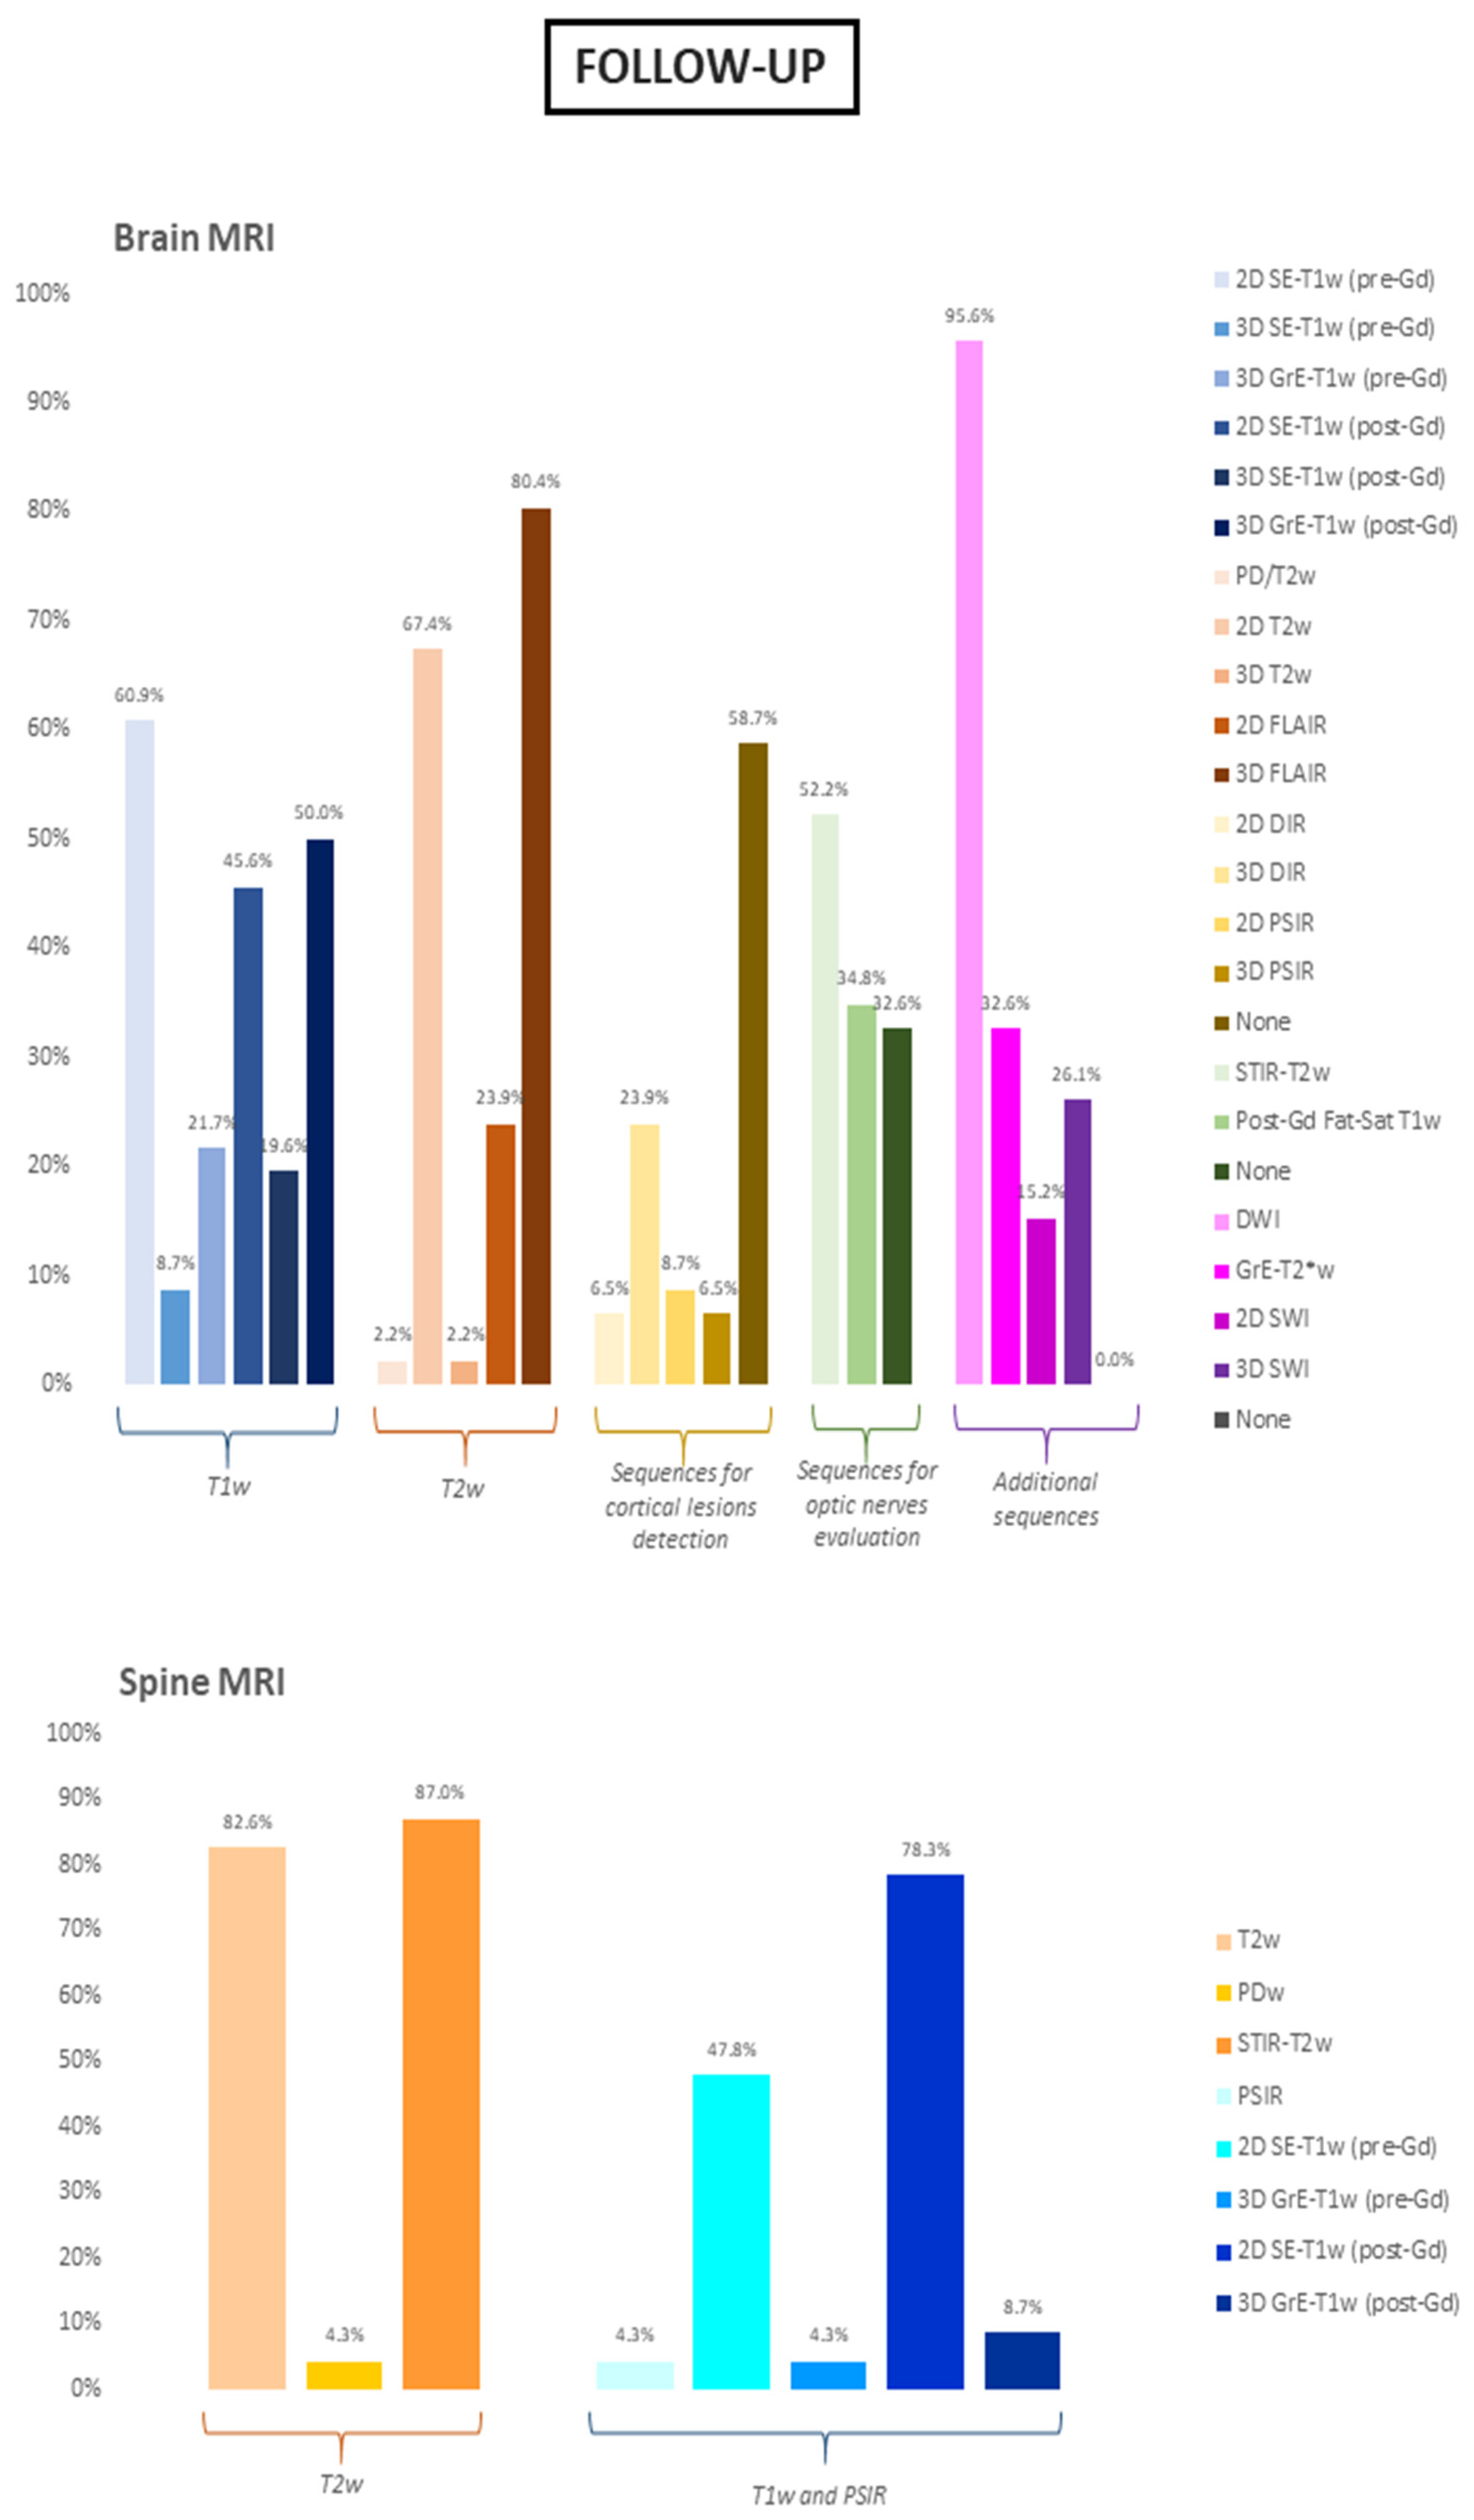
3.3. Brain and Spine MRI Protocols—Follow-Up
3.4. Stratification By Work-Related Environment
3.5. Stratification by Years of Experience
3.6. Report Structure
3.7. Future Directions
4. Discussion
Supplementary Materials
Author Contributions
Funding
Institutional Review Board Statement
Informed Consent Statement
Data Availability Statement
Acknowledgments
Conflicts of Interest
References
- Compston, A.; Coles, A. Multiple sclerosis. Lancet 2008, 372, 1502–1517. [Google Scholar] [CrossRef]
- Lublin, F.D.; Reingold, S.C.; Cohen, J.A.; Cutter, G.R.; Sørensen, P.S.; Thompson, A.J.; Wolinsky, J.S.; Balcer, L.J.; Banwell, B.; Barkhof, F.; et al. Defining the clinical course of multiple sclerosis: The 2013 revisions. Neurology 2014, 83, 278–286. [Google Scholar] [CrossRef] [Green Version]
- Gelfand, J.M. Multiple sclerosis: Diagnosis, differential diagnosis, and clinical presentation. In Handbook of Clinical Neurology; Elsevier B.V.: Amsterdam, The Netherlands, 2014; Volume 122, pp. 269–290. [Google Scholar]
- Thompson, A.J.; Banwell, B.L.; Barkhof, F.; Carroll, W.M.; Coetzee, T.; Comi, G.; Correale, J.; Fazekas, F.; Filippi, M.; Freedman, M.S.; et al. Diagnosis of multiple sclerosis: 2017 revisions of the McDonald criteria. Lancet Neurol. 2018, 17, 162–173. [Google Scholar] [CrossRef]
- Aliaga, E.S.; Barkhof, F. MRI mimics of multiple sclerosis. In Handbook of Clinical Neurology; Elsevier B.V.: Amsterdam, The Netherlands, 2014; Volume 122, pp. 291–316. [Google Scholar]
- Wattjes, M.P.; Steenwijk, M.D.; Stangel, M. MRI in the Diagnosis and Monitoring of Multiple Sclerosis: An Update. Clin. Neuroradiol. 2015, 25 (Suppl. S2), 157–165. [Google Scholar] [CrossRef] [PubMed] [Green Version]
- Filippi, M.; Preziosa, P.; Banwell, B.L.; Barkhof, F.; Ciccarelli, O.; De Stefano, N.; Geurts, J.J.G.; Paul, F.; Reich, D.S.; Toosy, A.T.; et al. Assessment of lesions on magnetic resonance imaging in multiple sclerosis: Practical guidelines. Brain J. Neurol. 2019, 142, 1858–1875. [Google Scholar] [CrossRef] [PubMed] [Green Version]
- Traboulsee, A.; Simon, J.H.; Stone, L.; Fisher, E.; Jones, D.E.; Malhotra, A.; Newsome, S.D.; Oh, J.; Reich, D.S.; Richert, N.; et al. Revised Recommendations of the Consortium of MS Centers Task Force for a Standardized MRI Protocol and Clinical Guidelines for the Diagnosis and Follow-Up of Multiple Sclerosis. AJNR Am. J. Neuroradiol. 2016, 37, 394–401. [Google Scholar] [CrossRef] [PubMed]
- Filippi, M.; Rocca, M.A.; Ciccarelli, O.; De Stefano, N.; Rammohan, K.; Khan, O.; Radue, E.-W.; Ford, C.; Halper, J.; Li, D. MRI criteria for the diagnosis of multiple sclerosis: MAGNIMS consensus guidelines. Lancet Neurol. 2016, 15, 292–303. [Google Scholar] [CrossRef] [Green Version]
- Rovira, À.; Wattjes, M.P.; Tintoré, M.; Tur, C.; Yousry, T.A.; Sormani, M.P.; De Stefano, N.; Filippi, M.; Auger, C.; Rocca, M.A.; et al. Evidence-based guidelines: MAGNIMS consensus guidelines on the use of MRI in multiple sclerosis-clinical implementation in the diagnostic process. Nat. Rev. Neurol. 2015, 11, 471–482. [Google Scholar] [CrossRef] [Green Version]
- Curley, M.; Josey, L.; Lucas, R.; McMichael, T.; Pender, M.P.; Ponsonby, A.-L.; Taylor, B.; Valery, P.; van der Mei, I.; Williams, D. Adherence to MRI protocol consensus guidelines in multiple sclerosis: An Australian multi-centre study. J. Med. Imaging Radiat. Oncol. 2012, 56, 594–598. [Google Scholar] [CrossRef]
- Gasperini, C.; Prosperini, L.; Tintoré, M.; Sormani, M.P.; Filippi, M.; Rio, J.; Palace, J.; Rocca, M.A.; Ciccarelli, O.; Barkhof, F.; et al. Unraveling treatment response in multiple sclerosis: A clinical and MRI challenge. Neurology 2019, 92, 180–192. [Google Scholar] [CrossRef]
- Vola, E.A.; Petracca, M.; Cocozza, S.; De Angelis, M.; Carotenuto, A.; Pontillo, G.; Morra, V.B.; Tedeschi, E.; Lanzillo, R. Possible progressive multifocal leukoencephalopathy and active multiple sclerosis under dimethyl fumarate: The central role of MRI in informing therapeutic decisions. BMC Neurol. 2021, 21, 146. [Google Scholar] [CrossRef]
- Rovaris, M.; Filippi, M. Contrast enhancement and the acute lesion in multiple sclerosis. Neuroimaging Clin. N. Am. 2000, 10, 705–716. [Google Scholar] [PubMed]
- Filippi, M.; Yousry, T.; Campi, A.; Kandziora, C.; Colombo, B.; Voltz, R.; Martinelli, V.; Spuler, S.; Bressi, S.; Scotti, G.; et al. Comparison of triple dose versus standard dose gadolinium-DTPA for detection of MRI enhancing lesions in patients with MS. Neurology 1996, 46, 379–384. [Google Scholar] [CrossRef] [PubMed]
- van Waesberghe, J.H.; Castelijns, J.A.; Roser, W.; Silver, N.; Yousry, T.; Nijeholt, G.J.L.à.; Adèr, H.J.; Uitdehaag, B.M.; Radue, E.W.; Polman, C.H.; et al. Single-dose gadolinium with magnetization transfer versus triple-dose gadolinium in the MR detection of multiple sclerosis lesions. Am. J. Neuroradiol. 1997, 18, 1279–1285. [Google Scholar]
- Wolansky, L.J.; Finden, S.G.; Chang, R.; Conigliari, M.; Lee, H.J.; Shaderowsky, P.D.; Cook, S.D. Gadoteridol in multiple sclerosis patients. A comparison of single and triple dose with immediate vs. delayed imaging. Clin. Imaging 1998, 22, 385–392. [Google Scholar] [CrossRef]
- Kanda, T.; Ishii, K.; Kawaguchi, H.; Kitajima, K.; Takenaka, D. High signal intensity in the dentate nucleus and globus pallidus on unenhanced T1-weighted MR images: Relationship with increasing cumulative dose of a gadolinium-based contrast material. Radiology 2014, 270, 834–841. [Google Scholar] [CrossRef] [PubMed]
- McDonald, R.J.; McDonald, J.S.; Kallmes, D.F.; Jentoft, M.E.; Murray, D.L.; Thielen, K.R.; Williamson, E.E.; Eckel, L.J. Intracranial Gadolinium Deposition after Contrast-enhanced MR Imaging. Radiology 2015, 275, 772–782. [Google Scholar] [CrossRef] [PubMed] [Green Version]
- Tedeschi, E.; Palma, G.; Canna, A.; Cocozza, S.; Russo, C.; Borrelli, P.; Lanzillo, R.; Angelini, V.; Postiglione, E.; Morra, V.B.; et al. In vivo dentate nucleus MRI relaxometry correlates with previous administration of Gadolinium-based contrast agents. Eur. Radiol. 2016, 26, 4577–4584. [Google Scholar] [CrossRef] [PubMed]
- Cocozza, S.; Pontillo, G.; Lanzillo, R.; Russo, C.; Petracca, M.; Stasi, M.D.; Paolella, C.; Vola, E.A.; Criscuolo, C.; Moccia, M.; et al. MRI features suggestive of gadolinium retention do not correlate with Expanded Disability Status Scale worsening in Multiple Sclerosis. Neuroradiology 2019, 61, 155–162. [Google Scholar] [CrossRef] [PubMed]
- Forslin, Y.; Shams, S.; Hashim, F.; Aspelin, P.; Bergendal, G.; Martola, J.; Fredrikson, S.; Kristoffersen-Wiberg, M.; Granberg, T. Retention of Gadolinium-Based Contrast Agents in Multiple Sclerosis: Retrospective Analysis of an 18-Year Longitudinal Study. AJNR Am. J. Neuroradiol. 2017, 38, 1311–1316. [Google Scholar] [CrossRef] [PubMed] [Green Version]
- Mallio, C.A.; Rovira, À.; Parizel, P.M.; Quattrocchi, C.C. Exposure to gadolinium and neurotoxicity: Current status of preclinical and clinical studies. Neuroradiology 2020, 62, 925–934. [Google Scholar] [CrossRef]
- Calabrese, M.; Agosta, F.; Rinaldi, F.; Mattisi, I.; Grossi, P.; Favaretto, A.; Atzori, M.; Bernardi, V.; Barachino, L.; Rinaldi, L.; et al. Cortical lesions and atrophy associated with cognitive impairment in relapsing-remitting multiple sclerosis. Arch. Neurol. 2009, 66, 1144–1150. [Google Scholar] [CrossRef] [Green Version]
- Curti, E.; Graziuso, S.; Tsantes, E.; Crisi, G.; Granella, F. Correlation between cortical lesions and cognitive impairment in multiple sclerosis. Brain Behav. 2018, 8, e00955. [Google Scholar] [CrossRef]
- Harrison, D.M.; Roy, S.; Oh, J.; Izbudak, I.; Pham, D.; Courtney, S.; Caffo, B.; Jones, C.K.; van Zijl, P.; Calabresi, P.A. Association of Cortical Lesion Burden on 7-T Magnetic Resonance Imaging With Cognition and Disability in Multiple Sclerosis. JAMA Neurol. 2015, 72, 1004–1012. [Google Scholar] [CrossRef]
- Pirko, I.; Lucchinetti, C.F.; Sriram, S.; Bakshi, R. Gray matter involvement in multiple sclerosis. Neurology 2007, 68, 634–642. [Google Scholar] [CrossRef]
- Roosendaal, S.D.; Moraal, B.; Pouwels, P.J.; Vrenken, H.; Castelijns, J.A.; Barkhof, F.; Geurts, J.J.G. Accumulation of cortical lesions in MS: Relation with cognitive impairment. Mult. Scler. 2009, 15, 708–714. [Google Scholar] [CrossRef]
- Calabrese, M.; De Stefano, N.; Atzori, M.; Bernardi, V.; Mattisi, I.; Barachino, L.; Morra, A.; Rinaldi, L.; Romualdi, C.; Perini, P.; et al. Detection of cortical inflammatory lesions by double inversion recovery magnetic resonance imaging in patients with multiple sclerosis. Arch. Neurol. 2007, 64, 1416–1422. [Google Scholar] [CrossRef] [PubMed] [Green Version]
- Calabrese, M.; Battaglini, M.; Giorgio, A.; Atzori, M.; Bernardi, V.; Mattisi, I.; Gallo, P.; De Stefano, N. Imaging distribution and frequency of cortical lesions in patients with multiple sclerosis. Neurology 2010, 75, 1234–1240. [Google Scholar] [CrossRef] [PubMed]
- Geurts, J.J.; Pouwels, P.J.; Uitdehaag, B.M.; Polman, C.H.; Barkhof, F.; Castelijns, J.A. Intracortical lesions in multiple sclerosis: Improved detection with 3D double inversion-recovery MR imaging. Radiology 2005, 236, 254–260. [Google Scholar] [CrossRef] [PubMed]
- Brown, P.J.; Rossington, H.; Taylor, J.; Lambregts, D.M.J.; Morris, E.; West, N.P.; Quirke, P.; Tolan, D.; on behalf of the YCR BCIP Study Group. Standardised reports with a template format are superior to free text reports: The case for rectal cancer reporting in clinical practice. Eur. Radiol. 2019, 29, 5121–5128. [Google Scholar] [CrossRef] [PubMed] [Green Version]
- Stanzione, A.; Boccadifuoco, F.; Cuocolo, R.; Romeo, V.; Mainenti, P.P.; Brunetti, A.; Maurea, S. State of the art in abdominal MRI structured reporting: A review. Abdom. Radiol. 2021, 46, 1218–1228. [Google Scholar] [CrossRef] [PubMed]
- Wibmer, A.; Vargas, H.A.; Sosa, R.; Zheng, J.; Moskowitz, C.; Hricak, H. Value of a standardized lexicon for reporting levels of diagnostic certainty in prostate MRI. AJR Am. J. Roentgenol. 2014, 203, W651–W657. [Google Scholar] [CrossRef] [PubMed]
- Alessandrino, F.; Pichiecchio, A.; Mallucci, G.; Ghione, E.; Romani, A.; Bergamaschi, R.; Bastianello, S. Do MRI Structured Reports for Multiple Sclerosis Contain Adequate Information for Clinical Decision Making? AJR Am. J. Roentgenol. 2018, 210, 24–29. [Google Scholar] [CrossRef]
- Lee, J.K.; Bermel, R.; Bullen, J.; Ruggieri, P.; Jones, S.E. Structured Reporting in Multiple Sclerosis Reduces Interpretation Time. Acad. Radiol. 2020. [Google Scholar] [CrossRef]
- Sinnecker, T.; Clarke, M.A.; Meier, D.; Enzinger, C.; Calabrese, M.; De Stefano, N.; Pitiot, A.; Giorgio, A.; Schoonheim, M.M.; Paul, F.; et al. Evaluation of the Central Vein Sign as a Diagnostic Imaging Biomarker in Multiple Sclerosis. JAMA Neurol. 2019, 76, 1446–1456. [Google Scholar] [CrossRef] [PubMed]
- Mistry, N.; Abdel-Fahim, R.; Samaraweera, A.; Mougin, O.; Tallantyre, E.; Tench, C.; Jaspan, T.; Morris, P.; Morgan, P.S.; Evangelou, N. Imaging central veins in brain lesions with 3-T T2*-weighted magnetic resonance imaging differentiates multiple sclerosis from microangiopathic brain lesions. Mult. Scler. 2016, 22, 1289–1296. [Google Scholar] [CrossRef] [PubMed]
- Maggi, P.; Absinta, M.; Grammatico, M.; Vuolo, L.; Emmi, G.; Carlucci, G.; Spagni, G.; Barilaro, A.; Repice, A.M.; Emmi, L.; et al. Central vein sign differentiates Multiple Sclerosis from central nervous system inflammatory vasculopathies. Ann. Neurol. 2018, 83, 283–294. [Google Scholar] [CrossRef] [PubMed]
- Guisset, F.; Lolli, V.; Bugli, C.; Perrotta, G.; Absil, J.; Dachy, B.; Pot, C.; Théaudin, M.; Pasi, M.; van Pesch, V.; et al. The central vein sign in multiple sclerosis patients with vascular comorbidities. Mult. Scler. 2021, 27, 1057–1065. [Google Scholar] [CrossRef] [PubMed]
- Inglese, M.; Petracca, M. MRI in multiple sclerosis: Clinical and research update. Curr. Opin. Neurol. 2018, 31, 249–255. [Google Scholar] [CrossRef] [PubMed]
- Pontillo, G.; Cocozza, S.; Di Stasi, M.; Carotenuto, A.; Paolella, C.; Cipullo, M.B.; Perillo, T.; Vola, E.A.; Russo, C.; Masullo, M.; et al. 2D linear measures of ventricular enlargement may be relevant markers of brain atrophy and long-term disability progression in multiple sclerosis. Eur. Radiol. 2020, 30, 3813–3822. [Google Scholar] [CrossRef] [PubMed]
- De Stefano, N.; Stromillo, M.L.; Giorgio, A.; Bartolozzi, M.L.; Battaglini, M.; Baldini, M.; Portaccio, E.; Amato, M.P.; Sormani, M.P. Establishing pathological cut-offs of brain atrophy rates in multiple sclerosis. J. Neurol. Neurosurg. Psychiatry 2016, 87, 93–99. [Google Scholar] [CrossRef] [PubMed] [Green Version]


| BASELINE | ||||||
|---|---|---|---|---|---|---|
| BRAIN MRI | ||||||
| MRI SEQUENCES | Number of Affirmative Answers | Percentage | Additional Questions | Number of Answers | Percentage | |
| T1-weighted | ||||||
| 2D SE-T1w (pre-Gd) | 30 | 65.2% | slice thickness | ≤3 mm | 8 | 26.7% |
| >3 mm | 22 | 73.3% | ||||
| gap | Yes | 10 | 33.3% | |||
| No | 20 | 66.7% | ||||
| 3D SE-T1w (pre-Gd) | 6 | 13.0% | voxel size | <1 mm (isotropic) | 3 | 50.0% |
| 1 mm (isotropic) | 3 | 50.0% | ||||
| other | 0 | 0.0% | ||||
| 3D GrE-T1w (pre-Gd) | 13 | 28.3% | voxel size | <1 mm (isotropic) | 1 | 7.7% |
| 1 mm (isotropic) | 12 | 92.3% | ||||
| other | 0 | 0.0% | ||||
| 2D SE-T1w (post-Gd) | 26 | 56.5% | slice thickness | ≤3 mm | 10 | 38.5% |
| >3 mm | 16 | 61.5% | ||||
| gap | Yes | 11 | 42.3% | |||
| No | 15 | 57.7% | ||||
| delay | ≤5′ | 11 | 42.3% | |||
| >5′ | 15 | 57.7% | ||||
| 3D SE-T1w (post-Gd) | 16 | 34.8% | voxel size | <1 mm (isotropic) | 6 | 37.5% |
| 1 mm (isotropic) | 8 | 50.0% | ||||
| other | 2 | 12.5% | ||||
| delay | ≤5′ | 11 | 68.7% | |||
| >5′ | 5 | 31.3% | ||||
| 3D GrE-T1w (post-Gd) | 23 | 50.0% | voxel size | <1 mm (isotropic) | 3 | 13.6% |
| 1 mm (isotropic) | 18 | 81.8% | ||||
| other | 1 | 4.6% | ||||
| delay | ≤5′ | 7 | 31.8% | |||
| >5′ | 15 | 68.2% | ||||
| T2-weighted | ||||||
| PD/T2w | 1 | 2.2% | slice thickness | ≤3 mm | 1 | 100% |
| >3 mm | 0 | 0.0% | ||||
| gap | Yes | 0 | 0.0% | |||
| No | 1 | 100.0% | ||||
| 2D T2w | 30 | 65.2% | slice thickness | ≤3 mm | 15 | 50.0% |
| >3 mm | 15 | 50.0% | ||||
| gap | Yes | 13 | 43.3% | |||
| No | 17 | 56.7% | ||||
| 3D T2w | 3 | 6.5% | voxel size | <1 mm (isotropic) | 1 | 33.3% |
| 1 mm (isotropic) | 1 | 33.3% | ||||
| other | 1 | 33.3% | ||||
| 2D FLAIR | 12 | 26.1% | slice thickness | ≤3 mm | 4 | 33.3% |
| >3 mm | 8 | 66.7% | ||||
| gap | Yes | 2 | 16.7% | |||
| No | 10 | 83.3% | ||||
| 3D FLAIR | 40 | 87.0% | voxel size | <1 mm (isotropic) | 10 | 25.0% |
| 1 mm (isotropic) | 24 | 60.0% | ||||
| other | 6 | 15.0% | ||||
| Sequences for cortical lesions detection | ||||||
| 2D DIR | 3 | 6.5% | slice thickness | ≤3 mm | 2 | 66.7% |
| >3 mm | 1 | 33.3% | ||||
| gap | Yes | 1 | 33.3% | |||
| No | 2 | 66.7% | ||||
| 3D DIR | 14 | 30.4% | voxel size | <1 mm (isotropic) | 2 | 14.3% |
| 1 mm (isotropic) | 10 | 71.4% | ||||
| other | 2 | 14.3% | ||||
| 2D PSIR | 4 | 8.7% | slice thickness | ≤3 mm | 2 | 50.0% |
| >3 mm | 2 | 50.0% | ||||
| gap | Yes | 2 | 50.0% | |||
| No | 2 | 50.0% | ||||
| 3D PSIR | 3 | 6.5% | voxel size | <1 mm (isotropic) | 0 | 0.0% |
| 1 mm (isotropic) | 3 | 100% | ||||
| other | 0 | 0.0% | ||||
| None | 23 | 50.0% | ||||
| Sequences for optic nerves evaluation | ||||||
| STIR-T2w | 34 | 73.9% | slice thickness | ≤3 mm | 31 | 91.2% |
| >3 mm | 3 | 8.8% | ||||
| gap | Yes | 10 | 29.4% | |||
| No | 24 | 70.6% | ||||
| Post-Gd Fat-Sat T1w | 22 | 47.8% | slice thickness | ≤3 mm | 22 | 100% |
| >3 mm | 0 | 0.0% | ||||
| gap | Yes | 5 | 22.7% | |||
| No | 17 | 77.3% | ||||
| None | 8 | 17.4% | ||||
| Additional sequences | ||||||
| DWI | 44 | 95.6% | ||||
| GrE-T2* | 17 | 37.0% | slice thickness | ≤3 mm | 4 | 23.5% |
| >3 mm | 13 | 76.5% | ||||
| gap | Yes | 8 | 47.1% | |||
| No | 9 | 53.9% | ||||
| 2D SWI | 12 | 26.1% | slice thickness | ≤3 mm | 9 | 75.0% |
| >3 mm | 3 | 25.0% | ||||
| gap | Yes | 2 | 16.7% | |||
| No | 10 | 83.3% | ||||
| 3D SWI | 15 | 32.6% | voxel size | <1 mm (isotropic) | 4 | 26.7% |
| 1 mm (isotropic) | 9 | 60.0% | ||||
| other | 2 | 13.3% | ||||
| None | 1 | 2.2% | ||||
| SPINE MRI | ||||||
| MRI SEQUENCES | Number of Affirmative Answers | Percentage | Additional Questions | Number of Answers | Percentage | |
| T2-weighted | ||||||
| T2w | 41 | 89.1% | acquisition plane | sagittal | 41 | 100% |
| axial | 17 | 41.5% | ||||
| slice thickness on sagittal acquisition | ≤3 mm | 39 | 95.1% | |||
| >3 mm | 2 | 4.9% | ||||
| gap on sagittal acquisition | Yes | 14 | 34.1% | |||
| No | 27 | 65.9% | ||||
| PDw | 2 | 4.3% | acquisition plane | sagittal | 2 | 100.0% |
| axial | 0 | 0.0% | ||||
| slice thickness on sagittal acquisition | ≤3 mm | 1 | 50.0% | |||
| >3 mm | 1 | 50.0% | ||||
| gap on sagittal acquisition | Yes | 2 | 100.0% | |||
| No | 0 | 0.0% | ||||
| STIR-T2w | 42 | 91.3% | acquisition plane | sagittal | 42 | 100.0% |
| axial | 2 | 4.7% | ||||
| slice thickness on sagittal acquisition | ≤3 mm | 38 | 90.5% | |||
| >3 mm | 4 | 9.5% | ||||
| gap on sagittal acquisition | Yes | 14 | 33.3% | |||
| No | 28 | 66.7% | ||||
| T1-weighted and inversion recovery | ||||||
| PSIR | 2 | 4.3% | acquisition plane | sagittal | 2 | 100% |
| axial | 0 | 0.0% | ||||
| slice thickness on sagittal acquisition | ≤3 mm | 2 | 100% | |||
| >3 mm | 0 | 0.0% | ||||
| gap on sagittal acquisition | Yes | 1 | 50.0% | |||
| No | 1 | 50.0% | ||||
| 2D SE-T1w (pre-Gd) | 26 | 56.5% | acquisition plane | sagittal | 26 | 100% |
| axial | 3 | 11.5% | ||||
| slice thickness on sagittal acquisition | ≤3 mm | 23 | 88.5% | |||
| >3 mm | 3 | 11.5% | ||||
| gap on sagittal acquisition | Yes | 11 | 42.3% | |||
| No | 15 | 57.7% | ||||
| 3D GrE-T1w (pre-Gd) | 2 | 4.3% | acquisition plane | sagittal | 2 | 100% |
| axial | 1 | 50.0% | ||||
| slice thickness on sagittal acquisition | ≤3 mm | 2 | 100% | |||
| >3 mm | 0 | 0.0% | ||||
| gap on sagittal acquisition | Yes | 0 | 0.0% | |||
| No | 2 | 100% | ||||
| 2D SE-T1w (post-Gd) | 42 | 91.3% | acquisition plane | sagittal | 41 | 100% |
| axial | 13 | 31.7% | ||||
| slice thickness on sagittal acquisition | ≤3 mm | 37 | 90.2% | |||
| >3 mm | 4 | 9.8% | ||||
| gap on sagittal acquisition | Yes | 16 | 39.0% | |||
| No | 25 | 61.0% | ||||
| delay | ≤5′ | 19 | 47.5% | |||
| >5′ | 21 | 52.5% | ||||
| 3D GrE-T1w (post-Gd) | 3 | 6.5% | acquisition plane | sagittal | 2 | 66.7% |
| axial | 2 | 66.7% | ||||
| slice thickness on sagittal acquisition | ≤3 mm | 2 | 100% | |||
| >3 mm | 0 | 0.0% | ||||
| gap on sagittal acquisition | Yes | 0 | 0.0% | |||
| No | 2 | 100% | ||||
| delay | ≤5′ | 1 | 33.3% | |||
| >5′ | 2 | 66.7% | ||||
| FOLLOW-UP | ||||||
|---|---|---|---|---|---|---|
| BRAIN MRI | ||||||
| MRI SEQUENCES | Number of Affirmative Answers | Percentage | Additional Questions | Number of Answers | Percentage | |
| T1-weighted | ||||||
| 2D SE-T1w (pre-Gd) | 28 | 60.9% | slice thickness | ≤3 mm | 10 | 35.7% |
| >3 mm | 18 | 64.3% | ||||
| gap | Yes | 12 | 42.9% | |||
| No | 16 | 57.1% | ||||
| 3D SE-T1w (pre-Gd) | 4 | 8.7% | voxel size | <1 mm (isotropic) | 2 | 66.7% |
| 1 mm (isotropic) | 1 | 33.3% | ||||
| other | 0 | 0.0% | ||||
| 3D GrE-T1w (pre-Gd) | 10 | 21.7% | voxel size | <1 mm (isotropic) | 1 | 10.0% |
| 1 mm (isotropic) | 9 | 90.0% | ||||
| other | 0 | 0.0% | ||||
| 2D SE-T1w (post-Gd) | 21 | 45.6% | slice thickness | ≤3 mm | 9 | 42.9% |
| >3 mm | 12 | 57.1% | ||||
| gap | Yes | 5 | 23.8% | |||
| No | 16 | 76.2% | ||||
| delay | ≤5′ | 12 | 57.1% | |||
| >5′ | 8 | 38.1% | ||||
| 3D SE-T1w (post-Gd) | 9 | 19.6% | voxel size | <1 mm (isotropic) | 3 | 33.3% |
| 1 mm (isotropic) | 5 | 55.5% | ||||
| other | 1 | 11.1% | ||||
| delay | ≤5′ | 6 | 66.6% | |||
| >5′ | 3 | 33.3% | ||||
| 3D GrE-T1w (post-Gd) | 23 | 50.0% | voxel size | <1 mm (isotropic) | 3 | 13.0% |
| 1 mm (isotropic) | 18 | 78.3% | ||||
| other | 0 | 0.0% | ||||
| delay | ≤5′ | 5 | 21.7% | |||
| >5′ | 16 | 70.0% | ||||
| T2-weighted | ||||||
| PD/T2w | 1 | 2.2% | slice thickness | ≤3 mm | 0 | 0.0% |
| >3 mm | 1 | 100% | ||||
| gap | Yes | 0 | 0.0% | |||
| No | 1 | 100% | ||||
| 2D T2w | 31 | 67.4% | slice thickness | ≤3 mm | 14 | 45.2% |
| >3 mm | 15 | 48.4% | ||||
| gap | Yes | 11 | 35.5% | |||
| No | 18 | 58.1% | ||||
| 3D T2w | 1 | 2.2% | voxel size | <1 mm (isotropic) | 1 | 100% |
| 1 mm (isotropic) | 0 | 0.0% | ||||
| other | 0 | 0.0% | ||||
| 2D FLAIR | 11 | 23.9% | slice thickness | ≤3 mm | 3 | 27.3% |
| >3 mm | 8 | 72.7% | ||||
| gap | Yes | 2 | 18.2% | |||
| No | 9 | 81.8% | ||||
| 3D FLAIR | 37 | 80.4% | voxel size | <1 mm (isotropic) | 9 | 24.3% |
| 1 mm (isotropic) | 23 | 62.2% | ||||
| other | 5 | 13.5% | ||||
| Sequences for cortical lesions detection | ||||||
| 2D DIR | 3 | 6.5% | slice thickness | ≤3 mm | 3 | 100% |
| >3 mm | 0 | 0.0% | ||||
| gap | Yes | 0 | 0.0% | |||
| No | 3 | 100% | ||||
| 3D DIR | 11 | 23.9% | voxel size | <1 mm (isotropic) | 3 | 27.3% |
| 1 mm (isotropic) | 7 | 63.6% | ||||
| other | 1 | 9.1% | ||||
| 2D PSIR | 4 | 8.7% | slice thickness | ≤3 mm | 2 | 50.0% |
| >3 mm | 1 | 25.0% | ||||
| gap | Yes | 2 | 50.0% | |||
| No | 1 | 25.0% | ||||
| 3D PSIR | 3 | 6.5% | voxel size | <1 mm (isotropic) | 1 | 33.3% |
| 1 mm (isotropic) | 2 | 66.7% | ||||
| other | 0 | 0.0% | ||||
| None | 27 | 58.7% | ||||
| Sequences for optic nerves evaluation | ||||||
| STIR-T2w | 24 | 52.2% | slice thickness | ≤3 mm | 22 | 91.7% |
| >3 mm | 2 | 8.3% | ||||
| gap | Yes | 6 | 25.0% | |||
| No | 18 | 75.0% | ||||
| Post-Gd Fat-Sat T1w | 16 | 34.8% | slice thickness | ≤3 mm | 16 | 100% |
| >3 mm | 0 | 0.0% | ||||
| gap | Yes | 4 | 25.0% | |||
| No | 12 | 75.0% | ||||
| None | 15 | 32.6% | ||||
| Additional sequences | ||||||
| DWI | 44 | 95.6% | ||||
| GrE-T2* | 15 | 32.6% | slice thickness | ≤3 mm | 4 | 26.7% |
| >3 mm | 11 | 73.3% | ||||
| gap | Yes | 6 | 40.0% | |||
| No | 9 | 60.0% | ||||
| 2D SWI | 7 | 15.2% | slice thickness | ≤3 mm | 5 | 71.4% |
| >3 mm | 2 | 28.6% | ||||
| gap | Yes | 2 | 28.6% | |||
| No | 5 | 71.4% | ||||
| 3D SWI | 12 | 26.1% | voxel size | <1 mm (isotropic) | 3 | 25.0% |
| 1 mm (isotropic) | 9 | 75.0% | ||||
| other | 0 | 0.0% | ||||
| None | 0 | 0.0% | ||||
| SPINE MRI | ||||||
| MRI SEQUENCES | Number of Affirmative Answers | Percentage | Additional Questions | Number of Answers | Percentage | |
| T2-weighted | ||||||
| T2w | 38 | 82.6% | acquisition plane | sagittal | 38 | 100% |
| axial | 12 | 31.6% | ||||
| slice thickness on sagittal acquisition | ≤3 mm | 37 | 97.4% | |||
| >3 mm | 1 | 2.6% | ||||
| gap on sagittal acquisition | Yes | 14 | 36.8% | |||
| No | 24 | 63.2% | ||||
| PDw | 2 | 4.3% | acquisition plane | sagittal | 2 | 100% |
| axial | 0 | 0.0% | ||||
| slice thickness on sagittal acquisition | ≤3 mm | 2 | 100% | |||
| >3 mm | 0 | 0.0% | ||||
| gap on sagittal acquisition | Yes | 2 | 100% | |||
| No | 0 | 0.0% | ||||
| STIR-T2w | 40 | 87.0% | acquisition plane | sagittal | 40 | 100% |
| axial | 5 | 12.5% | ||||
| slice thickness on sagittal acquisition | ≤3 mm | 38 | 95.0% | |||
| >3 mm | 2 | 5.0% | ||||
| gap on sagittal acquisition | Yes | 16 | 40.0% | |||
| No | 24 | 60.0% | ||||
| T1-weighted and inversion recovery | ||||||
| PSIR | 2 | 4.3% | acquisition plane | sagittal | 2 | 100% |
| axial | 0 | 0.0% | ||||
| slice thickness on sagittal acquisition | ≤3 mm | 2 | 100% | |||
| >3 mm | 0 | 0.0% | ||||
| gap on sagittal acquisition | Yes | 1 | 50.0% | |||
| No | 1 | 50.0% | ||||
| 2D SE-T1w (pre-Gd) | 22 | 47.8% | acquisition plane | sagittal | 22 | 100% |
| axial | 5 | 22.7% | ||||
| slice thickness on sagittal acquisition | ≤3 mm | 22 | 100% | |||
| >3 mm | 0 | 0.0% | ||||
| gap on sagittal acquisition | Yes | 8 | 36.4% | |||
| No | 14 | 63.6% | ||||
| 3D GrE-T1w (pre-Gd) | 2 | 4.3% | acquisition plane | sagittal | 2 | 100% |
| axial | 1 | 50.0% | ||||
| slice thickness on sagittal acquisition | ≤3 mm | 2 | 100% | |||
| >3 mm | 0 | 0.0% | ||||
| gap on sagittal acquisition | Yes | 0 | 0.0% | |||
| No | 2 | 100% | ||||
| 2D SE-T1w (post-Gd) | 36 | 78.3% | acquisition plane | sagittal | 36 | 100% |
| axial | 9 | 25.0% | ||||
| slice thickness on sagittal acquisition | ≤3 mm | 33 | 91.6% | |||
| >3 mm | 2 | 5.5% | ||||
| gap on sagittal acquisition | Yes | 13 | 36.1% | |||
| No | 22 | 61.1% | ||||
| delay | ≤5′ | 17 | 47.2% | |||
| >5′ | 19 | 52.8% | ||||
| 3D GrE-T1w (post-Gd) | 4 | 8.7% | acquisition plane | sagittal | 4 | 100% |
| axial | 1 | 25.0% | ||||
| slice thickness on sagittal acquisition | ≤3 mm | 3 | 75.0% | |||
| >3 mm | 1 | 25.0% | ||||
| gap on sagittal acquisition | Yes | 1 | 25.0% | |||
| No | 3 | 75.0% | ||||
| delay | ≤5′ | 0 | 0.0% | |||
| >5′ | 4 | 100% | ||||
Publisher’s Note: MDPI stays neutral with regard to jurisdictional claims in published maps and institutional affiliations. |
© 2021 by the authors. Licensee MDPI, Basel, Switzerland. This article is an open access article distributed under the terms and conditions of the Creative Commons Attribution (CC BY) license (https://creativecommons.org/licenses/by/4.0/).
Share and Cite
Tortora, M.; Tranfa, M.; D’Elia, A.C.; Pontillo, G.; Petracca, M.; Bozzao, A.; Caranci, F.; Cervo, A.; Cosottini, M.; Falini, A.; et al. Walk Your Talk: Real-World Adherence to Guidelines on the Use of MRI in Multiple Sclerosis. Diagnostics 2021, 11, 1310. https://doi.org/10.3390/diagnostics11081310
Tortora M, Tranfa M, D’Elia AC, Pontillo G, Petracca M, Bozzao A, Caranci F, Cervo A, Cosottini M, Falini A, et al. Walk Your Talk: Real-World Adherence to Guidelines on the Use of MRI in Multiple Sclerosis. Diagnostics. 2021; 11(8):1310. https://doi.org/10.3390/diagnostics11081310
Chicago/Turabian StyleTortora, Mario, Mario Tranfa, Anna Chiara D’Elia, Giuseppe Pontillo, Maria Petracca, Alessandro Bozzao, Ferdinando Caranci, Amedeo Cervo, Mirco Cosottini, Andrea Falini, and et al. 2021. "Walk Your Talk: Real-World Adherence to Guidelines on the Use of MRI in Multiple Sclerosis" Diagnostics 11, no. 8: 1310. https://doi.org/10.3390/diagnostics11081310