Article

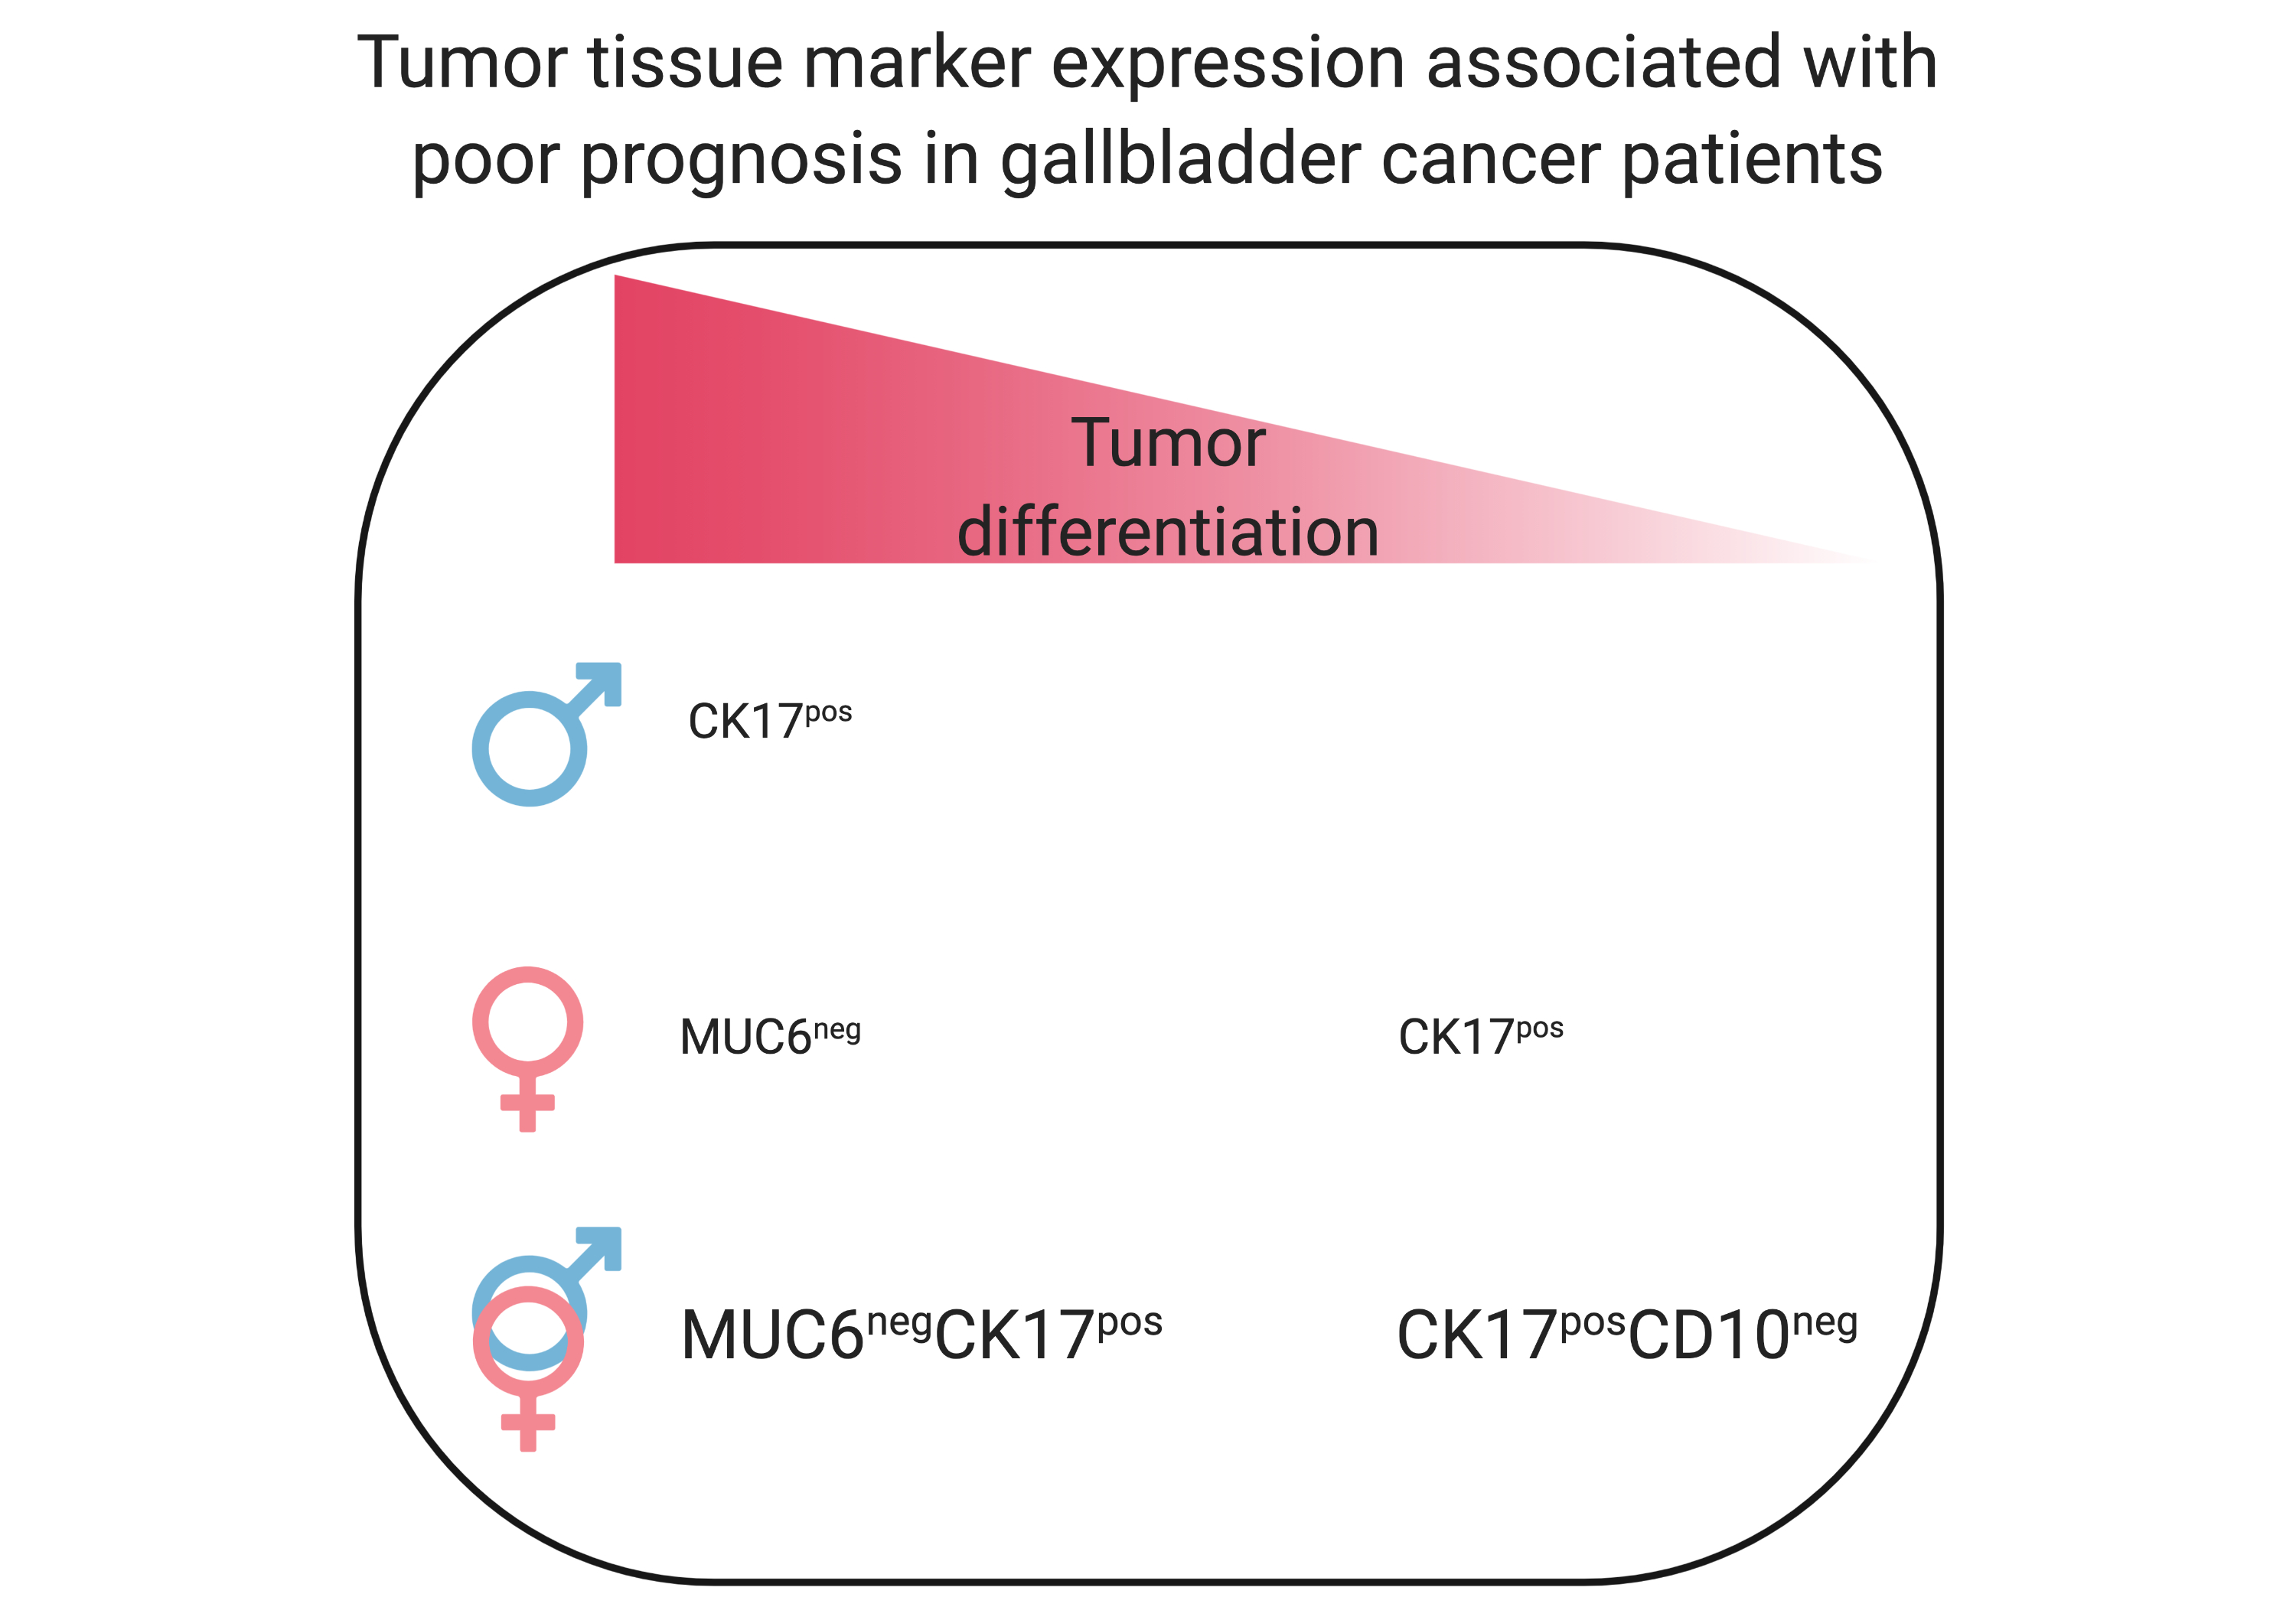
The Evaluation of 17 Gastrointestinal Tumor Markers Reveals Prognosis Value for MUC6, CK17, and CD10 in Gallbladder-Cancer Patients

1
Subdepartamento de Anatomía Patológica, Hospital Base de Valdivia, Valdivia 5090000, Chile
2
Programa Institucional de Fomento a la Investigación, Desarrollo e Innovación, Universidad Tecnológica Metropolitana, Santiago 8940577, Chile
3
Millennium Institute on Immunology and Immunotherapy, Faculty of Medicine, Universidad de Chile, Santiago 8380453, Chile
4
Disciplinary Program of Immunology, Institute of Biomedical Sciences, Faculty of Medicine, Universidad de Chile, Santiago 8380453, Chile
5
Departamento de Cirugía Oriente, Facultad de Medicina, Universidad de Chile, Santiago 7500922, Chile
6
Subdepartamento de Enfermedades Virales, Instituto de Salud Pública, Santiago 7780050, Chile
7
Escuela de Tecnología Médica, Universidad Austral de Chile, Puerto Montt 5500000, Chile
8
Instituto de Bioquímica y Microbiología, Universidad Austral de Chile, Valdivia 5090000, Chile
*
Authors to whom correspondence should be addressed.
These authors share first authorship.
Diagnostics 2021, 11(2), 153; https://doi.org/10.3390/diagnostics11020153
Submission received: 4 December 2020 / Revised: 14 January 2021 / Accepted: 19 January 2021 / Published: 21 January 2021
(This article belongs to the Section Pathology and Molecular Diagnostics)

Abstract

:
Gallbladder cancer (GBC) is an aggressive and highly lethal disease with relatively low global incidence, but one that constitutes a major health problem in Asian and Latin American countries, particularly in Chile. The identification of new tumor-associated markers with potential prognosis value is required for GBC clinical practice. Using immunohistochemistry/tumor tissue microarray, we evaluated the expression of 17 gastrointestinal tumor-associated protein markers (CK7, CK17, CK19, CK20, CKLMW, CKHMW, MUC1, MUC2, MUC5AC, MUC6, CA125, CD10, CEA, vimentin, villin, claudin-4, and CDX2) in primary gallbladder adenocarcinomas from 180 Chilean patients and analyzed potential associations with their pathological and clinical characteristics. Younger female patients with well- to moderately differentiated tumors had a better prognosis than that of older female or male patients with tumors with a similar tumor differentiation grade. Among all analyzed markers, MUC6 expression was associated with better prognosis in patients with well- to moderately differentiated tumors, whereas CK17 or CD10 was associated with worse prognosis in patients with poorly differentiated tumors. In addition, the MUC6+CK17 expression pattern was strongly associated with better prognosis in patients with well- to moderately differentiated tumors, whereas patients with poorly differentiated tumors and with the CK17+CD10+ expression pattern showed worse prognosis. Our results suggest that tumor MUC6, CK17, and CD10 can be considered as potential prognosis markers for GBC.

Graphical Abstract

1. Introduction

Gallbladder cancer (GBC) is the most frequent malignancy of the biliary tract and the fifth most common digestive neoplastic disease [1,2]. The prognosis of GBC is poor, with a median overall survival (OS) time of 3–11 months and a five-year survival rate ranging from 4% to 60%, depending on disease stage and tumor receptibility. This is mainly due to the aggressive behavior of the tumor cells and its nonspecific symptoms, leading to late clinical manifestation and, therefore, diagnosis at an advanced stage [3].
Global incidence and mortality for GBC show a strong geographical distribution and ethnic correlation [1,2,4]. In 2018, the International Agency for Research on Cancer (IARC) Globocan 2018 database estimated that GBC constitutes 1.7% of all cancer deaths, with 220,000 new cases diagnosed annually [2]. Interestingly, GBC is infrequent in most Western countries, while Japan, India, and Latin American countries share a high incidence of this tumor, constituting a major health problem [4,5,6]. Remarkably, Chile has the highest global incidence and mortality rates of GBC, representing one of the main causes of death due to malignant tumors in women [3,6]. The development of GBC was linked to various predisposing environmental and genetic variants [7]. However, one of the most relevant risk factors for GBC development is cholecystolithiasis and chronic inflammation of the gallbladder [8]. Other risk factors associated with GBC carcinogenesis are, for example, gender (women have two to six times more chances to develop GBC than men), obesity, congenital developmental abnormalities, sedentary behavior, gallbladder chronic infection and inflammation, ethnicity, and advanced age [7,8,9]. Adenocarcinoma is the most common histologic type, accounting for 98% of all gallbladder tumors.
Traditional chemotherapy and radiotherapy managements provide only marginal survival benefits to patients with locally advanced or metastatic GBC [10,11]. Therefore, the identification of novel molecular markers is crucial for the early diagnosis, prognosis, and further development of targeted therapies for GBC patients [12]. In this study, in a cohort of 180 Chilean patients with primary gallbladder adenocarcinoma, we evaluated the expression of 17 gastrointestinal tumor-associated protein markers consisting of six cytokeratins (CK7, CK17, CK19, CK20, CKLMW, and CKHMW), five mucins (MUC1, MUC2, MUC5AC, MUC6, and CA125), two glycoproteins (CD10 and CEA), two cytoskeleton-associated proteins (vimentin and villin), one tight junction protein (Claudin4), and one transcription factor (CDX2). The association of the expression profile of these markers with clinical and pathological GBC patients’ characteristics was further analyzed.
Cytokeratin expression is frequently used for the differential diagnosis of carcinomas originating from different sites, with the combination of CK7 and CK20 being the most useful for this purpose [13]. Mucins play a pivotal role in gallstone pathogenesis and in influencing cancer biology, such as carcinoma invasion and metastatic potential [14,15]. Glycoproteins CD10 and carcinoembryonic antigen (CEA) were used as important biomarkers for digestive-tract tumors [16,17]. Both vimentin and villin are proteins associated with GBC and involved in cytoskeleton homeostasis, epithelial-to-mesenchymal transition, and epithelial maintenance [18,19]. CDX2 is a transcription factor related to cellular growth and the differentiation of the intestinal tract, and it was previously associated with the clinical outcome of GBC patients [20].
Our results showed that MUC6 tumor expression was associated with a better prognosis in patients with well- to moderately differentiated tumors, whereas CK17 or CD10 tumor expression was associated with worse prognosis in patients with poorly differentiated tumors. Therefore, we propose that these proteins may constitute candidates for prognosis markers in patients with primary adenocarcinoma of the gallbladder.

2. Materials and Methods

2.1. Patients and Tumor Samples

Retrospective analysis of cholecystectomy specimens diagnosed as GBC and clinical data from patients diagnosed at the pathological anatomy subdepartment of Hospital Base Valdivia (Valdivia, Chile) was performed from 2001 to 2015. Cases were selected using code C.23 according to the International Classification of Diseases for Oncology (ICD-O). The study was performed in agreement with the Code of Ethics of the World Medical Association (Declaration of Helsinki), printed in the British Medical Journal (18 July 1964), and approved by the Bioethical Committee for Human Research of the Valdivia Regional Hospital. All patients signed a letter of informed consent for publication at the time of surgery.
Only primary invasive gallbladder adenocarcinoma cases were considered, reaching 215 cases. In situ adenocarcinoma, squamous carcinoma, neuroendocrine carcinoma, and metastases were excluded. From the 215 clinical cases, 180 samples (83.7%, slides and paraffin tissue blocks) were obtained. For the detection of each antigen, 159–178 cases could be analyzed due to limitations of the availability of tissue material. For each tumor sample, 2–3 foci of the neoplastic invasion were selected for analysis under light microscopy, and these areas were marked.
Tumor staging and differentiation status were based on the reported imaging findings and the pathologic evaluation of the resected specimens according to the eighth edition of the American Joint Committee on Cancer Staging Manual [21].

2.2. Tissue Microarray

Quick-Ray® UT06 Manual Tissue Microarrayer (Unitma Co., Ltd., Seoul, Korea) was used according to the manufacturer’s instructions. We used a 2 mm puncher tip with its respective puncher and receptor blocks with perforations of 2 mm × 60 mm. When the slices were faced with their respective donor block (the tissue to be studied in a paraffin block), the chosen site could be precisely located. Previous to tissue extraction, donor blocks were incubated at 37 °C–40 °C for 15 min–20 min. Then, samples were introduced into a puncher tip at a depth of 5 mm (needle measurement), obtaining a tissue cylinder that was deposited into a receptor block.
The block was placed on a horizontal and flat surface, and the needle of the puncher tip was accommodated in a position perpendicular to the holes. Tissue was slowly injected into the cylinder of the corresponding hole. Lastly, cylinders were softly pushed to even out the superior surface of the receptor block. The receptor blocks for the microarrays had 60 cylinder perforations, of which only 59 were used each time, leaving a strategic place to individualize and orientate them in the direction in which they were mounted, facilitating their identification further. In parallel, a sheet with a grid was created where the position of each piece of tissue and its respective case number were recorded. The receptor block was placed on a base mold (from the kit) face down and incubated at 70 °C for 30 min–60 min. Once the blocks had been completely transparent, they were embedded in an inclusion cassette and left to solidify on a cold plaque. Finally, a rotary microtome was used to produce slices with a width of three microns. These slices were placed on slides of 75 mm × 25 mm with their respective positive tissue controls.

2.3. Immunohistochemistry

Representative blocks (tissue specimens fixed in 10% neutral buffered formalin and embedded in paraffin wax) were selected for immunohistochemistry analysis. Paraffin blocks were dissected into 3 μm thick slides mounted on positively charged slides. The technique was achieved with an automatic BenchMark GX Ventana system (Roche, AZ, USA) using an ultraView Universal DAB Detection kit (Roche, Arizona, USA), following the manufacturer’s instructions. A complete list of the antibodies and positive control tissue used in this work is shown in Supplementary Table S1. Negative controls were prepared by omitting primary antibodies. Additionally, negative tissue controls were routinely used to reveal nonspecific binding and false-positive results. Two independent pathologists blindly evaluated all immunohistochemistry slides under light microscopy and classified antigen expression by comparison with positive and tissue controls included in each slice. The intensity of antigen expression was determined with a comparison among the positive tissue controls included in each slice and subjectively graded as negative expression—weak expression for those cases where the staining intensity was lower than the positive control, moderate expression for those samples with an antigen staining intensity equal to the positive control, and intense expression for those cases when antigen-staining intensities were higher than the positive control. Moreover, positive staining in tissue was subjectively categorized as focal, patchy, or diffuse patterns according to the marker location. Intensity and pattern distributions of the evaluated markers in primary gallbladder adenocarcinoma are shown in Supplementary Table S2. For statistical analysis of associations between tumor-associated marker expression and the clinicopathological characteristics of GBC patients, only the absence or presence of positive staining was considered.

2.4. Statistical Analysis

Statistical analyses were performed using GraphPad Prism 7 (GraphPad Software Inc., San Diego, CA, USA) and STATA/IC 16.0 (StataCorp, College Station, TX, USA) software. Chi-squared with Yates correction analysis was used to analyze the frequency of each group in relation to the studied parameters. Kaplan–Meier and log-rank (Mantel–Cox) tests were used to construct and evaluate OS data. Univariate and multivariate analyses were performed using the Cox proportional-hazard regression model (Breslow method) to study the effects of different variables on OS. Differences were considered statistically significant at p < 0.05.

3. Results

3.1. Clinicopathological Characteristics of GBC Patients

In line with previously reported data [1,3], the majority of GBC patients were female (77.8%) (Table 1). The median age of patients was 67.5 years old, ranging from 34 years old to 92 years old. The median age of the female patients was 66.5 years old, while the male median age was 70 years old. According to tumor differentiation status, only 8.9% of patients had well-differentiated tumors, whereas 58.3% and 32.8% had moderately and poorly differentiated tumors, respectively (Table 1). Patients with well-differentiated tumors were, on average, younger than patients with moderately or poorly differentiated tumors (60 years old vs. 69 years old or 67 years old, respectively). Additionally, the frequency of patients with advanced-stage tumors (T2–T4) was higher in patients with poorly differentiated tumors (100%) than in patients with moderately (87%) or well-differentiated tumors (55%) (Table 1).
As expected, the median OS time and five-year survival rate significantly decreased as the tumors became less differentiated (Figure 1A). In fact, patients with poorly differentiated tumors showed a median OS of 5.5 months and a five-year survival rate of 8.6%, while patients with well- to moderately differentiated tumors had a median OS of 14.5 months and a five-year survival rate of 26.3% (p < 0.0001; Figure 1B). In addition, female patients with well- to moderately differentiated tumors showed significantly better prognosis than male patients with tumors with the same grade of differentiation did (p = 0.0354; median OS, 19.5 months vs. 12 months; five-year survival rate, 29.3% vs. 15.4%; Figure 1C). Gender was not associated with the median OS of patients when tumors progressed to being poorly differentiated, but the percentage of long-term survival patients (five-year survival rate) is superior in women (10.9%) to male patients (0%) with poorly differentiated tumors (Figure 1D).
Analysis based on age, disease onset, and gender showed that younger female patients (early onset) with well- to moderately differentiated tumors have a better prognosis than male (both early and late-onset) and late-onset female (Figure 1E,F) patients. On the other hand, the age of disease onset and gender did not significantly correlate with the survival of patients with poorly differentiated tumors (Figure 1G,H). Altogether, according to our GBC patient cohort, younger female patients with well- to moderately differentiated tumors have a better prognosis than that of older female or male patients.

3.2. Immunohistochemistry Analysis of Broad Panel of Tumor-Associated Markers in Primary GBC Samples

The distribution of staining patterns (positive cases) for the 17 tumor-associated immunohistochemistry markers according to tumor differentiation and staging is shown in Table 2. Our results showed that more than 90% of cases diagnosed as primary adenocarcinoma of the gallbladder were positive for CK7 (97.6%), CK19 (98.2%), CKLMW (100%), CKHMW (91.6%), or MUC1 (97.1%) expression, or were negative for vimentin (96.1%) or MUC2 (96.9%). Expression levels from the rest of the evaluated tumor-associated markers (CK17, CK20, MUC5AC, MUC6, CDX2, CEA, CA125, CD10, claudin-4, and villin) showed more variable behavior, ranging from 81.8% (MUC5AC) to 15.4% (CK20) of positivity. Vimentin expression was statistically correlated with tumor differentiation status; it was expressed in a higher proportion in poorly differentiated tumors compared with well- to moderately differentiated tumors (p = 0.0014). Additionally, CA125 was expressed in a higher proportion in advanced-stage (T2 to T4) than in early stage (tumor in situ (TIS)–T1) tumors (p = 0.009), whereas MUC6 was expressed in higher proportion in early stage tumors (p = 0.04) (Table 2).

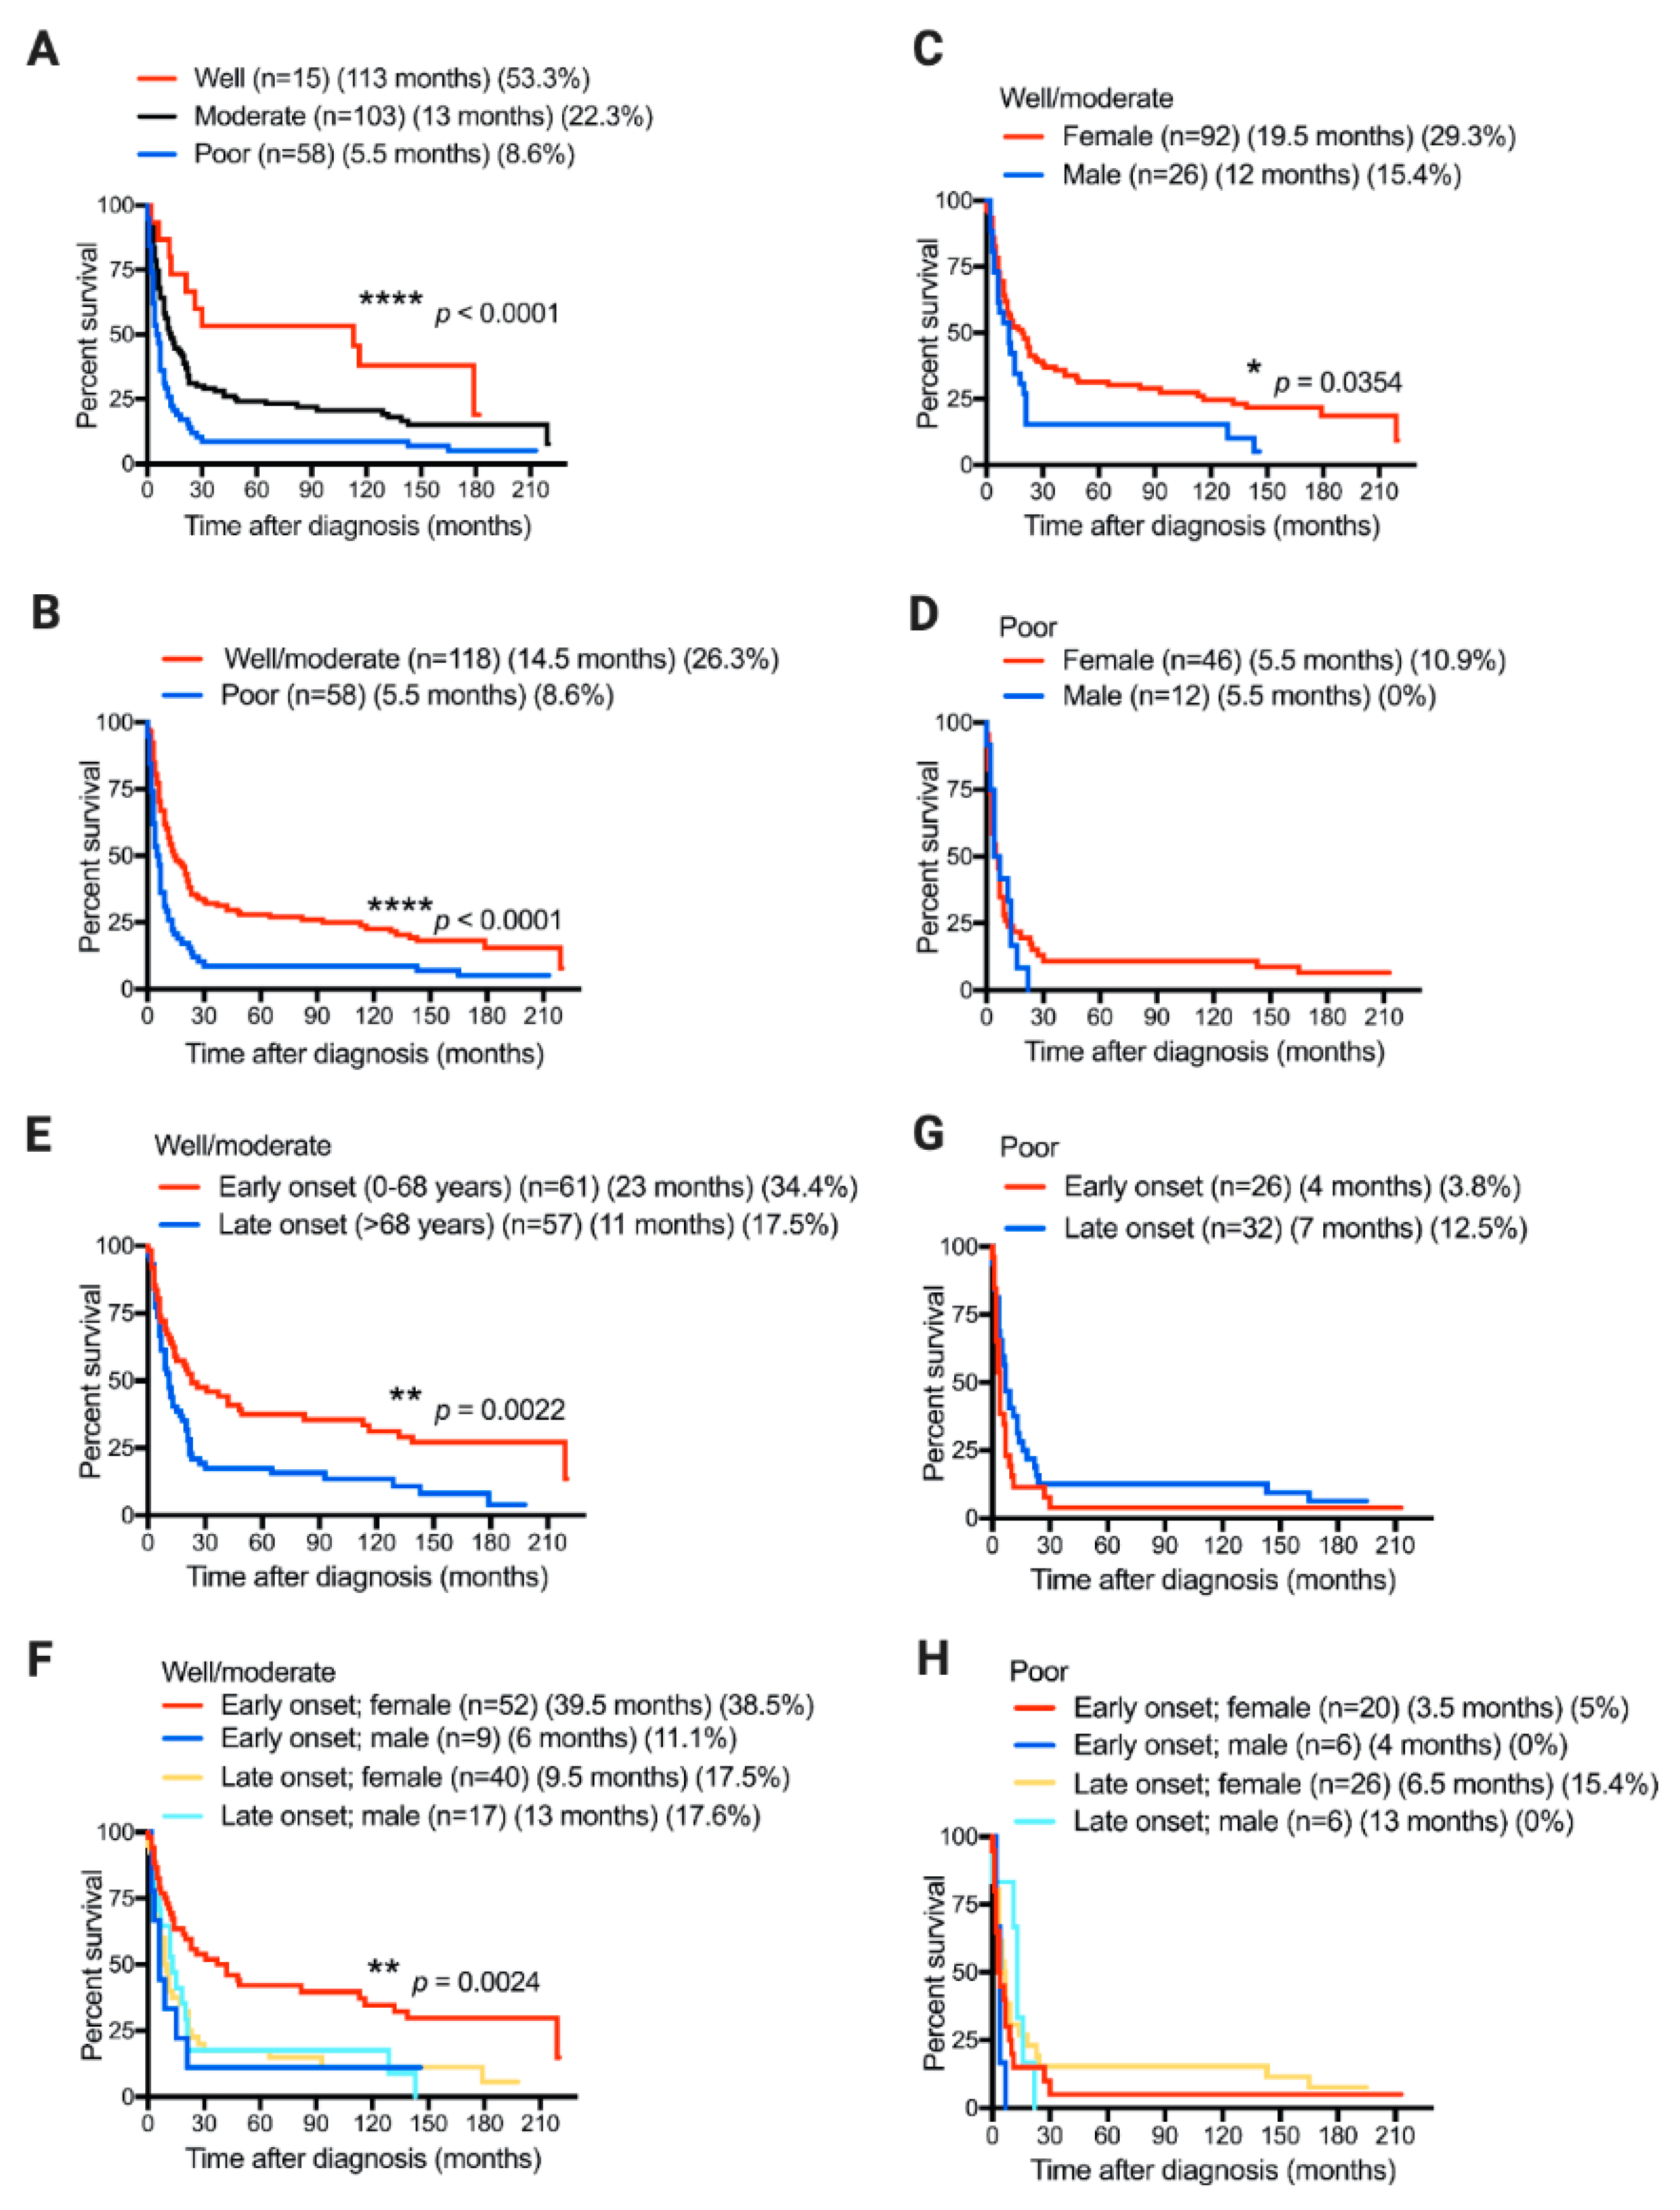
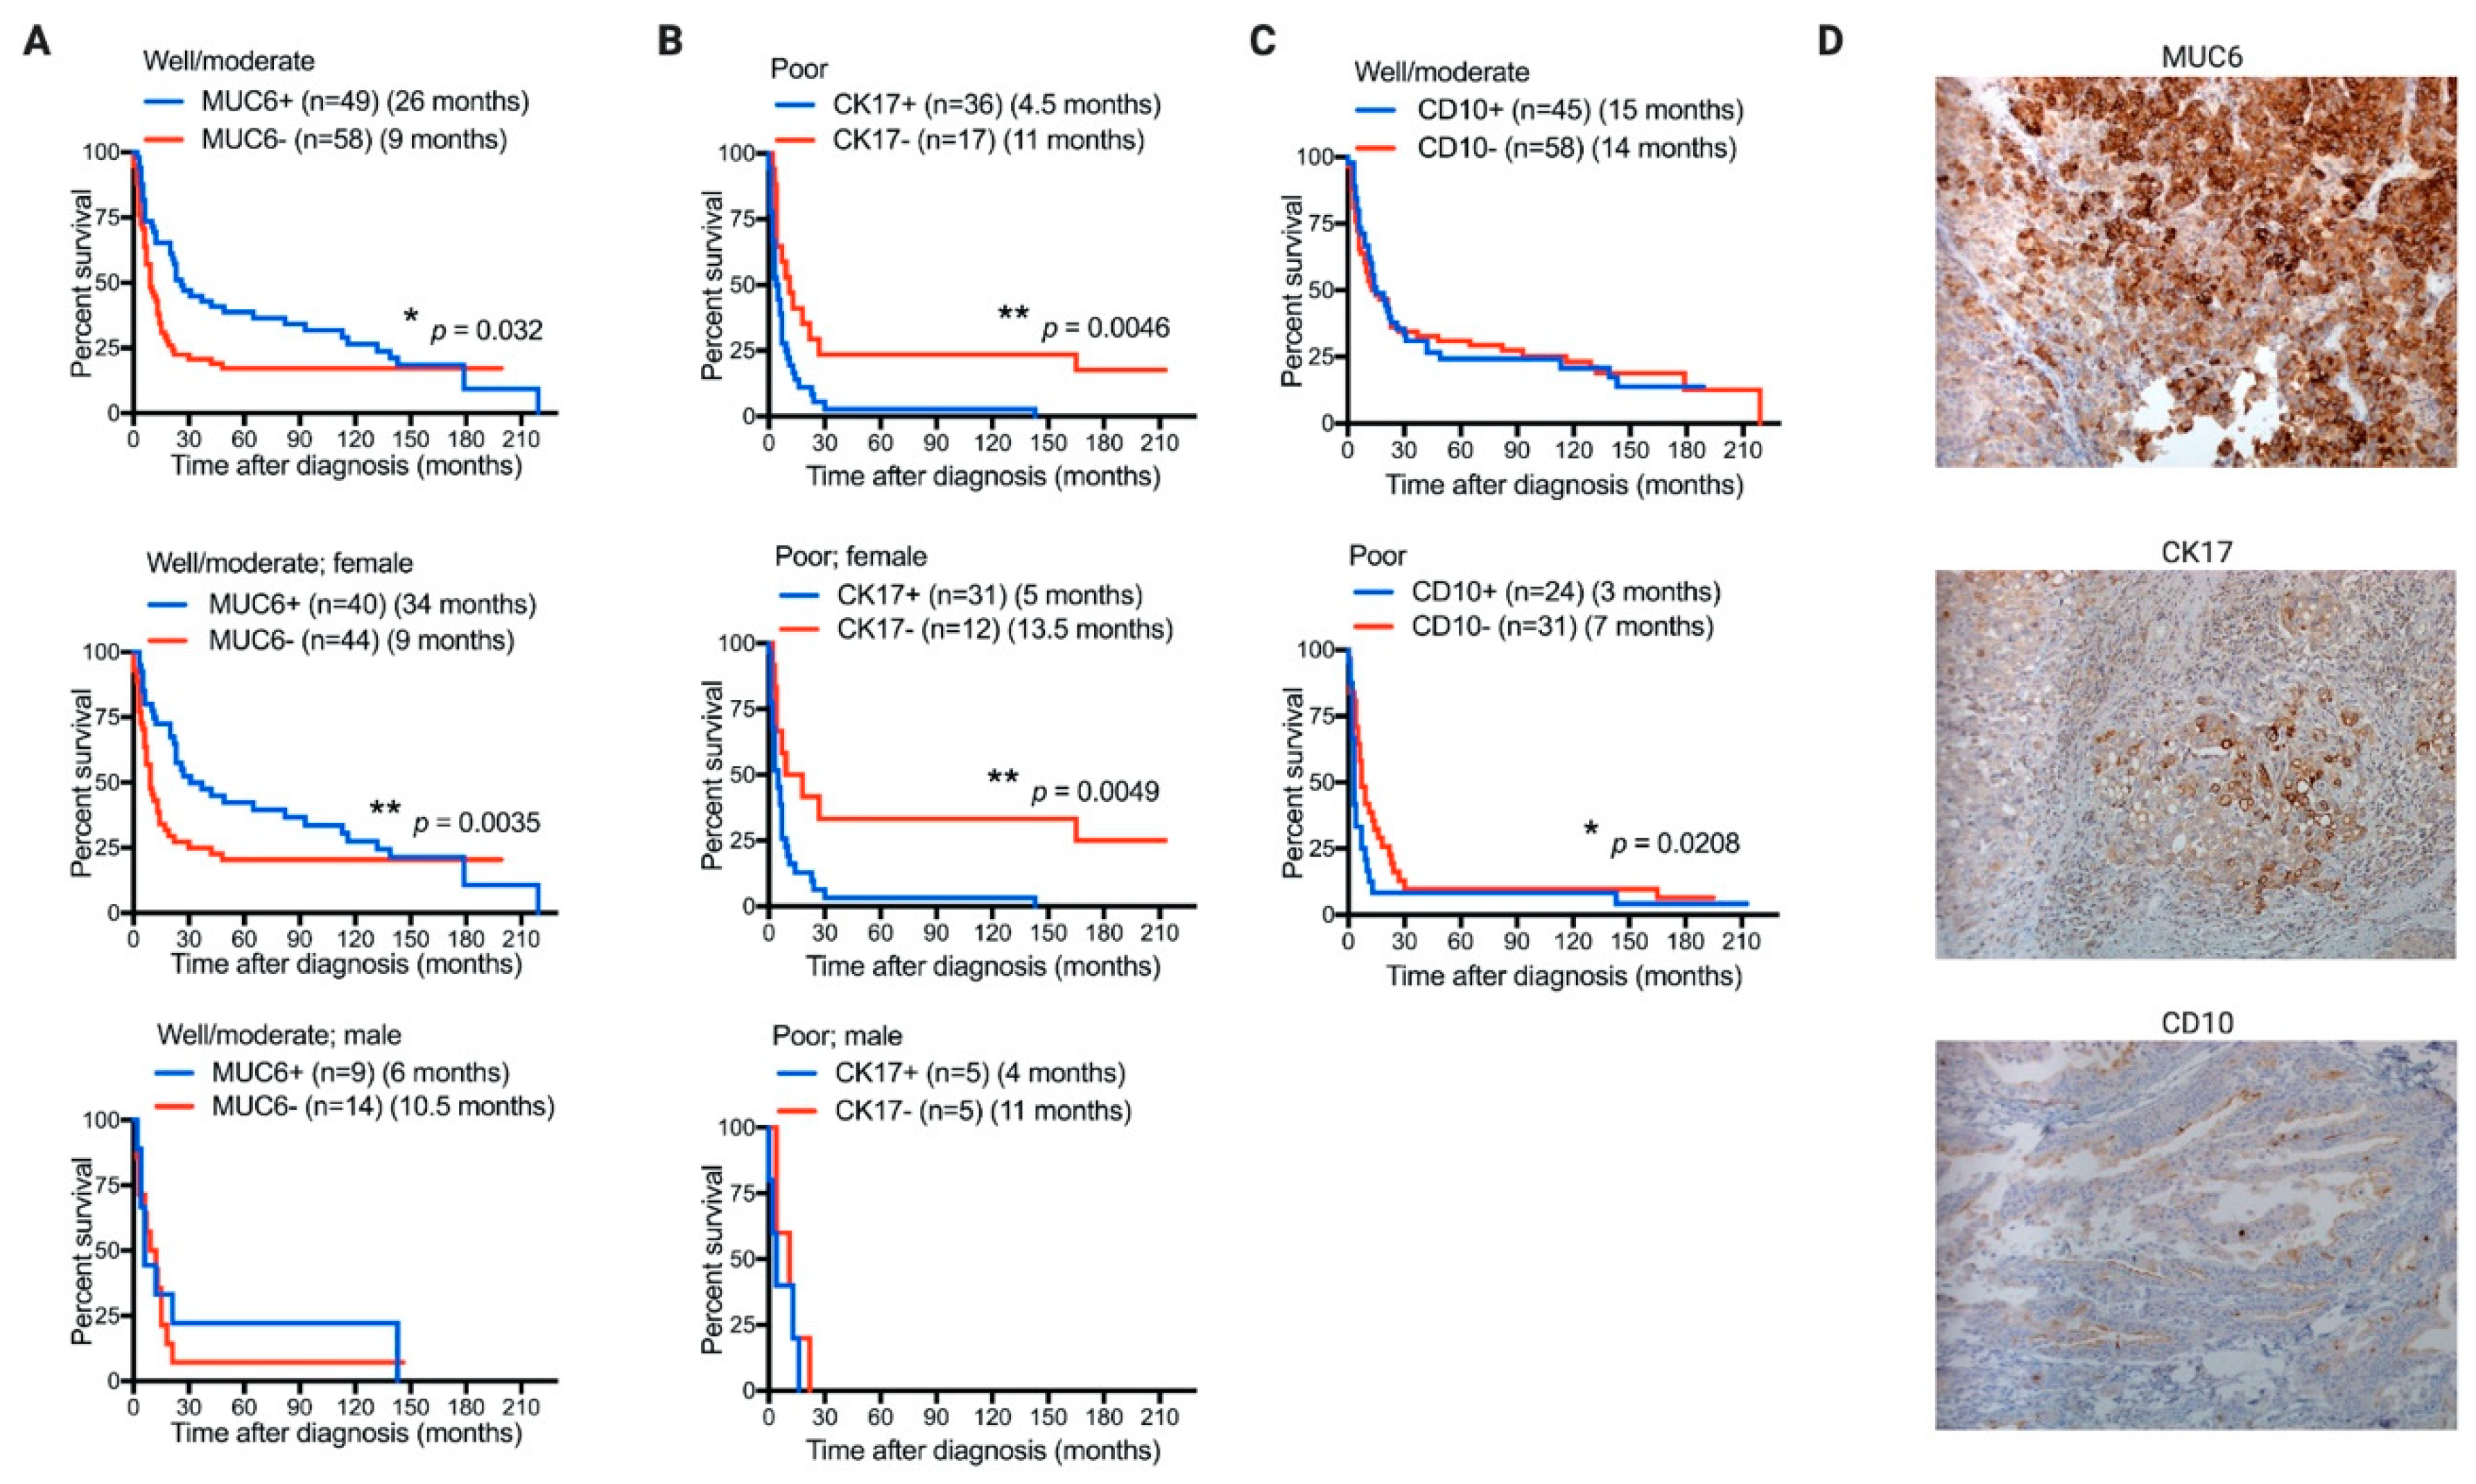
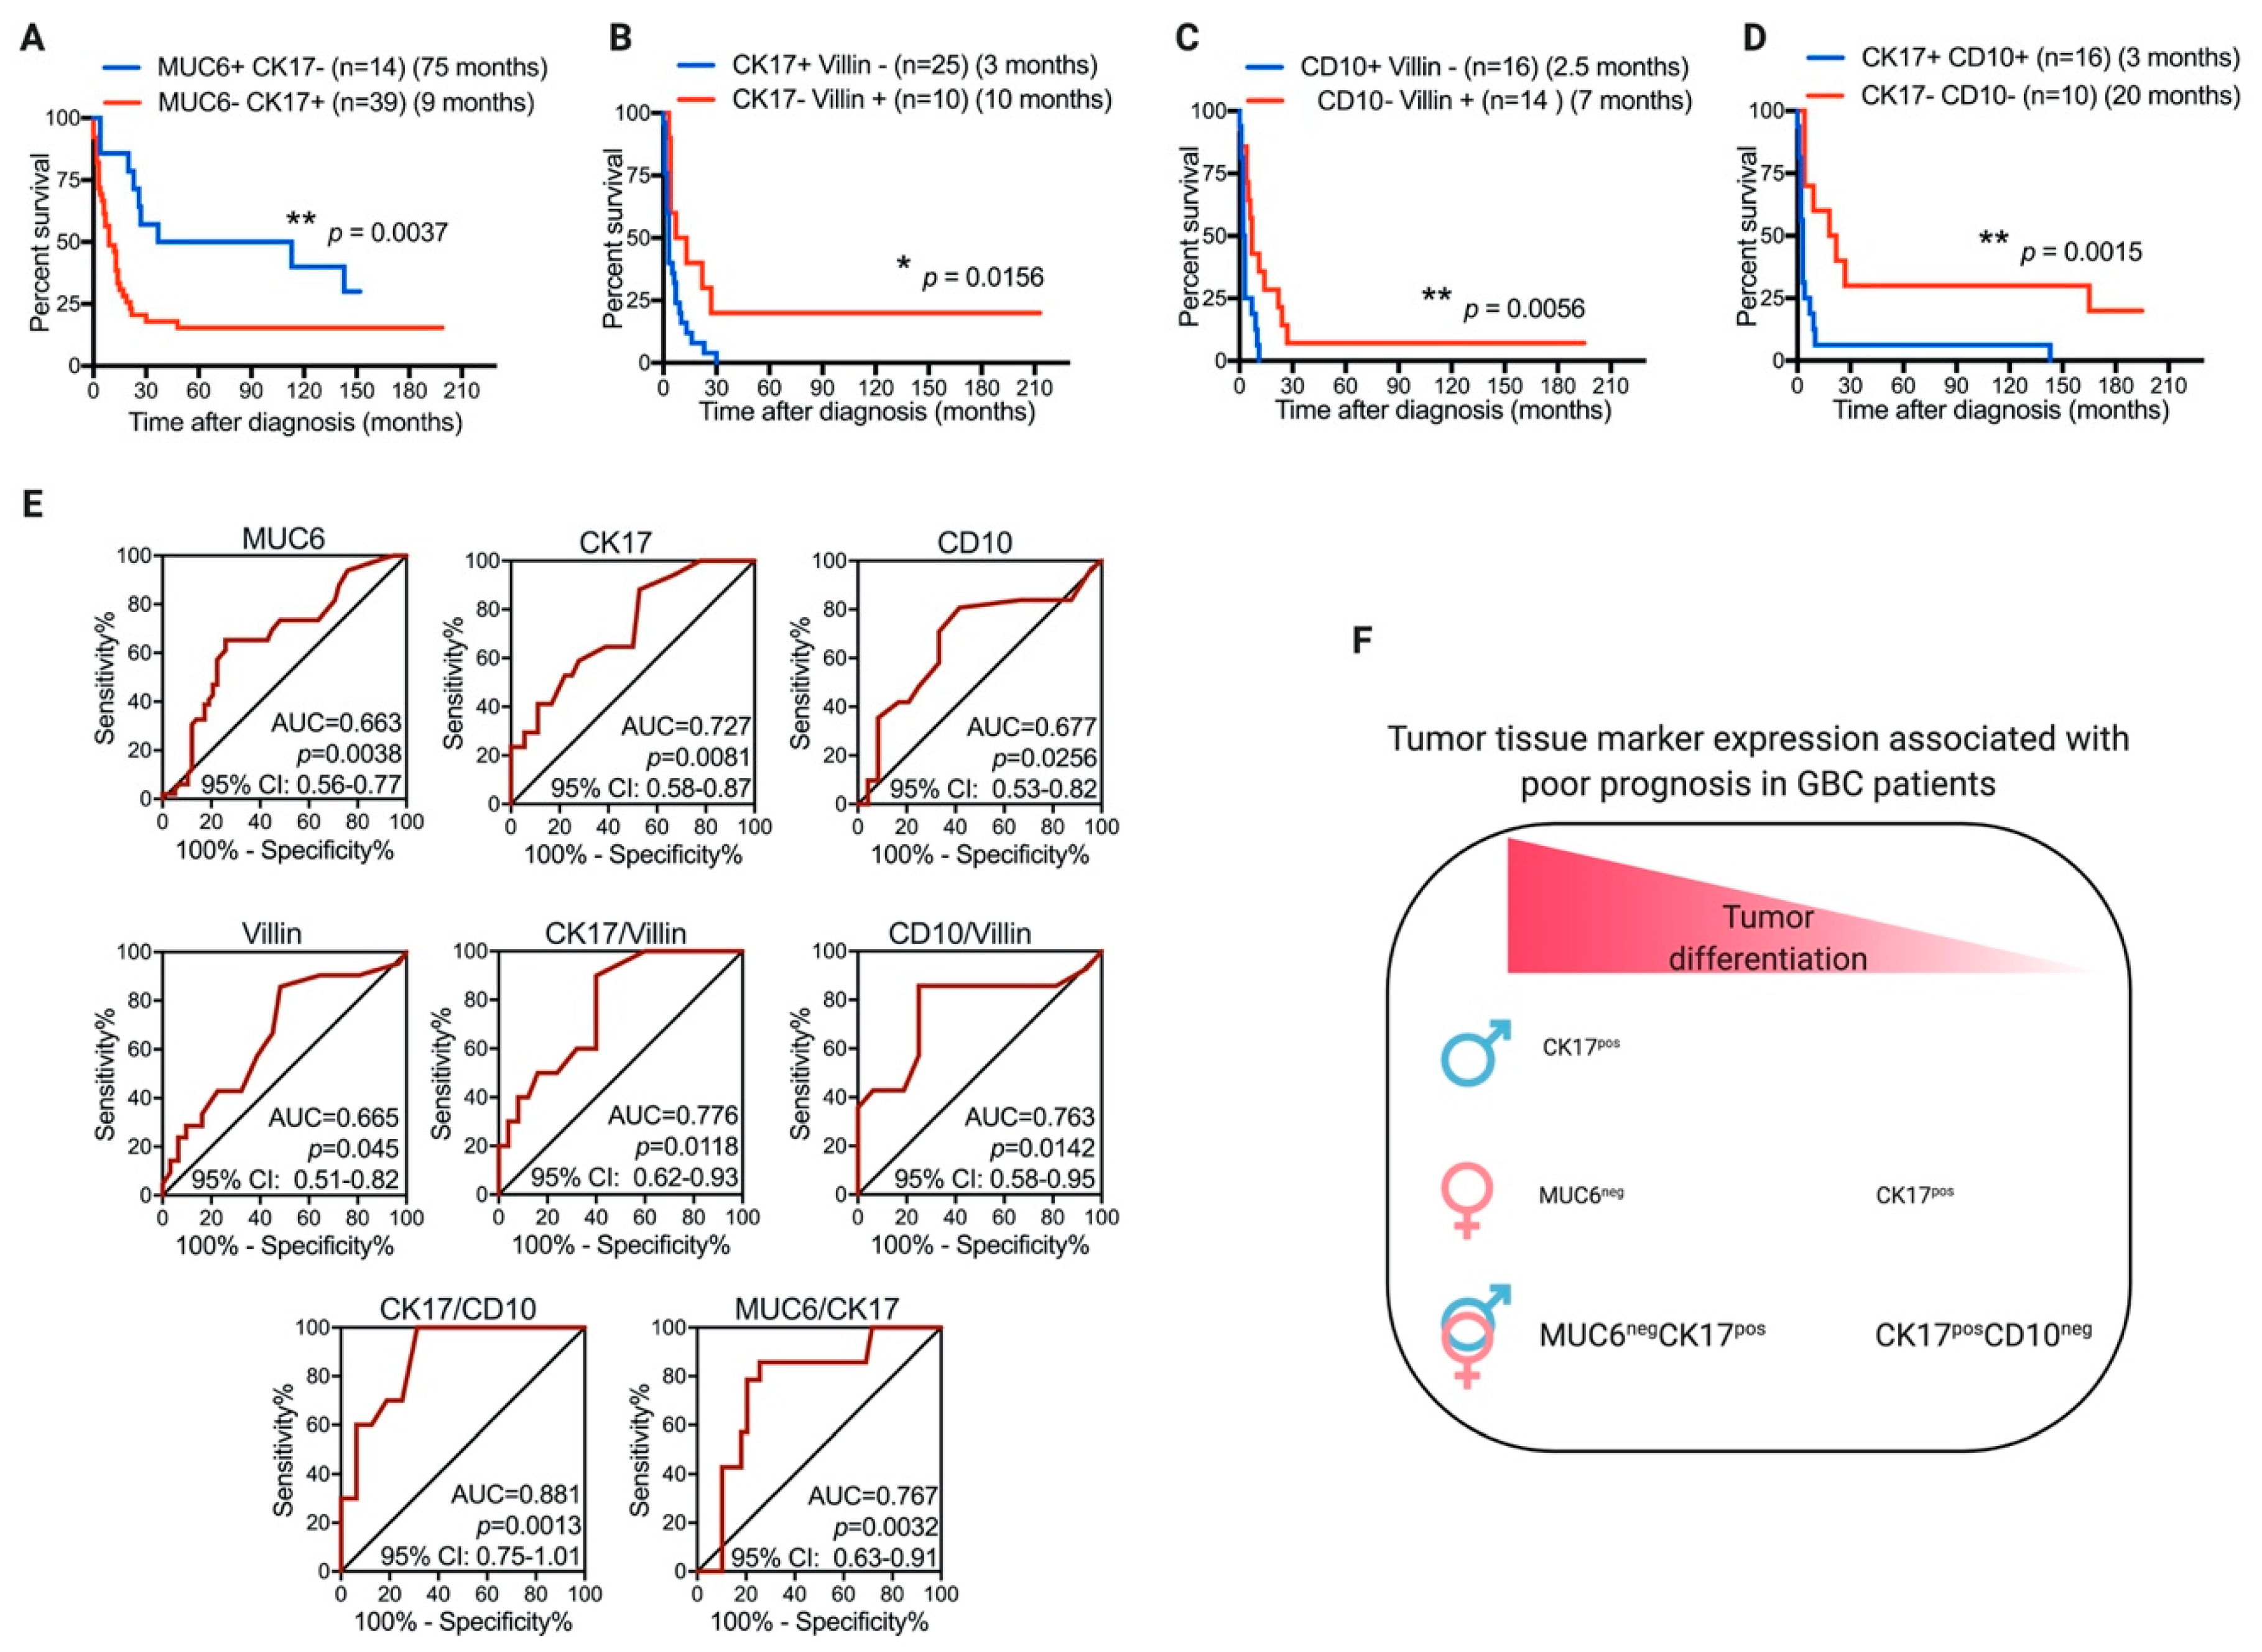
3.3. Association of Tumor-Associated Markers with GBC Patient Prognosis

We analyzed the association between molecular markers’ expression patterns and median OS according to the tumor differentiation status and gender of GBC patients. For these analyses, we excluded tumor-associated markers expressed in more than 90% (CK7, CK19, CKLMW, CKHMW, and MUC1) or less than 10% (vimentin and MUC2) of the tumor samples. Examples of immunohistochemistry photographs of tumor samples positive for CK7, CK19, CKLMW, CKHMW, and MUC1 or negative for vimentin and MUC2 are shown in Figure S1. Expression frequencies for CK20, MUC5AC, CDX2, CEA, CA125, or claudin-4 were not statistically associated with the OS time of GBC patients (data not shown). Immunohistochemistry examples of tumor samples positive for CK20, MUC5AC, CDX2, CEA, CA125, and claudin-4 are shown in Figure S2.
MUC6 expression in well- to moderately differentiated tumors was significantly correlated with better prognosis in GBC patients (median OS, 26 month vs. 9 months; p = 0.032), particularly in women (median OS, 34 months vs. 9 months; p = 0.0035) (Figure 2A). However, MUC6 expression was not associated with survival in patients with poorly differentiated tumors, independent of their gender (Figure S3). In addition, CK17 expression in well- to moderately differentiated tumors was only correlated with worse prognosis in male patients (median OS, 9 months vs. 143 months; p = 0.04) (Figure S4), in GBC patients with poorly differentiated tumors (median OS, 4.5 months vs. 11 months; p = 0.0046), and particularly in women (median OS, 5 months vs. 13.5 months; p = 0.0049) (Figure 2B). The expression of CD10 was slightly associated with worse prognosis in GBC patients with poorly differentiated tumors (median OS, 3 months vs. 7 months; p = 0.0208), while its expression was not associated with differential prognosis in patients with well- to moderately differentiated tumors or with patient gender (Figure 2C and data not shown). Representative immunohistochemistry images of tumor samples positives for MUC6, CK17, and CD10 are shown in Figure 2D.
Univariate and multivariate analyses of patients with poorly differentiated tumors using Cox regression models showed that CK17 and CD10 tumor expressions might be independent predictors for OS on GBC patients (Table 3). On the other hand, the same analyses in patients with well- to moderately differentiated tumors showed that MUC6 tumor expression and age of disease onset could be independent predictors in GBC patients (Table 3).
Then, we analyzed the prognosis association of a combined tumor-marker expression panel. The MUC6+CK17 expression pattern was strongly associated with better prognosis in GBC patients with well- to moderately differentiated tumors as compared with the expression of the MUC6CK17+ pattern (median OS, 75 months vs. 9 months; p = 0.0037) (Figure 3A). Additionally, patients with poorly differentiated tumors expressing double marker patterns CK17+Villin, CD10+Villin, or CK17+CD10+ showed lower OS times than patients with opposite double-marker patterns CK17Villin+ (3 months vs. 10 months; p = 0.0156), CD10Villin+ (2.5 months vs. 7 months; p = 0.0056), or CK17CD10 (3 months vs. 10 months; p = 0.0015) (Figure 3B–D).
Altogether, our results showed that the tumor expression patterns of MUC6, CK17, CD10, and villin constitute candidate markers with potential prognostic value for patients with primary adenocarcinoma of the gallbladder. According to receiver-operating-characteristic (ROC) curve analysis, tumor expression patterns MUC6CK17+ (for patients with well- to moderately differentiated tumors) and CK17+CD10 (for patients with poorly differentiated tumors) may be clinically useful, given that the area under the curve (AUC) and p values were >0.75 and <0.01, as suggested in the report of Fan et al. [22], respectively (Figure 3E,F).

4. Discussion and Conclusions

GBC is a digestive neoplasm characterized by its late diagnosis, high incidence, and mortality in some geographical regions, particularly in the female Chilean population [1,2,3]. Probably due to the relatively low incidences in industrialized Western countries, this disease has not been sufficiently characterized [2]. Currently, there are no reliable tumor-associated protein markers that can be precisely associated with primary gallbladder adenocarcinoma. To the extent of our knowledge, this is the first report evaluating the expression and association of an extensive number of gastrointestinal tumor-associated markers with patient prognosis in a large cohort of primary GBC patients. The obtained results may be of clinical utility, although further validation in an extended patient cohort is needed.
In our cohort, the majority of patients were women (77.8%), in line with evidence reported in the literature, as GBC is two to six times more common in women than in men [2,3]. Estrogen increases the saturation of cholesterol in the bile, thus increasing the risk of gallstone formation, which is believed to be the primary mechanism behind the greater risk of GBC in the female population [23]. In this study, OS was better in women than in men, particularly in younger (early onset) patients with well- or moderately differentiated tumors. These gender- and age-related associations with GBC prognosis were previously reported, both in patients receiving and not receiving postoperative therapies [24,25,26,27]. To date, the mechanistic causes explaining why gallbladder and biliary diseases (including GBC) are more common in women but more severe in men are not clearly known, but a similar behavior was also observed in other female-hormone-driving cancers, such as breast cancer [28], suggesting a dual role of estrogens in increasing the frequency but decreasing the severity of these kinds of tumors.
Of the 17 analyzed gastrointestinal tumor-associated markers, only four (MUC6, CK17, CD10, and Villin) were found to be significantly associated with OS of GBC patients. Mucins are high-molecular-weight glycoproteins that play an important role in protecting the gastrointestinal tract epithelium. However, during disease progression, the expression profile of mucins in cancer cells is altered, and some mucins show a correlation with good or bad prognosis, depending on malignancies [29,30]. Indeed, mucins can protect tumor cells from host immune responses [29], whereas others can also inhibit tumors from spreading and confine tumor cells to the primary site [30]. Cancer antigen-125 (CA125), also known as MUC16, is a large membrane glycoprotein belonging to the mucin family. Following its discovery in the blood of some patients with specific types of cancers, CA125 was used as a tumor marker of ovarian cancer [31]. In addition, the serum levels of CA125 were proposed as an independent risk factor with a diagnosis value for GBC [32]. Higher levels of serum CA125 were associated with a worse prognosis in GBC patients [33]. Although we found that the frequency of CA125 expression was significantly increased in GBC patients with advanced-stage (34.8%) compared to early stage tumors (0%), we did not find a statistical association between CA125 expression and the survival time of patients (data not shown). These data suggest that CA125 serum levels are more sensitive as a predictive prognosis biomarker for GBC than CA125 expression in tumor tissue.
MUC6 is a pyloric-gland-type-secreted mucin that was reported to be involved in tumor progression and metastasis [29,30,34]. MUC6 can retard the invasiveness of breast cancer cells by forming a barrier to prevent tumor cells from spreading [30]. There are several reports showing that MUC6 expression decreases in advanced stages of cancer, particularly in cholangiocarcinoma (CCA), a type of biliary-tree cancer, and its expression was positively correlated with increased patient survival time [35,36,37]. In these studies, it was suggested that the downregulation of MUC6 might be necessary for CCA spreading. To the extent of our knowledge, our report is the first showing a positive correlation between MUC6 expression in tumor tissue and a better prognosis for GBC patients. As in the reports for CCA, our data also indicate MUC6 expression loss in advanced stages of GBC (38.7% of advanced tumors were positive compared to 64.7% for early stage tumors). MUC6 expression was also only correlated with better prognosis in women patients with well- to moderately differentiated tumors, and this correlation is lost in men or women with poorly differentiated tumors. This agrees with the invasiveness-preventing role suggested for MUC6 [30], but once the tumor progresses, its protective role could be overcome by the dedifferentiation of the tumor cells. There are no data in the literature showing a gender-specific tumor protective role for tumor-tissue MUC6 expression, but our data suggest that this point needs to be addressed.
Cytokeratin 17 (CK17) is a basal/myoepithelial cell keratin that is normally expressed in the respiratory epithelium, urothelium, and various glands. In tumors, CK17 is mainly expressed in squamous, basal, and urothelial carcinomas, and in adenocarcinomas, with squamous differentiation [38]. CK17 expression was associated with cancer invasiveness and poor prognosis in stomach, breast, and ovary cancers, and as our results showed, also in GBC [39,40,41]. In addition, our data showed that CK17 was associated with poor prognosis only in patients with poorly differentiated tumors (and exclusive in the female group), but not in patients with more differentiated adenocarcinomas. Men with well- to moderately differentiated tumors also showed an inverse correlation between CK17 tumor expression and OS time, although the low number of included patients limits the statistical significance of this observation. These gender- and tumor-differentiation-status-specific associations between CK17 and OS have not been previously reported in GBC or other cancer patients.
CD10 is a cell-surface enzyme with neutral metalloendopeptidase activity, and it has been used as a marker for intestinal epithelial brush border. It is also expressed in normal bile ducts and gallbladder epithelia but is absent in CCA. Although its expression has not yet been associated with GBC prognosis, the high expression of CD10 was demonstrated to be associated with aggressive tumor behavior and poor prognosis in several types of cancer patients, including prostate [42], melanoma [43], and esophageal squamous cell carcinoma [44]. Interestingly, we observed that GBC patients with tumors co-expressing CD10 and CK17 had a worse prognosis than patients with the opposite profile, suggesting that CD10 and CK17 could be promising co-targets for GBC treatment.
Taken together, our results also allow us to suggest a panel of markers for the detection of an immunohistochemical profile (CK7+CK20CK19+CKHMW+CKLMW+MUC1+MUC2Vimentin), present in 70.6% of analyzed samples, which could be useful for GBC diagnosis and may particularly help in the identification of the tissue origin of adenocarcinomas of the unknown primary site [45]. However, additional research is needed in order to determine the sensitivity and specificity of this panel for GBC diagnosis. A limitation of our study is the lack of an independent-validation patient cohort, which is a challenging task to be approached in the future, given the rare nature of GBC. Cancer protein biomarkers are increasingly used in clinical practice for diagnosis and prognosis, the identification of responsive patients, and the prediction of treatment outcome [46]. Modern medicine in cancer treatment requires the identification of biological markers that guide in the decision making of such therapy to the chosen patients for more effective results. The rapid breakthrough and development of microarray and sequencing technologies constitute the main tools for paving the way toward individualized biomarker-driven cancer therapy [46].

Supplementary Materials

The following are available online at https://www.mdpi.com/2075-4418/11/2/153/s1. Figure S1: Examples of immunohistochemistry staining for tumor-associated markers expressed with high or low frequency in GBC patients, Figure S2: Examples of immunohistochemistry staining for tumor-associated markers do not associate with prognosis in our GBC patient cohort, Figure S3: MUC6 tumor expression did not correlate with overall survival of patients with poorly differentiated tumors, Figure S4: CK17 tumor expression correlates with a worse prognosis in male GBC patients with well- to moderately differentiated tumors, Table S1: Antibodies used for immunohistochemical tumor-associated marker evaluation on primary gallbladder-cancer biopsies, Table S2: Intensity and immunohistochemical staining pattern distribution of evaluated markers in primary gallbladder adenocarcinoma.

Author Contributions

Conceptualization, C.C., A.T., and F.S.-O.; methodology, C.C., A.T., N.P., M.D.P., O.B., M.H., and C.M.; investigation, C.C., A.T., D.R.-S., P.F., C.Q., and F.S.-O.; resources, C.C. and F.S.-O.; writing—original draft preparation, A.T. and F.S.-O.; writing—review and editing, C.C., A.T., P.F., C.Q., and F.S.-O.; visualization, C.C. and A.T. All authors have read and agreed to the published version of the manuscript.

Funding

This research was funded by grants from the National Fund for Scientific and Technological Development (FONDECYT) 1171213 (F.S.-O.), 1160777 (C.Q.), and 11160380 (A.T.); the Millennium Science Initiative from the Ministry for the Economy, Development, and Tourism (P09/016-F) (F.S.-O.; C.Q.); and Fund Innovation for Competitiveness, Región de Los Ríos (FIC19-70) (C.C., A.T., C.Q., F.S.-O.).

Institutional Review Board Statement

The study was conducted according to the guidelines of the Declaration of Helsinki, and approved by the Bioethical Committee for Human Research of the Valdivia Regional Hospital (protocol code 403, date of approval December 2015).

Informed Consent Statement

Informed consent was obtained from all subjects involved in the study.

Data Availability Statement

The data presented in this study are available on reasonable request from the corresponding authors.

Conflicts of Interest

The authors declare no conflict of interest. The funders had no role in the design of the study; in the collection, analyses, or interpretation of data; in the writing of the manuscript, or in the decision to publish the results.

References

  1. Hundal, R.; Shaffer, E.A. Gallbladder cancer: Epidemiology and outcome. Clin. Epidemiol. 2014, 6, 99–109. [Google Scholar]
  2. Bray, F.; Ferlay, J.; Soerjomataram, I.; Siegel, R.L.; Torre, L.A.; Jemal, A. Global cancer statistics 2018: Globocan estimates of incidence and mortality worldwide for 36 cancers in 185 countries. CA Cancer J. Clin. 2018, 68, 394–424. [Google Scholar] [CrossRef] [Green Version]
  3. Roa, I.; Ibacache, G.; Muñoz, S.; de Aretxabala, X. Gallbladder cancer in Chile: Pathologic characteristics of survival and prognostic factors: Analysis of 1366 cases. Am. J. Clin. Pathol. 2014, 141, 675–682. [Google Scholar] [CrossRef] [Green Version]
  4. Randi, G.; Franceschi, S.; La Vecchia, C. Gallbladder cancer worldwide: Geographical distribution and risk factors. Int. J. Cancer 2006, 118, 1591–1602. [Google Scholar] [CrossRef]
  5. Goldin, R.D.; Roa, J.C. Gallbladder cancer: A morphological and molecular update. Histopathology 2009, 55, 218–229. [Google Scholar] [CrossRef]
  6. Roa, I.; de Aretxabala, X. Gallbladder cancer in Chile: What have we learned? Curr. Opin. Gastroenterol. 2015, 31, 269–275. [Google Scholar] [CrossRef]
  7. Schmidt, M.A.; Marcano-Bonilla, L.; Roberts, L.R. Gallbladder cancer: Epidemiology and genetic risk associations. Chin. Clin. Oncol. 2019, 8, 31. [Google Scholar] [CrossRef]
  8. Stinton, L.M.; Shaffer, E.A. Epidemiology of gallbladder disease: Cholelithiasis and cancer. Gut Liver 2012, 6, 72–187. [Google Scholar] [CrossRef] [Green Version]
  9. Lorenzo Bermejo, J.; Boekstegers, F.; González Silos, R.; Marcelain, K.; Baez Benavides, P.; Barahona Ponce, C.; Müller, B.; Ferreccio, C.; Koshiol, J.; Fischer, C.; et al. Subtypes of Native American ancestry and leading causes of death: Mapuche ancestry-specific associations with gallbladder cancer risk in Chile. PLoS Genet. 2017, 13, e1006756. [Google Scholar] [CrossRef]
  10. Singh, S.K.; Talwar, R.; Kannan, N.; Tyagi, A.K.; Jaiswal, P.; Kumar, A. Chemotherapy compared with best supportive care for metastatic/unresectable gallbladder cancer: A non-randomized prospective cohort study. Indian J. Surg. Oncol. 2016, 7, 25–31. [Google Scholar] [CrossRef] [Green Version]
  11. Pollom, E.L.; Alagappan, M.; Park, L.S.; Whittemore, A.S.; Koong, A.C.; Chang, D.T. Does radiotherapy still have a role in unresected biliary tract cancer? Cancer Med. 2016, 6, 129–141. [Google Scholar] [CrossRef]
  12. Wang, Y.F.; Feng, F.L.; Zhao, X.H.; Ye, Z.X.; Zeng, H.P.; Li, Z.; Jiang, X.Q.; Peng, Z.H. Combined detection tumor markers for diagnosis and prognosis of gallbladder cancer. World J. Gastroenterol. 2014, 20, 4085–4092. [Google Scholar] [CrossRef]
  13. Duval, J.V.; Savas, L.; Banner, B.F. Expression of cytokeratins 7 and 20 in carcinomas of the extrahepatic biliary tract, pancreas, and gallbladder. Arch. Pathol. Lab. Med. 2000, 124, 1196–1200. [Google Scholar]
  14. Yoo, K.S.; Choi, H.S.; Jun, D.W.; Lee, H.L.; Lee, O.Y.; Yoon, B.C.; Lee, K.G.; Paik, S.S.; Kim, Y.S.; Lee, J. MUC Expression in Gallbladder Epithelial Tissues in Cholesterol-Associated Gallbladder Disease. Gut Liver 2016, 10, 851–858. [Google Scholar] [CrossRef] [Green Version]
  15. Hiraki, T.; Yamada, S.; Higashi, M.; Hatanaka, K.; Yokoyama, S.; Kitazono, I.; Goto, Y.; Kirishima, M.; Batra, S.; Yonezawa, S.; et al. Immunohistochemical expression of mucin antigens in gallbladder adenocarcinoma: MUC1-positive and MUC2-negative expression is associated with vessel invasion and shortened survival. Histol. Histopathol. 2017, 32, 585–596. [Google Scholar]
  16. Varona, A.; Blanco, L.; Perez, I.; Gil, J.; Irazusta, J.; López, J.I.; Candenas, M.L.; Pinto, F.M.; Larrinaga, G. Expression and activity profiles of DPP IV/CD26 and NEP/CD10 glycoproteins in the human renal cancer are tumor type dependent. BMC Cancer 2010, 10, 193–204. [Google Scholar] [CrossRef] [Green Version]
  17. Zhao, J.; Patwa, T.H.; Lubman, D.M.; Simeone, D.M. Protein biomarkers in cancer: Natural glycoprotein microarray approaches. Curr. Opin. Mol. Ther. 2008, 10, 602–610. [Google Scholar]
  18. Moll, R.; Robine, S.; Dudouet, B.; Louvard, D. Villin: A cytoskeletal protein and a differentiation marker expressed in some human adenocarcinomas. Virchows Arch. B Cell Pathol. Incl. Mol. Pathol. 1987, 54, 155–169. [Google Scholar] [CrossRef]
  19. Zhang, Y.; Xu, J.; Xu, Z.; Wang, Y.; Wu, S.; Wu, L.; Song, H.; Zhou, L. Expression of vimentin and Oct-4 in gallbladder adenocarcinoma and their relationship with vasculogenic mimicry and their clinical significance. Int. J. Clin. Exp. Pathol. 2018, 11, 3618–3627. [Google Scholar]
  20. Li, Q.L.; Yang, Z.L.; Liu, J.Q.; Miao, X.Y. Expression of CDX2 and hepatocyte antigen in benign and malignant lesions of gallbladder and its correlation with histopathologic type and clinical outcome. Pathol. Oncol. Res. 2011, 17, 561–568. [Google Scholar] [CrossRef] [Green Version]
  21. Amin, M.B.; Edge, S.; Greene, F.; Byrd, D.R.; Brookland, R.K.; Washington, M.K.; Gershenwald, J.E.; Compton, C.C.; Hess, K.R.; Sullivan, D.C.; et al. (Eds.) AJCC Cancer Staging Manual, 8th ed.; Springer International Publishing: New York, NY, USA; American Joint Commission on Cancer: Chicago, IL, USA, 2017. [Google Scholar]
  22. Fan, J.; Upadhye, S.; Worster, A. Understanding receiver operating characteristic (ROC) curves. CJEM 2006, 8, 19–20. [Google Scholar] [CrossRef] [PubMed]
  23. Everson, G.T.; McKinley, C.; Kern, F., Jr. Mechanisms of gallstone formation in women. Effects of exogenous estrogen (Premarin) and dietary cholesterol on hepatic lipid metabolism. J. Clin. Investig. 1991, 87, 237–246. [Google Scholar] [CrossRef] [PubMed]
  24. Bridgewater, J.; Lopes, A.; Wasan, H.; Malka, D.; Jensen, L.; Okusaka, T.; Knox, J.; Wagner, D.; Cunningham, D.; Shannon, J.; et al. Prognostic factors for progression-free and overall survival in advanced biliary tract cancer. Ann. Oncol. 2016, 27, 134–140. [Google Scholar] [CrossRef] [PubMed]
  25. Rahman, R.; Simoes, E.J.; Schmaltz, C.; Jackson, C.S.; Ibdah, J.A. Trend analysis and survival of primary gallbladder cancer in the United States: A 1973–2009 population-based study. Cancer Med. 2017, 6, 874–880. [Google Scholar] [CrossRef] [PubMed]
  26. Kim, B.J.; Hyung, J.; Yoo, C.; Kim, K.P.; Park, S.J.; Lee, S.S.; Park, D.H.; Song, T.J.; Seo, D.W.; Lee, S.K.; et al. Prognostic factors in patients with advanced biliary tract cancer treated with first-line gemcitabine plus cisplatin: Retrospective analysis of 740 patients. Cancer Chemother. Pharmacol. 2017, 80, 209–215. [Google Scholar] [CrossRef]
  27. Chen, M.; Cao, J.; Zhang, B.; Pan, L.; Cai, X. A Nomogram for Prediction of Overall Survival in Patients with Node-negative Gallbladder Cancer. J. Cancer 2019, 10, 3246–3252. [Google Scholar] [CrossRef] [Green Version]
  28. Gnerlich, J.L.; Deshpande, A.D.; Jeffe, D.B.; Seelam, S.; Kimbuende, E.; Margenthaler, J.A. Poorer survival outcomes for male breast cancer compared with female breast cancer may be attributable to in-stage migration. Ann. Surg. Oncol. 2011, 18, 1837–1844. [Google Scholar] [CrossRef] [Green Version]
  29. Baldus, S.E.; Engelmann, K.; Hanisch, F.G. MUC1 and the MUCs: A family of human mucins with impact in cancer biology. Crit. Rev. Clin. Lab. Sci. 2004, 41, 189–231. [Google Scholar] [CrossRef]
  30. Matsukita, S.; Nomoto, M.; Kitajima, S.; Tanaka, S.; Goto, M.; Irimura, T.; Kim, Y.S.; Sato, E.; Yonezawa, S. Expression of mucins (MUC1, MUC2, MUC5AC and MUC6) in mucinous carcinoma of the breast: Comparison with invasive ductal carcinoma. Histopathology 2003, 42, 26–36. [Google Scholar] [CrossRef]
  31. Norum, L.F.; Erikstein, B.; Nustad, K. Elevated CA125 in breast cancer—A sign of advanced disease. Tumour. Biol. 2001, 22, 223–228. [Google Scholar] [CrossRef]
  32. Zhang, L.; Miao, R.; Zhang, X.; Chen, W.; Zhou, Y.; Wang, R.; Zhang, R.; Pang, Q.; Xu, X.; Liu, C. Exploring the diagnosis markers for gallbladder cancer based on clinical data. Front. Med. 2015, 9, 350–355. [Google Scholar] [CrossRef] [PubMed]
  33. Wu, X.S.; Shi, L.B.; Li, M.L.; Ding, Q.; Weng, H.; Wu, W.G.; Cao, Y.; Bao, R.F.; Shu, Y.J.; Ding, Q.C.; et al. Evaluation of two inflammation-based prognostic scores in patients with resectable gallbladder carcinoma. Ann. Surg. Oncol. 2014, 21, 449–457. [Google Scholar] [CrossRef] [PubMed]
  34. Nishiumi, N.; Abe, Y.; Inoue, Y.; Hatanaka, H.; Inada, K.I.; Kijima, H.; Yamazaki, H.; Tatematsu, M.; Ueyama, Y.; Iwasaki, M.; et al. Use of 11p15 mucins as prognostic factors in small adenocarcinoma of the lung. Clin. Cancer Res. 2003, 9, 5616–5619. [Google Scholar] [PubMed]
  35. Thuwajit, P.; Chawengrattanachot, W.; Thuwajit, C.; Sripa, B.; Paupairoj, A.; Chau-In, S. Enhanced expression of mucin 6 glycoprotein in cholangiocarcinoma tissue from patients in Thailand as a prognostic marker for survival. J. Gastroenterol. Hepatol. 2008, 23, 771–778. [Google Scholar] [CrossRef] [PubMed]
  36. Aishima, S.; Kuroda, Y.; Nishihara, Y.; Taguchi, K.; Taketomi, A.; Maehara, Y.; Tsuneyoshi, M. Gastric mucin phenotype defines tumour progression and prognosis of intrahepatic cholangiocarcinoma: Gastric foveolar type is associated with aggressive tumour behaviour. Histopathology 2006, 49, 35–44. [Google Scholar] [CrossRef] [PubMed]
  37. Park, S.Y.; Roh, S.J.; Kim, Y.N.; Kim, S.Z.; Park, H.S.; Jang, K.Y.; Chung, M.J.; Kang, M.J.; Lee, D.G.; Moon, W.S.; et al. Expression of MUC1, MUC2, MUC5AC and MUC6 in cholangiocarcinoma: Prognostic impact. Oncol. Rep. 2009, 22, 649–657. [Google Scholar]
  38. Goldstein, N.S.; Bassi, D. Cytokeratins 7, 17, and 20 reactivity in pancreatic and ampulla of vater adenocarcinomas. Percentage of positivity and distribution is affected by the cut-point threshold. Am. J. Clin. Pathol. 2001, 115, 695–702. [Google Scholar] [CrossRef] [Green Version]
  39. Ide, M.; Kato, T.; Ogata, K.; Mochiki, E.; Kuwano, H.; Oyama, T. Keratin 17 expression correlates with tumor progression and poor prognosis in gastric adenocarcinoma. Ann. Surg. Oncol. 2012, 19, 3506–3514. [Google Scholar] [CrossRef]
  40. Wang, Y.F.; Lang, H.Y.; Yuan, J.; Wang, J.; Wang, R.; Zhang, X.H.; Zhang, J.; Zhao, T.; Li, Y.R.; Liu, J.Y.; et al. Overexpression of keratin 17 is associated with poor prognosis in epithelial ovarian cancer. Tumour. Biol. 2013, 34, 1685–1689. [Google Scholar] [CrossRef]
  41. Kim, K.; Lee, H.W.; Chae, S.W.; Kim, D.H.; Do, I.G.; Lee, H.J.; Do, S.I.; Min, K.W.; Pyo, J.S.; Shin, J.H.; et al. Cytokeratin 17 Expression is Associated with Poor Prognosis in Gallbladder Adenocarcinoma. Appl. Immunohistochem. Mol. Morphol. 2017, 25, 346–350. [Google Scholar] [CrossRef]
  42. Fleischmann, A.; Schlomm, T.; Huland, H.; Köllermann, J.; Simon, P.; Mirlacher, M.; Salomon, G.; Chun, F.H.K.; Steuber, T.; Simon, R.; et al. Distinct subcellular expression patterns of neutral endopeptidase (CD10) in prostate cancer predict diverging clinical courses in surgically treated patients. Clin. Cancer Res. 2008, 14, 7838–7842. [Google Scholar] [CrossRef] [PubMed] [Green Version]
  43. Oba, J.; Nakahara, T.; Hayashida, S.; Kido, M.; Xie, L.; Takahara, M.; Uchi, H.; Miyazaki, S.; Abe, T.; Hagihara, A.; et al. Expression of CD10 predicts tumor progression and unfavorable prognosis in malignant melanoma. J. Am. Acad. Dermatol. 2011, 65, 1152–1160. [Google Scholar] [CrossRef] [PubMed]
  44. Lee, K.W.; Sung, C.O.; Kim, J.H.; Kang, M.; Yoo, H.Y.; Kim, H.H.; Um, S.H.; Kim, S.H. CD10 expression is enhanced by Twist1 and associated with poor prognosis in esophageal squamous cell carcinoma with facilitating tumorigenicity in vitro and in vivo. Int. J. Cancer 2015, 136, 310–321. [Google Scholar] [CrossRef] [PubMed]
  45. Hainsworth, J.D.; Greco, F.A. Adenocarcinoma of Unknown Primary Site. In Holland-Frei Cancer Medicine, 6th ed.; Kufe, D.W., Pollock, R.E., Weichselbaumm, R.R., Bast, R.C., Gansler, T.S., Holland, J.F., Frei, E., Eds.; BC Decker: Hamilton, ON, Canada, 2003. [Google Scholar]
  46. Kamel, H.F.M.; Al-Amodi, H.S.A.B. Exploitation of Gene Expression and Cancer Biomarkers in Paving the Path to Era of Personalized Medicine. Genom. Proteom. Bioinform. 2017, 15, 220–235. [Google Scholar] [CrossRef] [PubMed]
Figure 1. Tumor differentiation status, gender, and age of disease onset correlate with overall survival of gallbladder-cancer (GBC) patients. Kaplan–Meier postdiagnosis overall survival (OS) estimation of GBC patients according to (A,B) tumor differentiation status, (C,D) gender, (E,G) age of disease onset, or (F,H) age of disease onset and gender together. Each graph shows the number of patients included in each group (n), median OS time in months, and five-year survival rate (%). Only p values < 0.05 shown.
Diagnostics 11 00153 g001
Figure 2. MUC6, CK17, and CD10 tumor expression correlate with the overall survival of GBC patients. Kaplan–Meier postdiagnosis overall-survival (OS) estimation of GBC patients according to tumor expression pattern for MUC6 ((A) upper, patients with well- to moderately differentiated tumors; (A) middle, female patients with well- to moderately differentiated tumors; and (A) bottom, male patients with well- to moderately differentiated tumors); CK17 ((B) upper, patients with poorly differentiated tumors; (B) middle, female patients with poorly differentiated tumors; and (B) bottom, male patients with poorly differentiated tumors); and CD10 ((C) upper, patients with well- to moderately differentiated tumors and (C) bottom, patients with poorly differentiated tumors). Each graph shows the number of patients included in each group (n) and median OS time in months. Only p values < 0.05 shown. (D) Immunohistochemical representative photographs using a tissue microarray (magnification, X20), for (upper) MUC6, (middle) CK17, and (bottom) CD10.
Diagnostics 11 00153 g002
Figure 3. Tumor expression patterns MUC6+CK17 and CK17+CD10 associated with better and worse prognoses of GBC patients, respectively. Kaplan–Meier postdiagnosis overall-survival (OS) estimation of GBC patients according to tumor expression pattern for (A) MUC6/CK17 in well- to moderately differentiated tumors, (B) CK17/Villin, (C) CD10/Villin, and (D) CK17/CD10 in poorly differentiated tumors. Each graph shows the number of patients included in each group (n) and median OS time in months. (E) Receiver-operating-characteristic (ROC) curves for patient survival according to tumor-marker pattern expressions. AUC: area under the curve. CI: confidence interval. (F) Association of tumor-marker expression and poor prognosis of GBC according to patient tumor differentiation status and gender. Font size indicative of statistical significance.
Diagnostics 11 00153 g003
Table 1. Clinicopathological characteristics of gallbladder cancer (GBC) patients.
CHARACTERISTICS
GenderFemale77.8% (n = 140)
Male22.2% (n = 40)
Median age (SD) All67.5 (±12.3)
Female66.5 (±12.6)
Male70 (±11.5)
Tumor
differentiation
Poor32.8% (59 cases)
79.7% female; 20.3% male
Median age: 67 (±13.1)
Tumor staging:
Early (TIS–T1): 0%
Advanced (T2–T4): 100%
Moderate58.3% (105 cases)
75.2% female; 24.8% male
Median age: 69 (±11.5)
Tumor staging:
Early (TIS–T1): 13%
Advanced (T2–T4): 87%
Well8.9% (16 cases)
87.5% female; 12.5% male
Median age: 60 (±14.8)
Tumor staging:
Early (TIS–T1): 45%
Advanced (T2–T4): 55%
SD: standard deviation; TIS: tumor in situ.
Table 2. Association between tumor marker expression and tumor differentiation status or tumor staging in GBC patients.
MarkerTotal Positive Tumor Differentiation, # Cases + (%)Tumor Staging, # Cases + (%)
Good/ModeratePoorStatistics aEarly bAdvanced cStatistics a
CK7164 (97.6%)112 (99.1%)52 (94.5%)NS16 (100%)131 (98.5%)NS
CK2026 (15.4%)21 (18.3%)5 (9.3%)NS5 (29.4%)20 (15.1%)NS
CK17118 (72.8%)81 (74.3%)37 (69.8%)NS8 (53.3%)97 (75.8%)NS
CK19166 (98.2%)112 (97.4%)54 (100%)NS16 (94.1%)132 (98.5%)NS
CKLMW169 (100%)114 (100%)54 (100%)NS16 (100%)132 (100%)NS
CKHMW153 (91.6%)104 (92%)49 (90.7%)NS13 (92.9%)123 (92.5%)NS
VIMENTIN7 (3.9%)1 (0.8%)6 (10.7%)p = 0.001407 (5%)NS
MUC1165 (97.1%)113 (97.4%)52 (96.3%)NS15 (100%)130 (97%)NS
MUC25 (3.1%)2 (1.9%)3 (5.8%)NS04 (3.2%)NS
MUC5AC135 (81.8%)93 (83%)42 (79.2%)NS15 (88.2%)107 (82.3%)NS
MUC668 (41%)52 (45.6%)16 (30.8%)NS11 (64.7%)50 (38.7%)p = 0.04
CDX2120 (72.7%)86 (76.8%)34 (64.1%)NS12 (85.7%)92 (70.8%)NS
CEA99 (57.9%)64 (55.2%)35 (63.6%)NS8 (47.1%)82 (61.2%)NS
CA12551 (30%)31 (26%)20 (39.2%)NS0 46 (34.8%)p = 0.009
CD1073 (44.2%)50 (45.4%)23 (41.8%)NS10 (62.5%)53 (40.4%)NS
CLAUDIN4132 (81%)90 (80.4%)42 (80.8%)NS12 (85.7%)106 (81.5%)NS
VILLIN81 (46.8%)62 (51.2%)19 (36.5%)NS11 (61.1%)61 (45.9%)NS
NS: not significant; a chi-squared test (Yale correction); b including tumor in situ (TIS) and T1 stages; c including from T2 to T4 stages.
Table 3. Univariate and multivariate Cox survival analysis of GBC patients.
Patients with poorly differentiated tumors (n = 58).
VariableUnivariate AnalysisMultivariate Analysis
HR95% CIp valueHR95% CIp value
MUC11.370.54–3.520.5090.760.05–10.890.843
MUC21.480.98–2.230.0611.780.83–3.830.138
MUC5AC0.810.48–1.360.4210.740.29–1.890.532
MUC60.90.6–1.360.6310.620.3–1.310.212
CK71.660.64–4.30.2920.680.11–4.230.678
CK201.290.77–2.160.3381.270.53–3.030.586
CK1721.26–3.190.0032.461.06–5.740.037
CK191.760.62–4.940.2850.630.01–38.410.824
CKHMW1.70.8–3.590.1662.870.96–8.540.058
CKLMW1.850.56–6.030.310.10.005–1.850.121
CDX20.880.52–1.470.6160.550.24–1.280.17
CD101.71.08–2.690.0233.761.65–8.560.002
CEA1.120.67–1.890.6641.030.45–2.350.95
CA1251.521.02–2.250.0381.990.98–4.070.058
Vimentin1.490.94–2.360.090.740.32–1.750.5
Villin0.790.52–1.220.2890.950.45–2.030.903
Claudin 41.210.63–2.320.5710.960.4–2.340.931
Age0.750.44–1.280.2891.710.82–3.570.152
Gender1.160.6–2.240.6490.970.42–2.260.954
Patients with well- to moderately differentiated tumors (n = 118).
VariableUnivariate AnalysisMultivariate Analysis
HR95% CIp ValueHR95% CIp Value
MUC10.680.38–1.210.1940.910.38–2.140.825
MUC20.80.59–1.090.1540.960.61–1.530.878
MUC5AC0.870.58–1.30.5071.130.66–1.920.665
MUC60.690.5–0.960.0290.460.24–0.860.015
CK70.570.27–1.20.1430.710.46–1.280.138
CK200.80.57–1.110.1820.890.58–1.370.614
CK171.010.72–1.40.9661.210.78–1.870.384
CK191.080.59–1.980.7921.480.66–3.350.342
CKHMW0.740.48–1.140.170.820.43–1.560.543
CKLMW1.080.56–2.080.8231.720.67–4.420.259
CDX20.720.5–1.010.060.60.39–0.930.023
CD100.950.71–1.260.7061.230.82–1.840.309
CEA1.030.74–1.440.8460.960.63–1.460.859
CA1251.180.84–1.650.3351.350.86–2–10.188
Vimentin10.53–1.880.9961.320.56–3.110.524
Villin0.860.62–1.210.3960.850.55–1.320.48
Claudin 40.770.54–1.110.1690.70.42–1.140.152
Age1.861.24–2.810.0032.281.43–3.640.001
Gender1.631.02–2.60.0411.160.67–2.020.598
HR: hazard ratio; CI: confidence interval. HR calculated as positive versus negative expression for tumor markers or late-age versus early age onset for age variable.
Publisher’s Note: MDPI stays neutral with regard to jurisdictional claims in published maps and institutional affiliations.

