Adaptive Boosting Based Personalized Glucose Monitoring System (PGMS) for Non-Invasive Blood Glucose Prediction with Improved Accuracy


Abstract
:1. Introduction
- (1)
- We develop an architecture, working principle, and software for PGMS. It consists of invasive and non-invasive sensors on a single device;
- (2)
- PGMS software forms different clusters consisting of invasive and non-invasive measured paired data. These clusters are developed scientifically based on domain-knowledge as per blood glucose ranges mapped with diabetes patient condition named as “hypoglycemia, normal, pre-diabetic, diabetic, highly diabetic, and critically diabetic”;
- (3)
- We develop the error prediction model for each cluster using the AdaBoost algorithm to predict the non-invasive blood glucose value accurately with goals to achieve the least overall MARD and Root Mean Square Error (RMSE).
2. Related Work
2.1. Parameters to Assess the Accuracy of Non-Invasive Blood Glucose Monitoring System
2.1.1. Mean Absolute Relative Difference (MARD)
- = Non-invasive blood glucose value at kth measurement
- = Reference invasive blood glucose value at kth measurement
- k = Measurement number, which is 1,2….N
- = Total number of measurements
- = Mean absolute relative difference
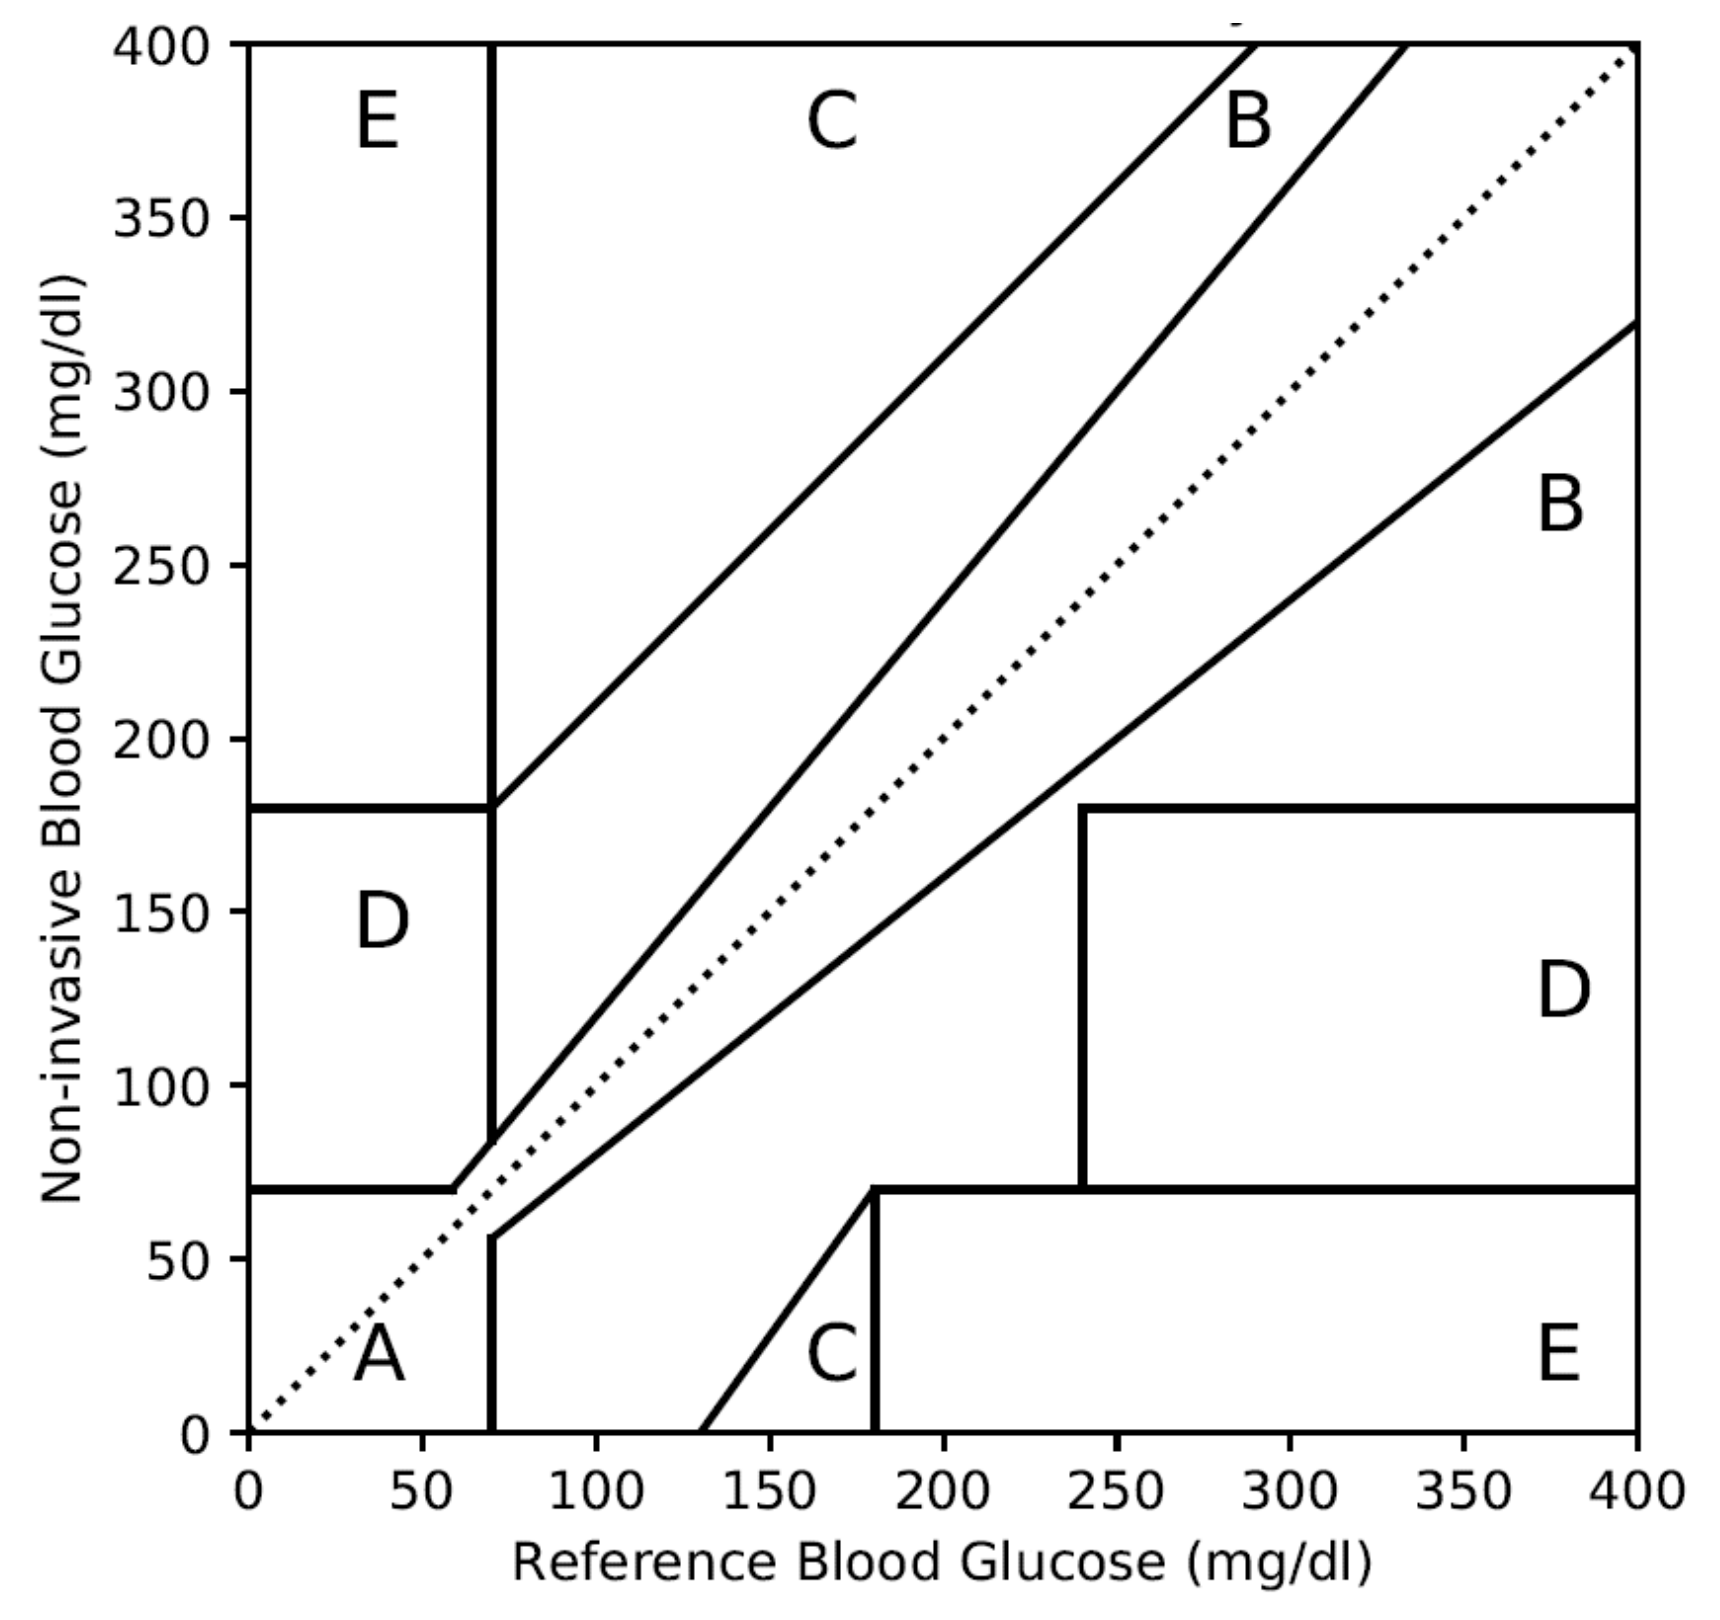
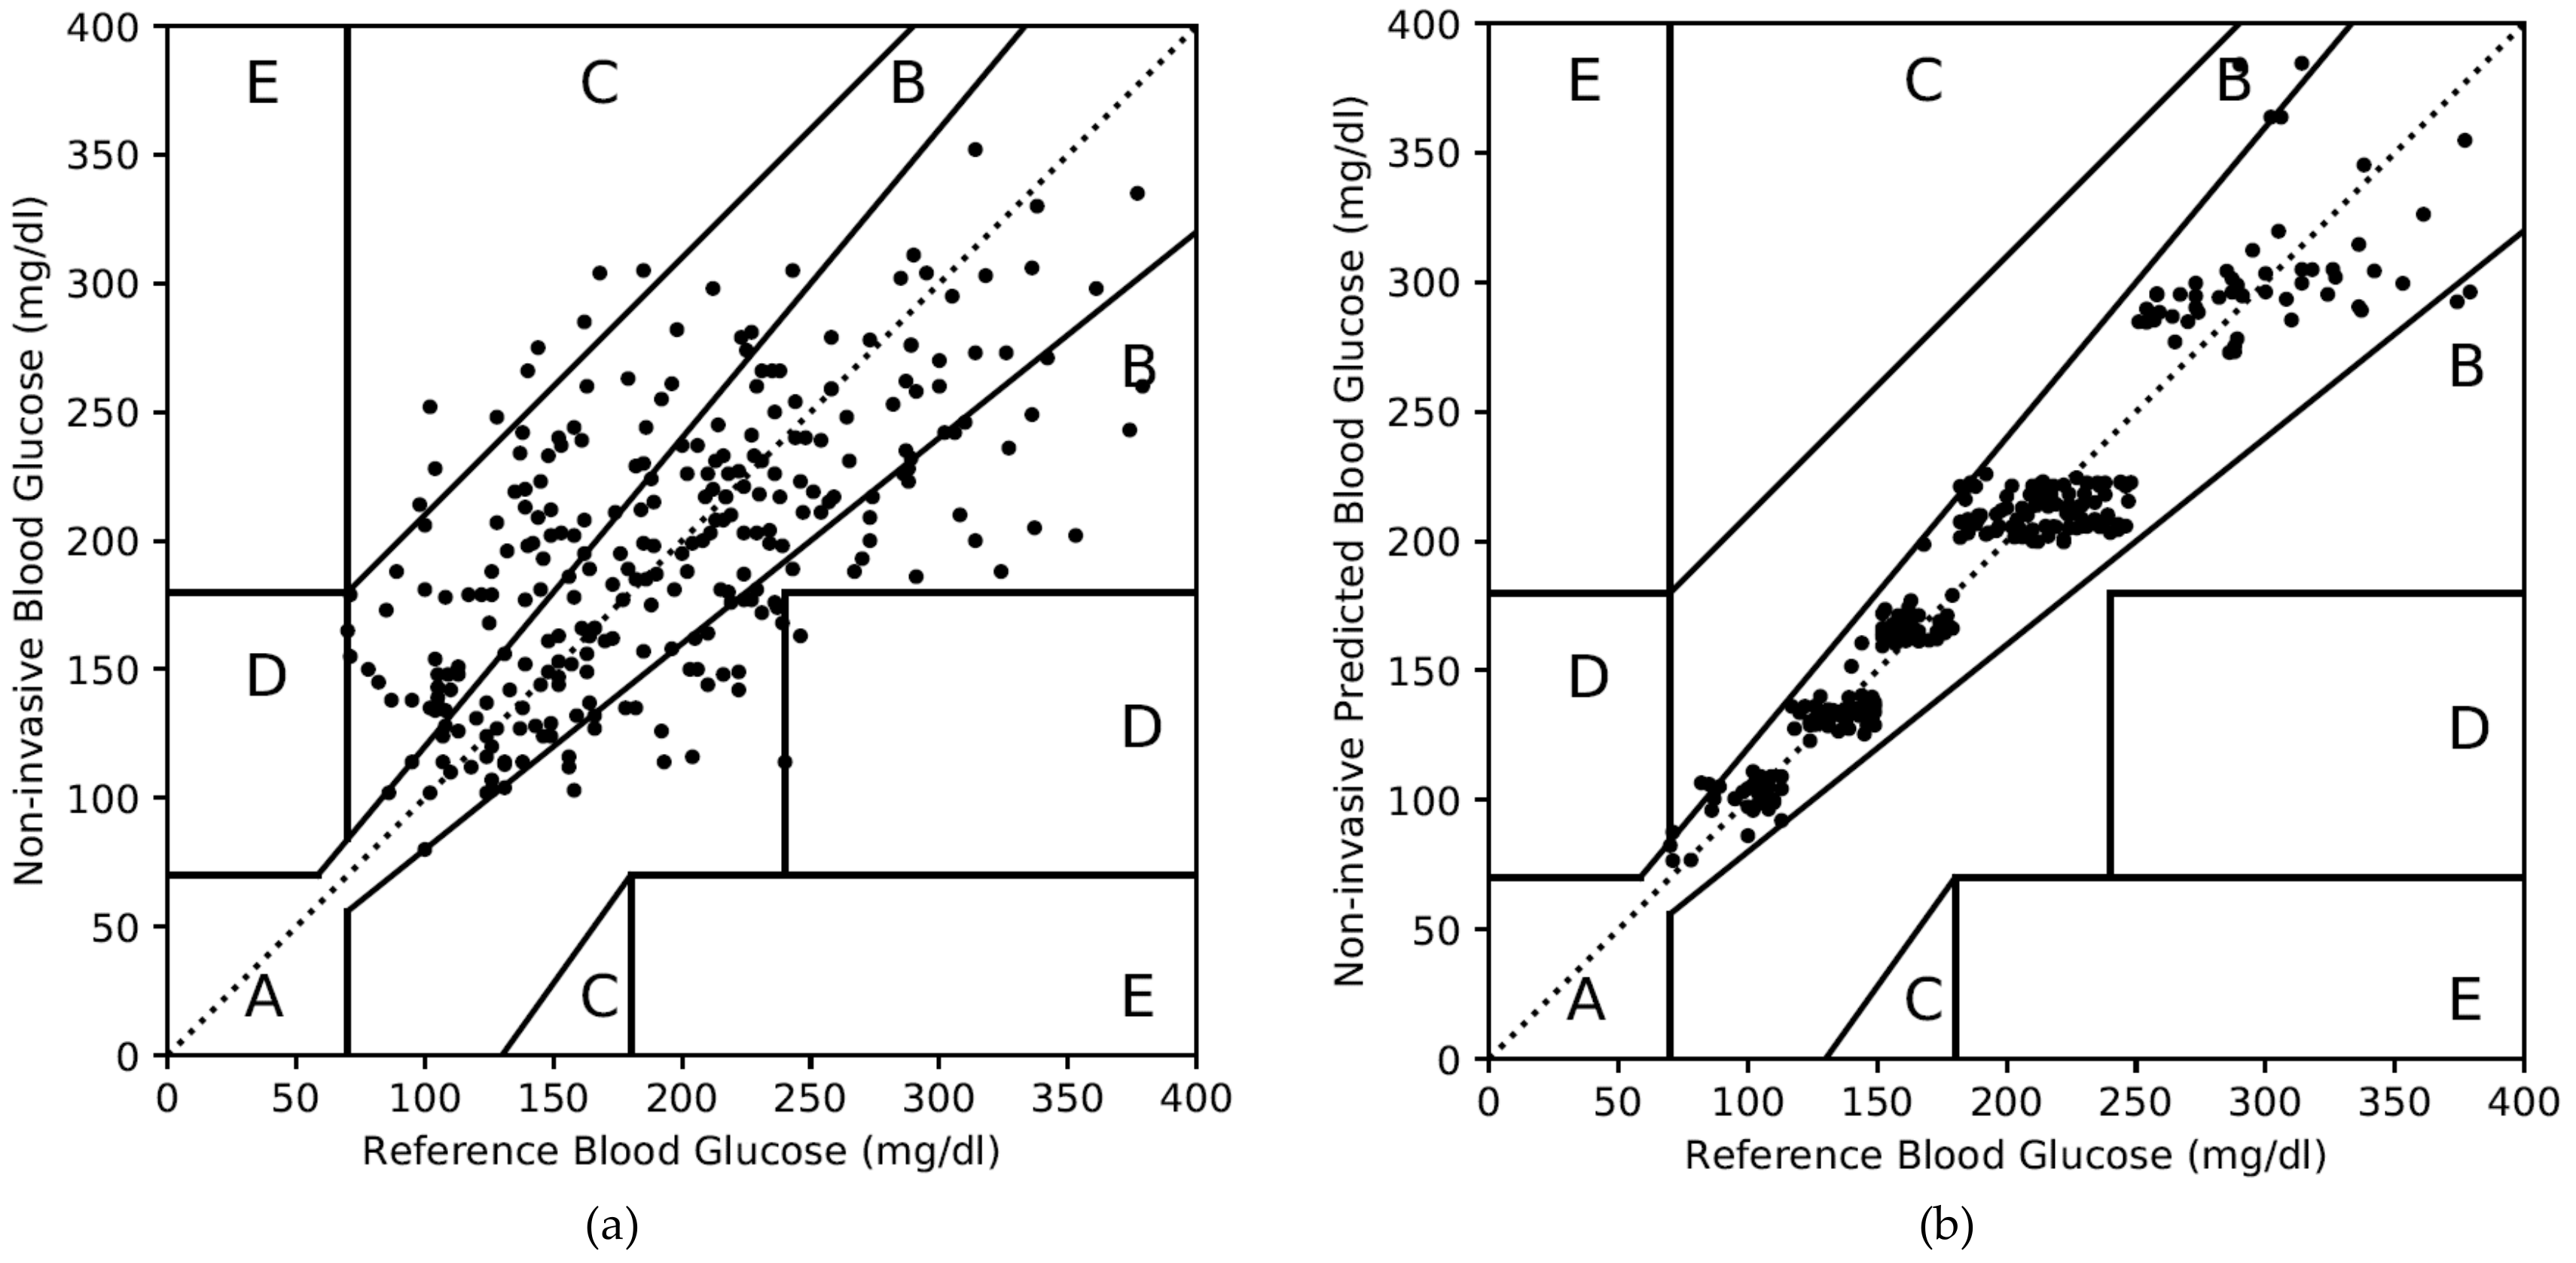
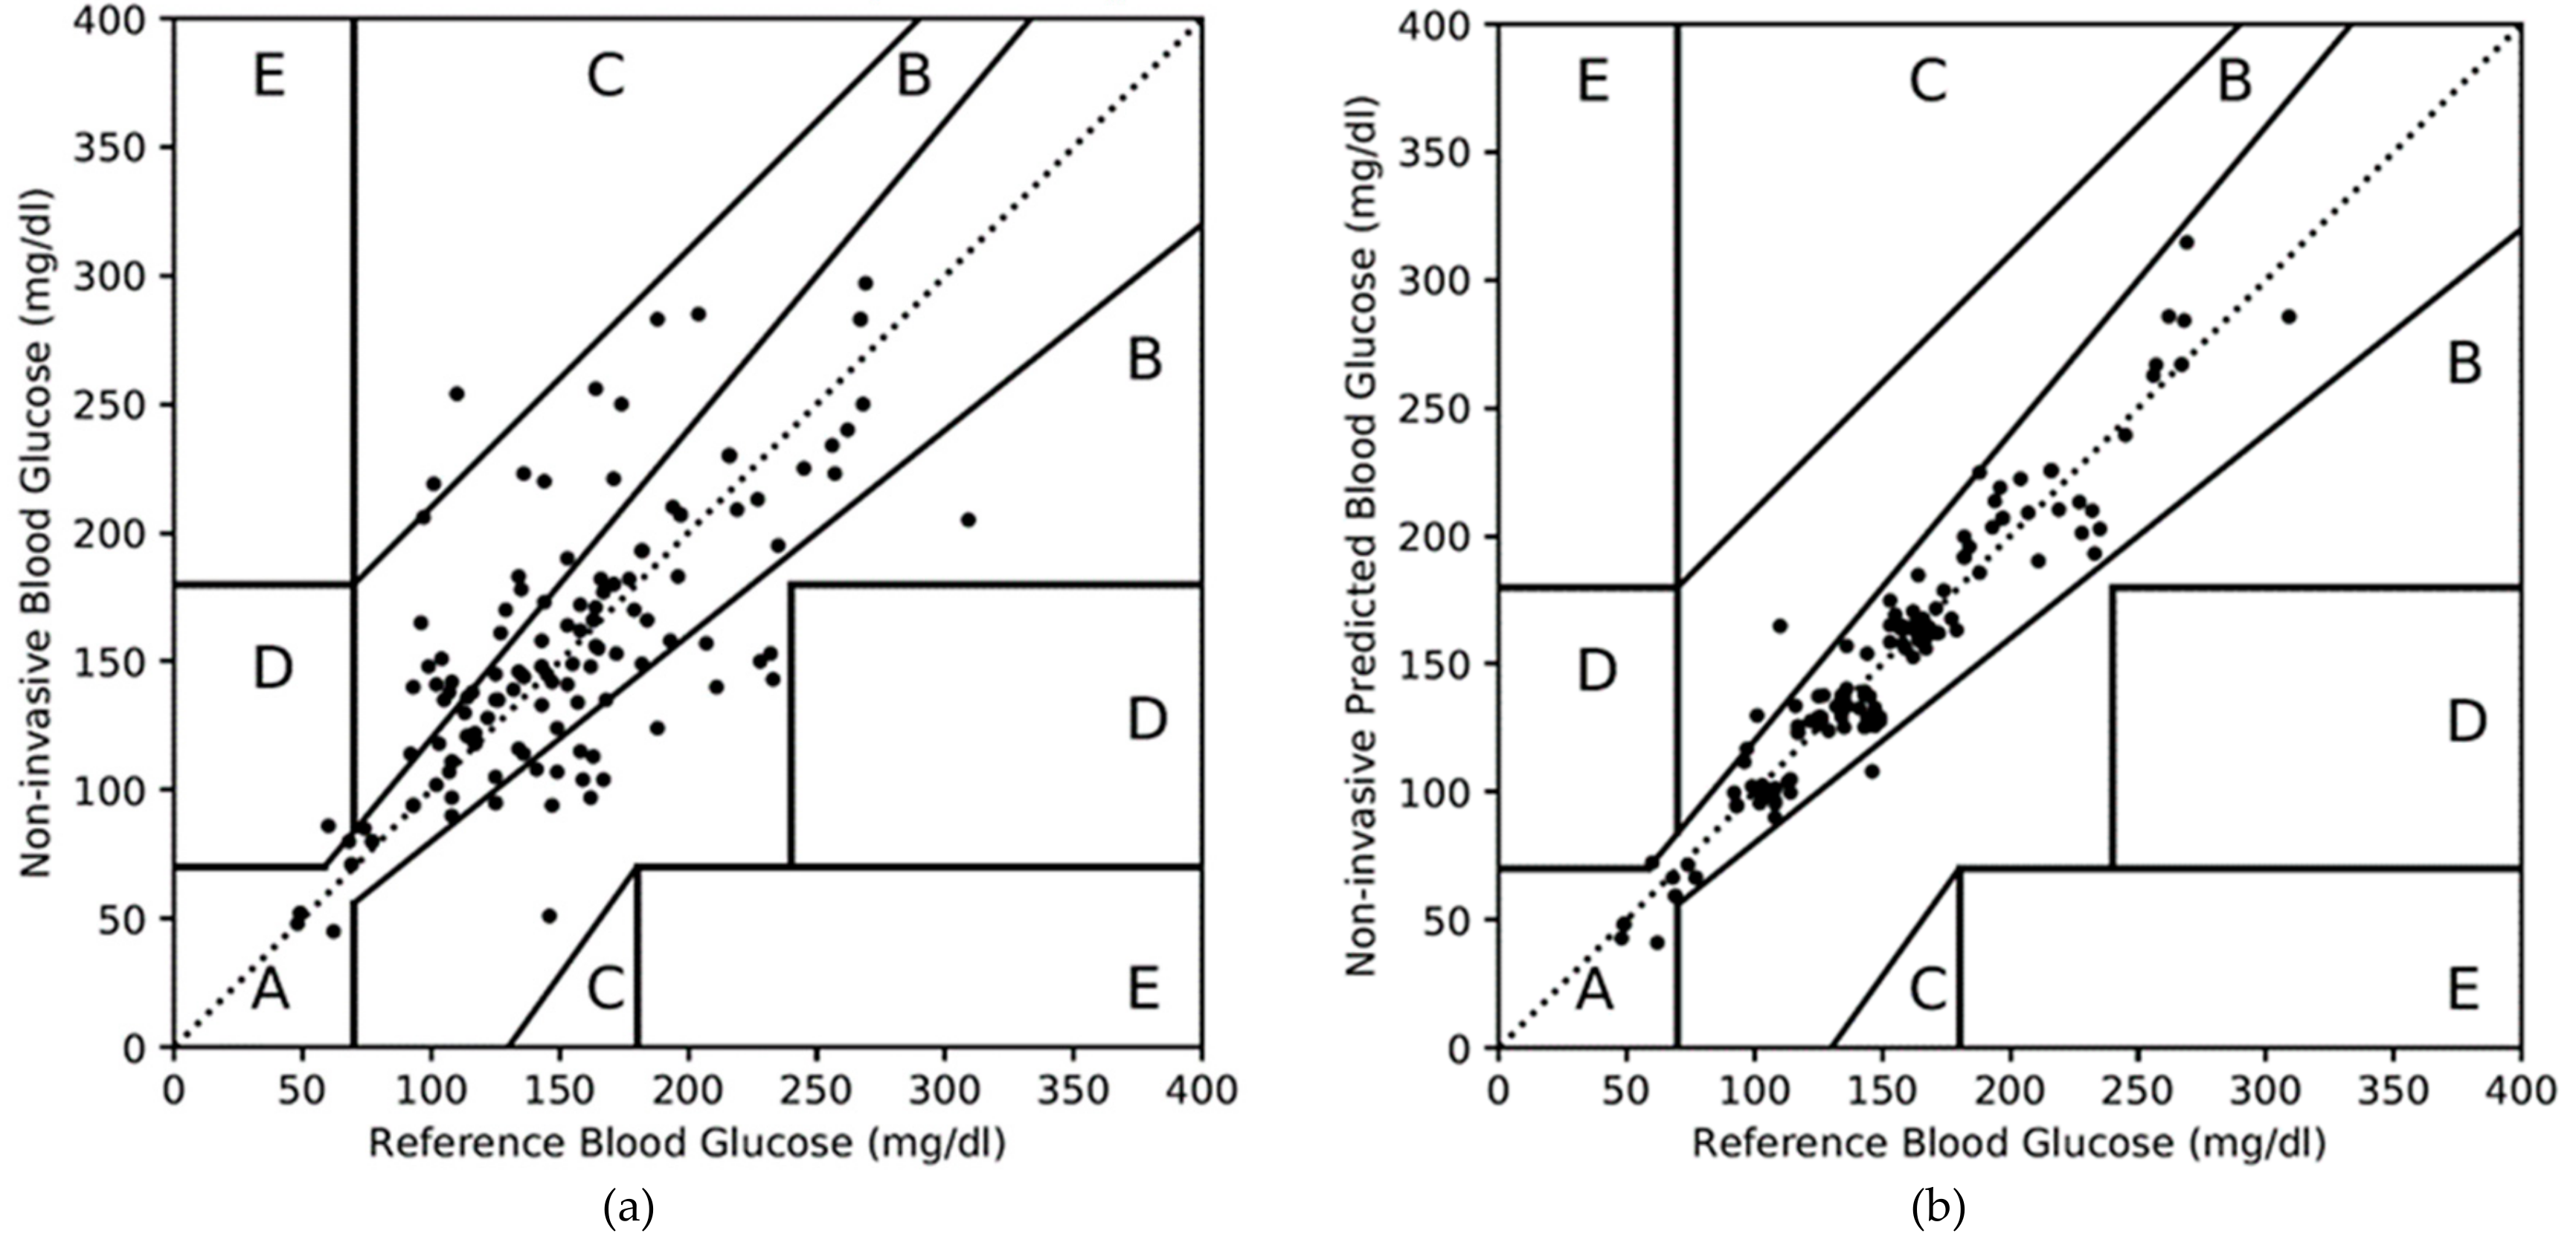
2.1.2. Clarke Error Grid Analysis (CEGA) Plot
- Zone A: Deviation with respect to reference is <20%. Values falling within this range are clinically accurate with the right treatment.
- Zone B: Deviation with respect to reference is >20% and within the range of clinically benign condition without risk to the patient.
- Zone C: Deviation is within hypoglycemia and hyperglycemia ranges. However, it can lead to unnecessary treatment.
- Zone D: Deviation is potentially dangerous and can fail to detect the hypoglycemic or hyperglycemic situation.
- Zone E: Deviation is extremely dangerous and can confuse hypoglycemia for hyperglycemia or vice versa.
2.1.3. Minimum and Maximum Percentage Error
2.2. Regulation for Blood Glucose Measurement Accuracy
2.3. Accuracy of Invasive Blood Glucose Monitoring Devices
2.4. Accuracy of Non-Invasive and Minimal-Invasive Blood Glucose Monitoring Devices
2.4.1. Accuracy of Non-Invasive Blood Glucose Sensor Technologies
2.4.2. Accuracy of Non-Invasive Blood Glucose Monitoring Devices
2.5. Machine Learning Based AdaBoost Algorithm for Prediction
- Input: The AdaBoost regressor starts with a weak predictor, such as a decision tree, based on an input dataset (ui, vi).
- Sequence of m examples (u1,v1),…, (um,vm) where labels vi ∈ R
- Weak learning algorithm Weak Learner
- Initialize: Next, the initialization in AdaBoost starts with equal weights for all datasets. We consider average loss function as zero during the first iteration.
- Iteration t = 1
- Distribution Dt(i) = 1/m for all i
- Average loss function Ltavg = 0
- Iterate: Then, the weak predictor is called repeatedly, making the predictor more concerned with samples that are difficult to predict by giving greater weight to incorrectly predicted samples in each round. During this process, the average loss function is calculated by linear or square, or exponential law depends on data as shown in Equations (3)–(5).
- Average loss function Ltavg < 0.5
- Call ft(ui), providing it with distribution Dt
- Build the regression model: ft(ui)⟶vi
- Calculate the loss for each training example as,
- Calculate the loss function Lt(i) for each training example using any of 3 functional forms as,
- Calculate an average loss from Equation (7),
- Calculate the measure of confidence in predictor as per Equation (8),
- Update distribution Dt by using Equation (9),
- Set t = t + 1 to perform next iteration.
- Output: For a particular input ui, each of the T machines makes a prediction ft. The final hypothesis is formed using T predictors as shown in Equation (10).
| = Independent variables for ith data; | = Dependent variables for ith data; |
| i = Number of data, which varies from is 1,2….m; | m = Total number of data; |
| t = Iteration number, which varies from 1,2….T; | T = Total number of iterations; |
| Dt(i) = Probability distribution for ith data at tth iteration; | ft(ui) = Weak predictor of variable ui at tth iteration; |
| = Loss of each training data at tth iteration; | Ltavg = Average loss function at tth iteration; |
| Lt(i) = Loss function of each training data at tth iteration; | βt = Measure of confidence in predictor at tth iteration; |
| = Strong or final predictor; |
3. Machine Learning Based PGMS with Improved Accuracy
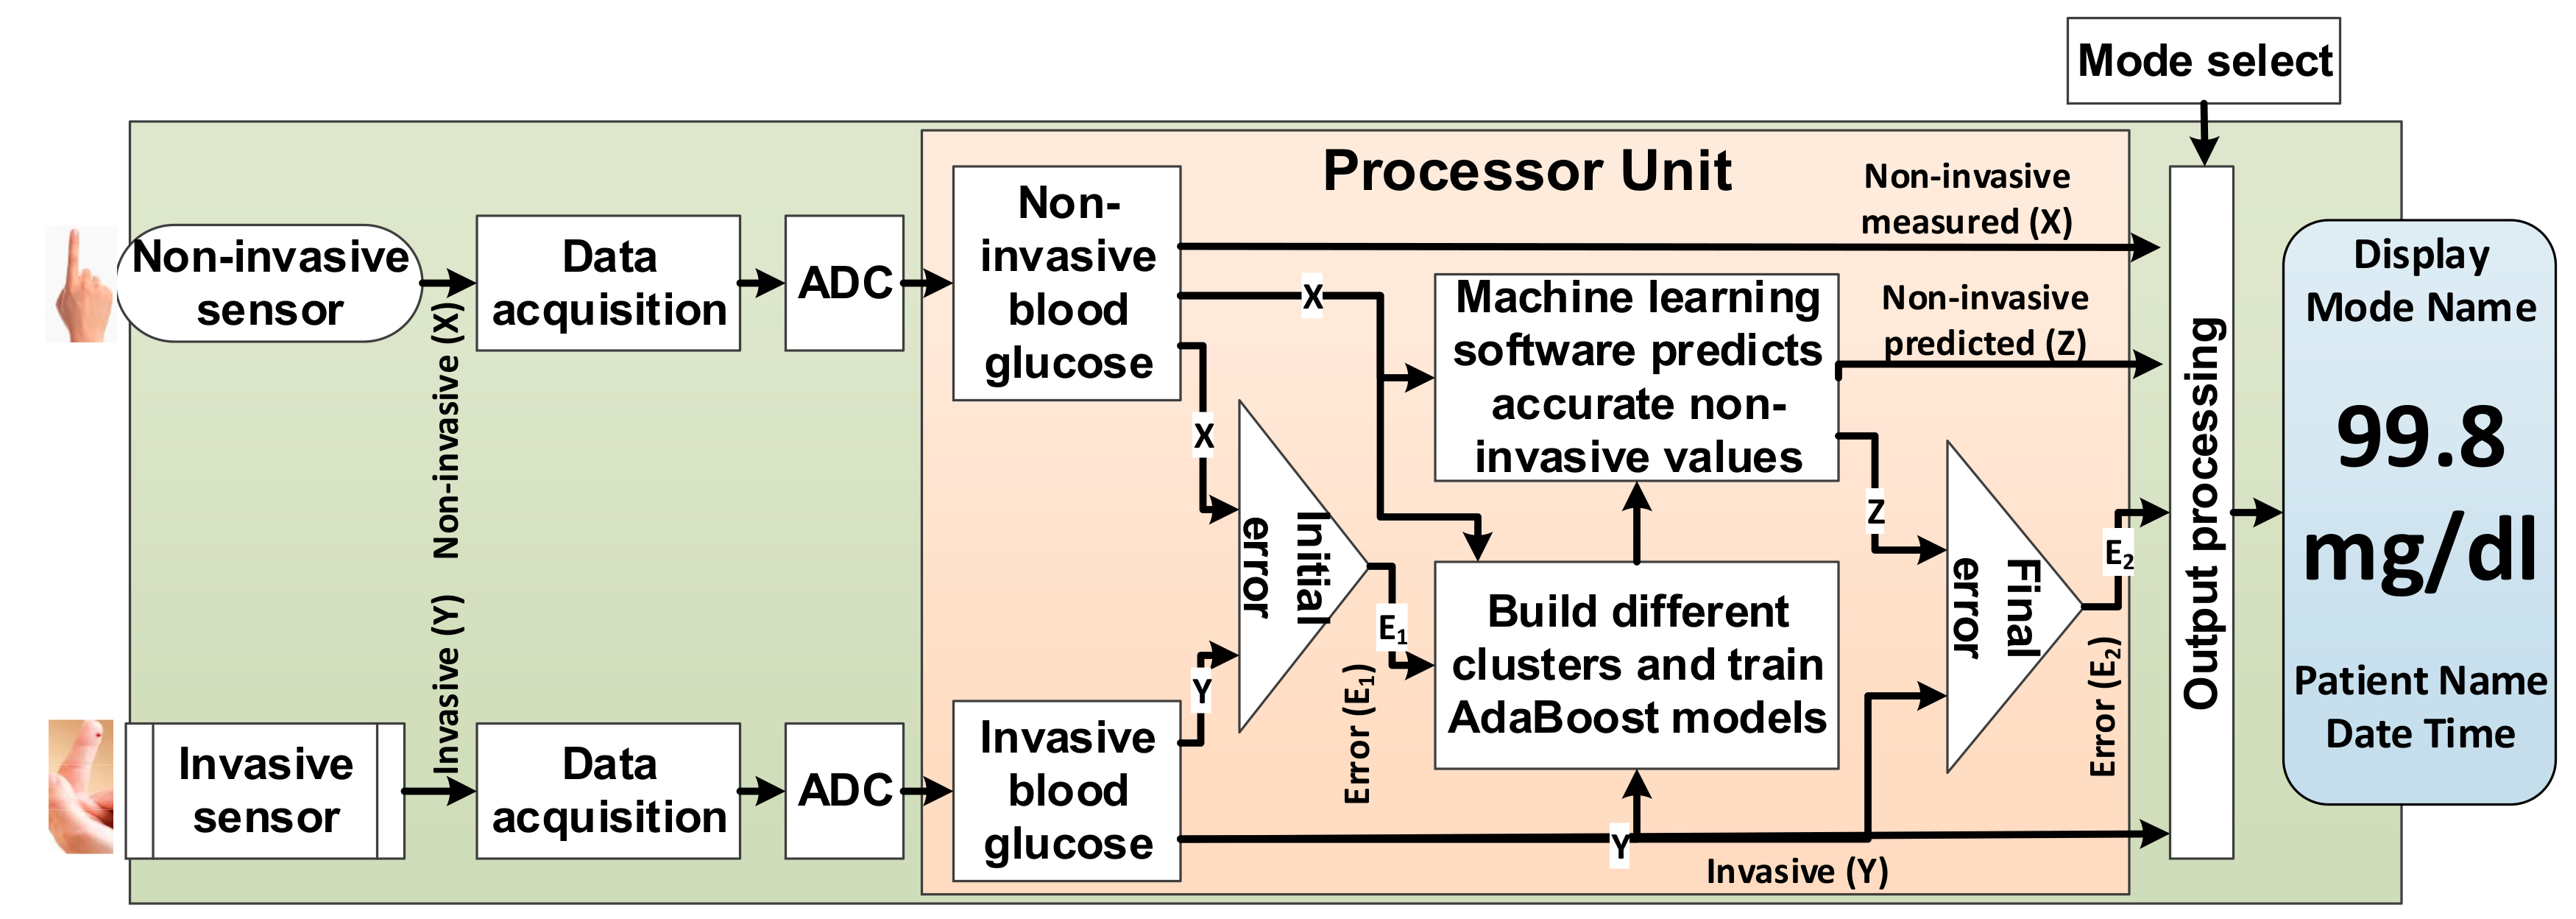
3.1. PGMS Architecture
3.2. Working Principle of the PGMS
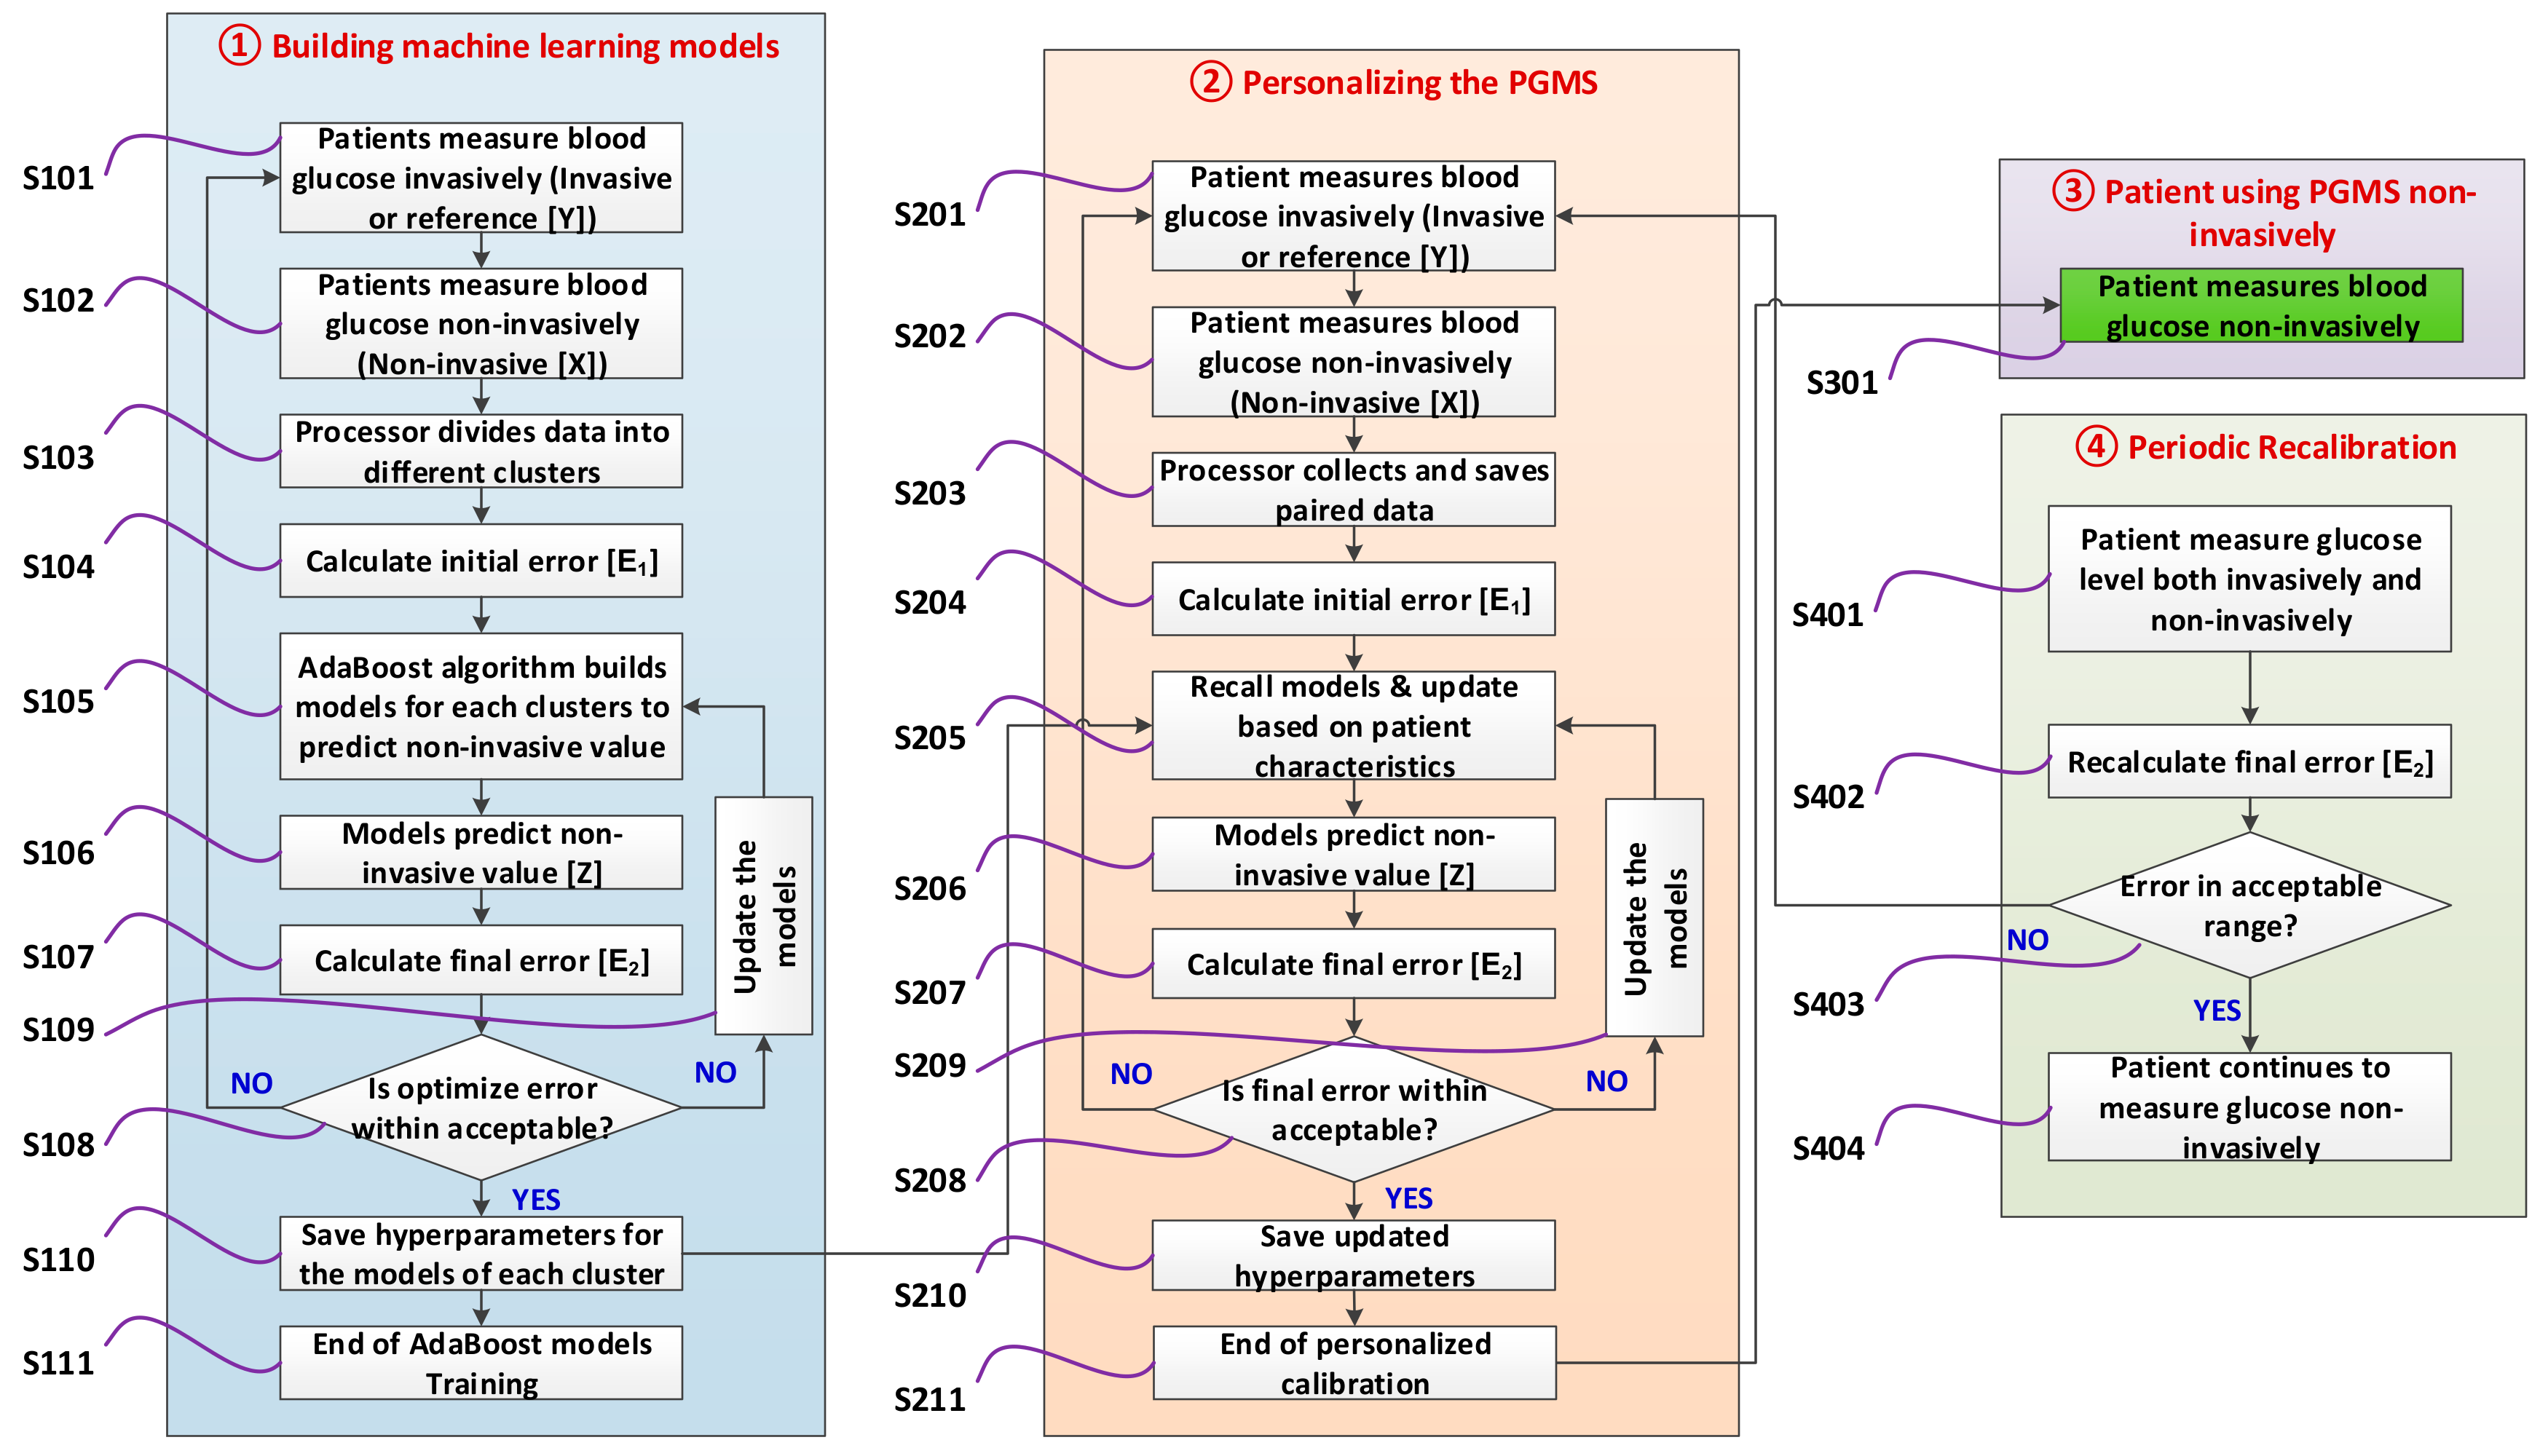
3.2.1. Building Machine Learning Models
3.2.2. Personalizing the Device for a Patient
3.2.3. Patient Measure Blood Glucose Non-Invasively
3.2.4. Periodic Re-Calibration of the Device (If Needed)
3.3. PGMS Algorithm Development
| = Measured non-invasive blood glucose value; | X = Dataset of ; |
| = Reference invasive blood glucose value; | Y = Dataset of ; |
| = Non-invasive predicted blood glucose value; | Z = Dataset of ; |
| = Relative different in measured non-invasive; | = Weak predictor at tth iteration; |
| = Predicted relative different; | = Loss of each training data at tth iteration; |
| i = ith paired data, which varies from 1,2,….m; | βt = Measure of confidence at tth iteration; |
| m = Number of paired data; | t = tth iteration, which is varies from 1,2,….T; |
| α = Learning rate | RMSE = Root mean square error |
| E1 = MARD before applying AdaBoost; | E2 = MARD after applying AdaBoost; |
3.4. Software Implementation for PGMS
3.5. Baseline Simulation Datasets
4. Results and Discussion
4.1. Initial Approaches and Challenges for PGMS
4.1.1. PGMS Using the AdaBoost without Clustering
4.1.2. PGMS with the K-Means Clustering and AdaBoost
4.2. PGMS with Domain-Knowledge Clustering and AdaBoost
| n = Number of clusters; | j = Cluster number, which is from 1,2,….n; |
| mj = Number of paired data in the jth cluster; | i = ith paired data, which varies from 1,2,….m; |
| = Measured non-invasive blood glucose value for ith paired data in jth cluster; | = Reference invasive blood glucose value for ith paired data in jth cluster; |
| = Non-invasive predicted blood glucose value for ith paired data in jth cluster; | E1 = Overall MARD in percentage before applying the AdaBoost; |
| E2 = Overall MARD after applying the AdaBoost; | RMSEj = Root mean square error of jth cluster |
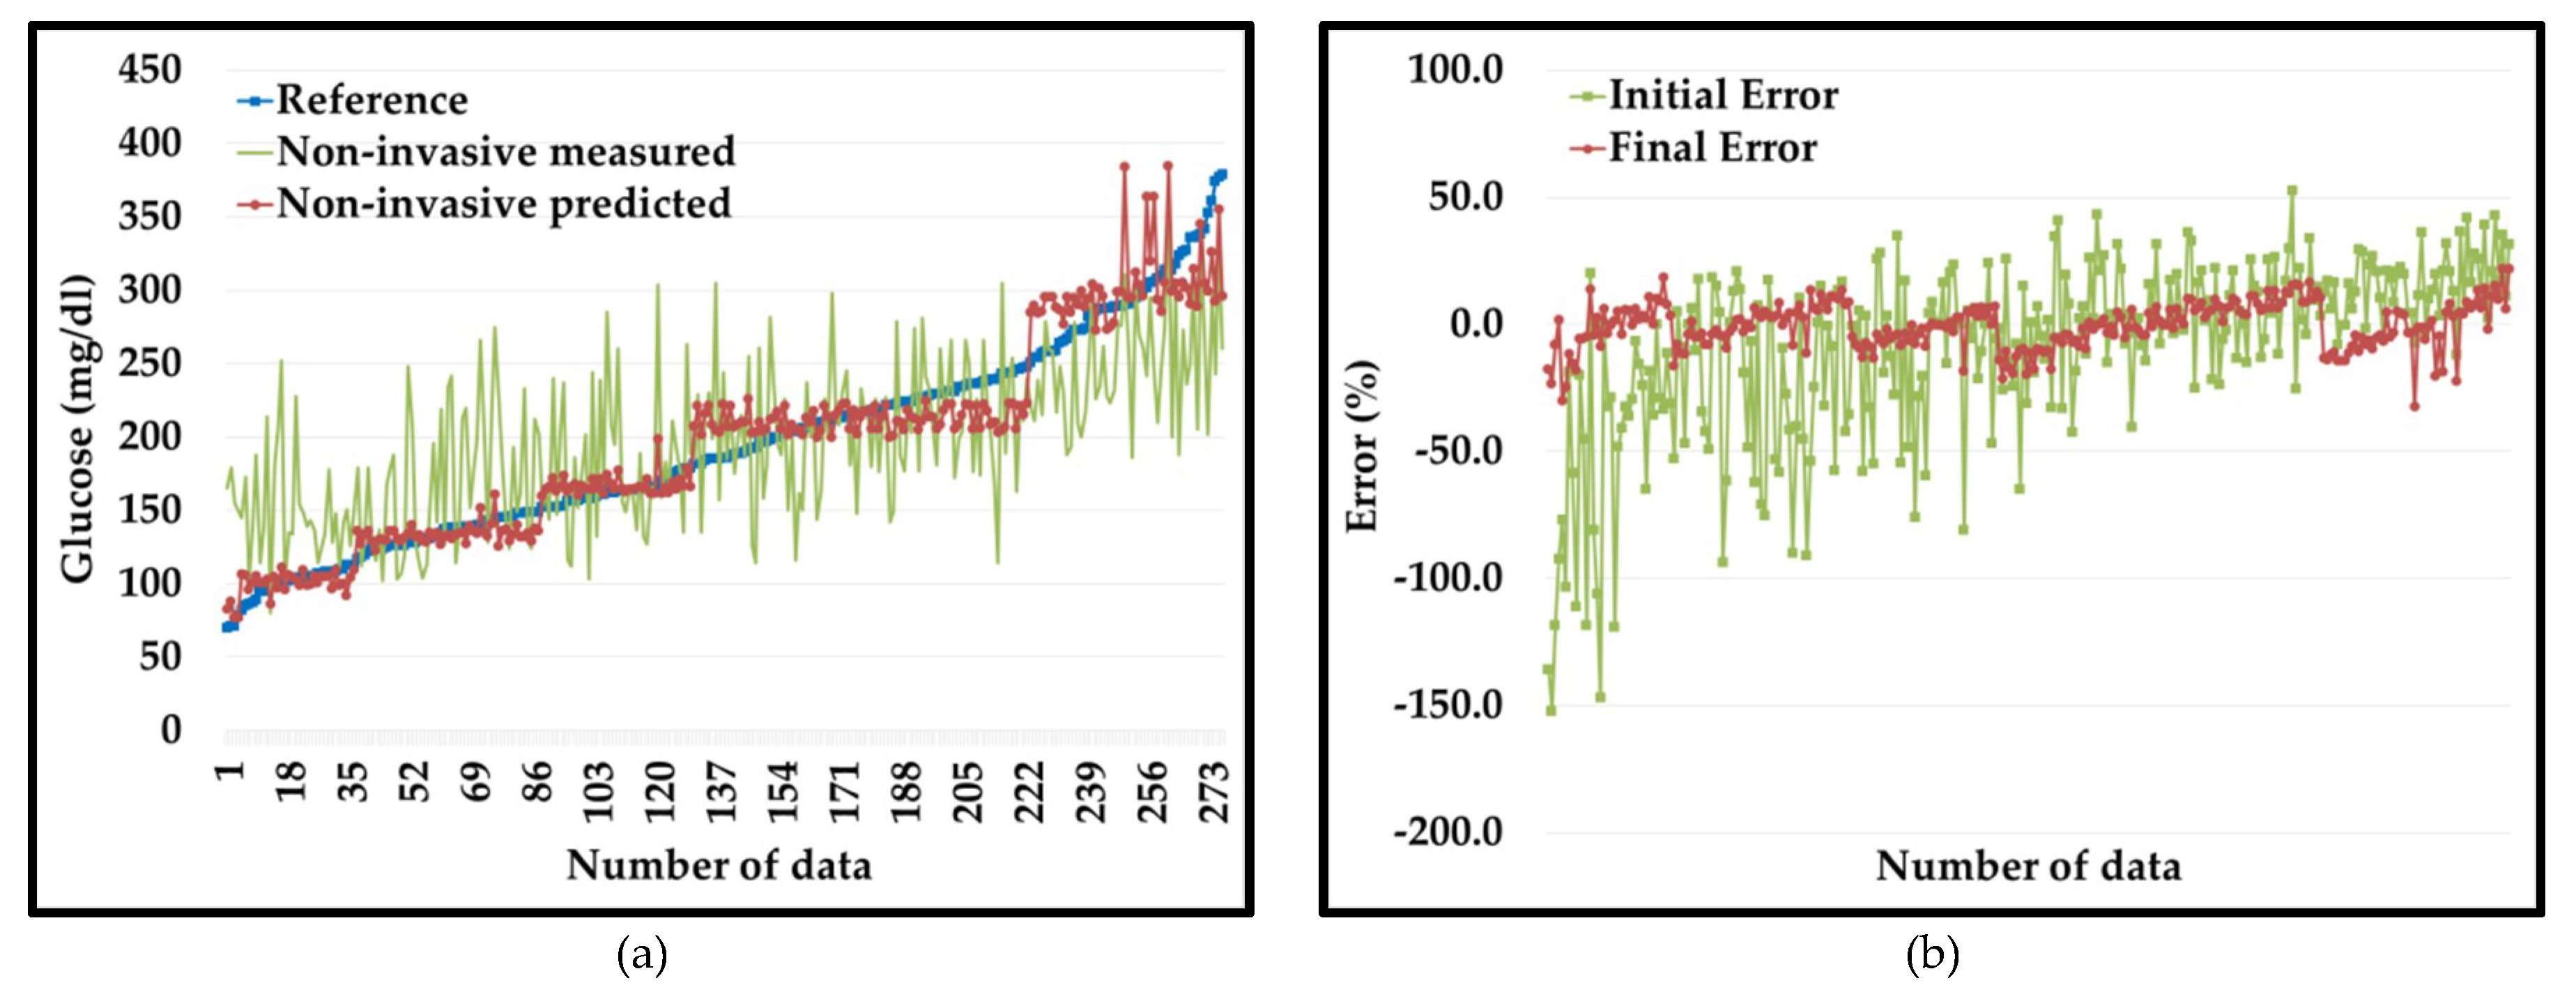
4.2.1. Results of the PGMS on Dataset 1
4.2.2. Results of the PGMS on Dataset 2
5. Conclusions and Future Work
6. Patents
Author Contributions
Funding
Acknowledgments
Conflicts of Interest
References
- Roglic, G. WHO Global report on diabetes: A summary. Int. J. Noncommunicable Dis. 2016, 1, 3–8. [Google Scholar] [CrossRef]
- Alberti, K.G.M.M.; Zimmet, P.Z. Definition, diagnosis and classification of diabetes mellitus and its complications. Part 1: Diagnosis and classification of diabetes mellitus. Provisional report of a WHO consultation. Diabet. Med. 1998, 15, 539–553. [Google Scholar] [CrossRef]
- Yamaguchi, M.; Mitsumori, M.; Kano, Y. Noninvasively measuring blood glucose using saliva. IEEE Eng. Med. Biol. Mag. 1998, 17, 59–63. [Google Scholar] [CrossRef]
- Yao, H.; Shum, A.J.; Cowan, M.; Lähdesmäki, I.; Parviz, B.A. A contact lens with embedded sensor for monitoring tear glucose level. Biosens. Bioelectron. 2011, 26, 3290–3296. [Google Scholar] [CrossRef] [PubMed] [Green Version]
- Moyer, J.; Wilson, D.; Finkelshtein, I.; Wong, B.; Potts, R. Correlation between sweat glucose and blood glucose in subjects with diabetes. Diabetes Technol. Ther. 2012, 14, 398–402. [Google Scholar] [CrossRef] [PubMed]
- Su, L.; Feng, J.; Zhou, X.; Ren, C.; Li, H.; Chen, X. Colorimetric detection of urine glucose based ZnFe2O4 magnetic nanoparticles. Anal. Chem. 2012, 84, 5753–5758. [Google Scholar] [CrossRef] [PubMed]
- Makaram, P.; Owens, D.; Aceros, J. Trends in nanomaterial-based non-invasive diabetes sensing technologies. Diagnostics 2014, 4, 27–46. [Google Scholar] [CrossRef] [PubMed]
- Villena Gonzales, W.; Mobashsher, A.T.; Abbosh, A. The progress of glucose monitoring—A review of invasive to minimally and non-invasive techniques, devices and sensors. Sensors 2019, 19, 800. [Google Scholar] [CrossRef] [PubMed] [Green Version]
- Not All FDA Approved Glucose Meters on the Market Meet Accuracy Standards, Diabetes Daily. Available online: https://www.diabetesdaily.com/blog/not-all-fda-approved-glucose-meters-on-the-market-meet-accuracy-standards-581567/ (accessed on 25 November 2019).
- Liakat, S.; Bors, K.A.; Xu, L.; Woods, C.M.; Doyle, J.; Gmachl, C.F. Noninvasive in vivo glucose sensing on human subjects using mid-infrared light. Biomed. Opt. Express 2014, 5, 2397–2404. [Google Scholar] [CrossRef]
- Caduff, A.; Dewarrat, F.; Talary, M.; Stalder, G.; Heinemann, L.; Feldman, Y. Non-invasive glucose monitoring in patients with diabetes: A novel system based on impedance spectroscopy. Biosens. Bioelectron. 2006, 22, 598–604. [Google Scholar] [CrossRef]
- Maruo, K.; Tsurugi, M.; Chin, J.; Ota, T.; Arimoto, H.; Yamada, Y.; Tamura, M.; Ishii, M.; Ozaki, Y. Noninvasive blood glucose assay using a newly developed near-infrared system. IEEE J. Sel. Top. Quantum Electron. 2003, 9, 322–330. [Google Scholar] [CrossRef]
- Dingari, N.C.; Barman, I.; Kang, J.W.; Kong, C.R.; Dasari, R.R.; Feld, M.S. Wavelength selection-based nonlinear calibration for transcutaneous blood glucose sensing using Raman spectroscopy. J. Biomed. Opt. 2011, 16, 087009. [Google Scholar] [CrossRef] [PubMed] [Green Version]
- Gabbay, R.A.; Sivarajah, S. Optical coherence tomography-based continuous noninvasive glucose monitoring in patients with diabetes. Diabetes Technol. Ther. 2008, 10, 188–193. [Google Scholar] [CrossRef] [PubMed]
- Pai, P.P.; Sanki, P.K.; Sarangi, S.; Banerjee, S. Modelling, verification, and calibration of a photoacoustics based continuous non-invasive blood glucose monitoring system. Rev. Sci. Instrum. 2015, 86, 064901. [Google Scholar] [CrossRef]
- Song, K.; Ha, U.; Park, S.; Bae, J.; Yoo, H.J. An impedance and multi-wavelength near-infrared spectroscopy IC for non-invasive blood glucose estimation. IEEE J. Solid State Circuits 2015, 50, 1025–1037. [Google Scholar] [CrossRef]
- Caduff, A.; Mueller, M.; Megej, A.; Dewarrat, F.; Suri, R.E.; Klisic, J.; Donath, M.; Zakharov, P.; Schaub, D.; Stahel, W.A.; et al. Characteristics of a multisensor system for non invasive glucose monitoring with external validation and prospective evaluation. Biosens. Bioelectron. 2011, 26, 3794–3800. [Google Scholar] [CrossRef]
- Harman-Boehm, I.; Gal, A.; Raykhman, A.M.; Naidis, E.; Mayzel, Y. Noninvasive glucose monitoring: Increasing accuracy by combination of multi-technology and multi-sensors. J. Diabetes Sci. Technol. 2010, 4, 583–595. [Google Scholar] [CrossRef] [Green Version]
- Segman, Y. Device and method for noninvasive glucose assessment. J. Diabetes Sci. Technol. 2018, 12, 1159–1168. [Google Scholar] [CrossRef] [Green Version]
- Nemaura Medical. Nemaura Announces Positive Results for Its SugarBEAT® European Clinical Program. Available online: http://nemauramedical.com/nemaura-announces-positive-results-sugarbeat-europeanclinical-program/ (accessed on 25 November 2019).
- Saur, N.M.; England, M.R.; Menzie, W.; Melanson, A.M.; Trieu, M.-Q.; Berlin, J.; Hurley, J.; Krystyniak, K.; Kongable, G.L.; Nasraway, S.A. Accuracy of a novel noninvasive transdermal continuous glucose monitor in critically Ill patients. J. Diabetes Sci. Technol. 2014, 8, 945–950. [Google Scholar] [CrossRef] [Green Version]
- Hadar, E.; Chen, R.; Toledano, Y.; Tenenbaum-Gavish, K.; Atzmon, Y.; Hod, M. Noninvasive, continuous, real-time glucose measurements compared to reference laboratory venous plasma glucose values. J. Matern. Fetal Neonatal Med. 2019, 32, 3393–3400. [Google Scholar] [CrossRef]
- Jafri, R.Z.; Balliro, C.A.; El-Khatib, F.; Maheno, M.; Hillard, M.A.; Donovan, A.J.; Selagamsetty, R.; Zheng, H.U.I.; Damiano, E.; Russell, S.J. A three-way accuracy comparison of the dexcom g5, abbott freestyle libre pro, and senseonics eversense cgm devices in an outpatient study of subjects with type 1 diabetes. Diabetes. 2018, 67, 14. [Google Scholar] [CrossRef]
- U.S. Food & Drug Administration (FDA). Blood Glucose Monitoring Test Systems for Prescription Point-of-Care Use; U.S. Food & Drug Administration (FDA): Silver Spring, MD, USA, 2016.
- U.S. Food & Drug Administration (FDA). Self-Monitoring Blood Glucose Test Systems for over-the-Counter Use; U.S. Food & Drug Administration (FDA): Silver Spring, MD, USA, 2016.
- In vitro Diagnostic Medical Devices, European Commission. Available online: http://ec.europa.eu/growth/single-market/european-standards/harmonised-standards/iv-diagnostic-medical-devices/#Note%202.1 (accessed on 25 November 2019).
- New Requirements for Medical Device Licence Applications for Lancing Devices and Blood Glucose Monitoring Systems, Government of Canada. Available online: https://www.canada.ca/en/health-canada/services/drugs-health-products/medical-devices/activities/announcements/notice-new-requirementsmedical-device-licence-applications-lancing-devices-blood-glucose-monitoring-systems.html (accessed on 25 November 2019).
- China Food & Drug Administration (CFDA). Glucometer Registration Technical Review Guidelines; Chemical Inspection and Regulation Service (CIRS): Beijing, China, 2016. [Google Scholar]
- Solihin, M.I.; Shameem, Y.; Htut, T.; Ang, C.K.; bt Hidayab, M. Non-Invasive Blood Glucose Estimation using Handheld Near Infra-Red Device. Int. J. Recent Technol. Eng. 2019, 8, 16–19. [Google Scholar]
- Malin, S.F.; Ruchti, T.L.; Blank, T.B.; Thennadil, S.N.; Monfre, S.L. Noninvasive prediction of glucose by near-infrared diffuse reflectance spectroscopy. Clin. Chem. 1999, 45, 1651–1658. [Google Scholar] [CrossRef] [PubMed] [Green Version]
- Russell, S.; Norvig, P. Artificial Intelligence: A Modern Approach; Prentice Hall: Upper Saddle River, NJ, USA, 2020. [Google Scholar]
- Alpaydin, E. Introduction to Machine Learning; MIT press: Cambridge, MA, USA, 2020. [Google Scholar]
- Freund, Y.; Schapire, R.E. A desicion-theoretic generalization of on-line learning and an application to boosting. In European Conference on Computational Learning Theory; Springer: Berlin/Heidelberg, Germany, 1995; pp. 23–37. [Google Scholar]
- Drucker, H. Improving regressors using boosting techniques. In Proceedings of the ICML, Nashville, TN, USA, 8–12 July 1997; Volume 97, pp. 107–115. [Google Scholar]
- Ferreira, J.M.; Pires, I.M.; Marques, G.; Garcia, N.M.; Zdravevski, E.; Lameski, P.; Flórez-Revuelta, F.; Spinsante, S. Identification of daily activites and environments based on the adaboost method using mobile device data: A systematic review. Electronics 2020, 9, 192. [Google Scholar] [CrossRef] [Green Version]
- Chen, P.; Pan, C. Diabetes classification model based on boosting algorithms. BMC Bioinform. 2018, 19, 109. [Google Scholar] [CrossRef] [PubMed] [Green Version]
- Sriram, G.; Vivek, M.; Roy, S.K.; Sharan, P. Spectral analysis of photonic crystal based bio-sensor using AdaBoost algorithm. In Proceedings of the 2015 IEEE International Conference on Communications and Signal Processing (ICCSP), Melmaruvathur, India, 2–4 April 2015; pp. 1806–1810. [Google Scholar]
- Heinemann, L.; Schoemaker, M.; Schmelzeisen-Redecker, G.; Hinzmann, R.; Kassab, A.; Freckmann, G.; Reiterer, F.; Del Re, L. Benefits and limitations of MARD as a performance parameter for continuous glucose monitoring in the interstitial space. J. Diabetes Sci. Technol. 2020, 14, 135–150. [Google Scholar] [CrossRef]
- Kirchsteiger, H.; Heinemann, L.; Freckmann, G.; Lodwig, V.; Schmelzeisen-Redeker, G.; Schoemaker, M.; Del Re, L. Performance comparison of CGM systems: MARD values are not always a reliable indicator of CGM system accuracy. J. Diabetes Sci. Technol. 2015, 9, 1030–1040. [Google Scholar] [CrossRef] [Green Version]
- Clarke, W.L. The original Clarke error grid analysis (EGA). Diabetes Technol. Ther. 2005, 7, 776–779. [Google Scholar] [CrossRef]
- Supervised Learning. Available online: https://scikit-learn.org/stable/supervised_learning.html#supervised-learning (accessed on 25 November 2019).


| Regulation | Glucose Level | Acceptable Error Range | Device Accuracy | MARD |
|---|---|---|---|---|
| US Food and Drug Administration (FDA) [24,25] | Entire range | −15%~15% | > 95% | < 5% |
| −20%~20% | > 99% | < 1% | ||
| European Medicines [26] Health Canada [27] China Food and Drug Administration (CFDA) [28] | ≥100 mg/dL | −15%~15% | > 95% | < 5% |
| <100 mg/dL | −15~15 mg/dL | > 95% | < 5% |
| Product Name | Manufacturer | Accuracy |
|---|---|---|
| Contour Next [9] | Bayer | 100% |
| Accu-Check Aviva Plus [9] | Roche | 99% |
| Walmart ReliOn Confirm [9] | Arkray | 97% |
| CVS Advanced [9] | AgaMatrix | 96% |
| FreeStyle Lite [9] | Abbott Diabetes Care | 96% |
| Sensing Technology | MARD (%) | CEGA Plot (%) | ||
|---|---|---|---|---|
| Zone A | Zone A and B | Zone C, D, and E | ||
| Infrared spectroscopy [10] | - | 84.0 | - | - |
| Impedance spectroscopy [11] | - | 56.0 | 93.0 | 7.0 |
| Diffuse reflectance [12] | - | 87.5 | 95.8 | 4.2 |
| Raman spectroscopy [13] | - | 86.7 | - | - |
| Optical coherence tomography [14] | 11.5 | 83.0 | 99.0 | 1.0 |
| Photo-acoustic spectroscopy [15] | 11.8 | 82.7 | 100.0 | 0.0 |
| Multi-sensor1 [16] | 8.3 | 90.0 | 100.0 | 0.0 |
| Multi-sensor2 [17] | 8.8 | 92.7 | 100.0 | 0.0 |
| Multi sensor3 [18] | 22.4 | 60.0 | 96.0 | 4.0 |
| Product Name | Manufacturer | Sensing Technology | Accuracy |
|---|---|---|---|
| GlucoTrack [18] | Integrity Application | Multi-technology (Ultrasound + Thermal + Electromagnetic) | MARD: 23.4% Zone A: 57% Zone B: 39% |
| Combo Glucometer (CoG) [19] | CNOGA Medical | Near-Infrared Spectroscopy | MARD: 17.1% Zone A: 86.2% Zone B: 12.6% |
| SugerBEAT [20] | Nemaura Medical | Reverse Iontophoresis | MARD: 13.8% |
| Symphony [21] | Echo Therapeutics | Sonophoresis | MARD: 12.3% Zone A: 81.7% Zone B: 18.3% |
| Wizmi [22] | Wear2b Ltd. | NIR spectroscopy | MARD: 7.2% Zone A: 93% Zone B: 7% |
| Eversense [23] | Senseonics | Fluorescence | MARD: 14.8% |
| Parameters | Unit | GlucoTrack [18] | Dataset 1 |
|---|---|---|---|
| Invasive Range | mg/dl | 65~492 | 65~492 |
| Non-invasive range | mg/dl | 80~352 | 80~352 |
| Number of paired data | - | 1772 | 918 |
| MARD | % | 23.4 | 23.9 |
| Minimum Error | % | −221 | −221 |
| Maximum Error | % | 61 | 61 |
| Parameters | Unit | CoG [19] | Dataset 2 |
|---|---|---|---|
| Invasive Range | mg/dl | 37~458 | 37~458 |
| Non-invasive range | mg/dl | 40~428 | 40~428 |
| Number of paired data | - | 730 | 470 |
| Minimum Error | % | −131 | −131 |
| Maximum Error | % | 65 | 65 |
| MARD | % | 17.1 | 17.4 |
| Parameter | Unit | AdaBoost | AdaBoost + K-Means Clustering | ||
|---|---|---|---|---|---|
| Initial Error | Final Error | Initial Error | Final Error | ||
| Minimum Error | % | −60.1 | −60.7 | −61 | −57 |
| Maximum Error | % | 149.3 | 143.5 | 149 | 139 |
| MARD | % | 27.4 | 26.3 | 26.8 | 25.1 |
| Blood Glucose Range (mg/dL) | Cluster Name |
|---|---|
| 50–80 | Hypoglycemia |
| 81–115 | No diabetic |
| 116–150 | Pre-diabetic |
| 151–180 | Diabetic |
| 181–250 | Highly diabetic |
| > 250 | Critically diabetic |
| Hyperparameters | Ranges | For Dataset 1 | For Dataset 2 |
|---|---|---|---|
| Regressor type | Decision Tree Gradient Boosting Support Vector Machine | Decision Tree | Decision Tree |
| Depth | 1~100 | 10 | 20 |
| Estimators | 10~500 | 200 | 150 |
| Learning rate | 0.0001~1 | 0.7 | 0.008 |
| Loss function | Linear, Square Exponential | Exponential | Linear |
| Random state | 1~5 | 3 | 1 |
| Cluster | Paired Data | Parameter | Unit | Initial Error | Final Error |
|---|---|---|---|---|---|
| <80 | 4 | Minimum | % | −152 | −23 |
| Maximum | % | −92 | 2 | ||
| MARD | % | 124.6 | 12.6 | ||
| 81–115 | 32 | Minimum | % | −147 | −30 |
| Maximum | % | 20 | 19 | ||
| MARD | % | 48.3 | 7.9 | ||
| 116–150 | 51 | Minimum | % | −94 | −16 |
| Maximum | % | 21 | 13 | ||
| MARD | % | 31.2 | 6.0 | ||
| 151–180 | 42 | Minimum | % | −81.0 | −18.3 |
| Maximum | % | 34.8 | 7.1 | ||
| MARD | % | 21.8 | 5.1 | ||
| 181–250 | 93 | Minimum | % | −64.9 | −21.5 |
| Maximum | % | 52.5 | 16.3 | ||
| MARD | % | 16.6 | 7.5 | ||
| >250 | 54 | Minimum | % | −12 | −32 |
| Maximum | % | 43 | 22 | ||
| MARD | % | 17.2 | 9.0 | ||
| Total | 276 | Minimum * | % | −152 | −32 |
| Maximum † | % | 53 | 22 | ||
| Overall MARD ‡ | % | 25.4 | 7.3 |
| Zones | Non-Invasive Measured Values | Non-Invasive Predicted Values | ||
|---|---|---|---|---|
| Number | % | Number | % | |
| Zone A | 149 | 54 | 267 | 97 |
| Zone B | 115 | 42 | 9 | 3 |
| Zone C | 9 | 3 | 0 | 0 |
| Zone D | 3 | 1 | 0 | 0 |
| Zone E | 0 | 0 | 0 | 0 |
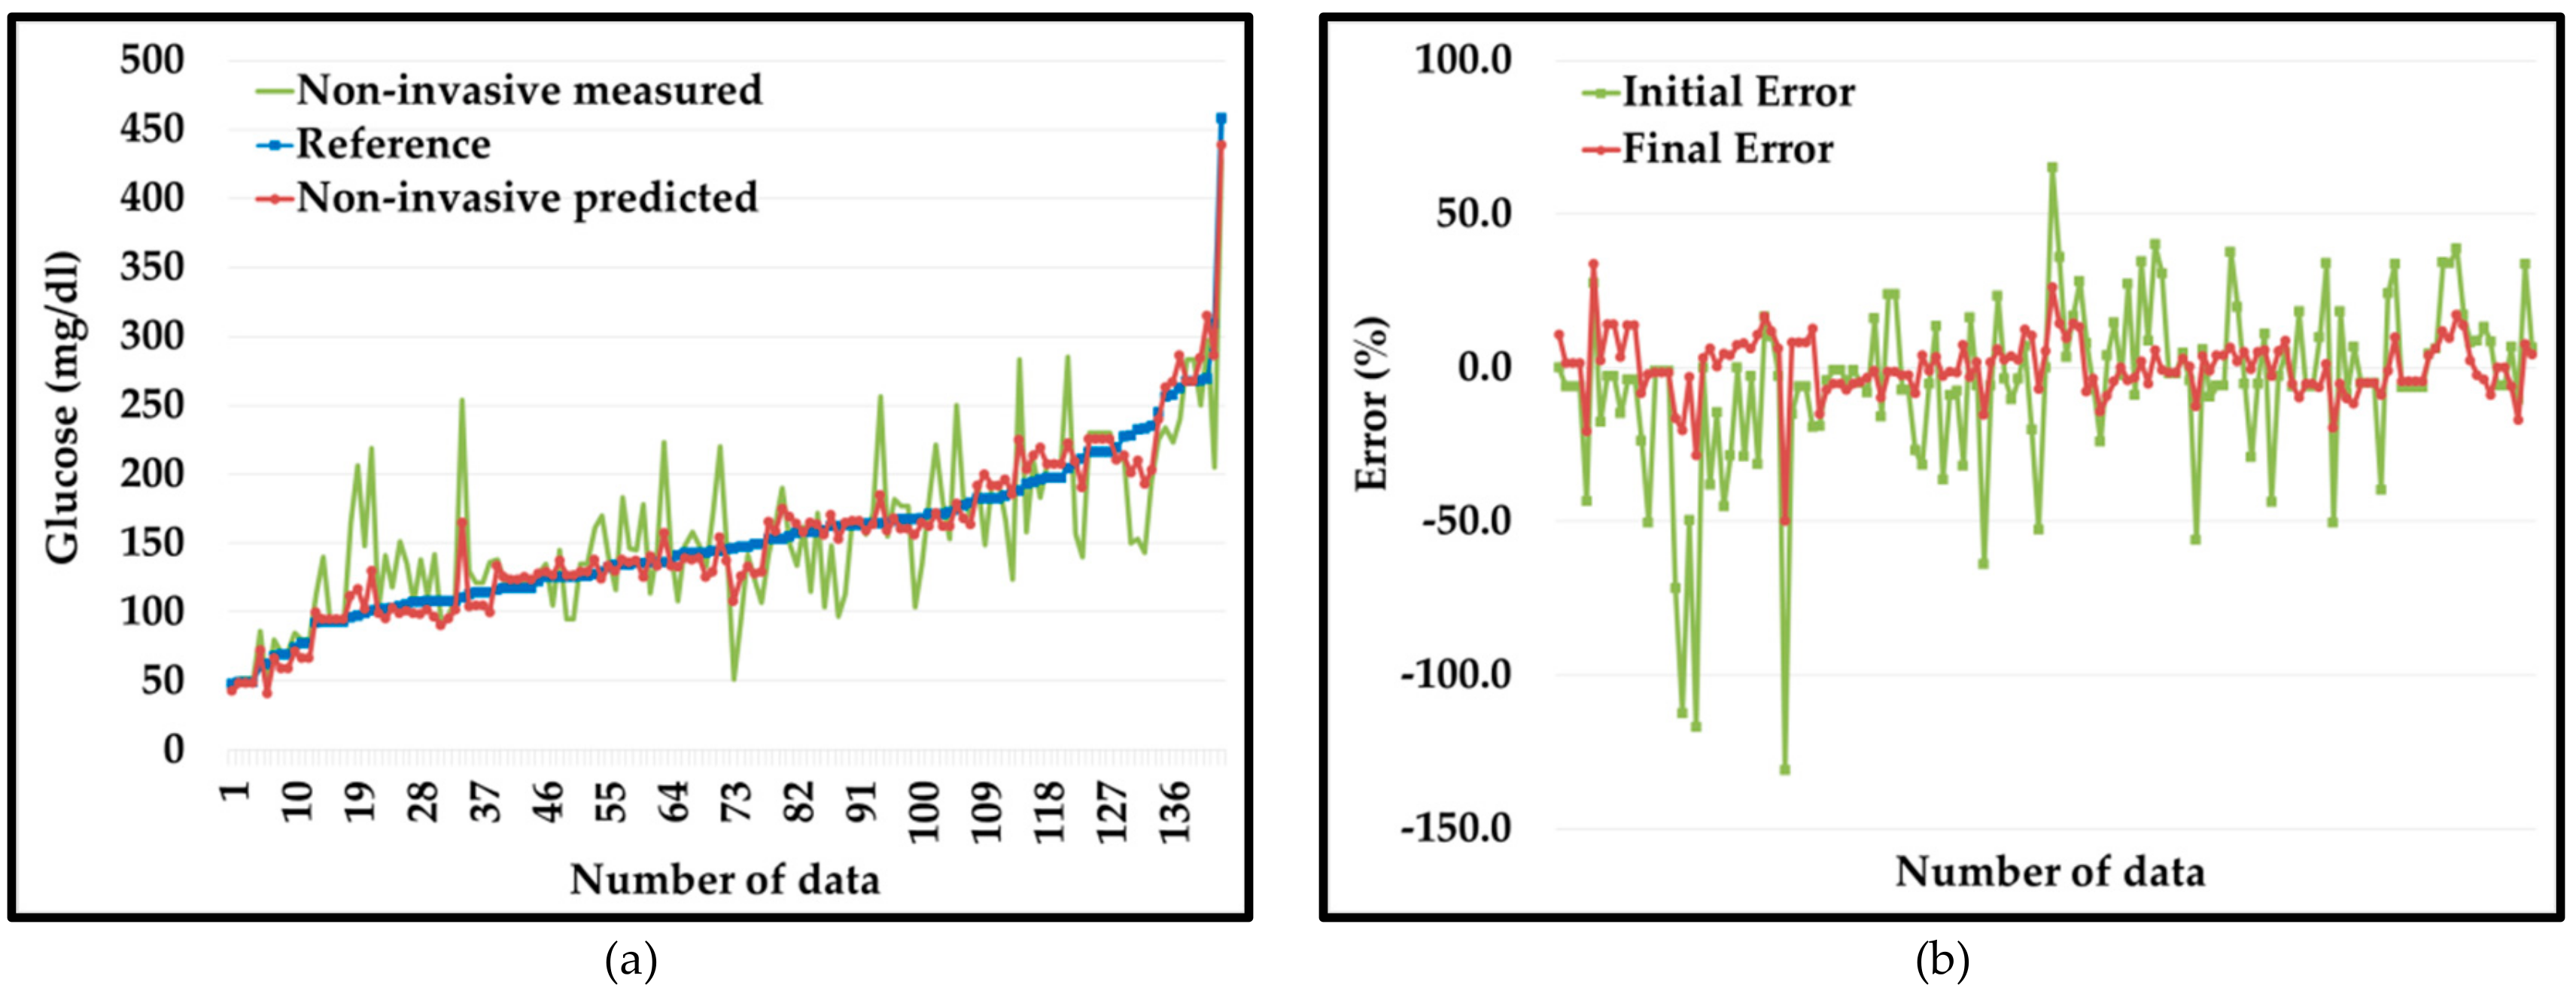
| Cluster | Paired Data | Parameter | Unit | Initial Error | Final Error |
|---|---|---|---|---|---|
| <80 | 12 | Minimum | % | −43.3 | −20.6 |
| Maximum | % | 27.4 | 33.8 | ||
| MARD | % | 11.3 | 10.9 | ||
| 81–115 | 26 | Minimum | % | −130.9 | −49.8 |
| Maximum | % | 16.7 | 16.6 | ||
| MARD | % | 31.7 | 9.8 | ||
| 116–150 | 39 | Minimum | % | −64.0 | −15.4 |
| Maximum | % | 65.1 | 26.0 | ||
| MARD | % | 17.0 | 6.5 | ||
| 151–180 | 30 | Minimum | % | −56.1 | −14.2 |
| Maximum | % | 40.1 | 8.8 | ||
| MARD | % | 15.6 | 4.5 | ||
| 181–250 | 27 | Minimum | % | −50.5 | −19.6 |
| Maximum | % | 38.6 | 17.1 | ||
| MARD | % | 16.5 | 7.3 | ||
| >250 | 9 | Minimum | % | −10.4 | −17.0 |
| Maximum | % | 33.7 | 7.5 | ||
| MARD | % | 11.1 | 5.6 | ||
| Total | 143 | Minimum * | % | −131 | −50 |
| Maximum † | % | 65 | 34 | ||
| Overall MARD ‡ | % | 18.4 | 7.1 |
| Zones | Non-Invasive Measured Values | Non-Invasive Predicted Values | ||
|---|---|---|---|---|
| Number | % | Number | % | |
| Zone A | 99 | 69 | 140 | 98 |
| Zone B | 41 | 29 | 3 | 2 |
| Zone C | 2 | 1 | 0 | 0 |
| Zone D | 1 | 1 | 0 | 0 |
| Zone E | 0 | 0 | 0 | 0 |
| Non-Invasive Measurement System | MARD | CEGA Plot | ||
|---|---|---|---|---|
| Zone A | Zone B | |||
| PGMS | AdaBoost | 26.3% | - | - |
| K-Means Clustering + AdaBoost | 25.1% | - | - | |
| Domain-knowledge Clustering + AdaBoost | 7.1% | 98% | 2% | |
| GlucoTrack | 23.4% | 57% | 39% | |
| CoG | 17.1% | 86.2% | 12.6% | |
| SugarBEAT | 13.8% | - | - | |
| Symphony | 12.3% | 81.7% | 18.3% | |
| Wizmi | 7.2% | 93% | 7% | |
| Eversense | 14.8% | - | - | |
© 2020 by the authors. Licensee MDPI, Basel, Switzerland. This article is an open access article distributed under the terms and conditions of the Creative Commons Attribution (CC BY) license (http://creativecommons.org/licenses/by/4.0/).
Share and Cite
Anand, P.K.; Shin, D.R.; Memon, M.L. Adaptive Boosting Based Personalized Glucose Monitoring System (PGMS) for Non-Invasive Blood Glucose Prediction with Improved Accuracy. Diagnostics 2020, 10, 285. https://doi.org/10.3390/diagnostics10050285
Anand PK, Shin DR, Memon ML. Adaptive Boosting Based Personalized Glucose Monitoring System (PGMS) for Non-Invasive Blood Glucose Prediction with Improved Accuracy. Diagnostics. 2020; 10(5):285. https://doi.org/10.3390/diagnostics10050285
Chicago/Turabian StyleAnand, Pradeep Kumar, Dong Ryeol Shin, and Mudasar Latif Memon. 2020. "Adaptive Boosting Based Personalized Glucose Monitoring System (PGMS) for Non-Invasive Blood Glucose Prediction with Improved Accuracy" Diagnostics 10, no. 5: 285. https://doi.org/10.3390/diagnostics10050285