
Prediction of Retention Indices and Response Factors of Oxygenates for GC-FID by Multilinear Regression

Faculty of Chemistry and Food Chemistry, Technische Universität Dresden, 01062 Dresden, Germany
*
Author to whom correspondence should be addressed.
Data 2022, 7(9), 133; https://doi.org/10.3390/data7090133
Submission received: 15 August 2022
/
Revised: 9 September 2022
/
Accepted: 12 September 2022
/
Published: 14 September 2022
Abstract
:The replacement of fossil carbon sources with green bio-oils promotes the importance of several hundred oxygenated hydrocarbons, which substantially increases the analytical effort in catalysis research. A multilinear regression is performed to correlate retention indices (RIs) and response factors (RFs) with structural properties. The model includes a variety of possible products formed during the hydrodeoxygenation of bio-oils with good accuracy (RRF2 0.921 and RRI2 0.975). The GC parameters are related to the detailed hydrocarbon analysis (DHA) method, which is commonly used for non-oxygenated hydrocarbons. The RIs are determined from a paraffin standard (C5–C15), and the RFs are calculated with ethanol and 1,3,5-trimethylbenzene as internal standards. The method presented here can, therefore, be used together with the DHA method and be expanded further. In addition to the multilinear regression, an increment system has been developed for aromatic oxygenates, which further improves the prediction accuracy of the response factors with respect to the molecular constitution (R2 0.958). Both predictive models are designed exclusively on structural factors to ensure effortless application. All experimental RIs and RFs are determined under identical conditions. Moreover, a folded Plackett–Burman screening design demonstrates the general applicability of the datasets independent of method- or device-specific parameters.
1. Introduction
The rising use of biogenic sources, beside fossil carbon sources, is an important strategy to face challenges on the route to a circular, CO2-neutral chemical industry. These new carbon-source converting technologies evolve to deal with varying local accessibility and the high diversity of biotic and abiotic carbon sources. Catalytic processes remain the most economically viable processes in the chemical industry; hence, the development, characterization and evaluation of a wide range of catalytic systems is of major interest [1,2,3,4,5,6,7,8].
At first, it is important to establish and evaluate a setup for the necessary analytics. Depending on the research tasks, this can be challenging due to the rising complexity of the system and the declining availability of the reference compounds [9,10]. For large-scale industrial processes, such as Fluid Catalytic Cracking (FCC), standardized GC methods are available. The related detailed hydrocarbon analysis (DHA) method enables a precise analysis based on tabulated retention indices and empirical response factors [11,12,13]. The retention indices developed by Ervin Kovats in 1958 enable a device-independent standardisation of retention time [14]. Using the retention indices, only a calibration of a GC with a suitable paraffin standard is necessary to determine the retention times of a variety of other components and, thus, enables a qualitative analysis of the product spectrum. The quantitative analysis of the signal from a flame ionization detector (FID) is based on substance-specific response factors [15]. These are available through empiric formulas only, depending on the structural data of individual substances within the DHA standard [11,12,13].
However, the empirical formulas do not include compounds with oxygen-containing functional groups, as otherwise their content can be dramatically underestimated, as shown by Costa et al. for bio-oils [16]. An explanation was provided by Nicholson et al. [17] in 1980. They suggested that the response of a molecule depends on the time it needs to be reduced to CHn radical species compared to other competitive reactions. The low response for oxygenates is, therefore, due to the structure-dependent low reaction rate to form CHn compared to those that form CO or H2CO. Starting from CHn, CHO+ fragments have been confirmed as the primary ions formed from oxygen functionalities at the FID [18,19].
To estimate the response factors, the more recent approaches rely on artificial neural networks [20] or multiple parameter regressions [21], but primarily focus on hydrocarbons. However, those complex approaches need detailed substance-specific data, such as polarizability, entropies, total one-center-one-electron repulsion energy and total hybridization of molecular dipoles [9,10,20,21,22]. For this reason, the identification and the determination of the response factors of oxygenated compounds are predominantly reperformed by scientists for each study [23,24,25,26,27,28].
Consequently, the scope of this work is a fast and easy prediction of the retention indices and response factors for phenolic bio-oil compounds only from structural properties. A multilinear prediction model is created by the assignment of 99 oxygen-containing compounds, including alcohols, ketones and methylated oxygenated aromatics. Due to the high importance of aromatic oxygenates, an additional increment system has been developed for compounds with up to four substituents. Furthermore, a screening test plan (Plackett–Burman design) quantifies the impact of different method parameters on the response factors and retention indices using 2-methoxyphenol to confirm the general applicability of the prediction model.
2. Materials and Methods
2.1. Utilized Raw Materials and Consumables
The DHA paraffin standard (C5–C15) that was used for the determination of the retention indices was purchased from Restek. The pentanol and 1,3,5-trimethylbenzene used for the calibration were purchased from Thermo Fisher Scientific with a minimum purity of 99%. The absolute ethanol was delivered from VWR with a minimum purity of 99.9%. The other oxygenated hydrocarbons are summarized in Table S5 in the Supplementary Materials with their producers and their purity. No contamination was detected by the GC analysis. All chemicals were used without further purification. The gases, helium, hydrogen and synthetic air, used for the GC analysis, were purchased from PraxAir with a purity of 99.999%.
2.2. Preparation of the Standard Solutions
For the preparation of the standards, 30-mL disposable vials were used. Each standard solution consists of pentanol (solvent), the compound to be analyzed and two internal standards, ethanol and mesitylene. The substances were weighted on a precision balance (Ohaus® Corp., Parsippany, NJ, USA, Analytical Plus balance) with a 0.01 mg resolution. To ensure a homogeneous distribution and dissolution of the solid compounds, all samples were mixed in an overhead shaker. Afterwards, each solution was split into 10 GC vials. A further increase in the accuracy was realized by the preparation of two solutions with different concentrations of 10 and 25 mg/g for each substance.
2.3. GC Methods
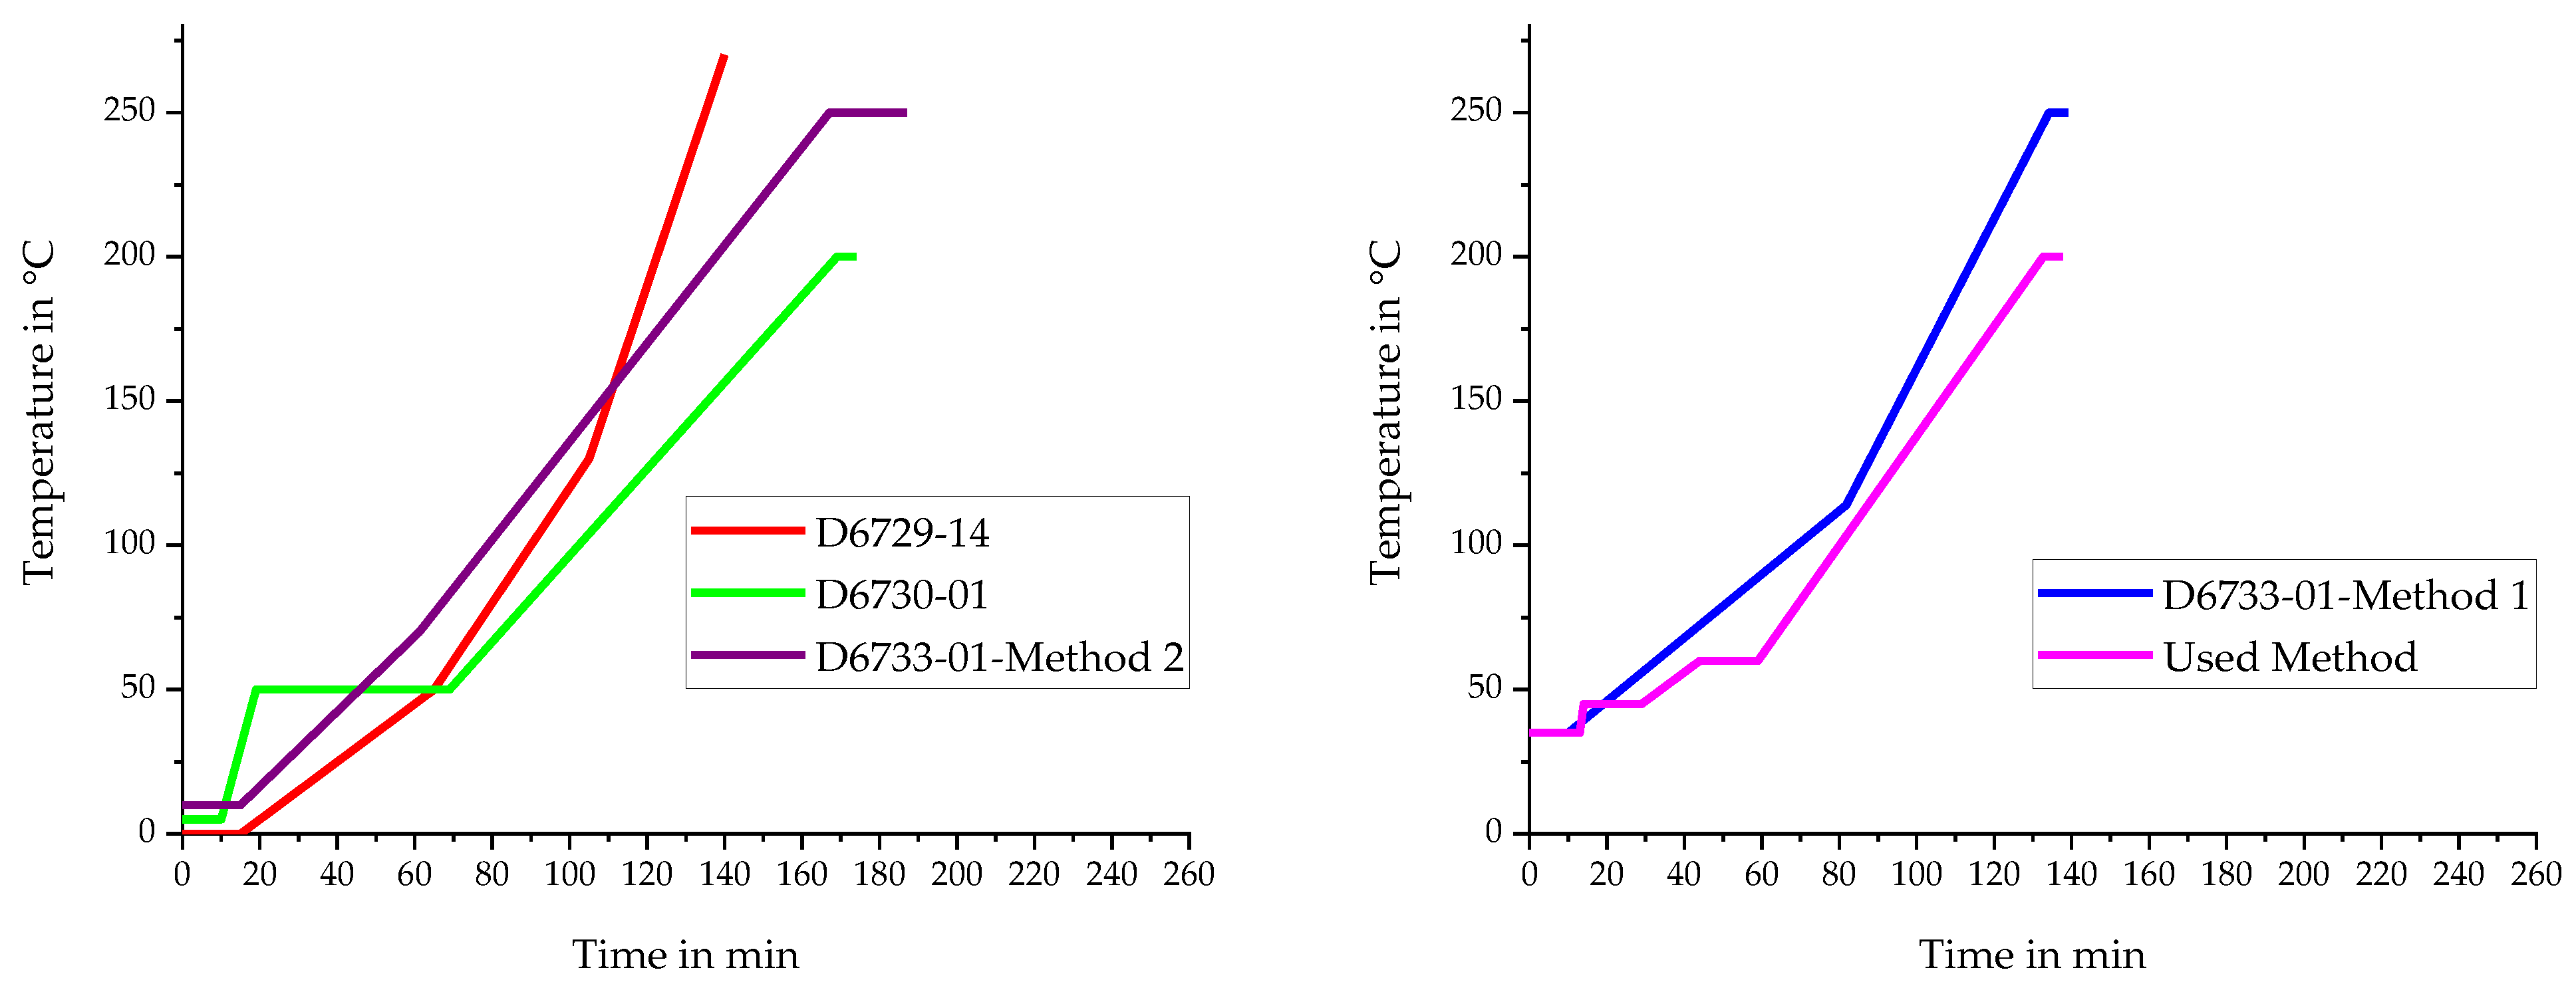
A detailed comparison of the different parameters of the ASTM standards [7,8,9] with the method used [29] is displayed in Table S1. As an overview, Figure 1 illustrates the different temperature profiles.
The investigations were performed on a Clarus 590 gas chromatograph with a wide-range FID from PerkinElmer. According to the used DHA method [29], a 100-m DB−1 column with an inner diameter of 0.25 mm and a film diameter of 0.5 µm was used.
The analysis of the 0.1 µL of the sample was performed at a split ratio of 100:1 using the temperature profile from Table 1. The injector temperature was set to 290 °C, and the total time of each run was 253 min. Helium was used as a carrier gas at 37 psig constant pressure. The FID was operated at a temperature of 250 °C; the hydrogen flow was 34.5 mL/min; the oxygen flow was 400 mL/min, and the detector offset was 5 mV.
2.4. Computation
The evaluation was performed with the software TotalChrom from PerkinElmer. The noise threshold was set to 1; the area threshold was set to 500, and the bunching factor was set to 20. A statistical analysis was performed in JMP by the SAS Institute. Due to the limited number of 99 substances, no separation of the dataset into a training set and a validation set for the statistical analysis was applied, as it is commonly used in the field of big data [30,31]. Instead, the full dataset was used to build the models, and R2 metrics were used as the basis of the model comparison and optimal model selection for assessing the overall performance of the regression models.
The retention indices, defined by Kovats [14], can be calculated according to Equation (1) from the ASTM D 6730 [12].
where
- RIi = retention index of the substance
- n = carbon number of n-paraffin
- ti = retention time of the component
- tn = retention time of the preceding n-paraffin
- tn+1 = retention time of the next n-paraffin molecule
Based on Equation (2), the retention times can be calculated from the specific retention indices.
The response factors of the hydrocarbons are normalized to n-heptane and calculated according to Equation (3) based on the ASTM D 6730 [12].
where
- RFi = relative response factor of the substance
- Caw = atomic weight of carbon (12.011)
- NC = number of carbon atoms in the substance
- Haw = atomic weight of hydrogen (1.008)
- NH = number of hydrogen atoms in the group
The response factors of the oxygenated hydrocarbons can be calculated according to Equation (4) by using the mass fractions corrected with the purity and the integrated FID signal areas. For each substance, the response factor was calculated in relation to both ethanol and 1,3,5-trimethylbenzene (mesitylene). As the components are a liquid and a solid, the response factors are standardised to n-heptane, as commonly applied for hydrocarbons. The procedure is based on the ASTM D 4626–95 [32].
where
- RFi = relative response factor of the substance
- RFRef = relative response factor of the reference
- (RFEthanol = 2.05; RF1,3,5-trimethylbenzene = 0.9329)
- RM,i = mass response factor of the substance
- RM,Ref = mass response factor of the reference
- Ai = area of the substance peak
- wi = mass fraction of the substance corrected by the purity of the substance
- ARef = area of the reference peak
- wRef = mass fraction of the reference
2.5. Design of the Experiments
The investigation of the parameters influencing the response factors was carried out using a screening test plan in double determination. For this, guaiacol acts as a model substance due to its structural similarity to bio-oils. Due to the variation in the temperature profile, decane and undecane additionally functioned as internal standards for the screening tests to calculate the RI. The experimental design is based on the Plackett–Burman design and allows the investigation of 11 factors on two levels with 12 experiments, which are summarized in Table 2 [33]. However, of the 11 possible factors, 2 were declared as controls to evaluate the random experimental error.
3. Results and Discussion
3.1. Determination of the Retention Indices and Response Factors
As a benchmark to state-of-the-art analytics, the retention times of the DHA standard (C5–C15) are determined with high reproducibility due to the autosampler, as displayed in Table 3.
In the first extension to the DHA method, mesitylene and ethanol were used as internal standards for the RF calculation. To prevent possible overlaps of the substances and standards and to increase the accuracy, we decided to use two internal standards at the same time. However, there was no overlap. Both standards eluted sufficiently far from each other. Pentanol was chosen as the solvent because all other components dilute well in it.
The second extension is illustrated in Table 4. It demonstrates the deviations of the experimentally determined response factors (RFs) of the selected oxygenates from those obtained by the calculations within this study, as well as from the reported DHA method.
The regression was performed considering substance-specific characteristics such as boiling point, melting point, functional groups, presence of cyclic structures, aromaticity, chemical formulas and their interactions. Considering all of the factors, the R2 values of 0.934 for the RF and 0.988 for the RI were achieved. In the third step, a backwards elimination was used to determine the significant description model, i.e., a stepwise elimination of the variables that possessed the lowest statistical confidence in the model. The aim was to develop a feasible formula with as few factors as possible that are significant and still provide a descriptive model with a high R2. Table S2 in the Supplementary Materials provides an overview of the systematic elimination steps. Equation (5) results from the backward regression and enables the calculation of the RF for oxygenates.
where
- NOH = number of hydroxyl groups in the substance
The RI follows from an analogous formula. Table 5 provides the variables, their p-values and the estimator for the RF and RI. For this, the estimators for the RF are replaced by those for the RI; for example, the intercept of 1.0710 by 117.796 and the multiplier for the carbon number of −0.0353 by 99.049.
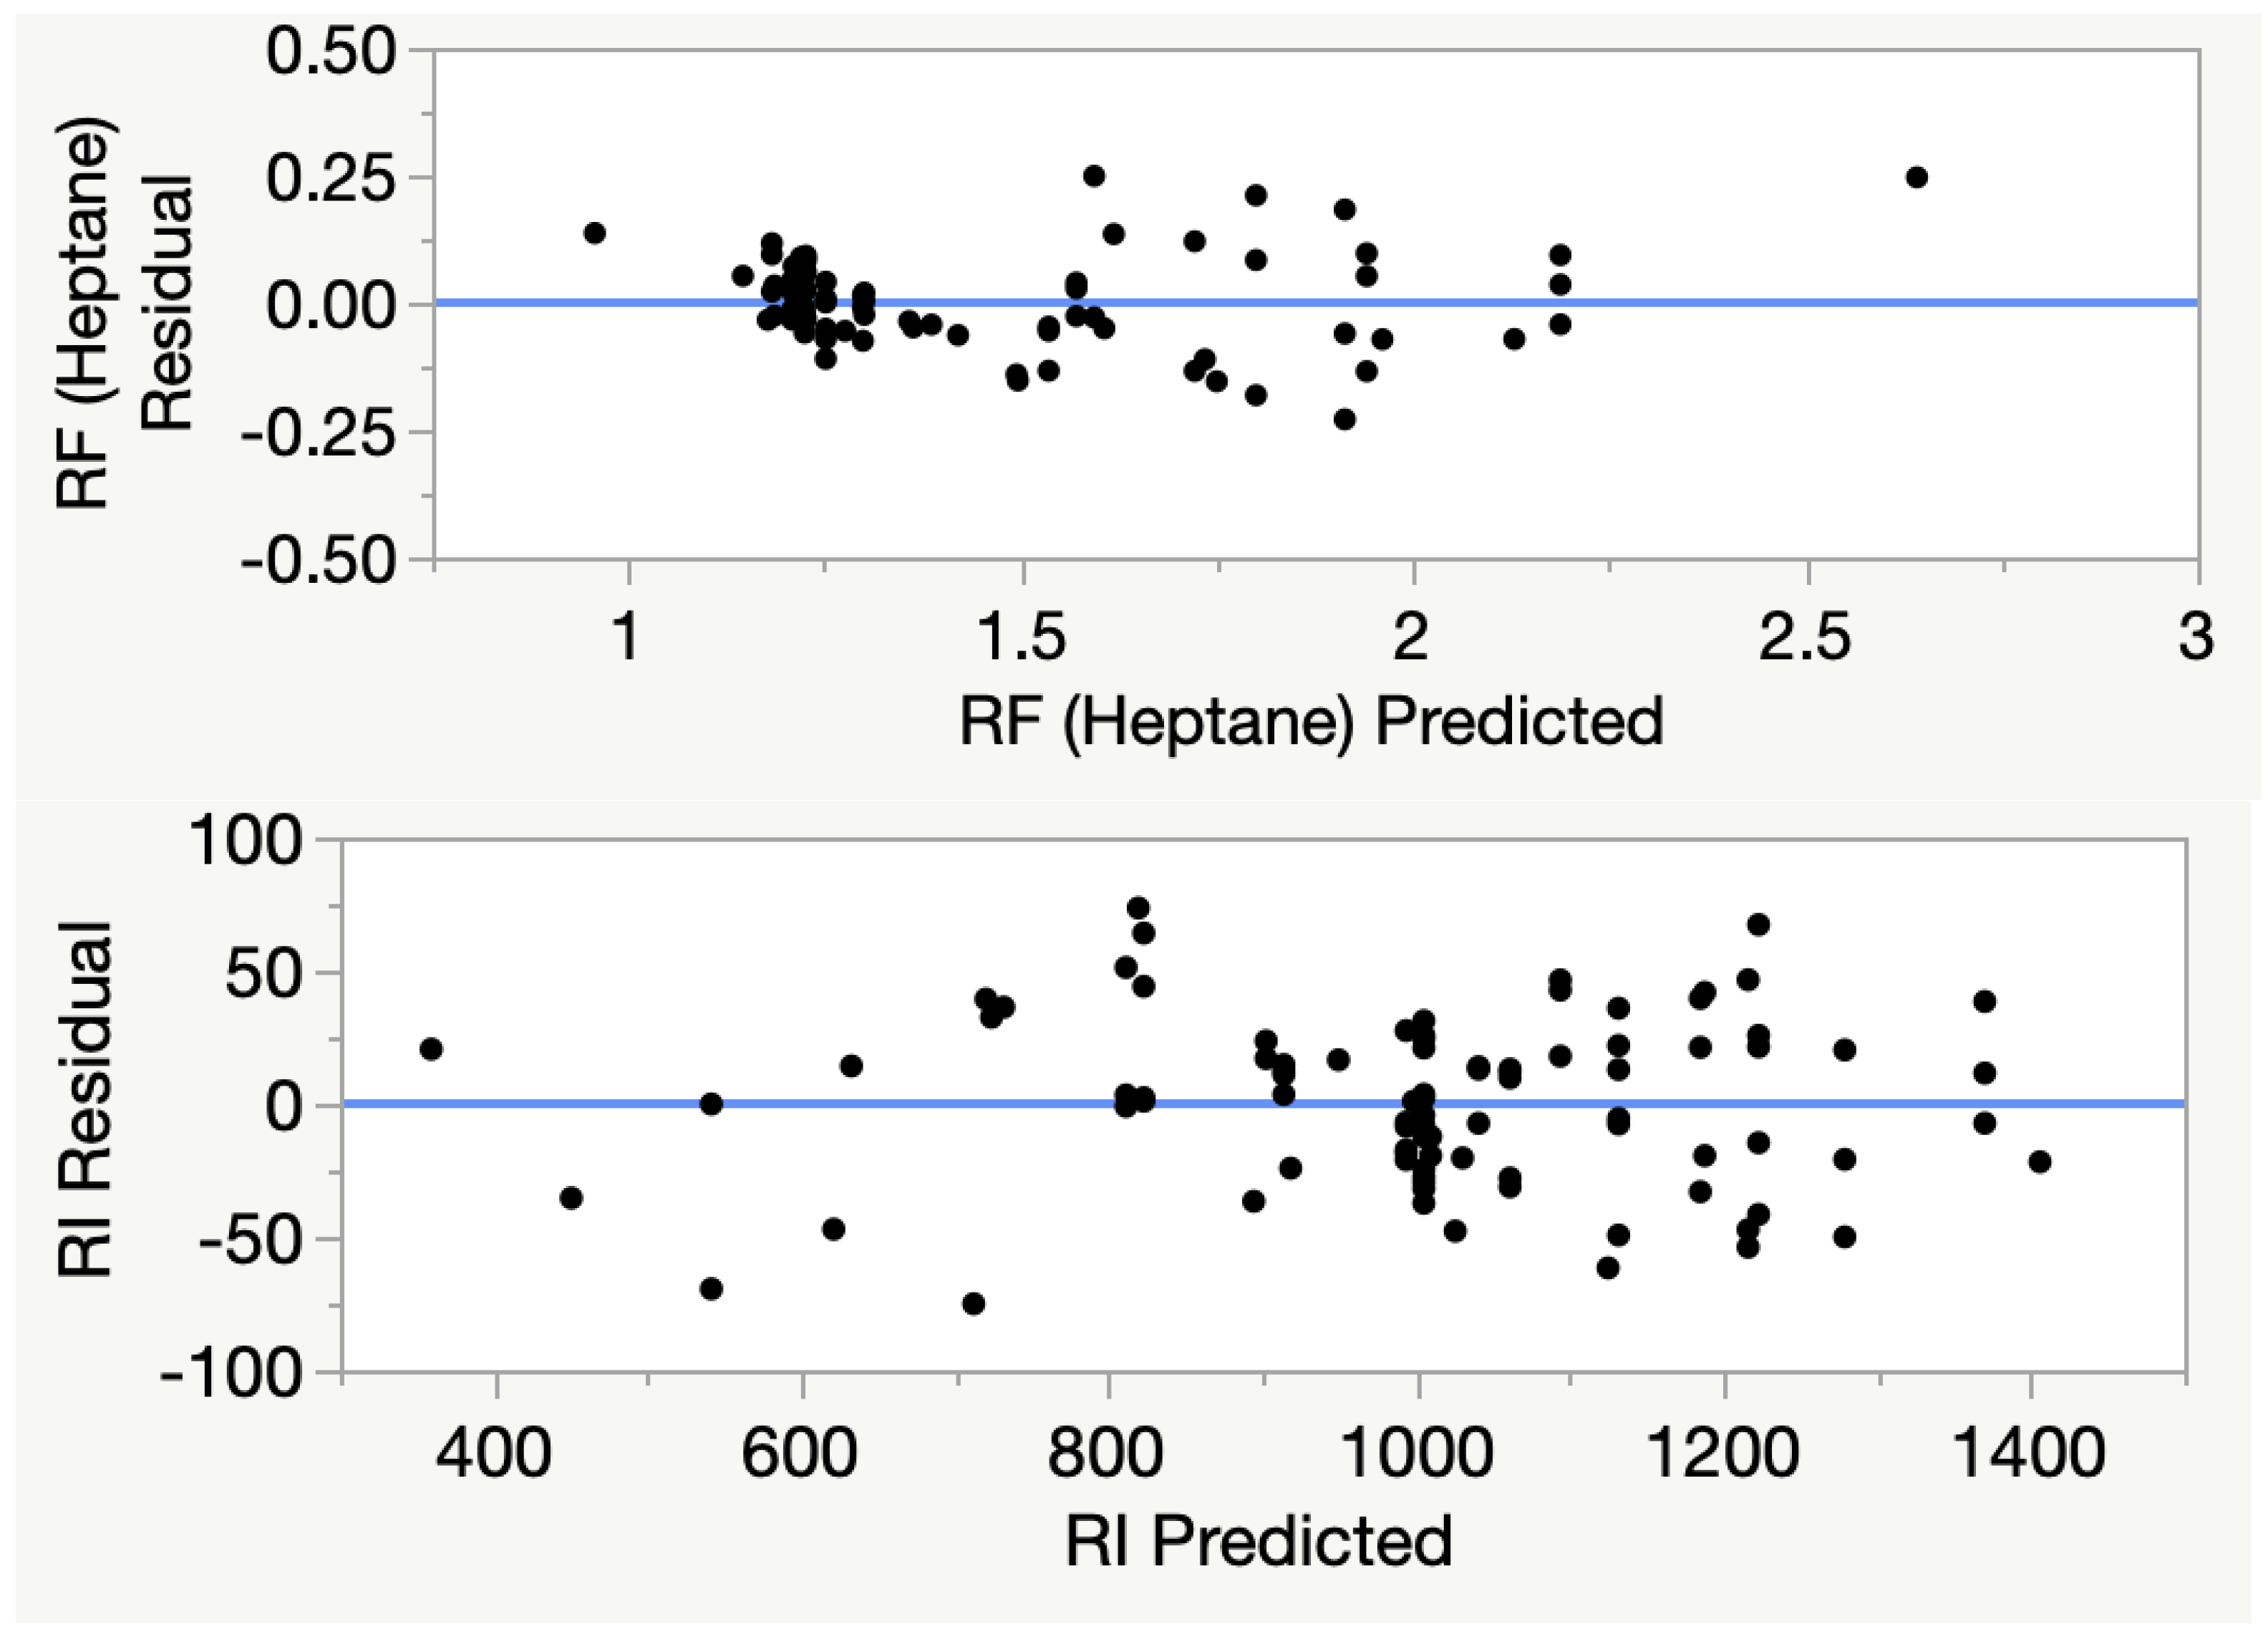
In statistics, the p-value is an evidence measure for the credibility of the null hypothesis, i.e., low p-values near zero indicate a strong influence of the variable. Consequently, all factors considered are significant for the description model. As shown in Table 5, the two-way interactions of C–H and C–O result in a significant improvement of the description model for the RF but not for the RI. For this reason, the interactions can be neglected for the RI. Residuals by predicted plot for the RF and RI are shown in Figure 2.
The accuracy target for an R2 of at least 0.90, comparable to Lučić et al. [21], is achieved for the RF (0.92) and is greatly exceeded for the RI (0.98). The experimental data (RI, RF and ti) are available in a table (Table S4) and in a CSV file in the Supplementary Materials.
3.2. Optimization for the Aromatic Oxygenates
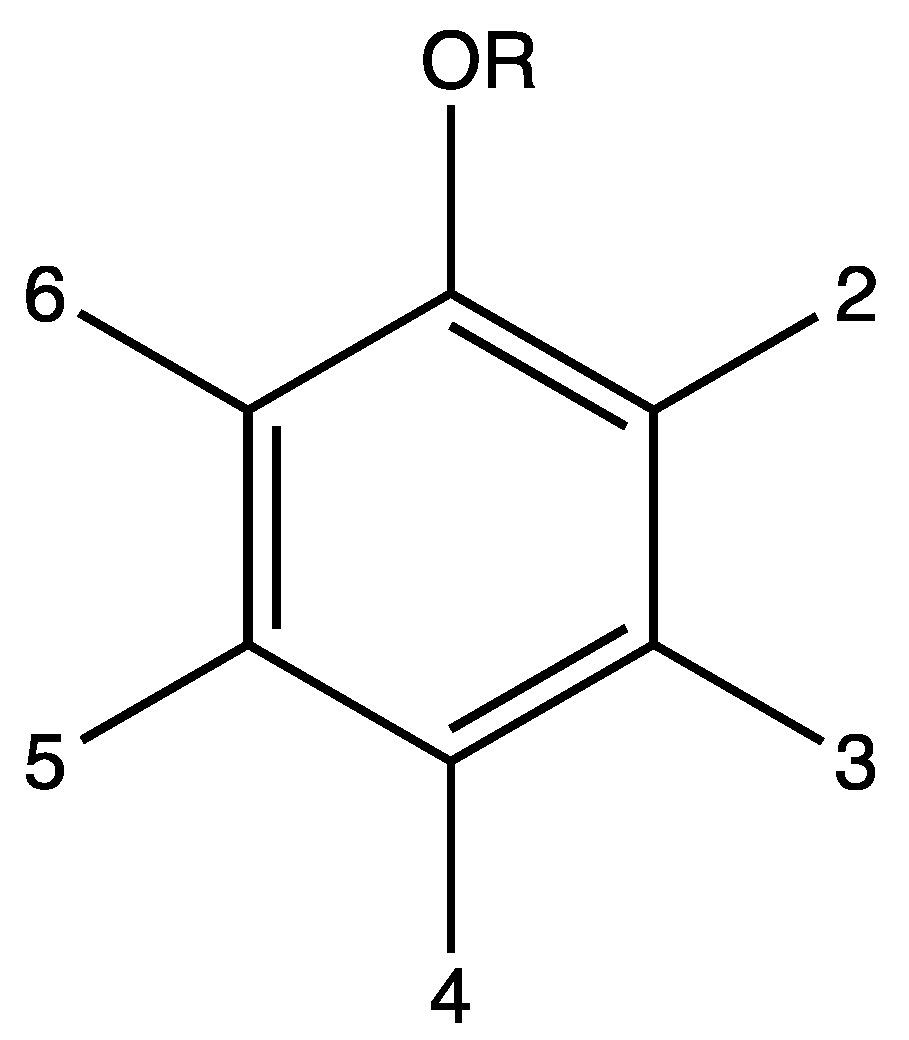
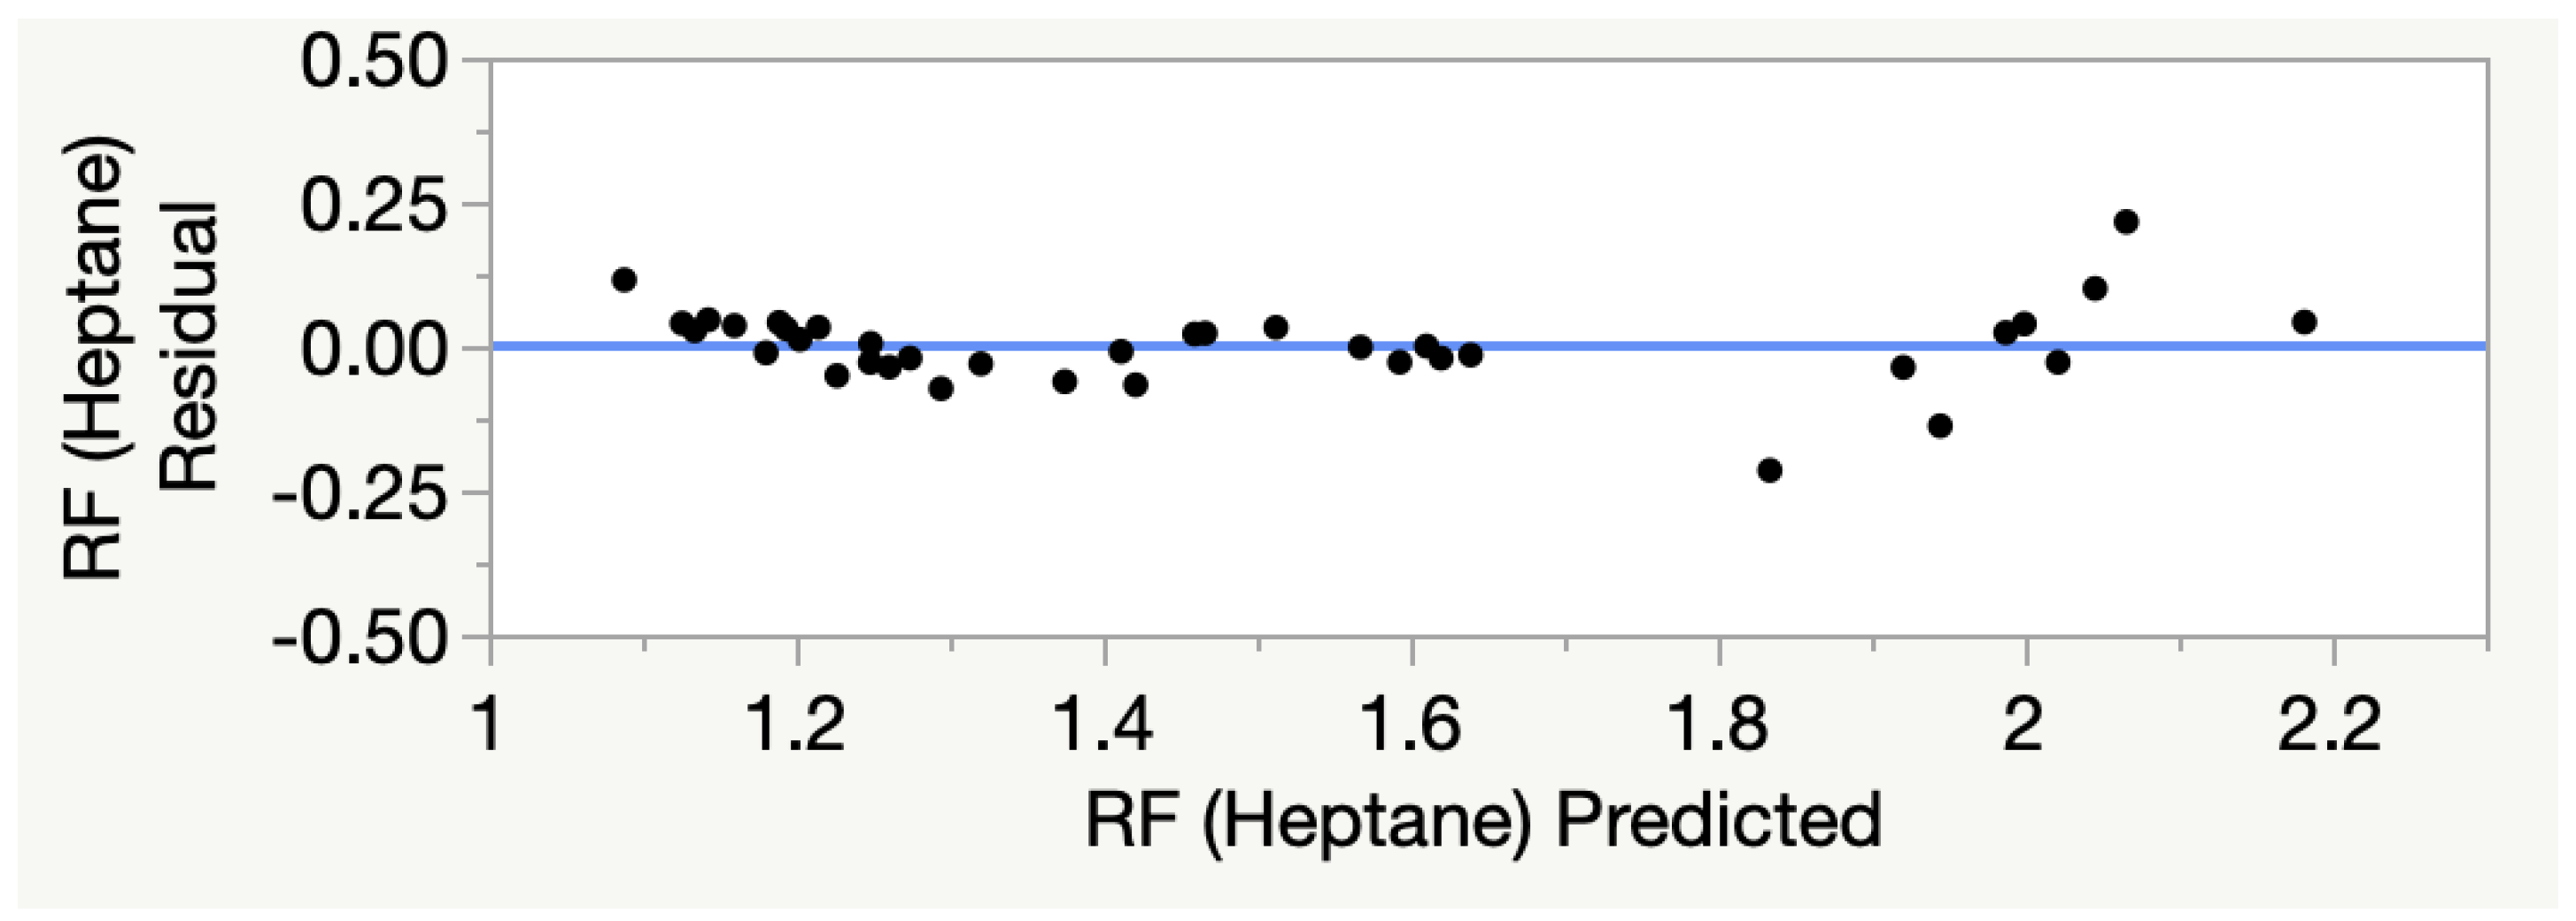
In addition to the general multilinear regression, which also considers cyclic and acyclic alcohols and ketones, an increment system was developed specifically for aromatic oxygenates. The structure of the increment system is based on the IUPAC nomenclature and is depicted in Figure 3. The advantage of this increment system is a higher prediction accuracy due to the consideration of constitutional isomers as demonstrated from the residuals by a predicted plot, which is shown in Figure 4.
Due to the IUPAC-based nomenclature, the hydroxyl and methoxy groups at positions 5 and 6 are not considered, as well as the methyl groups and hydrogen at position 1, because the position numbers would change. Table 6 provides the variables and the estimator for the RF. The RF itself can be calculated based on the structure of the following equation:
In general, hydroxyl and methoxy groups lead to an increase in the RF, as they result in a lower signal at the FID. Hydroxyl groups have a stronger influence than methoxy groups, which is explained by the higher bond dissociation energies of Ar–OH bonds (414 kJ/mol) compared to Ar–OMe bonds (356 kJ/mol) [4,35]. The former ones are more difficult to cleave. Furthermore, due to the structure-dependent low reaction rate of the reactions that form CHn compared to those that form CO or H2CO, a lower FID signal occurs. In contrast, methyl groups or even protons lead to a decrease in the RF, i.e., an increase in the signal at the FID [19].
Everything considered, the accuracy of the predictive model for the response factors of the substituted and aromatic oxygenated hydrocarbons is still high (R2 = 0.96), as illustrated in Figure 4.
3.3. Influence of the Method-Specific Factors by Design of the Experiments
The investigation of the method-specific factors influencing the response factors and response indices is carried out using the example of 2-methoxyphenol (guaiacol) and the principles of experimental design. Using a folded Plackett–Burman design [33,34], the main effects and interactions of nine parameters are determined in a screening experiment. In addition, two factors are used as control factors to determine the experimental variation. An overview of all experimental step sizes (+/−) is already listed in Table 2. For these experimental series, Table 7 shows the p-values and the influence of the investigated device parameters for the response factor and the retention index.
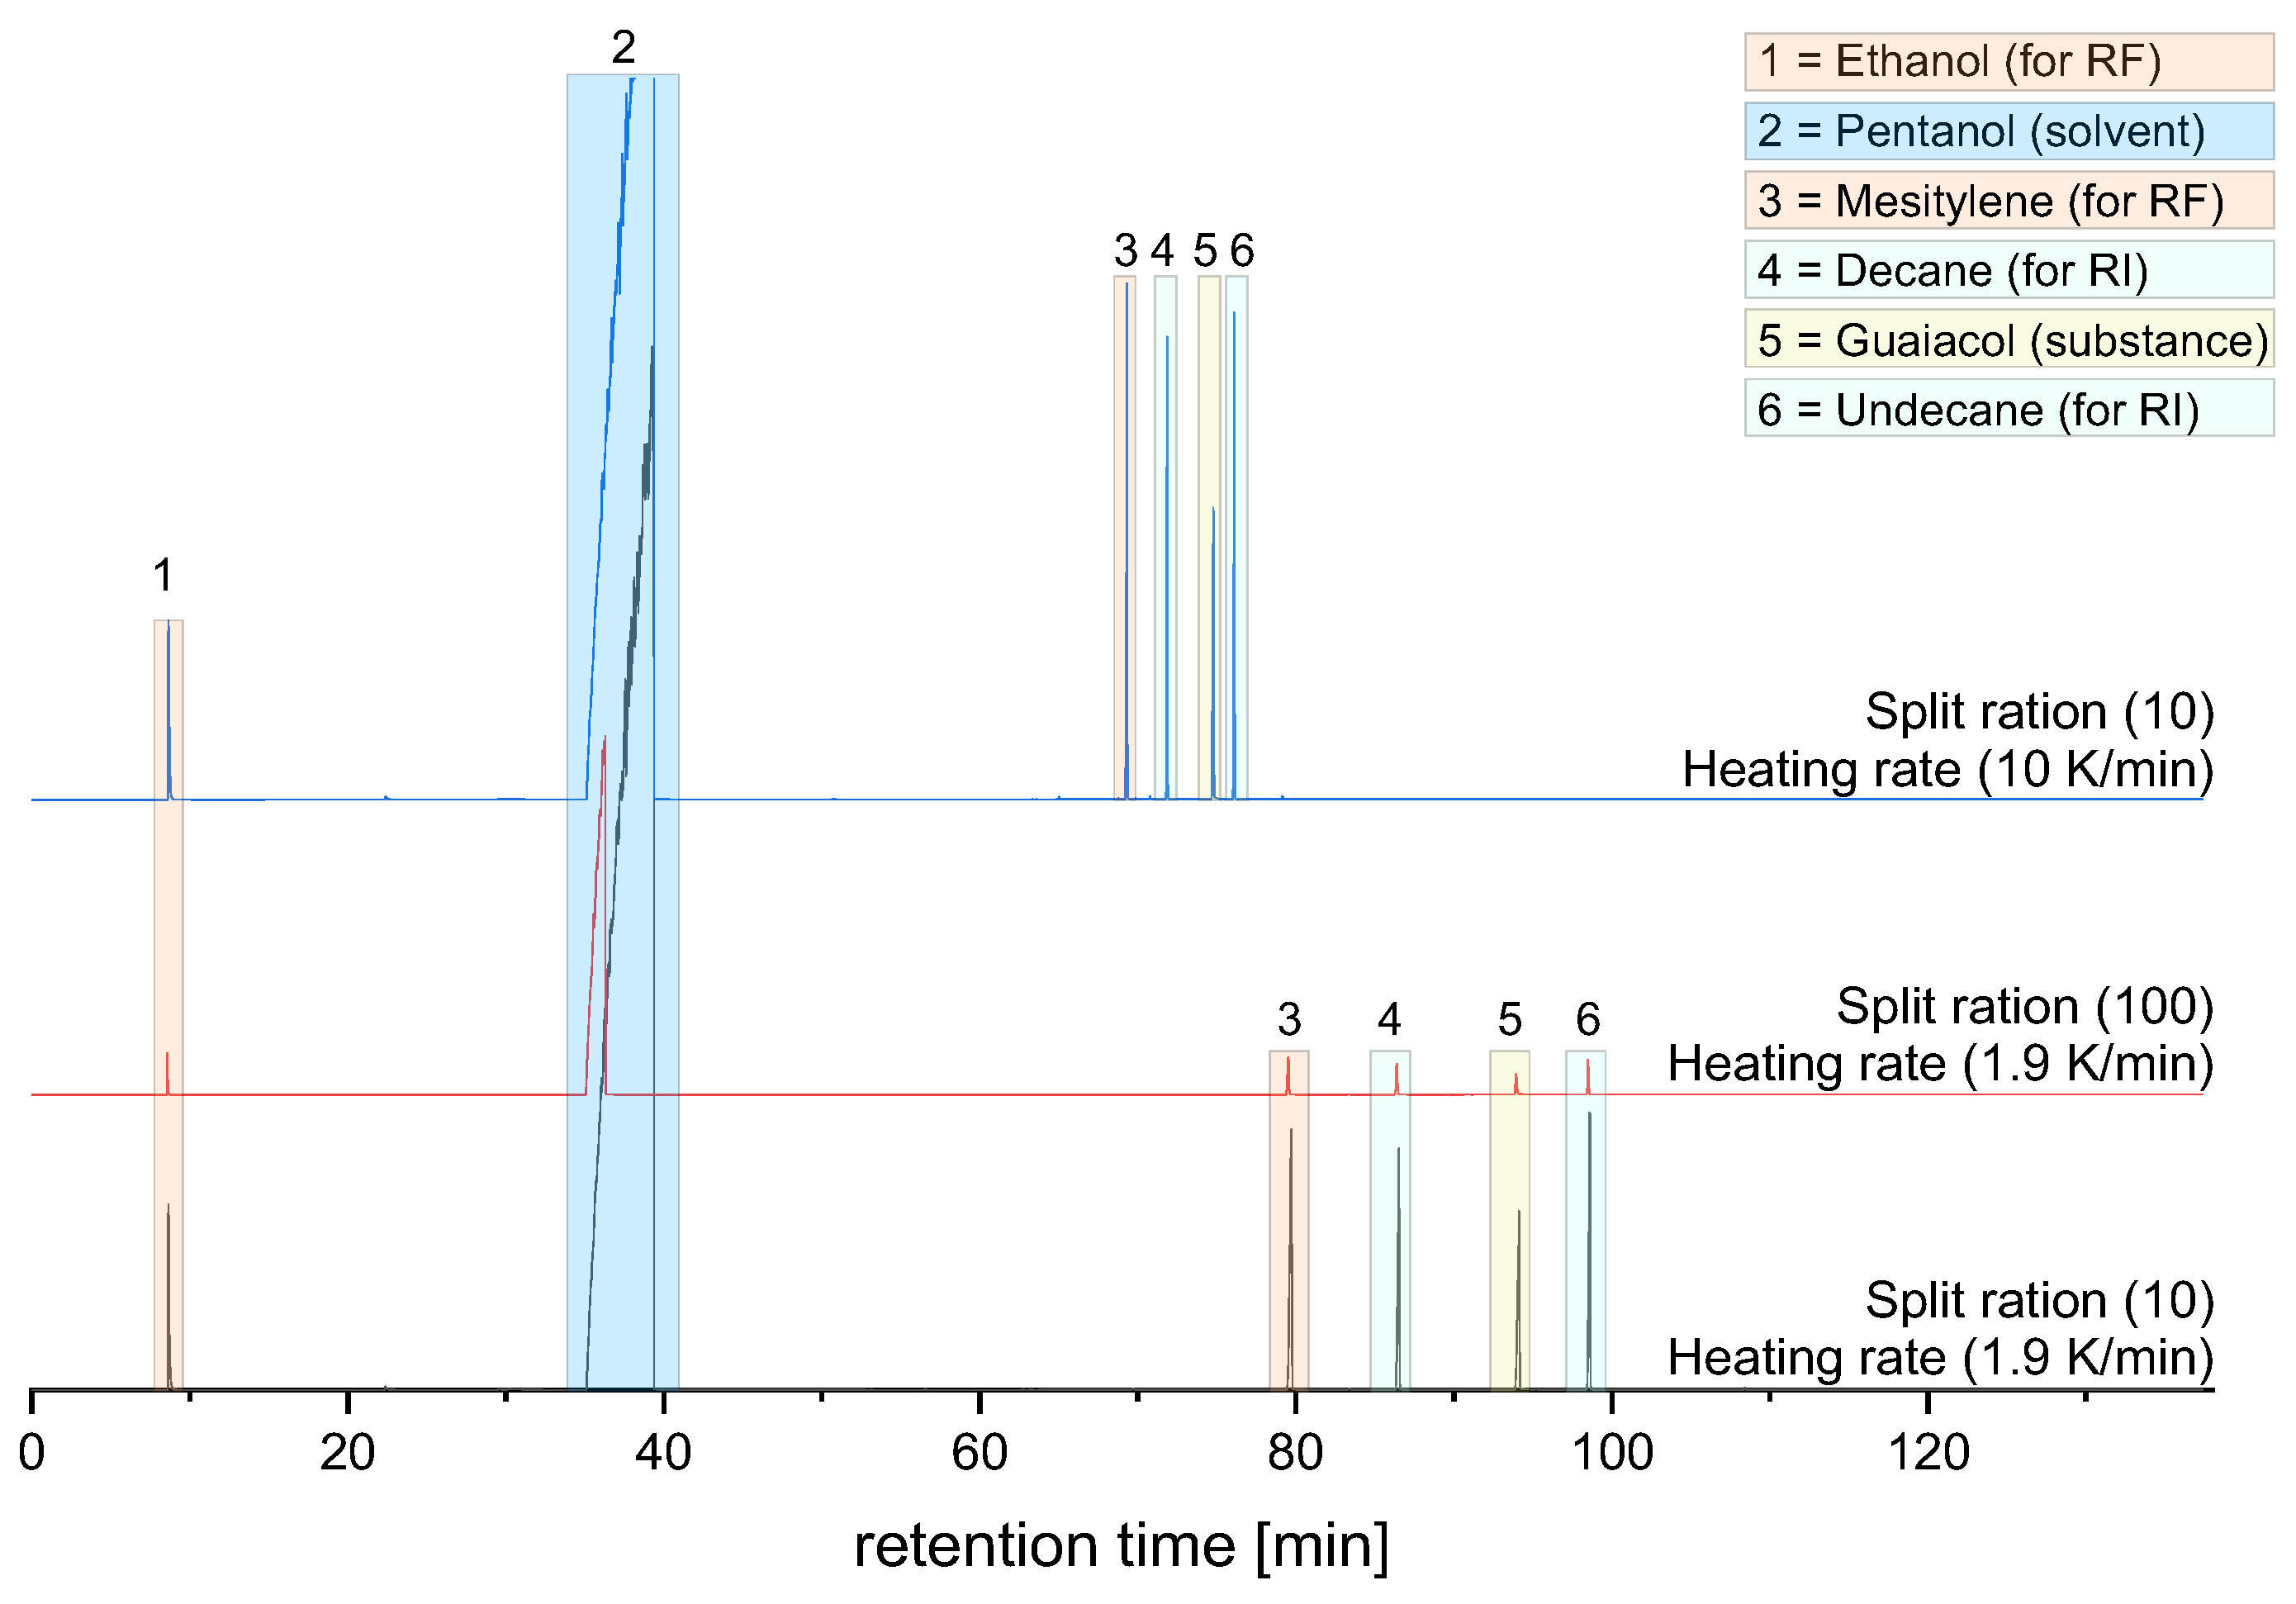
In statistics, the p-value is an evidence measure for the credibility of the null hypothesis, i.e., low p-values near zero indicate a strong influence of the variable. Consequently, due to the low p-value, only the factors “concentration of the substance” and “split ratio” are significant for the response factor, which is consistent with the literature [36,37,38,39]. However, their influence (estimate < 0.05) is negligible compared to those determined in the multilinear regression (see Table 5), which can be explained by technical improvements, e.g., the use of a wide-range FID [40]. For the retention index, the factors “concentration of substance”, “injection volume” and “temperature ramp” are more prominent. A larger amount of the substance leads to a peak broadening and, thus, to a slight shift of the signal to a higher retention time. The chromatograms of three exemplary runs, which are shown in Figure 5, illustrate the apparently high deviations. However, the total span of the variation is still low (estimate = 0.3). Based on Equation (2), a deviation of the retention time by 0.025 min results in a high concentration. Only the temperature profile has a considerable but small influence on the retention indices (estimate = 2.4). Based on the standard temperature profile, the deviation for both retention indices (1066.7 and 1069.1) is 0.298 min. Consequently, the response factors are stable for all device parameters in the investigated range. For the retention indices, it is recommended to use the proposed temperature profile; nevertheless, a variation also results in an acceptable accuracy (RI +2.4). However, it should be noted that a higher heating rate reduces the separation efficiency, which limits the minimum time for the GC analysis.
4. Conclusions
In this study, the response factors (RF) and retention indices (RI) are predicted for a variety of possible products that can be formed during the hydrodeoxygenation of phenolic model substances for bio-oils using a GC with a wide-range FID. A multilinear regression combined with a systematic selection of a minimum number of parameters based on structural properties results in a high degree of accuracy for the RFs and RIs (R2 ≥ 0.921 and 0.975). As aromatic oxygenated hydrocarbons are particularly important for studies on the conversion of lignocellulosic biomass, an increment system is developed, especially for phenols and methoxylated compounds. By considering the constitution, it is possible to improve the accuracy of the response factor prediction without complicated formulas and further tabulated constants (R2 ≥ 0.958). An experimental design confirms the almost negligible dependence ofthe RF and RI from device or method specific parameters, such as injection volume or carrier gas flow. Based on the described procedure and the experimental data, an extension to further substance groups, as well as the application to other analytical methods is possible. Everything considered, the work reduces the analytical effort for research in the field of bio-oil conversion towards new sustainable technologies by a robust procedure that is ready for application.
Supplementary Materials
The following supporting information can be downloaded at: https://www.mdpi.com/article/10.3390/data7090133/s1; Table S1: Additional materials and methods; Table S2: Backward regression; Table S3: Design of Experiments; Table S4: Database for response factors and retention indices; Table S5: Database of substances used for the calibration and their producers, including purity; database-csv.txt; PerkinElmer Methodefile.meth.
Author Contributions
Conceptualization, N.K.; methodology, N.K.; validation, N.K., M.S., O.B. and J.J.W.; formal analysis, N.K.; investigation, N.K.; resources, J.J.W.; data curation, N.K.; writing—original draft preparation, N.K.; writing—review and editing, M.S., O.B. and J.J.W.; visualization, N.K.; supervision, M.S., O.B. and J.J.W.; project administration, J.J.W.; funding acquisition, N.K. and J.J.W. All authors have read and agreed to the published version of the manuscript.
Funding
This research was funded by the German Federal Ministry for Education and Research (BMBF) by the joint project “ReCaLl” within the directive Client-II “International Partnerships for Sustainable Innovation” by FONA3 (funding code: 033R188A). The work of the first author was further funded by the Federal State of Saxony (Germany) through the Saxon State Scholarship Programme. The authors acknowledge Open Access Funding by the Publication Fund of the DFG and TU Dresden “OA Publikationskosten”.
Institutional Review Board Statement
Not applicable.
Informed Consent Statement
Not applicable.
Data Availability Statement
The data presented in this study are available in the Supplementary Materials. The raw data of the GC chromatograms can also be provided by the author upon reasonable request.
Conflicts of Interest
The authors declare no conflict of interest.
References
- Tekin, K.; Karagöz, S.; Bektaş, S. A review of hydrothermal biomass processing. Renew. Sustain. Energy Rev. 2014, 40, 673–687. [Google Scholar] [CrossRef]
- Li, X.; Chen, G.; Liu, C.; Ma, W.; Yan, B.; Zhang, J. Hydrodeoxygenation of lignin-derived bio-oil using molecular sieves supported metal catalysts: A critical review. Renew. Sustain. Energy Rev. 2017, 71, 296–308. [Google Scholar] [CrossRef]
- Chen, S.; Zhou, G.; Miao, C. Green and renewable bio-diesel produce from oil hydrodeoxygenation: Strategies for catalyst development and mechanism. Renew. Sustain. Energy Rev. 2019, 101, 568–589. [Google Scholar] [CrossRef]
- Ambursa, M.M.; Juan, J.C.; Yahaya, Y.; Taufiq-Yap, Y.H.; Lin, Y.C.; Lee, H.V. A Review on Catalytic Hydrodeoxygenation of Lignin to Transportation Fuels by Using Nickel-Based Catalysts; Elsevier: Amsterdam, The Netherlands, 2021; Volume 138, pp. 1–24. [Google Scholar]
- Sheldon, R.; Downing, R. Heterogeneous catalytic transformations for environmentally friendly production. Appl. Catal. A Gen. 1999, 189, 163–183. [Google Scholar] [CrossRef]
- Robinson, A.M.; Hensley, J.E.; Will Medlin, J. Bifunctional Catalysts for Upgrading of Biomass-Derived Oxygenates: A Review. ACS Catal. 2016, 6, 5026–5043. [Google Scholar] [CrossRef]
- Prabhudesai, V.S.; Gurrala, L.; Vinu, R. Catalytic Hydrodeoxygenation of Lignin-Derived Oxygenates: Catalysis, Mechanism, and Effect of Process Conditions. Energy Fuels 2022, 36, 1155–1188. [Google Scholar] [CrossRef]
- Qu, L.; Jiang, X.; Zhang, Z.; Zhang, X.; Song, G.; Wang, H.; Yuan, Y.; Chang, Y. A review of hydrodeoxygenation of bio-oil: Model compounds, catalysts, and equipment. Green Chem. 2021, 23, 1–7. [Google Scholar] [CrossRef]
- de Saint Laumer, J.-Y.; Leocata, S.; Tissot, E.; Baroux, L.; Kampf, D.M.; Merle, P.; Boschung, A.; Seyfried, M.; Chaintreau, A. Prediction of response factors for gas chromatography with flame ionization detection: Algorithm improvement, extension to silylated compounds, and application to the quantification of metabolites. J. Sep. Sci. 2015, 38, 3209–3217. [Google Scholar] [CrossRef]
- de Saint Laumer, J.-Y.; Cicchetti, E.; Merle, P.; Egger, J.; Chaintreau, A. Quantification in Gas Chromatography: Prediction of Flame Ionization Detector Response Factors from Combustion Enthalpies and Molecular Structures. Anal. Chem. 2010, 82, 6457–6462. [Google Scholar] [CrossRef]
- ASTM Standard D 6729-14; Standard Test Method for Determination of Indiviual Components in Spark Ignition Engine Fuels by 100 Metre Capillary High Resolution Gas Chromatography. ASTM International: West Conshohocken, PA, USA, 2014. [CrossRef]
- ASTM Standard D 6730-01; Standard Test Method for Determination of Individual Components in Spark Ignition Engine Fuels by 100 Meter Capillary (with Precolumn) High Resolution Gas Chromatography. ASTM International: West Conshohocken, PA, USA, 1999. [CrossRef]
- ASTM Standard D6733-01; Standard Test Method for Determination of Individual Components in Spark Ignition Engine Fuels by 50 Meter Capillary High Resolution Gas Chromatography. ASTM International: West Conshohocken, PA, USA, 1999. [CrossRef]
- Kováts, E. Gas-chromatographische Charakterisierung organischer Verbindungen. Teil 1: Retentionsindices aliphatischer Halogenide, Alkohole, Aldehyde und Ketone. Helv. Chim. Acta 1958, 41, 1915–1932. [Google Scholar] [CrossRef]
- Tranchida, P.Q.; Mondello, L. Detectors and basic data analysis. In Basic Multidimensional Gas Chromatography; Snow, N.H., Ed.; Elsevier: London, UK, 2020; pp. 205–227. ISBN 9780128137451. [Google Scholar]
- Costa, R.; d’Acampora Zellner, B.; Crupi, M.L.; de Fina, M.R.; Valentino, M.R.; Dugo, P.; Dugo, G.; Mondello, L. GC–MS, GC–O and enantio–GC investigation of the essential oil of Tarchonanthus camphoratus L. Flavour Fragr. J. 2008, 23, 40–48. [Google Scholar] [CrossRef]
- Ziegler, J.G.; Nichols, N.B. Optimum Settings for Automatic Controllers. Trans. Am. Soc. Mech. Eng. 1942, 64, 759–765. [Google Scholar] [CrossRef]
- Calcote, H.F. Ion production and recombination in flames. Symp. Int. Combust. 1961, 8, 184–199. [Google Scholar] [CrossRef]
- Gardner, M.P.; Vinckier, C.; Bayes, K.D. Identification of the primary chemi-ion in hydrocarbon oxidations. Chem. Phys. Lett. 1975, 31, 318–320. [Google Scholar] [CrossRef]
- Jalali-Heravi, M.; Fatemi, M.H. Prediction of flame ionization detector response factors using an artificial neural network. J. Chromatogr. A 1998, 825, 161–169. [Google Scholar] [CrossRef]
- Lučić, B.; Trinajstić, N.; Sild, S.; Karelson, M.; Katritzky, A.R. A new efficient approach for variable selection based on multiregression: Prediction of gas chromatographic retention times and response factors. J. Chem. Inf. Comput. Sci. 1999, 39, 610–621. [Google Scholar] [CrossRef]
- Tissot, E.; Rochat, S.; Debonneville, C.; Chaintreau, A. Rapid GC-FID quantification technique without authentic samples using predicted response factors. Flavour Fragr. J. 2012, 27, 290–296. [Google Scholar] [CrossRef]
- Venkatesan, K.; Krishna, J.V.; Anjana, S.; Selvam, P.; Vinu, R. Hydrodeoxygenation kinetics of syringol, guaiacol and phenol over H-ZSM-5. Catal. Commun. 2021, 148, 106164. [Google Scholar] [CrossRef]
- Chen, C.; Zhou, M.; Liu, P.; Sharma, B.K.; Jiang, J. Flexible NiCo-based catalyst for direct hydrodeoxygenation of guaiacol to cyclohexanol. New J. Chem. 2020, 44, 18906–18916. [Google Scholar] [CrossRef]
- García-Minguillán, A.M.; Briones, L.; Serrano, D.P.; Botas, J.A.; Escola, J.M. Shifting Pathways in the Phenol/2-Propanol Conversion over the Tandem Raney Ni + ZSM-5 Catalytic System. Ind. Eng. Chem. Res. 2020, 59, 3375–3382. [Google Scholar] [CrossRef]
- Zhou, H.; Wang, H.; Perras, F.A.; Naik, P.; Pruski, M.; Sadow, A.D.; Slowing, I.I. Two-step conversion of Kraft lignin to nylon precursors under mild conditions. Green Chem. 2020, 22, 4676–4682. [Google Scholar] [CrossRef]
- Inocêncio, C.V.; de Souza, P.M.; Rabelo-Neto, R.C.; Da Silva, V.T.; Noronha, F.B. A systematic study of the synthesis of transition metal phosphides and their activity for hydrodeoxygenation of phenol. Catal. Today 2020, 381, 133–142. [Google Scholar] [CrossRef]
- Shumeiko, B.; Kubička, D. Semi-Batch Hydrotreatment of Lignin-Derived Phenolic Compounds over Raney-Ni with a Continuous Regeneration of the H-Donor Solvent. ChemSusChem 2022, 15, e202102099. [Google Scholar] [CrossRef] [PubMed]
- PAC AC Analytical Controls. DHA-Handbook AC DHA Analyzer; PAC AC Analytical Controls: Rotterdam, The Netherlands, 1994. [Google Scholar]
- Subramanian, S.; Ganapathiraju, M.K. Antibody Exchange: Information extraction of biological antibody donation and a web-portal to find donors and seekers. Data 2017, 2, 38. [Google Scholar] [CrossRef] [PubMed]
- Berrar, D. Cross-Validation. In Encyclopedia of Bioinformatics and Computational Biology; Elsevier: Amsterdam, The Netherlands, 2019; pp. 542–545. ISBN 9780128114322. [Google Scholar]
- ASTM Standard D 4626-94; Standard Practice for Calculation of Gas Chromatographic Response Factors 1. ASTM International: West Conshohocken, PA, USA, 2015. [CrossRef]
- Plackett, R.L.; Burman, J.P. The Design of Optimum Multifactorial Experiments. Biometrika 1946, 33, 305–325. [Google Scholar] [CrossRef]
- Siebertz, K.; van Bebber, D.; Hochkirchen, T. Statistische Versuchsplanung, 2nd ed.; Springer: Berlin/Heidelberg, Germany, 2017; ISBN 978-3-662-55742-6. [Google Scholar]
- Furimsky, E. Catalytic hydrodeoxygenation. Appl. Catal. A Gen. 2000, 199, 147–190. [Google Scholar] [CrossRef]
- Cicchetti, E.; Merle, P.; Chaintreau, A. Quantitation in gas chromatography: Usual practices and performances of a response factor database. Flavour Fragr. J. 2008, 23, 450–459. [Google Scholar] [CrossRef]
- El-Naggar, A. Factors Affecting Linearity and Response of Flame Ionization Detector. Pet. Sci. Technol. 2006, 24, 41–50. [Google Scholar] [CrossRef]
- Kállai, M.; Máté, V.; Balla, J. Effects of experimental conditions on the determination of the effective carbon number. Chromatographia 2003, 57, 639–644. [Google Scholar] [CrossRef]
- Blanco, C.G.; Canga, J.S.; Domínguez, A.; Iglesias, M.J.; Guillén, M.D. Flame ionization detection relative response factors of some polycyclic aromatic compounds. Determination of the main components of the coal tar pitch volatile fraction. J. Chromatogr. A 1992, 607, 295–302. [Google Scholar] [CrossRef]
- Hassan, H.; Othman, M.F.; Zakaria, Z.A.; Ahmad Saad, F.F.; Abdul Razak, H.R. Assessing the influence of neglected GC-FID variables on the multiple responses using multivariate optimization for the determination of ethanol and acetonitrile in radiopharmaceuticals. SN Appl. Sci. 2021, 3, 251. [Google Scholar] [CrossRef]
Figure 1.
Comparison of the temperature profiles of the different ASTM standards for the detailed hydrocarbon analysis (DHA) method, including the applied method [11,12,13].

Figure 2.
Residuals by predicted plot for the response factors (RF) (top; R2 = 0.921) and retention indices (RI) (bottom; R2 = 0.975). Each of the dots represents an investigated substance and its deviation from the prediction model.
Figure 2.
Residuals by predicted plot for the response factors (RF) (top; R2 = 0.921) and retention indices (RI) (bottom; R2 = 0.975). Each of the dots represents an investigated substance and its deviation from the prediction model.

Figure 3.
Schematic representation of the positions for modeling of aromatic oxygenates, with R = H or Me.
Figure 3.
Schematic representation of the positions for modeling of aromatic oxygenates, with R = H or Me.

Figure 4.
Residuals by a predicted plot for the response factors (RF) (R2 = 0.958) for aromatic oxygenated hydrocarbons. Each of the dots represents an investigated substance and its deviation from the prediction model.
Figure 4.
Residuals by a predicted plot for the response factors (RF) (R2 = 0.958) for aromatic oxygenated hydrocarbons. Each of the dots represents an investigated substance and its deviation from the prediction model.

Figure 5.
Comparison of three different chromatograms for the Design of Experiments with obviously different shapes. The chromatograms differ in their temperature profiles at the last heating rate and in the split. Nevertheless, similar response factors (RFs) and retention indices (RIs) are obtained. Ethanol and mesitylene are used for the determination of the RFs of the model substances guaiacol, decane and undecane for the determination of the RIs. Pentanol serves as a solvent.


Table 1.
Overview of the temperature profile used for the analysis.
| Step | Temperature | Heating Rate | Dwell | |
|---|---|---|---|---|
| Starting [°C] | Final [°C] | [K/min] | [min] | |
| 1 | 35 | 35 | 0 | 13 |
| 2 | 35 | 45 | 10 | 15 |
| 3 | 45 | 60 | 1 | 15 |
| 4 | 60 | 200 | 1.9 | 120 |
Table 2.
Assignment of the examined factors and definition of the level settings + and −.
| Abbr. | Parameter | Level “−” | Level “+” |
|---|---|---|---|
| A | Concentration of the substance | 10 mg/mL | 20 mg/mL |
| B | Reference to substance ratio | 1 | 2 |
| C | Control | - | - |
| D | Control | - | - |
| E | Injection volume | 0.1 µL | 0.2 µL |
| F | Split ratio | 100 | 10 |
| G | Hydrogen flow | 34.5 mL/min | 30.0 mL/min |
| H | Synthetic air flow | 400 mL/min | 350 mL/min |
| I | Temperature ramp | last ramp 1.9 K/min | last ramp 10 K/min |
| J | Detector temperature | 250 °C | 225 °C |
| K | Injector temperature | 290 °C | 250 °C |
The original experimental design, which consists of 12 experiments, was extended by an additional 12 experiments with an inversion of the steps to separate the main effects from the double interactions. The result is a folded experimental design, which extends the resolution level from III to IV [34]. A detailed overview of the experimental plan is attached as Table S2.
Table 3.
Retention times of the components of the DHA-paraffin standard.
| Substance | CAS-Number | Retention Time [min] |
|---|---|---|
| Pentane | 109-66-0 | 10.097 ± 0.000 |
| Hexane | 110-54-3 | 15.197 ± 0.002 |
| Heptane | 142-82-5 | 25.842 ± 0.015 |
| Octane | 111-65-9 | 44.755 ± 0.015 |
| Nonane | 111-84-2 | 69.842 ± 0.011 |
| Decane | 124-18-5 | 86.627 ± 0.011 |
| Undecane | 1120-21-4 | 98.752 ± 0.013 |
| Dodecane | 112-40-3 | 108.677 ± 0.015 |
| Tridecane | 629-50-5 | 117.348 ± 0.012 |
| Tetradecane | 629-59-4 | 125.219 ± 0.012 |
| Pentadecane | 629-62-9 | 132.506 ± 0.009 |
Table 4.
Comparison of (a) the experimentally determined response factors (RFs) with (b) the calculated RFs from this study and (c) the calculations from the reported DHA method.
Table 4.
Comparison of (a) the experimentally determined response factors (RFs) with (b) the calculated RFs from this study and (c) the calculations from the reported DHA method.
| Compound | RFmeasured | RFthis study | RFDHA |
|---|---|---|---|
| Methanol | 2.8888 | 2.6713 | 1.1207 |
| Phenol | 1.3541 | 1.5104 | 0.9095 |
| Cyclohexanol | 1.2755 | 1.2070 | 0.9799 |
Table 5.
Parameter estimates for the modeling of the response factor (R2 = 0.921) and the retention index (R2 = 0.975). A = alcohols; B = phenols; C = else (aldehyde, ketone, ether, etc.).
Table 5.
Parameter estimates for the modeling of the response factor (R2 = 0.921) and the retention index (R2 = 0.975). A = alcohols; B = phenols; C = else (aldehyde, ketone, ether, etc.).
| Dependencies on Elementary Composition | ||||
| Source | Response Factor (RF) | Retention Index (RI) | ||
| p-Value | Estimate | p-Value | Estimate | |
| Intercept | - | 1.0719 | - | 117.796 |
| C | 0.0104 | −0.0353 | 0.0000 | 99.049 |
| H | 0.0260 | −0.0142 | 0.0576 | −4.160 |
| O | 0.0000 | 0.4318 | 0.0000 | 84.043 |
| Dependencies on Functional Groups | ||||
| Source | p-Value | Estimate | p-Value | Estimate |
| Hydroxy groups | 0.0001 | 0.2063 | 0.0000 | 157.068 |
| Categorical(A/B/C) | 0.0028 | A = −0.0729 B = −0.0553 C = 0.1282 | 0.0000 | A = −80.404 B = 23.134 C = 57.270 |
| Two-Way Interactions C-H and C-O | ||||
| Source | p-Value | Estimate | p-Value | Estimate |
| (C-7.0808)·(H-11.374) | 0.0000 | 0.0264 | Not necessary | |
| (C-7.0808)·(O-1.2828) | 0.0554 | −0.0510 | ||
The presence of many of the examined functional groups, such as aldehydes, ketones, ethers and alkyl groups, can be neglected because the molecular formulas and their interactions indirectly describe these factors. The same applies for the substance-specific properties, such as melting or boiling points. Finally, besides the chemical formula, only the number of hydroxyls and the distinction into alcoholic or phenolic groups are decisive for the accuracy of the model predictions.
Table 6.
Parameter estimates for modeling of the response factor of aromatic oxygenated hydrocarbons (R2 = 0.958).
Table 6.
Parameter estimates for modeling of the response factor of aromatic oxygenated hydrocarbons (R2 = 0.958).
| Source | OH | OMe | Me | H |
|---|---|---|---|---|
| Position 1 | 0.0633 | −0.0633 | - | - |
| Position 2 | 0.4540 | 0.0475 | −0.3309 | −0.1705 |
| Position 3 | 0.4300 | 0.1010 | −0.3158 | −0.2150 |
| Position 4 | 0.5007 | 0.0654 | −0.3061 | −0.2600 |
| Position 5 | - | - | −0.0358 | 0.0358 |
| Position 6 | - | - | −0.0170 | 0.0170 |
| Intercept | 1.9507 | |||
Table 7.
Parameter estimates for the folded Plackett–Burman design to quantify the impact of the method parameters for GC analysis with FID.
Table 7.
Parameter estimates for the folded Plackett–Burman design to quantify the impact of the method parameters for GC analysis with FID.
| Source | Response Factor (RF) | Retention Index (RI) | ||
|---|---|---|---|---|
| p-Value | Estimate | p-Value | Estimate | |
| Intercept | - | 1.452 | - | 1066.7 |
| Concentration of substance | 0.0157 | 0.033 | 0.0022 | 0.1 |
| Reference to substance ratio | 0.1782 | 0.018 | 0.8619 | 0.0 |
| Control | 0.3051 | 0.014 | 0.2048 | −0.1 |
| Control | 0.9833 | 0.000 | 0.9997 | 0.0 |
| Injection vol. | 0.7100 | 0.005 | 0.0008 | 0.2 |
| Split ratio | 0.0090 | −0.036 | 0.0000 | 0.4 |
| Hydrogen flow | 0.2425 | 0.015 | 0.4433 | 0.0 |
| Syn. air flow | 0.2334 | 0.016 | 0.1805 | 0.1 |
| Temp. ramp | 0.6384 | 0.006 | 0.0000 | 2.4 |
| Detector temp. | 0.2090 | 0.017 | 0.8356 | 0.0 |
| Injector temp. | 0.2777 | 0.014 | 0.9963 | 0.0 |
Publisher’s Note: MDPI stays neutral with regard to jurisdictional claims in published maps and institutional affiliations. |
© 2022 by the authors. Licensee MDPI, Basel, Switzerland. This article is an open access article distributed under the terms and conditions of the Creative Commons Attribution (CC BY) license (https://creativecommons.org/licenses/by/4.0/).
Share and Cite
MDPI and ACS Style
Kretzschmar, N.; Seifert, M.; Busse, O.; Weigand, J.J. Prediction of Retention Indices and Response Factors of Oxygenates for GC-FID by Multilinear Regression. Data 2022, 7, 133. https://doi.org/10.3390/data7090133
AMA Style
Kretzschmar N, Seifert M, Busse O, Weigand JJ. Prediction of Retention Indices and Response Factors of Oxygenates for GC-FID by Multilinear Regression. Data. 2022; 7(9):133. https://doi.org/10.3390/data7090133
Chicago/Turabian StyleKretzschmar, Nils, Markus Seifert, Oliver Busse, and Jan J. Weigand. 2022. "Prediction of Retention Indices and Response Factors of Oxygenates for GC-FID by Multilinear Regression" Data 7, no. 9: 133. https://doi.org/10.3390/data7090133