
Formation of Dataset for Fuzzy Quantitative Risk Assessment of LNG Bunkering SIMOPs


Australian Maritime College (AMC), College of Sciences and Engineering, University of Tasmania, Launceston, TAS 7248, Australia
*
Author to whom correspondence should be addressed.
Data 2022, 7(5), 60; https://doi.org/10.3390/data7050060
Submission received: 24 April 2022
/
Revised: 3 May 2022
/
Accepted: 6 May 2022
/
Published: 8 May 2022
Abstract
:New international regulations aimed at decarbonizing maritime transportation are positively contributing to attention being paid to the use of liquefied natural gas (LNG) as a ship fuel. Scaling up LNG-fueled ships is highly dependent on safe bunkering operations, particularly during simultaneous operations (SIMOPs); therefore, performing a quantitative risk assessment (QRA) is either mandated or highly recommended, and a dynamic quantitative risk assessment (DQRA) has been developed to make up for the deficiencies of the traditional QRA. The QRA and DQRA are both data-driven processes, and so far, the data of occurrence rates (ORs) of basic events (BEs) in LNG bunkering SIMOPs are unavailable. To fill this gap, this study identified a total of 41 BEs and employed the online questionnaire method, the fuzzy set theory, and the Onisawa function to the investigation of the fuzzy ORs for the identified BEs. Purposive sampling was applied when selecting experts in the process of online data collection. The closed-ended structured questionnaire garnered responses from 137 experts from the industry and academia. The questionnaire, the raw data and obtained ORs, and the process of data analysis are presented in this data descriptor. The obtained data can be used directly in QRAs and DQRAs. This dataset is first of its kind and could be expanded further for research in the field of risk assessment of LNG bunkering.
Dataset License: CC-BY.
1. Introduction
Maritime shipping, which represents 80–90% of international trade, is less carbon intensive than other forms of transport [1]; however, due to the large volumes of freight and long distances travelled, maritime shipping is responsible for about 3% of total global anthropogenic greenhouse gas (GHG) emissions on a carbon dioxide equivalent basis [2]. In recent times, the maritime industry has increased its efforts against global GHG emissions. The International Maritime Organization (IMO) has set the target to cut the carbon intensity of all ships by at least 40% by 2030, and to reduce total GHG emissions from global shipping by 50% (compared to 2008 levels) by 2050 [3]. Further stringent requirements are expected from the climate change agenda of the IMO’s Marine Environment Protection Committee (MEPC), upon release of the Intergovernmental Panel on Climate Change (IPCC) report after the 26th UN Climate Change Conference (COP 26) in Glasgow [4]; therefore, the need to switch to low-carbon or zero-carbon alternative fuels seems urgent for the maritime industry [5,6]. Given that zero-emission fuels, with the relevant technologies, such as green hydrogen, green ammonia, and green methanol, are premature and might be introduced after 2028 [7,8], liquified natural gas (LNG) is considered to be a suitable practicable transition option to address GHG emission reduction because of its low-carbon nature, availability, proven technology, and affordability [9,10,11,12]. Currently, the demand for using LNG as a ship fuel is growing. According to the society for gas, as a marine fuel (SGMF), about 240 LNG-fueled ships were ordered in 2021, which is more than all the LNG-fueled ships ordered in the past four years worldwide [13]. Moreover, at the time of writing, in early 2022, this trend does not seem to be slowing down [14]; for example, data showed a record 48% share of all shipbuilding orders in the first quarter of 2022 were LNG-fueled (excluding LNG carriers) [15]. From a long-term perspective, some researchers concluded that utilizing carbon-neutral liquefied biomethane (bio-LNG) and green hydrogen-based LNG (synthetic LNG or e-LNG) as drop-in solutions will expand the use of LNG as a ship fuel even after the aforementioned zero-emission fuels become available [14,16,17,18,19,20,21], this ensures that LNG-fueled ships are future-proof assets.
The availability of LNG bunkering is key to the uptake of LNG as a marine fuel. LNG bunkering modes could be ship-to-ship, truck-to-ship, or onshore station-to-ship. In recent years, more LNG bunkering infrastructures are emerging worldwide, and specifically at bunkering ports such as Singapore and Rotterdam [13]. As of February 2022, a total of 98 ports have had the ability to supply LNG bunker fuel, and there are 35 LNG bunkering ships in operation, with a further 24 ships on order [13]. To minimize the port stay for ships, it is recommended that LNG bunkering and the associated operations (such as cargo operations, port activities, and ship maintenance) should be conducted simultaneously, which is referred to as ‘simultaneous operations’ (SIMOPs) [22]. Scaling up the LNG-fueled ships is highly dependent on safe bunkering operations, particularly during SIMOPs.
The interactions between LNG bunkering and SIMOPs pose additional risks because the operations are dynamically interlocked. To ensure the safety of LNG bunkering, SIMOPs carrying out quantitative risk assessments (QRA) are either mandated or highly recommended for understanding and mitigating the potential risks highlighted in the existing regulations, rules, standards, and guidelines [22]. Furthermore, a dynamic quantitative risk assessments (DQRA) method has been developed to capture real-time risks associated with LNG bunkering SIMOPs [23]. When performing a QRA or DQRA, occurrence rates (ORs) (or failure rates) of basic events (BEs) are essential data for analysis [23]. BEs are referred to as root causes of unwanted consequences, such as cryogenic damages, fires, and explosions [24,25,26]; however, as the LNG bunkering industry is still in its early stages, the ORs of the BEs cannot be found in existing databases [27,28,29,30]. Spouge, J compared the leak frequencies from LNG bunkering hoses which had been used in published LNG bunkering QRAs-related documents [31]. Similarly, Gerbec, M and Aneziris, O discussed the uncertainties in the available data on LNG bunkering arms and hoses [32]; however, the ORs of BEs involved in LNG bunkering SIMOPs have yet to be investigated for future studies. So far, only two LNG bunkering accidents have been documented by the IMO [33]; hence, it is impossible to estimate the ORs of BEs based on the available information. Given this, the impetus for this work comes from the lack of necessary data which are needed for QRAs of LNG bunkering SIMOPs.
In this study, the BEs are identified, and the invited experts’ qualitative expressions (in linguistic terms) over the possibilities of the BEs are collected. Then, based on the fuzzy set theory [34], the experts’ linguistic terms are converted into the fuzzy numbers (FNs) which are further converted into the fuzzy ORs using defuzzification techniques and the Onisawa function [35,36].
The fuzzy set theory was first introduced by Zadeh to cope up with the data shortage in the conventional probability theory [34]. A fuzzy number (FN) does not refer to one single crisp value, but rather to a connected set of possible values. It is a convex fuzzy set, characterized by a given interval of possible values (real numbers), and each possible value has its own weight between 0 and 1. The weight is called the membership function. In recent decades, discussion of the approximation of fuzzy numbers has gained much importance; for example, crisp, interval, symmetric triangular, symmetric trapezoidal, triangular and trapezoidal approximations have been proposed by scholars [37]. The most commonly used fuzzy numbers are triangular and trapezoidal fuzzy numbers [38]. In the existing literature, studies have demonstrated that the applications of the fuzzy set theory contribute to risk assessment methods and safety-related decision-makings in the real-world [39,40,41,42,43,44].
The dataset provided in this data descriptor is aimed at filling the gap for the lack of the ORs required for the BEs in the field of the risk assessment of LNG bunkering SIMOPs.
2. Methods
This section presents the design strategy and methods applied to data collection and data analysis.
2.1. Identification of BEs
Based on the IMO’s report of LNG bunkering accidents and SGMF’s guidelines of LNG bunkering SIMOPs [33,45], a total of 41 BEs are involved in main ship types, and the possible LNG bunkering modes are identified (see Table 1). For the different ship types, BEs are categorized into seven groups, namely, G1: common events that might occur during LNG bunkering SIMOPs for all ship types (BE1–BE18), G2: events for container ships (BE19–BE25), G3: events for bulk carriers (BE26–BE31), G4: events for general cargo ships (BE32–BE33), G5: events for tankers (BE34–BE35), G6: events for cruise ships (BE36–BE38), and G7: events for offshore service vessels (BE39–BE41).
2.2. Ethics Approval
The online questionnaire method used in this work involves human information, and therefore, an ethics application was submitted to the University of Tasmania’s Social Sciences Human Research Ethics Committee on 13 January 2021, and it was approved on 9 February 2021 (Project ID:23903).
The survey invitations were distributed in China, where the authors had an extended network of maritime and LNG-related expertise. The participants’ professional fields, professional positions, service years, and education levels were sought in the process of data collection. The participants are referred to by numeric pseudonyms for confidentiality and anonymity purposes. In other words, personal information is de-identified before analysis and replaced by a code. The participants’ information is kept in password-protected computers, which are separated from other data. All participants are assured that their private information is kept strictly confidential.
2.3. Online Questionnaire
A closed-ended structured questionnaire was developed and made available to potential participants through online access with the Microsoft Forms tool. The questionnaire includes the following sections:
- Section A: demographics including four variables (professional field, professional role, service years, education level).
- Section B: Likert scale single-choice questions about possibilities of BEs that might occur during LNG bunkering SIMOPs. The questions were classified into seven subsections, in accordance with Table 1.
For the closed-ended questions, a seven-point Likert type scale was employed and anchored with a range from “very low” to” very high”. The main reason for using seven descriptors is that humans’ unidimensional judgment span is usually seven plus or minus two (i.e., five to nine) [46]. The questionnaire is designed to have mandatory and optional questions. The questions in G1 were set to be mandatory; the questions in G2–G7 were set to be optional, considering that different experts have different levels of familiarity with different ship types. See Document S1 available online.
2.4. Participants
Purposive sampling (also referred to as a judgmental or expert sample) was applied in this study to gain representative samples [47]. This sampling strategy enables the authors to utilize the participant’s expertise and familiarity in this research field. The criterion for the selection of experts was that LNG bunkering-related knowledge or experience was necessary. All participants had expertise in LNG bunkering-related fields from shipping companies, energy companies, maritime safety administrations, port authorities, classification societies, ship design companies, shipyards, equipment manufacturers, and academia.
2.5. Sample Size
LNG bunkering is an emerging industry, and at the time of data collection, a conservative estimate stipulates that there are about 500 qualified experts in China. A sample size of 82 is recommended using the formula for the sample size in the literature [48]. In this calculation, the population size is taken as 500, the margin of error is taken as 5%, the confidence level is taken as 90% as a result of using the purposive sampling, and the sample proportion is taken as 90%.
2.6. Data Collection
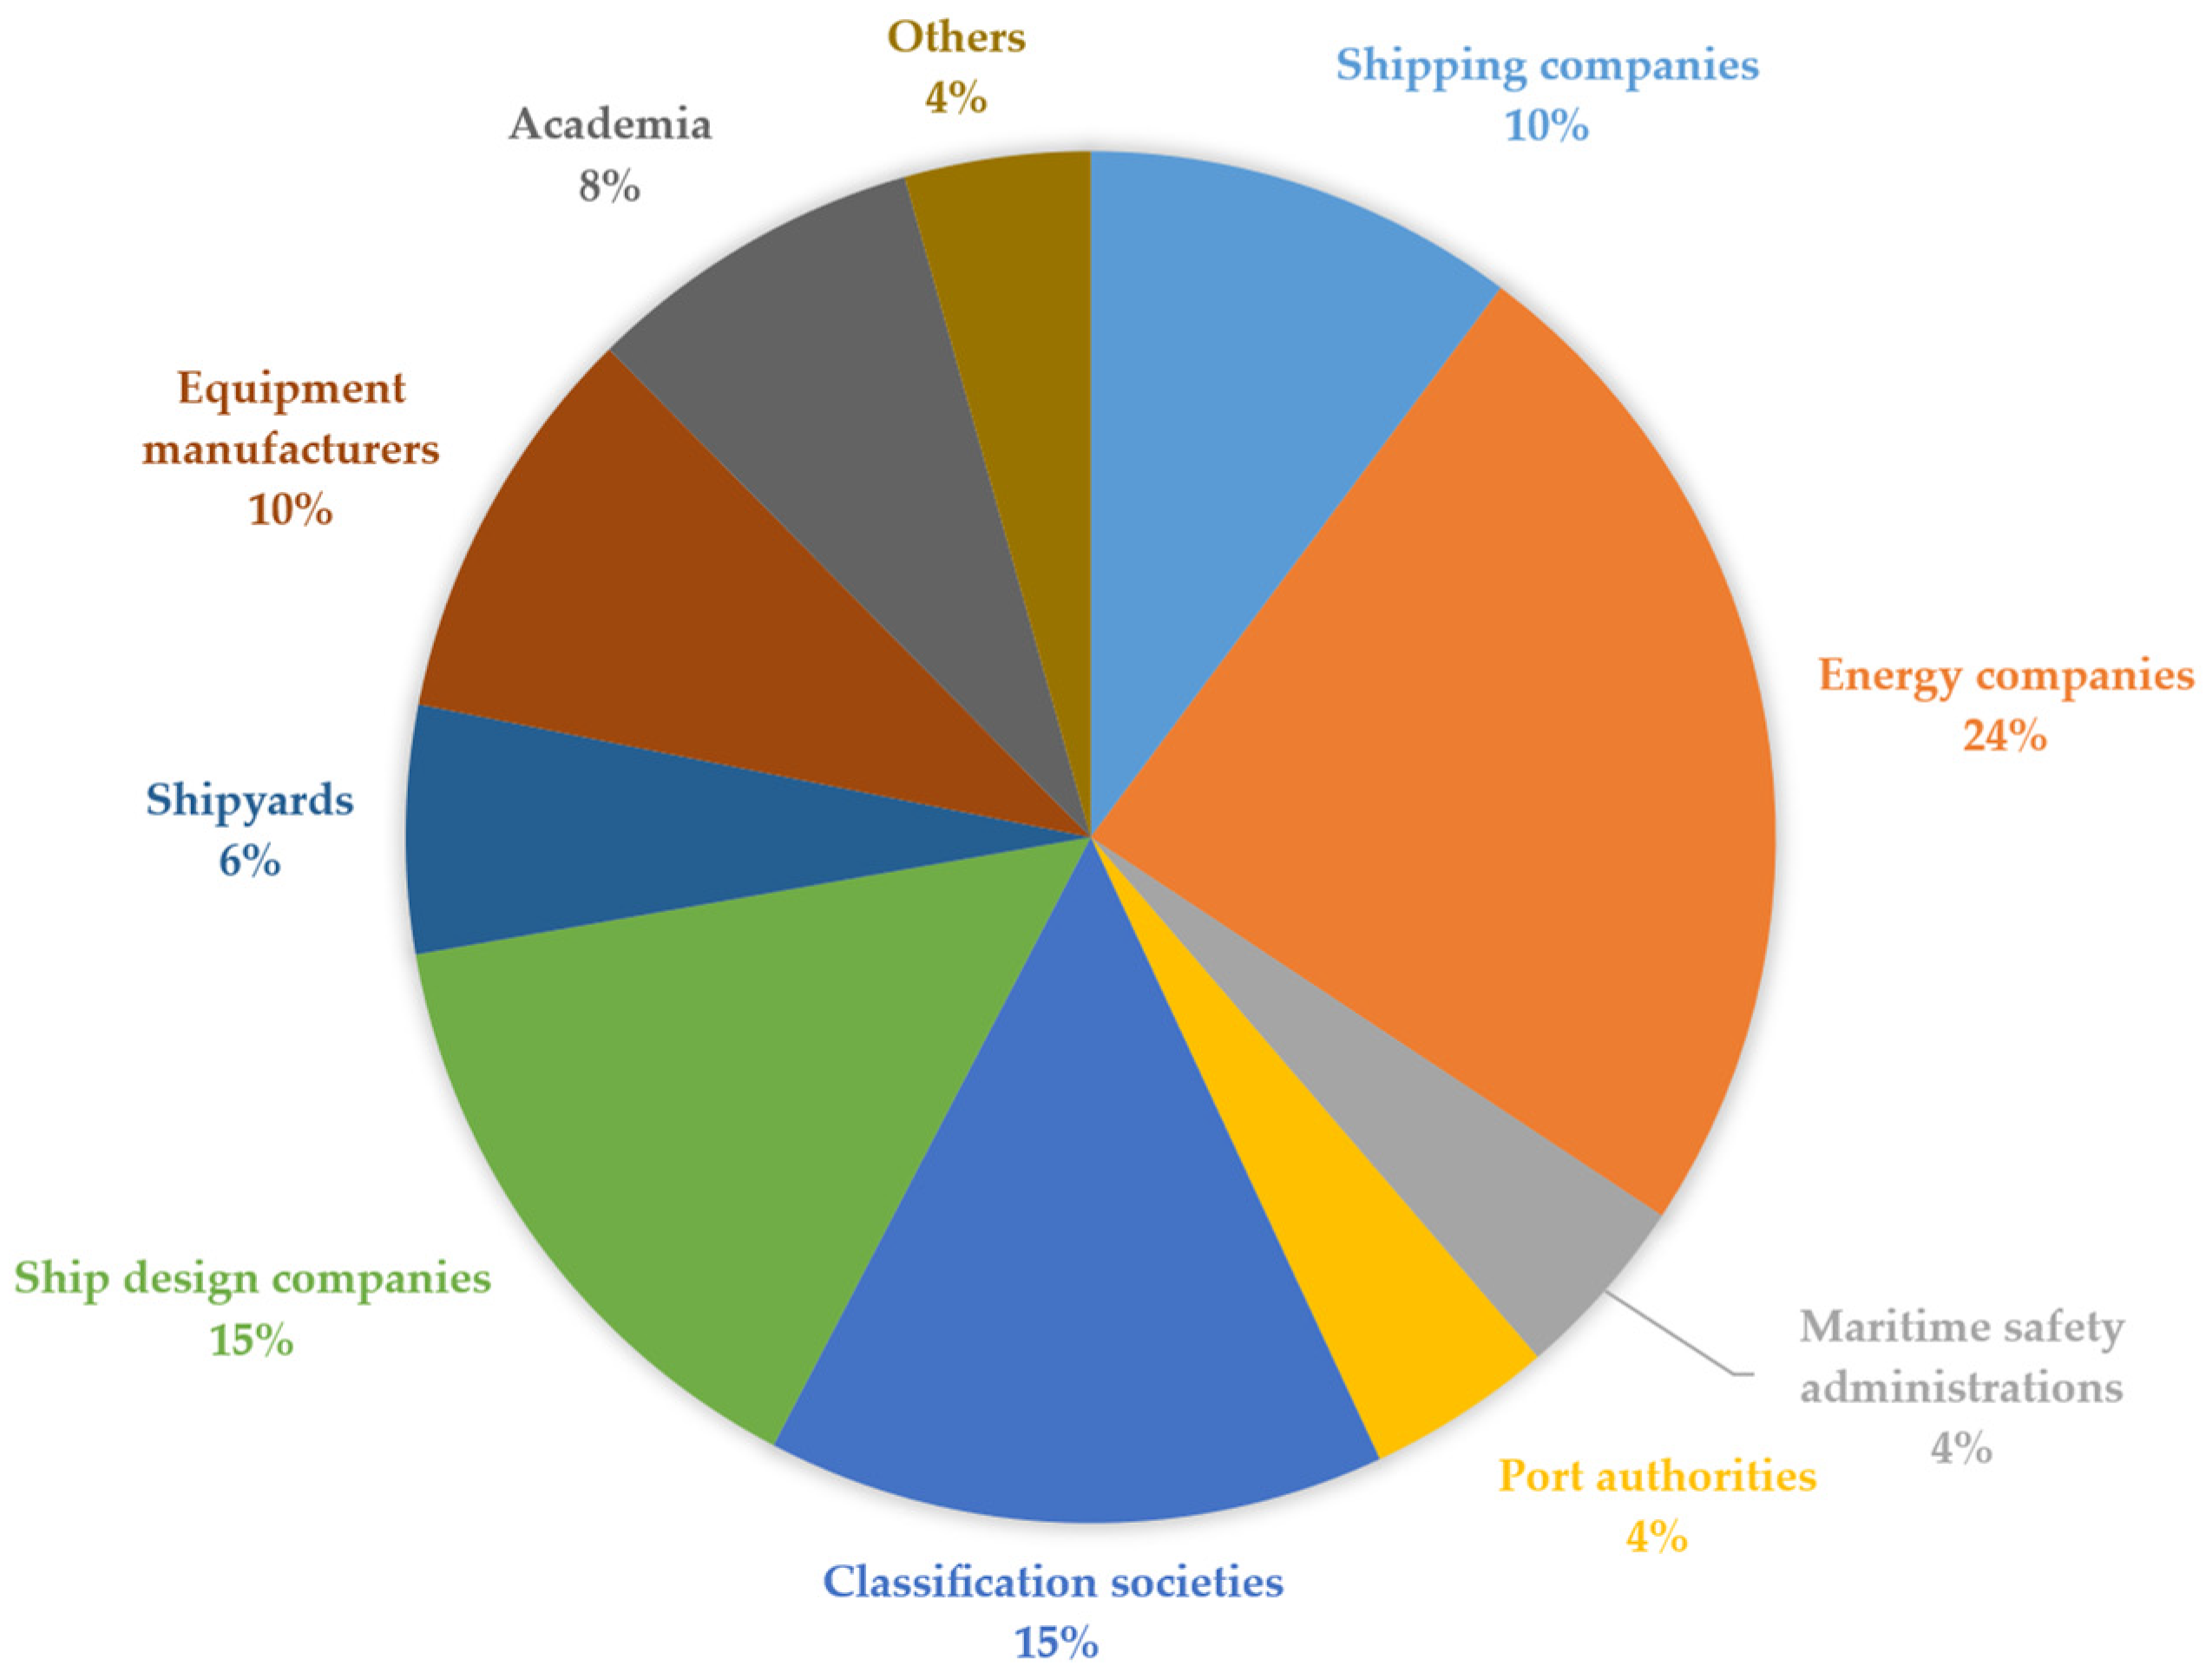
A total of 152 invitations were distributed via emails and social media messaging apps including WeChat and WhatsApp. A total of 137 responses were received, as shown in Figure 1, where there is a reasonable distribution of experts from different sectors. The responses appeared to have higher percentage from energy companies, and a lower percentage from maritime safety administrations and port authorities. This is because experts from energy companies had accumulated more experience in LNG bunkering practices, whereas maritime safety administrations and port authorities focused more on safety management and had limited experience in the details of risk assessment. The respondents were 78% Chinese companies or institutes and 22% international companies or institutes based in China. It is believed that acquired data from the diversity of these affiliations ensured a better reflection of the actual situation of the LNG bunkering industry. The minimum number of responses to the individual questions for the optional part in the questionnaire was 97, which meets the sample size criterion described in Section 2.5.
2.7. Data Analysis
This subsection presents the process of data analysis.
2.7.1. Experts’ Qualitative Expressions
A Likert scale is a psychometric scale that is used to represent people’s opinions and attitudes on a topic or subject matter. When designing a Likert scale, the number of points on the scale must be specified. In this study, a seven-point Likert scale is used to represent the likelihood of a certain BE with 1 = “very low”, 2 = “low”, 3 = “fairly low”, 4 = “medium”, 5 = “fairly high”, 6 = “high”, 7 = “very high”. An expert’s expression of a certain question represents the occurrence possibility of the BE per bunkering operation (a whole bunkering process from start to finish).
There are two main reasons for using seven-point Likert scale in this study:
- (1)
- Miller concluded that humans’ unidimensional judgment span is usually seven plus-minus two, which means the suitable number of comparisons for a human to judge at a time is between five and nine [46], and seven is the median.
- (2)
- The IMO has introduced a seven by four risk matrix for formal safety assessment (FSA) for use in the maritime industry, it reflects seven potential variations for frequencies and four potential variations for consequences; therefore, using seven linguistic terms is in line with the habit of the experts in the maritime industry [49].
2.7.2. Converting the Experts’ Qualitative Expressions into Quantitative Fuzzy Corresponding Numbers
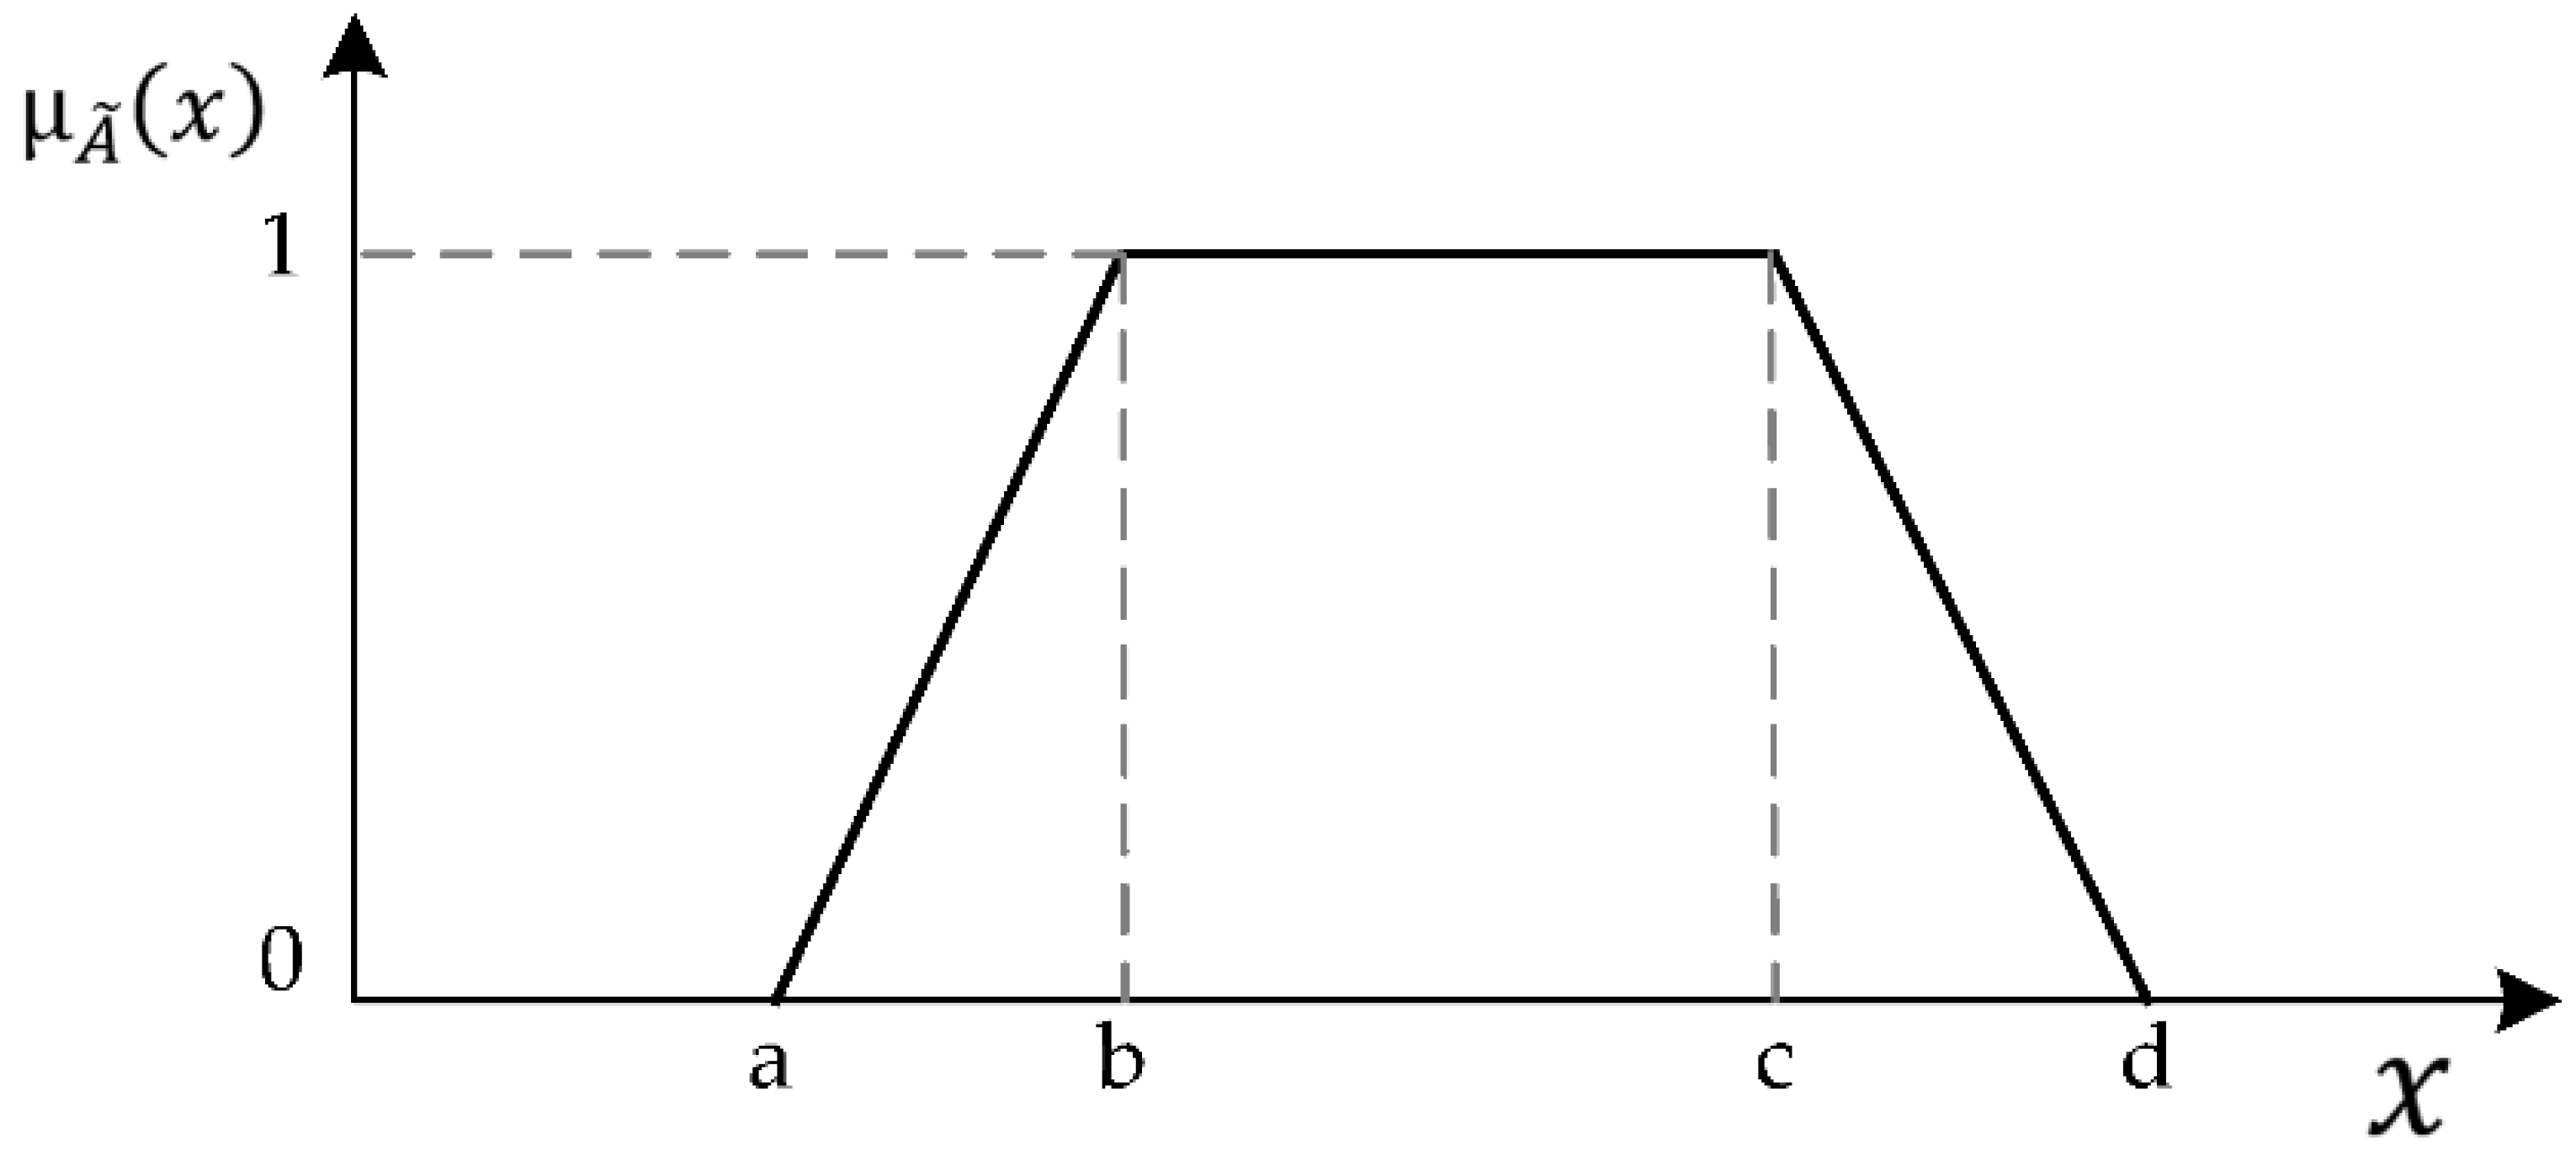
The trapezoidal fuzzy number is used in this study whose membership functions are defined as Equation (1) [38], and is plotted in Figure 2.
where is the membership function of the fuzzy set .
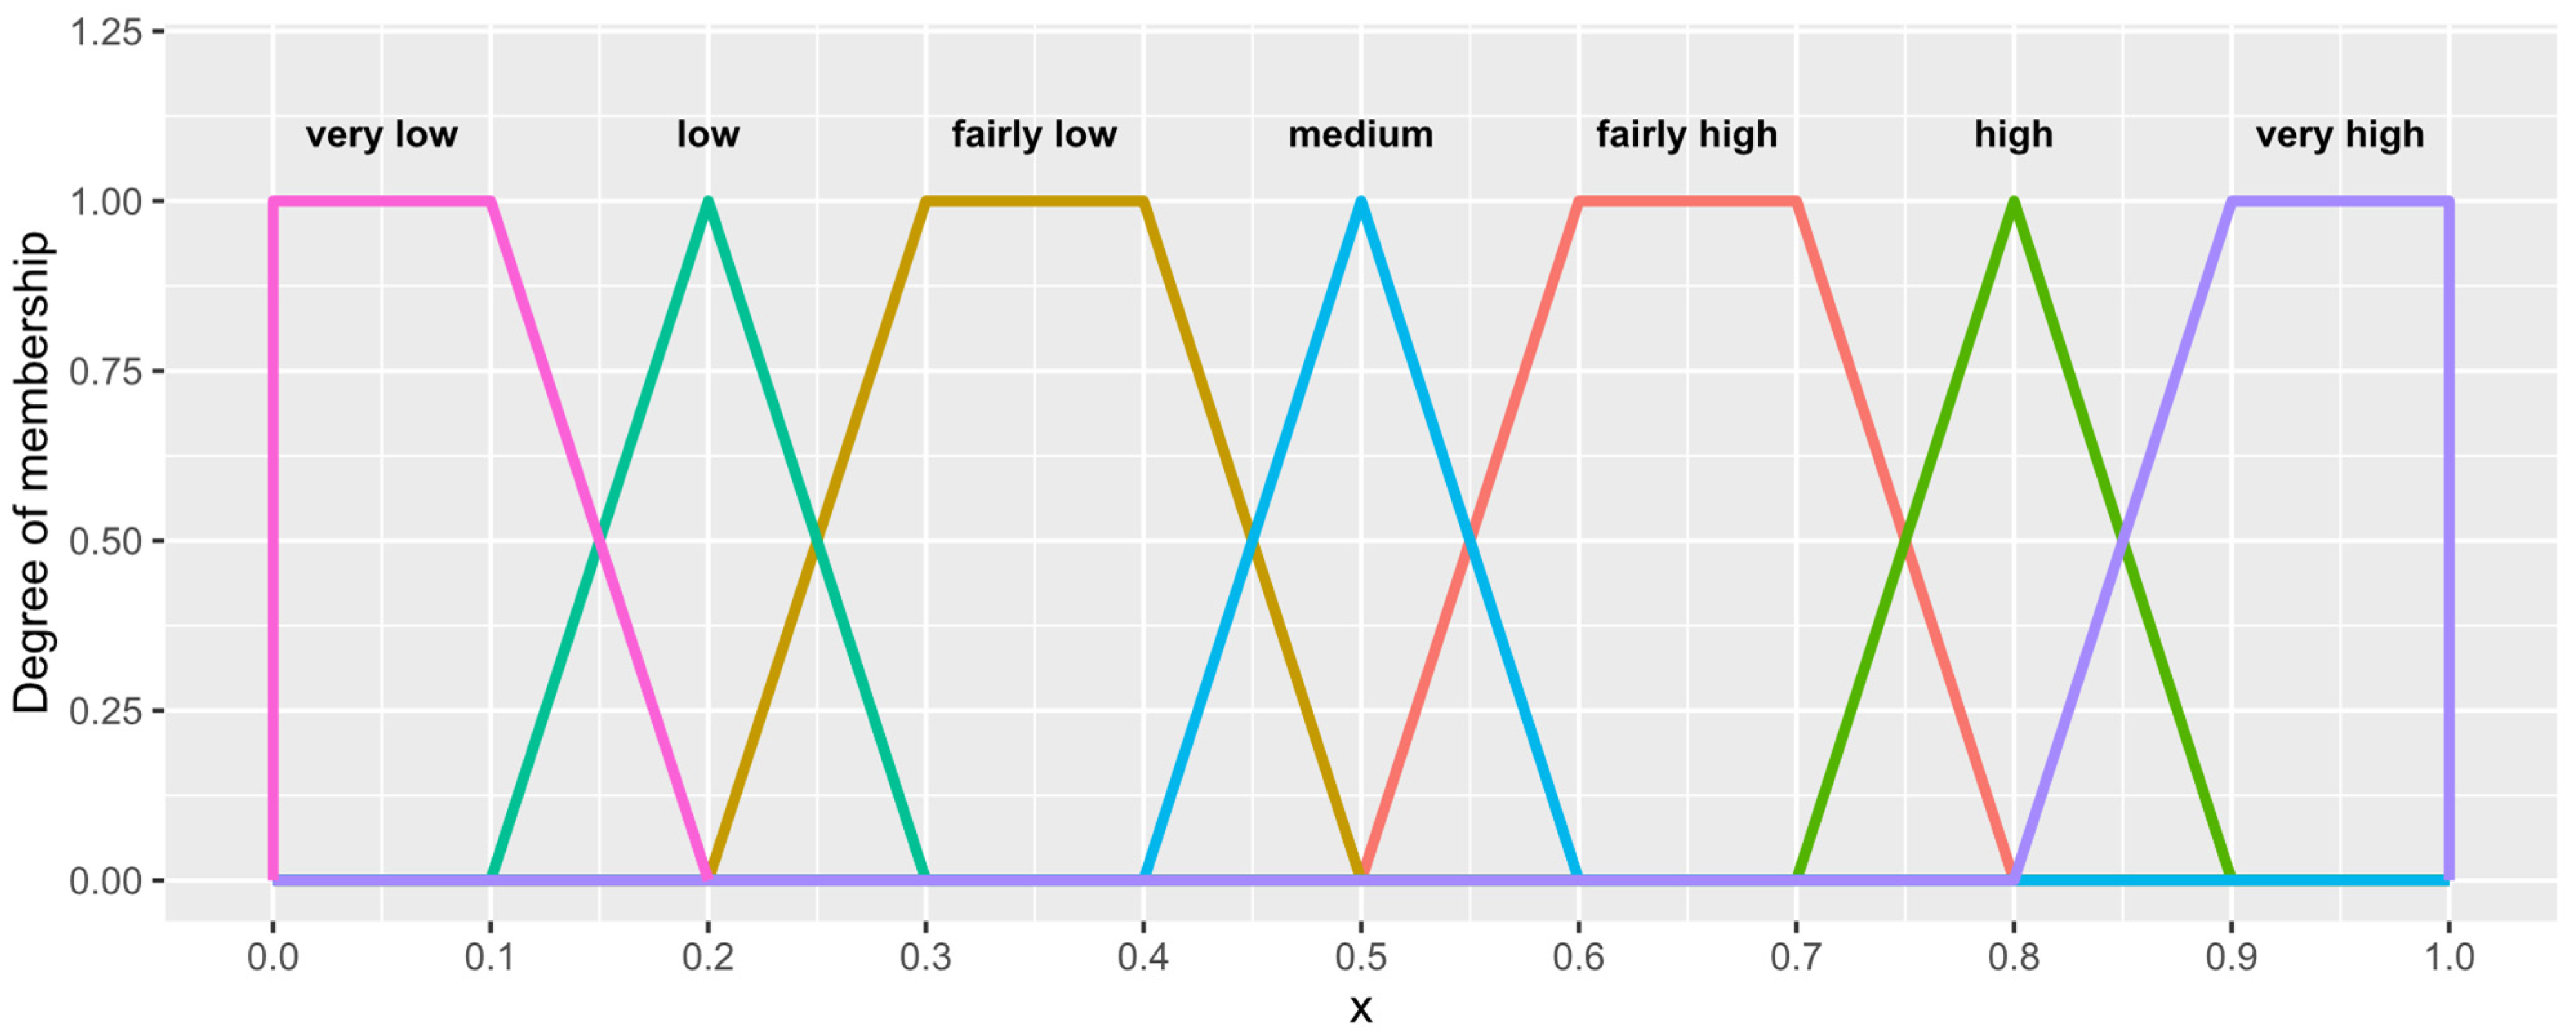
A numerical approximation system is proposed to systematically convert linguistic terms into corresponding fuzzy numbers. Chen and Hwang proposed eight conversion scales (Scale one to Scale eight) which were based on previous extensive empirical studies on the use of linguistic terms [50]. In the present study, the Scale six scale, which includes seven linguistic terms, are adopted for estimating the occurrence possibilities of BEs as shown in Figure 3 [50]. The effectiveness of the Scale six scale has been proven in the literature [51,52,53].
This scale translates an expert’s qualitative expression to a fuzzy number. For example, if an expert’s qualitative expression on the occurrence possibility of a BE is “low”, then the fuzzy number is (0.1, 0.2, 0.2, 0.3) according to Figure 3.
2.7.3. Converting the Fuzzy Numbers about a Certain Question into an Aggregated Fuzzy Number
The geometric mean and the linear opinion pool method could be employed to aggregate experts’ opinions. The linear opinion pool is adopted in this study due to its advantage of taking experts’ weights into account [54]. The occurrence possibility of a certain BE is affected by various factors, for example, the reliability of equipment, the environmental conditions, safety culture of the industry, psychological factors of the operators, etc. In this paper, experts’ engineering judgments are used to assess the possibility of occurrence by considering these factors; however, an expert’s background and engineering experience determine his/her judgment, therefore, the weight of each expert must be considered.
Based on the linear opinion pool method [55], the aggregated fuzzy number can be expressed by Equation (2).
where is the weight given to the expert , and ; is a fuzzy number obtained from the expression of the expert about BE , is the total number of experts, whereas is the total number of BEs. For example, the 1st expert’s linguistic expression on the 1st BE (BE1) is “very low” (see Figure 3), then is (0.0, 0.0, 0.1, 0.2), and the weight of the 1st expert to BE1 is 0.00657462, therefore, is (0.0, 0.0, 0.007, 0.0013). See Table S2 for the detailed calculation in the Supplemental Material available online.
The weight given to the expert is calculated using Equation (3) [56]. Table 2 presents the weighting criterion of experts. The criteria and similar criteria can be found in the literature [56,57,58,59,60,61,62].
where is the weight score of the expert , , , , and represent the professional position score (PPS), the service time score (STS), and the education level score (ELS) of the expert , respectively.
2.7.4. Defuzzification
By defuzzification, the fuzzy occurrence possibilities of the BEs per operation can be obtained so that it is easy to handle the fuzzy ORs. The defuzzification of a trapezoidal fuzzy number is given by Equation (4) based on the center of area method [63].
where is the fuzzy occurrence possibility of the Bes per operation, and is the abscissa of the center of area of the trapezoid as shown in Figure 2. Thereafter, the function developed by Onisawa is used for converting FOPs into fuzzy ORs per operation [36], in which the fuzzy OR can be expressed by Equations (5)–(7).
where K is a constant value, is taken as 5 × 10⁻³ which implies a safety criterion [35].
3. Data Description
The data were collected over three months, from 21 February 2021 to 21 May 2021.
The raw data comprises four main parts, where details of the data are demonstrated in a sampled table for further explanation in the following sub-sections.
The questionnaire form, the raw data and obtained fuzzy ORs, and the calculation sheet for data analysis are published online at https://doi.org/10.5281/zenodo, accessed on 4 April 2022.
3.1. Demographic Information of the Experts
In the first part of the raw data, experts’ demographic information is presented. Table 3 shows the demographic information and their data types. The first row shows the attributes’ names, and the second row is the descriptions of the corresponding data, where expert E1 is taken as an example.
3.2. Expressions of the Experts to the Occurrence Possibilities of the BEs
In the second part of the raw data, the experts’ expressions are presented. Table 4 shows the data types, where expert E1 is taken as an example.
3.3. Weight of Each Expert to Each BE
In the third part of the raw data, the weight of each expert to each BE (WBE) is presented in Table 5, where expert E1 is taken as an example.
3.4. Fuzzy Occurrence Rates of BEs
In the fourth part of the dataset, the fuzzy ORs per operation of the BEs are presented in Table 6.
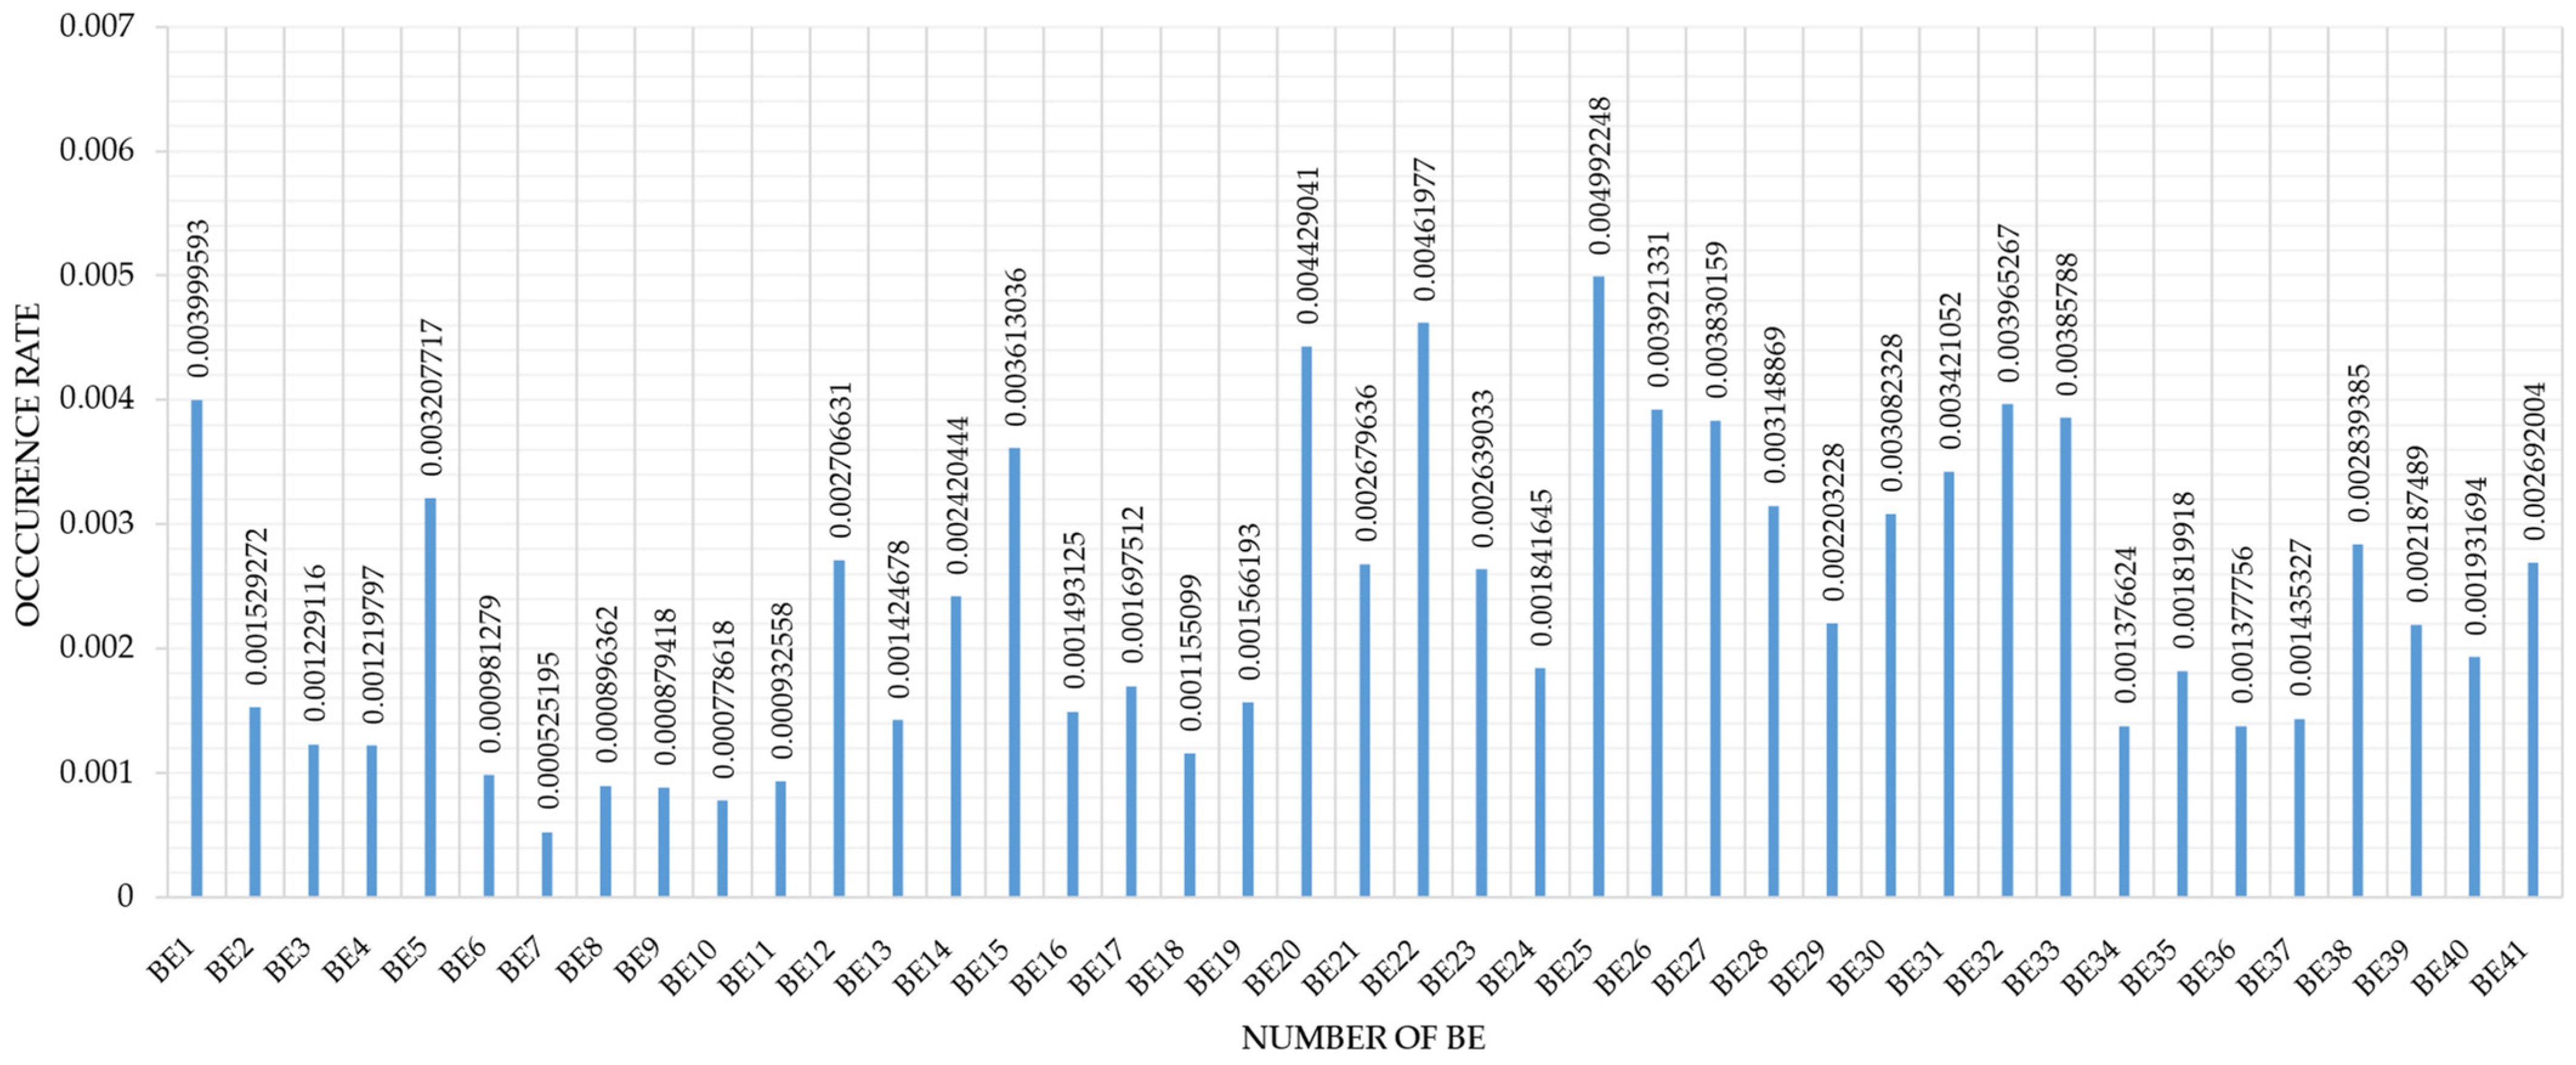
Figure 4 presents the fuzzy ORs of the BEs per operation. These values could be directly used as input data when performing quantitative risk assessments of LNG bunkering SIMOPs.
4. User Notes
The existing numerical risk criteria in performing quantitative risk assessment uses “per year” as a unit. This is given in Table 7, which presents the IMO’s individual risk criteria [49,64]; therefore, the duration of each LNG bunkering operation in hours, and the number of LNG bunkering operations in a year for a specific LNG bunkering project, should be estimated prior to converting ORs per operation into occurrence probabilities per year. Thereafter, with the exponential distributions expressed by Equation (8), the annual occurrence probability for a BE can be calculated.
where is the annual occurrence probability of a BE, is the occurrence rate per hour of a BE, is the operational hours in a year. For example, for BE 3 (Failure of LNG bunkering breakaway couplings), the OR per operation is 0.00123, if the duration of each LNG bunkering operation is 5 h, then , if the operational hours in a year , then , which means the annual failure probability of LNG bunkering breakaway couplings is 0.03.
5. Limitation
Firstly, in this investigation there is a limited source for data collection, and the reader should bear in mind that the study is based on experts from companies established in China. In spite of its limitations, the study adds to our understanding in terms of the quality required for generating a dataset of a dynamic risk assessment of an LNG SIMPOS operation. A natural progression of this work would be to add more data to this dataset obtained from experts in different region of the world.
Secondly, there are limitations to the purposive sampling method in this study. On one hand, to some extent, the investigators are making subjective judgements when choosing participants. On the other hand, it is hard to evaluate the reliability of the experts; this means it is difficult to determine if there is a sampling error in the information that investigators present. To minimize these limitations, the inclusion criteria for experts are defined for screening the eligibilities of experts.
Thirdly, the weighting criteria of experts adopted in this study have limitations. There are inhomogeneities of gaps between metrics, for example, the difference between a PhD and Masters might be larger than that between vocational education and high school. Thus, it deserves further study on quantifying the difference between metrics.
Supplementary Materials
The following supporting information can be downloaded at: https://www.mdpi.com/article/10.3390/data7050060/s1, Document S1: The questionnaire form; Table S1: The raw data and obtained ORs; Table S2: The calculation sheet for data analysis.
Author Contributions
Conceptualization, H.F. and H.E.; methodology, H.F.; validation, H.F., H.E. and S.G.J.; formal analysis, H.F.; resources, H.F. and H.E.; data curation, H.F. and H.E.; writing—original draft preparation, H.F.; writing—review and editing, H.E. and S.G.J.; supervision, H.E. and S.G.J.; project administration, H.E. and H.F. All authors have read and agreed to the published version of the manuscript.
Funding
This research received no external funding.
Institutional Review Board Statement
Not applicable.
Informed Consent Statement
Informed consent was obtained from all subjects involved in the study.
Data Availability Statement
The data used for this paper can be found at https://doi.org/10.5281/zenodo.6527869, accessed on 4 April 2022.
Acknowledgments
The authors would like to express their gratitude to the experts who participated in the online questionnaire survey.
Conflicts of Interest
The authors declare no conflict of interest.
Abbreviations
| BE | Basic event |
| DQRA | Dynamic quantitative risk assessment |
| ELS | Education level score |
| ESD | Emergency shutdown |
| GHG | Greenhouse gas |
| IMO | The International Maritime Organization |
| IPCC | The Intergovernmental Panel on Climate Change |
| LNG | Liquified natural gas |
| MEPC | Marine Environment Protection Committee |
| OR | Occurrence rate |
| PPS | Professional position score |
| QRA | Quantitative risk assessment |
| SGMF | The society for gas as a marine fuel |
| SIMOPs | Simultaneous operations |
| STS | Service time score |
| Symbols | |
| Fuzzy set | |
| Education level score of the ith expert | |
| Fuzzy occurrence possibility of a certain BE | |
| Constant value | |
| Annual occurrence probability of a certain BE | |
| Fuzzy number obtained from the expression of the expert i about BE | |
| Pj | Aggregated fuzzy number |
| Professional position score of the ith expert | |
| Safety criterion value | |
| Service time score of the ith expert | |
| Operational hours in a year | |
| Weight given to the expert i | |
| Weight score of the expert i | |
| Abscissa of the center of area of the trapezoid | |
| Occurrence rate of a BE per hour | |
| Membership function of the fuzzy set |
References
- IRENA. Navigating the Way to a Renewable Future: Solutions to Decarbonise Shipping (Preliminary Findings); International Renewable Energy Agency: Abu Dhabi, United Arab Emirates, 2019. [Google Scholar]
- IMO. Reduction of GHG Emissions from Ships—Fourth IMO GHG Study 2020; Final Report; IMO: London, UK, 2020. [Google Scholar]
- IMO. Guidelines on the Method of Calculation of the Attained Energy Efficiency Design Index (EEDI) for New Ships; IMO: London, UK, 2018. [Google Scholar]
- IPCC. Climate Change 2021; The Physical Science Basis: Cambridge, UK, 2021. [Google Scholar]
- Al-Enazi, A.; Okonkwo, E.C.; Bicer, Y.; Al-Ansari, T. A review of cleaner alternative fuels for maritime transportation. Energy Rep. 2021, 7, 1962–1985. [Google Scholar] [CrossRef]
- Mallouppas, G.; Yfantis, E.A. Decarbonization in Shipping Industry: A Review of Research, Technology Development, and Innovation Proposals. J. Mar. Sci. Eng. 2021, 9, 415. [Google Scholar] [CrossRef]
- Hydrogen Council. Hydrogen Insights: A Perspective on Hydrogen Investment, Market Development and Cost Competitiveness; Hydrogen Council: Vancouver, Canada, 2021. [Google Scholar]
- LR; UMAS. Techno-Economic Assessment of Zero-Carbon Fuels; LR: London, UK, 2020. [Google Scholar]
- Schuller, O.; Kupferschmid, S.; Hengstler, J.; Whitehouse, S. 2nd Life Cycle GHG Emission Study on the Use of LNG as Marine Fuel; Sphera: Leinfelden-Echterdingen, Germany, 2021. [Google Scholar]
- Wang, S.; Qi, J.; Laporte, G. Governmental subsidy plan modeling and optimization for liquefied natural gas as fuel for maritime transportation. Transp. Res. Part B Methodol. 2022, 155, 304–321. [Google Scholar] [CrossRef]
- Lagemann, B.; Lindstad, E.; Fagerholt, K.; Rialland, A.; Ove Erikstad, S. Optimal ship lifetime fuel and power system selection. Transp. Res. Part D Transp. Environ. 2022, 102, 103145. [Google Scholar] [CrossRef]
- Balcombe, P.; Staffell, I.; Kerdan, I.G.; Speirs, J.F.; Brandon, N.P.; Hawkes, A.D. How can LNG-fuelled ships meet decarbonisation targets? An environmental and economic analysis. Energy 2021, 227, 120462. [Google Scholar] [CrossRef]
- SGMF. LNG Fueled Ships Database. Available online: https://www.sgmf.info/data (accessed on 14 April 2022).
- Keller, P. Op-Ed: The Emergence of Bio-LNG. Available online: https://www.maritime-executive.com/editorials/op-ed-the-emergence-of-bio-lng (accessed on 17 March 2022).
- Chambers, S. 61% of All Orders in Q1 Were for Alternatively Fuelled Vessels. Available online: https://splash247.com/61-of-all-orders-in-q1-were-for-alternatively-fuelled-vessels/ (accessed on 11 April 2022).
- SEA\LNG. LNG—A Fuel in Transition. Available online: https://sea-lng.org/wp-content/uploads/2022/03/LNG-2022_A-view-from-the-bridge_.pdf (accessed on 10 January 2022).
- Wang, Y.; Wright, L.A. A Comparative Review of Alternative Fuels for the Maritime Sector: Economic, Technology, and Policy Challenges for Clean Energy Implementation. World 2021, 2, 456–481. [Google Scholar] [CrossRef]
- SEA\LNG. LNG as a Marine Fuel—Our Zero Emissions Future Starts Now. Available online: https://sea-lng.org/wp-content/uploads/2020/02/200214_SEALNG2019reviewDIGITAL_compressed.pdf (accessed on 10 January 2022).
- Ryste, J.A.; Wold, M.; Sverud, T. Alternative Marine Fuels Study; DNV GL: Høvik, Norway, 2019. [Google Scholar]
- Hine, L. Bring on the Bio: LNG Bunker Buyers Look to Their Decarbonisation Pathways. Available online: https://www.tradewindsnews.com/business-focus/bring-on-the-bio-lng-bunker-buyers-look-to-their-decarbonisation-pathways/2-1-1185802 (accessed on 11 April 2022).
- Ship & Bunker News Team. Container Ship Reports 27% GHG Savings From Using Synthetic LNG Blend. Available online: https://shipandbunker.com/news/world/169647-container-ship-reports-27-ghg-savings-from-using-synthetic-lng-blend (accessed on 11 April 2022).
- Fan, H.; Enshaei, H.; Gamini Jayasinghe, S. Safety philosophy and risk analysis methodology for LNG bunkering simultaneous operations (SIMOPs): A literature review. Saf. Sci. 2021, 136, 105150. [Google Scholar] [CrossRef]
- Fan, H.; Enshaei, H.; Jayasinghe, S.G. Dynamic quantitative risk assessment of LNG bunkering SIMOPs based on Bayesian network. J. Ocean Eng. Sci. 2022, 1, 1–19. [Google Scholar] [CrossRef]
- Rausand, M. Risk Assessment: Theory, Methods, and Applications; John Wiley & Sons, Inc.: Hoboken, NJ, USA, 2011. [Google Scholar]
- Woodward, J.L.; Pitblado, R. LNG Risk Based Safety: Modeling and Consequence Analysis; AIChE: Hoboken, NJ, USA, 2010. [Google Scholar]
- Cao, Y.; Jia, Q.-J.; Wang, S.-M.; Jiang, Y.; Bai, Y. Safety design analysis of a vent mast on an LNG powered ship during a low-temperature combustible gas leakage accident. J. Ocean Eng. Sci. 2021, 7, 75–83. [Google Scholar] [CrossRef]
- Uijt de Haag, P.A.M.; Ale, B.J.M.; Post, J.G. T10-1—The ‘Purple Book’: Guideline for Quantitative Risk Assessment in the Netherlands. In Loss Prevention and Safety Promotion in the Process Industries; Pasman, H.J., Fredholm, O., Jacobsson, A., Eds.; Elsevier Science B.V.: Amsterdam, The Netherlands, 2001; pp. 1429–1438. [Google Scholar]
- OGP. Risk Assessment Data Directory: Process Release Frequencies; OGP: London, UK, 2010. [Google Scholar]
- SINTEF. OREDA Offshore Reliability Data Handbook, 4th ed.; SINTEF: Trondheim, Norway, 2002. [Google Scholar]
- HSE. Failure Rate and Event Data for Use within Risk Assessments. Available online: https://www.hse.gov.uk/landuseplanning/failure-rates.pdf (accessed on 10 January 2021).
- Spouge, J. Sources of LNG Bunkering Leak Frequencies. In Proceedings of the 31st European Safety and Reliability Conference, Angers, France, 19–23 September 2021. [Google Scholar]
- Gerbec, M.; Aneziris, O. Uncertainties in failure rates in the LNG bunkering risk assessment. Saf. Sci. 2022, 152, 105774. [Google Scholar] [CrossRef]
- IMO. MSC 95/INF.17 Information on Incidents during Bunkering of LNG; IMO: London, UK, 2015. [Google Scholar]
- Zadeh, L.A. Fuzzy sets. Inf. Control. 1965, 8, 338–353. [Google Scholar] [CrossRef] [Green Version]
- Onisawa, T. An approach to human reliability in man-machine systems using error possibility. Fuzzy Sets Syst. 1988, 27, 87–103. [Google Scholar] [CrossRef]
- Onisawa, T. An application of fuzzy concepts to modelling of reliability analysis. Fuzzy Sets Syst. 1990, 37, 267–286. [Google Scholar] [CrossRef]
- Ekel, P.; Pedrycz, W.; Pereira, J., Jr. Multicriteria Decision-Making under Conditions of Uncertainty: A Fuzzy Set Perspective; John Wiley & Sons: Hoboken, NJ, USA, 2019. [Google Scholar]
- Hadi-Vencheh, A.; Allame, M. On the relation between a fuzzy number and its centroid. Comput. Math. Appl. 2010, 59, 3578–3582. [Google Scholar] [CrossRef] [Green Version]
- Kutlu Gündoğdu, F.; Duleba, S.; Moslem, S.; Aydın, S. Evaluating public transport service quality using picture fuzzy analytic hierarchy process and linear assignment model. Appl. Soft Comput. 2021, 100, 106920. [Google Scholar] [CrossRef]
- Ortega, J.; Tóth, J.; Moslem, S.; Péter, T.; Duleba, S. An Integrated Approach of Analytic Hierarchy Process and Triangular Fuzzy Sets for Analyzing the Park-and-Ride Facility Location Problem. Symmetry 2020, 12, 1225. [Google Scholar] [CrossRef]
- Moslem, S.; Gul, M.; Farooq, D.; Celik, E.; Ghorbanzadeh, O.; Blaschke, T. An Integrated Approach of Best-Worst Method (BWM) and Triangular Fuzzy Sets for Evaluating Driver Behavior Factors Related to Road Safety. Mathematics 2020, 8, 414. [Google Scholar] [CrossRef] [Green Version]
- Tubis, A.A.; Skupień, E.T.; Jankowski, S.; Ryczyński, J. Risk Assessment of Human Factors of Logistic Handling of Deliveries at an LNG Terminal. Energies 2022, 15, 2750. [Google Scholar] [CrossRef]
- Shen, J.-H.; Liu, C.-P.; Chang, K.-Y.; Chen, Y.-W. Ship Deficiency Data of Port State Control to Identify Hidden Risk of Target Ship. J. Mar. Sci. Eng. 2021, 9, 1120. [Google Scholar] [CrossRef]
- Abdussamie, N.; Daboos, M.; Elferjani, I.; Shuhong, C.; Alaktiwi, A. Risk assessment of LNG and FLNG vessels during manoeuvring in open sea. J. Ocean Eng. Sci. 2018, 3, 56–66. [Google Scholar] [CrossRef]
- SGMF. Gas as A Marine Fuel-Simultaneous Operations (Simops) During LNG Bunkering: Safety, (version 1.0); SGMF: London, UK, 2018. [Google Scholar]
- Miller, G.A. The magical number seven, plus or minus two: Some limits on our capacity for processing information. Psychol. Rev. 1956, 63, 81–97. [Google Scholar] [CrossRef] [PubMed] [Green Version]
- Lavrakas, P.J. Encyclopedia of Survey Research Methods; Sage: Los Angeles, CA, USA, 2008; Volume 2, p. 509. [Google Scholar] [CrossRef]
- Population Proportion—Sample Size. Available online: https://select-statistics.co.uk/calculators/sample-size-calculator-population-proportion/ (accessed on 1 December 2020).
- IMO. Revised Guidelines for Formal Safety Assessment (FSA) for Use in the IMO Rule-Making Process; IMO: London, UK, 2018. [Google Scholar]
- Chen, S.-J.; Hwang, C.-L. Fuzzy multiple attribute decision making methods. In Fuzzy Multiple Attribute Decision Making; Springer: Berlin, Germany, 1992; pp. 289–486. [Google Scholar]
- Yazdi, M.; Zarei, E. Uncertainty Handling in the Safety Risk Analysis: An Integrated Approach Based on Fuzzy Fault Tree Analysis. J. Fail. Anal. Prev. 2018, 18, 392–404. [Google Scholar] [CrossRef]
- Chen, K.; Jacobson, C.; Blong, R. Artificial Neural Networks for Risk Decision Support in Natural Hazards: A Case Study of Assessing the Probability of House Survival from Bushfires. Environ. Modeling Assess. 2004, 9, 189–199. [Google Scholar] [CrossRef]
- Rahman Dwi Wahyudi, M.A.H.; Hartono, M. Predicting Service Reliability—Using Survival Analysis of Customer Fuzzy Satisfaction. Asian J. Technol. Manag. 2018, 11, 79–93. [Google Scholar] [CrossRef]
- Romeijn, J.-W. An Interpretation of Weights in Linear Opinion Pooling. Episteme 2020, 1–15. [Google Scholar] [CrossRef]
- Clemen, R.T.; Winkler, R.L. Combining Probability Distributions from Experts in Risk Analysis. Risk Anal. 1999, 19, 187–203. [Google Scholar] [CrossRef]
- Cheliyan, A.S.; Bhattacharyya, S.K. Fuzzy fault tree analysis of oil and gas leakage in subsea production systems. J. Ocean Eng. Sci. 2018, 3, 38–48. [Google Scholar] [CrossRef]
- Yuhua, D.; Datao, Y. Estimation of failure probability of oil and gas transmission pipelines by fuzzy fault tree analysis. J. Loss Prev. Process. Ind. 2005, 18, 83–88. [Google Scholar] [CrossRef]
- Mirzaei Aliabadi, M.; Pourhasan, A.; Mohammadfam, I. Risk modelling of a hydrogen gasholder using Fuzzy Bayesian Network (FBN). Int. J. Hydrog. Energy 2020, 45, 1177–1186. [Google Scholar] [CrossRef]
- Zarei, E.; Khakzad, N.; Cozzani, V.; Reniers, G. Safety analysis of process systems using Fuzzy Bayesian Network (FBN). J. Loss Prev. Process. Ind. 2019, 57, 7–16. [Google Scholar] [CrossRef]
- Ramzali, N.; Lavasani, M.R.M.; Ghodousi, J. Safety barriers analysis of offshore drilling system by employing Fuzzy Event Tree Analysis. Saf. Sci. 2015, 78, 49–59. [Google Scholar] [CrossRef]
- Mehmet Ersin Yücel, C.Y. Determination of Risk Factors Caused by Ships in Port Planning Int. J. Environ. Geoinform. 2019, 6, 254–263. [Google Scholar] [CrossRef] [Green Version]
- Zaib, A.; Yin, J.; Khan, R.U. Determining Role of Human Factors in Maritime Transportation Accidents by Fuzzy Fault Tree Analysis (FFTA). J. Mar. Sci. Eng. 2022, 10, 381. [Google Scholar] [CrossRef]
- Wang, Y.-M.; Yang, J.-B.; Xu, D.-L.; Chin, K.-S. On the centroids of fuzzy numbers. Fuzzy Sets Syst. 2006, 157, 919–926. [Google Scholar] [CrossRef]
- IMO. MSC 82/INF.3 Formal Safety Assessment Possible Improvements on FSA Guidelines; IMO: London, UK, 2006. [Google Scholar]
Figure 1.
The distribution of the participants.

Figure 2.
Trapezoidal fuzzy membership function [38].
Figure 2.
Trapezoidal fuzzy membership function [38].

Figure 3.
The seven linguistic terms conversion scale.

Figure 4.
The fuzzy occurrence rates per operation of the BEs.


Table 1.
The identified BEs.
| Group | No. | Basic Event |
|---|---|---|
| G1: Common | BE1 | Excessive ship motion due to operation of ship stabilizing system during cargo loading/unloading. |
| BE2 | Failure of mooring lines. | |
| BE3 | Failure of LNG bunkering breakaway couplings. | |
| BE4 | Failure of LNG bunkering dry-disconnect/connect couplings. | |
| BE 5 | Gasket failure of the flanges of the LNG bunkering manifolds. | |
| BE 6 | Failure of water curtain protection system in the bunkering manifold area. | |
| BE 7 | Failure of LNG drip tray in the bunkering manifold area. | |
| BE 8 | Failure of water spray system. | |
| BE 9 | Failure of high expansion foam system (if applicable). | |
| BE 10 | Failure of LNG bunkering ESD (Emergency Shutdown) system. | |
| BE 11 | Failure of gas detectors. | |
| BE 12 | Sparks/heat (hot work) from maintenance and inspection. | |
| BE 13 | Sparks from lifeboat drill or test. | |
| BE 14 | Sparks from local generators on shore. | |
| BE 15 | Sparks from vehicle movements on shore. | |
| BE 16 | Sparks due to failure of onboard (LNG receiving vessel) electrical lighting. | |
| BE 17 | Sparks due to failure of onshore electrical lighting. | |
| BE 18 | Failure of the mooring lines caused by waves created by the passing vessel. | |
| G2: Container ships | BE 19 | Containers dropping during cargo operation. |
| BE 20 | Sparks from dropping containers. | |
| BE 21 | Sparks from refrigerated containers (not be intrinsically safe). | |
| BE 22 | Sparks from port cranes and stacker/tractor–trailer units (not intrinsically safe). | |
| BE 23 | Dropping objects during stores loading/waste removal. | |
| BE 24 | Sparks from dropping objects during stores loading/waste removal. | |
| BE 25 | Sparks/heat from using electric motors-driven rolling hatch covers. | |
| G3: Bulk carriers | BE 26 | Sparks/heat from using electric motors-driven rolling hatch covers. |
| BE 27 | Sparks from port cranes and stacker/tractor-trailer units (not intrinsically safe). | |
| BE 28 | Sparks from using cargo conveyer belts. | |
| BE 29 | Dropping large items of cargo during operation. | |
| BE 30 | Sparks from dropping large items of cargo during operation. | |
| BE 31 | Sparks from using mechanical equipment to redistribute cargo. | |
| G4: General cargo ships | BE 32 | Sparks/heat from using electric motors-driven rolling hatch covers. |
| BE 33 | Sparks from cargo delivery vehicles movements. | |
| G5: Tankers | BE 34 | Failure of the cargo transfer hose (hoses). |
| BE 35 | Ignition of the flammable cargo/cargoes. | |
| G6: Cruise ships | BE 36 | Sparks from passenger/crew embarkation/disembarkation. |
| BE 37 | Sparks from passenger/crew safety drill. | |
| BE 38 | Sparks from passenger’s vehicle movements on shore. | |
| G7: Offshore service vessels | BE 39 | Sparks from loading/back loading the rear decks with containerized and noncontainerized cargo. |
| BE 40 | Sparks from dangerous goods, refrigerated containers (not be intrinsically safe) on the back deck. | |
| BE 41 | Sparks from vehicles movements on shore. |
Table 2.
Weighting criteria of experts.
| PPS | STS | ELS | |||
|---|---|---|---|---|---|
| Category | Score | Category | Score | Category | Score |
| Senior Manager (SM) | 5 | ≥30 years | 5 | PhD | 5 |
| Junior Manager (JM) | 4 | 20–29 years | 4 | Masters | 4 |
| Engineer (E) | 3 | 10–19 years | 3 | Bachelors | 3 |
| Technician (T) | 2 | 6–9 years | 2 | Vocational education | 2 |
| Worker (W) | 1 | ≤5 years | 1 | High school | 1 |
Table 3.
The demographic information.
| Expert ID | PP | PPS | ST | STS | EL | ELS |
|---|---|---|---|---|---|---|
| E1 | JM | 4 | 10~19 | 3 | Bachelor | 3 |
Table 4.
The experts’ expressions to the occurrence possibilities of the BEs.
| Expert ID | No. of BE | ||||
|---|---|---|---|---|---|
| BE1 | BE2 | BE3 | … | BE41 | |
| E1 | 1 | 1 | 1 | … | NR 1 |
1 NR: No response.
Table 5.
The weight of each expert to each BE.
| Expert ID | No. of WBE | ||||
|---|---|---|---|---|---|
| WBE1 | WBE2 | WBE3 | … | WBE41 | |
| E1 | 0.006574622 | 0.006574622 | 0.006574622 | … | 0 |
Table 6.
The fuzzy occurrence rates per operation of the BEs.
| No. of BE | |||||
|---|---|---|---|---|---|
| BE1 | BE2 | BE3 | … | BE41 | |
| Occurrence rate | 0.003999593 | 0.001529272 | 0.001229116 | … | 0.002692004 |
Publisher’s Note: MDPI stays neutral with regard to jurisdictional claims in published maps and institutional affiliations. |
© 2022 by the authors. Licensee MDPI, Basel, Switzerland. This article is an open access article distributed under the terms and conditions of the Creative Commons Attribution (CC BY) license (https://creativecommons.org/licenses/by/4.0/).
Share and Cite
MDPI and ACS Style
Fan, H.; Enshaei, H.; Jayasinghe, S.G. Formation of Dataset for Fuzzy Quantitative Risk Assessment of LNG Bunkering SIMOPs. Data 2022, 7, 60. https://doi.org/10.3390/data7050060
AMA Style
Fan H, Enshaei H, Jayasinghe SG. Formation of Dataset for Fuzzy Quantitative Risk Assessment of LNG Bunkering SIMOPs. Data. 2022; 7(5):60. https://doi.org/10.3390/data7050060
Chicago/Turabian StyleFan, Hongjun, Hossein Enshaei, and Shantha Gamini Jayasinghe. 2022. "Formation of Dataset for Fuzzy Quantitative Risk Assessment of LNG Bunkering SIMOPs" Data 7, no. 5: 60. https://doi.org/10.3390/data7050060