Towing Test Data Set of the Kyushu University Kite System


1
Interdisciplinary Graduate School of Engineering Sciences (IGSES - ESST), Kyushu University, 6-1 Kasugakoen, Kasuga, Fukuoka 816-8580, Japan
2
Faculty of Engineering and Technology, Future University in Egypt (FUE), 5th Settlement, New Cairo 11835, Egypt
3
Research Institute for Applied Mechanics (RIAM), Kyushu University, 6-1 Kasugakoen, Kasuga, Fukuoka 816-8580, Japan
4
Faculty of Aerospace Engineering, Delft University of Technology, 2629 HS Delft, The Netherlands
*
Author to whom correspondence should be addressed.
Data 2020, 5(3), 69; https://doi.org/10.3390/data5030069
Submission received: 26 June 2020
/
Revised: 23 July 2020
/
Accepted: 30 July 2020
/
Published: 3 August 2020
Abstract
:Kites can be used to harvest wind energy with substantially lower material and environmental footprints and a higher capacity factor than conventional wind turbines. In this paper, we present measurement data from seven individual tow tests with the kite system developed by Kyushu University. This system was designed for 7 kW traction power and comprises an inflatable wing of 6 m surface area with a suspended kite control unit that is towed on a relatively short tether of 0.4 m by a truck driving at constant speed along a straight runway. To produce a controlled relative flow environment, the experiment was conducted only when the background wind speed was negligible. We recorded the time-series of 11 different sensor values acquired on the kite, the control unit and the truck. The measured data can be used to assess the effects of the towing speed, the flight mode and the lengths of the control lines on the tether force.
Dataset License: CC BY 4.0
1. Summary
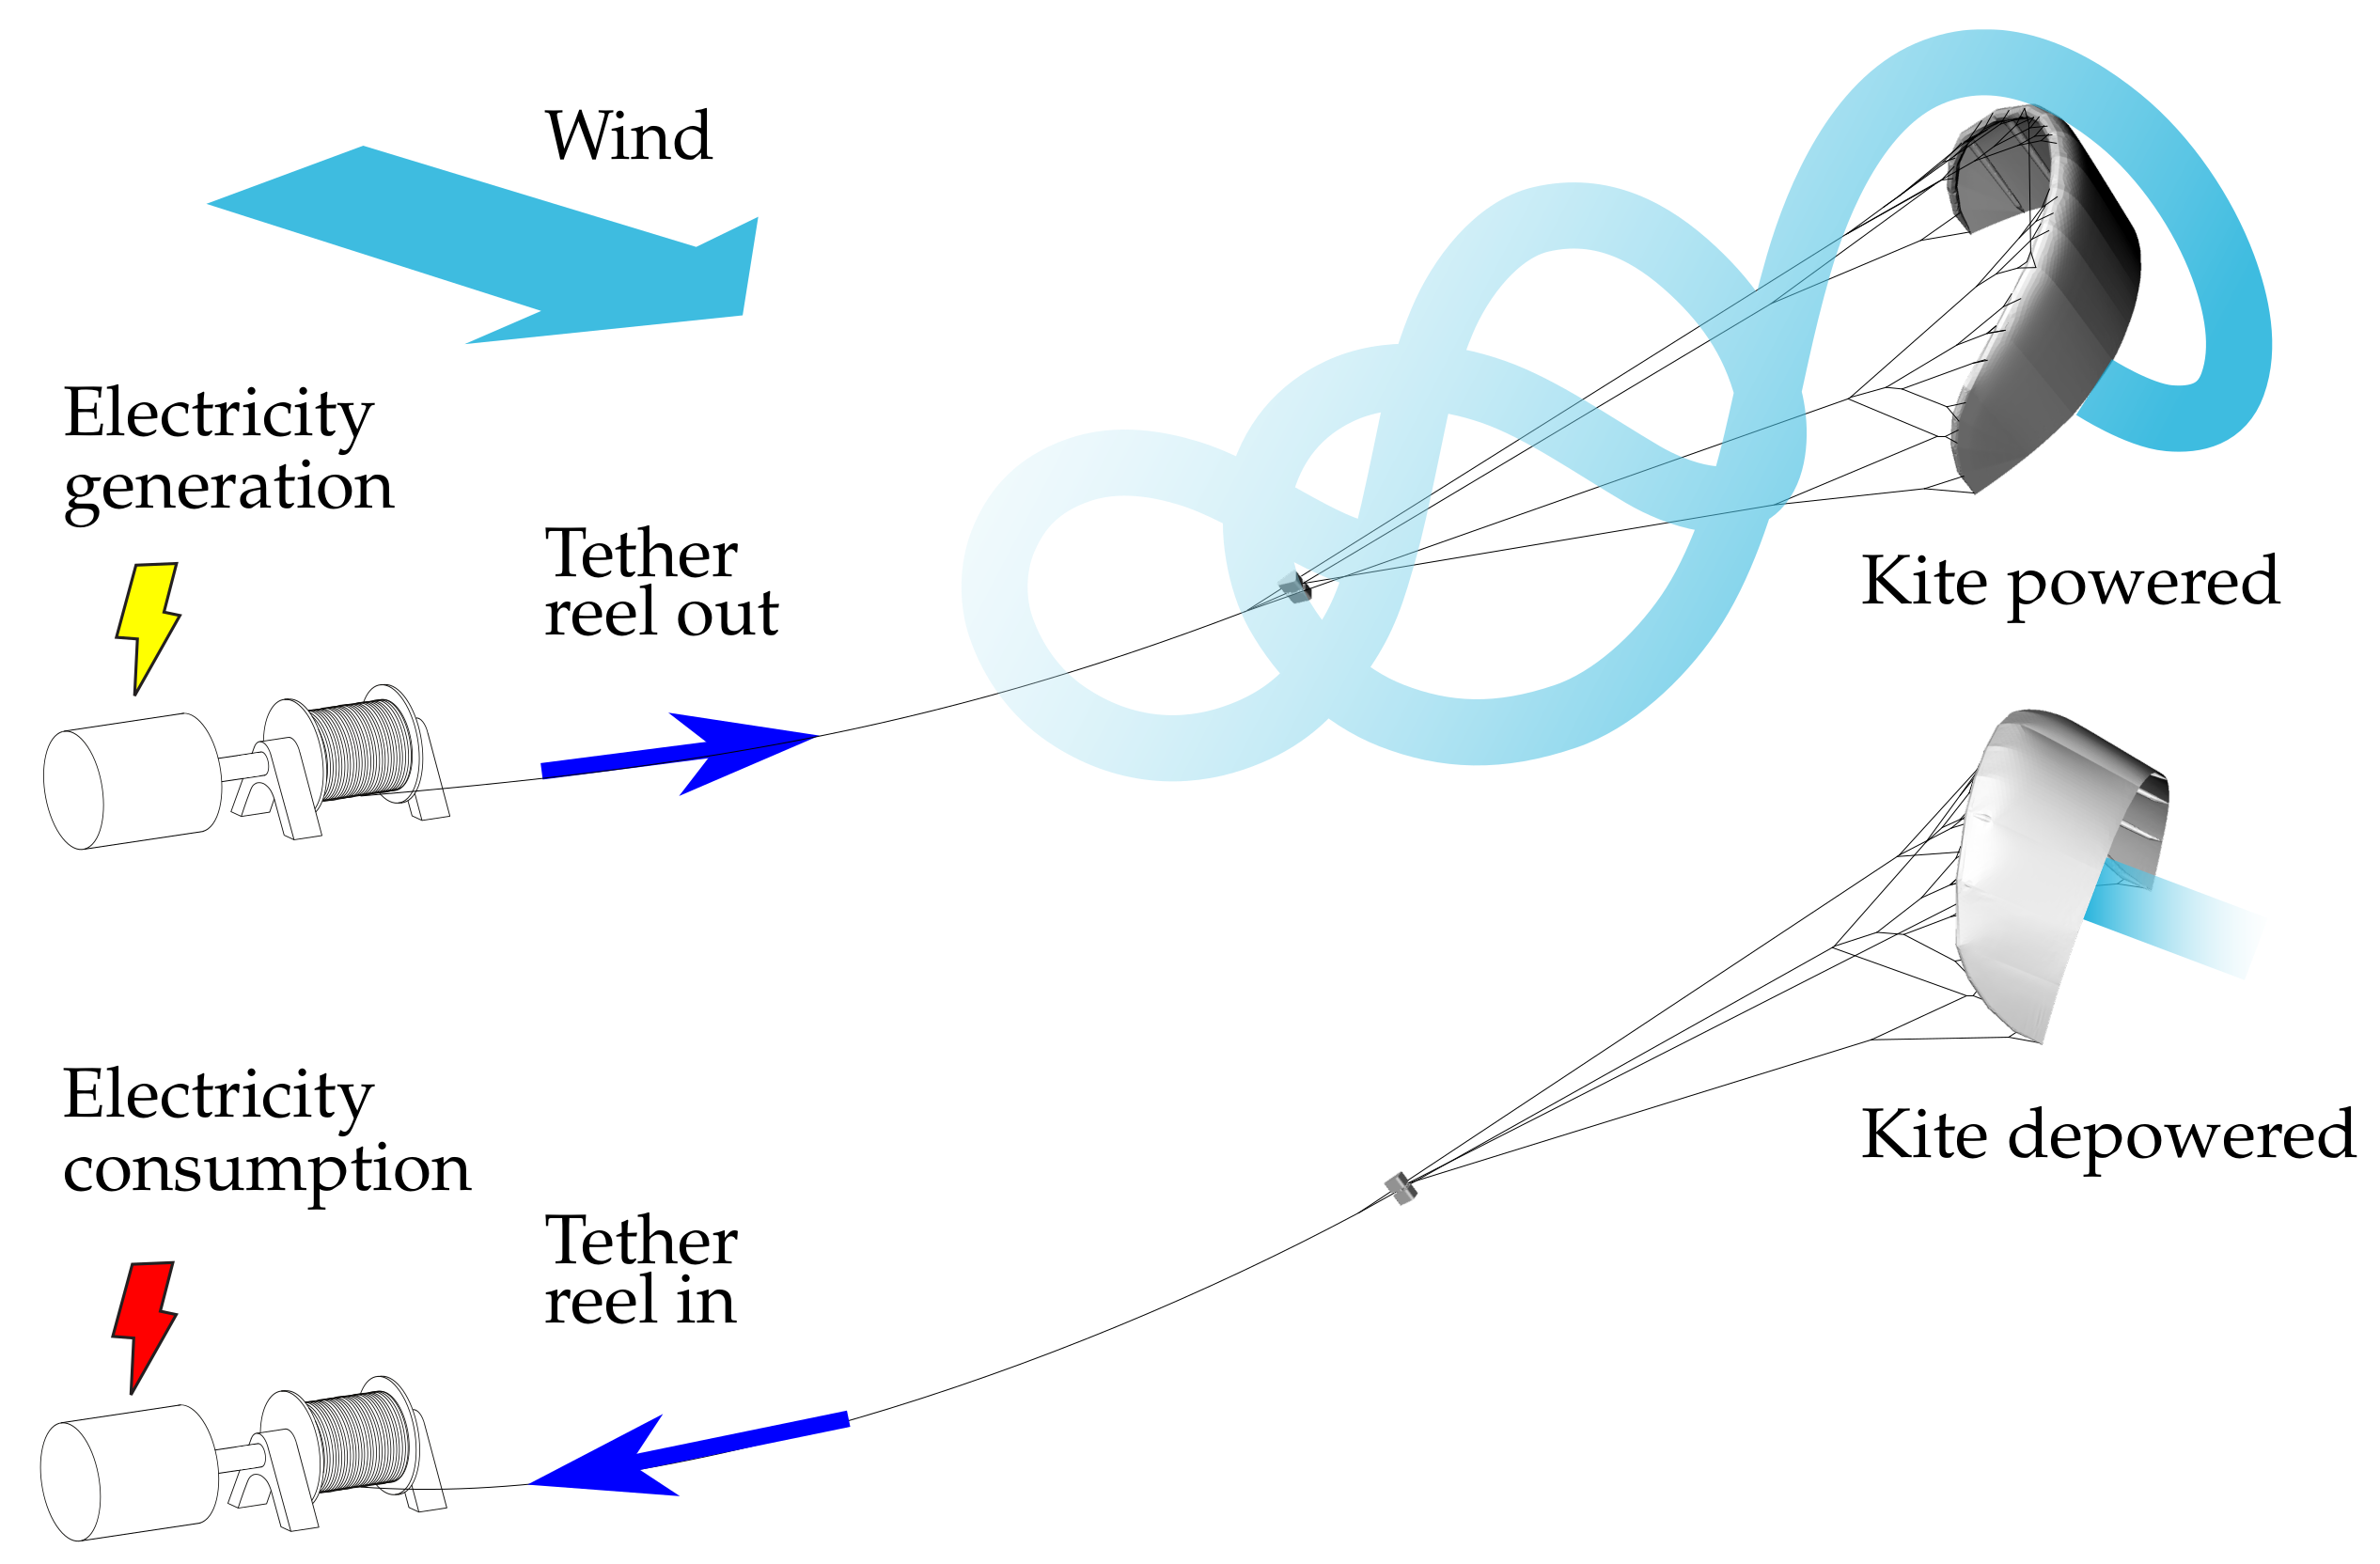
Compared to conventional tower-based wind turbines, kites can be used to harvest wind energy at higher altitudes with substantially lower material and environmental footprints [1,2,3]. Because the harvesting altitude can be continuously adjusted to the wind resource, the capacity factor of such airborne wind energy (AWE) systems can be higher [4]. A number of different harvesting concepts are currently being explored, most predominantly that of a flying device performing fast crosswind maneuvers and transferring the generated pulling force via a tether to a ground station [5]. At the ground station, the tether is reeled off a drum-generator module to convert the pulling force into electrical energy. When reaching the maximal tether length, the flight pattern of the device is changed and the tether is reeled back in, which consumes a small fraction of the previously generated energy. The working principle of such a pumping AWE system is illustrated in Figure 1.
To assess the performance of an AWE system it is important to know how the design and the operational parameters influence the generated aerodynamic force and by that also the available tether force. Due to the size restrictions of wind tunnels, tow tests have been used in the past to assess the aerodynamic characteristics of kites or tethered aircraft. Especially when choosing days with negligible wind speed, the quality of the acquired data was high.
One of the first tow test setups for systematic performance measurement of two and four-line kites was presented in [7,8]. The test rig was mounted on a car and allowed simultaneous measurement of the line angles and line forces, while driving along a straight stretch of the beach or in an aircraft hangar and steering the kite through the open roof of the car. The authors later provided an alternative performance measurement technique, employing circular crosswind flight maneuvers around a fixed ground anchor [9,10]. A similar setup based on flying the kite in crosswind maneuvers was proposed in [11]. A tow test setup with a measurement rig mounted on a trailer was used in [12] to quantify the aerodynamic characteristics of a 3 m kite flying manually-controlled maneuvers. A similar configuration is described in [13] and extended in [14] by a control strategy to fly automatic figure-of-eight maneuvers while towing. This test rig was also used for tow tests of a rigid-wing aircraft mounted on a rigid frame [15]. A static variant of this setup has been used by [16] to investigate the steering behavior of a 9 m kite operated in crosswind flight maneuvers. A fully integrated system for automated performance assessment of surfkites was presented in [17], using a steering module that was mounted on a trailer to mimic the steering actuation of a kite surfer. During the tests, the control software automatically maneuvered the kite through a set of quasi-steady flight modes to cover the entire angle of attack range of the wing. An in situ measurement technique for the aerodynamic performance of a kite with a suspended control unit during wind energy harvesting in pumping cycles was proposed in [18], using a Pitot tube and two orthogonal flow vanes mounted in the bridle line system between the wing and control unit. The general advantage of tow tests is that these generally allow for better control of the relative flow, while in situ tests during nominal flight operations, such as a pumping cycle operation, provide more realistic loading scenarios.
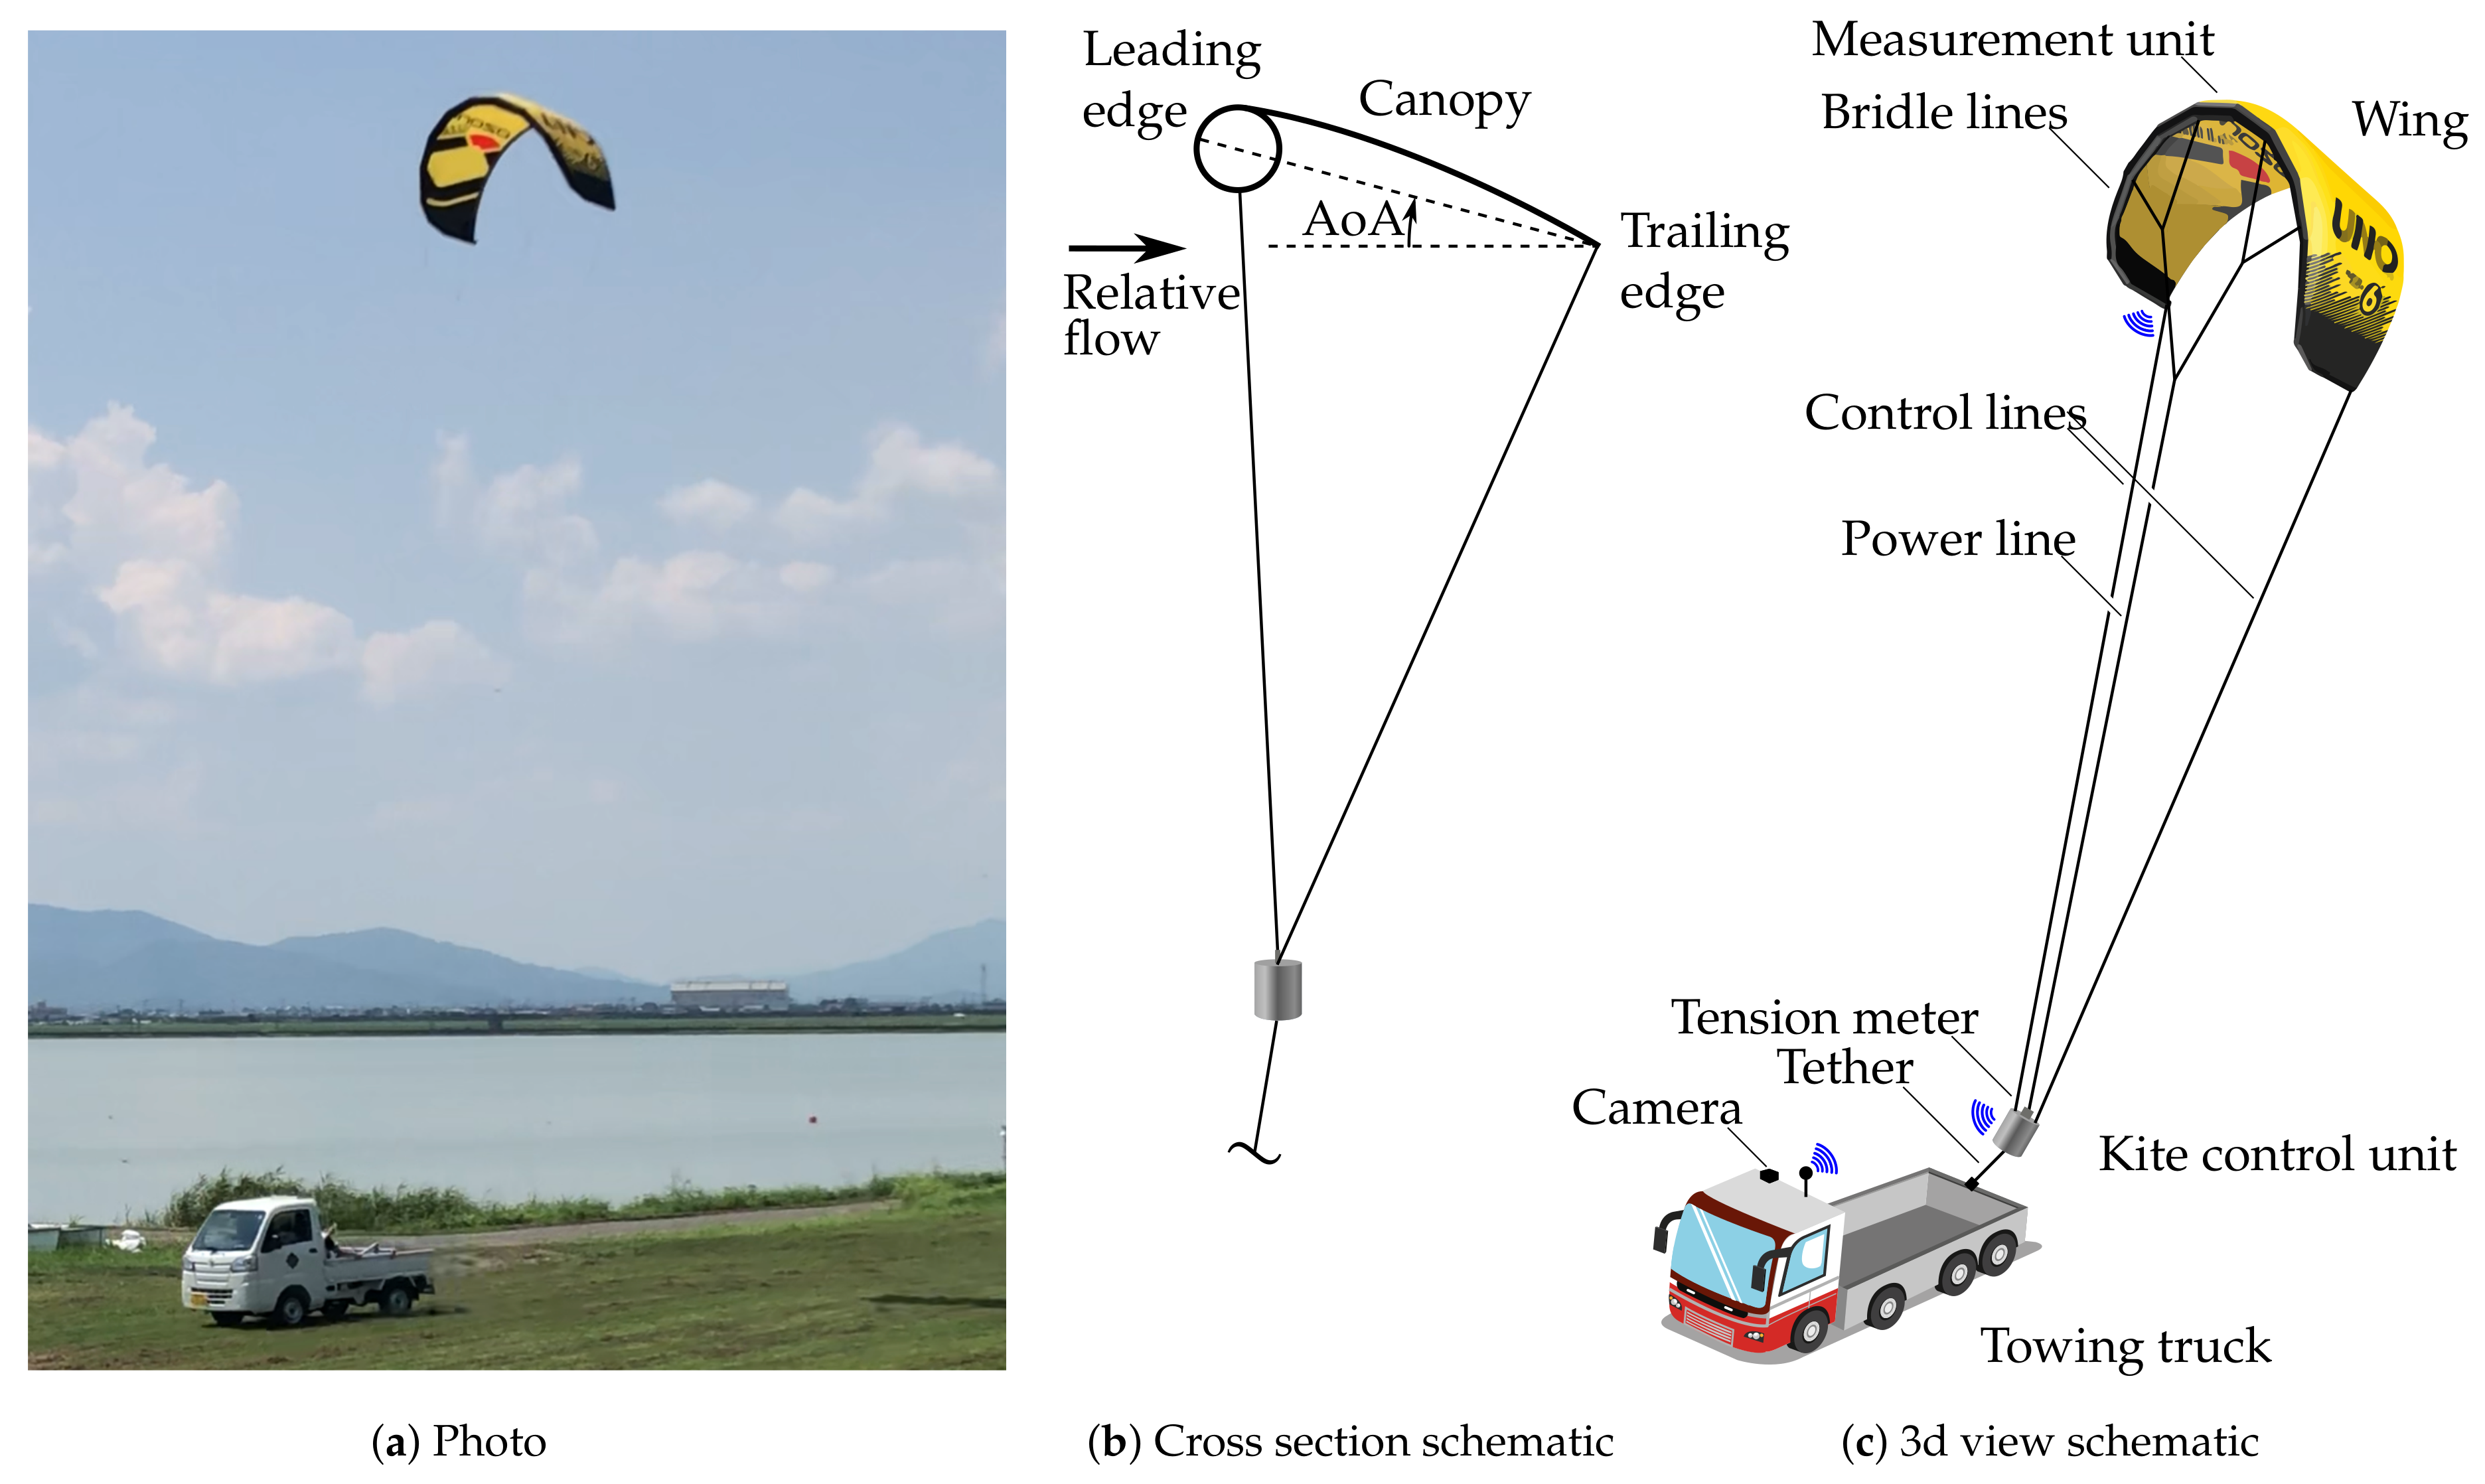
Figure 2 shows the setup used for the present measurement campaign. The experimental kite system was designed for 7 kW nominal traction power and consists of a 6 m leading edge inflatable wing and a suspended cable robot that is towed by a truck on a relatively short tether. This kite control unit (KCU) is remote-controlled by a trained human pilot from the truck. The position and orientation of the kite are determined by a measurement unit (IMU) that is mounted at the center of the wing. The tether force at the KCU is measured by a tension meter. During the tests, the towing truck was driving straight along a runway, performing U-turns when reaching the ends. To ensure high quality of the measured data, the effect of atmospheric background wind on the relative airflow generated by the towing was minimized by carrying out the tests on a day with very low wind speeds. To our knowledge, tow tests of flexible membrane kites with suspended, remote-controlled cable robots have not yet been performed. The various test setups described in the literature all used steering mechanisms that were mounted on the towing vehicle.
We have used the tow test data in a recent study on the use of machine learning algorithms for predicting the tether force [19]. The remainder of the paper is divided into three main sections. In Section 2 we describe the measurement data, in Section 3 how we collected the data and in Section 4 how the data could be used in future studies.
2. Data Description
The measurement data from seven individual tow tests are deposited as individual csv-files, each containing the relative time measured from the start of the recording, the time-series of 11 sensor values and the sampling time. The recorded data are listed in Table 1, and ordered according to the columns in the data files.
The two variables dt and S were nearly constant during the tests and are possibly less important for the AWE research community. The flight tests were classified based on the towing speed, flight mode and control line length (CLL), as shown in Table 2
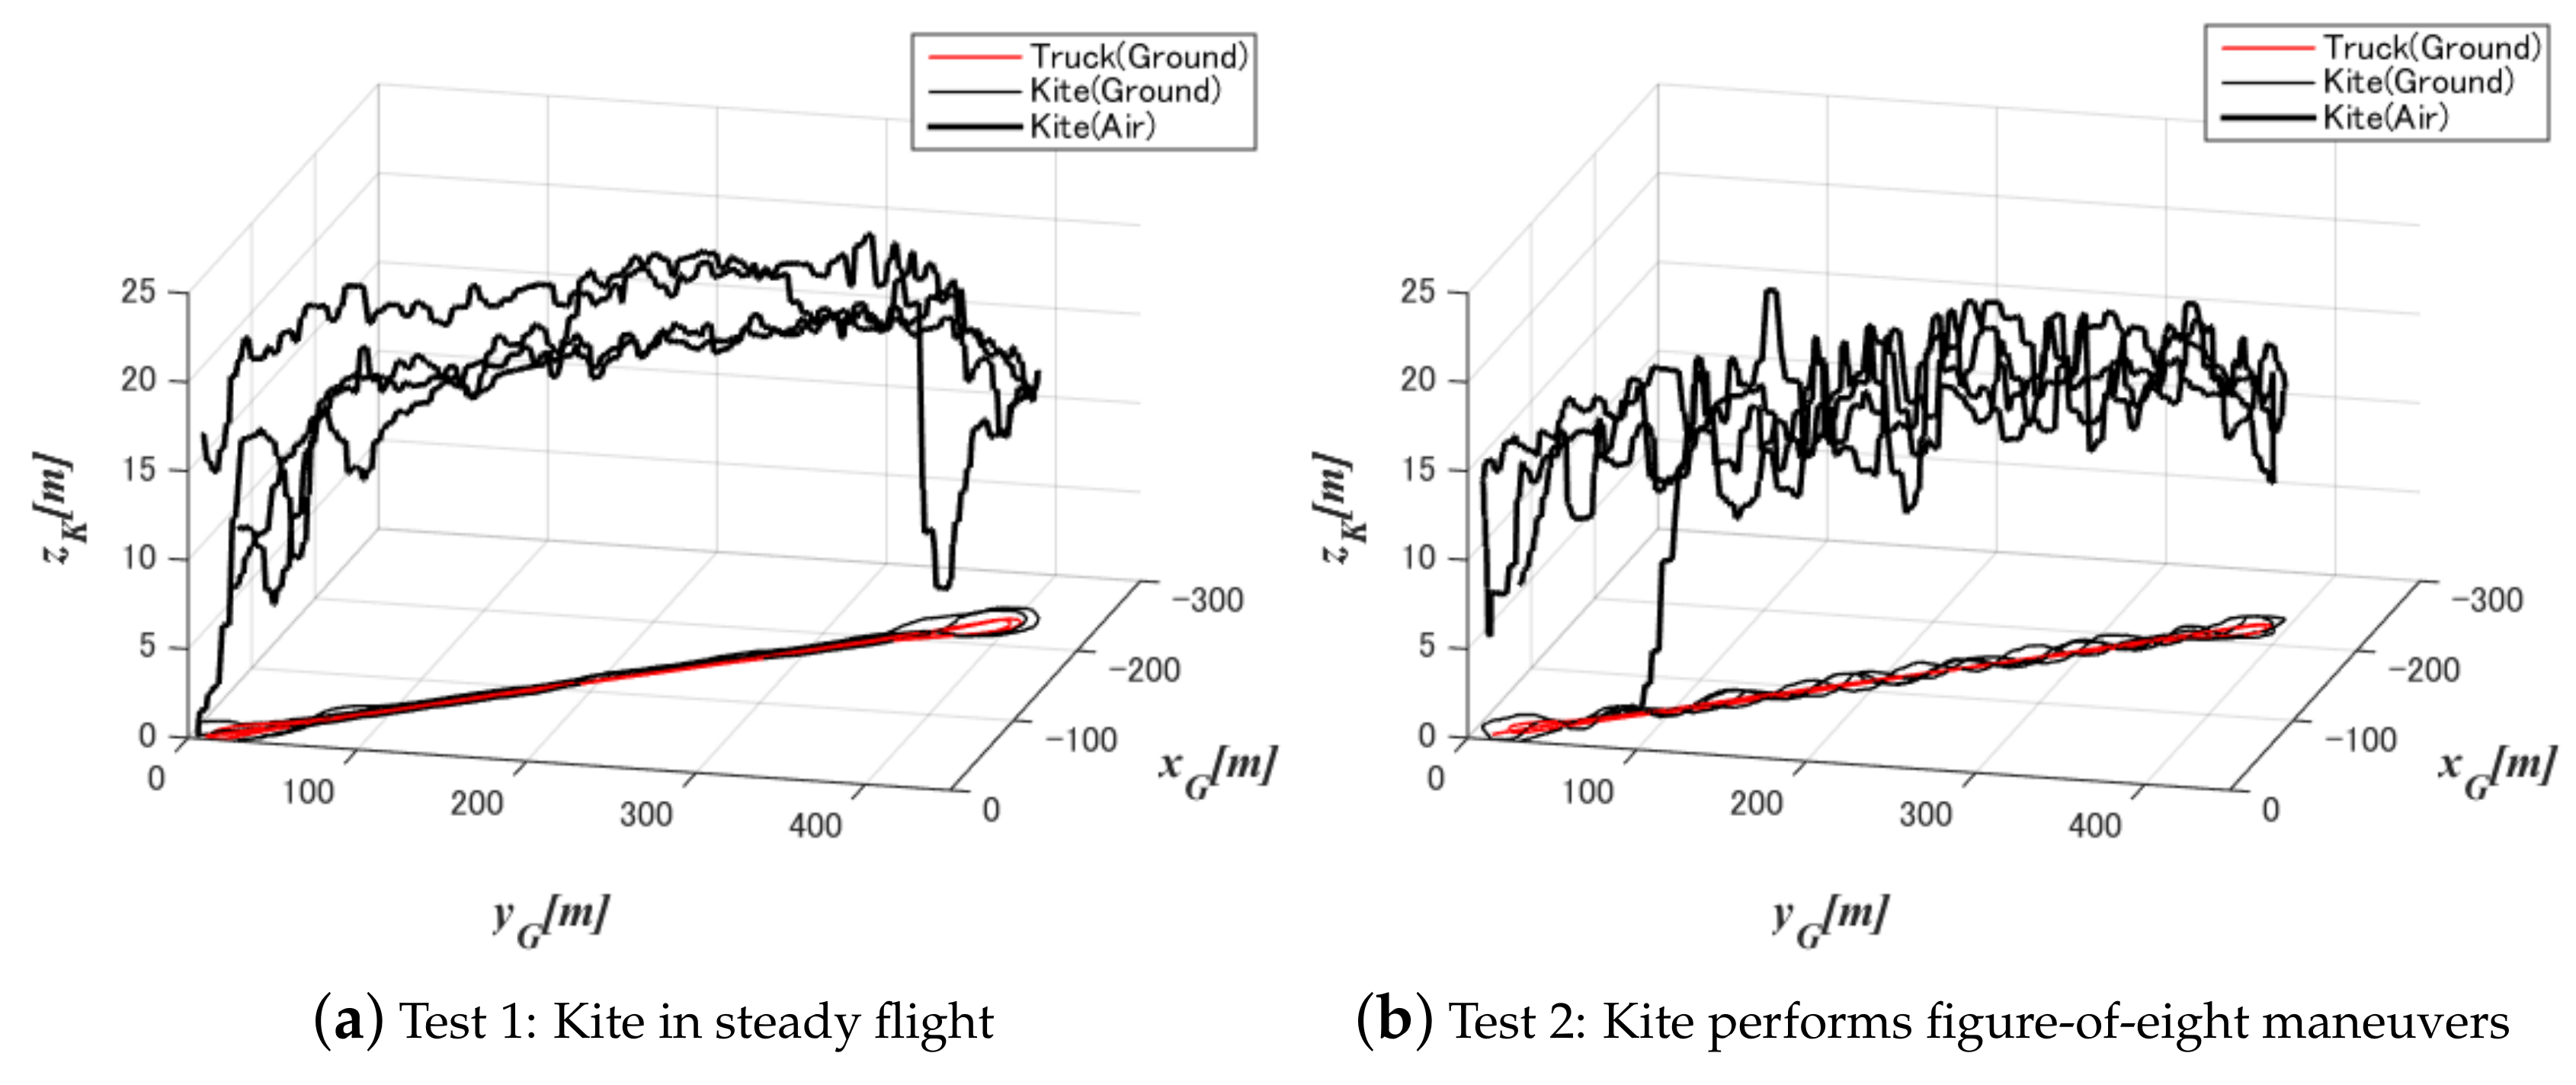
A 3D visualization of the measured flight path in tow tests 1 and 2 is presented in Figure 3. The flight path is represented in global coordinates (, , ) with its origin at the point of starting the data recording.
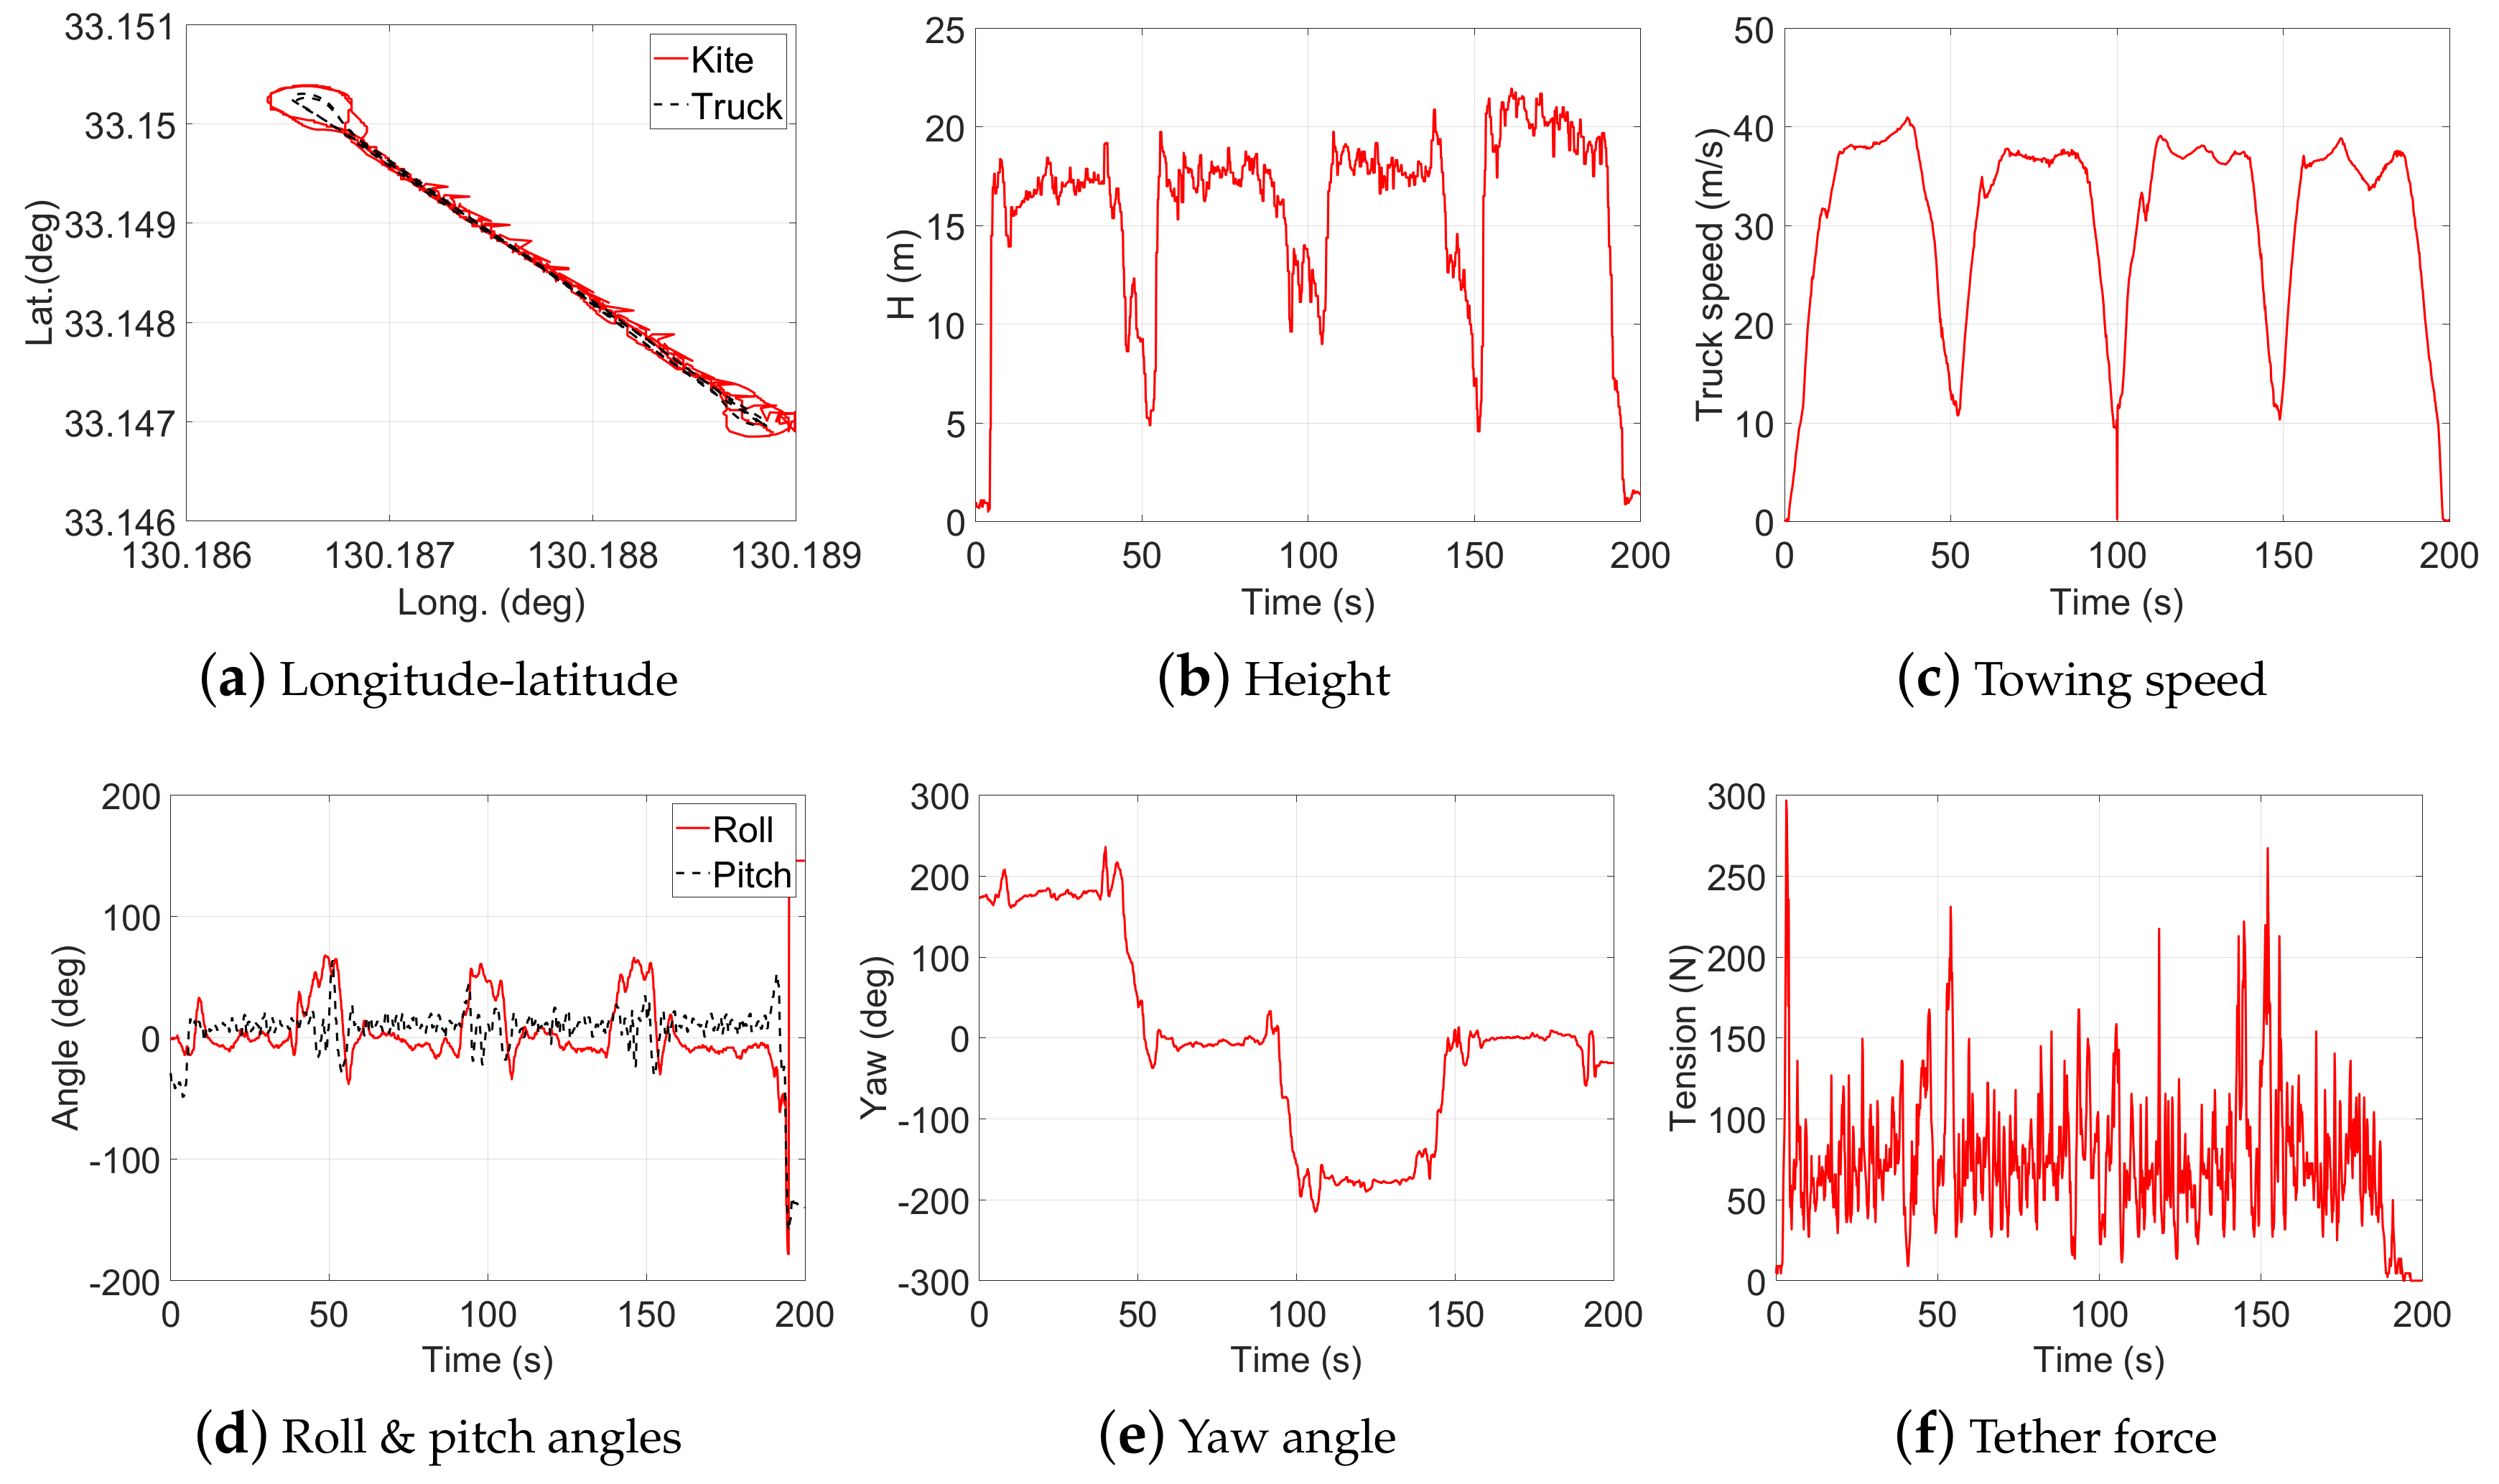
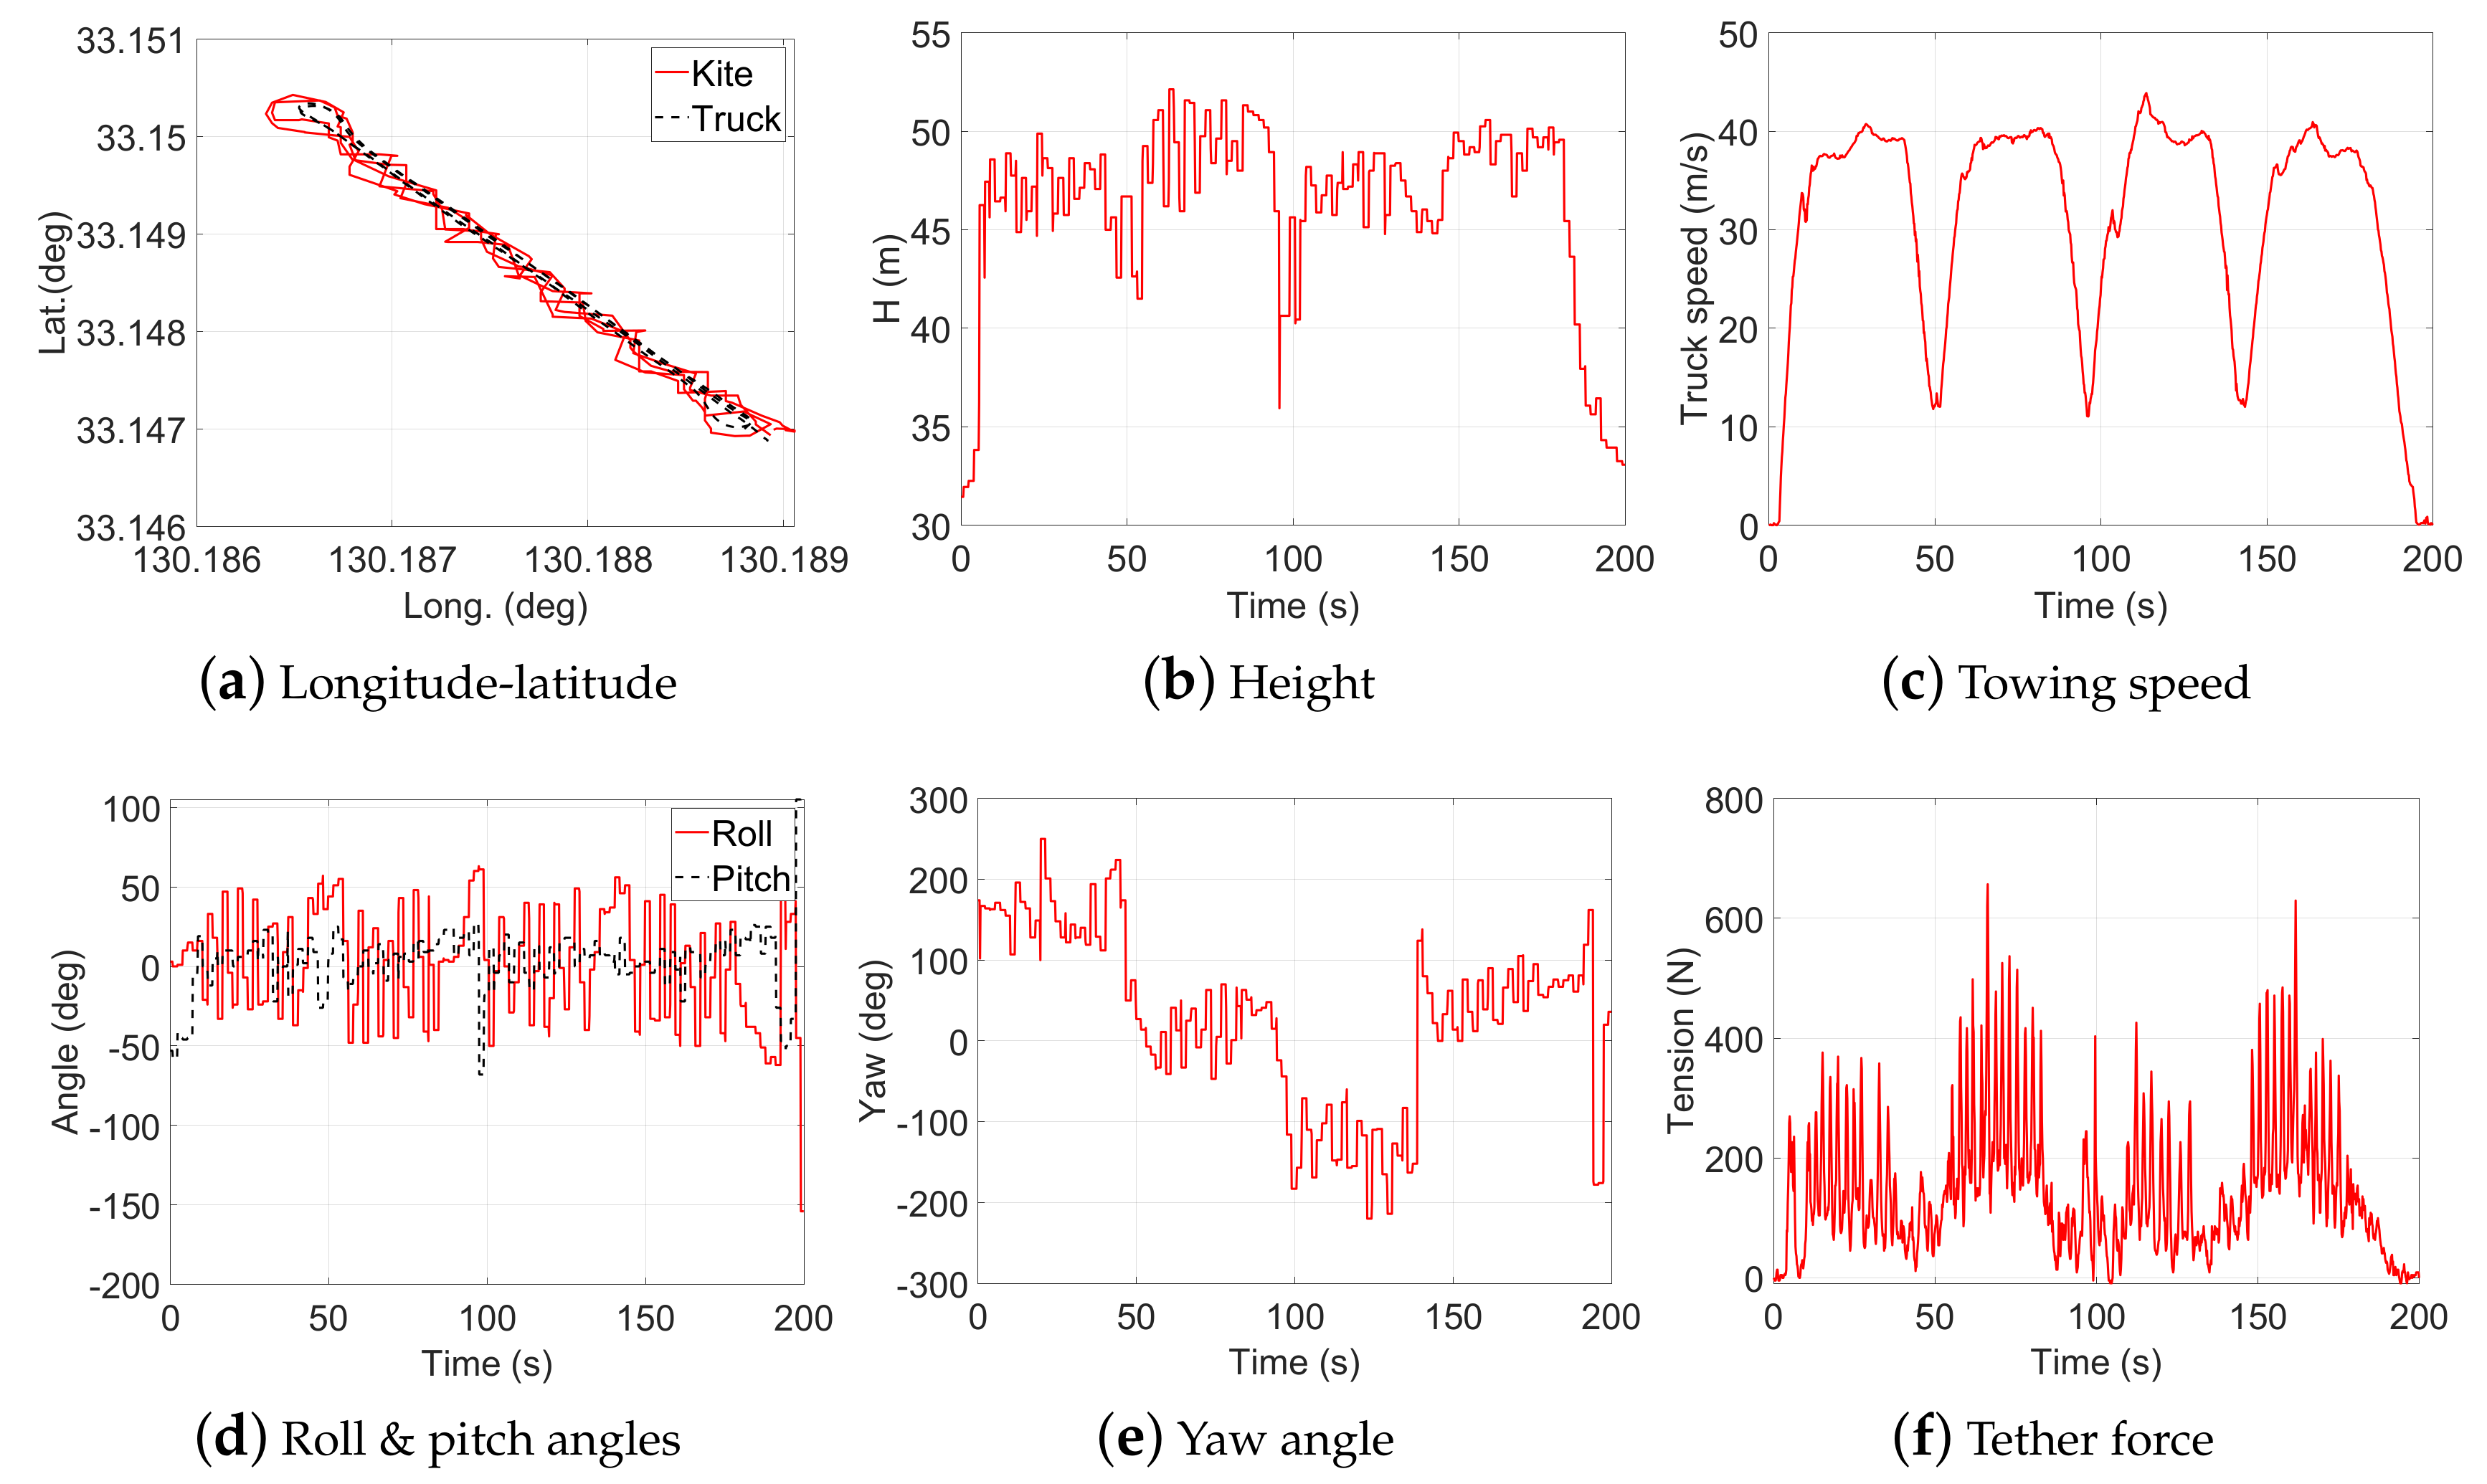
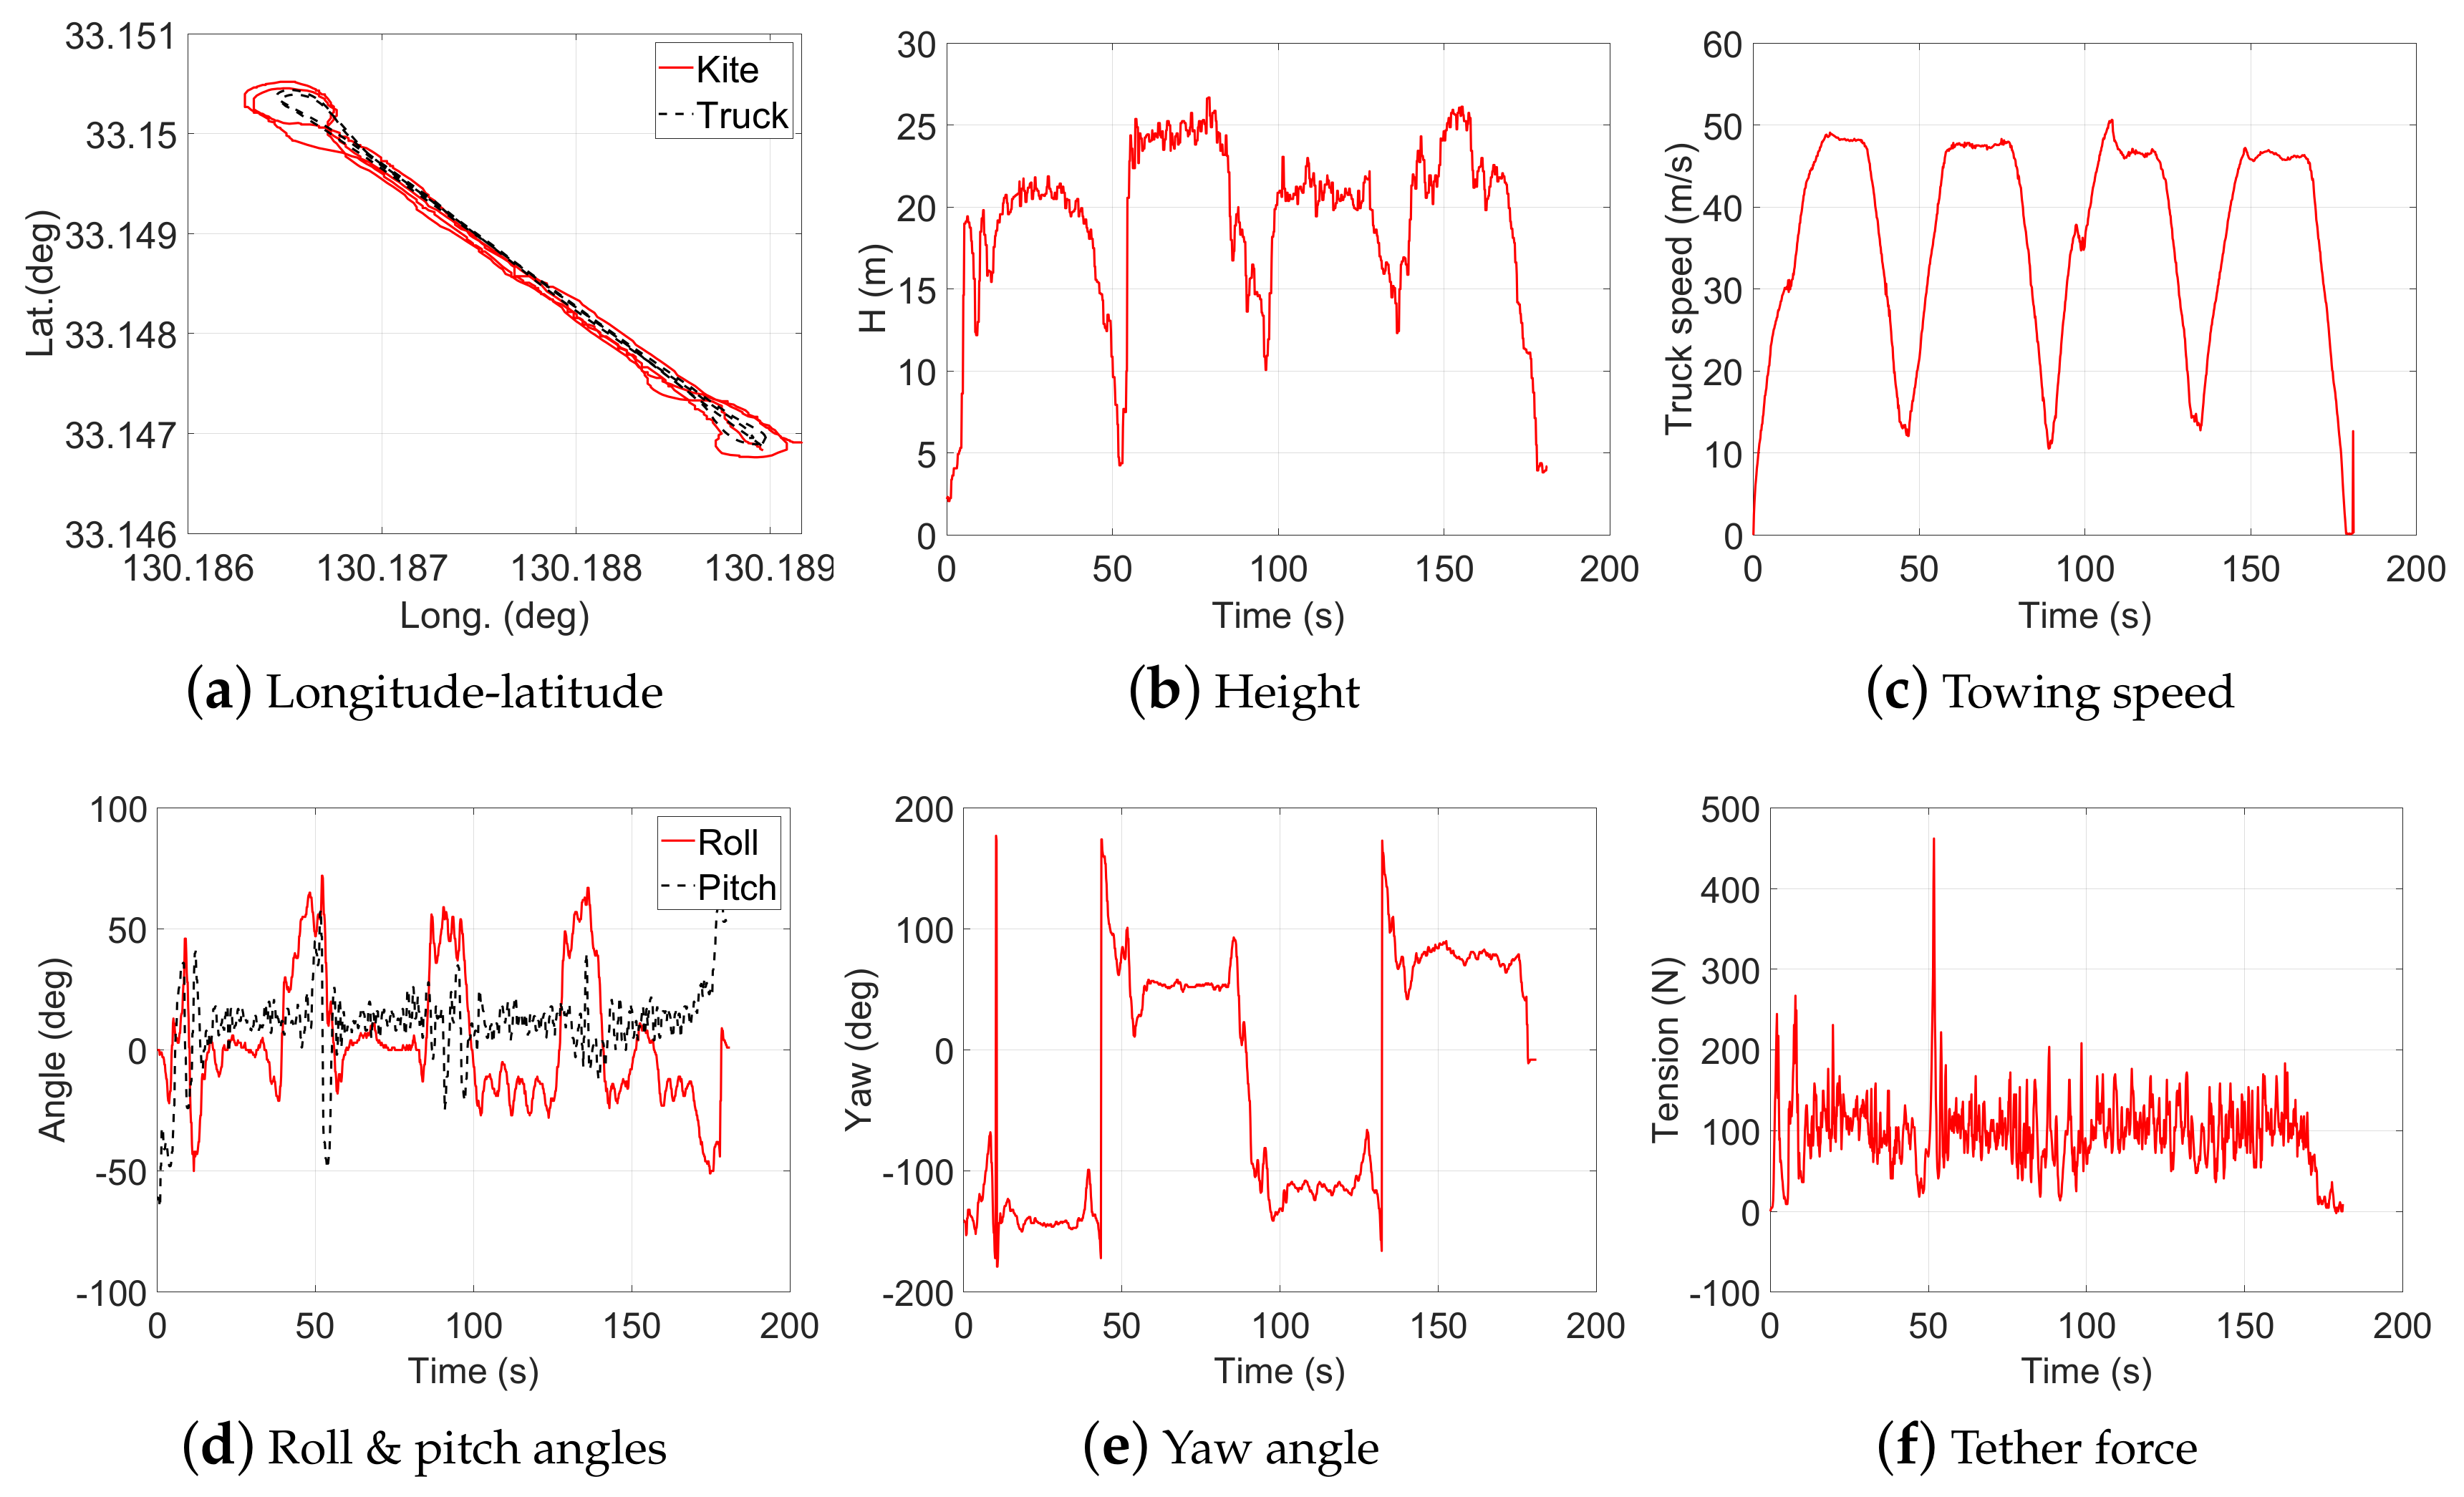
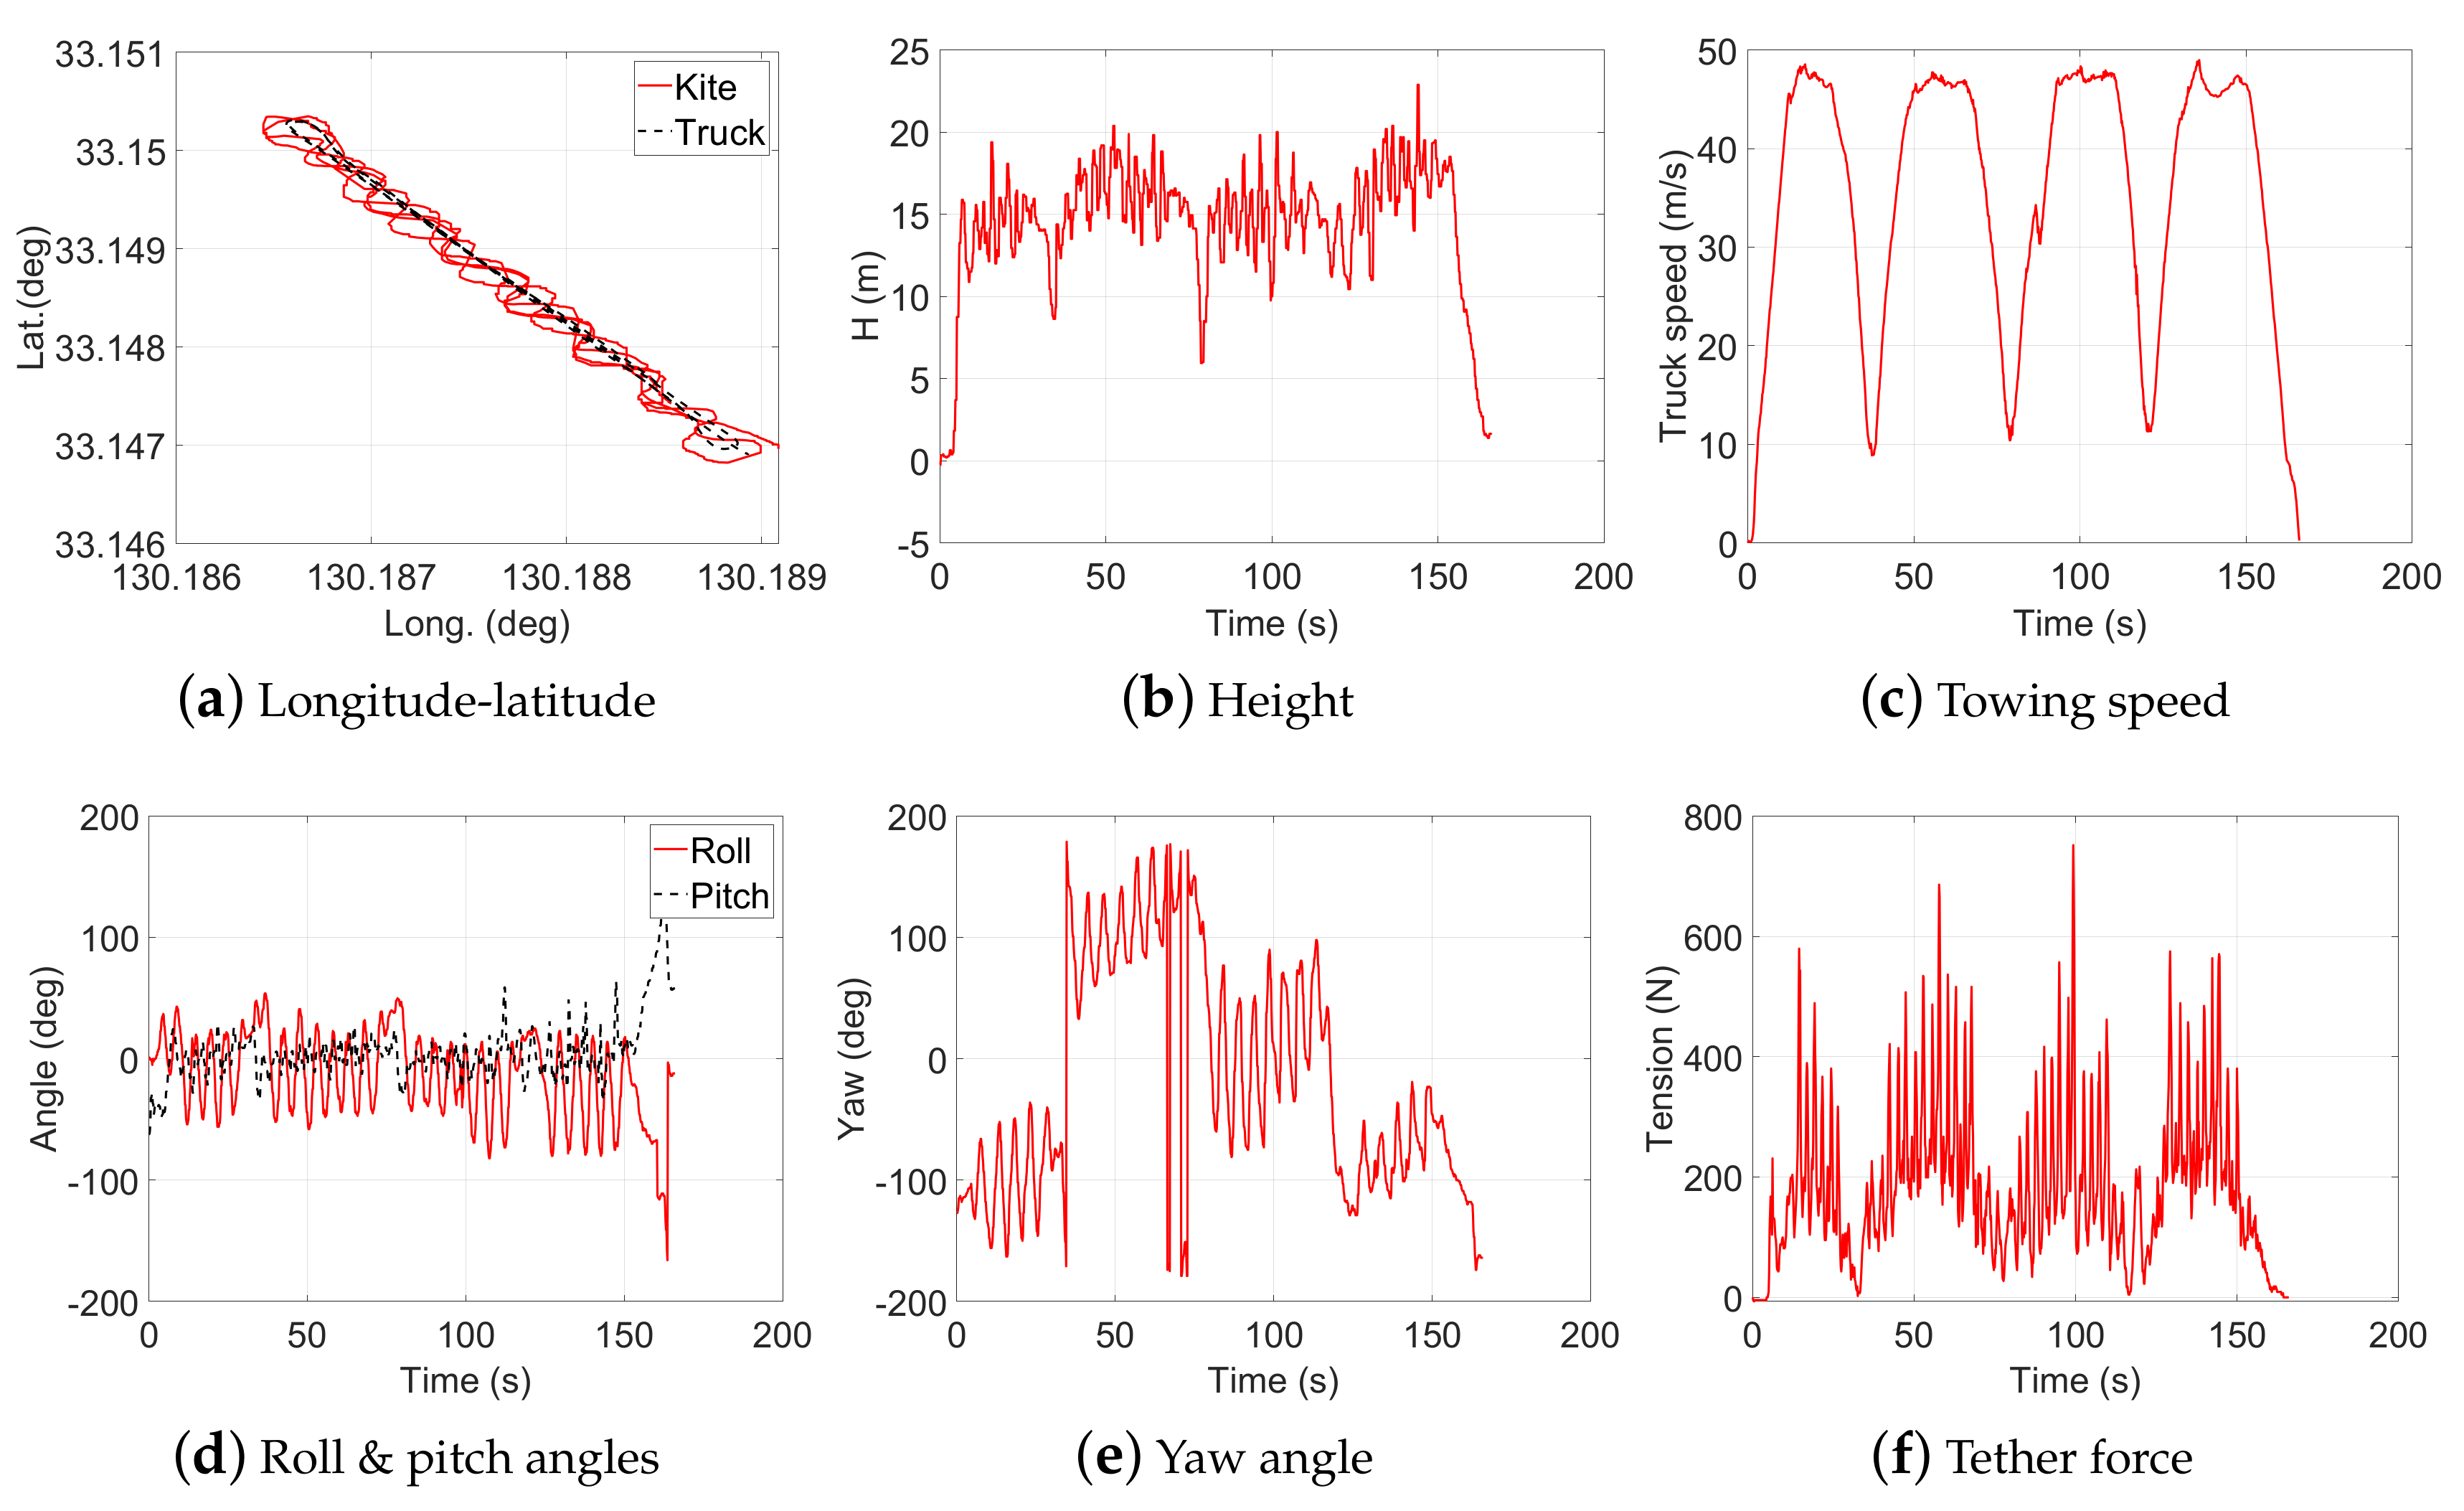
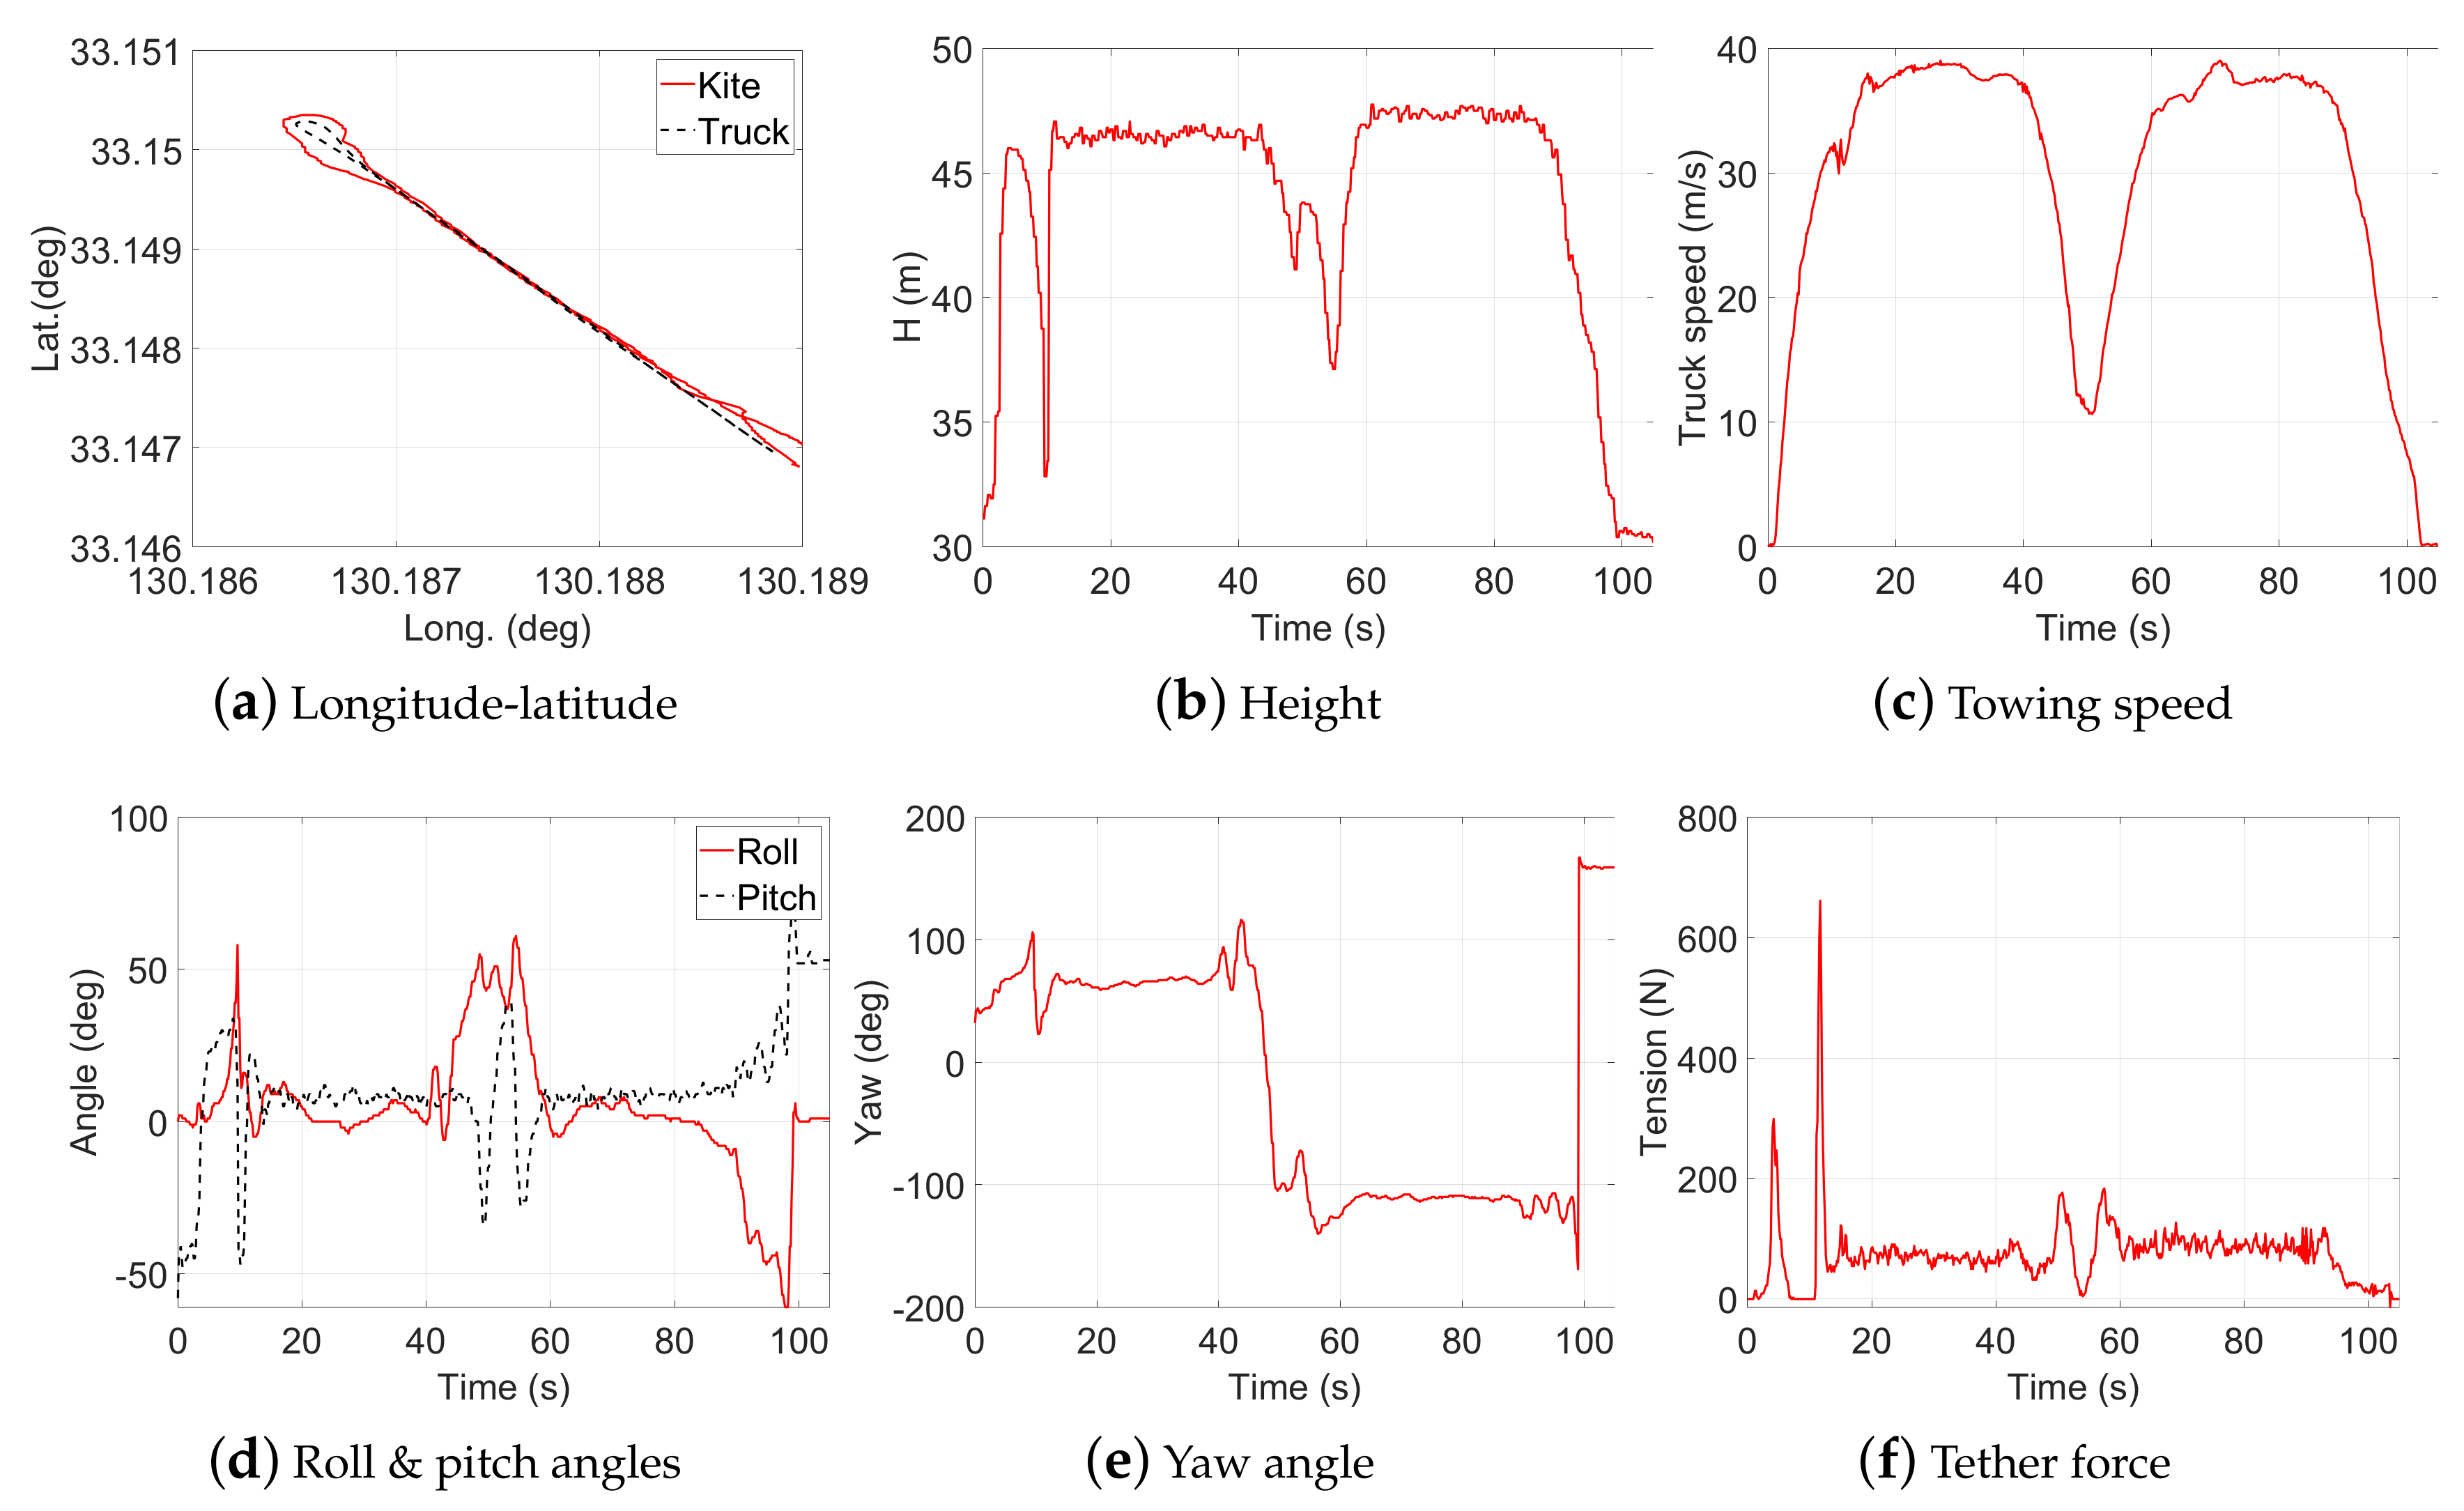
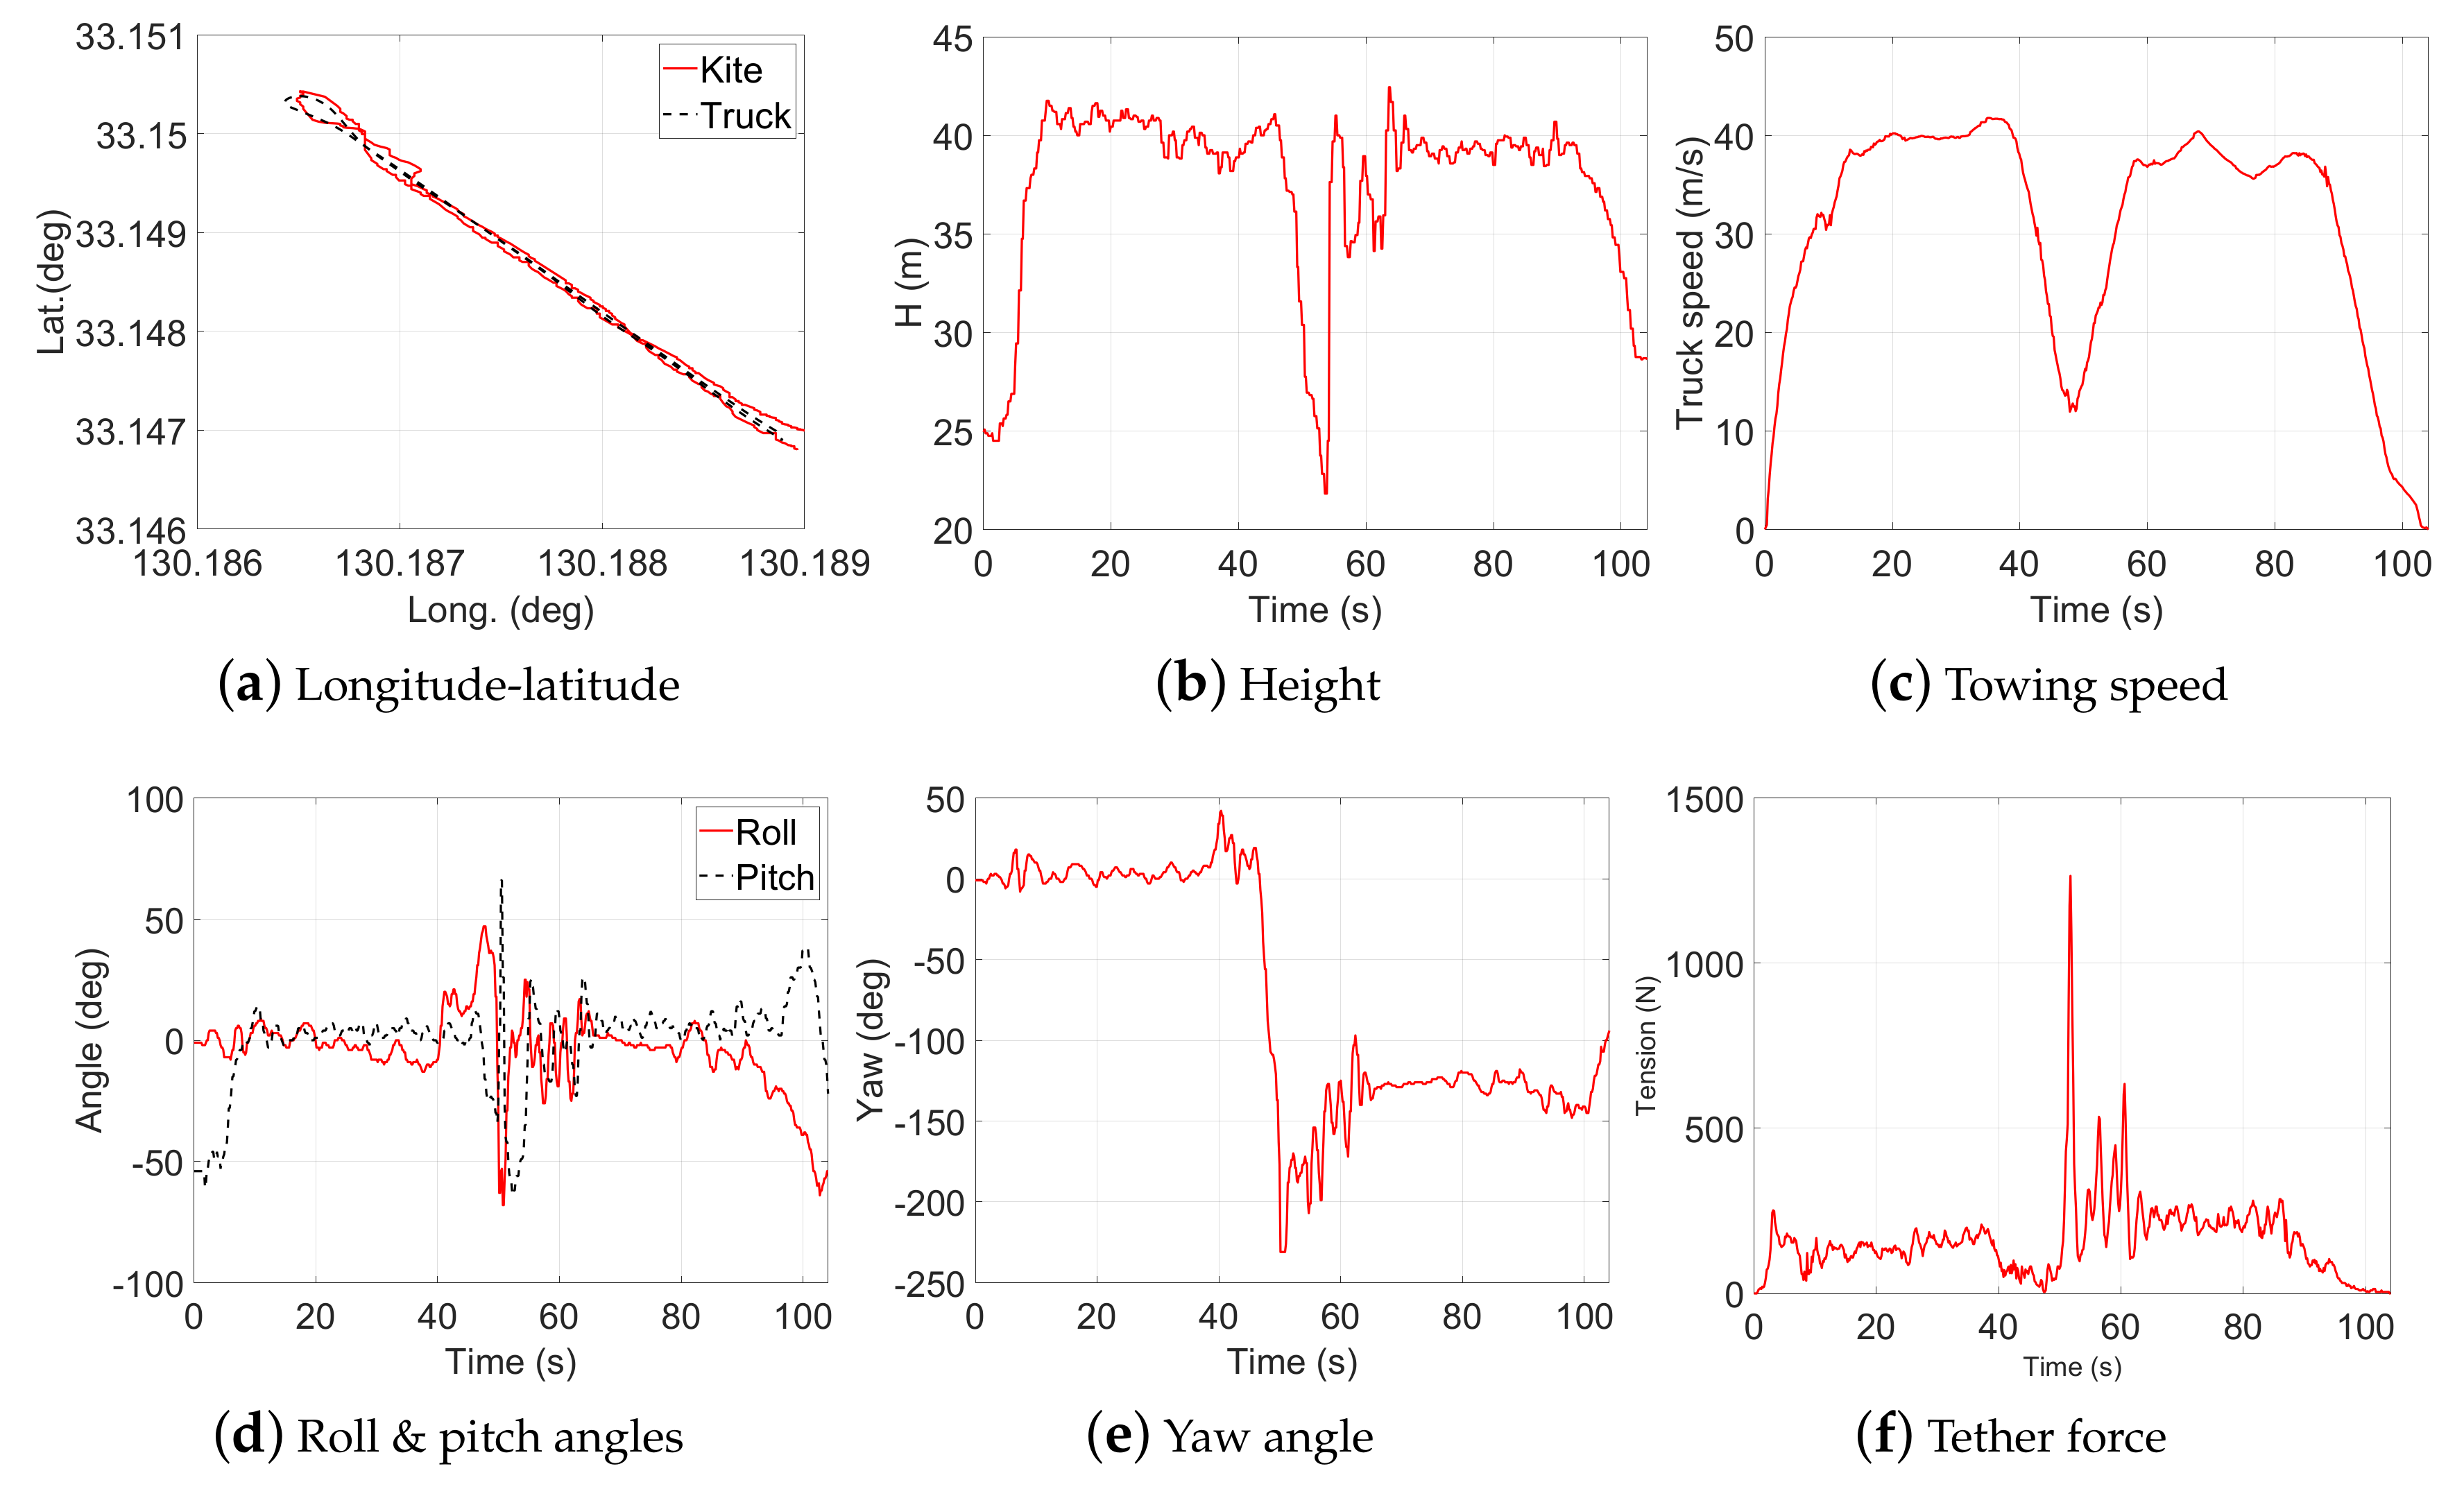
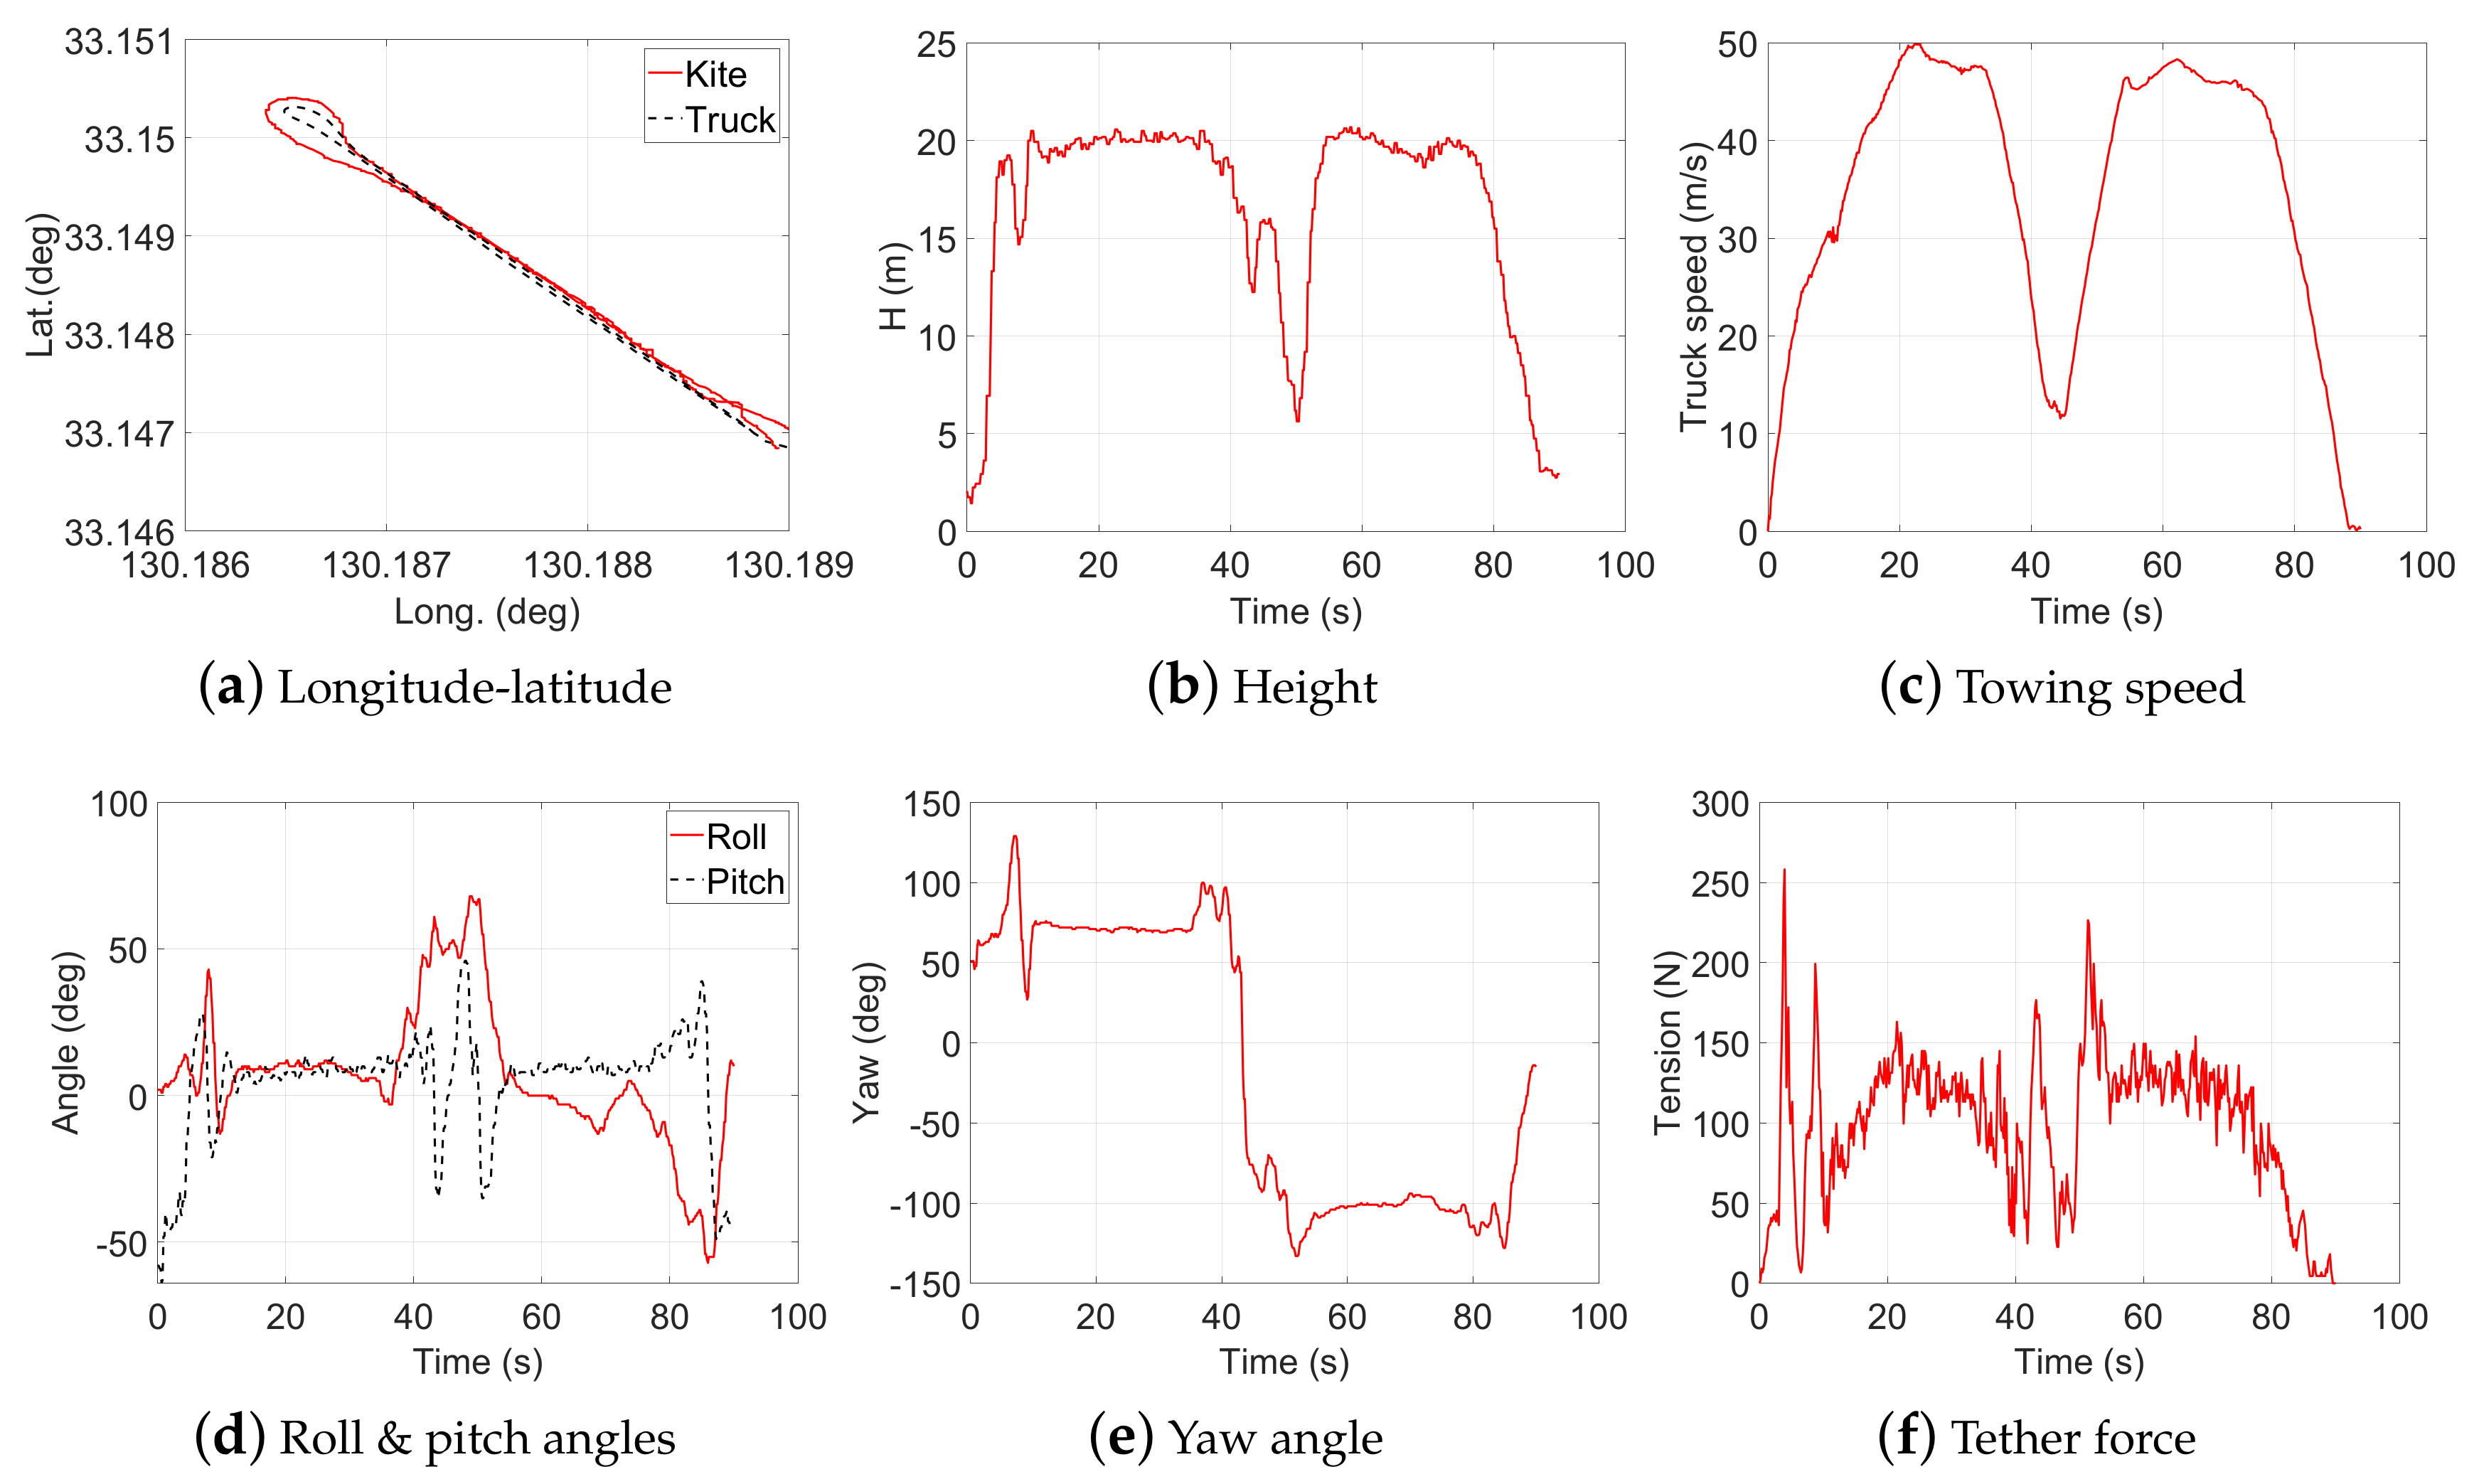
The results of tow tests 1–7 are illustrated in Figure 4, Figure 5, Figure 6, Figure 7, Figure 8, Figure 9 and Figure 10. For each figure, sub-figure (a) represents the longitude versus latitude of the kite and the truck, in red and black, respectively. Towards the ends of the runway, the truck needed to perform U-turns. In order to do this, any flight maneuvers were stopped and the kite was positioned in a steady flight state towards the side of the turning truck, and in this way pulled around during the U-turns. As a consequence, the turning kite was tracing a larger radius than the turning truck. It is straightforward to distinguish figure-of-eight flight maneuvers from the fluctuation along the runway, as shown in tests 2 and 4.
Sub-figure (b) represents the height of the kite, completing the information about the flight path for each test. It is notable that the height decreased during the turn as a result of the decrease in towing speed, which is illustrated in sub-figure (c). Height and towing speed are strongly coupled and the corresponding diagrams show, thus, similar time-series. Again, it is straighforward to distinguish steady flight (tests 1, 3, 5, 6 and 7) and flight in figure-of-eight maneuvers (tests 2 and 4) by the fluctuations in height.
Sub-figures (d) and (e) represent the orientation/attitude of the kite. While sub-figure (d) shows the time-series of the roll and pitch angles, sub-figure (e) separately shows the yaw behavior, to illustrate the correlation with the height and towing speed shown in sub-figures (b) and (c), respectively. It is important to note that the body-fixed reference frame of the kite, in which we measured roll, pitch and yaw, was similar to the body-fixed reference frame of a conventional aircraft. The x-axis pointed along the chord line of the wing, from trailing towards leading edge. The y-axis was perpendicular to the x-axis and pointed towards the right wing tip. The z-axis pointed towards the towing truck and was perpendicular to the -plane according to the right-hand rule. The measurement unit (MU) was mounted behind the leading edge tube at the connection to the strut tube.
3. Methods
3.1. Setup and Design of the Experiment
The main objective of the tow tests was to measure the pulling force of a kite, under controlled relative flow conditions, as a function of design and operational parameters. The aim was to use a test setup that was inexpensive while at the same time being as close as possible to a complete AWE system using a flexible membrane wing with suspended kite control unit, as described in [6,20,21,22,23]. This was achieved by the tow test setup illustrated in Figure 2.
The kite was a regular surfkite, while the KCU and measurement equipment were mostly made using off-the-shelf components. The kite was connected to the KCU by three separate lines: the power line, which collected the major part of the aerodynamic load on the wing via multiple bridle lines that were attached along the leading edge tube, and two control lines, which connected to the tips of the leading edge tube. The power line was kept at a constant length of 13.3 m (measured from the KCU to the first line split). We used control lines of three different lengths, 13.4, 13.6 and 13.8 m, to adjust the angle of attack of the wing over the different tests. A schematic cross section indicating the effect of the control line length is illustrated from a side view in Figure 2b. The KCU was connected to the truck deck by a short tether with a constant length of 0.4 m. For the next stages of this research project, we planned to use a much longer tether to allow the kite to sweep a larger area and to reach higher altitudes for energy harvesting in a configuration similar to the one depicted in Figure 1. The pulling force of the towed wing was measured by a voltage meter which was attached to the KCU. To minimize the effect of atmospheric background wind on the relative airflow generated by the towing, the tow tests were carried out on a day with very little wind.
The experimental work comprises seven individual experiments outlined in Table 2, for different combinations of towing speed, kite maneuvering and control line length. For tests 1–4, the truck followed a continuous path A–B–A–B–A on the runway (see Figure 11), performing a total of two loops per test.
Each time the truck reached the end points A or B, it performed a U-turn at a reduced speed of 20 km/h. As a result of the reduced towing speed, the height of the kite also decreased, as indicated in Figure 3. For tests 5–7, only a single loop was performed. In Figure 4, Figure 5, Figure 6, Figure 7, Figure 8, Figure 9 and Figure 10, the sub-figures b, c, e and f show the same sinusoidal pattern, clearly indicating the number of towing loops. During towing, the kite was either controlled in figure-of-eight flight maneuvers, or kept in a steady state of flight by maintaining a constant position with respect to the truck.
3.2. System Components
In this subsection we describe the different system components in more detail. Based on this information, it should be possible to build a similar experimental setup, perform similar tests and reproduce our data. The relevant technical specifications of the electrical motor and its driver and of all sensors are listed in Table 3, Table 4, Table 5, Table 6, Table 7, Table 8, Table 9 and Table 10.
3.2.1. Kite and Tether
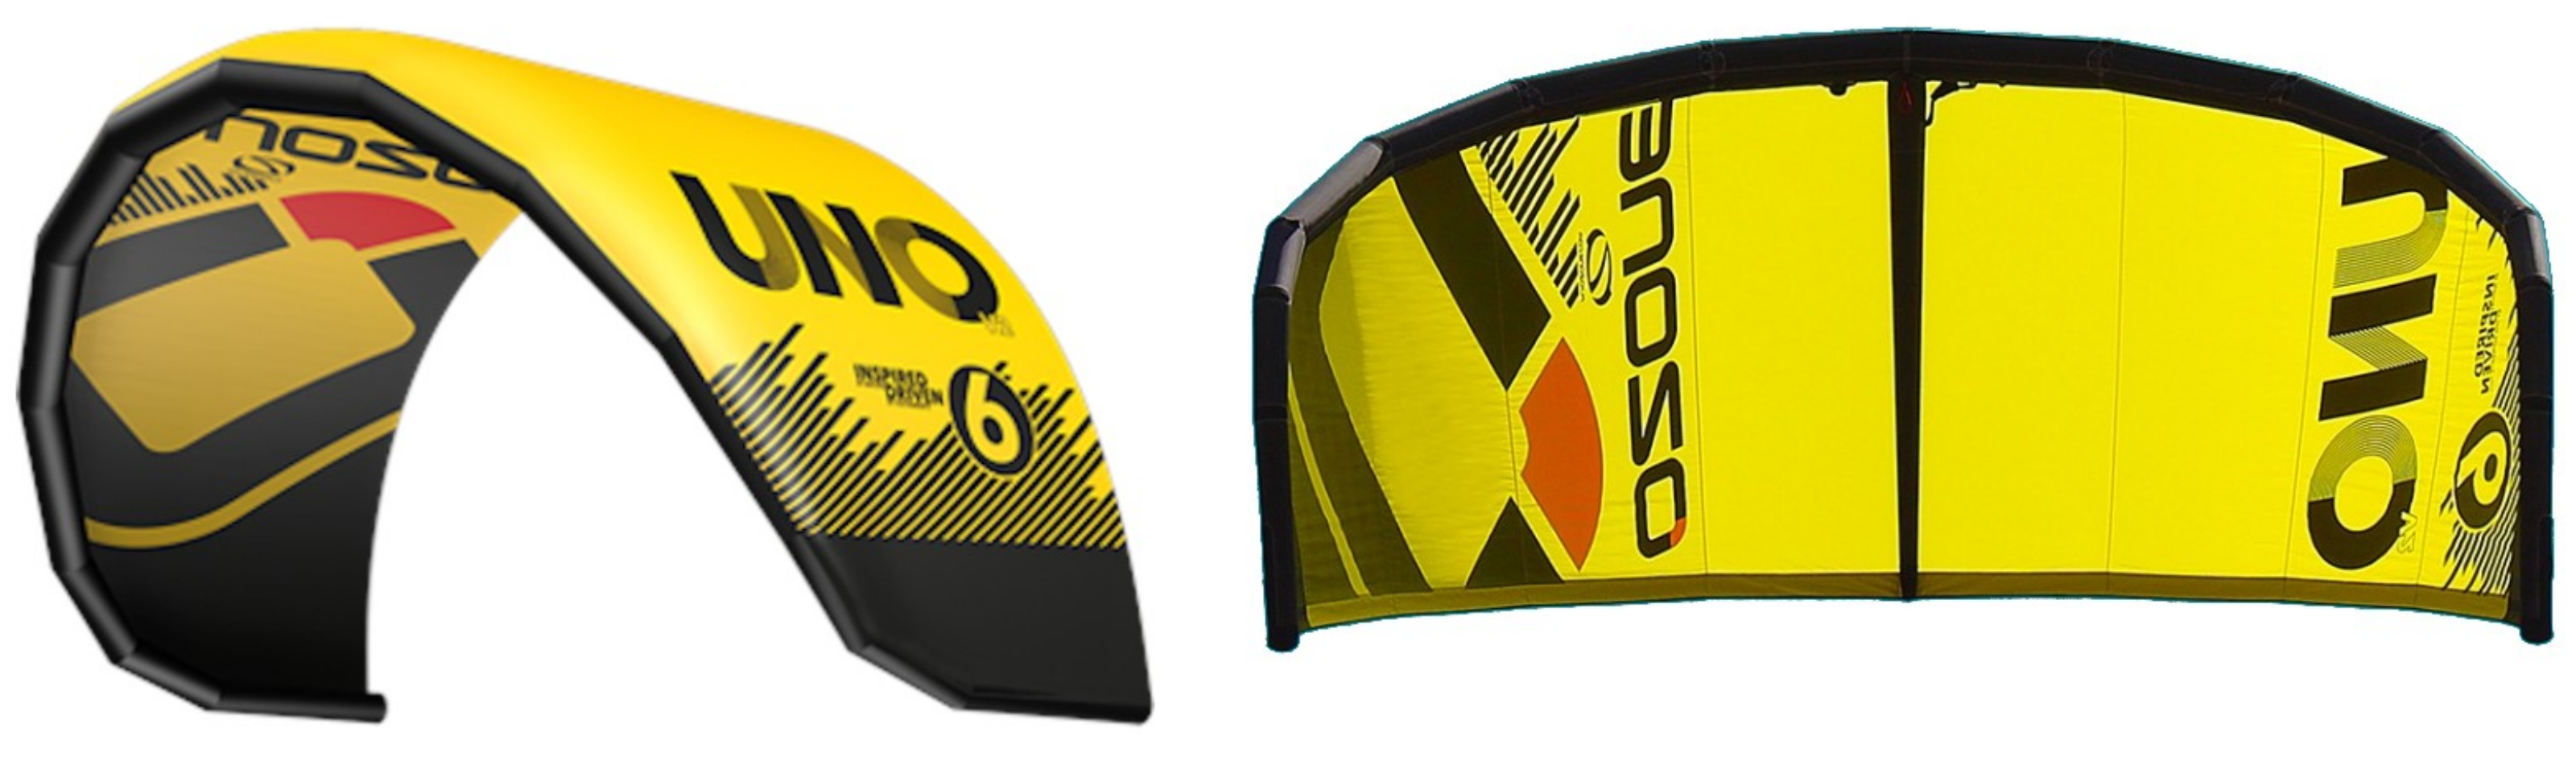
For our tests we used an UNO V2 surfkite with a 6 m wing surface area, developed by OZONE [24] (Figure 12).
This leading edge inflatable tube kite is a bow kite with a single strut supporting the canopy. The power and control lines, and the short tether, are made of Dyneema®, which is a light-weight high-performance fiber made of ultra-high molecular weight polyethylen. The power line and the tether can withstand a maximum tensile force of 2500 N. As shown in Figure 2c the power line splits into four bridle lines that support the leading edge tube. The control lines attach the tips of the leading edge tube. This layout is common for small surf kites.
3.2.2. Kite Control Unit (KCU)
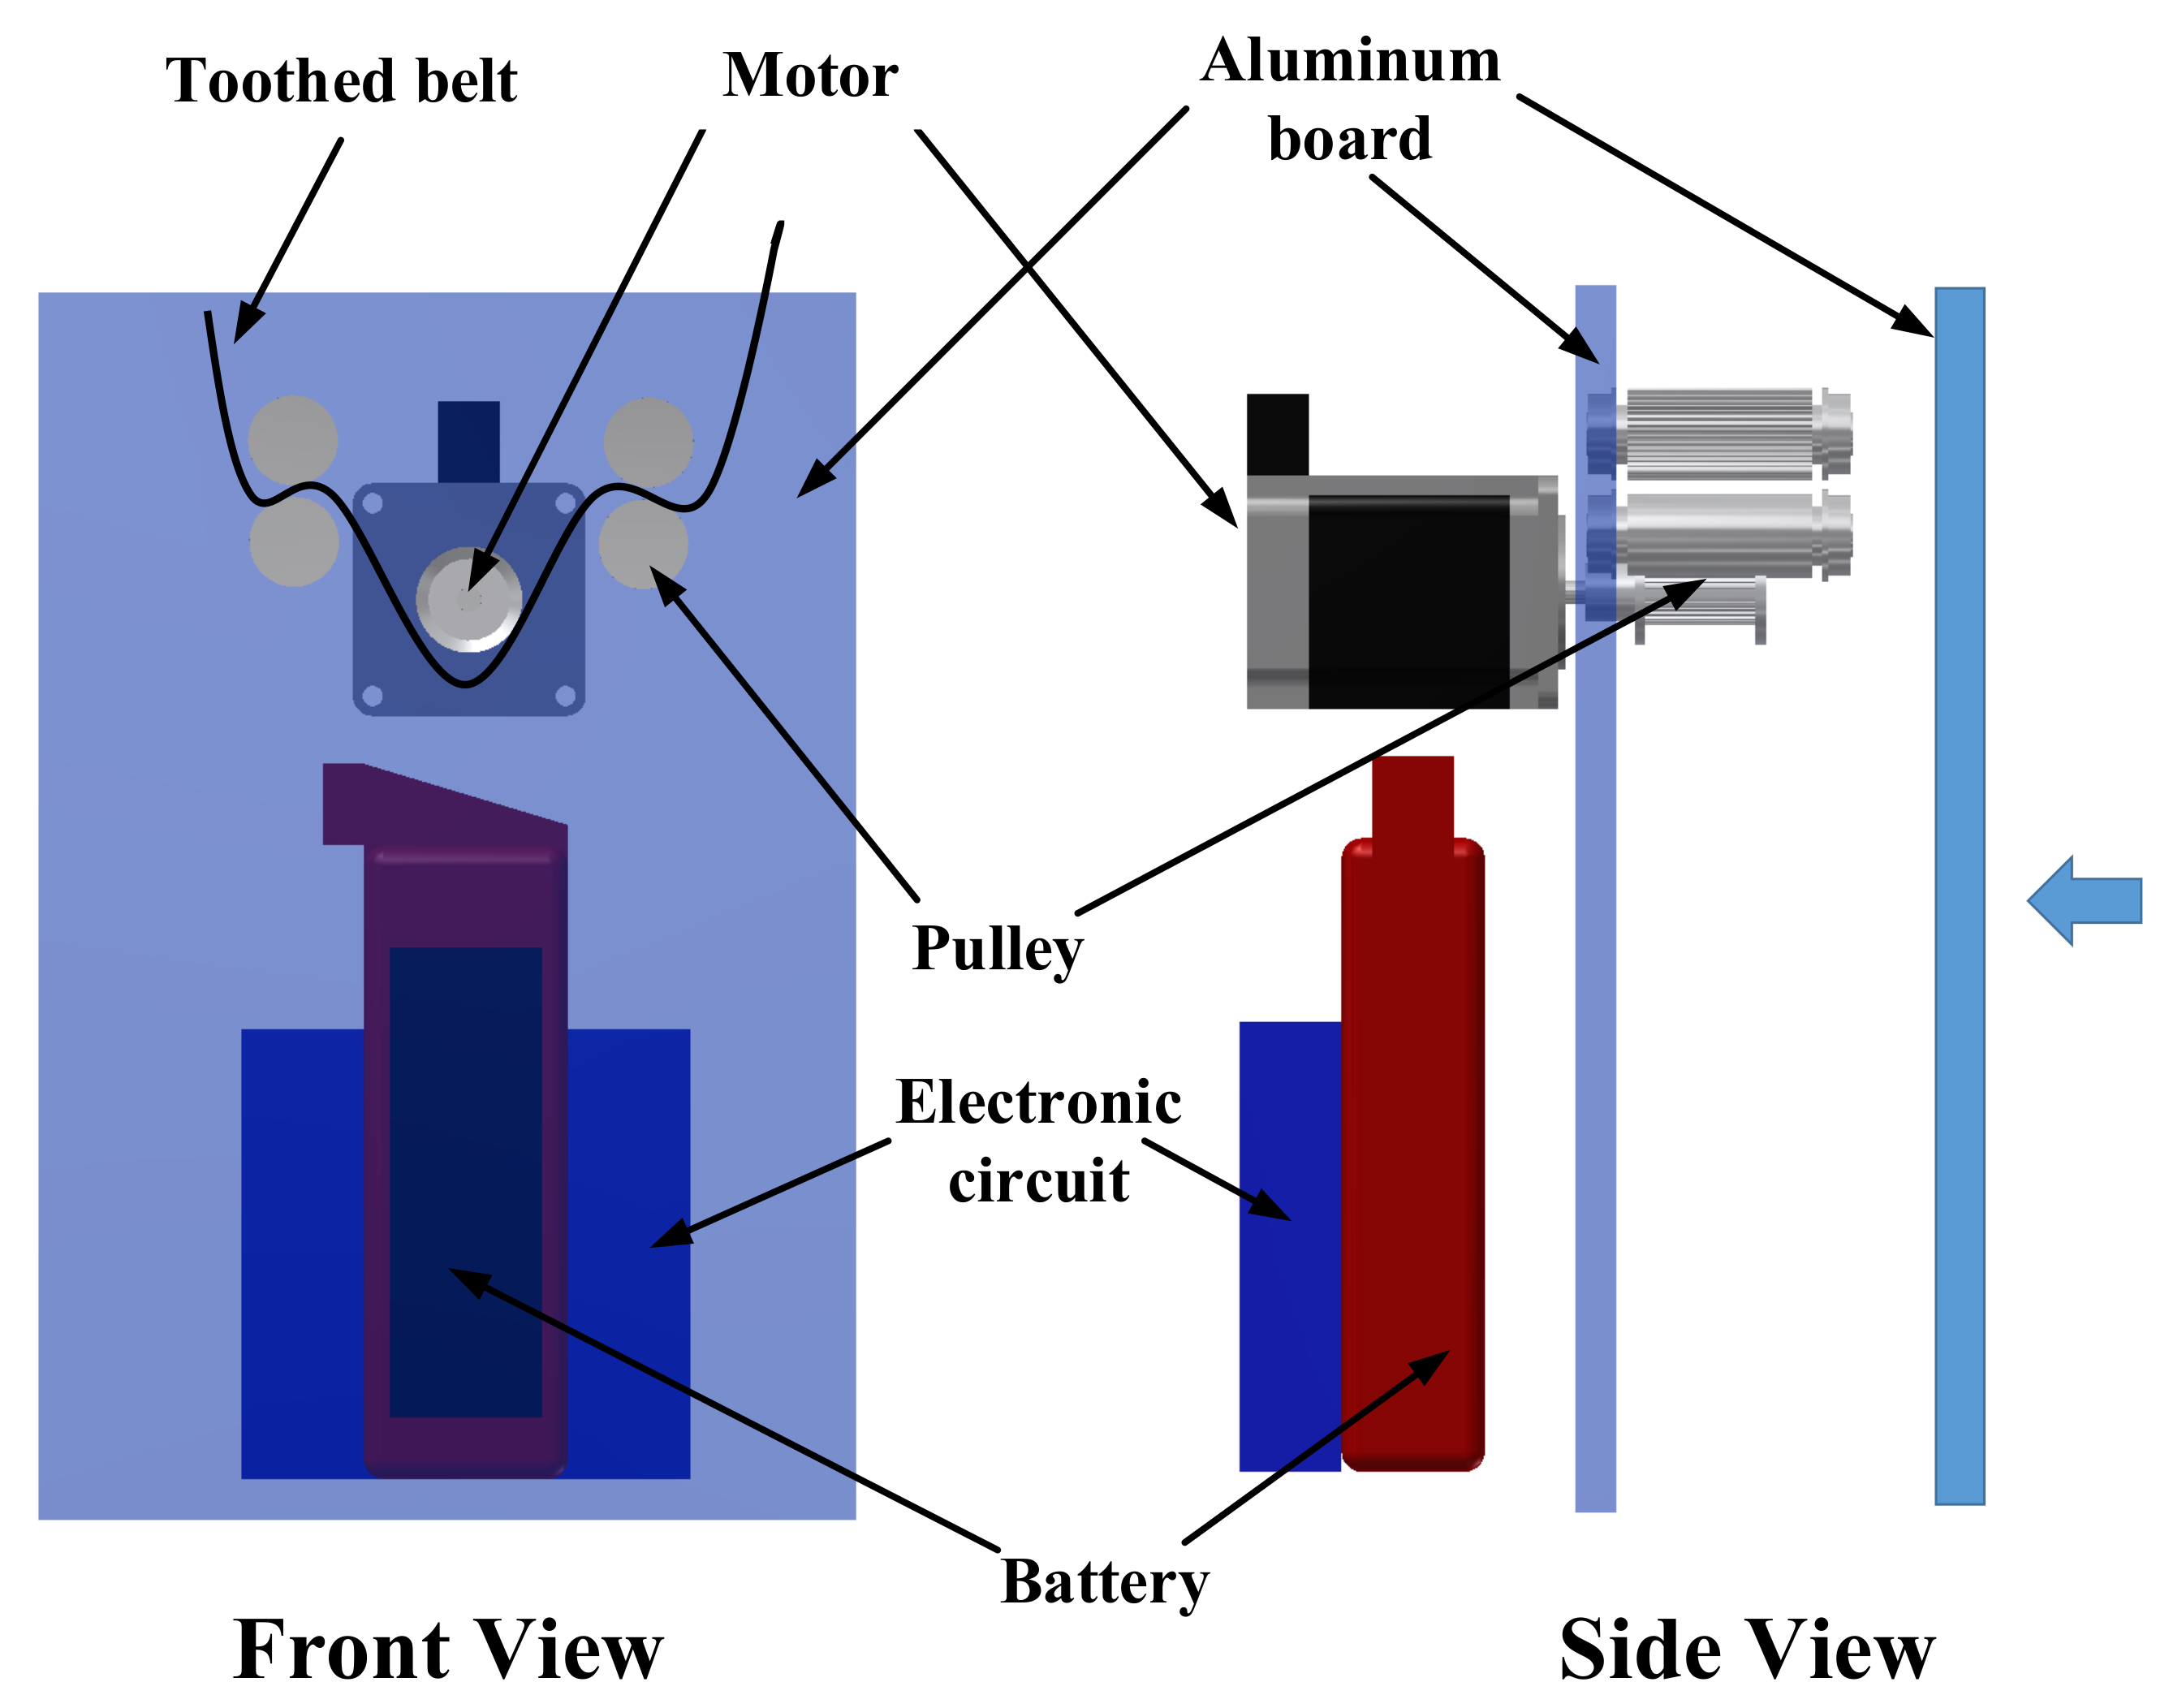
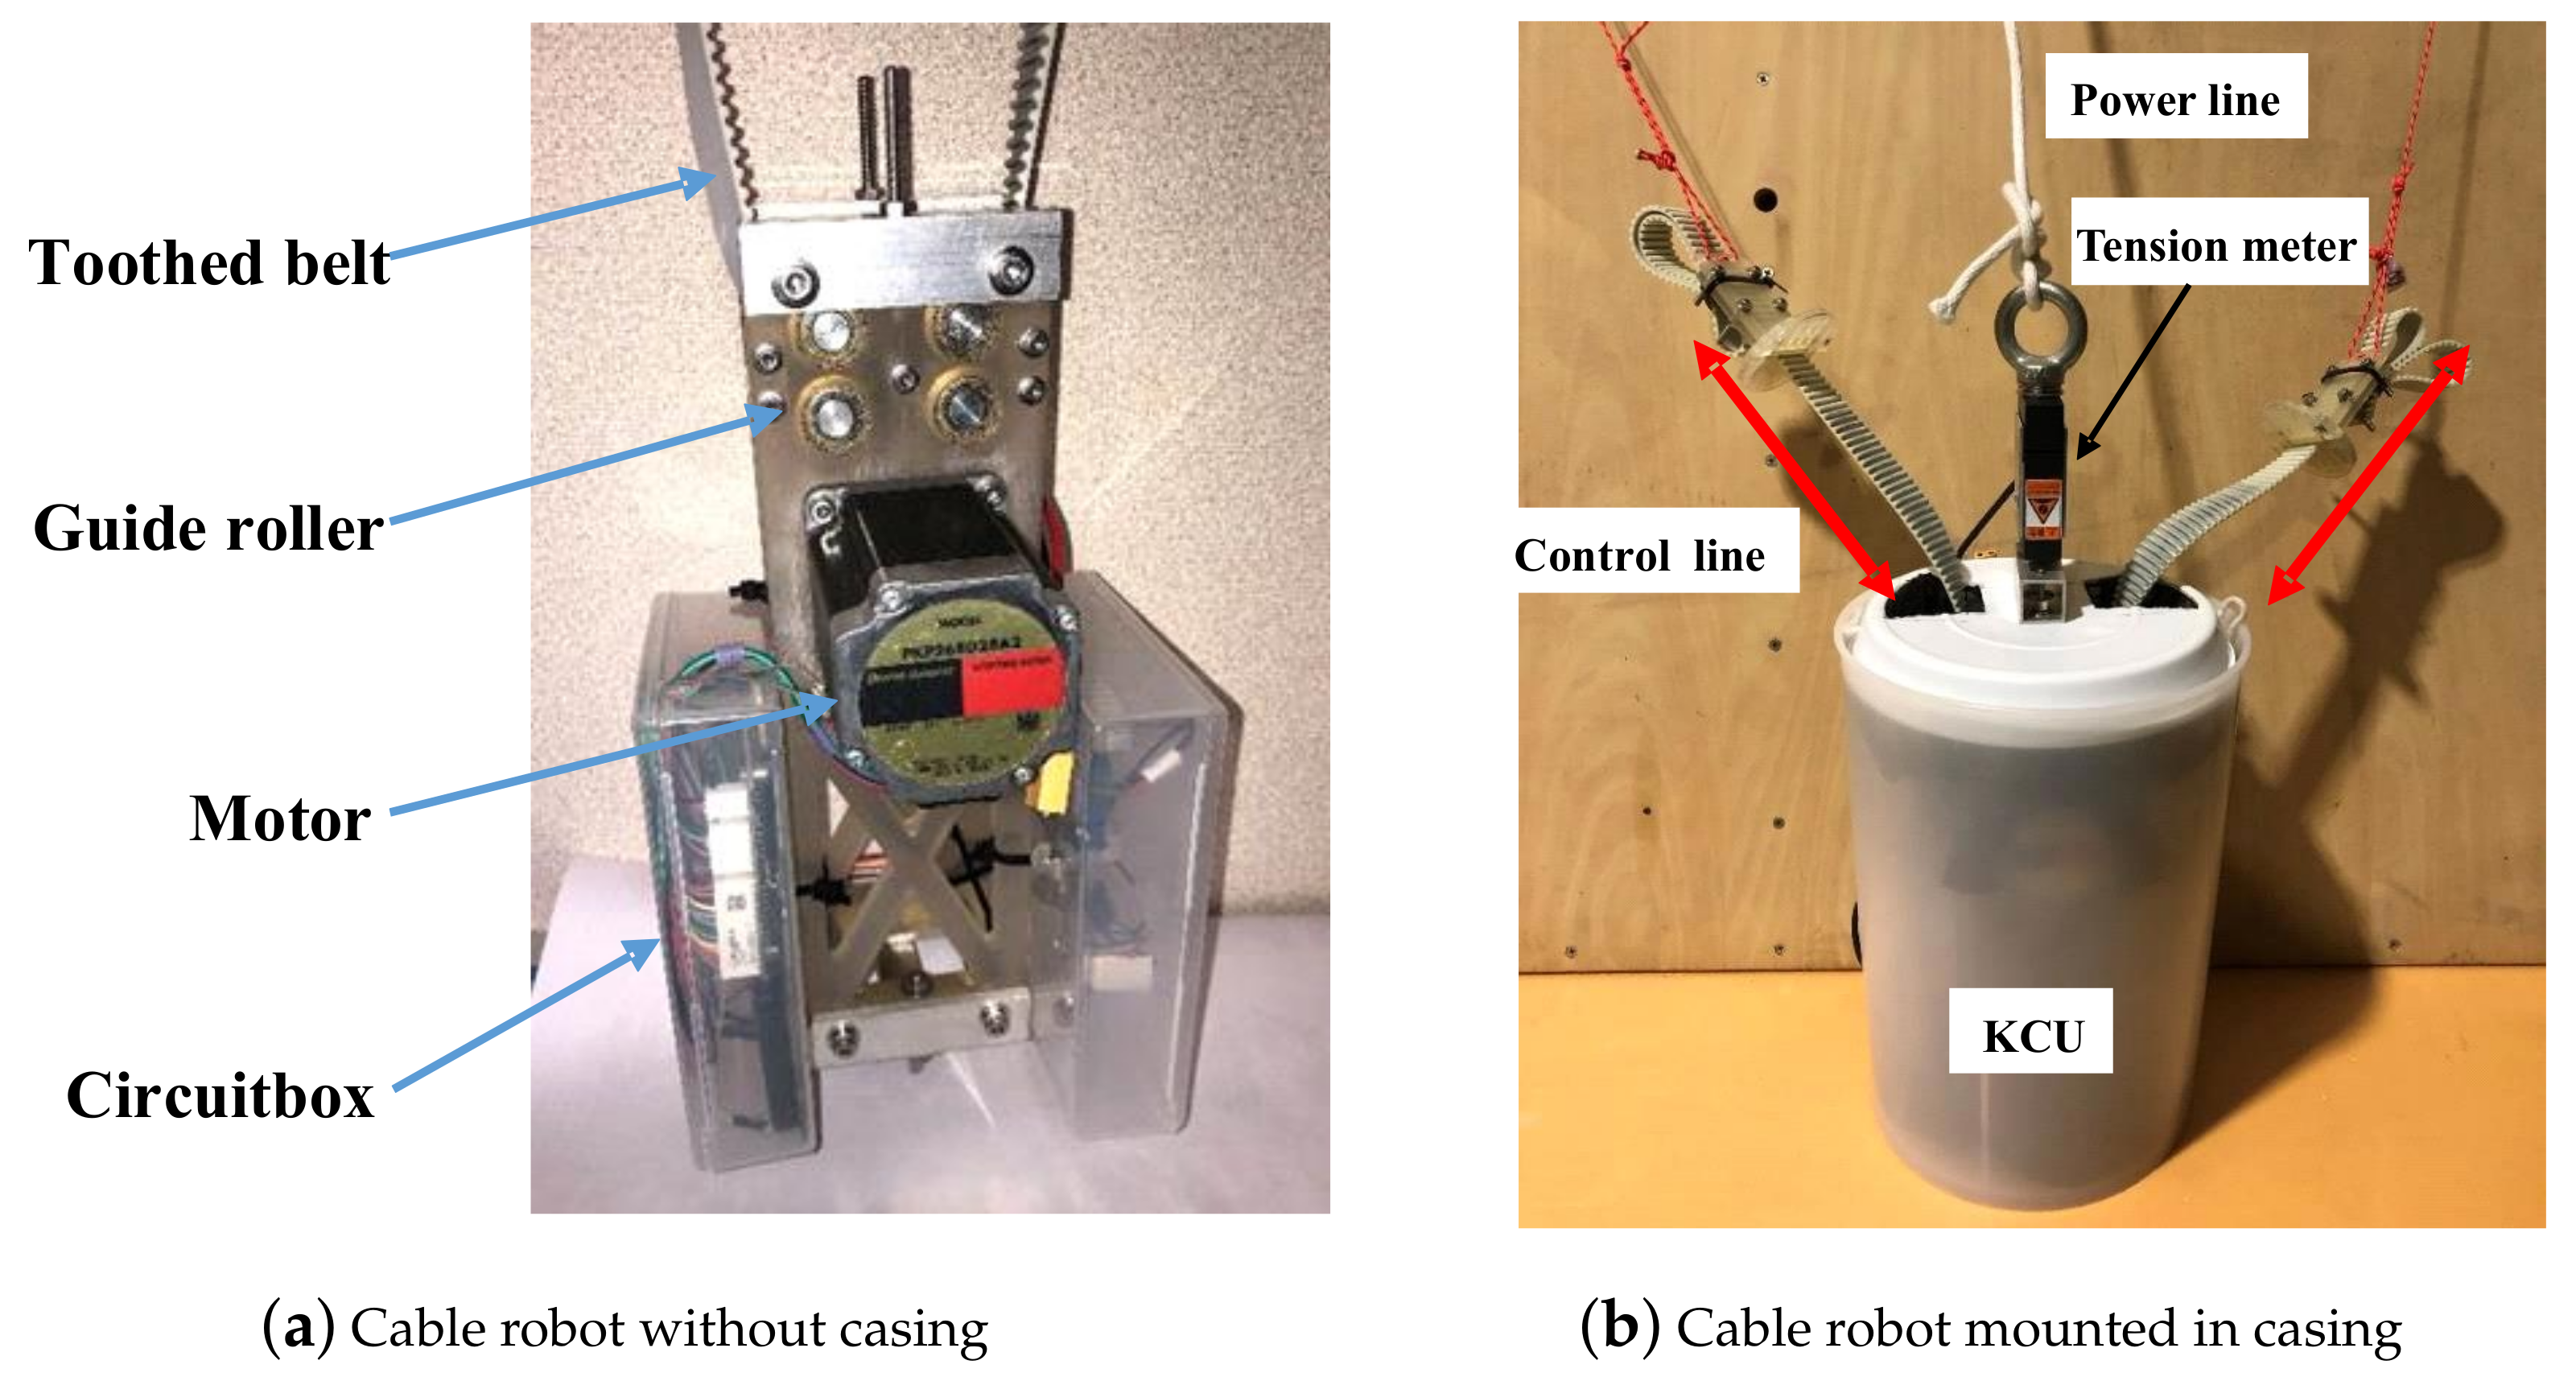
Figure 13 shows a schematic of the conceptual design of the KCU and the different functional components. Figure 14 shows photos of the final product. The unit was powered by a lithium-ion battery which could sustain almost three hours of continuous operation. The mass of the unit, including the battery, was about 3 kg. The KCU was suspended about 13 m below the kite and used a stepper motor [25,26] to actuate the control lines, by which the kite was steered on a specific flight path. The actuation was asymmetric, shortening one control line, while feeding out the other. Such control input leads mainly to a spanwise twist deformation of the wing, because when fully tensioned, the front bridle largely constrains the roll motion of the wing. The wing twist and the modulated aerodynamic load on the wing tips induce a yaw moment by which the kite is steered into a turn [27,28]. At the current stage of the project, it was not possible to actively control the angle of attack of the wing; however, the length of the control lines was varied along different flight tests, which affected the angle of attack, as shown in Figure 2b. The KCU receives the control action for the servo motor wirelessly from the radio control (RC). The tensile force in the power line was measured at the KCU end of the line, using a tension meter, as shown in Figure 14b. The technical specifications of the stepper motor and its driver are listed in Table 3 and Table 4, respectively.
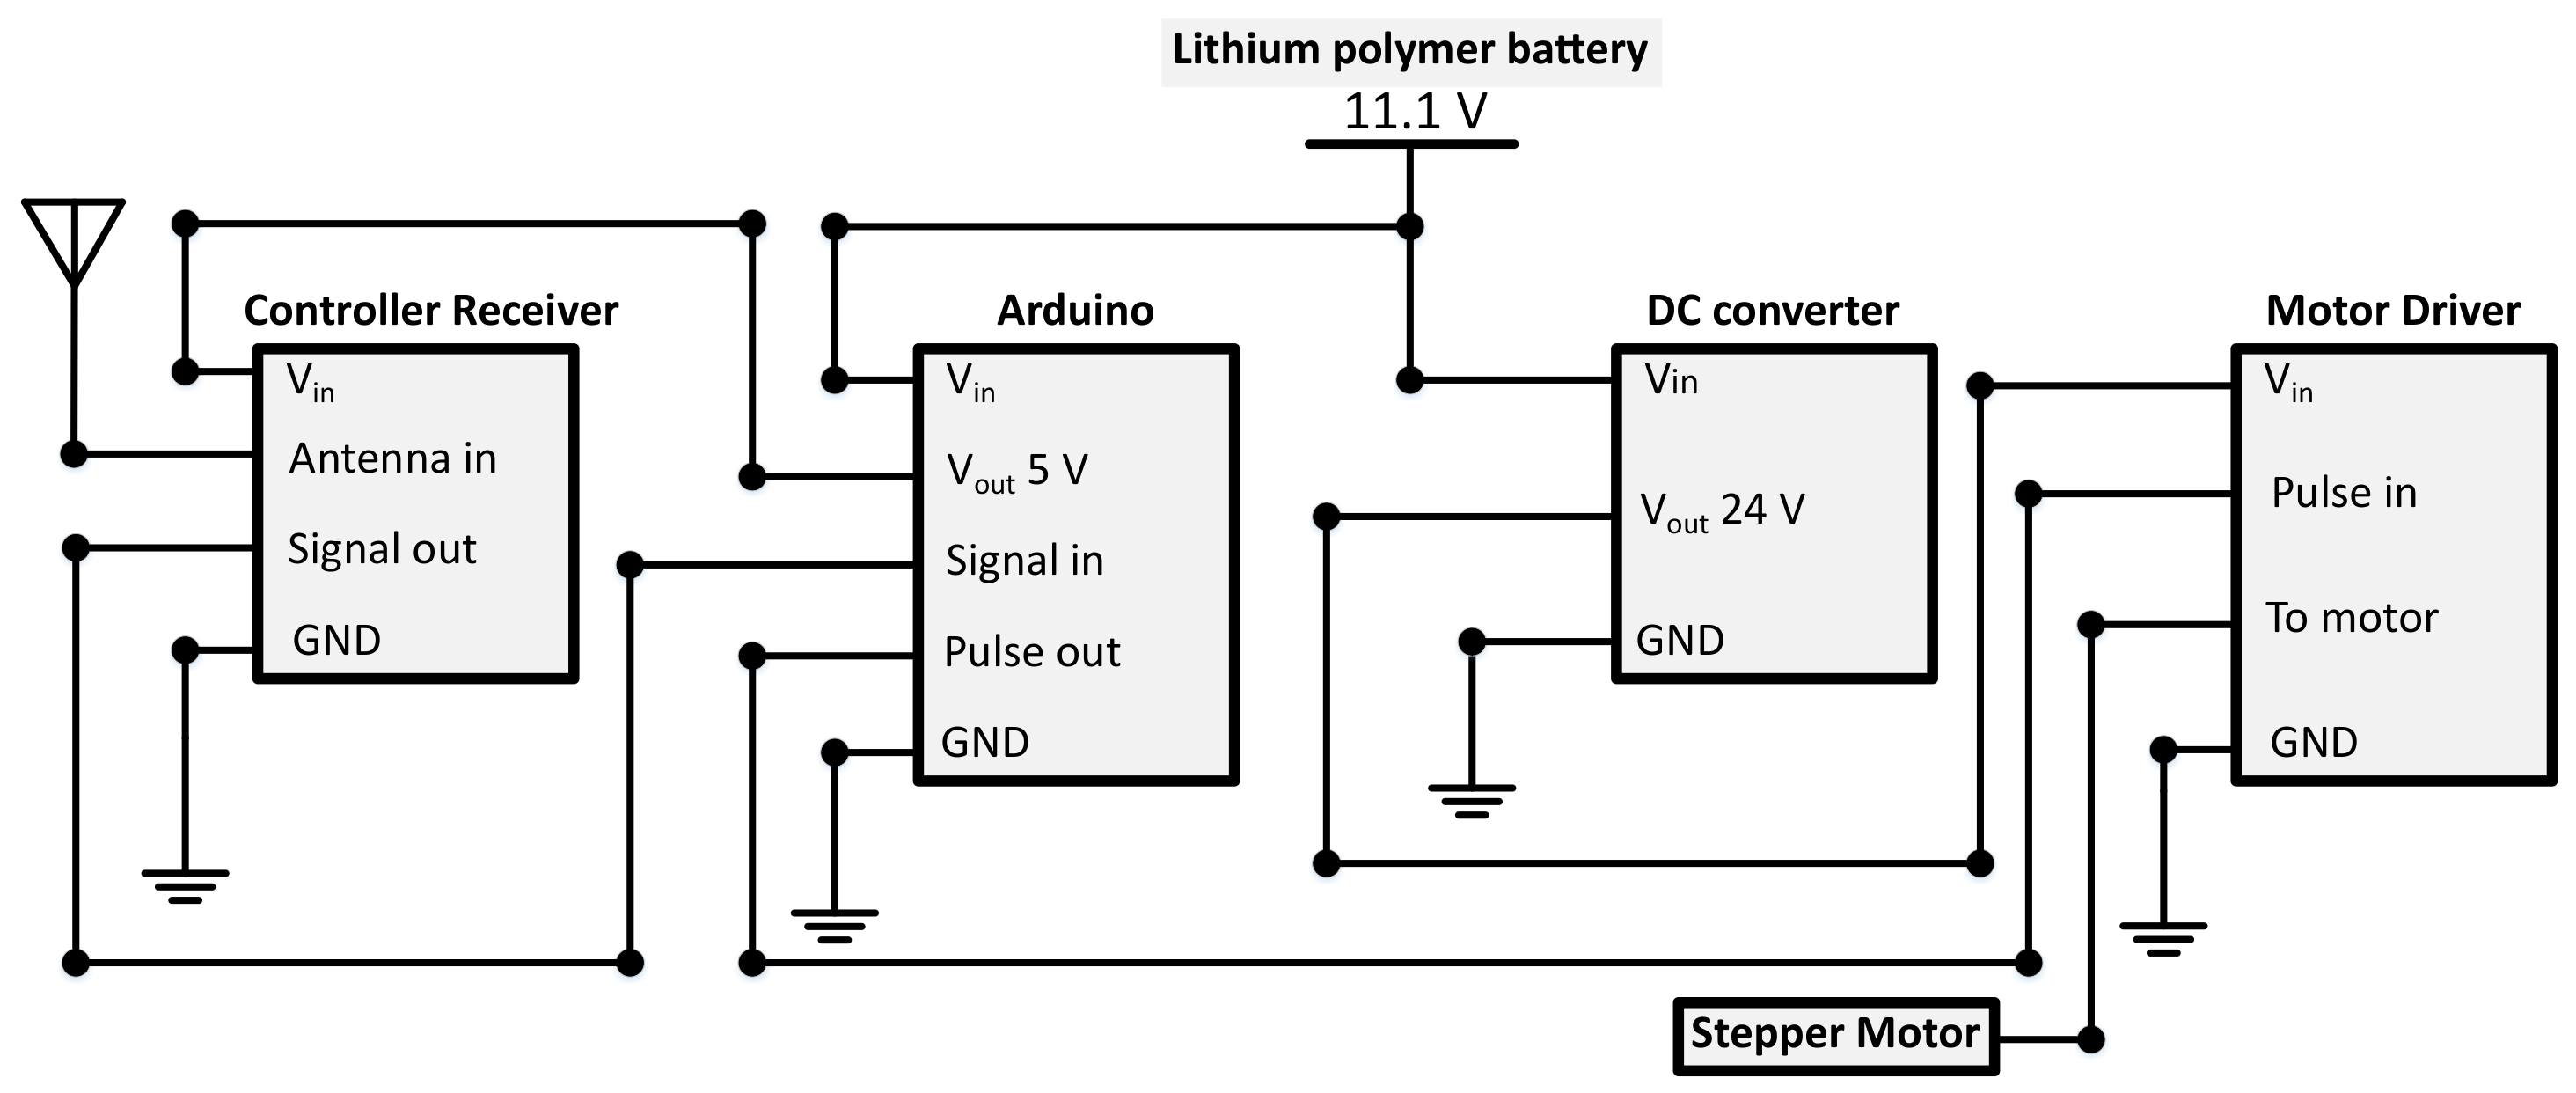
The electronic circuit diagram of the KCU in Figure 15 shows how the control robot received the control action and translated that into commands for the motor driver.
3.2.3. Measurement Unit (MU)
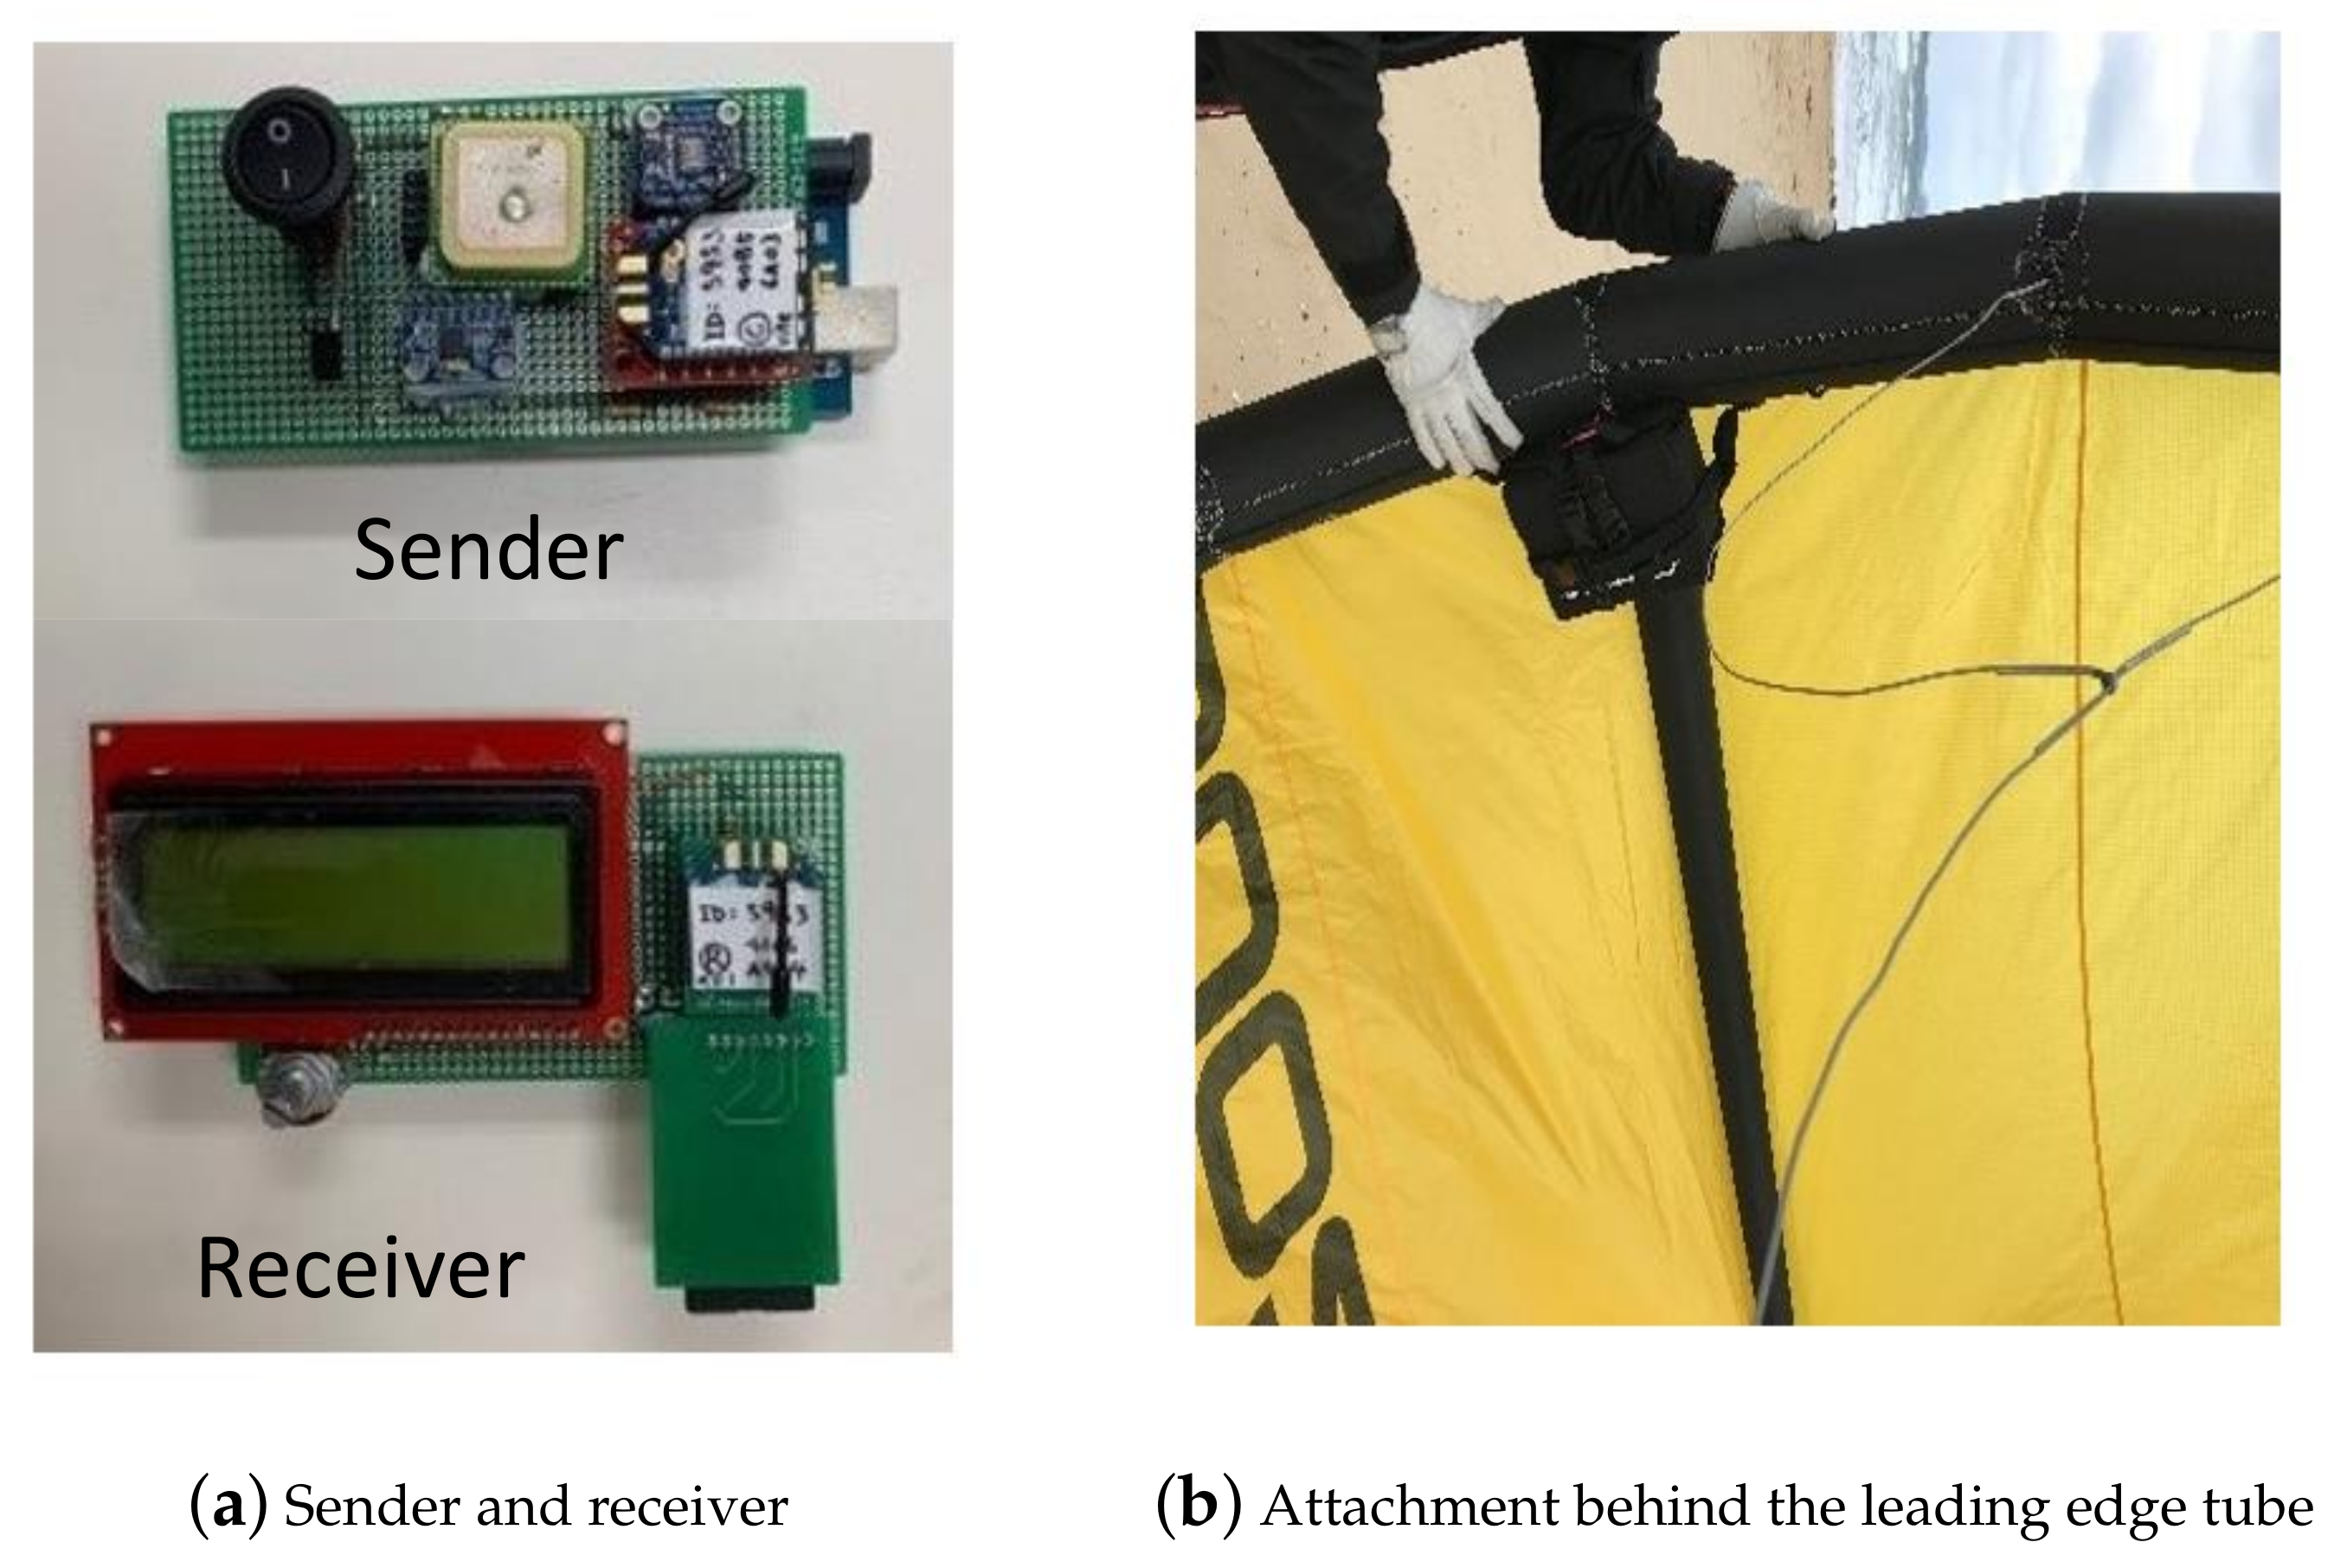
To obtain position, height and attitude of the kite, a small measurement unit with a mass of 300 g was attached at the connection of the leading edge tube and the strut tube, as shown in Figure 18. The acquired data were collected with an Arduino microcontroller [29], a global positioning system (GPS) [30] which provides position information five times per second; an inertial measurement unit (IMU) [31] with a sensitivity up to 131 LSBs/dps; and a pressure sensor which was used to measure height with an accuracy of 30 cm [32]. An XBee® module was used to wirelessly relay the data to the ground station with a sampling time of 0.15 s [33]. This module has a 100 m indoor range and a 3.2 km outdoor/line-of-sight range, which was sufficient for our application. Inside the casing of the measurement unit, the circuit board, on which the sensors were mounted, was oriented in such a way that it was aligned with the axes of the body-fixed reference frame of the wing. This was achieved by positioning the circuit board and filling the volume of the MU with construction foam. We checked whether foam and bag would affect the quality of the GPS sensor, and that was not the case. The technical specifications of the sensor equipment of the MU are listed in Table 5, Table 6, Table 7 and Table 8.
3.2.4. Ground Equipment
The ground equipment included a wireless unit receiver (Figure 18a bottom), a speed sensor [34] and accessories for tension meters [35,36]. Additionally, a wireless remote control operated by the human pilot was included. Hence, for the current experiment, the truck deck played the role of the ground. The technical specifications of the speed sensor and the load cell are listed in Table 9 and Table 10, respectively.
4. User Notes
The tow test procedure is in general a useful, low-cost method with which to assess the aerodynamic performances of surfkites. The measurement data summarized in Table 1 can be used in several different ways. In our recent publications we presented and discussed three possible use cases:
- Using the data for a sensitivity analysis of the tether force with respect to design and operation parameters [19]. This work shows that the tow speed is the most important parameter affecting the tether force, which is consistent with the theoretical analysis.
- Using the data for predicting the tether force employing multivariate machine learning algorithms [19]. In this work, the performances of different machine learning algorithms were assessed and the neural network model achieved the highest accuracy.
- Applying a system identification technique to identify the kite behavior and to develop a real time control technique [38]. In this work, Placket’s algorithm was used to generate a transfer function for the kite based on its roll angle, as an input, and tether force, as an output.
The data will be generally useful for validating kite models to predict the generated tether force and mechanical power.
Author Contributions
Data collection, M.A.R. and T.N.D.; design of experiment, M.A.R., T.N.D. and S.Y.; writing—original draft preparation, M.A.R. and R.S.; writing—review and editing, M.A.R. and R.S.; supervision and funding acquisition, S.Y. and R.S. All authors have read and agreed to the published version of the manuscript.
Funding
M.A.R. conducted this work with the support of Japanese Ministry of Education, Culture, Sports, Science and Technology (MEXT). R.S. was supported by the H2020-ITN project AWESCO funded by the European Union’s Horizon 2020 research and innovation program under the Marie Skłodowska-Curie grant agreement number 642682.
Acknowledgments
The authors acknowledge Daichi Fujimot and Kosuke Sawano, two Masters students at Kyushu University, for their help in the setup and execution of the towing tests. Additionally, we would like to thank the technical staff-member Hamasaki Masahiro for his help with manufacturing the KCU.
Conflicts of Interest
The authors declare no conflict of interest.
Abbreviations
| AWE | Airborne wind energy |
| bps | Bits per second |
| CLL | Control line length |
| DC | Direct current |
| dps | Degrees per second |
| FIFO | First in, first out |
| GPS | Global positioning system |
| IMU | Inertial measurement unit |
| KCU | Kite control unit |
| LSB | Least significant bit |
| MU | Measurement unit |
| RC | Remote control |
| SBAS | Satellite-based augmentation system |
| TTFF | Time to first fix (GPS acquire satellite signals and calculate position) |
| TTL | Transistor-transistor logic |
References
- Schmehl, R. (Ed.) Airborne Wind Energy: Advances in Technology Development and Research; Green Energy and Technology; Springer: Singapore, 2018. [Google Scholar] [CrossRef]
- Ahrens, U.; Diehl, M.; Schmehl, R. (Eds.) Airborne Wind Energy; Green Energy and Technology; Springer: Berlin/Heidelberg, Germany, 2013. [Google Scholar] [CrossRef]
- Cherubini, A.; Papini, A.; Vertechy, R.; Fontana, M. Airborne Wind Energy Systems: A review of the technologies. Renew. Sustain. Energy Rev. 2015, 51, 1461–1476. [Google Scholar] [CrossRef] [Green Version]
- Bechtle, P.; Schelbergen, M.; Schmehl, R.; Zillmann, U.; Watson, S. Airborne Wind Energy Resource Analysis. Renew. Energy 2019, 141, 1103–1116. [Google Scholar] [CrossRef]
- AWESCO Network. Airborne Wind Energy—An Introduction to an Emerging Technology. Available online: http://www.awesco.eu/awe-explained (accessed on 14 February 2020).
- Van der Vlugt, R.; Peschel, J.; Schmehl, R. Design and Experimental Characterization of a Pumping Kite Power System. In Airborne Wind Energy; Ahrens, U., Diehl, M., Schmehl, R., Eds.; Green Energy and Technology; Springer: Berlin/Heidelberg, Germany, 2013; Chapter 23; pp. 403–425. [Google Scholar] [CrossRef]
- Alexander, K.; Stevenson, J. A test rig for kite performance measurement. Proc. Inst. Mech. Eng. Part B J. Eng. Manuf. 2001, 215, 595–598. [Google Scholar] [CrossRef]
- Stevenson, J.C. Traction Kite Testing and Aerodynamics. Ph.D. Thesis, University of Canterbury, Christchurch, New Zealand, 2003. [Google Scholar]
- Stevenson, J.; Alexander, K.; Lynn, P. Kite performance testing by flying in a circle. Aeronaut. J. (1968) 2005, 109, 269–276. [Google Scholar] [CrossRef]
- Stevenson, J.C.; Alexander, K.V. Circular flight kite tests: Converting to standard results. Aeronaut. J. (1968) 2006, 110, 605–614. [Google Scholar] [CrossRef]
- Van der Vlugt, R. Aero- and Hydrodynamic Performance Analysis of a Speed Kiteboarder. Master’s Thesis, Delft University of Technology, Delft, The Netherlands, 2009. [Google Scholar]
- Dadd, G.M.; Hudson, D.A.; Shenoi, R.A. Comparison of two kite force models with experiment. J. Aircr. 2010, 47, 212–224. [Google Scholar] [CrossRef]
- Costa, D. Experimental Investigation of Aerodynamic and Structural Properties of a Kite. Master’s Thesis, ETH Zurich, Zurich, Switzerland, 2011. [Google Scholar]
- Wood, T.A.; Hesse, H.; Smith, R.S. Predictive Control of Autonomous Kites in Tow Test Experiments. IEEE Control Syst. Lett. 2017, 1, 110–115. [Google Scholar] [CrossRef]
- Luchsinger, R.; Aregger, D.; Bezard, F.; Costa, D.; Galliot, C.; Gohl, F.; Heilmann, J.; Hesse, H.; Houle, C.; Wood, T.A.; et al. Pumping Cycle Kite Power with Twings. In Airborne Wind Energy: Advances in Technology Development and Research; Schmehl, R., Ed.; Green Energy and Technology; Springer: Singapore, 2018; Chapter 2; pp. 603–621. [Google Scholar] [CrossRef]
- Fagiano, L.; Zgraggen, A.U.; Morari, M. On Modeling, Filtering and Automatic Control of Flexible Tethered Wings for Airborne Wind Energy. In Airborne Wind Energy; Ahrens, U., Diehl, M., Schmehl, R., Eds.; Green Energy and Technology; Springer: Berlin/Heidelberg, Germany, 2013; Chapter 9. [Google Scholar] [CrossRef]
- Hummel, J.; Göhlich, D.; Schmehl, R. Automatic measurement and characterization of the dynamic properties of tethered membrane wings. Wind Energy Sci. 2019, 4, 41–55. [Google Scholar] [CrossRef] [Green Version]
- Oehler, J.; Schmehl, R. Aerodynamic characterization of a soft kite by in situ flow measurement. Wind Energy Sci. 2019, 4, 1–21. [Google Scholar] [CrossRef] [Green Version]
- Rushdi, M.A.; Rushdi, A.A.; Dief, T.N.; Halawa, A.M.; Yoshida, S.; Schmehl, R. Power Prediction of Airborne Wind Energy Systems Using Multivariate Machine Learning. Energies 2020, 13, 2367. [Google Scholar] [CrossRef]
- Erhard, M.; Strauch, H. Automatic Control of Pumping Cycles for the SkySails Prototype in Airborne Wind Energy. In Airborne Wind Energy: Advances in Technology Development and Research; Schmehl, R., Ed.; Green Energy and Technology; Springer: Singapore, 2018; Chapter 9; pp. 189–213. [Google Scholar] [CrossRef]
- Jamieson, P. Future Wind Technology. In Innovation in Wind Turbine Design, 2nd ed.; John Wiley & Sons Ltd.: Chichester, UK, 2018; Chapter 28. [Google Scholar] [CrossRef]
- Van der Vlugt, R.; Bley, A.; Schmehl, R.; Noom, M. Quasi-Steady Model of a Pumping Kite Power System. Renew. Energy 2019, 131, 83–99. [Google Scholar] [CrossRef]
- Nelson, V. Innovative Wind Turbines: An Illustrated Guidebook; CRC Press: Boca Raton, FL, USA, 2020. [Google Scholar] [CrossRef]
- Ozone Kites. Available online: https://ozonekites.com/products/water-kites/uno-v2/ (accessed on 21 May 2020).
- OrientalMotor—2-Phase Stepping Motor—PKP Series. Available online: https://www.orientalmotor.co.jp/products/detail.action?hinmei=PKP268D28A2 (accessed on 21 May 2020).
- OrientalMotor—Bipolar Driver. Available online: https://www.orientalmotor.co.jp/products/detail.action?hinmei=CVD228-K (accessed on 21 May 2020).
- Breukels, J. An Engineering Methodology for Kite Design. Ph.D. Thesis, Delft University of Technology, Delft, The Netherlands, 2011. [Google Scholar]
- Bosch, A.; Schmehl, R.; Tiso, P.; Rixen, D. Dynamic nonlinear aeroelastic model of a kite for power generation. J. Guid. Control Dyn. 2014, 37, 1426–1436. [Google Scholar] [CrossRef] [Green Version]
- Arduino Mega 2560 Rev3. Available online: https://store.arduino.cc/usa/mega-2560-r3 (accessed on 21 May 2020).
- GPS Receiver—LS20031 5 Hz. Available online: https://www.sparkfun.com/products/8975 (accessed on 21 May 2020).
- Triple Axis Accelerometer and Gyro Breakout—MPU-6050. Available online: https://www.sparkfun.com/products/11028 (accessed on 21 May 2020).
- Altitude/Pressure Sensor Breakout—MPL3115A2. Available online: https://www.sparkfun.com/products/11084 (accessed on 21 May 2020).
- XBee 3 Pro Module. Available online: https://www.sparkfun.com/products/15127 (accessed on 21 May 2020).
- Qstarz Racing. Available online: http://racing.qstarz.com/Products/LT-6000S.html (accessed on 21 May 2020).
- GraphTec midi logger. Available online: http://www.graphteccorp.com/instruments/gl200a/ (accessed on 21 May 2020).
- IMADA Tension Gauge—ZP Series. Available online: https://www.forcegauge.net/en/discontinued (accessed on 21 May 2020).
- IMADA Load Cell. Available online: https://www.forcegauge.net/en/catalog/dpu020 (accessed on 21 May 2020).
- Rushdi, M.A.; Dief, T.N.; Halawa, A.M.; Yoshida, S. System Identification of a 6 m2 Kite Power System in Fixed-Tether Length Operation. Int. Rev. Aerosp. Eng. 2020, in press. [Google Scholar]
Figure 1.
Working principle of the pumping kite power system of TU Delft [6].
Figure 1.
Working principle of the pumping kite power system of TU Delft [6].

Figure 2.
Tow test setup of Kyushu University. Schematic illustrations (b) and (c) are reproduced from [19], the truck rendering is from http://freepik.com.
Figure 2.
Tow test setup of Kyushu University. Schematic illustrations (b) and (c) are reproduced from [19], the truck rendering is from http://freepik.com.

Figure 3.
Flight paths of the kite in tests 1 and 2 [19].
Figure 3.
Flight paths of the kite in tests 1 and 2 [19].

Figure 4.
Test 1: Steady flight with towing speed 30∼40 km/h and CLL = 13.8 m [19].
Figure 4.
Test 1: Steady flight with towing speed 30∼40 km/h and CLL = 13.8 m [19].

Figure 5.
Test 2: Figure-of-eight maneuvers with towing speed 30∼40 km/h and CLL = 13.8 m [19].
Figure 5.
Test 2: Figure-of-eight maneuvers with towing speed 30∼40 km/h and CLL = 13.8 m [19].

Figure 6.
Test 3: Steady flight with towing speed 40∼50 km/h and CLL = 13.8 m [19].
Figure 6.
Test 3: Steady flight with towing speed 40∼50 km/h and CLL = 13.8 m [19].

Figure 7.
Test 4: Figure-of-eight maneuvers with towing speed 40∼50 km/h and CLL = 13.8 m [19].
Figure 7.
Test 4: Figure-of-eight maneuvers with towing speed 40∼50 km/h and CLL = 13.8 m [19].

Figure 8.
Test 5: Steady flight with towing speed 30∼40 km/h and CLL = 13.6 m [19].
Figure 8.
Test 5: Steady flight with towing speed 30∼40 km/h and CLL = 13.6 m [19].

Figure 9.
Test 6: Steady flight with towing speed 30∼40 km/h and CLL = 13.4 m [19].
Figure 9.
Test 6: Steady flight with towing speed 30∼40 km/h and CLL = 13.4 m [19].

Figure 10.
Test 7: Steady flight with towing speed 40∼50 km/h and CLL = 13.6 m [19].
Figure 10.
Test 7: Steady flight with towing speed 40∼50 km/h and CLL = 13.6 m [19].

Figure 11.
Aerial view of the runway used for the tow tests, at Shiroshi, Saga, Japan [19] (© DigitalGlobe, © Zennin).
Figure 11.
Aerial view of the runway used for the tow tests, at Shiroshi, Saga, Japan [19] (© DigitalGlobe, © Zennin).

Figure 12.
The 6 m OZONE UNO V2 inflatable kite used for the tow tests [24].
Figure 12.
The 6 m OZONE UNO V2 inflatable kite used for the tow tests [24].

Figure 13.
Schematic front and side views of the kite control unit (KCU).

Figure 14.
KCU including structural frame, transmission belts, electronic circuit and motors.

Figure 15.
Electronic circuit diagram of the KCU and its interfaces.

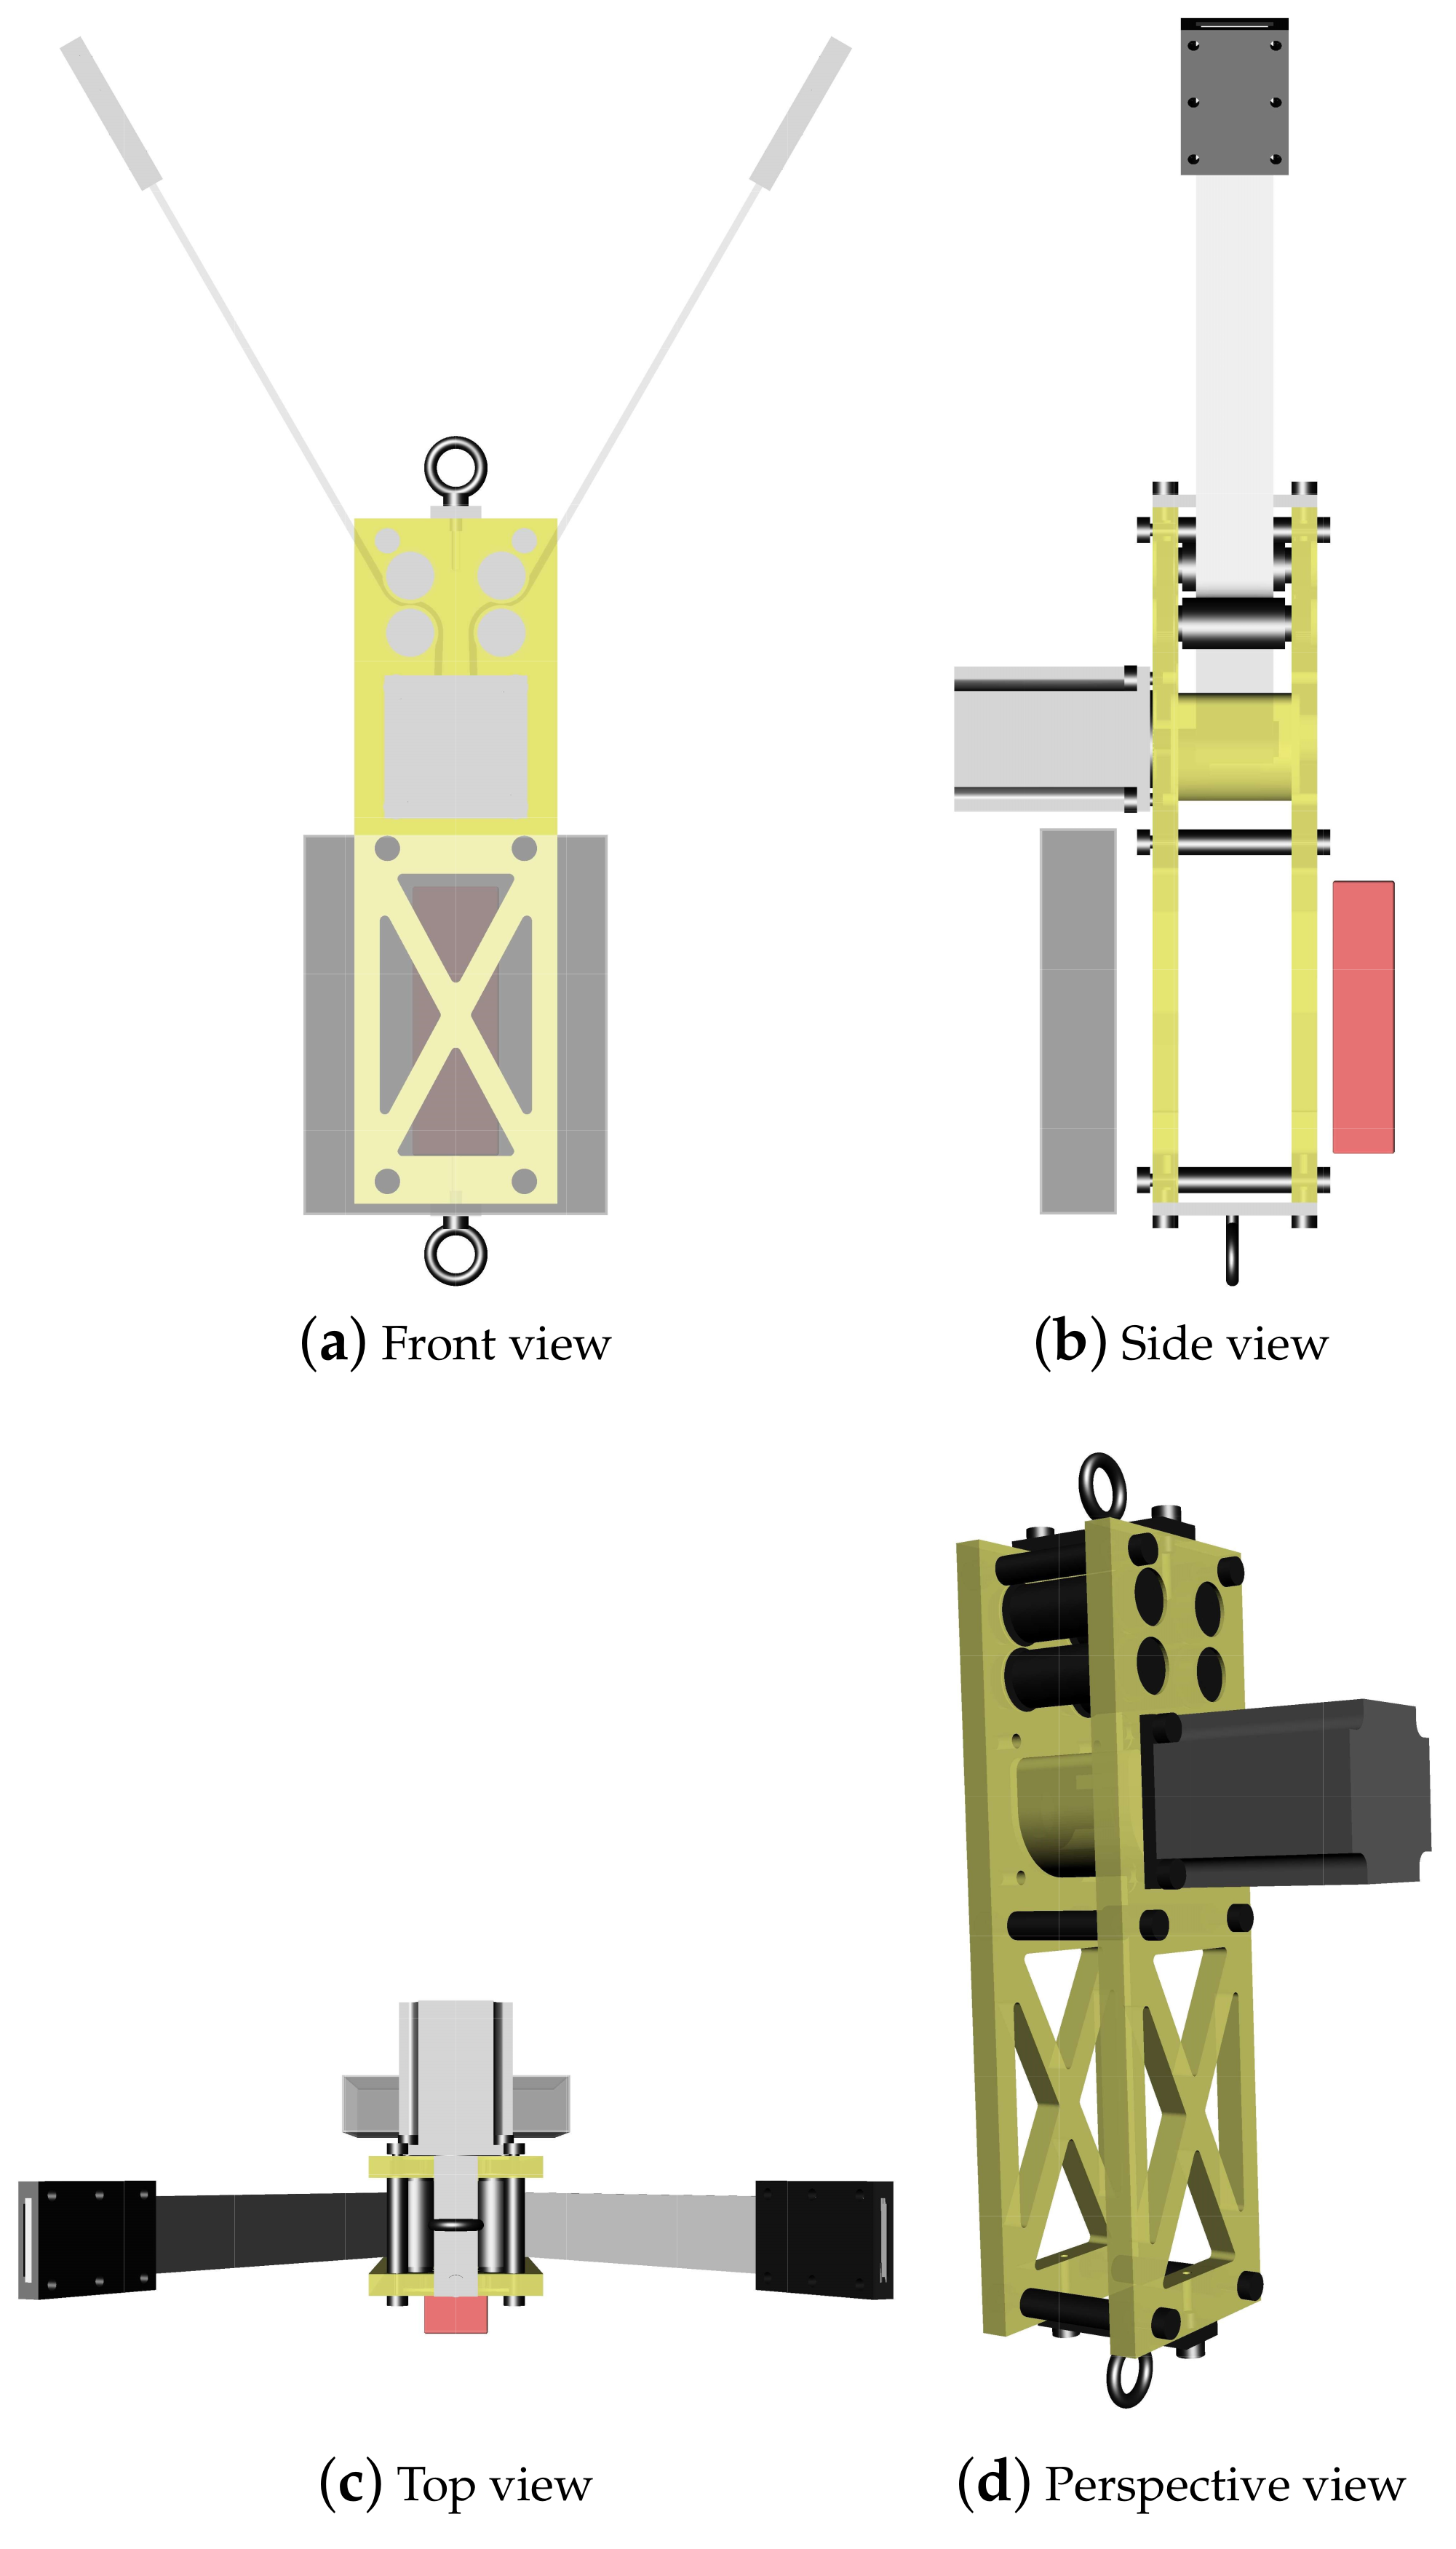
Figure 16.
CAD renderings of the assembled KCU, without casing.

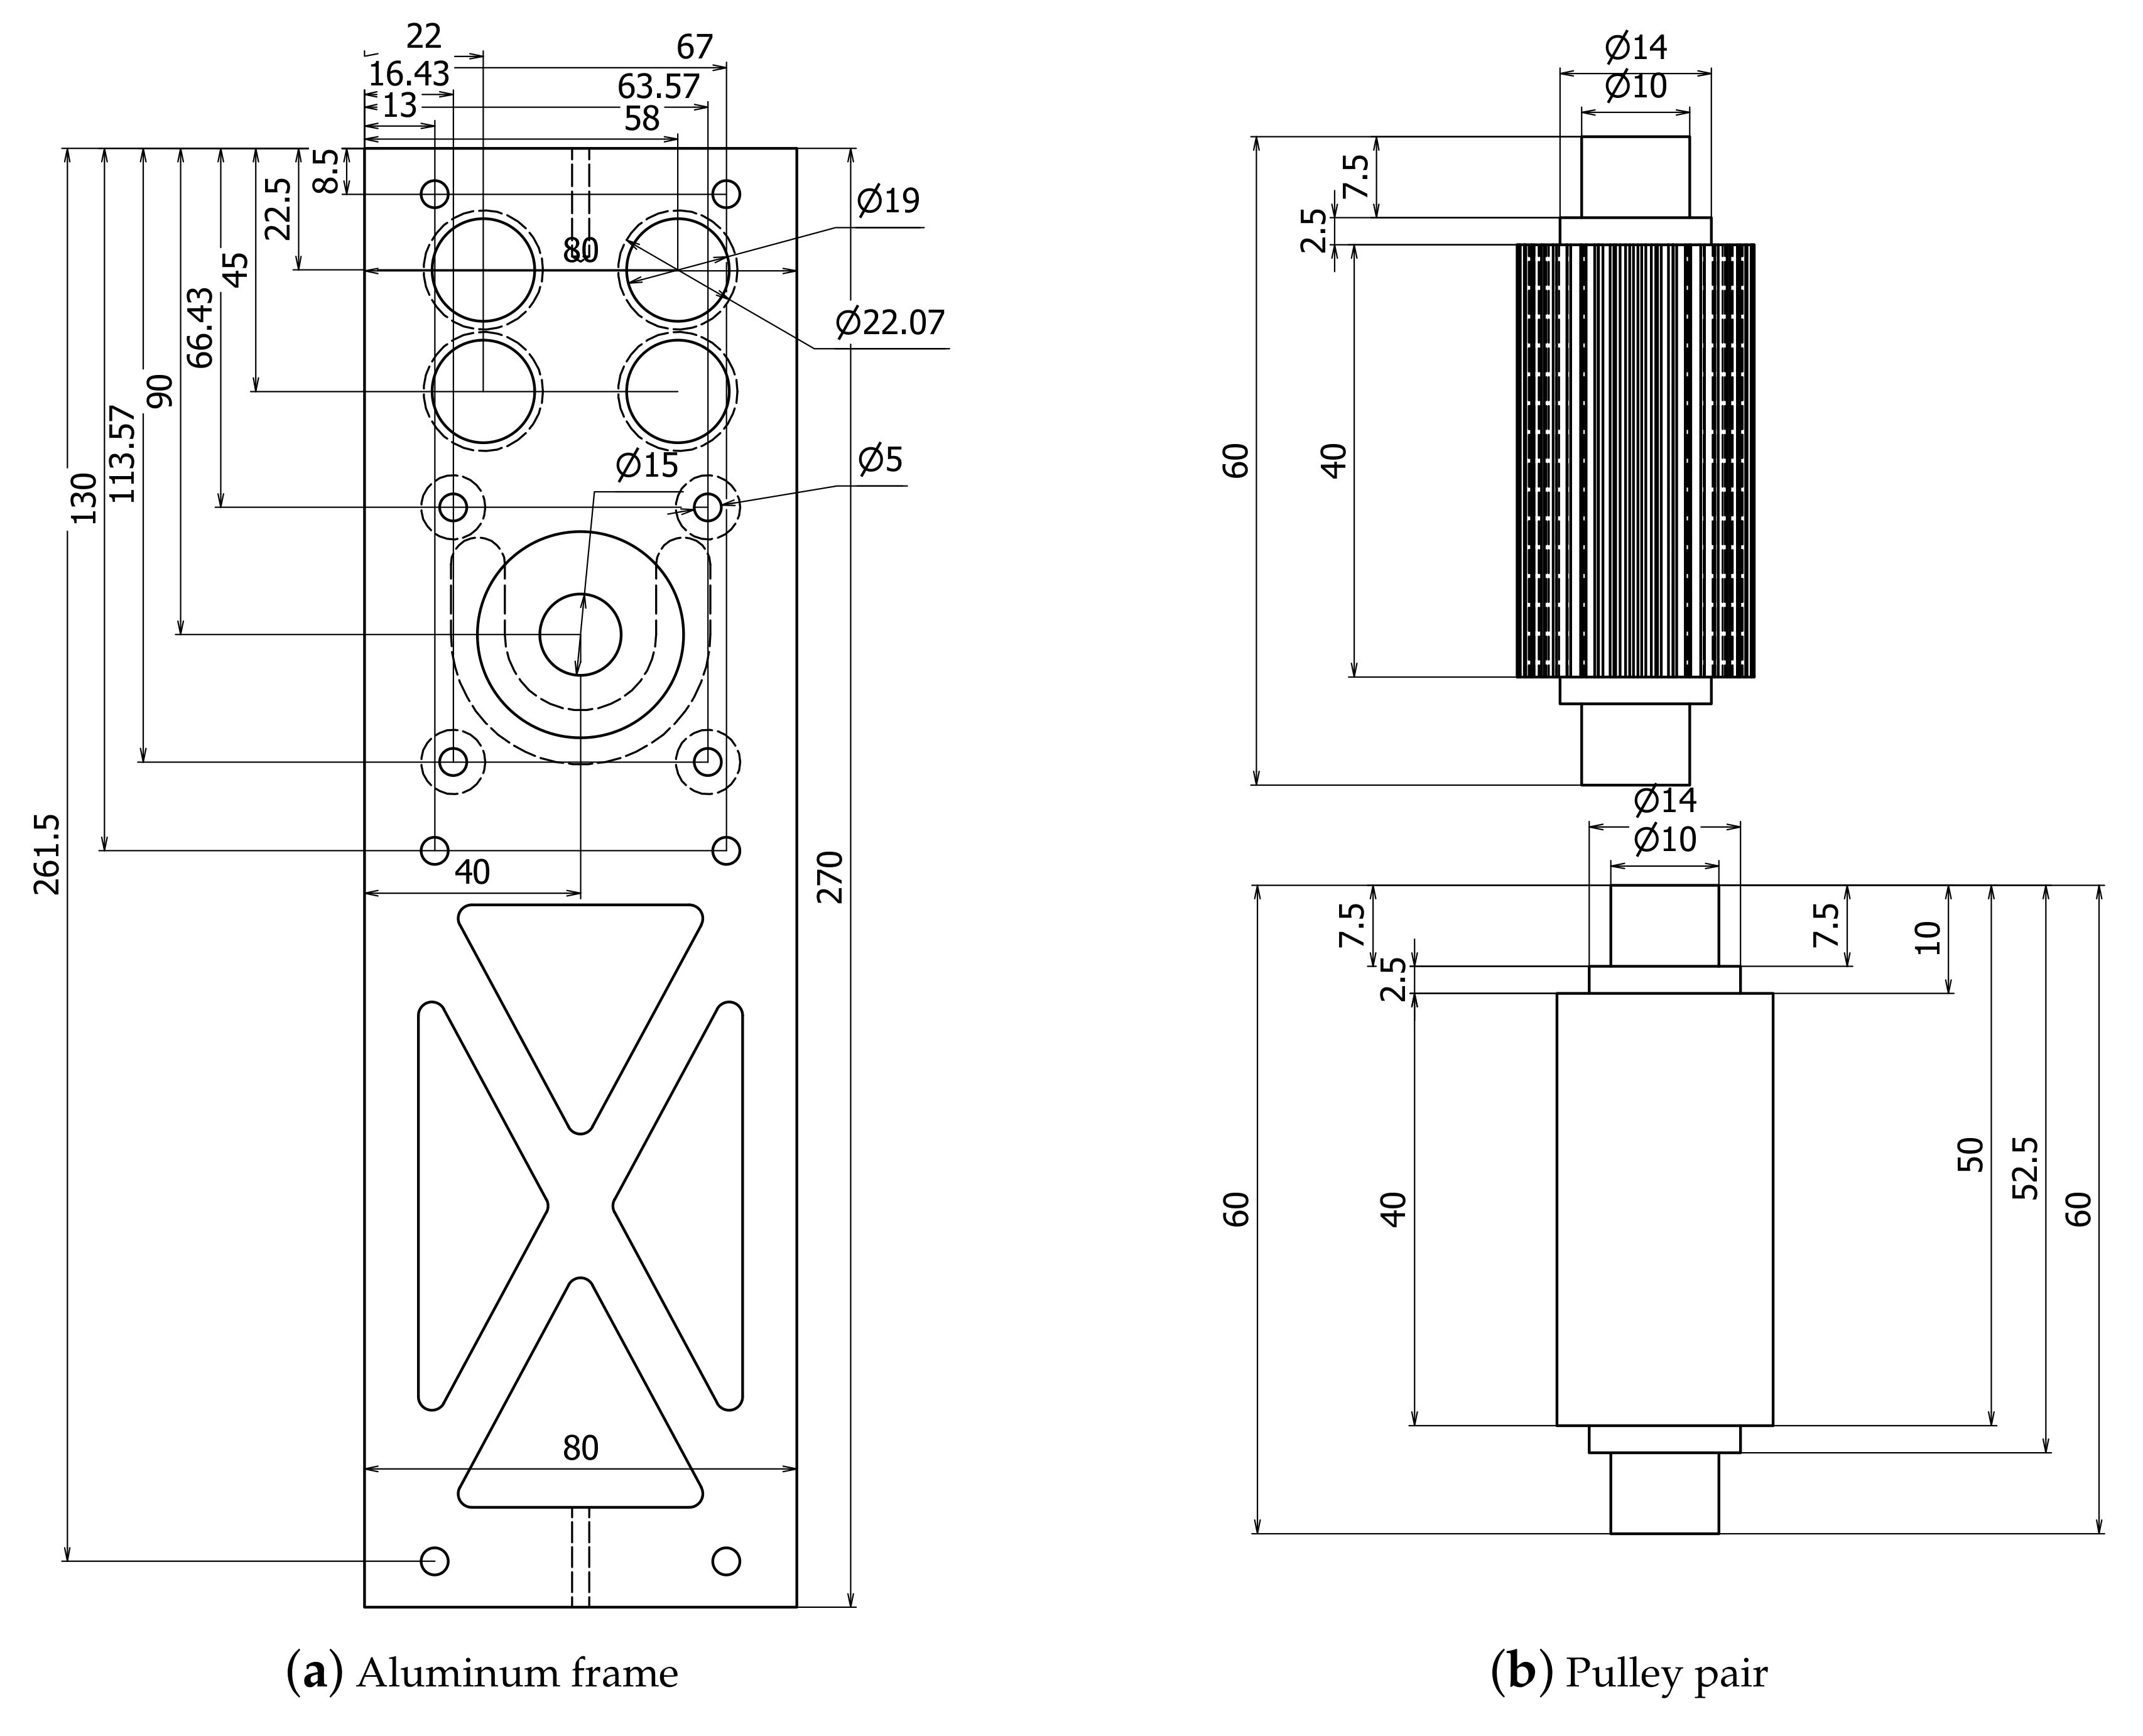
Figure 17.
Dimensioned CAD drawings of the aluminum frame and pulleys (dimensions are in mm).

Figure 18.
Measurement unit for position, height, and attitude of the kite [19].
Figure 18.
Measurement unit for position, height, and attitude of the kite [19].


Table 1.
Description of the recorded data.
| ID | Variable | Description | Unit |
|---|---|---|---|
| 01 | time | Time since start recording | s |
| 02 | long | Kite longitude | ◦ |
| 03 | lat | Kite latitude | ◦ |
| 04 | dt | Sampling time | s |
| 05 | H | Kite height | m |
| 06 | Roll | Kite roll angle | ◦ |
| 07 | Pitch | Kite pitch angle | ◦ |
| 08 | Yaw | Kite yaw angle | ◦ |
| 09 | S | Number of satellites connected to GPS | - |
| 10 | truckSpeed | Towing speed | km/h |
| 11 | truck_lat | Truck latitude | ◦ |
| 12 | truck_long | Truck longitude | ◦ |
| 13 | Tension | Tether force measured in the power line | N |
Table 2.
Test specifications based on truck speed, flight mode and control line length (CLL). Part of the data are taken from [19].
Table 2.
Test specifications based on truck speed, flight mode and control line length (CLL). Part of the data are taken from [19].
| Test No. | Towing Speed (km/h) | Flight Mode | CLL (m) | File Name in Dataset |
|---|---|---|---|---|
| 1 | 30∼40 | Steady flight | 13.8 | Test 1-40-13,8-steady |
| 2 | 30∼40 | Figure-of-eight maneuvers | 13.8 | Test 2-40-13,8-Fig8 |
| 3 | 40∼50 | Steady flight | 13.8 | Test 3-50-13,8-steady |
| 4 | 40∼50 | Figure-of-eight maneuvers | 13.8 | Test 4-50-13,8-Fig8 |
| 5 | 30∼40 | Steady flight | 13.6 | Test 5-40-13,6-steady |
| 6 | 30∼40 | Steady flight | 13.4 | Test 6-40-13,4-steady |
| 7 | 40∼50 | Steady flight | 13.6 | Test 7-50-13,6-steady |
Table 3.
Motor specifications [25].
Table 3.
Motor specifications [25].
| 2-Phase Stepping Motor—PKP268D28A2 | |
|---|---|
| Mounting angle dimensions | 56.4 mm |
| Wiring method | Bipolar 4 leads |
| Axis type | Uniaxial |
| Electromagnetic brake | None |
| Excitation max. static torque | 2.5 N m |
| Rotor moment of inertia | 500 × 10 kg m |
| Reduction ratio | - |
| Basic step angle | 1.8 |
| Rated current | 2.8 A/phase |
| Voltage | 3.4 V |
| Winding resistance | 1.2 /phase |
| Inductance | 4.6 mH/phase |
| Motor part mass | 1.1 kg |
Table 4.
Motor driver specifications [26].
Table 4.
Motor driver specifications [26].
| Bipolar Drive Driver—CVD228-K | |
|---|---|
| Drive system | Micro-step drive bipolar constant current method |
| Driver type | Pulse train input type |
| Driver shape | Without mounting plate |
| Power input voltage | 24 V DC |
| Power supply voltage allowable range | ±10% |
| Power input current | 3.0 A |
| Motor drive current (factory setting) | 2.8 A/phase |
| Circuit part mass | 0.02 kg |
Table 5.
GPS specifications [30].
Table 5.
GPS specifications [30].
| GPS Receiver—LS20031 5 Hz |
|---|
| 5 Hz sampling rate (can be raised to 10 Hz) |
| 57,600 bps TTL serial interface |
| 66 Channel GPS |
| Fast TTFF at low signal level |
| Capable of SBAS (WAAS, EGNOS, MSAS) |
| Built-in micro battery to preserve system |
| data for rapid satellite acquisition |
Table 6.
IMU specifications [31].
Table 6.
IMU specifications [31].
| Triple Axis Accelerometer and Gyro Breakout—MPU-6050 |
|---|
| I2C digital-output of 6- or 9-axis motion fusion data in |
| rotation matrix, quaternion, Euler angle or raw data format |
| Input Voltage: 2.3–3.4 V |
| Tri-Axis angular rate sensor (gyro) with a sensitivity up to |
| 131 LSBs/dps |
| Full-scale range of ±250, ±500, ±1000, and ±2000 dps |
| Tri-Axis accelerometer with a programmable full scale |
| range of ±2 g, ±4 g, ±8 g and ±16 |
| Fast TTFF at low signal level |
| Capable of SBAS (WAAS, EGNOS, MSAS) |
| Built-in micro battery to preserve system data for rapid |
| satellite acquisition |
Table 7.
Wireless module specifications [33].
Table 7.
Wireless module specifications [33].
| XBee 3 Pro Module—PCB Antenna |
|---|
| RF 250 Kbps, Serial 1 Mbps |
| 100 m (indoor) to 3.2 km (outdoor) range |
| Transmit power +19 dBM at 135 mA |
| Receiver Sensitivity −103 dBm at 15 mA |
| 4× 10-bit ADC inputs |
| 15× Digital I/O pins |
| HCS08 CPU at up to 50.33 MHz |
| 128/256 bit AES Encryption |
| 2.1 V to 3.6 V operating voltage |
| 1.7 A power-down current |
| Built in RS-485 support |
| AT command or API frame support |
Table 8.
Altitude sensor specifications [32].
Table 8.
Altitude sensor specifications [32].
| Altitude/Pressure Sensor Breakout—MPL3115A2 |
|---|
| 1.95–3.6 V Supply Voltage, internally regulated by LDO |
| 1.6–3.6 V Digital Interface Supply Voltage |
| Fully Compensated internally |
| Direct Reading, Compensated |
| Pressure: 20-bit measurement (Pascals) |
| Altitude: 20-bit measurement (meters) |
| Temperature: 12-bit measurement () |
| Autonomous Data Acquisition |
| Spatial resolution down to 30 cm |
| 32 Sample FIFO |
| Ability to log data up to 12 days using the FIFO |
| 1 sto 9 h data acquisition rate |
| I2C digital output interface (operates up to 400 kHz) |
Table 9.
Speed sensor specifications [34].
Table 9.
Speed sensor specifications [34].
| Qstarz LT-6000S GPS Lap Timer |
|---|
| 10 Hz sampling time of GPS data |
| High sensitivity GPS |
| 4 GB memory capacity to record up to 20,000 min |
| Battery capacity to operate up to 10 h |
| Input power 5 V DC, 500 mA |
Table 10.
Load cell specifications [37].
Table 10.
Load cell specifications [37].
| Load Cell - DPU Series | |
|---|---|
| Capacity | 1∼20 kN |
| Rated output | 2 mV/V ± 1% |
| Nonlinearity | 0.05% R.O |
| Hysteresis | 0.05% R.O |
| Recommended voltage | 10 V DC |
| Allowable applied voltage | 18 V DC |
| Working environment | −10∼+70 |
| Allowable temperature | −20∼+80 |
| Temperature influence for 0 | 0.01%/ |
| Temperature influence for output | 0.01%/ |
| Mass | Approx. 800 g |
© 2020 by the authors. Licensee MDPI, Basel, Switzerland. This article is an open access article distributed under the terms and conditions of the Creative Commons Attribution (CC BY) license (http://creativecommons.org/licenses/by/4.0/).
Share and Cite
MDPI and ACS Style
Rushdi, M.A.; Dief, T.N.; Yoshida, S.; Schmehl, R. Towing Test Data Set of the Kyushu University Kite System. Data 2020, 5, 69. https://doi.org/10.3390/data5030069
AMA Style
Rushdi MA, Dief TN, Yoshida S, Schmehl R. Towing Test Data Set of the Kyushu University Kite System. Data. 2020; 5(3):69. https://doi.org/10.3390/data5030069
Chicago/Turabian StyleRushdi, Mostafa A., Tarek N. Dief, Shigeo Yoshida, and Roland Schmehl. 2020. "Towing Test Data Set of the Kyushu University Kite System" Data 5, no. 3: 69. https://doi.org/10.3390/data5030069