Article

Antarctic Special Protected Area 161 as a Reference to Assess the Effects of Anthropogenic and Natural Impacts on Meiobenthic Assemblages

by
Federica Semprucci
1,2,3,
Luca Appolloni
3,4,*,
Eleonora Grassi
1,
Luigia Donnarumma
3,4,
Lucia Cesaroni
1,
Giuseppina Tirimberio
4,
Elena Chianese
4,*,
Paola Di Donato
4,5,
Giovanni Fulvio Russo
3,4,
Maria Balsamo
1,2,3 and
Roberto Sandulli
3,4,*
1
Department of Biomolecular Sciences (DiSB), University of Urbino, Via Cà Le Suore, 61029 Urbino, Italy
2
Fano Marine Center, The Inter-Institute for Research on Marine Biodiversity, Resources and Biotechnologies, 61032 Fano, Italy
3
Consorzio Nazionale Interuniversitario per le Scienze del Mare (CoNISMa) Rome—DiST, Marine Ecology Laboratory, Centro Direzionale—Isola C4, 80143 Napoli, Italy
4
Department of Science and Technology (DiST), Parthenope University of Naples, Centro Direzionale—Isola C4, 80143 Napoli, Italy
5
Institute of Biomolecular Chemistry National Research Council of Italy, Via Campi Flegrei, 34, Pozzuoli, 80078 Napoli, Italy
*
Authors to whom correspondence should be addressed.
Diversity 2021, 13(12), 626; https://doi.org/10.3390/d13120626
Submission received: 8 September 2021 / Revised: 22 November 2021 / Accepted: 23 November 2021 / Published: 29 November 2021
(This article belongs to the Section Marine Diversity)

Abstract

:
The Antarctic region is usually considered a pristine area. Nevertheless, regional warming effects and increasing human activities, including the presence of several research stations, are inducing considerable environmental changes that may affect the ecosystem’s functions. Therefore, during the XXXIII Antarctic expedition, we carried out an investigation in Terra Nova bay (Ross Sea), close to the Antarctic Specially Protected Area (ASPA) n.161. In particular, we compared the effects of two different types of impacts on the meiobenthic assemblages: anthropogenic impact (AI), associated with the activity of Mario Zucchelli Research Station (MZS), and natural impact (NI) attributable to a large colony of Adélie penguins (Pygoscelis adeliae) in Adelie Cove. For each impacted site, a respective control site and two sampling depths (20 and 50 m) were selected. Several environmental variables (pH, dissolved oxygen, major and minor ions, heavy metals, organic load, and sediment grain size) were measured and analysed, to allow a comprehensive characterization of the sampling areas. According to the criteria defined by Unites States Environmental Protection Agency (US EPA 2009), heavy metal concentrations did not reveal critical conditions. However, both the MZS (AI20) and penguin colony (NI20) sites showed higher heavy metal concentrations, the former due to human activities related to the Italian research station, with the latter caused by the penguins excrements. Meiobenthic richness and abundance values suggested that the worst ecological condition was consistently related to the Adélie penguins colony. Furthermore, the higher contribution of r-strategists corroborates the hypothesis that the chronic impact of the penguin colonies may have stronger effects on the meiobenthos than the human activities at the MZS. Food is not limited in shallow Antarctic bottoms, and microscale differences in primary and secondary production processes can likely explain the greater spatial heterogeneity, highlighted both by the univariate and multivariate attributes of meiobenthic assemblage (i.e., richness, diversity, abundance, whole structure assemblage, and rare taxa) at the deeper stations. As reported in other geographical regions, the assemblage structure of rare meiobenthic taxa is confirmed to be more susceptible to environmental variations, rather than the whole assemblage structure.

1. Introduction

Despite the fact that polar regions might be particularly sensitive to anthropogenic impacts (e.g., climate changes), Antarctic coasts are still amongst the least studied on Earth, due to their remoteness and harsh regional climatic conditions [1]. Available data from Antarctica show a high marine faunal biodiversity, even though this knowledge is mainly limited to mega- and macrofauna, while the meiobenthic component (body size: 45–500 µm) is overlooked or partly studied in Antarctic Peninsula (East Antarctica) (e.g., [2,3]). However, recent metabarcoding data reveal high levels of meiobenthic diversity within the same magnitude, as in temperate regions, confirming that meiobenthos plays a significant role in the global biogeochemical cycles of inorganic and organic compounds [3,4]. Many studies support the idea that meiobenthos is essential for understanding the functioning and resilience of marine ecosystems (e.g., [5]). Furthermore, they are more abundant, compared to the macrobenthic taxa, and require only a limited sediment volume to obtain representative samples [6]. Because of their widespread distribution, high turnover rate, life cycles spent entirely in the sediment, high biodiversity, and specific ecological requirements, meiobenthos responds more precociously to several types of environmental changes (e.g., [7,8,9,10,11,12]). Hence, they are considered effective bio-indicators of natural and anthropogenic disturbances (e.g., [13,14,15]). Nematodes and copepods generally constitute more than 80% of the total meiobenthic abundance, whereas many other taxa often represent less than 1% each. However, these latter, defined as ‘rare’ by Bianchelli and co-authors [16], may be useful to disentangle the differences in environmental conditions, thus providing a clearer figure of the ecosystem status, compared to the whole meiobenthic assemblage [17].
Although heavy metals can be introduced into the environment by natural causes, the major input derives from anthropogenic origin [6]. One of the main problems associated with these contaminants is their persistence; unlike organic pollutants, they do not decay but show high bioaccumulation and biomagnification rates. Over the last four decades, many field studies and laboratory experiments have documented significant changes in meiobenthic structure and diversity after exposure to heavy metals (e.g., [6,18]). The chemical form, as well as the type of trace element, is generally important in determining the toxicity effects on meiobenthic organisms (see [19] for review). However, laboratory studies have shown that the effect of trace elements depends not only on the nature of the element, but also on some environmental conditions, such as temperature, salinity, and trophic availability [19].
Since meiobenthic organisms have a crucial role in detritus decomposition, nutrient cycling, and energy flow, their change in composition and structure is assumed to be a good proxy for detecting biodeposition effects (e.g., [20,21,22,23]). The primary anthropogenic sources of organic enrichment in marine ecosystems are related to sewage discharges and aquaculture activities (see [6] and reference therein), but there are also possible natural origins of organic enrichment. Penguins constitute an important bird biomass in the Southern Hemisphere, where they breed in colonies on different sites, from hundreds to thousands of individuals [24]. In the Ross Sea region (Antarctica), large colonies of Adélie penguins (Pygoscelis adeliae) have been forming extensive deposits of ornithogenic sediments [25], and the biochemical characterization of the sediments revealed organic matter concentrations higher than those reported for highly productive areas [26,27,28,29]. Chemical contamination, especially through fuel spills and exhaust gases, is the most widespread environmental impact of human activities in Antarctica, especially near the land stations [30]. In particular, human presence has determined a marked increase in products discharged at sea, such as fuels, sewage waste, and the ‘grey water’ originating from toilets, laundry facilities, accommodation, and cooking areas [31,32,33,34]. Thus, products such as heavy metals/metalloids (typically copper, lead, zinc, cadmium, mercury, and arsenic), hydrocarbons, and desalination plant brine [35] can strongly affect Antarctica benthic assemblages, inducing possible higher abundance of resilient taxa, such as polychaetes and gastropods, when compared to uncontaminated assemblages [36]. In addition to human activities, some products, mostly heavy metals, may derive from penguin faeces; for example, [37] observed the presence of cadmium in Edmonson Point (Terranova Bay), due to the Adélie penguins’ guano. Similar results were found by [38], revealing cadmium, copper, and zinc in penguins’ faeces.
Among the main types of human activities in Antarctica, research has demonstrated that the limited sewage treatment of the research stations represents an impact on marine ecosystems [33,36,39,40]. In the early 1990s, the Madrid Protocol required that national programs prevent or mitigate the adverse impacts of human activity on the environment and natural resources of the Antarctic continent, but disturbances and impacts still occur [41,42,43,44].
This study investigates the response of the meiobenthic assemblages to different sources and magnitudes of disturbance. To achieve this objective, during the XXXIII Antarctic expedition, environmental parameters (i.e., pH, dissolved oxygen, major and minor ions, and heavy metals), organic load, sediment grain size, and meiobenthos were investigated close to the Mario Zucchelli Station (MZS, Terra Nova Bay, Ross Sea) and along the coast of the proximate Antarctic Specially Protected Area (ASPA) n.161. Based on previous knowledge [29], two main sampling locations (and their respective controls) were selected: the Mario Zucchelli Station (MZS, hereafter named as anthropogenic impact site, AI) and Adelie Cove (natural impacted site, NI). Previous studies highlighted that research stations and penguin colonies are characterized by an organic and chemical enrichment in sediments, due to the impact of the untreated, domestic wastewaters, related to the summer research activities, and by the penguin excreta accumulation, respectively [30,32,35,38,45,46]. The main questions were: (1) do anthropogenic and natural impact sources show different effects on the meiobenthic assemblages? (2) Can rare taxa add more information in the detection of the distinct environmental conditions of the sampling sites than those supplied by the whole meiobenthic assemblage?

2. Material and Methods

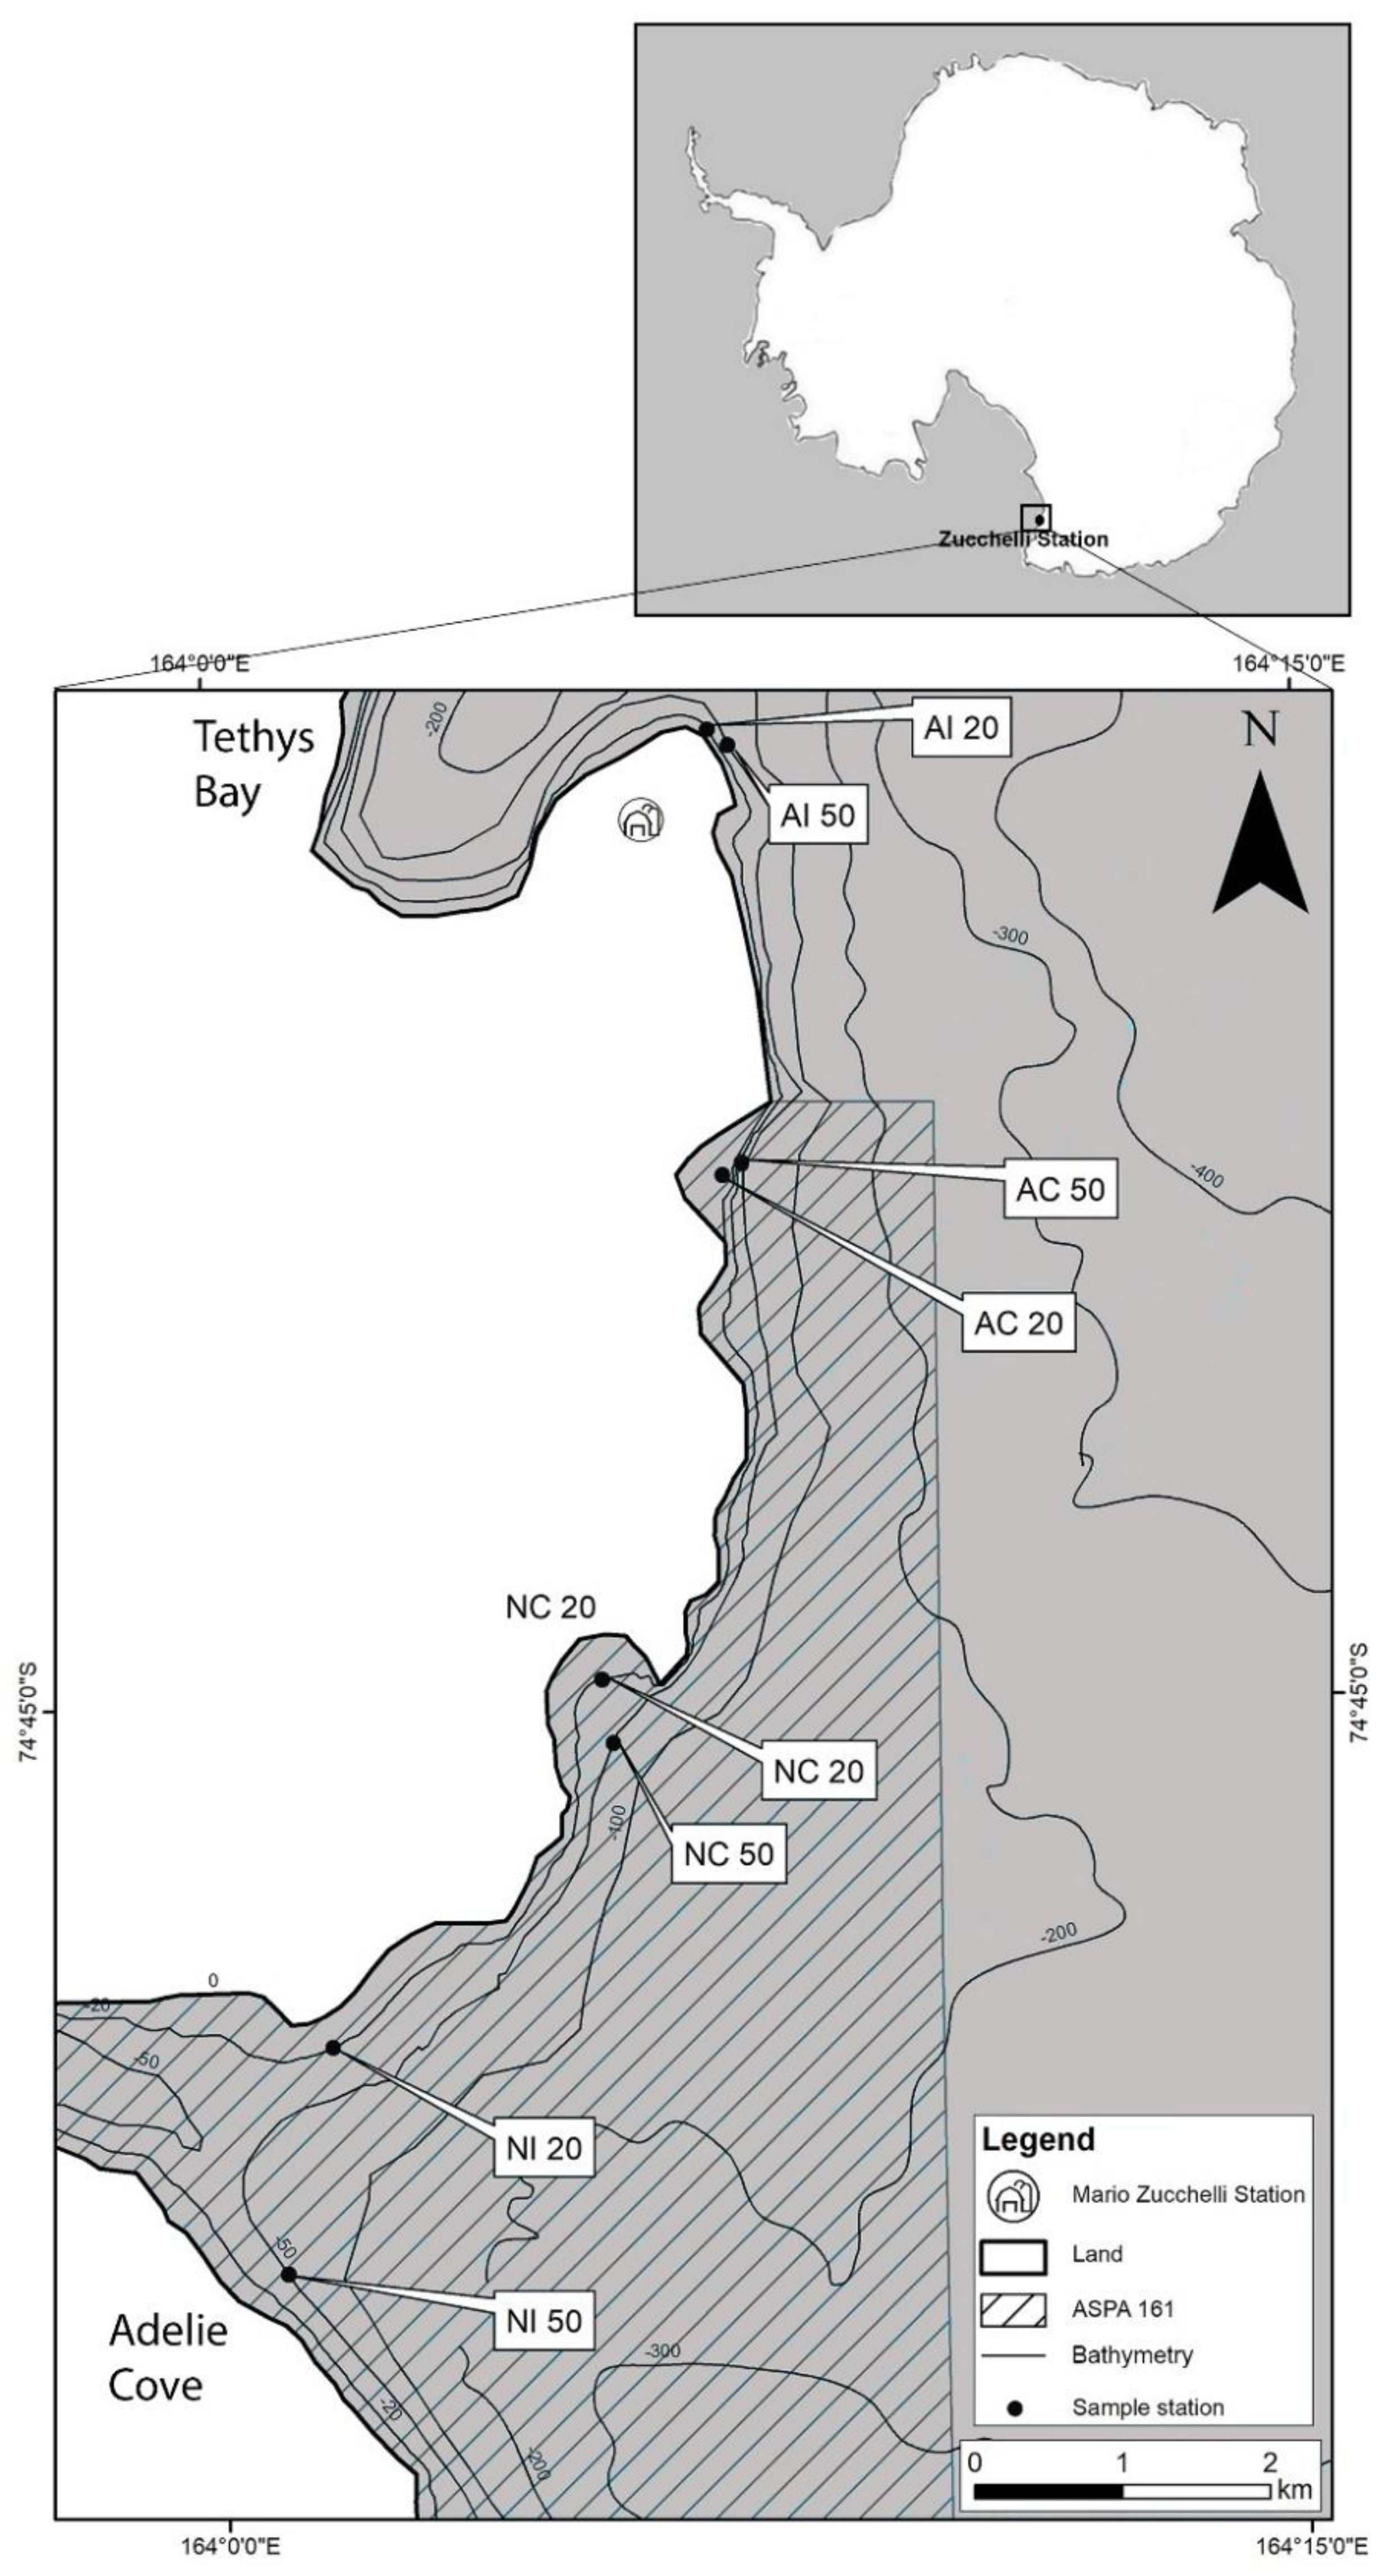
2.1. Study Area and Sampling Sites

MZS is located at 74°42′ S, 164°07′ E in the Terra Nova Bay area (Ross Sea) and accommodates about 120 people; although, during the summer, more than 250 people live in the base for short and long periods (Figure 1). Station facilities include an electrical generator; desalination plant, for drinkable water from sea water; incinerator; and a sewage primary treatment plant. The base is supplied with food and other material by ships from New Zealand. All waste is subjected to differentiated collection, locally treated, or brought back to Italy for recycling or disposal.
Adelie Cove, a small 70-m deep V-shaped bay, located at 74°46′ S and 164°1′ E in Terra Nova Bay (Ross Sea), hosts an Adelie penguin colony, composed of hundreds of individuals (Figure 1). It is separated from the open sea by a 12- to 15-m deep sill, which forms a barrier to inflow and outflow. This area is strongly affected by katabatic wind events, blowing down a glacial valley towards the open sea [47].
During the Antarctic summer season, 2017/2018, four sites were selected to assess the effects of anthropogenic and natural impacts on meiobenthic assemblages. In particular, the MZS area was considered as the anthropogenic impact source (AI), while a P. adeliae colony, located in Adelie Cove area, was considered as the natural impact source (NI). Two control sites, named the anthropogenic control (AC) and natural control (NC), were also chosen at about 2 Km from the AI and NI, respectively. At each area, sediments were collected from two stations, located 20 and 50 m in depth (Figure 1), by means of a modified Van Veen grab (total volume 12 l). This modified grab model permits the insertion of a Plexiglass corer into the central part of the grab, allowing for the collection of undisturbed sediments. Three independent deployments of the grab were utilized to collect three sediment replicates. Thus, one subsample for total organic content (TOC), one for grain-size, and one for meiobenthos analyses were collected for each grab sample, by means of corers (inner diameter 2.7 cm), down to a sediment depth of 5 cm. The sediment was fixed with 4% neutralized formalin in seawater and stained with Rose Bengal. Interstitial water was also collected by 20 mL syringe and immediately frozen for the further physico-chemical analyses.

2.2. Environmental Parameters Analyses

Analysis of major and minor ions, heavy metals, and chemical-physical parameters for interstitial waters was carried out at the Laboratory of Chemistry at Parthenope University of Naples.
Samples were filtered with cellulose filters (porosity: 0.20 μm); for each filtered sample, pH, salinity, dissolved oxygen (O2), and conductivity values were measured using a pHenomenal MU 6100 L (VWR) multimeter. Samples were then treated with H2O2 (100 μL in 10 mL of sample) for the digestion of organic content; then, samples were fractioned in two aliquots for ions and metals determination.
For the analysis of major and minor ions concentration, interstitial water samples were analyzed using a Dionex ICS1100 system, equipped with an ASRS 300-4 mm suppressor (applied current of 33 mA and an AS22 column working with a buffer solution 3.5 mM of sodium carbonate/bicarbonate, at a flow rate of 1.20 mL/min) for anions detection. This system allows for the determination of Cl, F, Br, NO2, NO3, PO43, and SO42, as the inorganic species, and HCOO, CH3COO, and C2O42 as the organic species.
In addition, the system was equipped with a CERS 500-4 mm suppressor, with an applied current of 15 mA and CS12A column (working with 20 mM methanesulfonic acid solution as eluent, at a flow rate of 0.25 mL/min) for cations determination (Li+, Na+, K+, NH4+, Ca2+, and Mg2+). For both anions and cations, calibration curves were defined using certified multistandard solutions.
For metals determination, voltammetric analyses were carried out with a Metrohm 797 VA Computrace and multimode working Mercury electrode. An Ag/AgCl electrode was used as reference and a Pt electrode as auxiliary electrode. For calibration, the standard addition method was applied to limit the matrix effects. All elements were quantified using linear regression, based on the height of voltammogram peaks. Anodic stripping voltammetry (ASV), with the hanging mercury drop electrode (HMDE), was used to determine all those metals that are soluble in mercury; this method allows the determination of zinc, cadmium, lead, and copper.
In order to consider the effects of soluble species, coming from ultrapure water, LODs (limit of detections) were calculated for each species [48].
For the grain size analysis, sediment was sieved over a series of sieves, with mesh sizes ranging from 1 mm to 0.25 mm, considering three main sediment fractions: coarse sand (sediment fraction ≥ 1 mm), sand (<1 mm and ≥0.25 mm), and fine sand (<0.25 mm) [49]. Fractions were dried in oven at 60 °C for 48 h and weighed; data were expressed as percentages of the total sediment dry weight, differencing it in the three size classes. Total organic carbon (TOC) was determined, according to [50], and expressed as a percentage in the sediment. In detail, a known weight of sample was placed in a ceramic crucible (or similar vessel), which was then heated to between 350 and 500 °C overnight. The sample was then cooled in a desiccator and weighed. Organic matter content was calculated as the difference between the initial and final sample weights divided by the initial sample weight times 100%. All weights are dried and put to 60 °C for 48 h, prior to organic matter combustion.

2.3. Meiobenthic Assemblage Analysis

In the laboratory, all meiobenthic samples were carefully washed through two nested mesh sieves (500 and 45 µm) (e.g., [51]). The first was used to exclude macrofaunal organisms, while the second was used to retain meiobenthos. The residual fraction obtained was centrifuged three times (10 min at 3000 rpm) with Ludox HS 30 colloidal silica (density 1.18 g cm−3) for specimen extraction purposes [52]. The organisms retained on the 45 µm sieve were then transferred into a ‘Delfuss’ Petri dish with a checkered bottom and, with the aid of a Leica G26 stereomicroscope, sorted into major meiobenthic groups and counted. The density of all the individuals found (both temporary and permanent meiobenthos) was standardized as abundance in 10 cm−2. The meiobenthic groups that were found in low densities (less than 1% of the total abundance in all investigated samples) were defined as rare taxa and named as reported in the ‘Others’ category [16].
In order to describe the meiobenthic assemblage structure, synecological indices were used. In particular, the number of meiobenthic taxa, the number of individuals in 10 cm−2 (A), diversity index, calculated by Shannon index (H’), and evenness, calculated according to Pielou index (J) (both using log2 data), were calculated for each station, at the major group level. Ecological quality (EcoQ) status was assessed using meiofaunal richness, according to Danovaro et al. (2004 and modified in agreement with the WFD classification): bad = ≤4 taxa, poor = 4–7 taxa, moderate = 8–11 taxa, good environmental quality = 12–16, and high environmental quality = ≥16 taxa.

2.4. Statistical Analyses
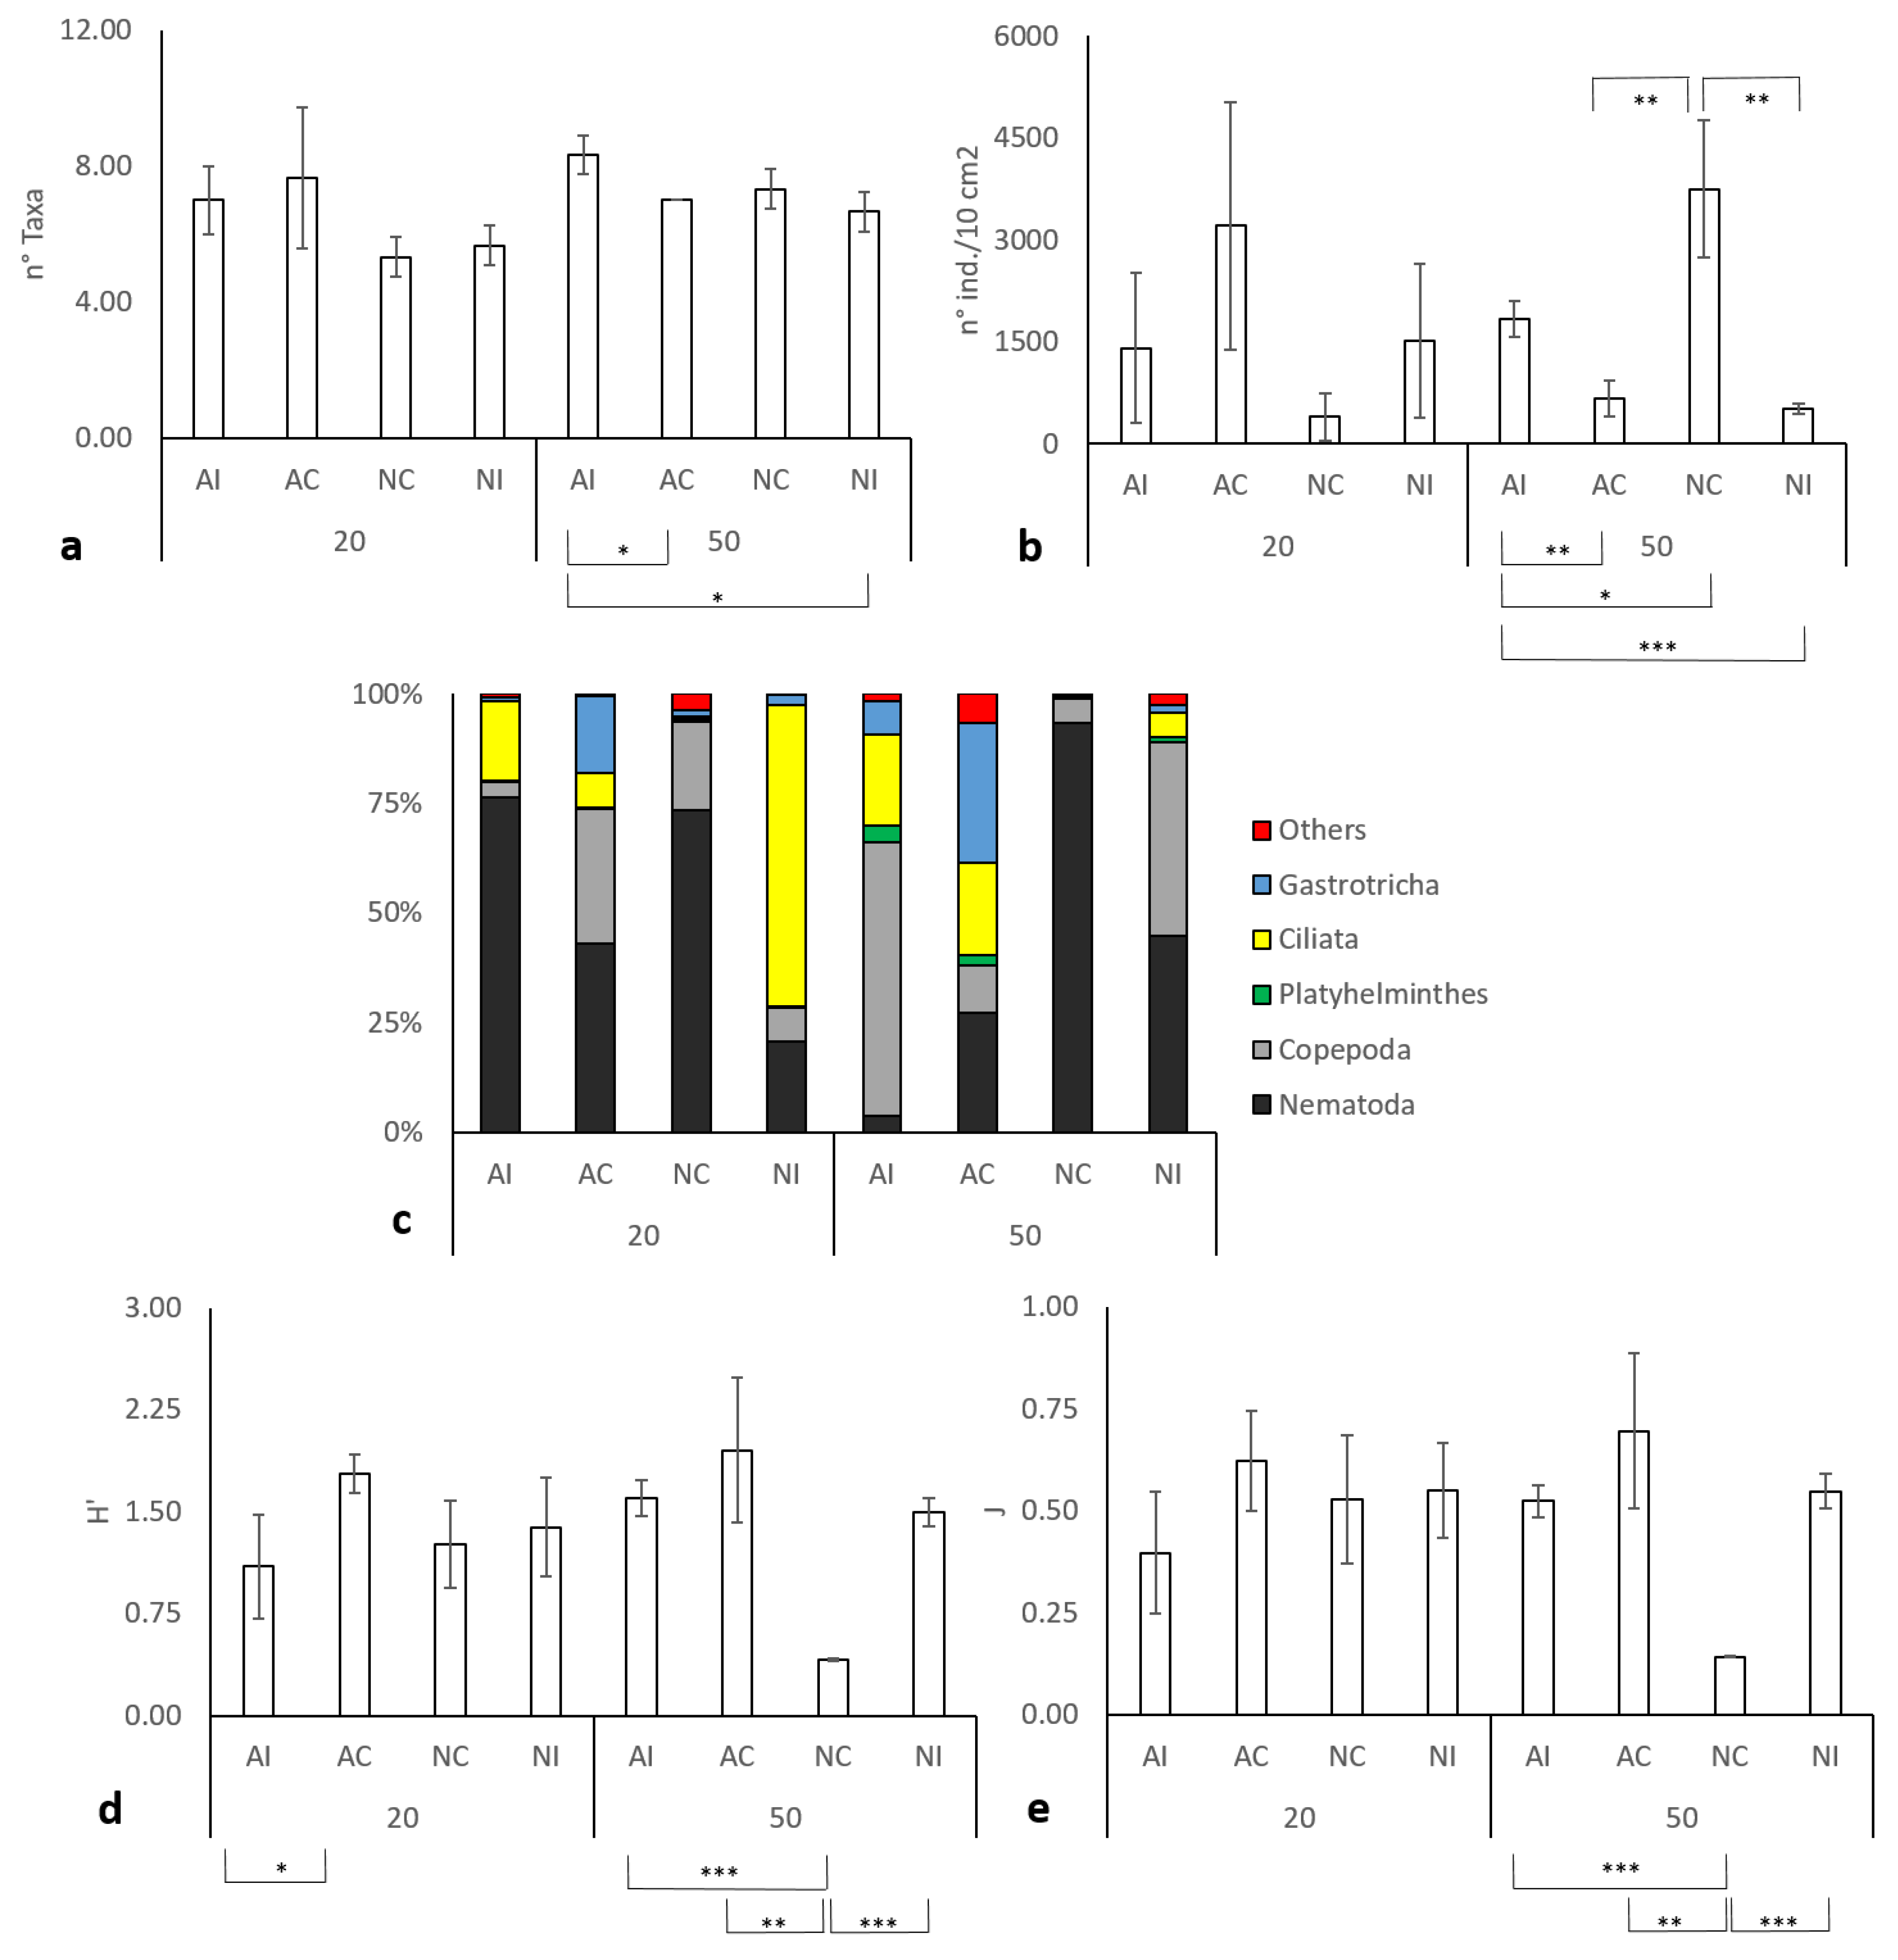
The obtained environmental and biological data set was used to assess possible significant differences between the different impacted areas. As applied in previous studies (e.g., [53,54,55]), the ACI (after-control/impact) experimental design was chosen selecting two factors: area factor (Ar, fixed and orthogonal with 4 levels: anthropically impacted area = AI, the relative anthropogenic control area = AC, naturally impacted area = NI, and the relative natural control area = NC) and depth factor (De, fixed and orthogonal with 2 levels: 20 and 50 m), with n = 3.
All statistical analyses were performed with PRIMER-E 6 + PERMANOVA [56].
Environmental data were normalized, and a permutational multivariate analysis of variance (PERMANOVA, [57]), based on Euclidean distance, was performed, in order to assess differences in data composition imputable to the anthropogenic or natural impacts. Each term in the analysis was tested by 4999 random permutation [58], and a post-hoc pair-wise comparison, using PERMANOVA t-statistic, was also conducted, if necessary. The p values for pairwise comparisons were obtained from Monte Carlo asymptotic distributions, because of the restricted number of unique permutations. Multivariate patters were visualized through principal component analyses (PCA) ordination plot.
To test for spatial differences in the total meiobenthic assemblage and rare taxa, data matrix based on the faunal abundances were constructed by applying the Bray–Curtis similarity (biological data were fourth-root transformed). Each term in the analysis was tested by 4999 random permutations, and a post-hoc pair-wise comparison, using PERMANOVA t-statistic, was also conducted, if necessary. The p values for pairwise comparisons were obtained from Monte Carlo asymptotic distributions, because of the restricted number of unique permutations. Multivariate patters were visualized through canonical analysis of principal coordinates ordination plot (CAP, [59]), and taxa were correlated by Pearson index (ρ), if needed. Based on the results of PERMANOVA, SIMPER analyses [60] were employed to identify taxa that mainly affected dissimilarities: within total or rare assemblages, among area factor levels, and/or between depth factor levels. Univariate PERMANOVA analyses were performed on synecological indices, based on Euclidean distances [61], in order to test for differences among assemblage structures.
Environmental data were here related to meiobenthic assemblages through distance-based linear modelling (DistLM, [62]), using stepwise as the selection procedure and adjusted r2 (hereafter Adj. r2) as the selection criterion, in order to assess what variable affected biological patterns. Relations among assemblages and environmental variables, selected by distLM, were visualized through distance-based redundancy analysis ordination plot (dbRDA, [63]).

3. Results

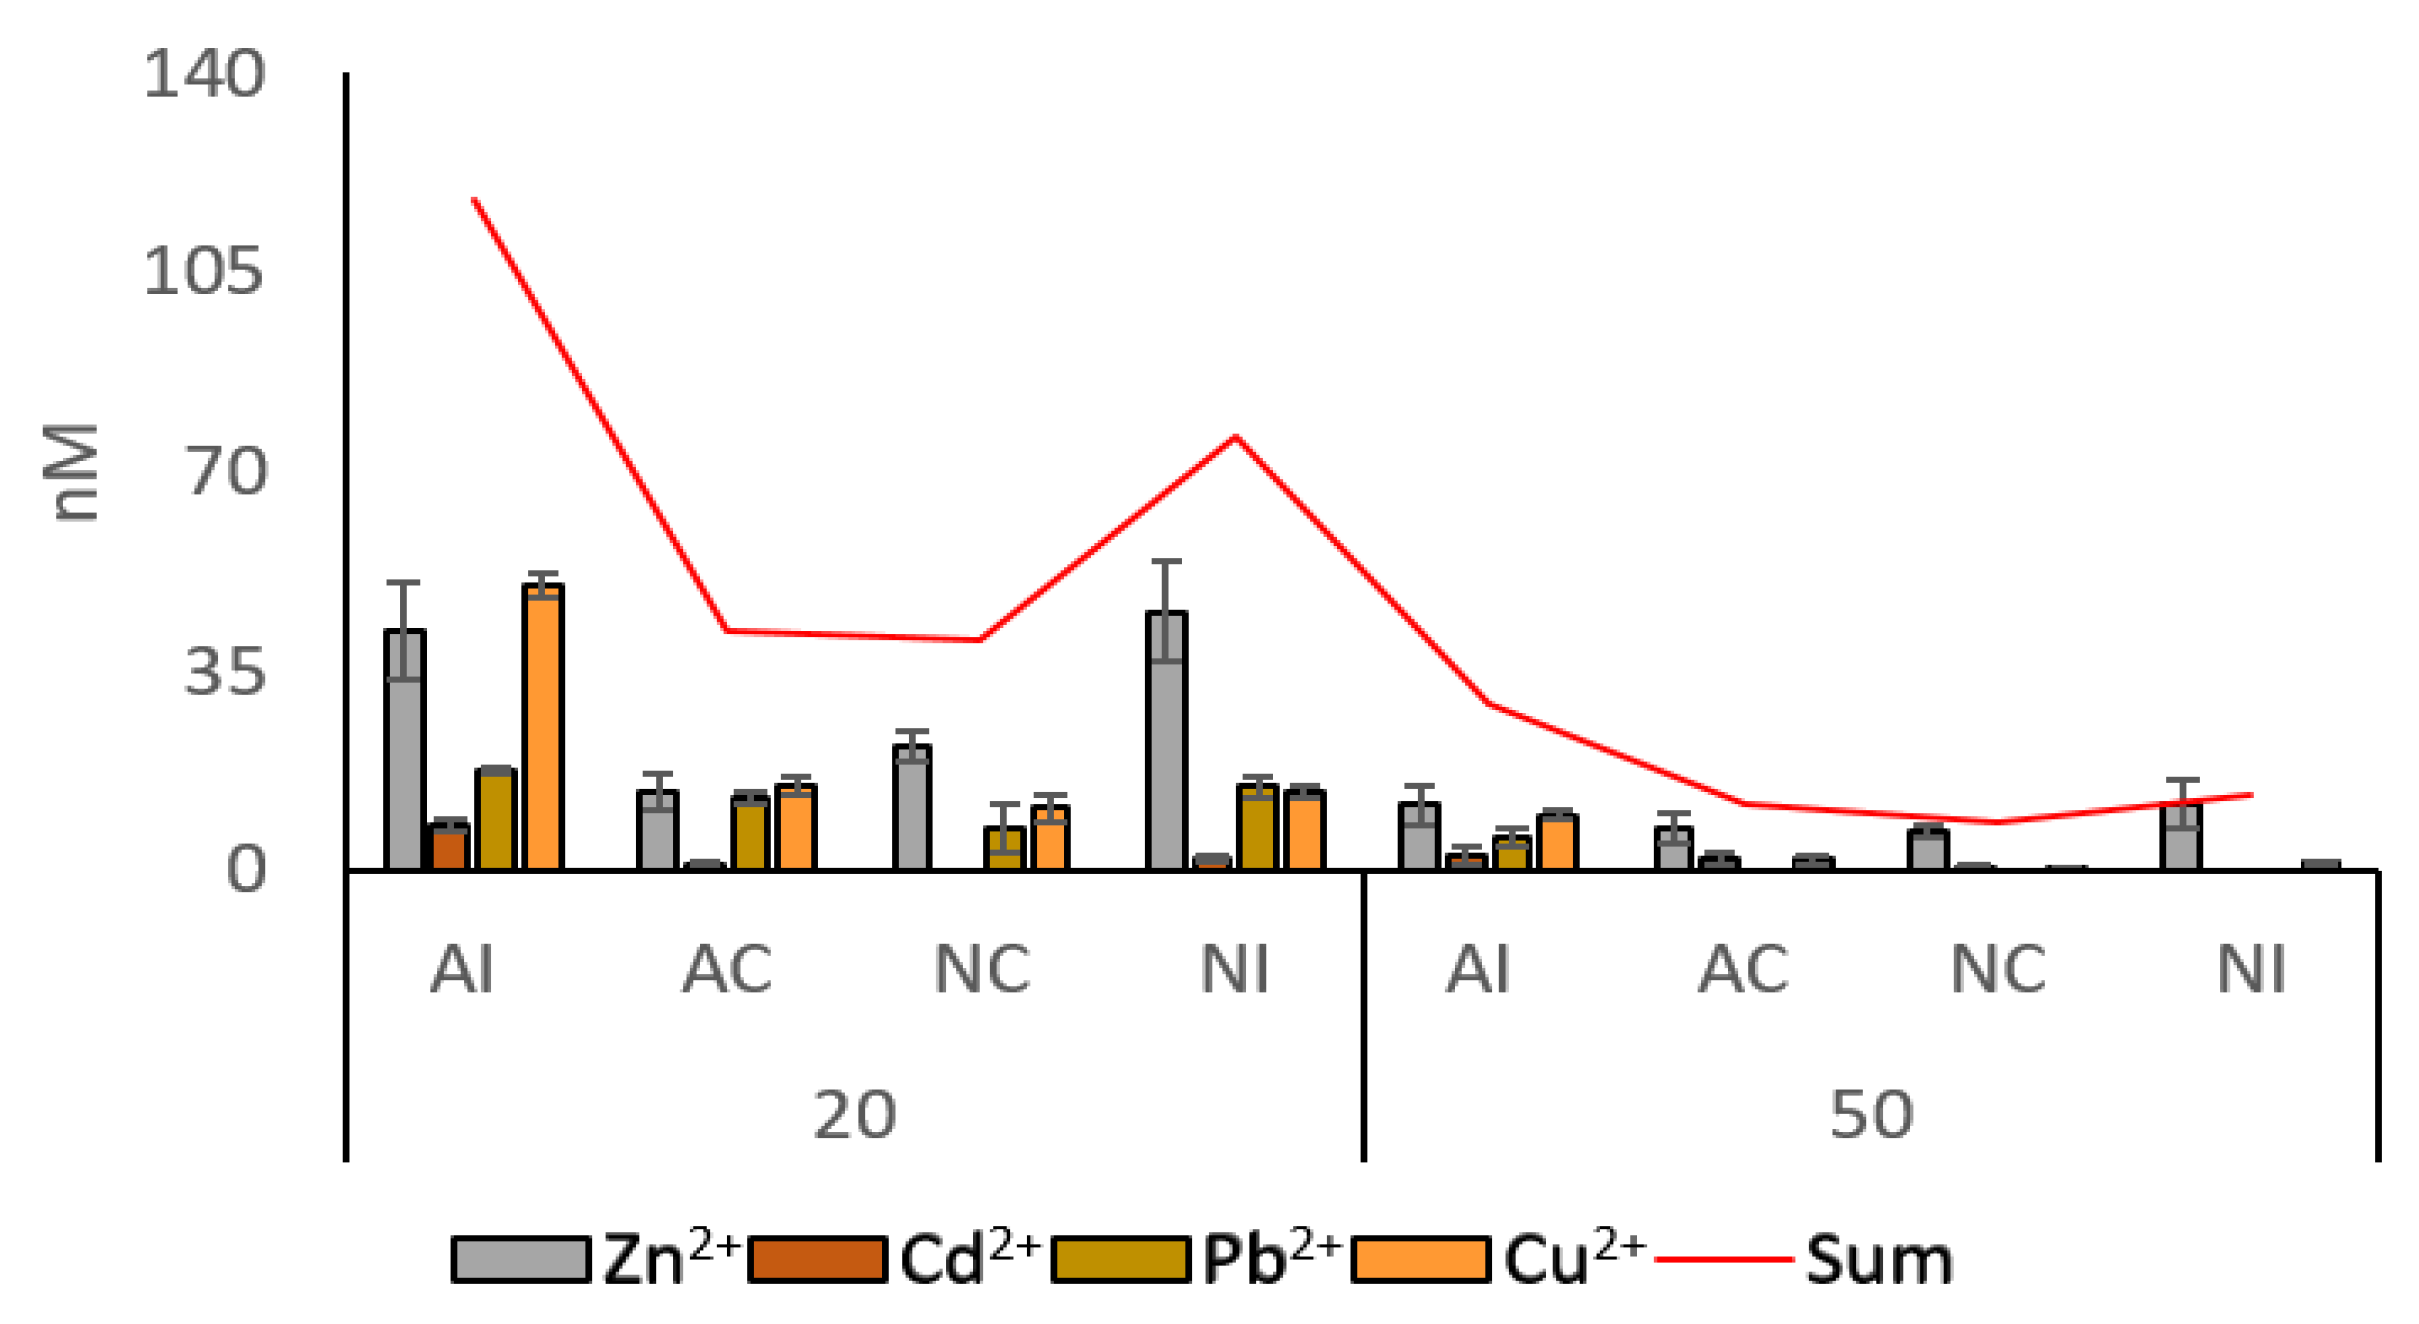
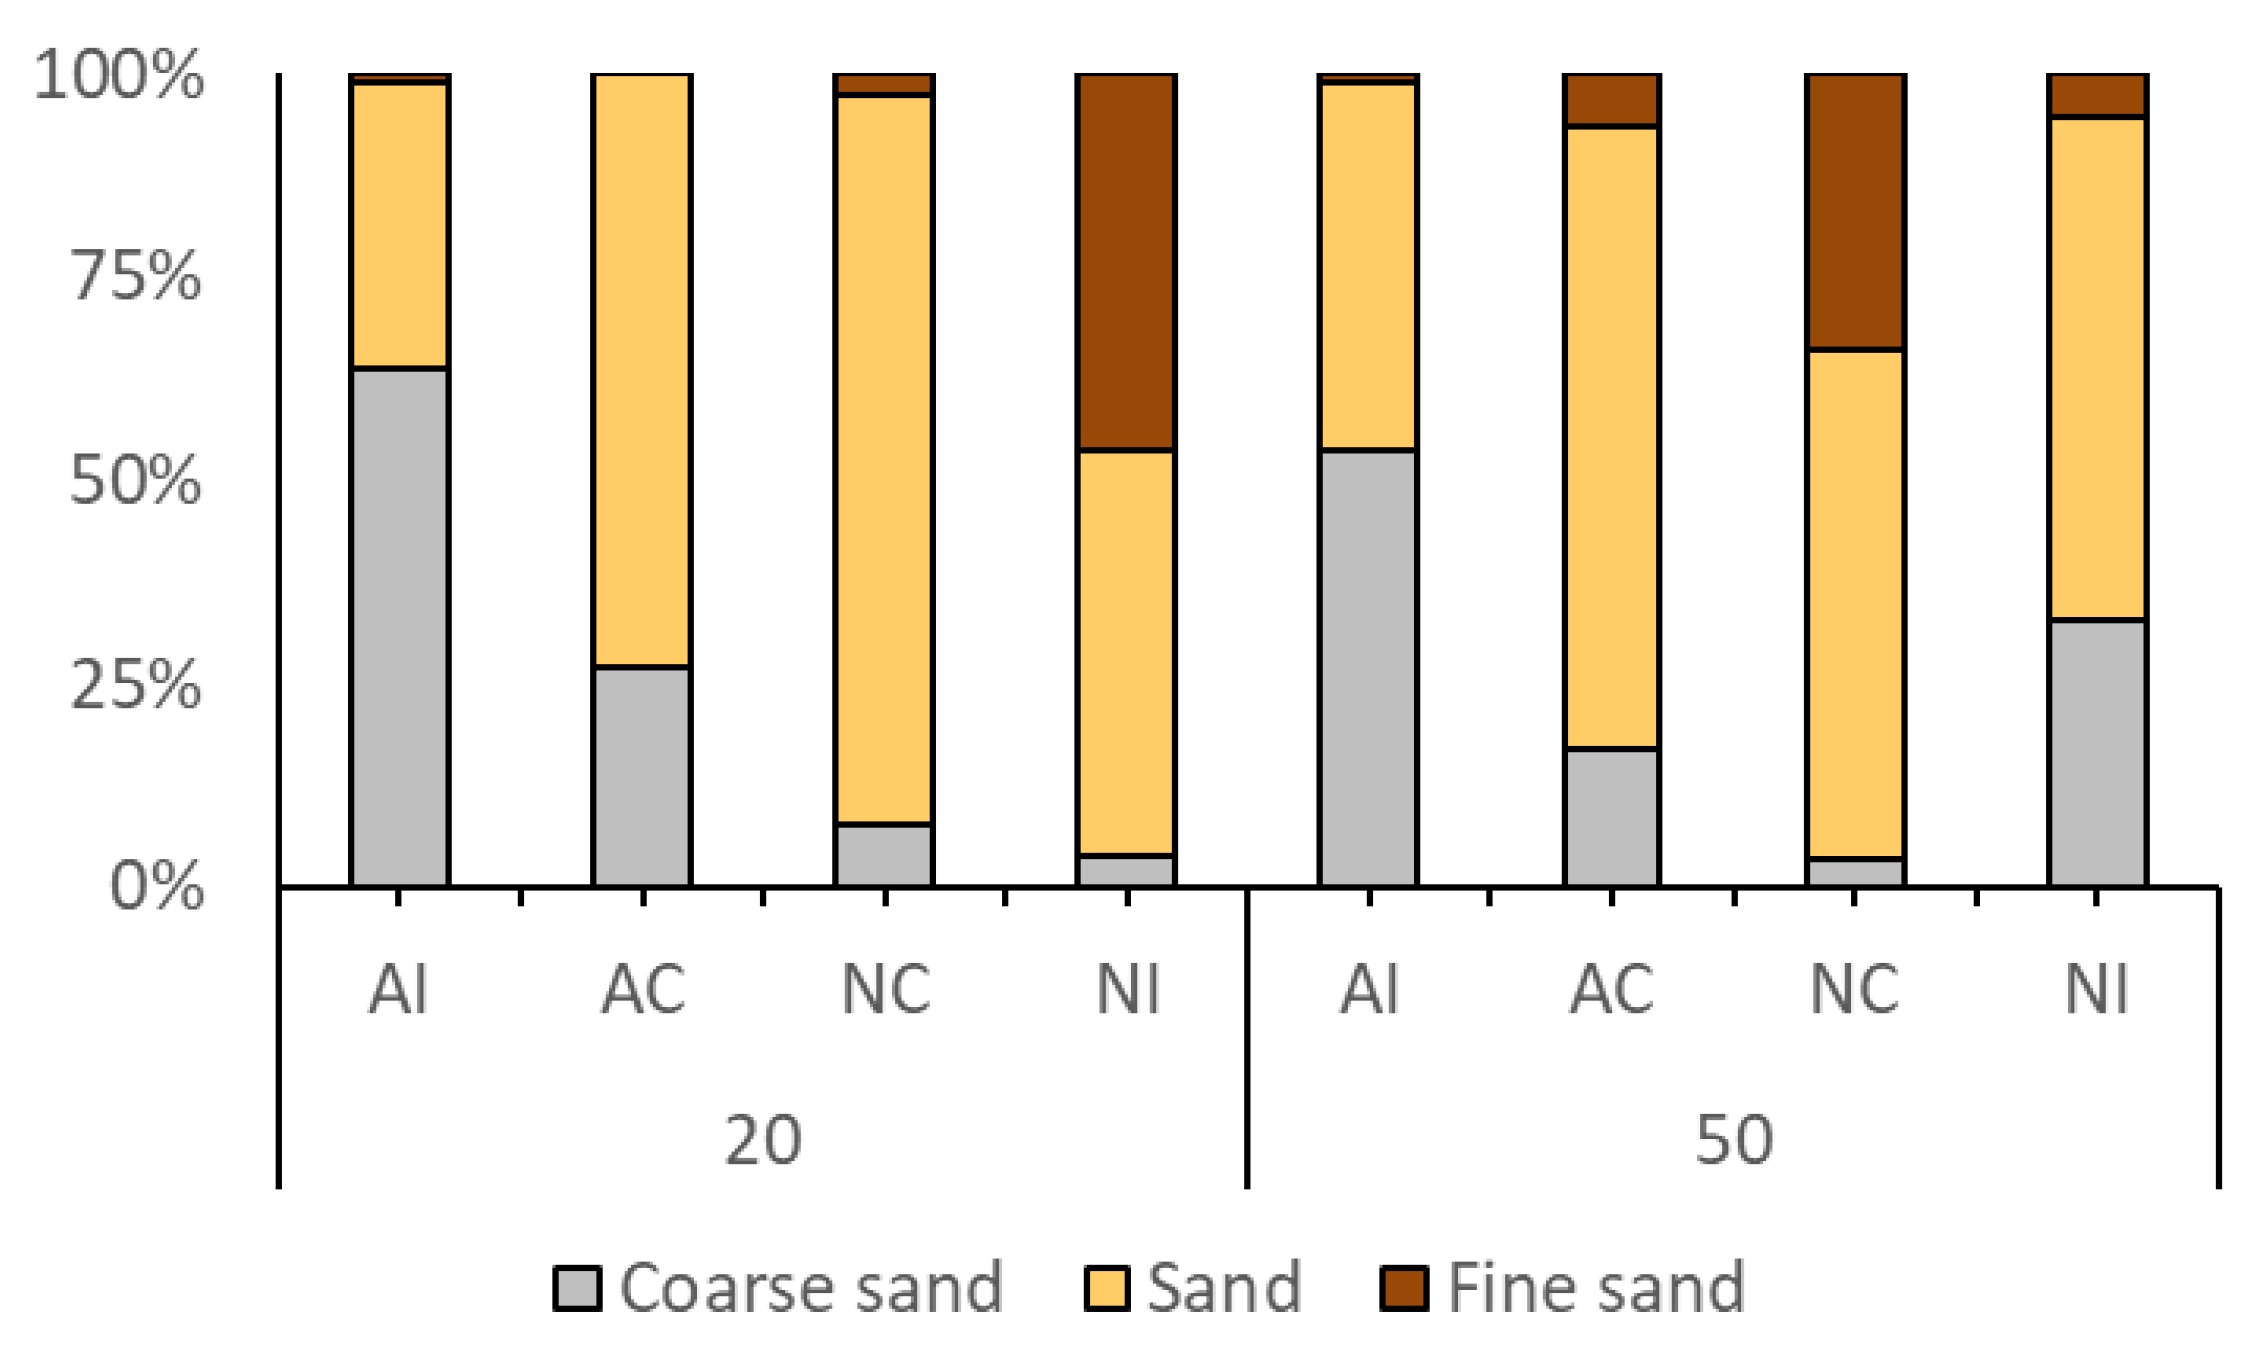
3.1. Environmental Data

Values of zinc (Zn2+), cadmium (Cd2+), lead (Pb2+), copper (Cu2+), nitrate ion (NO3), phosphate ion (PO43−), sulphate ion (SO42−), pH, O2, coarse sand, medium sand, fine sand, and TOC in the sampling stations are reported in the Table 1.
The highest concentration of PO43− was detected in the stations NI20, although it was also found in NC50 and AC50, with very low concentrations. NO3 was detected in AI20, NI50, and NC50. The pH and O2 concentrations did not show high spatial variability among stations, ranging between 8.85 and 8.33 for the former and between 6.2 and 5.7 mg/L the latter. Finally, SO42− was detected in all the sampling stations with comparable concentrations, except for AC20, where it reached the lowest value.
Metal concentrations showed a high spatial variability (Figure 2). Zn2+ concentration ranged between 41.99 ± 8.344 nM in AI20 and 6.942 ± 0.873 nM in NC50; Cd2+ between 7.894 ± 1.15 nM in AI20 and nd (not detectable concentration) in NC20 and NI 50; Pb2+ between 17.556 ± 0.741 nM in AI20 and nd in NC50, NI50, AC50; finally, Cu2+ between 50.177 ± 2.083 nM in AI20 and 0.642 ± 0.115 nM in NC50.
The sum of the detected heavy metals showed the same spatial variability, from the north to the south stations. In particular, for the 20 and 50 m sampling stations, the highest values were reached in the stations AI and NI (117.621 nM and 76.264 nM at 20 m, as well as 29.546 nM and 13.206 nM at 50 m, respectively).
As reported in the Figure 3, the highest percentages of coarse sand were detected both at AI20 (63.62%) and AI50 (53.87%), while sand was prevalent at AC20 and NC20 (73.14% and 89.74%, respectively) and AC50 and NC50 (76.70% and 62.87% respectively). Finally, the highest fine sand percentages were found in NI20 (46.17%) and NC50 (33.78%). TOC concentrations showed the highest values at AC20 (4.04%) and AC50 (5.71%) and the lowest at NC20 (1.26%) and NC50 (1.15%).
PERMANOVA (Supplementary S1 Table S1) performed on environmental data showed that the interaction between areas and depths factors (Ar × De) determine significant differences (PERMANOVA, p < 0.001). In particular, t-statistics highlighted that, within the depth levels (i.e., 20 and 50 m), all sites showed significant differences (PERMANOVA, t-statistic p < 0.001) between each other. The same results were observed within the areas levels (AI, AC, NC, and NI), where environmental characteristics were strongly different for each pair of 20 and 50 m (PERMANOVA t-statistic, p < 0.001) samples.
The PERMANOVA results were consistent with PCA analyses (Figure 4), where the PC1 axis accounts for the 38.2% of total variance, with PC2 accounting for 25.4%. The PCA plot shows four different clusters made up of AI20 samples (Group 1), strongly correlated to coarse sand fraction and, to a lesser extent, heavy-metals and NO3; NI20 samples (Group 2) mainly correlated to pH, fine sand, and PO43−; NC20 and NC50 stations (Group 3) were associated with medium sand; and, finally, AI50, NI50 AC20, and AC50 samples (Group 4) correlated with O2 and TOC.

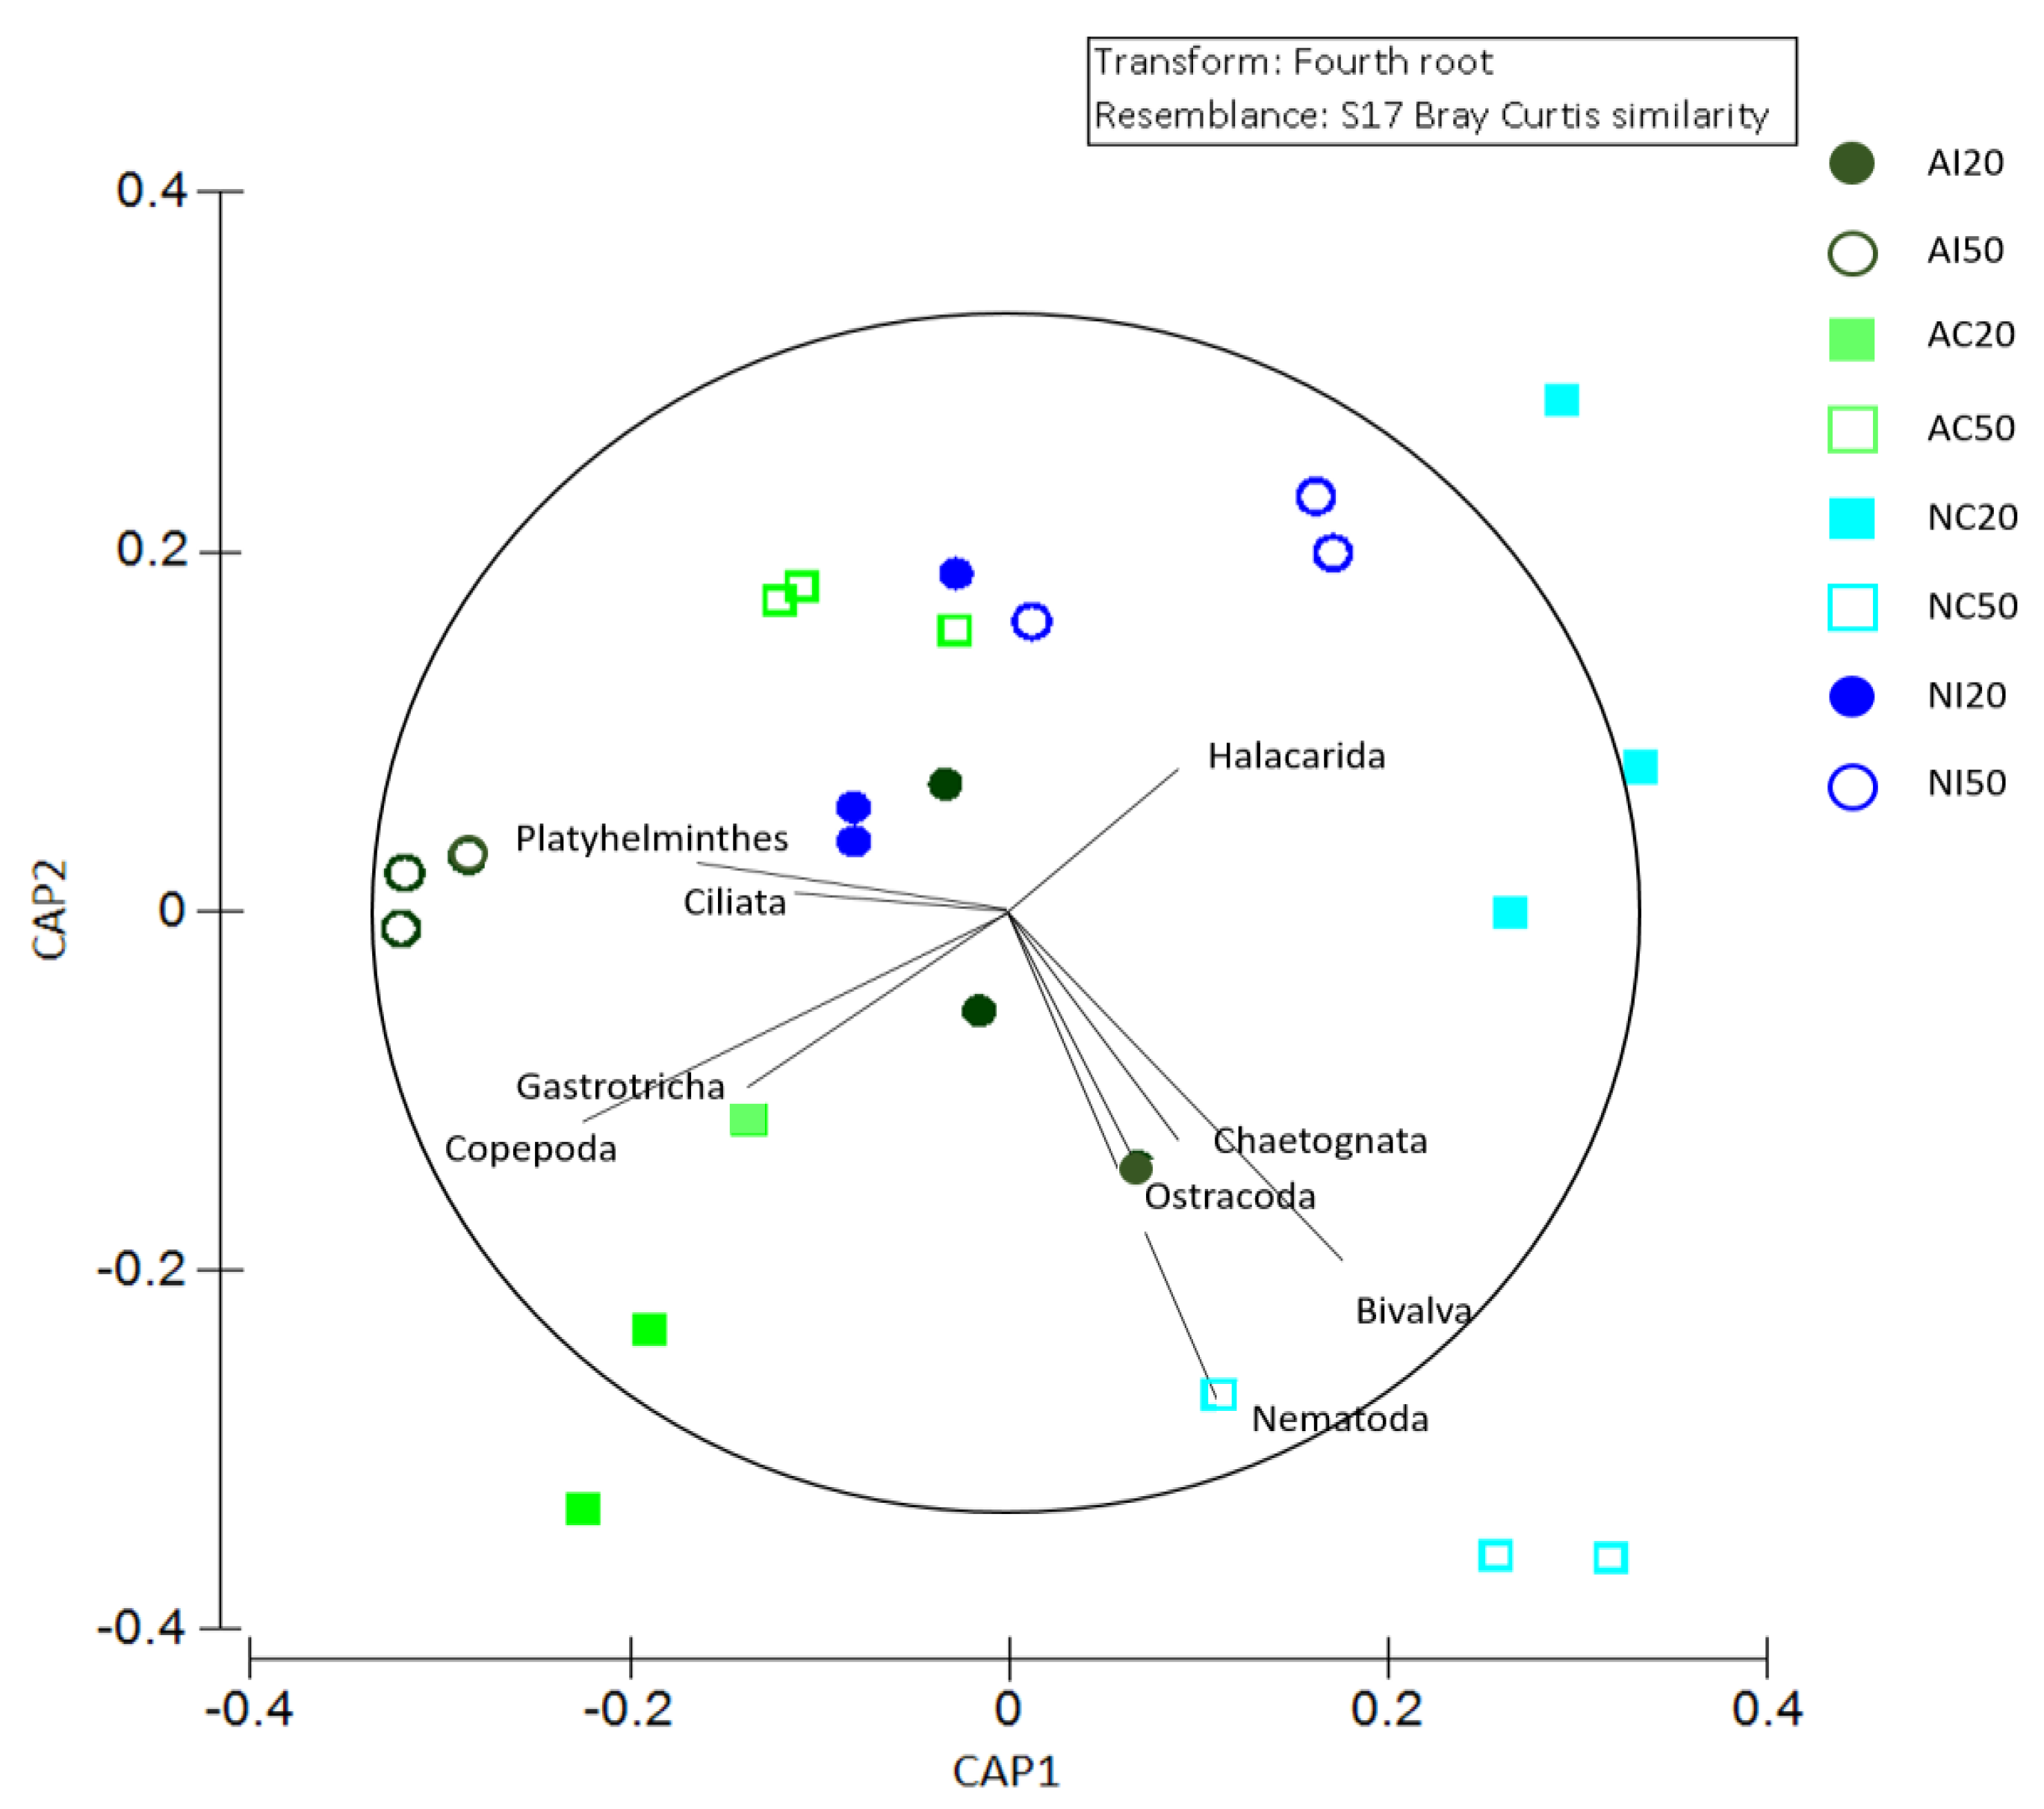
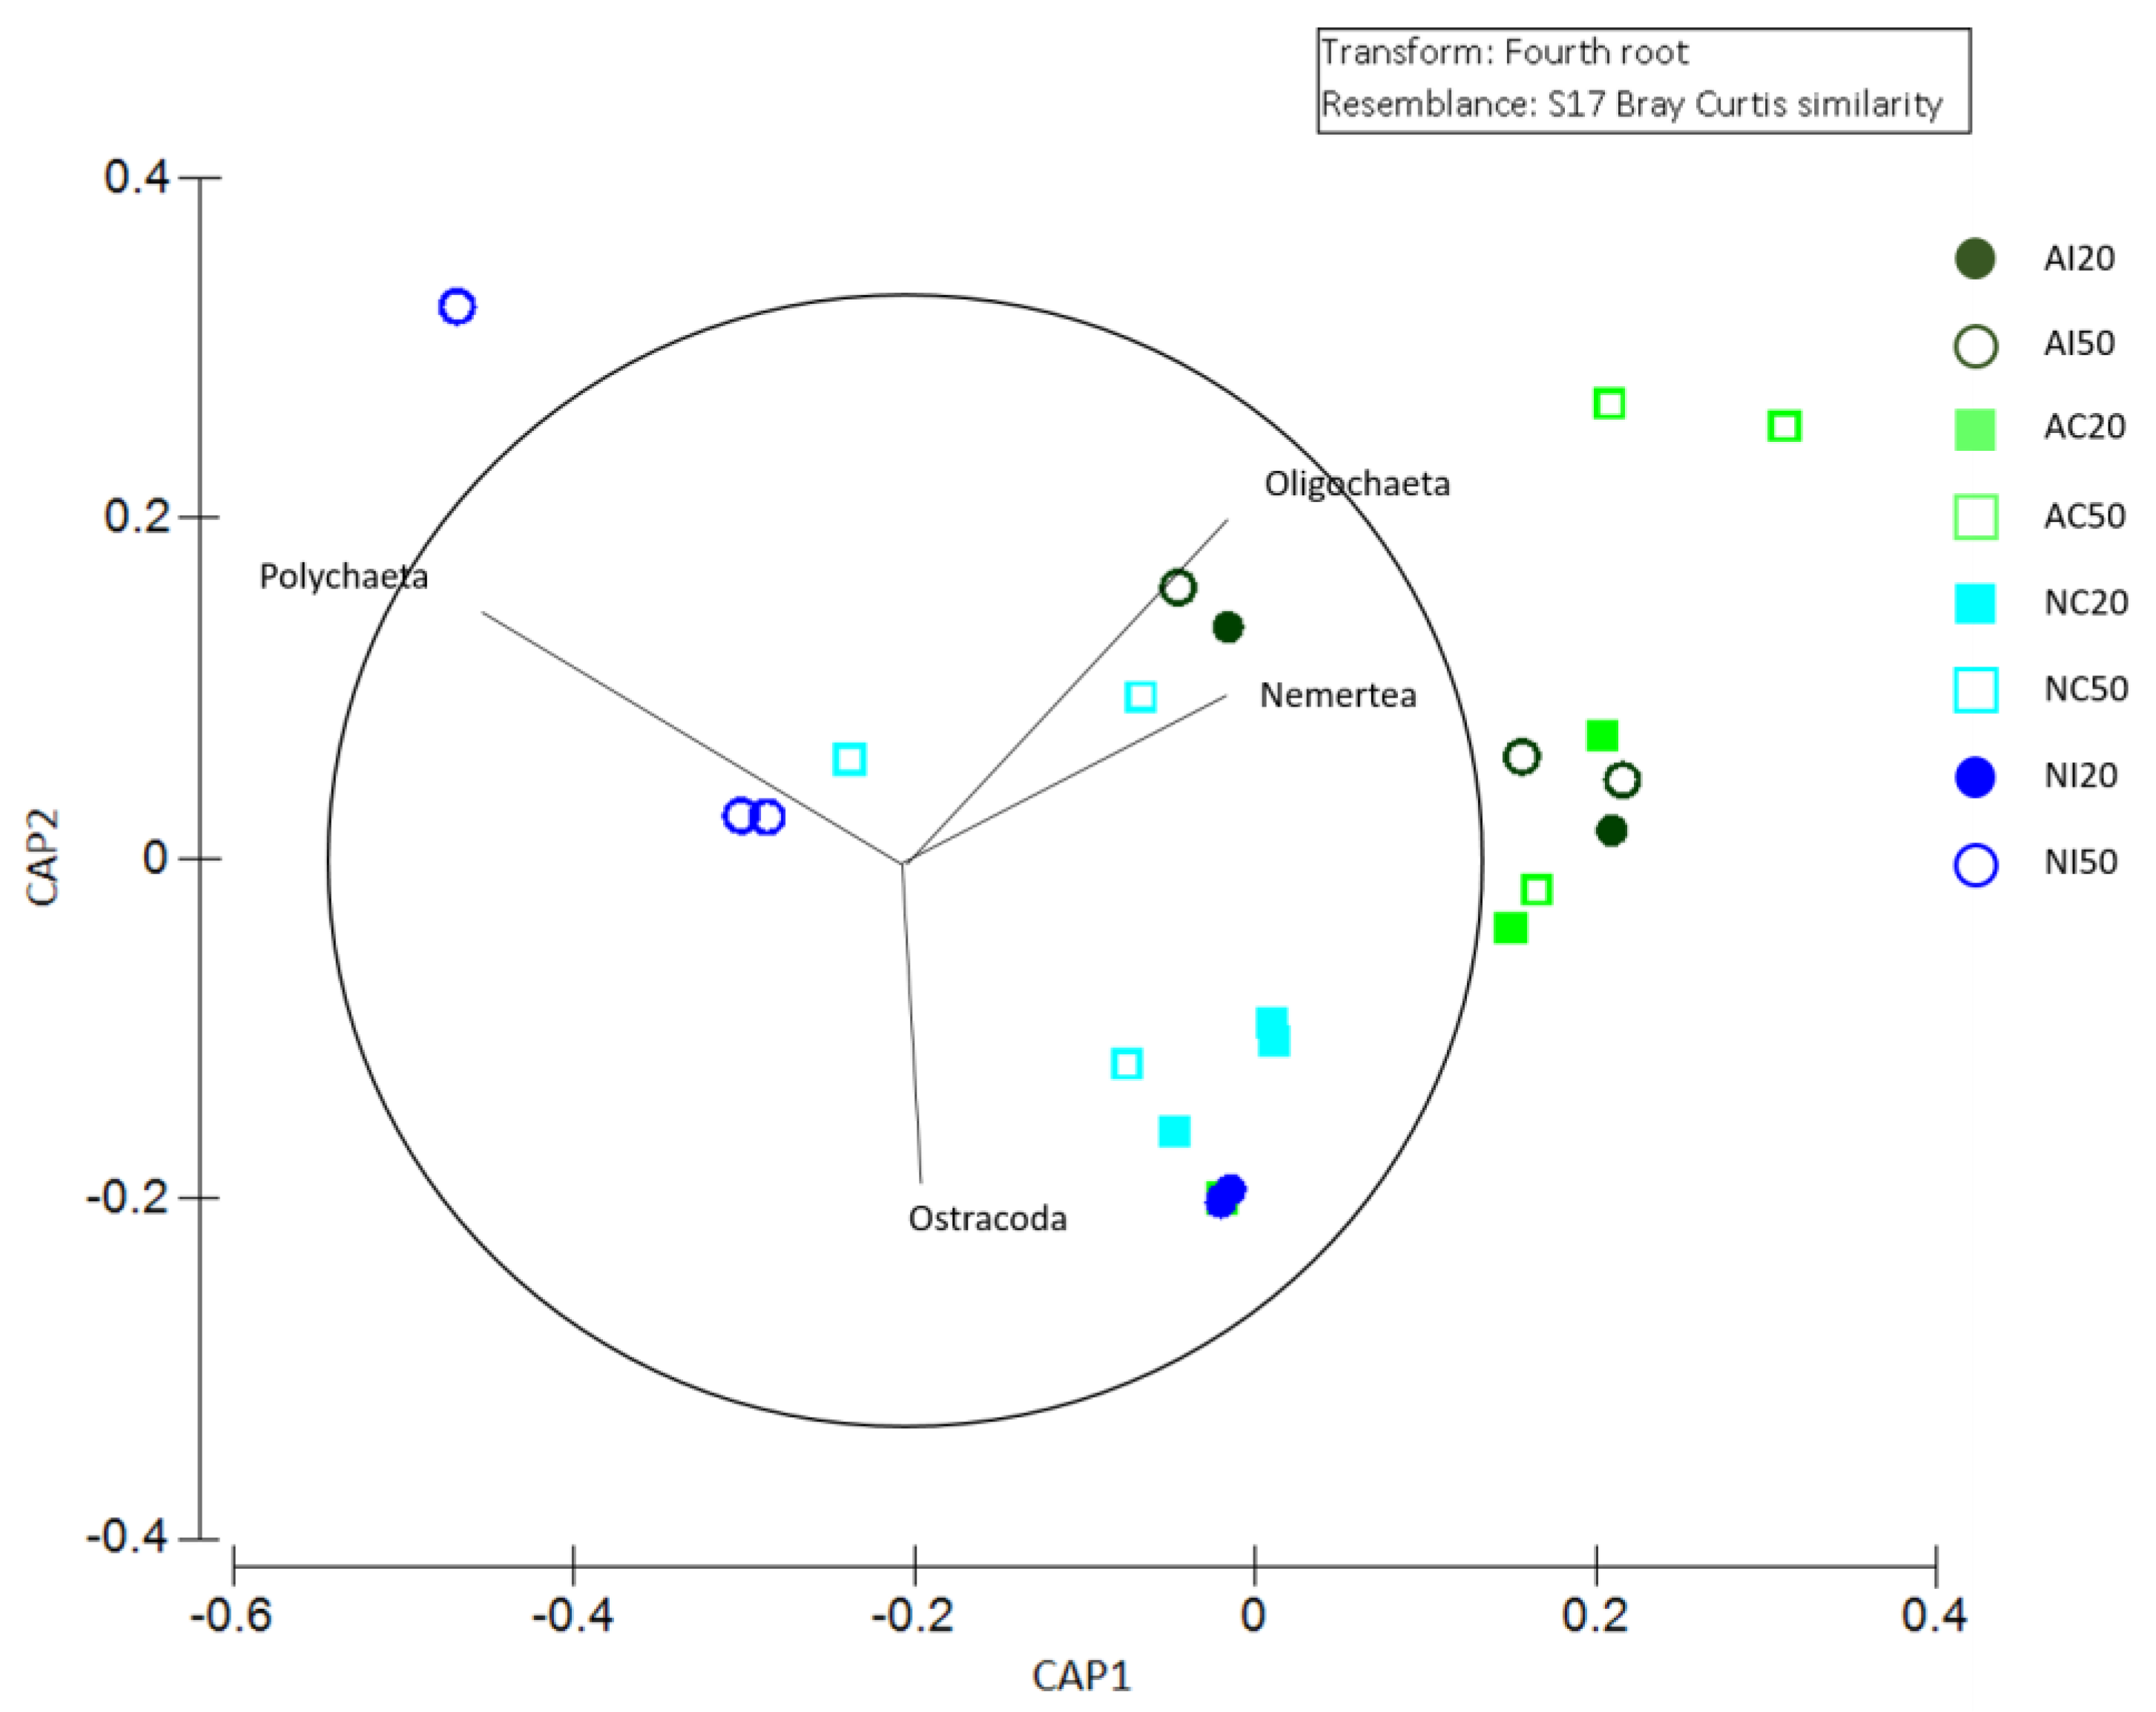
3.2. Meiobenthic Assemblage Analysis

Meiobenthic richness (number of taxa) accounted for a total of 14 taxa, with values ranging between 6 taxa at NI20 and 11 taxa at AI50 and NC50. According to the classification proposed by Danovaro et al. [51], the sampling areas were characterized by a moderate ecological quality, with the exception of the natural impacted area that showed a poor ecological quality. Significant differences were detected among the levels of the factor area (PERMANOVA, p = 0.0258) and between the levels of the factor depth (PERMANOVA, p = 0.0284). In particular, t-statistics on the number of taxa account for differences only within the level 50 m between AI and AC (PERMANOVA t-statistic, p = 0.018) and AI and NI (PERMANOVA t-statistic, p = 0.02) (Supplementary S1 Table S2; Figure 5a).
The total abundance (A) of the meiobenthic assemblage ranged from 401 ± 347 ind./10 cm2 at NC20 to 3753 ± 1006 ind./10 cm2 at NC50, with generally higher values at the control stations and the lowest at NI (Supplementary S2 Table S8). Significant differences were detected only for the interaction Ar × De (PERMANOVA, p = 0.004), due to differences within the level 50 m. Indeed, the t-statistics highlight significant differences among all pairs of stations, except between AI and NI. In particular, significant differences were detected only within the 50 m level, between AI and AC (PERMANOVA t-statistic, p = 0.004), AI and NC (PERMANOVA t-statistic, p = 0.035), AI and NI (PERMANOVA t-statistic, p = 0.0008), AC and NC (PERMANOVA t-statistic, p = 0.0054), and NC and NI (PERMANOVA t-statistic, p = 0.0068) (Supplementary S1 Table S3; Figure 5b).
The dominant taxon was Nematoda (Figure 5c), with a mean density ranging from 72 ± 47 ind./10 cm−2 at AI50 to 3507 ± 925 ind./10 cm2 at NC50 (on average, 53% of the total meiofauna ranging between the 4% and 93%). The next most abundant taxa were Copepoda (on average 22% of the total meiofauna from 3% to 62%), Ciliata (on average 16%, range: 0.5–69%), Gastrotricha (on average 7%, range: 0.1–32%), and Platyhelminthes (on average 1%, range: 1–4%). Nemertea, Bivalvia, Oligochaeta, Polychaeta, Ostracoda, Syncarida, Halacaridae, Insecta, and Chaetognata were all included in the rare taxa, i.e., taxa sporadically found in the study area and with less than 1% of abundance (see ‘Others’ category in Figure 5c).
Both diversity (H’, Figure 5d) and evenness (J, Figure 5e) indices revealed the highest values at station AC50 (1.95 ± 0.53 and 0.70 ± 0.19, respectively), while the lowest values were recorded at station NC50 (0.41 ± 0.012 and 0.14 ± 0.001). Significant differences were detected for the interaction of Ar × De (PERMANOVA, pH’ = 0.0076 and pJ = 0.007) and for the single factor area (PERMANOVA, pH’ = 0.0008 and pJ = 0.0032). Within 20 m in depth, H’ showed significant differences only between AI and AC (PERMANOVA t-statistic, p = 0.045), while J did not show significant differences; within 50 m in depth, both H’ and J showed significant differences between the AI and NC (PERMANOVA t statistic, pH’ = pJ = 0.0002), AC and NC (PERMANOVA t-statistic, pH’ = 0.007, pJ = 0.005), and NC and NI comparisons (PERMANOVA t-statistic, pH’ = 0.0002, pJ = 0.0004) (Supplementary S1 Tables S4 and S5).
PERMANOVA analyses performed on assemblage structure (Supplementary S1 Table S6) showed that there are significant differences, both considering the single factors (PERMANOVA, areas: p = 0.0002; depths: p = 0.0336) and their interactions Ar × De (PERMANOVA, p < 0.001). In particular, statistical differences are detected, both among areas (PERMANOVA, p = 0.0002) and between depths (PERMANOVA, p = 0.0336). A list of taxa affecting for more than 70% of dissimilarities for each pair Ar × De interaction (SIMPER test) is reported in Supplementary S3 Table S9. In detail, the most frequent taxa here were: Gastrotricha, Nematoda, Ciliata, Copepoda, Platyhelminthes, Ostracoda, and Oligochaeta. The t-statistic highlighted that, within the 20 m level of the depth, there were significant differences between AC and NC and AC and NI (Table 2a). Within the 50 m level of the depth, all pair-wises showed significant differences with only one exception (Table 2b). Within levels of the factor area, significant differences between assemblages at 20 and 50 m depth were detected only at AC (PERMANOVA, t-statistic, p = 0.044) and NI (PERMANOVA, t-statistic, p = 0.022) stations.
In the CAP ordination plot on total assemblages (Figure 6; Supplementary S4 Figure S1), although clear clusters are not evident, it is possible to recognize that AI50 and NI20 are strongly correlated, and AI20 is weakly correlated with the Platyhelminthes and Ciliata taxa; AC20 with Copepoda and Gastrotricha; NC50 with Bivalvia and Nematoda; and NC20 was weakly correlated with Halacaridae. These stations formed four separated clusters, located at the plot edges.
PERMANOVA analyses, performed on the assemblages and composed by the only rare taxa, showed significant differences for both the factors (PERMANOVA, area p = 0.0002 and depth: p = 0.0014) but not for their interactions (Supplementary S1 Table S7). SIMPER analysis showed that Oligochaeta, Ostracoda, Polychaeta, Halacaridae, and Bivalvia are the taxa affecting more than 70% dissimilarities for each area pair-wise comparison (Supplementary S3 Table S10). The first four taxa were also those that contributed more than 70% to dissimilarity between the 20 and 50 m levels of the factor depth (Supplementary S3 Table S11). The t-statistics highlighted that no differences were detected among areas within the 20 m depth (Table 3a), while differences were detected among all pairs of station within the 50 m depths (Table 3b), except for the pairs AI and AC and AI and NC.
Significant differences between assemblages at 20 and 50 m depth were detected only at the NI area (PERMANOVA t-statistic, p = 0.019) within its levels.
In the CAP ordination plot on rare taxa assemblages (Figure 7; Supplementary S4 Figure S2), clear clusters were not evident, since a high overlapping rate existed among the area and depth factors elements. However, it is possible to observe that all the stations belonging to AI and AC are grouped together in the positive quadrant of the CAP1 and CAP2 and are weakly correlated to the Oligochaeta and Nemertea taxa.

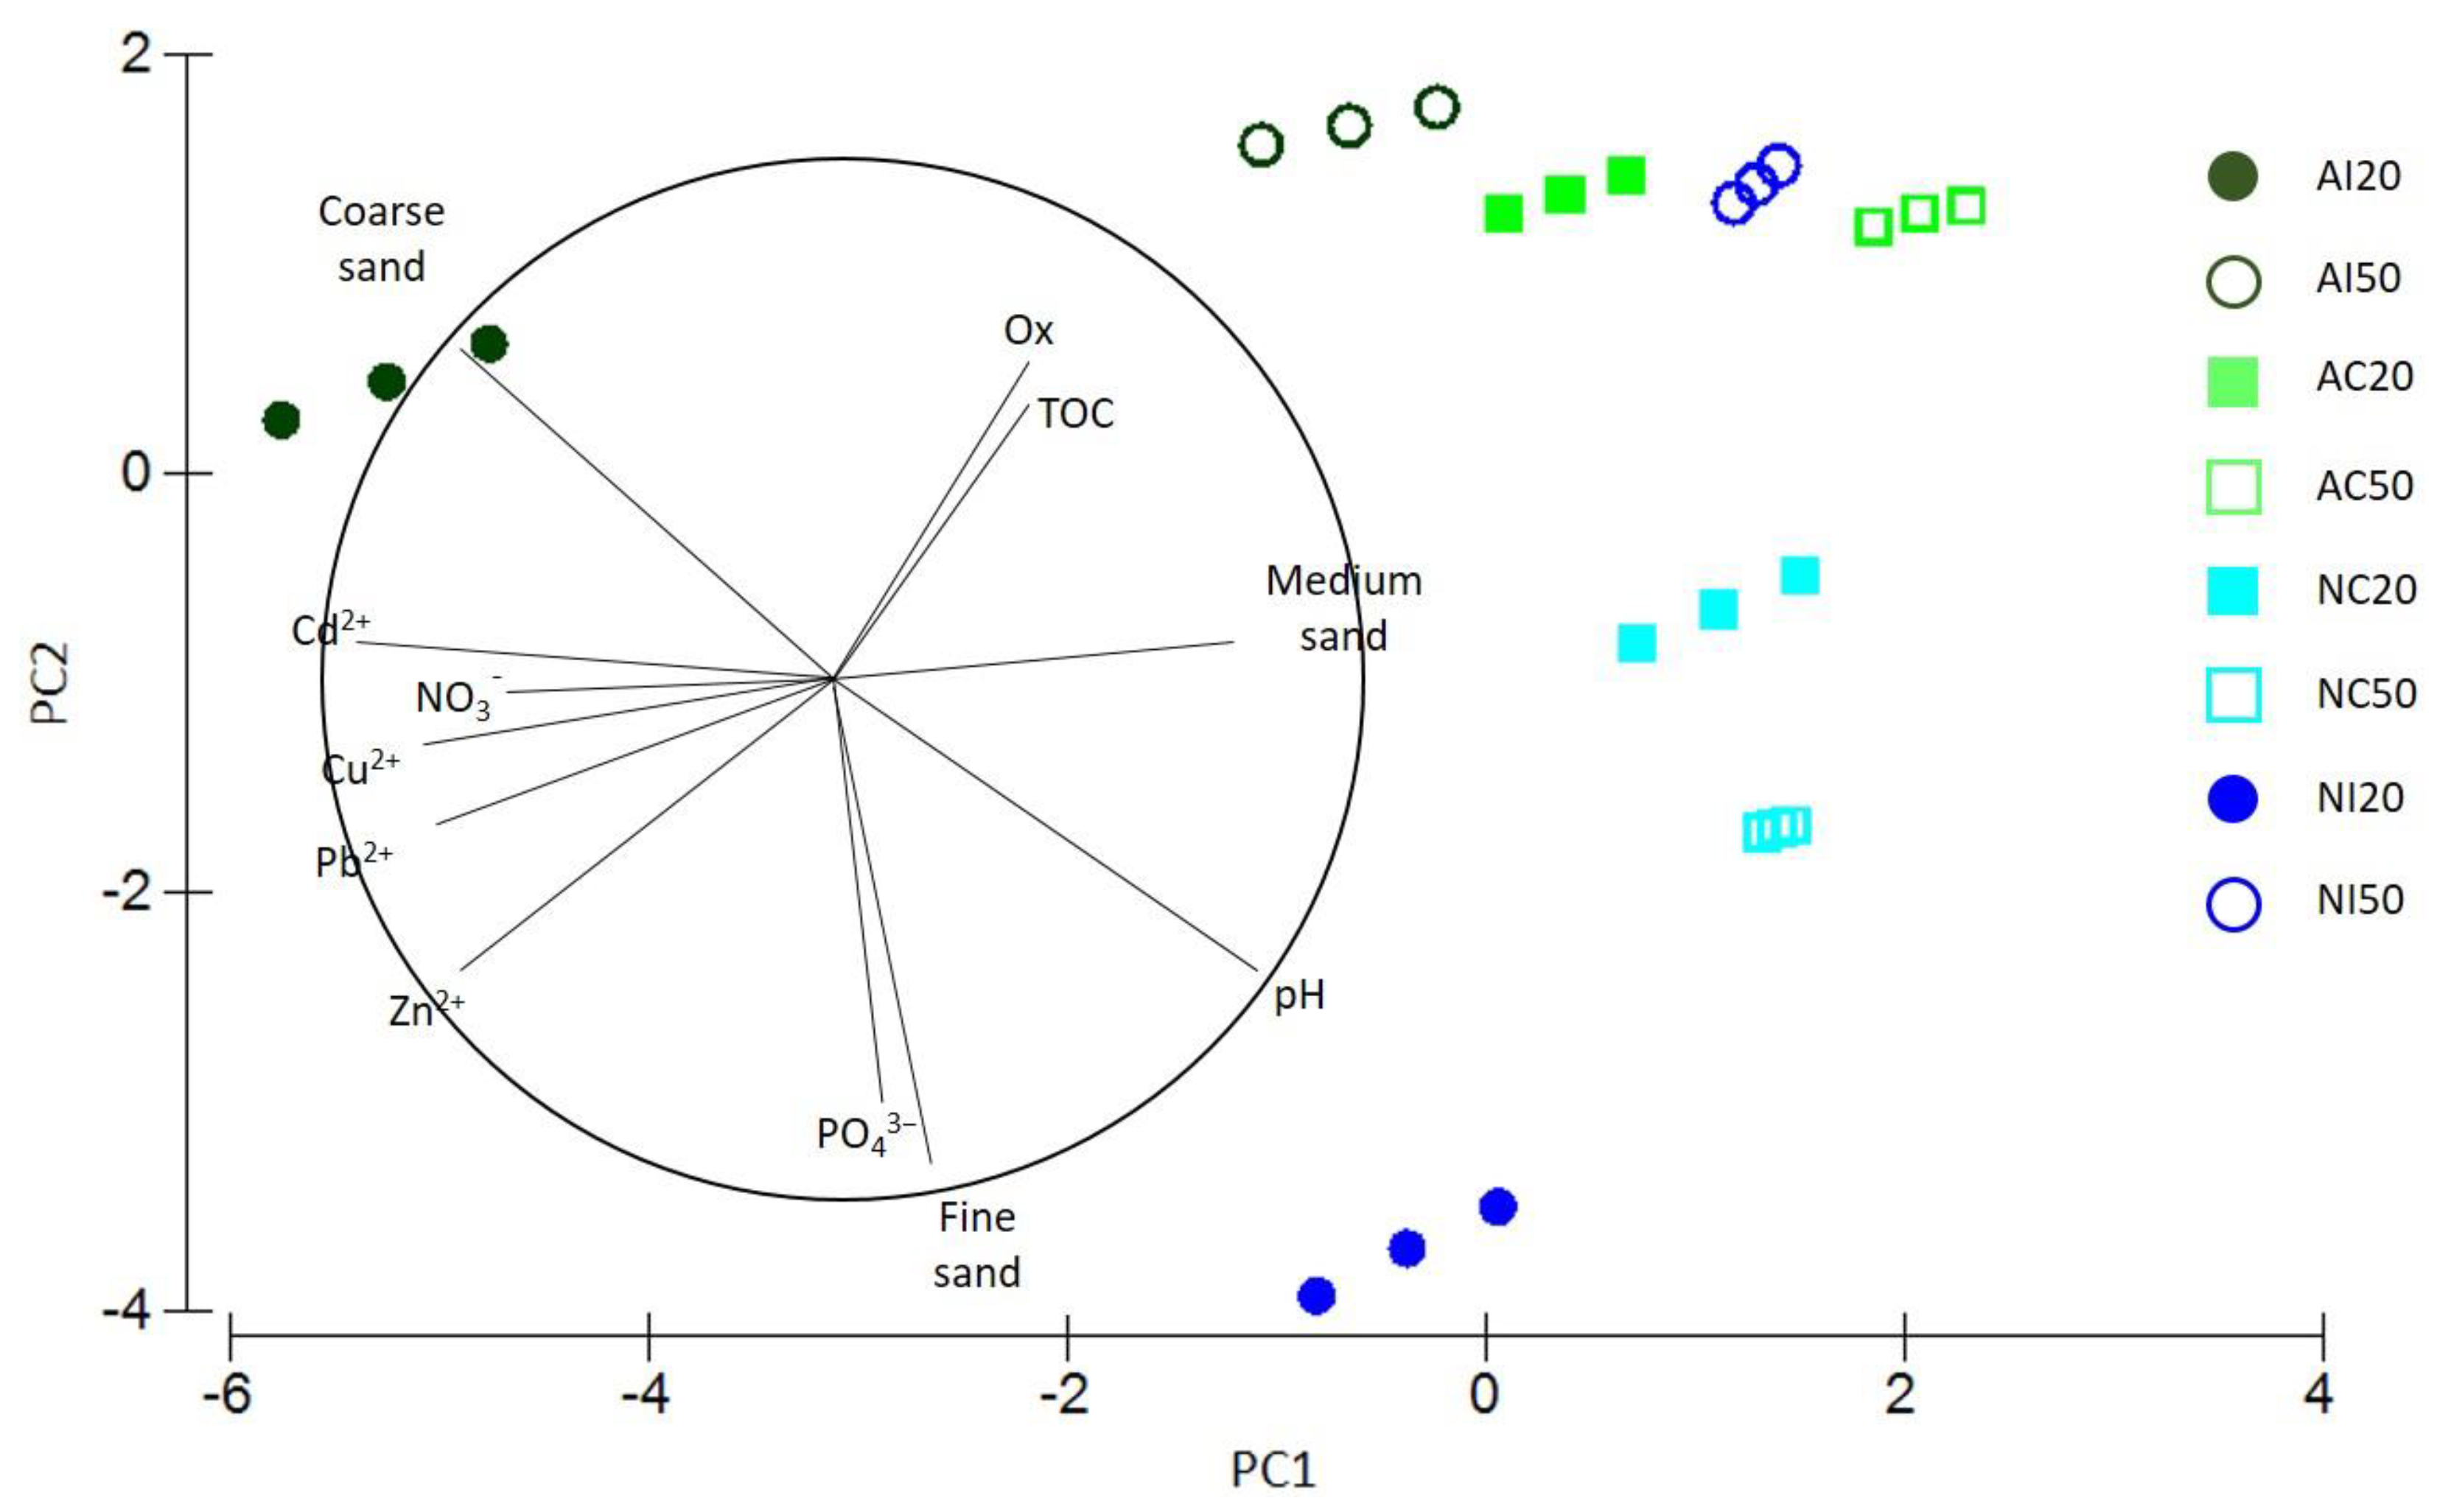
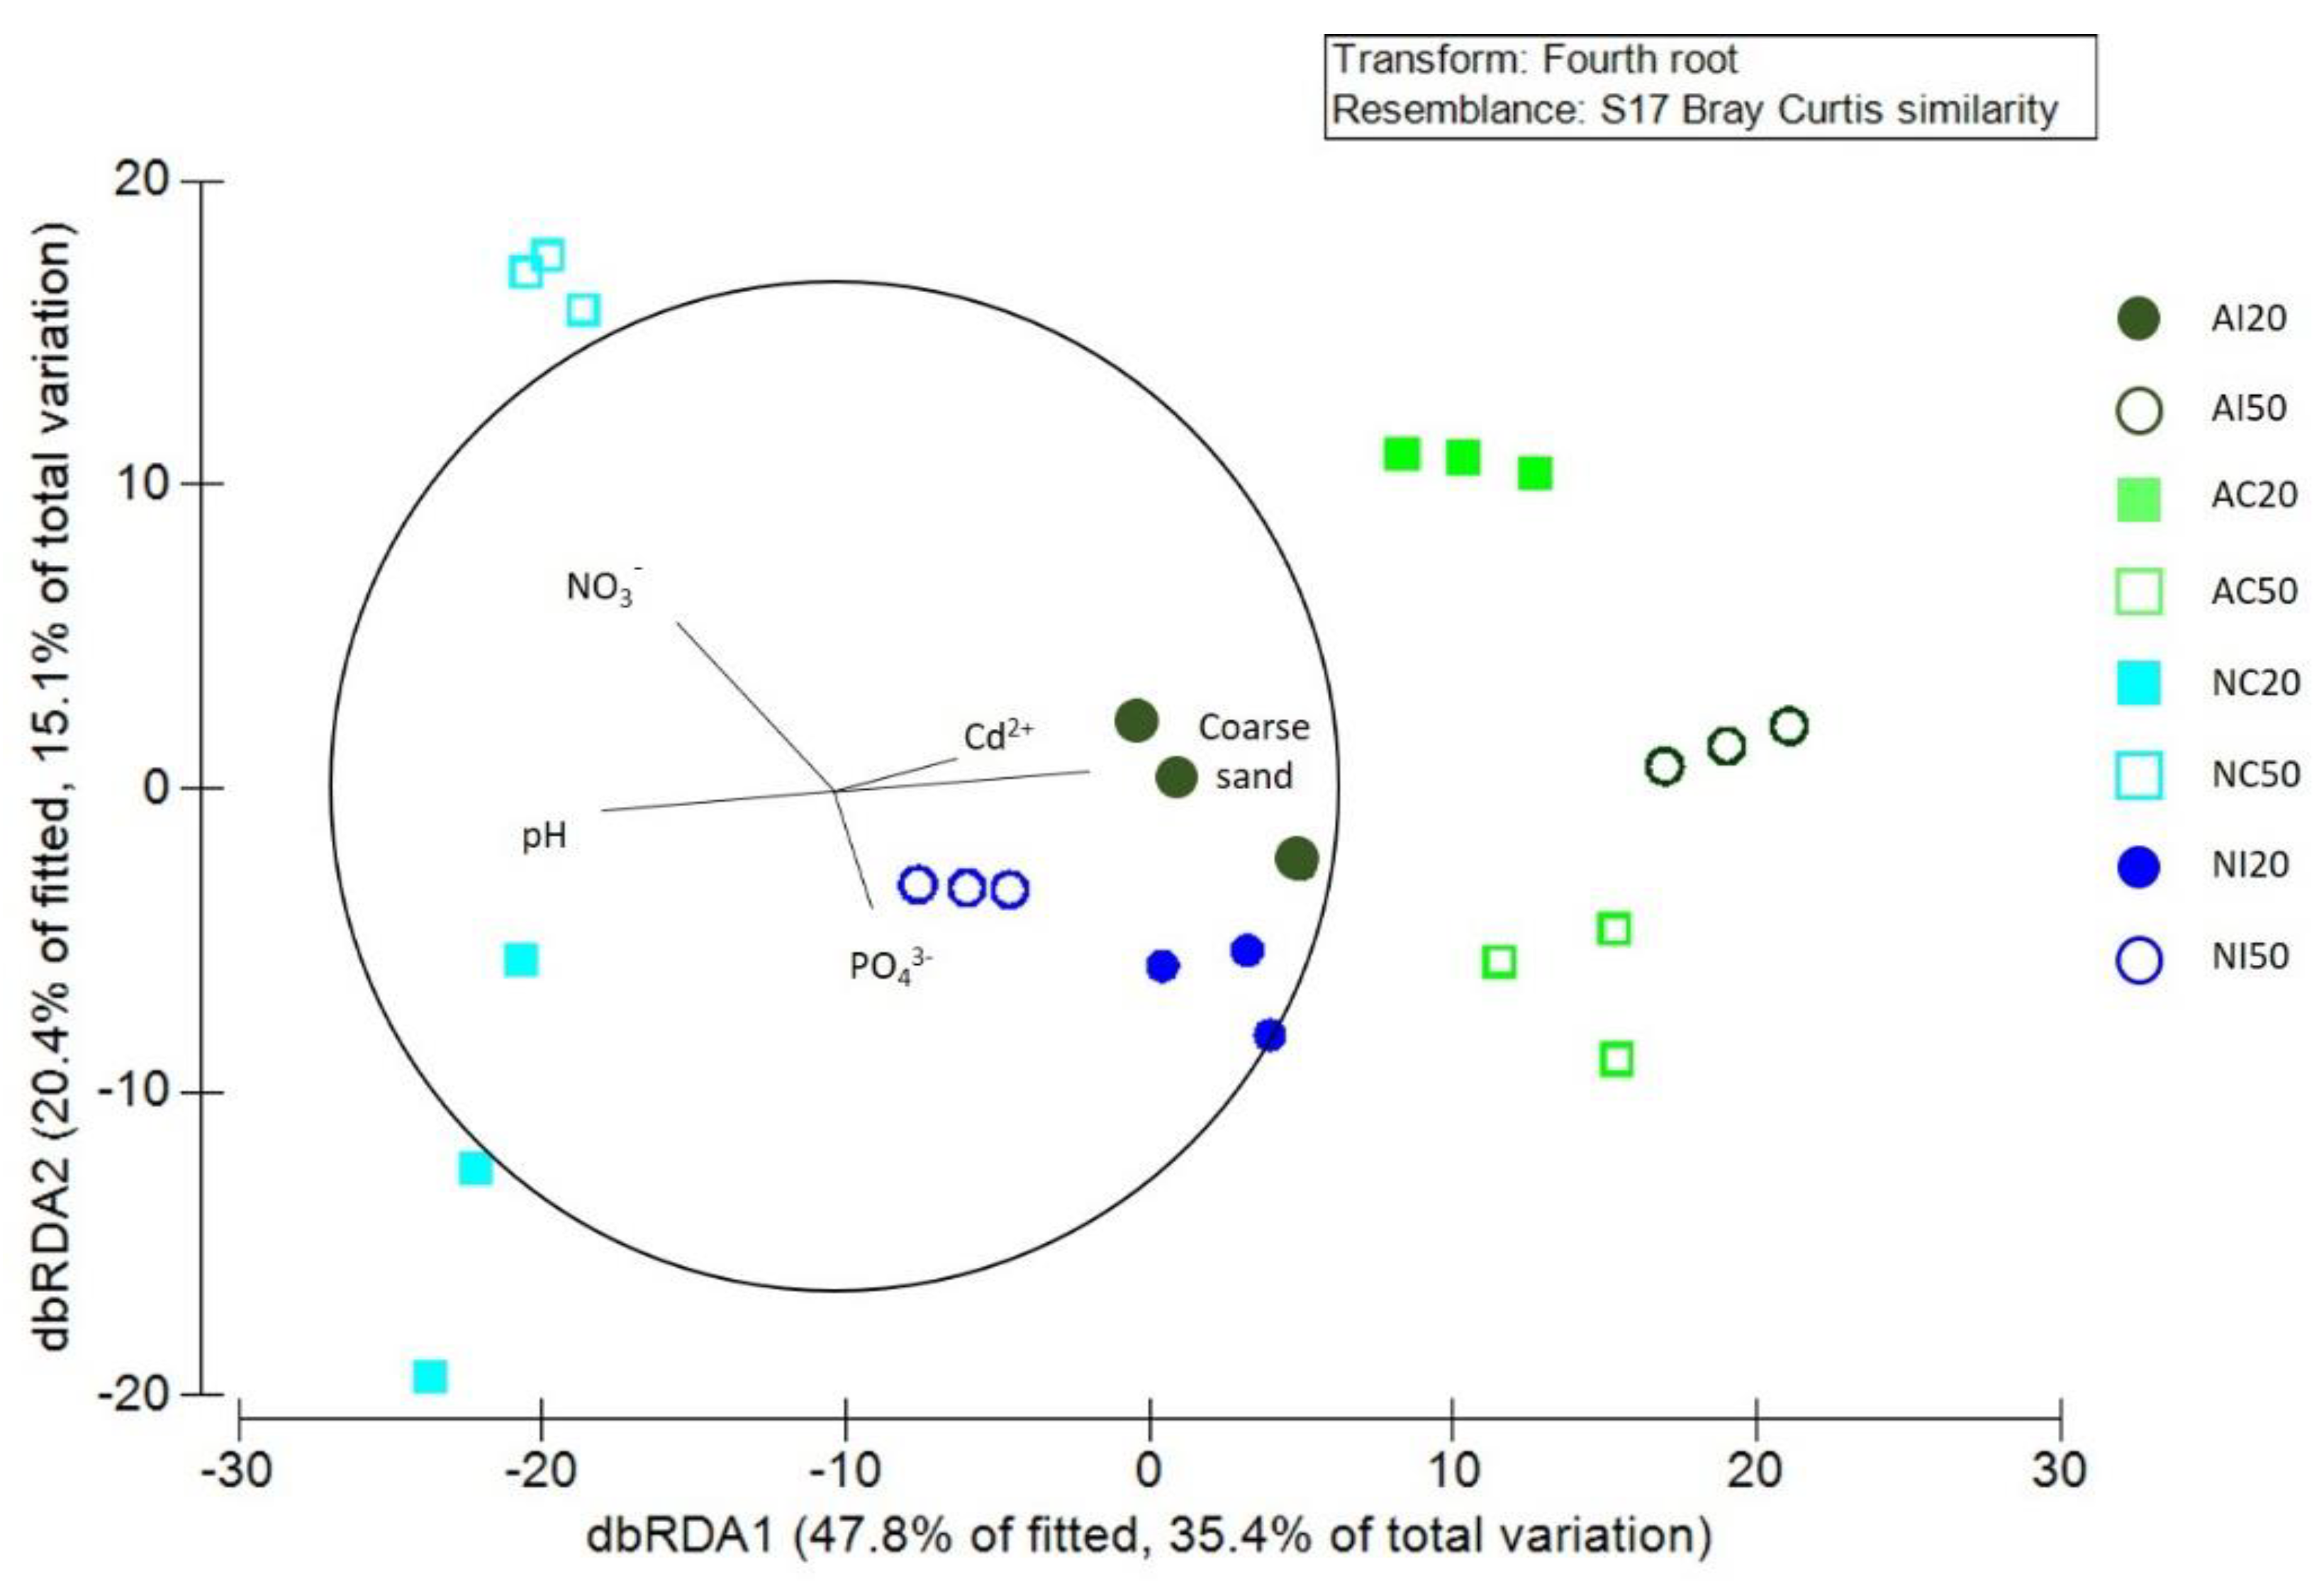
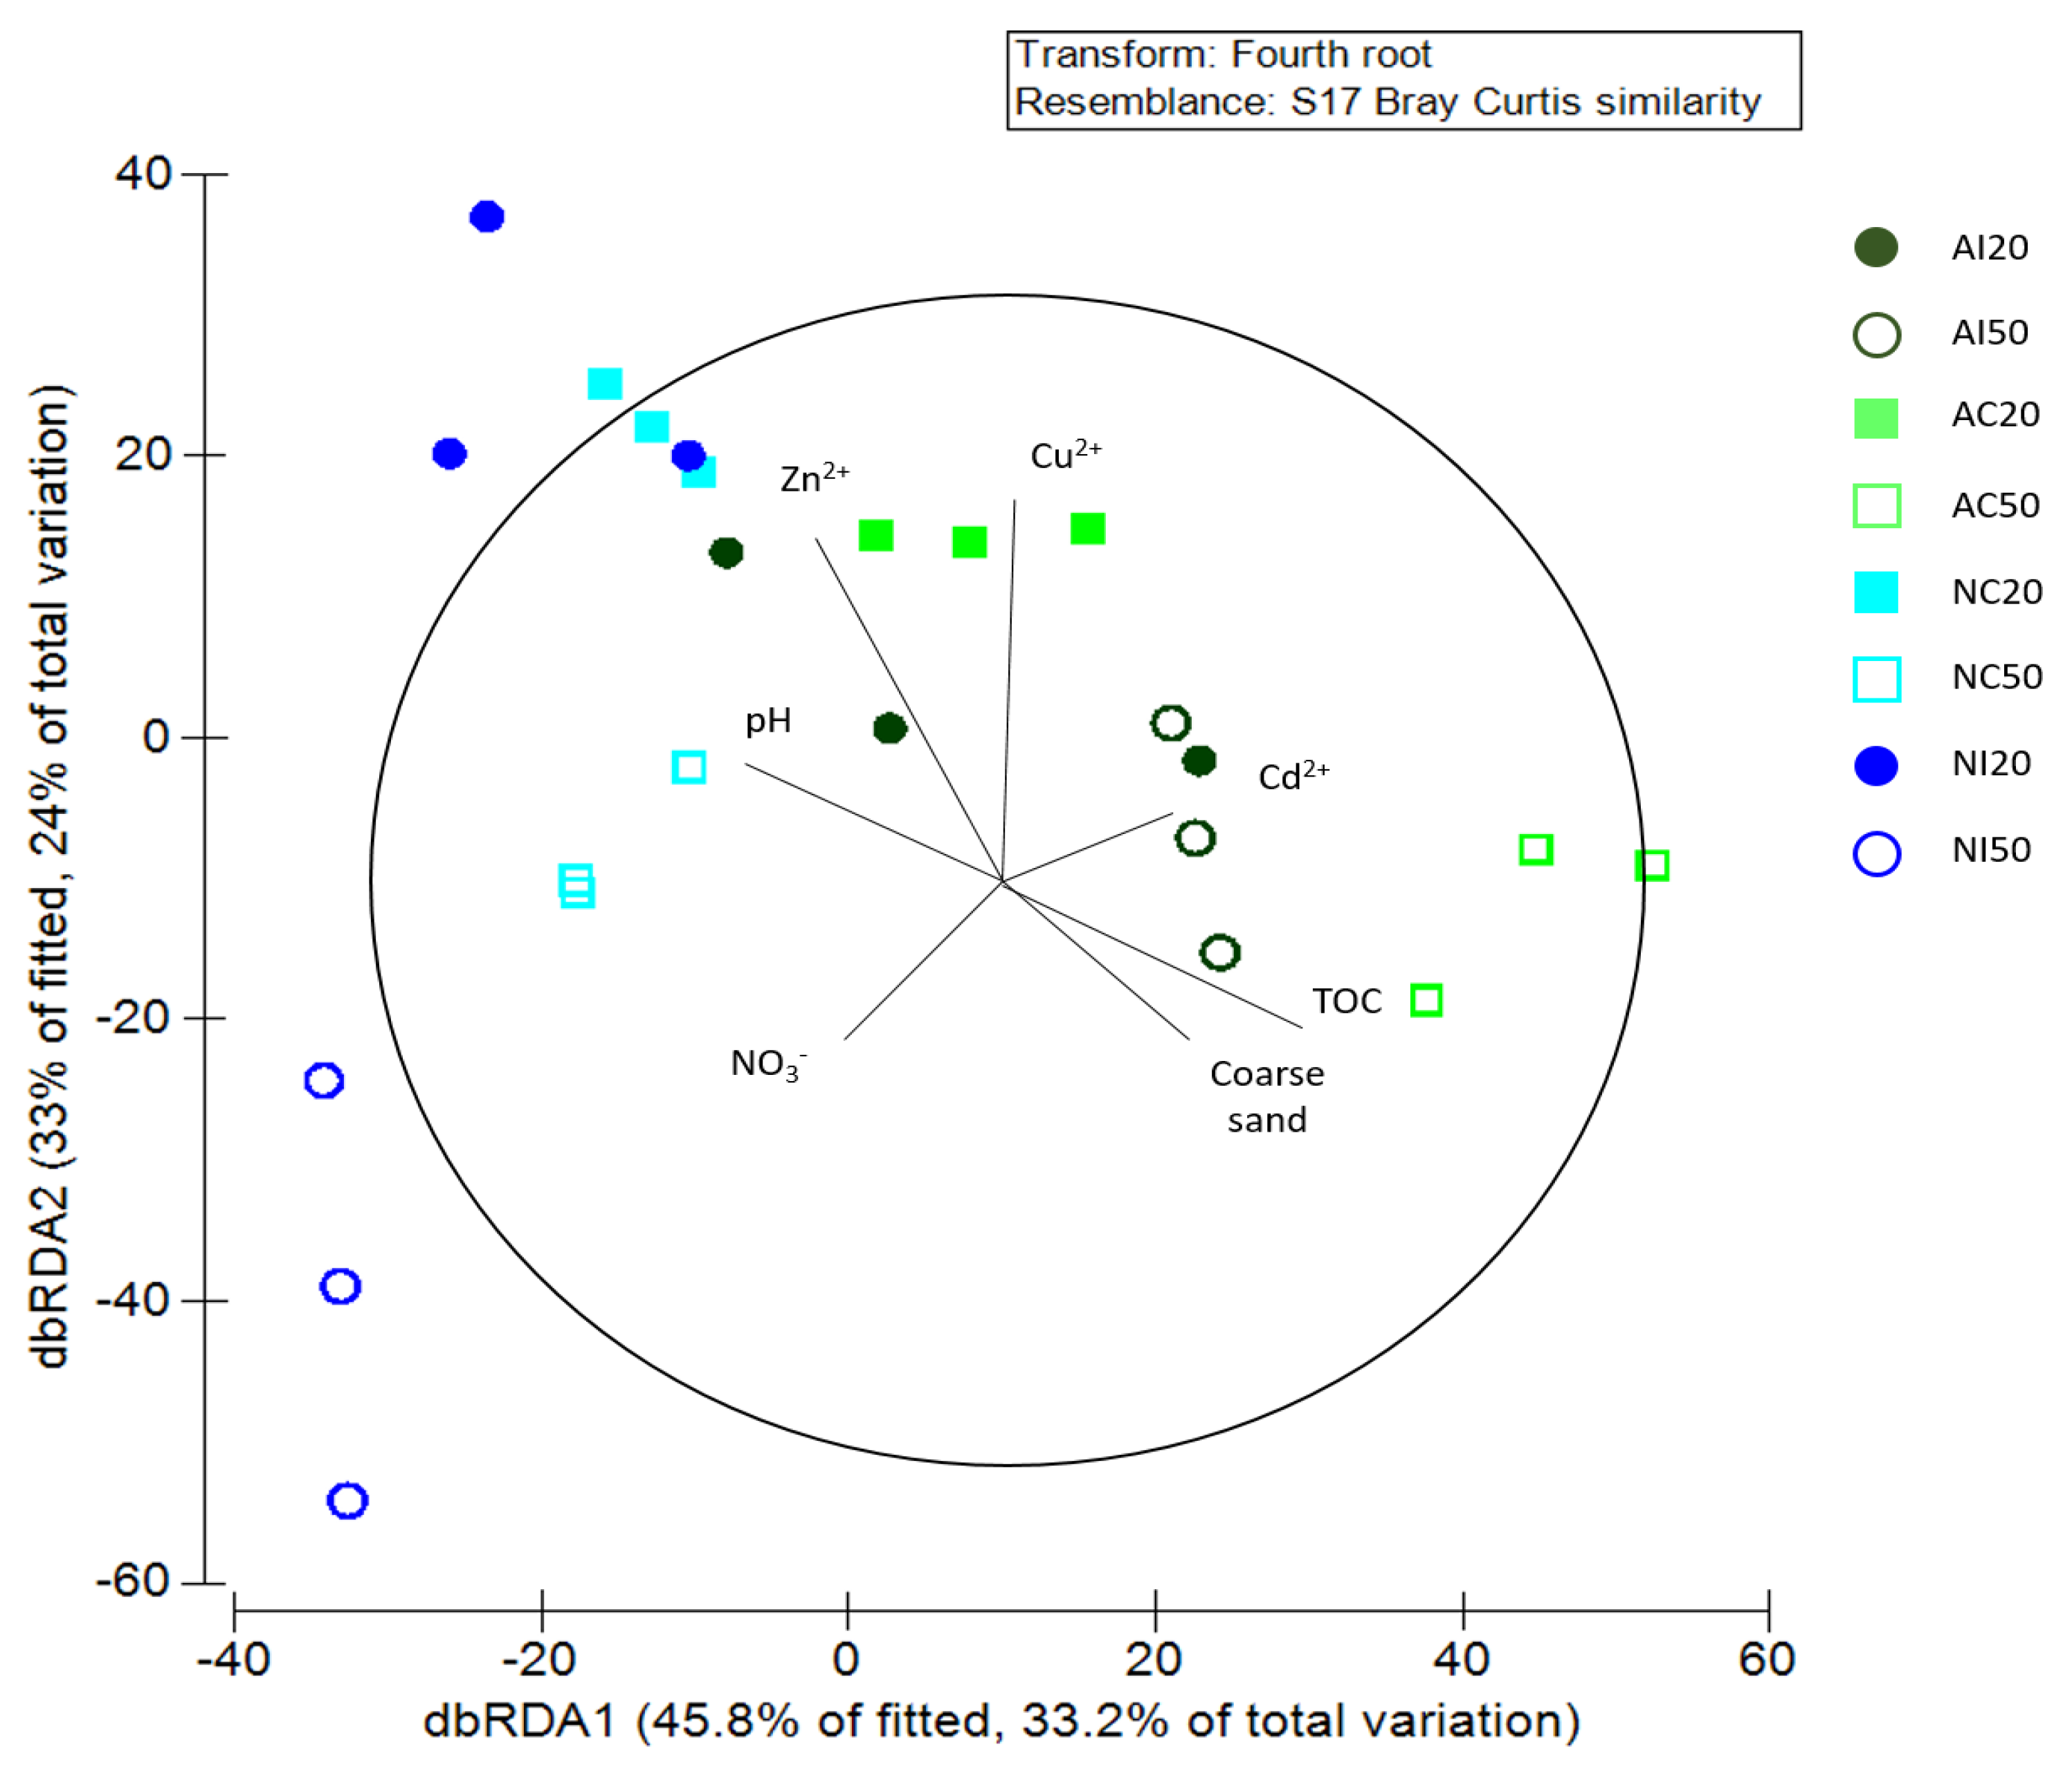
3.3. Interaction between Environmental and Biological Data

DistLM performed on total assemblages selected Cd2+, NO3, coarse sand percentage, pH, and PO43− as the best combination of environmental variables affecting meiobenthic assemblages and concurring for more than 55% of total variance (Adj. r2 = 0.56). However, Cd2+, NO3, and pH were significantly correlated with assemblage structures (Table 4).
dbRDA performed on total assemblages and related to environmental variables, selected by distLM (Figure 8), showed three different clusters: one composed by AC20, AC50 and AI50 replicates and positioned in the central part of the dbRDA2; one composed by AI20, NI20 and NI50 stations polarized at the plot centre; and one composed by NC20 and NC50 polarized in the negative part of dbRDA1. Of these clusters, AI20 elements were correlated with Cd2+ and coarse sand percentage, NI20 and NI50 with PO43−, and, finally, NC20 and NC50 with NO3 and pH.
DistLM performed on rare assemblage structures of the selected TOC, Cu2+, pH, NO3¯, coarse sand percentage, Zn2+, and Cd2+ as environmental variables affecting rare meiobenthic taxa and concurring for more than 50% of total variation (Adj. r2 = 0.505). However only TOC, Cu2+, pH, and coarse sand were significantly positive correlated with assemblages (Table 5).
dbRDA performed on rare assemblages and related to environmental variables, selected by distLM (Figure 9), grouped the 20 m elements in the positive part of dbRDA2 strongly correlated with Zn2+, Cu2+, and pH, while 50 m depths in the negative part of dbRDA strongly correlated with coarse sand, NO3, and TOC. It is noteworthy that AI20 and AI50 appeared to be more correlated with Cd2+.

4. Discussion

4.1. Environmental Characterization of the Study Area

High levels of lead, cadmium, copper, and zinc are generally considered indicators of anthropogenic contamination; in addition, they can result in adverse effects on several benthic components (e.g., [6]). Their concentrations were in general agreement with other published data related to the impacted sites in the Antarctic region ([64]). From Figure 2, it is possible to note that the highest metals concentrations were at AI20 (i.e., Zn2+, Cd2+, Pb2+, and Cu2+) and NI20 (only Zn2+ and Pb2+), suggesting that, in these stations, the highest impact of pollutants (emission or accumulation) is present, with respect to the other ones. This result should not be considered surprising, due to the presence of MZS (in AI20), where heavy metals, organic matter, and hydrocarbon are produced by fuel spills, sewage waste, and the ‘grey waters’ that originate from station toilets, laundry facilities, accommodation, and cooking areas. In addition, the presence of the Adelie penguin colony in Adelie Cove (NI20) could contribute to the circulation of all the metals that are here considered [65,66]. In particular, Chu et al. [65,66] reported that heavy metals and other trace elements are present in Antarctica, due to both global events (global circulation of air masses and water) and local phenomena, such as human (including activities related to research stations) and natural activities (principally, penguins faeces). With reference to the latter point, [66] proposed a mechanism for the bio-transport of metals in the Antarctic sediments by penguins that can act, depending on their diet, as bioaccumulators of environmental contaminants [67].
The Unites States Environmental Protection Agency [68] set the limit concentration of the heavy metals in seawater. In particular, the “criterion maximum concentration” (CMC), as an estimate of the highest concentration of a material in surface water to which an aquatic assemblage can be briefly exposed to without a negative impact, was established; in addition, a “criterion continuous concentration” (CCC), which stands for the highest concentration for indefinite exposure, was defined [69]. As far as our data are concerned, it is possible to state that, at present, there is no critical condition for the contamination, due to heavy metals; however, this aspect must be monitored for the future.
Phosphate and nitrate ions play the role of nutrients and are generally regarded as the most typical bioindicator for penguin input [70]. In this investigation, phosphate was detected in the stations NI20, NC50, and AC50, with the highest concentration measured in the sampling station NI20; these values were high, compared to the background level recorded in seawater and interstitial water samples [71].
The concentrations, discussed here, for nitrate ion were very low, compared to levels recorded in seawater samples, with the highest value at station AI 20. Our data are in agreement with previous measures in interstitial waters, collected in coastal sediments in Antarctica; Monien et al. [71] assumed that nitrate loss might be due to a variation in redox sediment conditions. The sulphate ion is a conservative component of seawater, and its concentration depends on physical phenomena, such as evaporation and precipitation. The values recorded in the present study are lower than typical background values for pore waters and might be attributable to microorganism activities, as reported by Monien et al. [71].
O2 represents an important measure of water quality. All the investigated stations show optimal values of this parameter, since O2 concentrations are higher than 4.8 mg/L, which is considered the background protective value for biological health, survival of juveniles and adults, growth, and larval recruitment [68].
Sediment granulometry and TOC percentage values highlight high environmental heterogeneity, mostly at deeper stations. Indeed, Ross Sea soft bottom habitats are mainly composed of: (a) basal tills sediments, which display all the characteristics of continental shelf and indicate deposition by grounded ice; (b) residual glacial marine sediments, derived from floating ice and icebergs, where the fine fraction has been removed by marine currents; and (c) compound glacial marine sediments, derived, in part, from floating ice but containing a significant current-derived fine component [72]. Moreover, during the water freezing period, plankton is trapped among the ice crystals, and its amount is variable each year, depending on specific spatio-temporal environmental parameters (i.e., the current regime and geomorphological features). During the ice melting period, the previously trapped plankton is released; it then settles on the seabed as organic matter, thus contributing to the TOC concentration and its great spatial heterogeneity [73].

4.2. Meiobenthic Assemblage Structure

Total meiobenthic abundances were lower than that documented in many studies carried out in the Antarctic Peninsula (see [74] and references therein), but they were comparable with those reported for Ross Sea [2]. However, as suggested by Pasotti et al. [74], comparisons of abundance data are often impaired by the use of different sampling methods or mesh size sieves, applied during the meiobenthic sampling routine or separation process. Nematodes and copepods (adults and nauplii) were the most abundant taxa in our data set; besides those two, Ciliata, Gastrotricha, and Platyhelminthes showed relevant abundances and were regularly documented among the prevalent taxa in many polar expeditions [2,74,75,76,77,78,79,80]. The statistical analysis did not reveal clear effects of anthropogenic or natural impacts or depth gradient on the meiobenthic richness; however, a significantly higher number of taxa at the station AI50 was detected, suggesting that human influence is minimal at the deeper stations. When the number of taxa was used to obtain a classification of the ecological quality of the sediments [51], all the sampling stations showed a moderate quality, with the exception of the sites corresponding to the penguin colonies (NI20 and NI50), which showed a poor ecological quality. The total abundance appeared to be affected more by natural and human impacts than the number of taxa, with particularly lower values in the proximity of the penguin colonies.
The general positive relation between medium sands and meiobenthic diversity and evenness [8] was not clearly discernible in the present study (see Figure 3 and Figure 5d). However, the sites with the lowest H’ and J values (i.e., NC50) were characterized by a high percentage of fine sediment fraction, which likely contributed to the reduction of the interstitial space in the sediment matrix [81]. Here, the almost total absence of the phylum Gastrotricha taxon, mainly showing interstitial lifestyle [82], and particularly high abundance of the more tolerant nematodes seem to corroborate this hypothesis.
There were significant differences in the structure of the whole meiobenthic assemblage, due to area, which were larger than those that were due to the depths, as well as their interactions. Almost all pair-wise comparisons showed significant differences within the 50 m depth level, revealing a high degree of environmental heterogeneity, especially at deeper sites. Despite Ciliata and nematodes resulted more abundant in the impacted sediments in the present study, the former, as well as other groups such as Chaetognata, are often ignored in investigations on meiobenthos. Indeed, Ciliata are prokaryotes, and the latter were previously considered only macrobenthic components and only an accidental taxon in meiobenthos until a few years ago. However, ciliates, as part of the complex detritus–bacteria–meiofauna system, might play an important role in the marine ecosystem functioning [4,11,83]. In addition, numerous worldwide investigations have recently documented the presence of a very small meiobenthic species, belonging to the Chaetognata genus Spadella, suggesting that meiobenthos may number more specialized forms than expected [84,85,86,87,88].
When rare taxa were taken into account, PERMANOVA revealed significant differences only for the single factors, underlining a more relevant difference between areas, rather than depths, as revealed also by the whole assemblage structure. Indeed, the positive side of the CAP1 contained all AI and AC samples, where Oligochaeta and Nemertea were more abundant.
The higher spatial heterogeneity of the meiobenthic assemblages (at both total community and rare taxa levels) at the deeper stations (i.e., 50 m) seems to confirm the previous observations by Pasotti et al. [74], who reported a high spatial heterogeneity of meiofauna, closely associated to food availability and microscale differences in primary (microphytobenthos and macroalgae) and secondary (bacteria and protozoans) production processes.
Although the analyzed environmental parameters explain only a part of the assemblage structure variations (suggesting the possible influence of additional abiotic variables), Cd2+, pH, NO3, and coarse sand percentage appeared to be among the most relevant variables for both whole meiobenthic assemblage and rare taxa structure. Moreover, rare taxa appeared to be more susceptible to small environmental variations, as underlined primarily by the total variation, accounting for more than 57% (Figure 9), and, secondly, by a high number of parameters affecting the assemblages (see distLM results: i.e., 5 vs. 7 total meiofauna and rare taxa, respectively; Table 4 and Table 5). In particular, heavy metals, coarse sediments, and TOC (this latter only for rare taxa) seem to control the assemblages of the anthropogenically impacted sediments, while the NO3, PO43−, and pH values appear to influence the assemblages in the stations where the penguin colonies are located. However, these observations need to be confirmed by a higher number of sites and studied within each combination of factors in the future sampling campaigns in the Ross Sea. The poor ecological quality, highlighted by the taxonomic richness values, low meiobenthic abundances, and prevalence of r-strategy lifestyle taxa (e.g., ciliates and nematodes, characterized by high reproduction rate, high surviving ability, and physiological adaptations to changing environments) [9,18,51], suggests that the chronic impact of penguin colonies might have stronger effects on the meiobenthic assemblages than the human activities at the MZS.

5. Conclusions

Understanding the anthropogenic impacts on Antarctica has become a crucial issue, as the world is experiencing major environmental changes. Despite the benefits of many of the research programs carried out in Antarctica, the presence of scientific field infrastructure is causing adverse impacts on the environment, which need to be accurately monitored. Meiobenthic organisms have proven to be useful as early biological indicators and for documenting all of the ecosystem dynamics in many field and laboratory studies. Based on the present comparison between naturally and anthropogenically impacted areas, we can conclude that the large and old colony of Adélie penguins (Pygoscelis adeliae) at Adelie Cove has a heavier impact on the meiobenthic community than the Mario Zucchelli Station. Despite the fact that environmental and faunal data did not reveal critical conditions or the overcoming of international guideline thresholds, the presence of the Antarctic Specially Protected Area (ASPA) n.161 and vulnerability of this ecosystem require future accurate monitoring.

Supplementary Materials

The following are available online at https://www.mdpi.com/article/10.3390/d13120626/s1, Supplementary S1 Table S1: results of PERMANOVA analyses on environmental data; Supplementary S1 Table S2: results of PERMANOVA analyses on Species Richness results; Supplementary S1 Table S3: results of PERMANOVA analyses on Abundances results; Supplementary S1 Table S4: results of PERMANOVA analyses on Diversity Species index results; Supplementary S1 Table S5: results of PERMANOVA analyses on Evenness results; Supplementary S1 Table S6: results of PERMANOVA analyses on Assemblages structure; Supplementary S1 Table S7: results of PERMANOVA analyses on Assemblages composed by rare taxa; Supplementary S2 Table S8: Mean (±SD) abundances of taxa (n° ind./10 cm2); Supplementary S3 Table S9: Mean (±SD) abundances of taxa (n° ind./10 cm2), Taxa affecting for more than 70% dissimilarities for each pair AreaXDepth interaction detected by SIMPER analysis. Contrib% = percentage contribution of each Taxa to dissimilarities; Cum.% = percentage cumulative contribution of each Taxa to dissimilarities; Supplementary S3 Table S10: results of SIMPER analysis showing main TAXA affecting dissimilarities of area pairs meio-benthic communities compose by rare TAXA. Contrib% = percentage contribution of each TAXA to dissimilarities; Cum.% = percentage comulative contribution of each TAXA to dissimilarities; Supplementary S3 Table S11: results of SIMPER analysis showing main TAXA affecting dissimilarities between 20 and 50 meters meio-benthic communities compose by rare TAXA. Contrib% = percentage contribution of each TAXA to dissimilarities; Cum.% = percentage comulative contribution of each TAXA to dissimilarities. Supplementary S4 Figure S1: Canonical Analysis of Principal coordinates (CAP) of the factor a) Area and b) Depth on dataset of total taxa; Supplementary S4 Figure S2: Canonical Analysis of Principal coordinates (CAP) of the factor a) Area and b) Depth on dataset of rare taxa.

Author Contributions

Conceptualization, F.S. and L.A.; methodology, F.S., L.A. and E.C.; validation, G.F.R., M.B. and R.S.; formal analysis, F.S., L.A. and E.C.; investigation, E.G., L.D., L.C. and G.T.; resources, P.D.D. and R.S.; writing—original draft preparation, F.S. and E.C.; writing—review & editing, L.A.; supervision, G.F.R., M.B. and R.S.; project administration, P.D.D. and R.S.; funding acquisition, P.D.D. All authors have read and agreed to the published version of the manuscript.

Funding

This research was supported by a grant from PNRA (Programma Nazionale di Ricerche in Antartide), Italian Ministry of Education and Research, Research Project PNRA16_00274.

Institutional Review Board Statement

Not applicable.

Data Availability Statement

The data presented in this study are available in the present study and in the supplementary material here.

Acknowledgments

The authors wish to thank the technical staff at the Italian Base ‘M. Zucchelli’ for their help and assistance in collecting the sediment samples.

Conflicts of Interest

The authors declare no conflict of interest.

References

  1. Cook, W.M.; Yao, J.; Foster, B.L.; Holt, R.D.; Patrick, L.B. Secondary succession in an experimentally fragmented landscape: Community patterns across space and time. Ecology 2005, 86, 1267–1279. [Google Scholar] [CrossRef] [Green Version]
  2. Fabiano, M.; Danovaro, R. Meiofauna distribution and mesoscale variability in two sites of the Ross Sea (Antarctica) with contrasting food supply. Polar Biol. 1999, 22, 115–123. [Google Scholar] [CrossRef]
  3. Fonseca, V.G.; Sinniger, F.; Gaspar, J.M.; Quince, C.; Creer, S.; Power, D.M.; Peck, L.S.; Clark, M.S. Revealing higher than expected meiofaunal diversity in Antarctic sediments: A metabarcoding approach. Sci. Rep. 2017, 7, 1–11. [Google Scholar]
  4. Bianchelli, S.; Nizzoli, D.; Bartoli, M.; Viaroli, P.; Rastelli, E.; Pusceddu, A. Sedimentary organic matter, prokaryotes, and meiofauna across a river-lagoon-sea gradient. Diversity 2020, 12, 189. [Google Scholar] [CrossRef]
  5. Schratzberger, M.; Ingels, J. Meiofauna matters: The roles of meiofauna in benthic ecosystems. J. Exp. Mar. Bio. Ecol. 2018, 502, 12–25. [Google Scholar] [CrossRef]
  6. Balsamo, M.; Semprucci, F.; Frontalini, F.; Coccioni, R. Meiofauna as a tool for marine ecosystem biomonitoring. Mar. Ecosyst. 2012, 4, 77–104. [Google Scholar]
  7. Semprucci, F.; Balsamo, M.; Appolloni, L.; Sandulli, R. Assessment of ecological quality status along the Apulian coasts (eastern Mediterranean Sea) based on meiobenthic and nematode assemblages. Mar. Biodivers. 2018, 48, 105–115. [Google Scholar] [CrossRef]
  8. Boufahja, F.; Semprucci, F.; Beyrem, H. An experimental protocol to select nematode species from an entire community using progressive sedimentary enrichment. Ecol. Indic. 2016, 60, 292–309. [Google Scholar] [CrossRef]
  9. Frontalini, F.; Semprucci, F.; Di Bella, L.; Caruso, A.; Cosentino, C.; Maccotta, A.; Scopelliti, G.; Sbrocca, C.; Bucci, C.; Balsamo, M. The response of cultured meiofaunal and benthic foraminiferal communities to lead exposure: Results from mesocosm experiments. Environ. Toxicol. Chem. 2018, 37, 2439–2447. [Google Scholar] [CrossRef]
  10. Appolloni, L.; Zeppilli, D.; Donnarumma, L.; Baldrighi, E.; Chianese, E.; Russo, G.F.; Sandulli, R. Seawater Acidification Affects Beta-Diversity of Benthic Communities at a Shallow Hydrothermal Vent in a Mediterranean Marine Protected Area (Underwater Archaeological Park of Baia, Naples, Italy). Diversity 2020, 12, 464. [Google Scholar] [CrossRef]
  11. Baldrighi, E.; Zeppilli, D.; Appolloni, L.; Donnarumma, L.; Chianese, E.; Russo, G.F.; Sandulli, R. Meiofaunal communities and nematode diversity characterizing the Secca delle Fumose shallow vent area (Gulf of Naples, Italy). PeerJ 2020, 8, 1–28. [Google Scholar] [CrossRef] [PubMed]
  12. Semprucci, F.; Cesaroni, L.; Guidi, L.; Balsamo, M. Do the morphological and functional traits of free-living marine nematodes mirror taxonomical diversity? Mar. Environ. Res. 2018, 135, 114–122. [Google Scholar] [CrossRef] [PubMed]
  13. Donnarumma, L.; Appolloni, L.; Chianese, E.; Bruno, R.; Baldrighi, E.; Guglielmo, R.; Russo, G.F.; Zeppilli, D.; Sandulli, R. Environmental and Benthic Community Patterns of the Shallow Hydrothermal Area of Secca Delle Fumose (Baia, Naples, Italy). Front. Mar. Sci. 2019, 6, 1–15. [Google Scholar] [CrossRef] [Green Version]
  14. Hong, J.-H.; Semprucci, F.; Jeong, R.; Kim, K.; Lee, S.; Jeon, D.; Yoo, H.; Kim, J.; Kim, J.; Yeom, J. Meiobenthic nematodes in the assessment of the relative impact of human activities on coastal marine ecosystem. Environ. Monit. Assess. 2020, 192, 1–13. [Google Scholar] [CrossRef] [PubMed]
  15. Sahraeian, N.; Sahafi, H.H.; Mosallanejad, H.; Ingels, J.; Semprucci, F. Temporal and spatial variability of free-living nematodes in a beach system characterized by domestic and industrial impacts (Bandar Abbas, Persian Gulf, Iran). Ecol. Indic. 2020, 118, 106697. [Google Scholar] [CrossRef]
  16. Bianchelli, S.; Gambi, C.; Zeppilli, D.; Danovaro, R. Metazoan meiofauna in deep-sea canyons and adjacent open slopes: A large-scale comparison with focus on the rare taxa. Deep. Res. Part I Oceanogr. Res. Pap. 2010, 57, 420–433. [Google Scholar] [CrossRef]
  17. Pusceddu, A.; Bianchelli, S.; Gambi, C.; Danovaro, R. Assessment of benthic trophic status of marine coastal ecosystems: Significance of meiofaunal rare taxa. Estuar. Coast. Shelf Sci. 2011, 93, 420–430. [Google Scholar] [CrossRef]
  18. Losi, V.; Grassi, E.; Balsamo, M.; Rocchi, M.; Gaozza, L.; Semprucci, F. Changes in taxonomic structure and functional traits of nematodes as tools in the assessment of port impact. Estuar. Coast. Shelf Sci. 2021, 260, 107524. [Google Scholar] [CrossRef]
  19. Coull, B.C.; Chandler, G.T. Pollution and meiofauna: Field, laboratory, and mesocosm studies. Oceanogr. Mar. Biol. Annu. Rev. 1992, 30, 191–271. [Google Scholar]
  20. Mirto, S.; La Rosa, T.; Danovaro, R.; Mazzola, A. Microbial and meiofaunal response to intensive mussel-farm biodeposition in coastal sediments of the Western Mediterranean. Mar. Pollut. Bull. 2000, 40, 244–252. [Google Scholar] [CrossRef]
  21. Vezzulli, L.; Moreno, M.; Marin, V.; Pezzati, E.; Bartoli, M.; Fabiano, M. Organic waste impact of capture-based Atlantic bluefin tuna aquaculture at an exposed site in the Mediterranean Sea. Estuar. Coast. Shelf Sci. 2008, 78, 369–384. [Google Scholar] [CrossRef]
  22. Grego, M.; De Troch, M.; Forte, J.; Malej, A. Main meiofauna taxa as an indicator for assessing the spatial and seasonal impact of fish farming. Mar. Pollut. Bull. 2009, 58, 1178–1186. [Google Scholar] [CrossRef] [PubMed]
  23. Dal Zotto, M.; Santulli, A.; Simonini, R.; Todaro, M.A. Organic enrichment effects on a marine meiofauna community, with focus on Kinorhyncha. Zool. Anzeiger-A J. Comp. Zool. 2016, 265, 127–140. [Google Scholar] [CrossRef]
  24. Espejo, W.; Celis, J.E.; Sandoval, M.; González-Acuña, D.; Barra, R.; Capulín, J. The impact of penguins on the content of trace elements and nutrients in coastal soils of North Western Chile and the Antarctic Peninsula area. Water Air Soil Pollut. 2017, 228, 116. [Google Scholar] [CrossRef]
  25. Emslie, S.D. Ancient Adélie penguin colony revealed by snowmelt at Cape Irizar, Ross Sea, Antarctica. Geology 2021, 49, 145–149. [Google Scholar] [CrossRef]
  26. Batalla Salvarrey, A.V.; Kotzian, C.B.; Spies, M.R.; Braun, B. The influence of natural and anthropic environmental variables on the structure and spatial distribution along longitudinal gradient of macroinvertebrate communities in southern Brazilian streams. J. Insect Sci. 2014, 14, 1–23. [Google Scholar] [CrossRef]
  27. Bueno, C.; Brugnoli, E.; Bergamino, L.; Muniz, P.; García-Rodríguez, F.; Figueira, R. Anthropogenic and natural variability in the composition of sedimentary organic matter of the urbanised coastal zone of Montevideo (Río de la Plata). Mar. Pollut. Bull. 2018, 126, 197–203. [Google Scholar] [CrossRef]
  28. Hermand, R.; Salen-Picard, C. Responses of a Macrobenthic Mediterranean Community Submitted to Allochtonous Natural or Anthropic Sedimentary Inputs; Universite de l a Mediterranee, Centre d’Oceanologie de Marseille, Station Marine d’Endoume: Marseille, France, 2008; Volume 33, p. 18. [Google Scholar]
  29. Danovaro, R.; Chiantore, M.; Pusceddu, A.; Cattaneo Vietti, R.; Manini, E.; Fabiano, M. Sediment organic matter, bacteria and protozoans in Terra Nova bay, Ross Sea, Antarctica, during austral summer 1993/1994. In National Programme for Antarctic Research—ROSSMIZE (Ross Sea Marginal Ice Zone Ecology); Faranda, F.M., Guglielmo, L., Povero, P., Eds.; G.Lang Editor: Genoa, Italy, 1997; pp. 423–430. [Google Scholar]
  30. Bargagli, R. Antarctic Ecosystems: Environmental Contamination, Climate Change, and Human Impact; Czeschlik, D., Ed.; Springer Science & Business Media: Berlin/Heidelberg, Germany, 2006; Volume 175, ISBN 3540264655. [Google Scholar]
  31. Hughes, K.A.; Thompson, A. Distribution of sewage pollution around a maritime Antarctic research station indicated by faecal coliforms, Clostridium perfringens and faecal sterol markers. Environ. Pollut. 2004, 127, 315–321. [Google Scholar] [CrossRef]
  32. Stark, J.S.; Smith, J.; King, C.K.; Lindsay, M.; Stark, S.; Palmer, A.S.; Snape, I.; Bridgen, P.; Riddle, M. Physical, chemical, biological and ecotoxicological properties of wastewater discharged from Davis Station, Antarctica. Cold Reg. Sci. Technol. 2015, 113, 52–62. [Google Scholar] [CrossRef]
  33. Stark, J.S.; Corbett, P.A.; Dunshea, G.; Johnstone, G.; King, C.; Mondon, J.A.; Power, M.L.; Samuel, A.; Snape, I.; Riddle, M. The environmental impact of sewage and wastewater outfalls in Antarctica: An example from Davis station, East Antarctica. Water Res. 2016, 105, 602–614. [Google Scholar] [CrossRef] [PubMed]
  34. Corbett, P.A.; King, C.K.; Stark, J.S.; Mondon, J.A. Direct evidence of histopathological impacts of wastewater discharge on resident Antarctic fish (Trematomus bernacchii) at Davis Station, East Antarctica. Mar. Pollut. Bull. 2014, 87, 48–56. [Google Scholar] [CrossRef]
  35. Tin, T.; Fleming, Z.L.; Hughes, K.A.; Ainley, D.G.; Convey, P.; Moreno, C.A.; Pfeiffer, S.; Scott, J.; Snape, I. Impacts of local human activities on the Antarctic environment. Antarct. Sci. 2009, 21, 3–33. [Google Scholar] [CrossRef] [Green Version]
  36. Stark, J.S.; Snape, I.; Riddle, M.J. The effects of petroleum hydrocarbon and heavy metal contamination of marine sediments on recruitment of Antarctic soft-sediment assemblages: A field experimental investigation. J. Exp. Mar. Bio. Ecol. 2003, 283, 21–50. [Google Scholar] [CrossRef]
  37. Ancora, S.; Volpi, V.; Olmastroni, S.; Focardi, S.; Leonzio, C. Assumption and elimination of trace elements in Adélie penguins from Antarctica: A preliminary study. Mar. Environ. Res. 2002, 54, 341–344. [Google Scholar] [CrossRef]
  38. Espejo, W.; Celis, J.E.; Acuna, D.G.; Jara, S.; Barra, R. Concentration of trace metals in excrements of two species of penguins from different locations of the Antarctic Peninsula. Polar Biol. 2014, 37, 675–683. [Google Scholar] [CrossRef]
  39. Stark, J.S.; Mohammad, M.; McMinn, A.; Ingels, J. Diversity, Abundance, Spatial Variation, and Human Impacts in Marine Meiobenthic Nematode and Copepod Communities at Casey Station, East Antarctica. Front. Mar. Sci. 2020, 7, 480. [Google Scholar] [CrossRef]
  40. Conlan, K.E.; Kim, S.L.; Thurber, A.R.; Hendrycks, E. Benthic changes at McMurdo Station, Antarctica following local sewage treatment and regional iceberg-mediated productivity decline. Mar. Pollut. Bull. 2010, 60, 419–432. [Google Scholar] [CrossRef]
  41. Lenihan, H.S.; Peterson, C.H.; Kim, S.L.; Conlan, K.E.; Fairey, R.; McDonald, C.; Grabowski, J.H.; Oliver, J.S. Variation in marine benthic community composition allows discrimination of multiple stressors. Mar. Ecol. Prog. Ser. 2003, 261, 63–73. [Google Scholar] [CrossRef]
  42. Conlan, K.E.; Kim, S.L.; Lenihan, H.S.; Oliver, J.S. Benthic changes during 10 years of organic enrichment by McMurdo Station, Antarctica. Mar. Pollut. Bull. 2004, 49, 43–60. [Google Scholar] [CrossRef]
  43. Hill, S.; Cavanagh, R.; Knowland, C.; Grant, S.; Downie, R. Bridging the Krill Divide: Understanding Cross-Sector Objectives for Krill Fishing and Conservation; WWF Living Planet Centre: Woking, UK, 2014. [Google Scholar]
  44. Stark, J.S.; Mohammad, M.; McMinn, A.; Ingels, J. The effects of hydrocarbons on meiofauna in marine sediments in Antarctica. J. Exp. Mar. Bio. Ecol. 2017, 496, 56–73. [Google Scholar] [CrossRef]
  45. Stark, J.S.; Bridgen, P.; Dunshea, G.; Galton-fenzi, B.; Hunter, J.; Johnstone, G.; King, C.; Leeming, R.; Palmer, A.; Smith, J.; et al. Chemosphere Dispersal and dilution of wastewater from an ocean outfall at Davis Station, Antarctica, and resulting environmental contamination. Chemosphere 2016, 152, 142–157. [Google Scholar] [CrossRef]
  46. Stark, J.S.; Kim, S.L.; Oliver, J.S. Anthropogenic disturbance and biodiversity of marine benthic communities in Antarctica: A regional comparison. PLoS ONE 2014, 9, e98802. [Google Scholar] [CrossRef]
  47. Povero, P.; Chiantore, M.; Misic, C.; Budillon, G.; Cattaneo-Vietti, R. Land forcing controls pelagic-benthic coupling in Adelie Cove (Terra Nova Bay, Ross Sea). Polar Biol. 2001, 24, 875–882. [Google Scholar] [CrossRef]
  48. Chianese, E.; Tirimberio, G.; Riccio, A. PM2.5 and PM10 in the urban area of Naples: Chemical composition, chemical properties and influence of air masses origin. J. Atmos. Chem. 2019, 76, 151–169. [Google Scholar] [CrossRef]
  49. Wentworth, C.K. A Scale of Grade and Class Terms for Clastic Sediments. Published by The University of Chicago Press. J. Geol. 1922, 30, 377–392. [Google Scholar] [CrossRef]
  50. Schumacher, B.A. Methods for the Determination of Total Organic Carbon (TOC) in Soils and Sediments, NCEA-C-1282, 1st ed.; Schumacher, B.A., Ed.; US Environmental Protection Agency, Office of Research and Development: Washington, DC, USA, 2002.
  51. Danovaro, R.; Gambi, C.; Mirto, S.; Sandulli, R.; Ceccherelli, V. Meiofauna. In Mediterranean Marine Benthos: A Manual of Methods for Its Sampling and Study; Gambi, M.C., Dappiano, M., Eds.; S.I.B.M-Società Italiana di Biologia Marina: Genova, Italy, 2004; pp. 55–97. [Google Scholar]
  52. Heip, C.; Vincx, M.; Vranken, G. The Ecology of Marine Nematodes; Aberdeen University Press: Aberdeen, UK, 1985. [Google Scholar]
  53. Appolloni, L.; Bevilacqua, S.; Sbrescia, L.; Sandulli, R.; Terlizzi, A.; Russo, G.F. Does full protection count for the maintenance of β-diversity patterns in marine communities? Evidence from Mediterranean fish assemblages. Aquat. Conserv. Mar. Freshw. Ecosyst. 2017, 27, 1–11. [Google Scholar] [CrossRef] [Green Version]
  54. Azzurro, E.; Matiddi, M.; Fanelli, E.; Guidetti, P.; La Mesa, G.; Scarpato, A.; Axiak, V. Sewage pollution impact on Mediterranean rocky-reef fish assemblages. Mar. Environ. Res. 2010, 69, 390–397. [Google Scholar] [CrossRef] [Green Version]
  55. Underwood, A.J. Beyond BACI: Experimental Designs for Detecting Human Environmental Impacts on Temporal Variations in Natural Populations. Aust. J. Mar. Freshw. Res. 1991, 42, 569–587. [Google Scholar] [CrossRef]
  56. Anderson, M.; Gorley, R.N.; Clarke, K.R. PERMANOVA + for PRIMER User Manual; PRIMER-E Ltd.: Plymouth, UK, 2008. [Google Scholar]
  57. Anderson, M.J. A new method for non parametric multivariate analysis of variance. Austral. Ecol. 2001, 26, 32–46. [Google Scholar] [CrossRef]
  58. Anderson, M.J. Permutation tests for univariate or multivariate analysis of variance and regression. Can. J. Fish. Aquat. Sci. 2001, 58, 626–639. [Google Scholar] [CrossRef]
  59. Anderson, M.J.; Willis, T.J. Canonical Analysis of Principal Coordinates: A Useful Method of Constrained Ordination for Ecology. Ecology 2003, 84, 511–525. [Google Scholar] [CrossRef]
  60. Clarke, K.R.; Gorley, R.; Sommerfield, P.J.; Warwick, R.M. Change in Marine Communities—An Approach to Statistical Analysis and Interpretation, 3rd ed.; PRIMER-E: Plymouth, UK, 2014. [Google Scholar]
  61. Terlizzi, A.; Anderson, M.J.; Fraschetti, S.; Benedetti-Cecchi, L. Scales of spatial variation in Mediterranean subtidal sessile assemblages at different depths. Mar. Ecol. Prog. Ser. 2007, 332, 25–39. [Google Scholar] [CrossRef] [Green Version]
  62. Anderson, M.J. DISTLM v. 5: A FORTRAN computer program to calculate a distance-based multivariate analysis for a linear model. Dep. Stat. Univ. Auckl. N. Z. 2004, 10, 2016. [Google Scholar]
  63. Legendre, P.; Anderson, M.J. Distance-based redundancy analysis: Testing multispecies responses in multifactorial ecological experiments. Ecol. Monogr. 1999, 69, 1–24. [Google Scholar] [CrossRef]
  64. Larner, B.L.; Seen, A.J.; Snape, I. Evaluation of diffusive gradients in thin film (DGT) samplers for measuring contaminants in the Antarctic marine environment. Chemosphere 2006, 65, 811–820. [Google Scholar] [CrossRef]
  65. Chu, W.-L.; Dang, N.-L.; Kok, Y.-Y.; Yap, K.-S.I.; Phang, S.-M.; Convey, P. Heavy metal pollution in Antarctica and its potential impacts on algae. Polar Sci. 2019, 20, 75–83. [Google Scholar] [CrossRef]
  66. Chu, Z.; Yang, Z.; Wang, Y.; Sun, L.; Yang, W.; Yang, L.; Gao, Y. Assessment of heavy metal contamination from penguins and anthropogenic activities on fildes peninsula and ardley island, antarctic. Sci. Total Environ. 2019, 646, 951–957. [Google Scholar] [CrossRef]
  67. Metcheva, R.; Yurukova, L.; Teodorova, S.E. Biogenic and toxic elements in feathers, eggs, and excreta of Gentoo penguin (Pygoscelis papua ellsworthii) in the Antarctic. Environ. Monit. Assess. 2011, 182, 571–585. [Google Scholar] [CrossRef]
  68. US EPA Ambient Aquatic Life Water Quality Criteria for Dissolved Oxygen (Saltwater): Cape Cod to Cape Hatteras; Environmental Protection Agency, Office of Water, Office of Science and Technology: Washington, DC, USA, 2000.
  69. Dimitrakakis, E.; Hahladakis, J.; Gidarakos, E. The “Sea Diamond” shipwreck: Environmental impact assessment in the water column and sediments of the wreck area. Int. J. Environ. Sci. Technol. 2014, 11, 1421–1432. [Google Scholar] [CrossRef] [Green Version]
  70. Huang, T.; Yang, L.; Chu, Z.; Sun, L.; Yin, X. Geochemical record of high emperor penguin populations during the Little Ice Age at Amanda Bay, Antarctica. Sci. Total Environ. 2016, 565, 1185–1191. [Google Scholar] [CrossRef]
  71. Monien, P.; Lettmann, K.A.; Monien, D.; Asendorf, S.; Wölfl, A.-C.; Lim, C.H.; Thal, J.; Schnetger, B.; Brumsack, H.-J. Redox conditions and trace metal cycling in coastal sediments from the maritime Antarctic. Geochim. Cosmochim. Acta 2014, 141, 26–44. [Google Scholar] [CrossRef]
  72. Anderson, J.B.; Kurtz, D.D.; Domack, E.W.; Balshaw, K.M. Glacial and glacial marine sediments of the antarctic continental shelf. J. Geol. 1980, 88, 399–414. [Google Scholar] [CrossRef]
  73. Pusceddu, A.; Dell’Anno, A.; Fabiano, M. Organic matter composition in coastal sediments at Terra Nova Bay (Ross Sea) during summer 1995. Polar Biol. 2000, 23, 288–293. [Google Scholar] [CrossRef]
  74. Pasotti, F.; De Troch, M.; Raes, M.; Vanreusel, A. Feeding ecology of shallow water meiofauna: Insights from a stable isotope tracer experiment in Potter Cove, King George Island, Antarctica. Polar Biol. 2012, 35, 1629–1640. [Google Scholar] [CrossRef]
  75. Gradinger, R. Integrated abundance and biomass of sympagic meiofauna in Arctic and Antarctic pack ice. Polar Biol. 1999, 22, 169–177. [Google Scholar] [CrossRef]
  76. Vanhove, S.; Beghyn, M.; Van Gansbeke, D.; Bullough, L.W.; Vincx, M. A seasonally varying biotope at Signy Island, Antarctic: Implications for meiofaunal structure. Mar. Ecol. Prog. Ser. 2000, 202, 13–25. [Google Scholar] [CrossRef]
  77. Lee, H.; Vanhove, S.; Peck, L.S.; Vincx, M. Recolonisation of meiofauna after catastrophic iceberg scouring in shallow Antarctic sediments. Polar Biol. 2001, 24, 918–925. [Google Scholar] [CrossRef]
  78. Veit-Köhler, G.; Durst, S.; Schuckenbrock, J.; Hauquier, F.; Suja, L.D.; Dorschel, B.; Vanreusel, A.; Arbizu, P.M. Oceanographic and topographic conditions structure benthic meiofauna communities in the Weddell Sea, Bransfield Strait and Drake Passage (Antarctic). Prog. Oceanogr. 2018, 162, 240–256. [Google Scholar] [CrossRef] [Green Version]
  79. Ehrlich, J.; Schaafsma, F.L.; Bluhm, B.A.; Peeken, I.; Castellani, G.; Brandt, A.; Flores, H. Sympagic fauna in and under Arctic pack ice in the annual sea-ice system of the new Arctic. Front. Mar. Sci. 2020, 7, 452. [Google Scholar] [CrossRef]
  80. Leasi, F.; Sevigny, J.L.; Hassett, B.T. Meiofauna as a valuable bioindicator of climate change in the polar regions. Ecol. Indic. 2021, 121, 107133. [Google Scholar] [CrossRef]
  81. Jouili, S.; Essid, N.; Semprucci, F.; Boufahja, F.; Nasri, A.; Beyrem, H.; Mahmoudi, E. Environmental quality assessment of El Bibane lagoon (Tunisia) using taxonomic and functional diversity of meiofauna and nematodes. J. Mar. Biol. Assoc. United Kingdom 2017, 97, 1593–1603. [Google Scholar] [CrossRef]
  82. Balsamo, M.; Albertelli, G.; Ceccherelli, V.U.; Coccioni, R.; Colangelo, M.A.; Curini-Galletti, M.; Danovaro, R.; D’Addabbo, R.; Leonardis, C.; Fabiano, M.; et al. Meiofauna of the Adriatic Sea: Current state of knowledge and future perspectives. Chem. Ecol. 2010, 26, 45–63. [Google Scholar] [CrossRef]
  83. Ferrigno, F.; Russo, G.F.; Semprucci, F.; Sandulli, R. Unveiling the state of some underexplored deep coralligenous banks in the Gulf of Naples (Mediterranean Sea, Italy). Reg. Stud. Mar. Sci. 2018, 22, 82–92. [Google Scholar] [CrossRef]
  84. Kapp, H.; Giere, O. Spadella interstitialis sp. nov., a meiobenthic chaetognath from Mediterranean calcareous sands. Meiofauna Mar. 2005, 14, 109–114. [Google Scholar]
  85. Casanova, J.P.; Hernández, F.; Jiménez, S. Spadella lainezi n. sp., the first cave chaetognath from the Eastern Atlantic Ocean. Vieraea 2006, 34, 17–24. [Google Scholar]
  86. Curini-Galletti, M.; Artois, T.; Di Domenico, M.; Fontaneto, D.; Jondelius, U.; Jörger, K.M.; Leasi, F.; Martínez, A.; Norenburg, J.L.; Sterrer, W. Contribution of soft-bodied meiofaunal taxa to Italian marine biodiversity. Eur. Zool. J. 2020, 87, 369–384. [Google Scholar] [CrossRef]
  87. Semprucci, F.; Colantoni, P.; Baldelli, G.; Rocchi, M.; Balsamo, M. The distribution of meiofauna on back-reef sandy platforms in the Maldives (Indian Ocean). Mar. Ecol. 2010, 31, 592–607. [Google Scholar] [CrossRef]
  88. Semprucci, F.; Frontalini, F.; Losi, V.; du Chatelet, E.A.; Cesaroni, L.; Sandulli, R.; Coccioni, R.; Balsamo, M. Biodiversity and distribution of the meiofaunal community in the reef slopes of the Maldivian archipelago (Indian Ocean). Mar. Environ. Res. 2018, 139, 19–26. [Google Scholar] [CrossRef]
Figure 1. Study area in the Terra Nova Bay area (Ross Sea, Antarctica). Sediments were collected in four sites: anthropically impacted site (AI) and its control (AC); naturally impacted site (NI) and its control (NC). Two stations were also selected in each area, at 20 and 50 m in depth. The limits of the Antarctic Specially Protected Area (ASPA) were also reported on the map.
Diversity 13 00626 g001
Figure 2. Heavy metals concentration (nM) among stations; “Sum” indicates the sum of all detected metals in each station.
Diversity 13 00626 g002
Figure 3. Cumulative percentages of three main gran size classes in the sampling stations.
Diversity 13 00626 g003
Figure 4. Ordination plot on environmental data and coming from PCA analysis. Replicates of Ar × De interaction are here shown. Strength lines are vectors that graphically show the correlation of physical and chemical correlation with different clusters.
Diversity 13 00626 g004
Figure 5. Trends of synecological indices and results of univariate analyses. (a) Number of meiobenthic taxa, (b) abundances, (c) percent composition of meiobenthic taxa (those taxa with less than 1% were grouped in the “Others” category), (d) diversity (H’) calculated as Shannon index, and (e) evenness (J) calculated as Pielou index. PERMANOVA significant differences among stations are also shown: * = p < 0.05, ** = p < 0.01, *** = p < 0.001.
Diversity 13 00626 g005
Figure 6. Canonical analysis of principal coordinates (CAP) of the interaction of Ar × De factors. Dataset on total taxa is correlated by the Pearson index (ρ > 0.35). Straight lines are vectors of taxa, whose orientation and length are proportional to the most correlated plot elements. Circle represents 95% confidence interval.
Diversity 13 00626 g006
Figure 7. Canonical analysis of principal coordinates (CAP) of the interaction Ar × De factors. Dataset on rare taxa is correlated by Pearson index (ρ > 0.35). Straight lines are vectors of taxa whose orientation and length are proportional to the most correlated plot elements. Circle represents 95% confidence interval.
Diversity 13 00626 g007
Figure 8. The dbRDA (distance-based redundancy analysis) ordination of total meiobenthic assemblages vs. the significant explanatory environmental variables selected by distLM. Vector overlays represent multiple partial correlations of the explanatory variables with the distance-based redundancy analysis (dbRDA) axes. See text for further explanation.
Diversity 13 00626 g008
Figure 9. The dbRDA (distance-based redundancy analysis) ordination of rare meiobenthic assemblages vs. the significant explanatory environmental variables. Vector overlays represent multiple partial correlations of the explanatory variables with the distance-based redundancy analysis (dbRDA) axes. See text for further explanation.
Diversity 13 00626 g009
Table 1. Environmental conditions of each station. Data were expressed as nanomoles (nM), milligrams/liter (mg/L), or as percentage of total sample (%); nd. refers to no detectable concentration. Standard deviation (SD) of each variable is also shown.
StationZn2+Cd2+Pb2+Cu2+pHO2NO3PO43−SO42−Coarse SandSandFine SandTOC
(nM)(nM)(nM)(nM)(mg/L)(mM)(mM)(mM)%%%%
AI2041.9947.89417.55650.1778.335.70.494nd.23.00263.61835.4260.9561.732
±SD8.3441.1500.7412.083 0.013 0.0450.9830.1440.3980.008
AC2013.7351.03112.70014.8388.706.2nd.nd.18.36226.84473.1420.0144.043
±SD3.1810.5811.0911.629 0.0360.9230.6890.0060.008
NC2021.939nd.7.26911.0248.855.7nd.nd.20.4117.80089.7402.4601.263
±SD2.686 4.1842.457 0.0640.6740.9650.8930.001
NI2045.4532.03314.80213.9768.865.9nd.1.86424.1833.81450.01546.1722.348
±SD8.6800.5981.9131.176 0.0120.0520.3800.5010.1380.006
AI5011.4822.6395.6989.7278.556.2nd.nd.24.77053.86745.0751.0572.800
±SD3.6431.3951.5400.825 0.0310.2510.2550.0410.009
AC507.4232.106nd.1.9388.706.2nd.0.56923.90717.02576.7016.2755.711
±SD2.6810.807 0.710 0.0140.0480.8760.0190.8180.010
NC506.9420.706nd.0.6428.855.70.3130.43824.4653.34162.87533.7841.153
±SD0.8730.331 0.115 0.0170.0090.0560.5950.6360.7400.007
NI5011.722nd.nd.1.4848.716.20.205nd.24.34232.87261.7605.3693.867
±SD4.413 0.176 0.014 0.0430.9650.5950.0990.007
Table 2. Pair-wise comparisons and t-statistics for differences in total meiobenthic assemblages among stations, within levels of the depth factor. Significant tests relevant to the hypothesis are given in bold. (a) Within level ‘20’ of factor ‘Depth’. (b) Within level ‘50’ of factor ‘Depth’.
(a)(b)
Station PairtpStation Pairtp
AI vs. AC1.46620.147AI vs. AC1.81750.0718
AI vs. NC1.66710.105AI vs. NC3.9890.0032
AI vs. NI1.08710.356AI vs. NI4.07490.0018
AC vs. NC2.54690.0244AC vs. NC3.15630.012
AC vs. NI2.26360.028AC vs. NI2.47010.0208
NC vs. NI1.92680.0544NC vs. NI2.78360.0136
Table 3. Pair-wise comparisons and t-statistics for differences in rare meiobenthic assemblages among stations within levels of the depth factor. Significant tests relevant to the hypothesis are given in bold. (a) Within level ‘20’ of factor ‘Depth’. (b) Within level ‘50’ of factor ‘Depth’.
(a)(b)
Station PairtpStation Pairtp
AI vs. AC0.467280.8484AI vs. AC0.729940.6404
AI vs. NC1.32670.2092AI vs. NC2.01950.0548
AI vs. NI1.42240.1976AI vs. NI3.11820.019
AC vs. NC1.37190.1856AC vs. NC2.15860.043
AC vs. NI1.53150.1794AC vs. NI2.99990.0152
NC vs. NI2.1360.0586NC vs. NI2.53340.0396
Table 4. Variables selected by distLM as the most affecting biological data showed in their cumulative contribution to total variation Adj, r2, and the significance (p in bold) of their own pseudo-F value.
VariableAdj. r2Pseudo-Fp
+Cd2+0.274273.97240.0018
+NO30.354373.60540.0032
+Coarse sand0.462352.47450.051
+pH0.525493.26220.019
+PO43−0.560522.27520.0832
Table 5. Variables selected by distLM as the most affecting biological data showed in their cumulative contribution to total variation Adj, r2, and the significance (p in bold) of their own pseudo-F value.
VariableAdj. r2Pseudo-Fp
+TOC0.10473.68960.0112
+Cu2+0.195443.48130.0146
+pH0.271493.19210.0302
+NO30.296411.70840.1804
+Coarse sand0.41424.78170.003
+Zn2+0.489032.20480.1056
+Cd2+0.504711.28030.3088
Publisher’s Note: MDPI stays neutral with regard to jurisdictional claims in published maps and institutional affiliations.

