Article

Mating System in a Native Norway Spruce (Picea abies [L.] KARST.) Stand-Relatedness and Effective Pollen Population Size Show an Association with the Germination Percentage of Single Tree Progenies

by
Oliver Caré
1,2,3,
Oliver Gailing
1,2,*,
Markus Müller
1,
Konstantin V. Krutovsky
1,2,4,5,6 and
Ludger Leinemann
1,3
1
Department of Forest Genetics and Forest Tree Breeding, Georg-August University of Göttingen, 37077 Göttingen, Germany
2
Center for Integrated Breeding Research (CiBreed), Georg-August University of Göttingen, 37075 Göttingen, Germany
3
ISOGEN GmbH & Co.KG, 37077 Göttingen, Germany
4
Department of Ecosystem Science and Management, Texas A&M University, College Station, TX 77840, USA
5
Laboratory of population genetics, Vavilov Institute of General Genetics, Russian Academy of Sciences, 119991 Moscow, Russia
6
Genome Research and Education Centre, Siberian Federal University, 660036 Krasnoyarsk, Russia
*
Author to whom correspondence should be addressed.
Diversity 2020, 12(7), 266; https://doi.org/10.3390/d12070266
Submission received: 5 June 2020 / Revised: 30 June 2020 / Accepted: 1 July 2020 / Published: 3 July 2020
(This article belongs to the Section Plant Diversity)

Abstract

:
Norway spruce differs little in neutral genetic markers among populations and provenances often reported, but in terms of putative adaptive traits and their candidate genes, some clear differences have been observed. This has previously been shown for crown morphotypes. Stands with mostly narrow crown shapes are adapted to high elevation conditions, but these stands are scattered, and the forest area is often occupied by planted stands with predominantly broad crowned morphotypes. This raises questions on whether this differentiation can remain despite gene flow, and on the level of gene flow between natural and planted stands growing in close neighbourhood. The locally adapted stands are a valuable seed source, the progeny of which is expected to have high genetic quality and germination ability. The presented case study is useful for spruce plantation by demonstrating evaluation of these expectations. Immigrant pollen and seeds from planted trees could be maladaptive and may alter the genetic composition of the progeny. This motivated us to study single tree progenies in a locally adapted stand with narrow crowned trees in a partial mast year at nuclear genomic simple sequence repeat (SSR) markers. Spruce is a typical open-pollinated conifer tree species with very low selfing rates, which were also observed in our study (s = 0.3–2.1%) and could be explained by efficient cross-pollination and postzygotic early embryo abortion, common in conifers. The estimated high amount of immigrant pollen found in the pooled seed lot (70.2–91.5%) is likely to influence the genetic composition of the seedlings. Notably, for individual mother trees located in the centre of the stand, up to 50% of the pollen was characterised as local. Seeds from these trees are therefore considered to retain most of the adaptive variance of the stand. Germination percentage varied greatly between half-sib families (3.6–61.9%) and was negatively correlated with relatedness and positively with effective pollen population size of the respective families. As pollen mostly originated from outside the stand and no family structures in the stand itself were found, germination differences can likely be explained by diversity differences in the individual pollen cloud.

1. Introduction

Historically, forest areas were heavily exploited and reforested in Germany, and older stands were often planted with unknown and potentially unsuitable plant material [1]. Typically, local stands of Norway spruce at higher elevations are characterised by trees with a narrow crown and plate-like branching adapted to sustain heavy snowfall [2,3]. In the past, due to limited availability of planting material from desired provenances or lack of attention in selection of material, spruce stands were often established using seeds or seedlings representing lowland morphotypes. Recently, Caré et al. [4] showed adaptive differentiation at candidate genes between high and low elevation morphotypes.
Adapted autochthonous stands are valuable for in situ conservation of genetic resources and as the main seed sources for artificial regeneration [1]. Therefore, there are two important aspects related to the genetic composition of the offspring: (1) the natural regeneration of the stand itself, and (2) the usage of the seeds for production and subsequent plantation of seedlings. As a wind-pollinated monoecious species, Norway spruce is characterised by high outcrossing rates and long-distance pollen dispersal [5,6,7,8]. The high outcrossing rates can, not only be explained by effective wind-mediated pollen flow, but also by postzygotic abortion of inbred embryos, decreasing the selfing rates estimated in viable seeds. Early studies in the genus Picea spp. detected no self-incompatibility, but did detect unviability of selfed embryos caused by inbreeding depression [9,10]. Inbreeding depression in Picea abies [L.] Karst. also lowers germination percentage and speed and negatively affects growth traits and the viability of young trees [11]. At later ontogenetic stages it strongly reduces tree volume and height and increases mortality compared to individuals from open pollinated seeds [12].
Pollen-mediated gene flow in conifers occurs at the local population scale as a distance dependent process with a typically exponential decrease with increasing distance. However, long distance gene flow occurs by pollen lifted in upper air-layers and transported over several or even hundreds of kilometres [7,8,13,14]. This leads to the overall low differentiation of Norway spruce populations at neutral markers observed throughout the distribution range of the species [15]. Long-distance gene flow and immigrant pollen could have various impacts on the genetic composition of a local population. Gene flow between populations, on the one hand, leads to a distribution of genetic information across the population range, possibly counteracting effects of genetic drift or inbreeding and distributing potentially important gene variants for adaptation, that even might assist the adaptive processes to climatic changes. On the other hand, it may alter local adaptation by changing allele frequencies and gene complexes [16].
We studied seed samples from single tree progenies (half-sib families) ripened after a partial mast year. The samples were collected in a putatively adapted and autochthonous spruce stand of mainly narrow to intermediate crowned individuals that grow at higher elevations of the Thuringia Forest in Germany and that have previously showed signs of genetic adaptation to the mountainous environment [4]. The area is also characterised by a high proportion of planted stands typically consisting of broad crowned individuals. The sampled stand is used as a seed source to produce reproductive material of mountainous provenance. Thus, potentially extended gene flow from the surrounding stands might introduce undesired characteristics to the progeny, and our results could be helpful in the evaluation of the stand as seed source.
Genetic analysis combined with observation of germination was conducted to address the following objectives: (1) assigning progeny to potential pollen donors to examine the mating system, (2) quantifying the amount of pollen originated from within the autochthonous stand or migrated from the surrounding stands to assess possible impacts on adaptive genetic variation, and (3) observing the germination rate of seed samples from each half-sib family and estimating genetic differences between them, considering also a possible link between genetics and fitness.

2. Materials and Methods
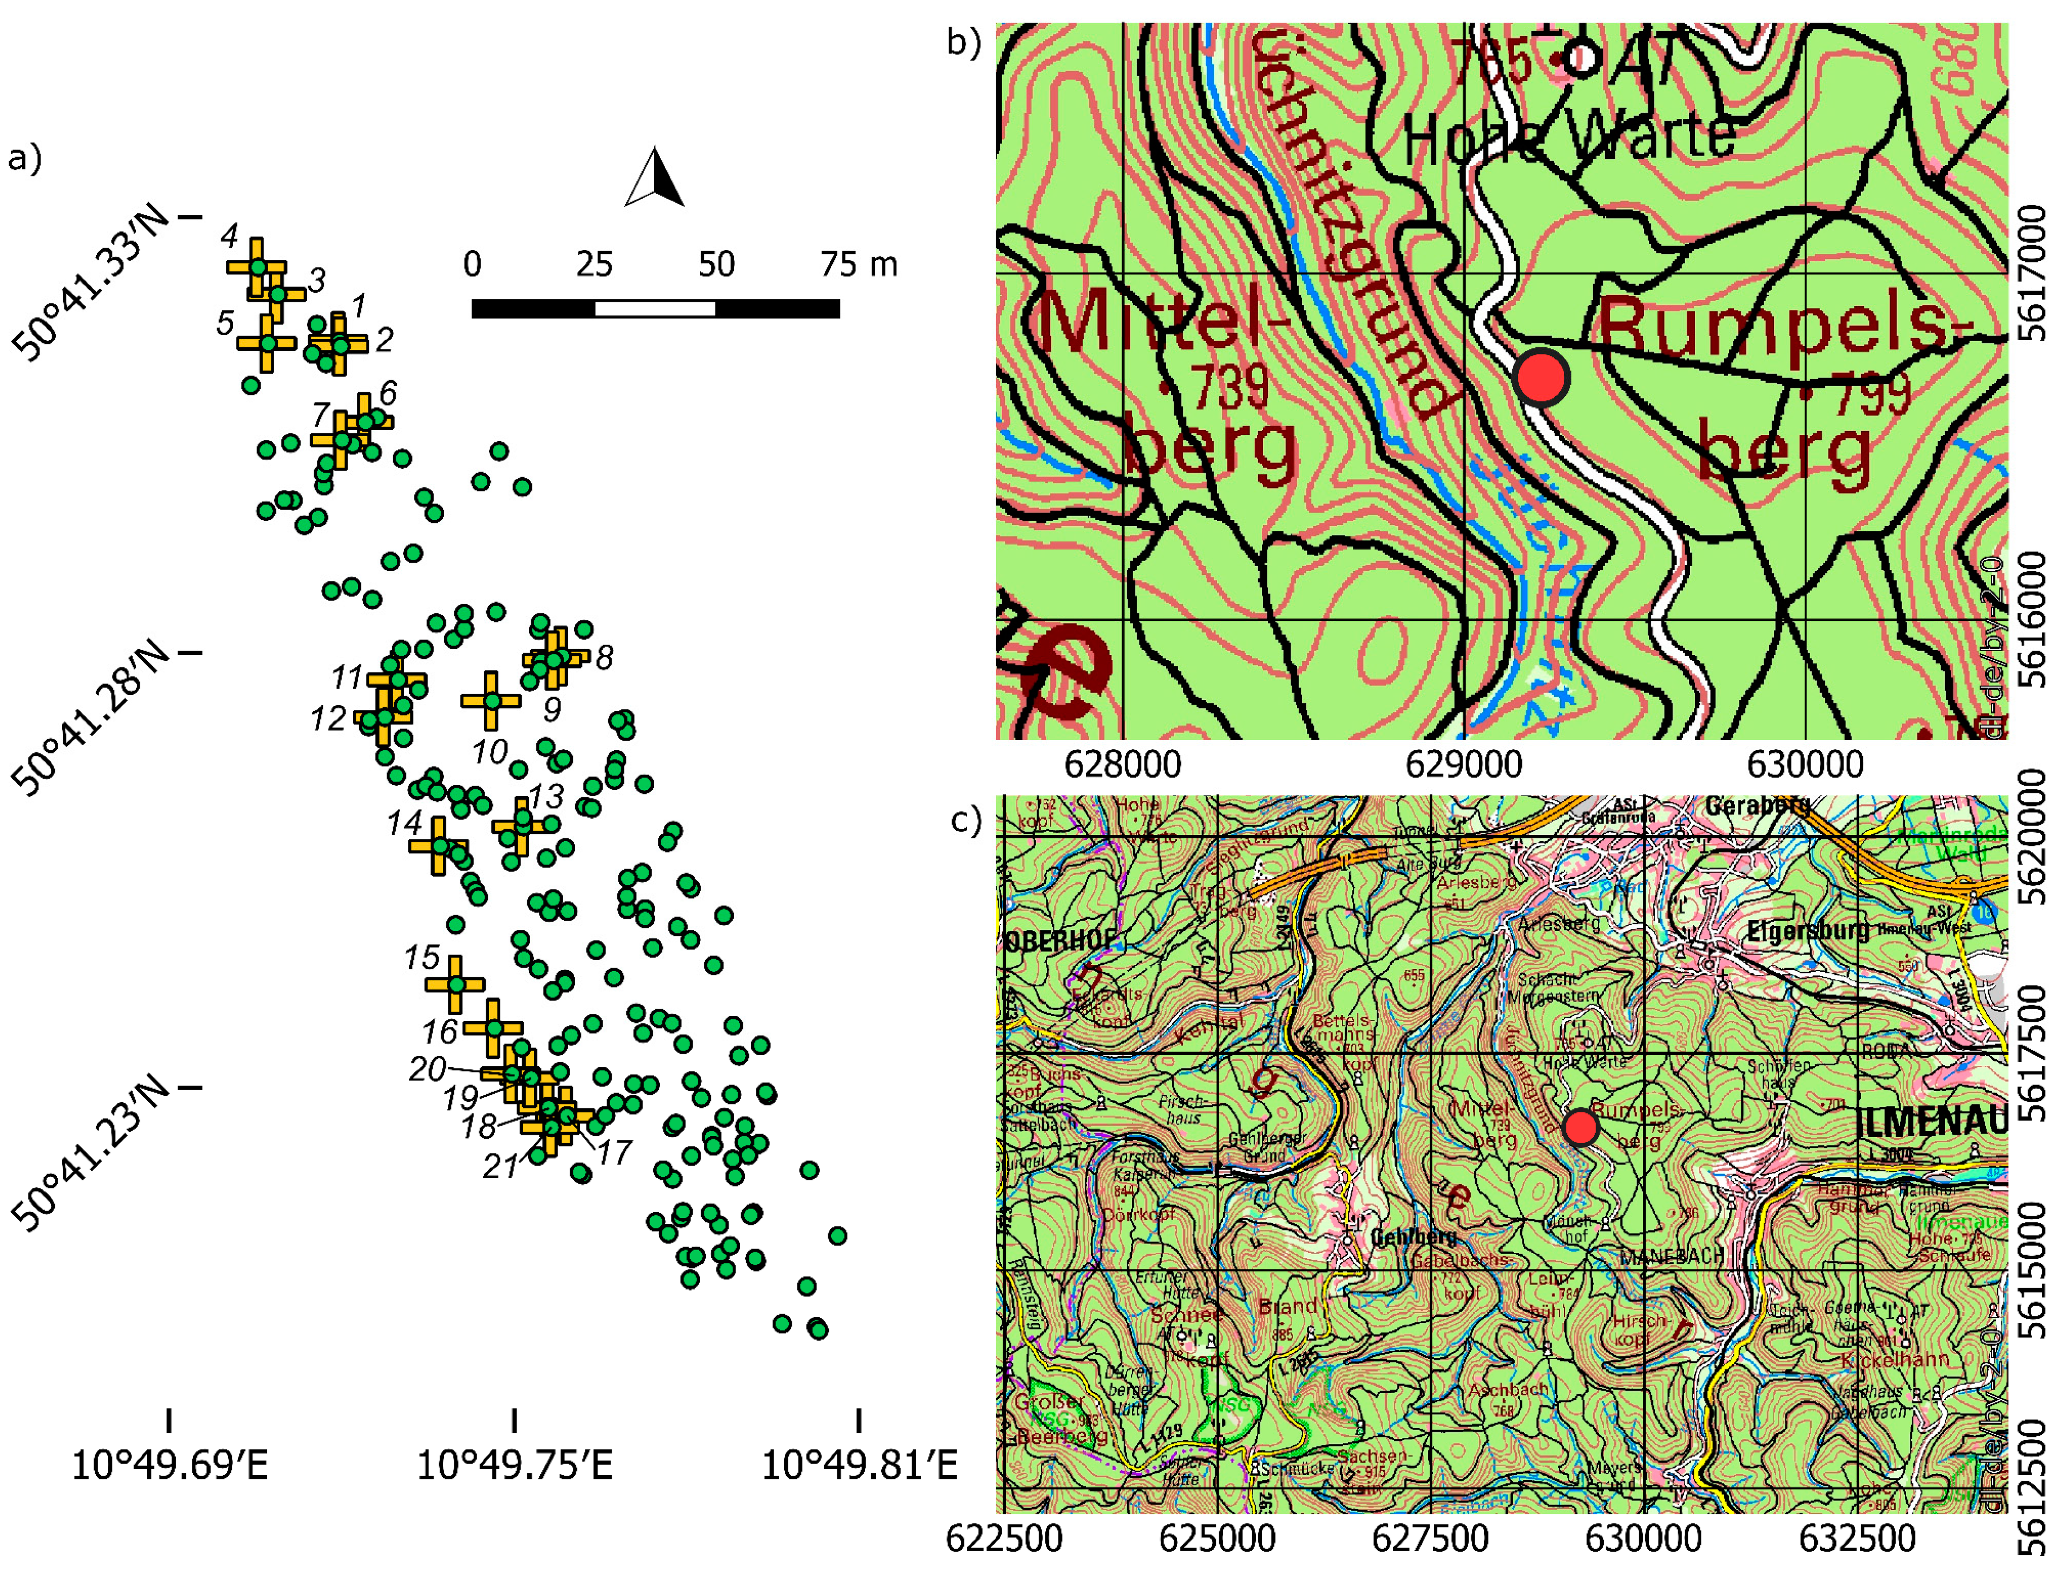
2.1. Plant Material

Cones from 21 trees were collected in March 2017 in a pure Norway spruce stand located in the Thuringian forest at ~770 m a.s.l. (above sea level), where the forest area is dominated by pure spruce stands. This sample represents a partial mast year, with seed ripening in 2016. The mother-trees were selected in three groups representing the northern and south-eastern edges, as well as the central part of the stand, respectively. Cones and seeds were collected, kept and studied separately for each mother tree representing half-sib family samples from open pollination. Preceding the cone collection, 200 adult trees in this stand were initially genotyped at nuclear genomic microsatellite or genomic simple sequence repeat (SSR) markers (gSSRs) and expressed sequence tag SSR markers (EST-SSRs) [17] including the 21 mother trees, the seeds of which were used here to study germination and infer potential pollen donors (Figure 1a). The stand is considered autochthonous and used for harvesting seeds for forest reproductive material. Stand location and topographic features of the region are displayed in Figure 1b,c. Trees within the stand are mainly characterised by a narrow to intermediate crown shape with plate-brush or plate-like secondary branching pattern [17]. Narrow crowned trees with plate-like branching are typical high elevation morphotypes.

2.2. Observation of Germination

The collected cones were dried to extract the seeds, which were manually cleaned and then stored at 8 °C. Germination was observed for 84 seeds per tree. Seeds were put on top of moist paper tissue in Petri dishes that were subdivided in segments for single-seed-identification. During the 10-day observation period, the seeds were kept moist under ambient conditions in the laboratory. Germination was assessed daily, where each seed was scored whether (1) its seed coat was dehisced, (2) the seed coat was dehisced and the root tip was visible, (3) the root had started to elongate or (4) the seed showed no signs of germination. For each tree 20 seeds were randomly selected for genotyping. They were used for DNA-extraction either when the root emerged or after 10 days without germination. If a selected seed was empty and could not be used for extraction, another random seed was used. For five trees less than 20 seeds could be used for DNA extraction due to the high proportion of empty seeds. Nevertheless, all seeds prepared for DNA extraction could be genotyped successfully.

2.3. DNA Extraction and Genotyping

For DNA extraction, seeds were dissected to isolate embryo and megagametophyte and, then, to genotype them separately. This enables us to determine separately individual paternal and maternal contributions to the genotype of the embryo. DNA extraction was carried out according to the manufacturer’s protocol using the DNeasy 96 Plant Kit (Qiagen, Hilden, Germany) with prior freezing of embryo or megagametophyte tissues in liquid nitrogen and grounding them in a MM300 ball mill (Retsch, Haan, Germany) for 2 min at 30 Hz.
Genotyping of 200 adult trees (including the 21 trees from which seed samples were taken and the potential pollen donors) at gSSRs and EST-SSRs had been performed by Caré et al. [17]. Here, embryos and corresponding megagametophytes were genotyped accordingly at the same seven gSSRs [19,20] and three out of four EST-SSRs [21,22] (Table S1). The EST-SSR PaGB8 was excluded to increase parent–offspring assignment accuracy, because this marker often had a stuttering pattern, which may cause misgenotyping that negatively affects assignment probability. PCR reactions were performed the same way as for the adult trees in 14 μL total volume containing 1 μL of 1:10 diluted DNA mixed with 1X reaction buffer B (Solis BioDyne, Tartu, Estonia), 2.68 mM MgCl2, 178.57 μM for each dNTP, and one unit of HOT FIREPol® (Solis BioDyne, Tartu, Estonia) Taq polymerase. Multiplex combinations of primer pairs and their concentrations are provided in Table S2. Reactions were run in a Biometra TProfessional Basic thermocycler (Analytic Jena AG, Jena, Germany) using a touch-down PCR protocol (Table S3) followed by fragment separation on an ABITM 3130xl Genetic Analyzer (Applied Biosystems, Foster City, CA, USA) with the size standard GeneScanTM500 ROXTM (Applied Biosystems, Foster City, CA, USA) and peak calling using GeneMapperTM v4.1 software (Applied Biosystems, Foster City, CA, USA).

2.4. Statistical Analysis

Quality control genotyping and allele calling were validated by inspecting whether at least one allele found in the embryo matched the allele in the corresponding megagametophyte and that this allele matched at least one allele in the respective mother tree. The haplotype of male gametes in the pollen contributing to the formation of the seed was inferred by subtracting the megagametophyte haplotype from the corresponding embryo genotype. In rare cases (<1%), when no data for the megagametophyte were available, and the embryo had both alleles in common with the mother tree the male contribution could not be determined. Then, both alleles were considered as potential male contribution in the assignment analysis. Not excluding these cases from the analysis as undefined missing data help to better resolve the number of potential pollen-donors. One tree was discarded from the analysis of potential pollen donors, as it was successfully genotyped at only five loci.
Individual observed heterozygosity (H) of the embryo was calculated as a proportion of heterozygous loci among all loci genotyped. Fixation index (FIS), which was used as a proxy for inbreeding coefficient, its corresponding p-value after 50,000 permutations, mean observed (Ho) and expected (He) heterozygosity over all loci were calculated for each half-sib family and for the entire pooled sample using Arlequin 3.5.2.2 [23]. To account for uncertainties from unequal sample size the standard deviation of the mean Ho from 10,000 rarefaction resampling to n = 10 was calculated. The He within the stand and the seed lot was also calculated and compared to the half-sib families Ho to estimate potential loss of heterozygosity across generations. Visualisation of dissimilarities among embryos and also adult trees that represent potential pollen donors in the stand was performed by principal coordinate analysis (PCoA) using the R-package ape v.5.2 [24] and pairwise Hamming distances [25] calculated using the R-package poppr v.2.8.1 [26,27], which can be regarded as genetic distance based on allelic differences between individual embryos or adult trees. Outbreeding rate for each half-sib family was calculated as the number of seeds without an assigned pollen donor in the stand divided by the total number of genotyped seeds. Germination percentage was calculated as the percentage of germinated seeds from the initial 84 seeds. To assess association between genotypes and germination percentage and time, linear regression was applied considering the germination time or percentage as a response variable and genetic indices as fixed effect.
Effective population size (Ne) was estimated using the R-package NB v.0.9 [28] based on a maximum likelihood approach [29] from the change in allele frequencies between the parent and offspring generation. Since each offspring sample represents a half-sib family, differences between the maternal genotypes and corresponding Ho could influence the estimated Ne. Therefore, the final Ne and its regression against the germination percentage were calculated based on the haploid pollen contribution to the embryo genotypes, giving an estimate of the effective pollen population size (Ne (P)). Less than 20 seeds were available for genotyping and subsequent analysis for five families, therefore the Ne (P) of these half-sib families with fewer full seeds might be negatively biased. Rarefaction resampling to a sample size of ten with replacement and recalculating Ne (P) 10,000 times was used to adjust to uneven sample size. Hence, the mean rarefied effective pollen population size (Ne (P; r)) was used as the unbiased estimator. Moreover, half-sib family 1 was excluded from subsequent calculation of the regression due to the very low sample size.
The triadic likelihood relatedness (r) estimate [30] was calculated using the R-package related v.0.8 [31] as a measure of pairwise relatedness among embryos and as a mean relatedness within half-sib families calculated by averaging pairwise r-values for all embryos from the same half-sib family. Linear regression of relatedness against the germination percentage was calculated. To verify relatedness estimates and the linear regression, r-values were additionally calculated by the efficient method-of-moment [32] and dyadic likelihood estimates [33] and processed as described above. Further, each algorithm was run with different reference allele frequencies. As all the r-estimators used here rely on the sample allele frequency, the sensitivity of the r-estimates was assessed by using different allele frequency estimates. First, the default setting was used which calculates population allele frequencies from the individuals of which the r-values should be estimated, this corresponds to only the embryo genotypes. In this default calculation the maternal alleles are overrepresented in the allele frequency estimates, because in each half-sib family half the alleles originate from the corresponding maternal tree. This can reduce diversity of the estimated population allele frequency compared to estimates made from stand data, and thus might influence the pairwise r-estimates. Therefore, as a second calculation, the frequencies were estimated from the combined embryos and adult trees in the stand and, third, based on the adult trees only. After evaluating the robustness of the method, the rarefied triadic likelihood relatedness (r(r)) estimate was calculated by rarefaction resampling to a sample size of ten with replacement and recalculating the within family mean over 10,000 replications. As the mean relatedness is calculated from the pairwise estimates, which are largely unaffected by sample size, rarefaction was used to assess the variation of the mean estimate due to different combinations of seeds in a single half-sib family. Also, regression was calculated excluding family 1. For both regressions of r(r) and Ne (P; r) with the germination percentage as response, respectively, the assumption of normality and homogeneity of the residual variances was checked. Box–Cox transformation was applied to validate results, if one of the assumptions was not met.
Resampling with replacement was chosen in order to take into account also families with lower sample size. However, this inevitably implicates drawing identical genotypes for the calculation, which could lower the diversity of the rarefied sample, thus leading to lower estimates of Ne (P; r). Therefore, the rarefaction without replacement was additionally calculated. For the estimate of mean r-values it is however irrelevant weather it is calculated by the mean of the original pairwise values or by resampling, either with or without replacement, as the results are identical. Resampling in this case is an approximation of the actual mean value, with increasing iterations approaching it. Yet, the resampling gives additional information on the standard deviation.
Potential pollen donors were assigned by two approaches: (1) a match/no-match comparison between genotypes and (2) using CERVUS v.3.0.7 software [34].
First, we compared the paternal haplotype in the respective embryo to all corresponding genotypes in the sample population at all genotyped markers. Those trees that had no mismatch with the inferred pollen haplotypes were considered as potential paternal trees. To account for potential genotyping errors, a less strict assignment was also performed by allowing a single mismatch only for one of the markers. Trees with only a single mismatch were considered as potential pollen donors, if no other trees with complete matching genotype were found.
Second, CERVUS v.3.0.7 was used with default settings to assign paternal parents. Unfortunately, this programme cannot use paternal haplotype data inferred from the embryo genotypes directly. We solved this problem by forcing the programme to use specifically only these data by replacing maternal haplotypes in diploid embryo genotypes by dummy alleles that are not present in the studied sample. All embryos had the same dummy “maternal” allele at each locus that was also present in only one artificially added dummy mother tree. This approach allowed us to identify the most likely paternal trees for embryos based on the paternal haplotype of these embryos. The cases, in which a paternal tree was also a true maternal parent of an embryo, represented tentative self-pollination.
Pollen dispersal can be described by the distance and geographic direction between the assigned potential pollen donor and the mother tree. Geodesic distances were based on the WGS 84 (EPSG: 3857) point coordinates for trees and calculated using the R-packages rgdal v.1.3-6 [35] and geosphere v.1.5-7 [36]. The direction of pollen dispersal was calculated as the angle between the point coordinates of the maternal tree and the putative pollen donor. For graphical representation all mother trees were projected to a single point, and direction and distance to all putative pollen donors was plotted with the R-package plotrix v.3.7-4 [37]. Dispersal distance was also visualised as frequency histogram in 10-m distance classes. In cases where no potential pollen donor could be identified without mismatch and more than one potential pollen donor was identified by accepting a single mismatch, the tree with the shortest distance to the mother tree was considered as the most likely candidate pollen donor. In the CERVUS assignment, two confidence thresholds of 95% (strict) and 80% (relaxed) were considered.
Simulations were used to compare the observed distances and directions of pollen-dispersal with those expected under complete random mating without assumptions. The 21 mother trees were computationally resampled 20,000 times, pollen donors from the studied stand were randomly assigned, and distances and angles were calculated. Distributions of simulated and observed distances and angles were compared by a two-sample Kolmogorov-Smirnov test. Both the strict and relaxed assignments with 80% confidence for CERVUS and allowance of one mismatch in the genotype matching approach were used, respectively.

3. Results

Germination percentage varied considerably among half-sib families (Table 1). From 3.6% to 61.9% of the 84 seeds per tree showed at least a dehisced seed coat after 10 days, with an average of 38.5% for all seeds. Ho and He ranged from 0.517 to 0.713 and from 0.500 to 0.640 in half-sib families (Table 1). FIS-values were negative (−0.006 to −0.122) in all half-sib families except for family 15 (0.024) and significant in 11 families (Table 1). Comparing the He (0.724) estimated based on all 200 trees in the stand to the Ho (0.613) of the pooled seed sample, seeds showed a considerable loss in heterozygosity. In addition, He (0.696) compared to Ho of the pooled seed sample (0.607) showed lower heterozygosity. Ne (P; r) varied from 1.1 to 3.7 in the half-sib families and equalled 85.3 for the pooled genotyped seeds (Table 1). The within families mean rarefied triadic likelihood r(r)-estimates varied from 0.11 to 0.33, with a combined mean of 0.22 (Table 1). For estimating relatedness within the half-sib families two related methods and two additional population allele frequency estimates were investigated to assess robustness of the reported values. The calculations of the triadic likelihood estimate based on allele frequencies of combined embryo and stand data and stand-only data produced similar and slightly higher mean r-values of 0.22 and 0.24, respectively, compared to the default calculation using only the embryo data. Using the same algorithm with the different reference allele frequencies resulted in significantly correlated estimates. Comparison of different algorithms using the same reference allele frequencies demonstrated also significant correlations between them, except for comparisons of the efficient method-of-moment estimates based on the stand allele frequencies to the two other estimates (Table S4).
A highly significant (p = 0.005) negative linear relationship was found between r(r) (Figure 2a), as well as a highly significant (p = 0.003) positive relationship between Ne (P; r), calculated with replacement, and germination percentage in the half-sib families. This relationship was still significant (p = 0.02) for the rarefied calculation without replacement (Figure 2b). Assumptions of normality and homogeneity of variances of the residuals were tested by QQ-plots (Figure S1) and the Breusch-Pagan [38] test, respectively. Residuals met the assumption for Ne (P; r), but for r(r) the Breusch-Pagan test indicated heterogeneity of variances. To confirm the regression result, it was recalculated with a Box-Cox transformation of r(r), which met both the assumption of normality and variance homogeneity of the residuals. A significant relationship with germination rate was confirmed with an adjusted R2 of 0.24 (p = 0.015). Results of the unrarefied values are presented in Figure S2. A significant negative relationship was confirmed for the original data with all methods for calculating r [30,32,33] and applying the described population reference allele frequency estimates, except for the efficient method-of-moment algorithm based on the stand only data (Table S5). Linear regressions between the time and percentage of germination against Ho at typed loci were insignificant. As well as no significant influence of FIS on the germination percentage or the dispersal distance of assigned pollen donors was found. Finally, no significant relationship was found between outbreeding and germination rates.
The PCoA plot demonstrates variability of genetic distances between embryos within half-sib families, as well as variability of genetic distance between half-sib families and the stand (Figure S2). Highest within family distance between embryos was found in families 2, 10, 16, 18, and 19, while others showed less genetic distance, especially in families 7 and 17. Families 14, 15, 16, 19, and 20 represented the stand relatively well in terms of variation and coverage, whereas families 2, 4, 11, 12, and 21 showed more differences to the overall stand. Nevertheless, samples of half-sib families always overlapped partially with the stand data (Figure S3).
For the combined results of the assignments without and with one mismatch together the proportion of immigrant pollen was 75.8% with 92 assignable local pollen donors in 375 genotyped seeds. Three self-pollination events were found among 375 mating events in the assignment without and with one mismatch, leading to an estimated self-fertilisation rate s of 0.8% (3/375). One potential pollen donor could be assigned with no mismatch for 32 unique mating events. This corresponds to 8.5% of all genotyped seeds or an estimated 91.5% of immigrant pollen, respectively. One self-pollination event without mismatch was detected for 32 mating events (s = 1/375 or 0.3%) (Table 1). Dispersal distance for outcrossing ranged from 3 to 138 m with a mean of 33 m. Potential pollen donors could be assigned for additional 60 seeds by accepting a single mismatch. For 18 of these seeds, more than one potential pollen donor was assigned. Considering only mating with the shortest distance between seed parent and pollen donor for these 18 cases, the mean dispersal distance was 66 m (ranging from 5 to 161 m) for outcrossing. Pollen dispersal was mainly realised within 10 m (47%) and 10–20 m (19%) distances when the strict assignment was used. If mating assignments with a single mismatch are also included and considering among multiple possibilities only events with the shortest distance between parents, pollen dispersal within 10 (18%) and 10–20 (12%) m distances was still the most frequent. A more homogeneous distribution of dispersals was observed for more distant classes, up to the 130–140 m class. In the simulated random mating without any assumptions, dispersal distances reached up to 250 m with the far-reaching upper tail representing very rare dispersal events. Most simulated dispersal events (28% in total) occurred within 30 to 60 m distance classes. Shorter distance classes were much less represented for dispersal events than in the observed data (Figure 3a). Dispersal directions were mainly from northern pollen donors southward. Pollen flow north to north-westwards also occurred, but less than the southward dispersal, and distances were much shorter than the possible distances under the simulation. Almost no pollen came from north eastern to south eastern trees (Figure S4a). These directions represent only the observable pollen dispersal based on the genetic assignment; pollen flow from outside this stand is unknown in terms of distance and direction.
Candidate pollen donors were assigned for 112 seeds by CERVUS with relaxed confidence, giving an immigrant pollen estimate of 70.1%. They included 33 assignments with the strict confidence threshold. For eight seeds their true mother tree was assigned as candidate pollen donor, meaning eight self-pollination events for 375 mating events in total (s = 8/375 or 2.1%) (Table 1). In total, 30 assignments were detected by both assignment methods, CERVUS and comparison, both with the less strict criteria. Most dispersal occurred within distances up to 20 m in assignments detected by CERVUS with either relaxed or strict criteria. The distance class up to 10 m comprised 19.6% and 39.4% of assigned mating events under the strict and relaxed criteria, respectively. For the 10–20 m distance class 18.8% and 25.2% of assigned mating events were observed, respectively. The mean distance between seed parent and putative pollen donor was 47 m under the strict criterion, but 169 m under the relaxed one (Figure 3b). Long distance mating events occurred mainly between a pollen donor located south and the southeast mother tree, but some pollen came from the northern pollen donors. The assignments by CERVUS also included pollen donors from northeast and southeast (Figure S4b), although again gene flow distances and directions for outside pollen could not be characterised.
Distributions of the simulated distances and directions (angles) differed significantly (p < 0.0001) from the observed distributions, except for the distribution of pollen dispersal directions (angles) in the CERVUS assignments with relaxed confidence threshold. Estimates of external pollen from the “putative maladapted gene pool” accounted for 70.1–91.5% of viable embryos, depending on the method of assignment.

4. Discussion

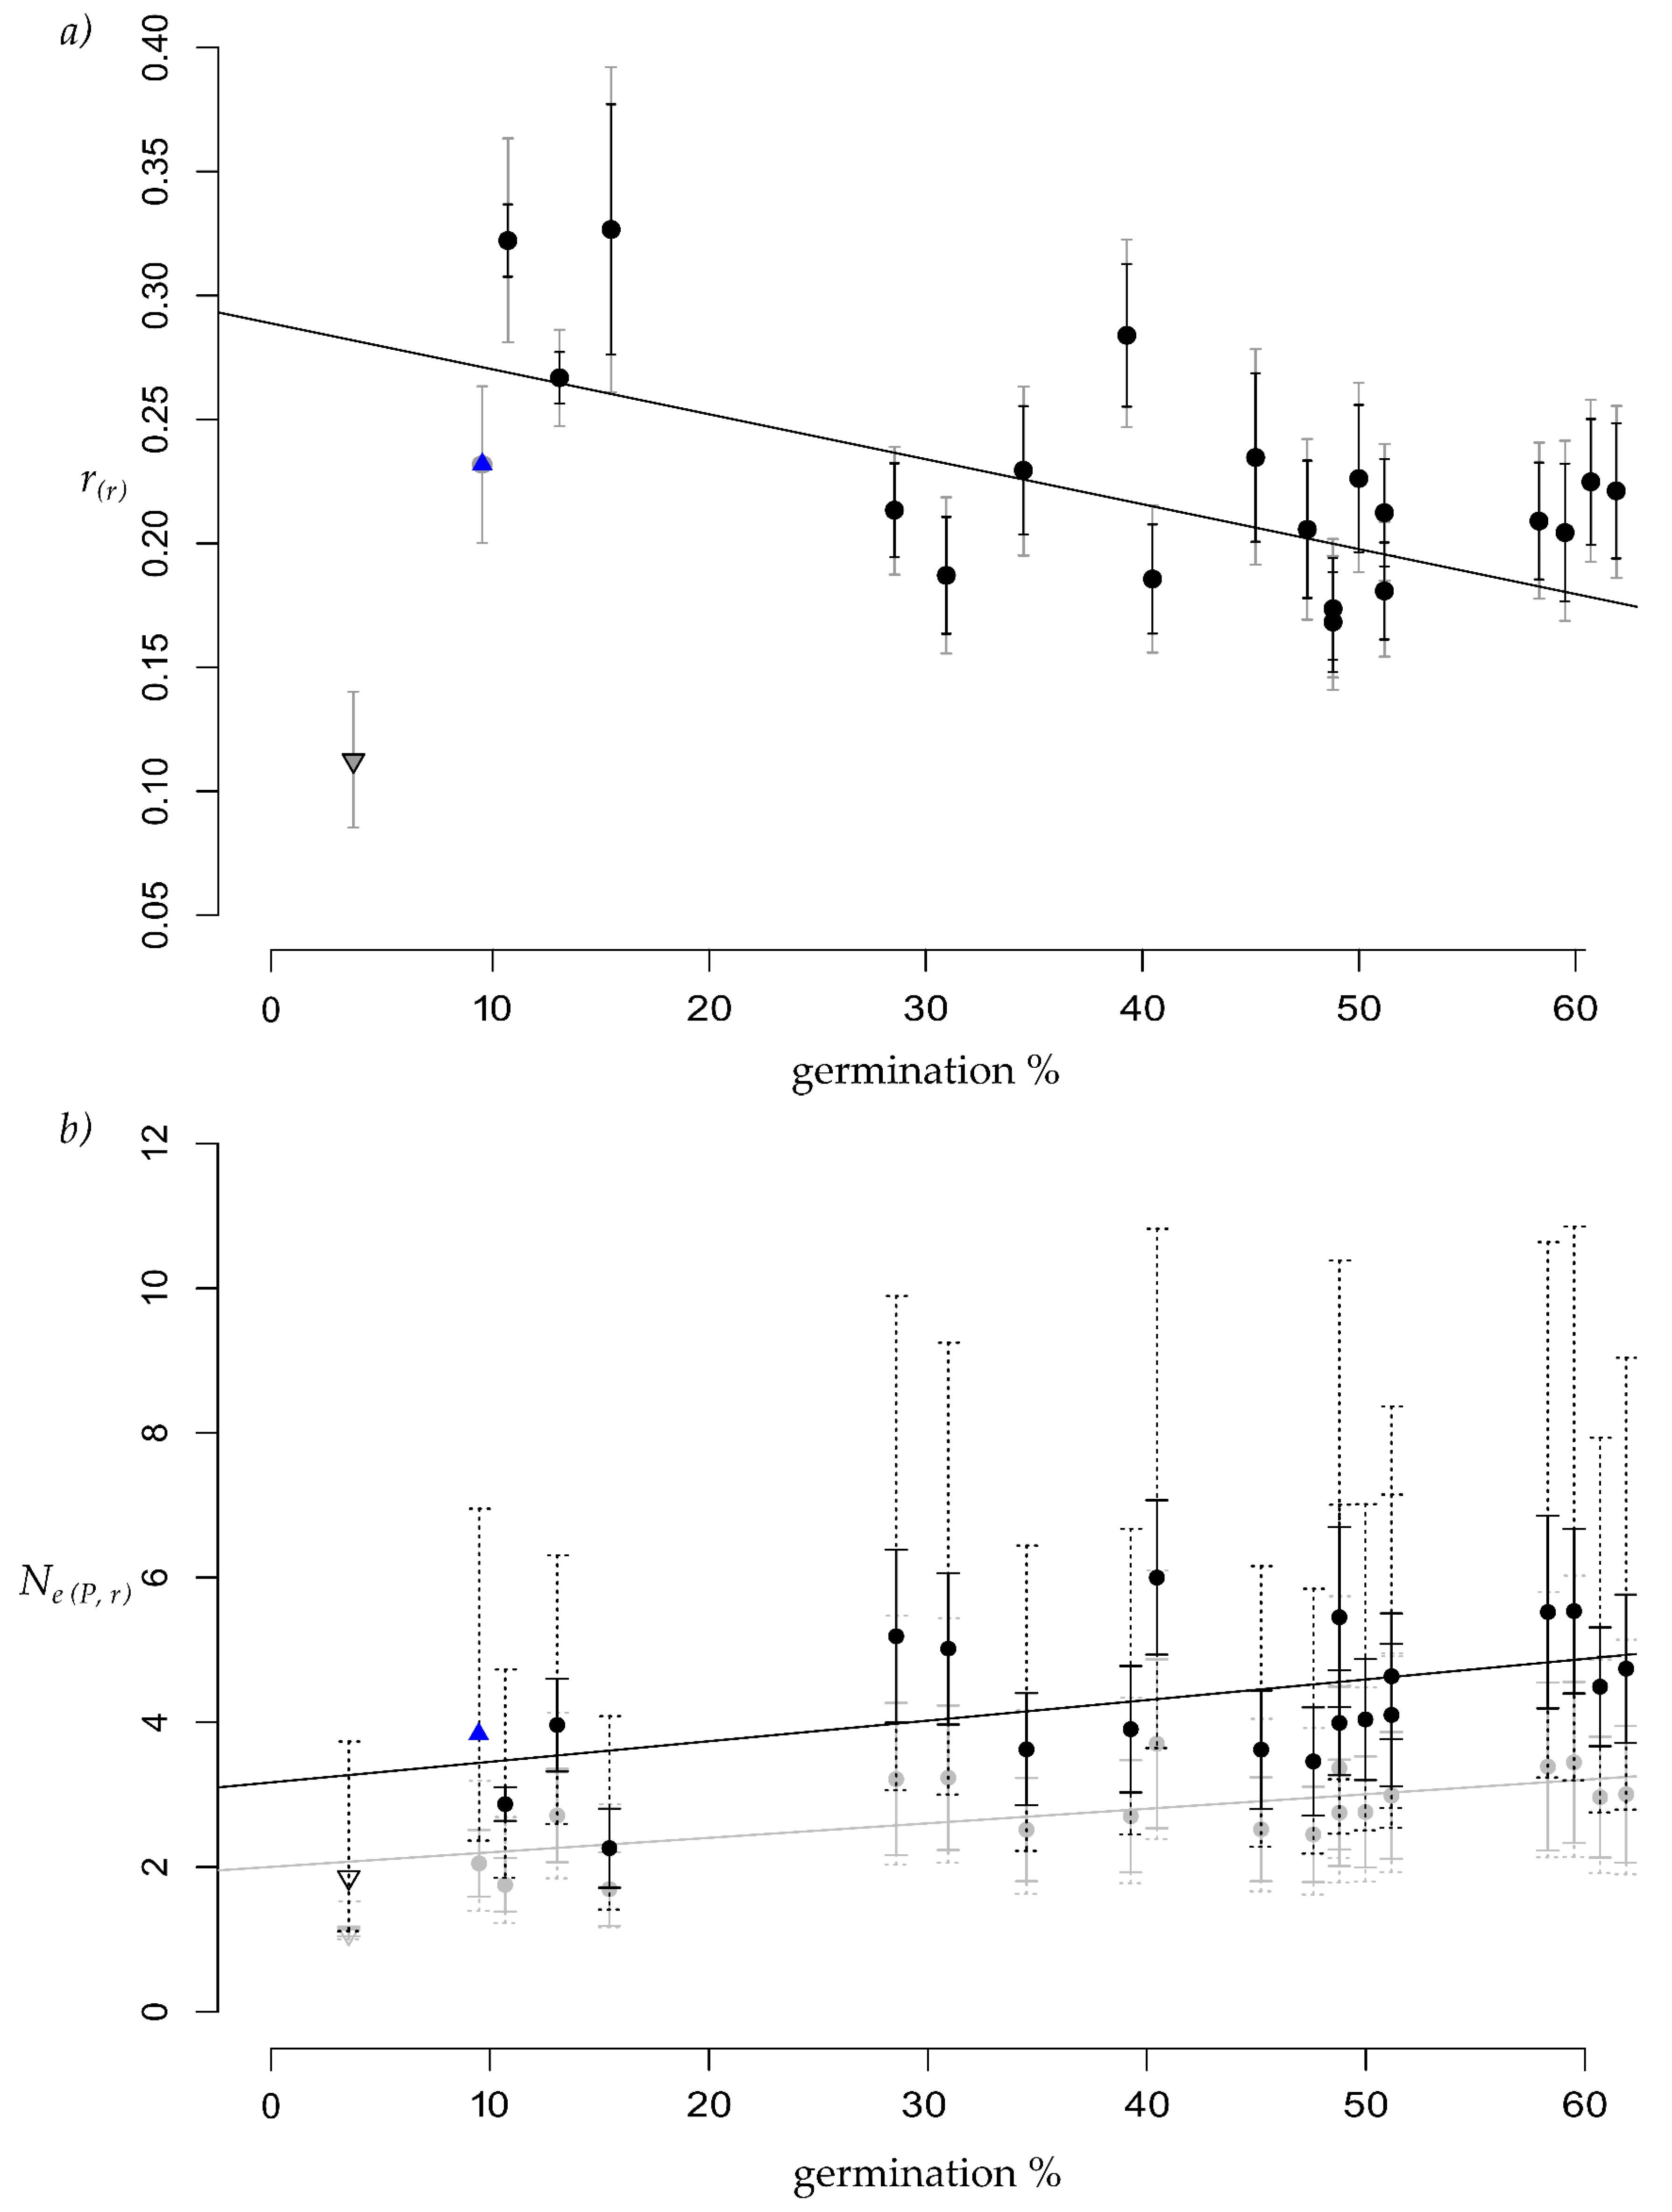
4.1. Germination and Relatedness

The observed mean germination percentage of 38.5% was relatively low compared to typical commercially available seeds. Although, reported germination percentage may greatly vary depending on year, location, and tree, germination is drastically reduced in selfed seeds [11,39]. The seeds used in our study were not commercially processed, and, thus, empty seeds were still present in the sample. Among seeds from five half-sib families, more than 75% were empty, and fewer than 20 full seeds were available for analysis. Factors that may increase the formation of empty seeds are, amongst others, lack of or insufficient pollination and unsuitable environmental conditions during seed maturation. Nonetheless, inbreeding is the main cause of empty seeds and attributed to increased homozygosity and resulting expression of deleterious recessive alleles, as shown for different spruce species [10,39,40,41,42] and other conifers [43,44,45]. The higher proportion of empty seeds is thus likely caused by selfing and inbreeding but cannot be confirmed by genetic analyses because postzygotic abortion leaves no material to study.
An increase in r(r) and Ne (P; r) estimates within the half-sib families revealed significant negative and positive associations with the germination percentage, respectively. Half-sib families with the highest proportion of empty seeds and low germination, showed Ne values below, and within family r-values above the mean (Figure S2). Because of the high proportion of empty seeds, it was not possible to achieve the sample size of 20 genotyped seeds in these families. Therefore, rarefaction methods were used to calculate unbiased estimators. In contrast, no significant association of diversity (Ho) and fixation index (FIS) with the germination time and percentage were detected. Although, a slight trend of positive correlation of higher Ho with germination percentage was observed, it was insignificant. Only in four families a slightly increased homozygosity was found within the half-sib families, when Ho and He were compared. For the complete seed lot, increased homozygosity was more pronounced. Distribution of samples in the PCoA also demonstrates a restricted genetic diversity and higher similarity within half-sib families. Genetic load could not be accurately determined because only viable embryos were screened. Thus, genetic diversity parameters in half-sib families with high proportion of empty seeds could be overestimated. However, negative associations of r(r) were observed with Ne (P; r) and germination. The Ne (P; r) estimates, however, should be interpreted with caution, as this method is strongly influenced by sample size. A sample size of 20 and subsequent reduction to 10 for the rarefaction for estimating population size from genotypic data is quite low and combined with a relative high uncertainty of the estimate given by the confidence interval. Higher confidence for the present data is unlikely be achieved with 20 true samples for each family, because even for the complete seed lot of 375 samples, the confidence interval of the estimated total pollen population size was still very broad −38% and 87% of the estimate, respectively.
To explain differences between the half-sib families in Ho, r(r) and Ne (P; r), different levels of inbreeding are conceivable, but could not be confirmed. The differences can probably be explained by a limited number and/or diversity of the pollen donors contributing to the single half-sib-families. No family structure was found in the stand: differentiation and relatedness between adult trees did not depend on geographic distance. The pooled progeny was fathered to a large extent by immigrant pollen (70.2% to 91.5% dependent on the method), likely from the surrounding planted stands. Thus, increase relatedness estimates cannot be explained only by mating between close relatives. Low diversity of the pollen donors can also result in lower genetic diversity, higher genetic similarity, and increased homozygosity in a half-sib family. This could also lower population size estimates and increase relatedness estimates in the progenies. Thus, a restricted number of, or lower genetic diversity amongst pollen donors likely affected the offspring of a single tree. This is also a plausible explanation for the lower germination, as fitness and variability are associated with genetic diversity in forest trees [46]. Such correlation between poorer seed performance and restricted population size was previously detected in other conifers [47,48]. For example, increased formation of empty seeds and lowered germination rate dependent on population size had been found in artificial Douglas-fir (Pseudotsuga menziesii [Mirbel] Franco) stands of different size [47], and decreased germination and seedling performance dependent on population size were observed in the tropical pine Pinus chiapensis [Martínez] Andresen [48]. In both cited studies the population size was calculated from census data of the parental population, whereas here it was estimated from genetic data of the pollen haploid contributions to the embryos. We showed that although the studied stand was located within a relatively large spruce area with a supposedly large census, the effective pollen population size varied in the families and affected their germination percentage.
In future studies the effect of pollen immigration on fitness traits, such as germination percentage, should be investigated in detail. The overall low germination performance in combination with the detected high proportion of immigrant pollen of likely different origin from the planted surrounding stands could hint to outbreeding depression. The reduction in fitness traits is caused by cross fertilisation of genetic distant gene pools, when the breakdown of adaptive gene complexes outweighs positive introgression effects [49]. Outbreeding depression was shown to reduce fruit set and seedling number in the flowering plant Acmispon glaber [Vogel] Brouillet. High seed abortion in cross- and naturally pollinated seeds of Pinus sylvestris L. was also explained by outbreeding depression [50]. Similar to inbreeding depression, outbreeding depression also has a long-term effect as revealed by poorer performance of growth traits in Abies sachalinensis [F. Schmidt] Mast. progenies [51]. Neverteless, we could not confirm a significant relationship of the half-sib families’ individual outbreeding rate and the germination percentage.
However, the overall Ne(p)-estimate of 85.3 in the pooled seed lot can be interpreted as large enough to contain enough genetic diversity to avoid genetic drift. It is comparable to similar estimates in other studies of P. abies [52] and conifers [53]. A good representation of the stand in the pooled seed lot can also be seen in the PCoA distribution based on the selectively neutral markers (Figure S2), where the pooled seed lot overlaps with the stand samples. Genetic differentiation estimated using selectively neutral markers was in general relatively low between different P. abies stands [15]. It was also found in German stands including the one studied here [17]. However, low genetic differentiation at neutral markers did not reflect differentiation at potentially adaptive candidate genes, for which variation was associated with different adaptive morphotypes [4]. Thus, the high amount of immigrant pollen contributing to at least 70% of the offspring can change allele frequencies at putative adaptive loci. Population structure of the stand was already studied in Caré et al. [17], and neither correlation of genetic differentiation with distance among individuals nor significant within population genetic structure were found. Here, we studied correlation of r with distance among individuals, and no significant correlation was found.

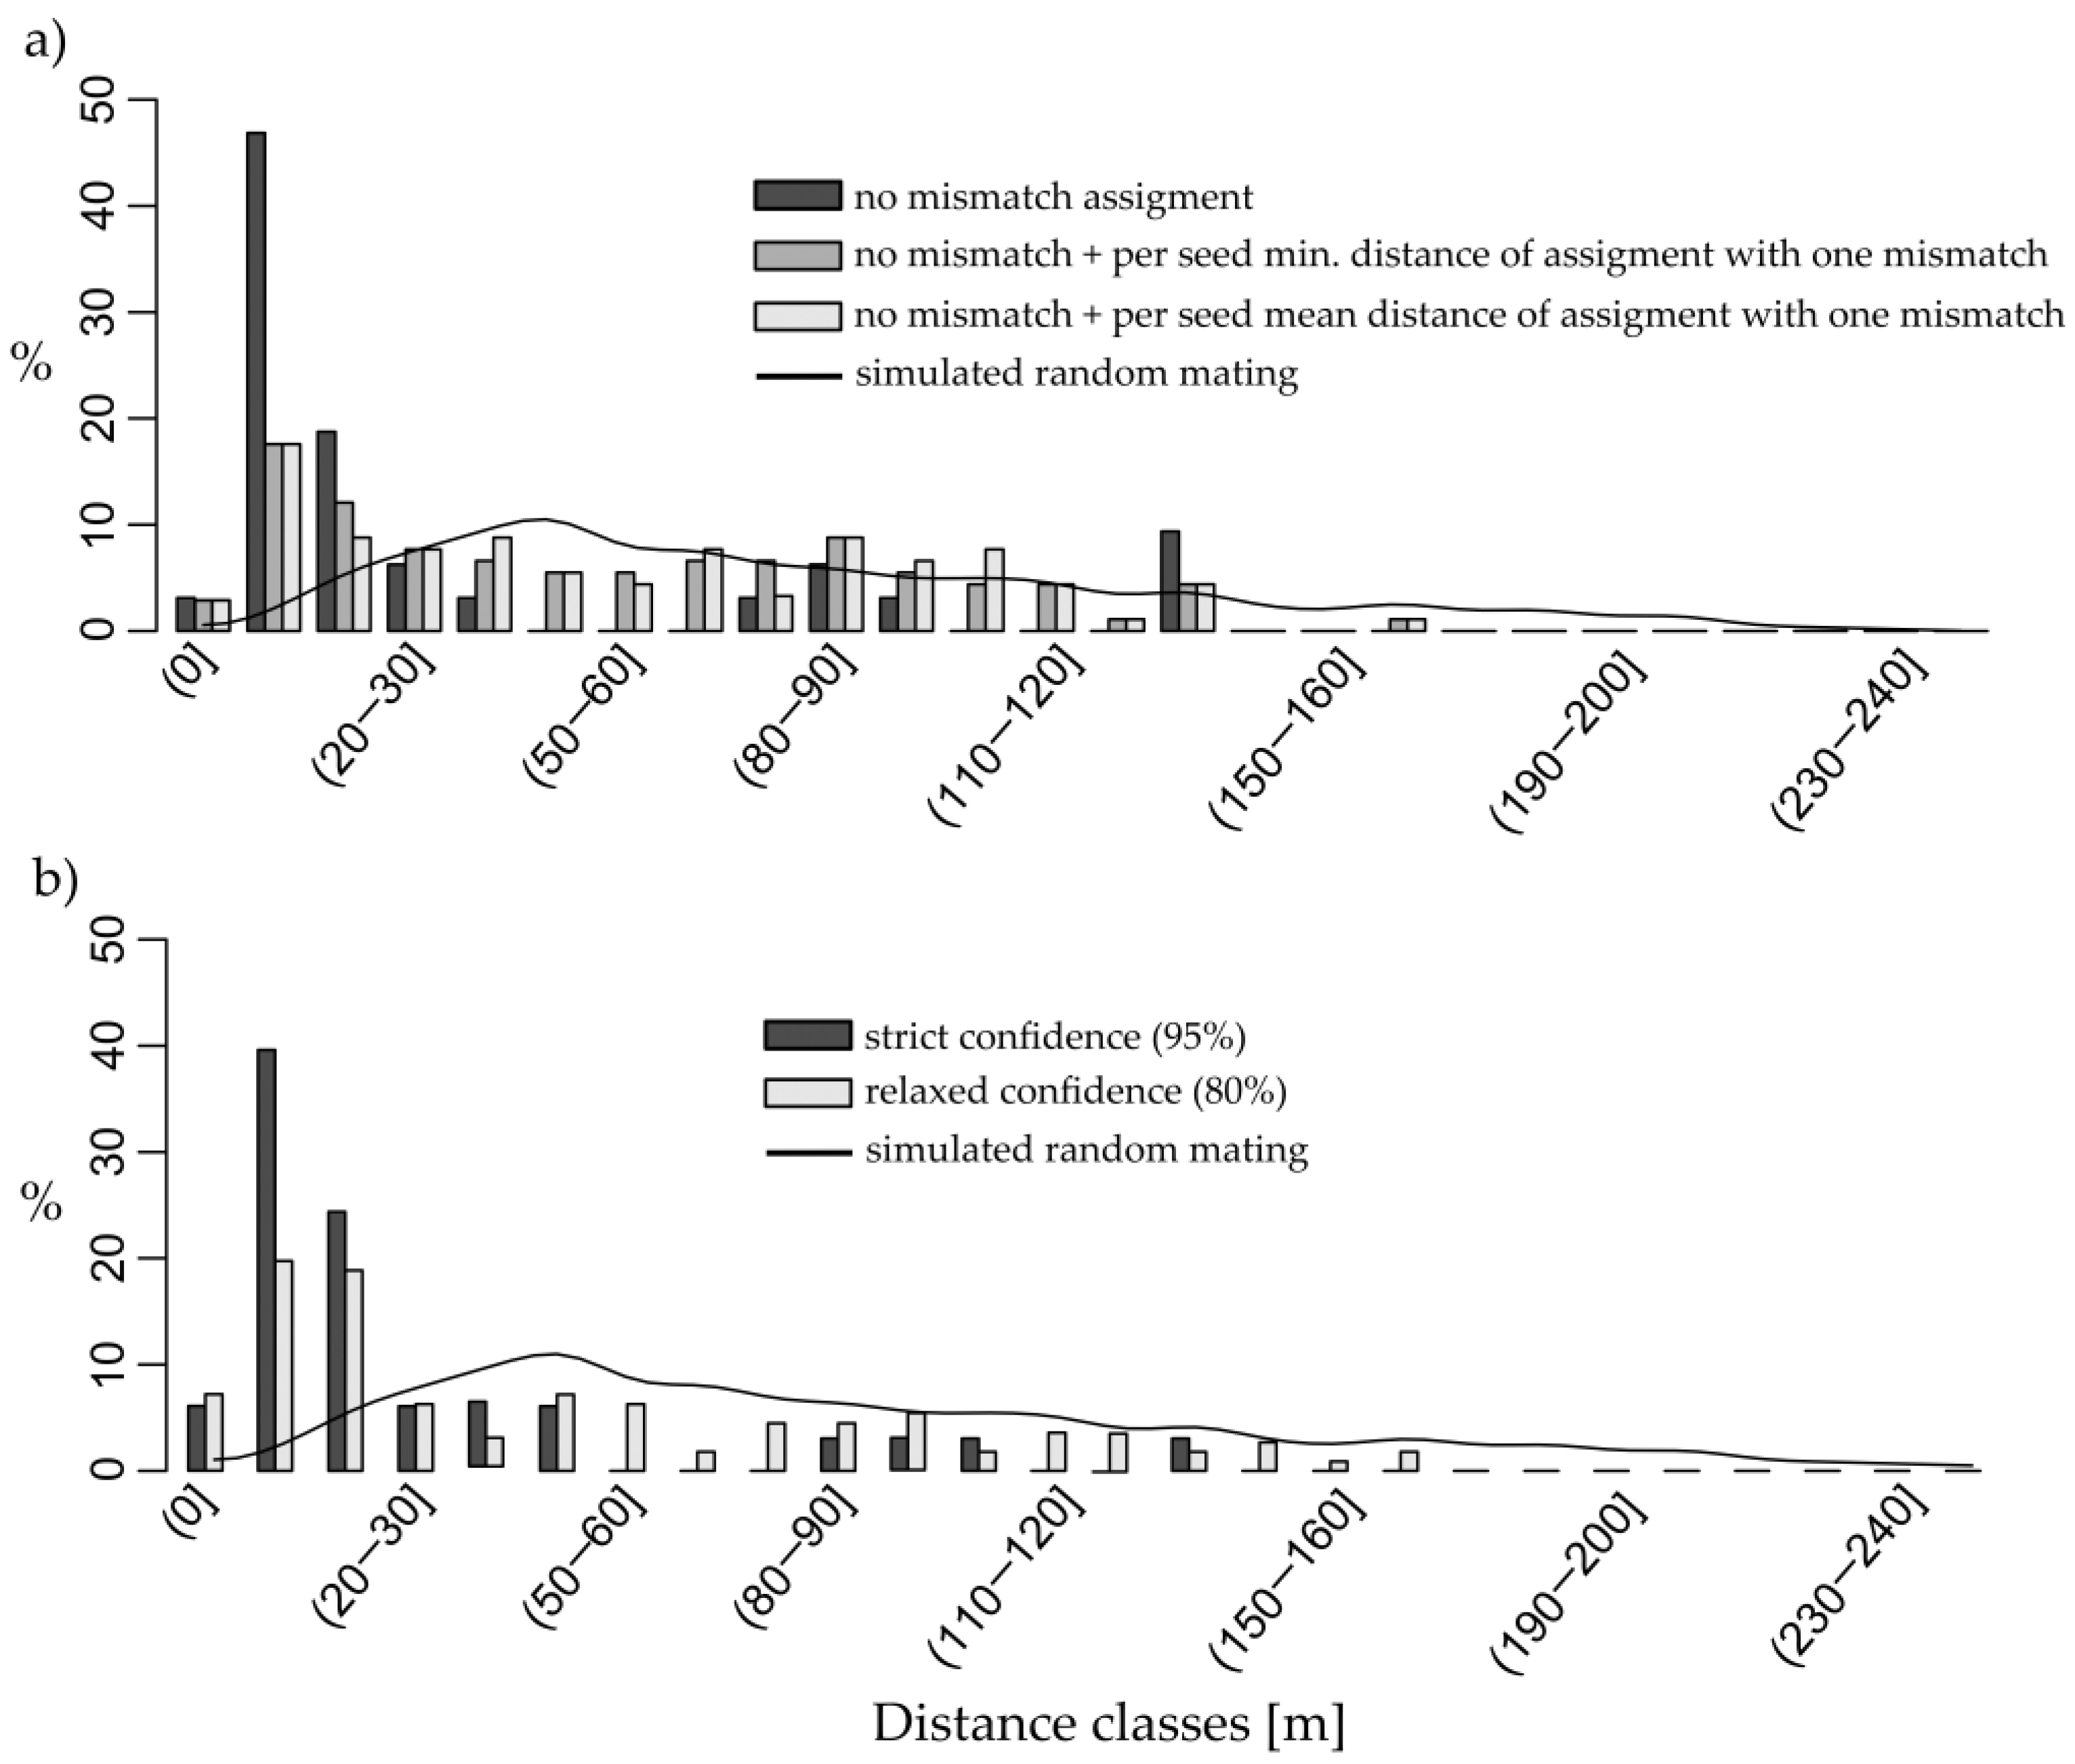
4.2. Distances and Distribution

We observed distance-dependent mating within the stand with closer growing trees being more likely to mate. Within the investigated stand, mating events were most frequent per distance class in >0 m to 10 m and 10 m to 20 m, but can be as distant as 170 m. This is in agreement with previous results [6,54] and observations on the distance-dependency of single tree pollen cloud density [55]. A directionality in pollen dispersal departing from the simulated random dispersal within the stand could not be conclusively defined because comparisons between simulated and observed distributions were inconsistent, and their significance depended on the method and confidence thresholds.
This distance-dependent mating success applies only to the local pollen and accounts for ~10–30% of the total seeds studied. Exponential decrease in mating probability in the present study was mostly shown at a local scale. Here, “local” refers to the sampled stand, to which an assignment is possible. As the area is continuously covered by spruce trees, mating of the trees on the edge of this stand is expected to happen also with neighbouring trees that will be characterised as immigrant pollen even though it could result from a short distance mating. Nevertheless, a large proportion of pollen likely came from distant pollen sources as previously shown [5,6]. For trees within the centre of the stand, more potential pollen donors were assigned in both approaches than for those growing at the stand edge. This might be partly an effect of the sampling design, since central trees were surrounded by more genotyped trees as compared to trees growing on the edge of the sampled stand. Nevertheless, this indicated that immigrant pollen from the surrounding stands contributed less to the progeny of the central trees, and a considerable amount of within stand mating for central trees is realistic. Moreover, for single mother trees, a maximum of no more than half of the seeds were assigned to potential pollen donors in the studied stand. These results further underline the high proportion of immigrant pollen also for single trees, with as high as 100% in family 4.

4.3. Selfing and Outcrossing

Estimated effective selfing rates in viable seeds ranged from 0.3% to 2.1%. This is on the lower end compared to the reported mean values of generally low selfing rates in P. abies [5,6,56,57,58,59]. Nevertheless, although rarely, but 100% outcrossing [58] or high selfing rates greater than 20% were also observed [59]. Nonetheless, genetic studies of the mating system require “full” seeds. Therefore, estimates of selfing and outcrossing could be biased for seed lots with empty seeds resulted from postzygotic abortion due to possible inbreeding depression [60]. This mechanism of avoiding high self-fertilisation rates in the viable offspring in the absence of self-incompatibility mechanisms has also been observed in P. omorika [42].
Approximately two thirds of the estimated outcrossing was due to immigrant pollen most likely coming from the neighbour largely supposedly planted stands. Thus, a negative effect on the genetic composition at adaptive genes is likely. Particularly considering adaptive genetic differences that had been found between different morphotypes in Norway spruce [4].

5. Conclusions and Perspectives

Association between r(r) and Ne (P; r) of single tree progenies and fitness represented by germination was shown for seeds collected from a natural population after a partial mast year. Progenies with lowered germination percentage had also lower Ne (P; r) but increased mean r(r). This can be explained by lower genetic diversity in these progenies due to probably a limited number of pollen donors and/or their low diversity. Inbreeding depression expected from mating amongst close relatives and high selfing rates was not found, despite high amounts of empty seeds. This can be an artefact explained by postzygotic abortion of inbred embryos that results in empty seeds as reported for several conifers [43,45,50], but these empty seeds cannot be genetically studied. Further, we estimated that at least 70% of viable seeds were formed by immigrant pollen. This likely alters the genetic composition of the progeny in this locally adapted stand. As the immigrant pollen was most likely contributed by the surrounding planted spruce stand, representing most likely a distant gene pool, potentially outbreeding depression might both contribute to empty seeds and poor seed fitness. To quantitatively assess these impacts, further studies on seed lots including putative adaptive candidate genes are necessary. To confirm outbreeding depression, controlled crosses or at least sampling the surrounding stands and observing seedling development would be necessary.
For natural regeneration the high amounts of immigrant pollen are likely to alter genetic composition of the stand over generations. As seeds also have a distance-dependent dispersal, and less immigrant pollen contributes to the progeny of central trees, decrease of adaptation is likely happening faster at the edges than in the centre of the stand. Still, dilution of adaptive variation in the stand is a conceivable long-term process in the absence of other effects. Here, the actual regeneration should be studied, as natural selection might counteract the alteration of adaptive variation by immigrant pollen. Also, here we investigated one seed year. As natural regeneration is formed with contributions of several seed years, where the genetic structure of the progeny and mating system parameters vary between years, the amount of immigrant pollen might be differently estimated based on young trees.
It can be expected, that harvesting seeds predominantly in the centre of the stand would retain the most adaptive variation of the stand itself. Still, for a seed harvest equal representation of mother trees in the seed lot is advised, as this also guaranties the maintenance of genetic diversity to avoid introduction of drift effects, since diversity and genetic distance are highly variable between half-sib families. Still, the overall high amount of immigrant pollen is troublesome in the context of preservation of genetic composition of the parental stand.

Supplementary Materials

The following are available online at https://www.mdpi.com/1424-2818/12/7/266/s1, Document (pdf; 5 pp) including Table S1: SSR markers used for genotyping 200 adult trees including 21 seed-collected trees, embryos, and megagametophytes (Caré et al. [17], modified), Table S2: Concentration (ci, μM/μL) of each forward and reverse primer in the multiplex reactions (Caré et al. [17], modified), Table S3: PCR touch-down protocol used for amplification of SSR-markers, Table S4: Pearson’s correlation coefficient (PCC) for the comparisons (1 vs. 2) of mean within half-sib families relatedness estimated with different algorithms and reference allele frequencies, Table S5: Adjusted R2 of linear regressions between the germination percentage and the mean within family relatedness estimated with different algorithms and reference allele frequencies from the original data, excluding half-sib-family 1 due to very limited sample size, Figure S1: Quantile-Quantile diagram of the standardised residuals in the linear regression between within half-sib family seed germination rate presented in Figure 3 and (a) rarefied mean relatedness or (b) rarefied mean effective pollen population size, Figure S2: Scatter plot of mean seed germination rate (y-axis) in 21 half-sib families plotted against the (a) mean within half-sib family relatedness (r) or (b) effective population size (Ne) of the half-sib families. The black line represents the corresponding linear regression trendline: (a) adjusted R2 = 0.34, p = 0.004 excluding half-sib family 1 (depicted by the grey cross) due to very limited sample size; (b) adjusted R2 = 0.15, p = 0.046, Figure S3: Principal Coordinate Analysis (PCoA) of embryos and also adult trees that represent potential pollen donors in the stand based on the pairwise Hamming distance [25] between them calculated using genotypes of 10 SSR markers. For better visualisation of the embryos belonging to the same half-sib family, the figure presents the same PCoA plot 21 times, but each time with samples of a particular half-sib family highlighted by dark blue dots. Potential pollen donors in the stand are highlighted by turquoise, and all other datapoints are highlighted by grey. Distributions of the datapoints that belong to the same half-sib family are circled each by a 95% inertia ellipse, Figure S4: Local pollen dispersal distances and angles of the assignment determined by (a) matching the pollen haplotype with the genotyped individuals and (b) using Cervus 3.0.7 software. All 21 seed-collected mother trees are projected to the centre of the plot. End-marked lines indicate the assigned pollen donor. (a) A strict assignment with complete match for all markers and allowing a single mismatch for one of the markers are depicted by dark violet lines with round-pointed-ends and blue lines with square-pointed ends, respectively. (b) A strict 95% confidence delta threshold and a relaxed 80% confidence delta threshold are depicted by dark violet lines with round-pointed-ends and blue lines with square-pointed ends, respectively. The simulated random mating events (n = 20,000) between 21 seed-collected mother trees and all genotyped trees are depicted by light orange lines in the background. Both observed and simulated data do not include pollen flow from outside the stand.

Author Contributions

Conceptualization, O.C., O.G., M.M., K.V.K. and L.L.; methodology, O.C., O.G., M.M., K.V.K. and L.L.; software, O.C.; validation, O.C., O.G., M.M., K.V.K. and L.L.; formal analysis, O.C.; investigation, O.C.; data curation, O.C.; writing—original draft preparation, O.C.; writing—review and editing, O.C., O.G., M.M., K.V.K. and L.L.; visualisation, O.C.; supervision, O.G. and L.L.; project administration, O.G. and L.L.; funding acquisition, O.G., M.M, and L.L. (listed based on position in author list). All authors have read and agreed to the published version of the manuscript.

Funding

This research was funded by the German Federal Ministry of Food and Agriculture (BMEL) represented by the Fachagentur Nachwachsende Rohstoffe e. V. (FNR) grant number FKZ 22023814. The APC was funded by a publication fee waiver granted by MDPI to O.G.

Acknowledgments

The authors thank Alexandra Dolynska, Christine Radler from the Department of Forest Genetics and Forest Tree Breeding, University of Göttingen, for assistance with lab work and ThüringenForst AöR and its staff for help in stand selection. The authors specially thank Chrisitian Rösner from the Forstliches Forschungs- und Kompetenzzentrum (FFK Gotha) for his help with providing the seed samples for this study. The authors also acknowledge the aid in stand selection and permission for the sampling of the adult reference material provided by ThüringenForst AöR. We also acknowledge the three reviewers for their comments that helped us considerably improve the manuscript.

Conflicts of Interest

The authors declare no conflict of interest. The funders had no role in the design of the study; in the collection, analyses, or interpretation of data; in the writing of the manuscript, or in the decision to publish the results.

References

  1. Paul, M.; Hinrichs, T.; Janßen, A.; Schmitt, H.-P.; Soppa, B.; Stephan, R.; Dörflinger, H. Forest Genetic Resources in Germany—Concept for the Conservation and Sustainable Utilization of Forest Genetic Resources in the Federal Republic of Germany; Federal Ministry of Food Agriculture and Consumer Protection (BMELV) in Cooperation with the Federal Government/Länder Working Group “Forest Genetic Resources and Legislation on Forest Reproductive Material” (BLAG-FGR), Ed.; BMELV: Bonn, Germany, 2010. [Google Scholar]
  2. Schmidt-Vogt, H. Taxonomie, Verbreitung, Morphologie, Ökologie, Waldgesellschaften. In Die Fichte—Ein Handbuch in zwei Bänden; Bd. 1.; Parey: Hamburg/Berlin, Germany, 1977; p. 647. [Google Scholar]
  3. Geburek, T.; Robitschek, K.; Milasowszky, N. A tree of many faces: Why are there different crown types in Norway spruce (Picea abies [L.] Karst.)? Flora Morphol. Distrib. Funct. Ecol. Plants 2008, 203, 126–133. [Google Scholar] [CrossRef]
  4. Caré, O.; Gailing, O.; Müller, M.; Krutovsky, K.V.; Leinemann, L. Crown morphology in Norway spruce (Picea abies [Karst.] L.) as adaptation to mountainous environments is associated with single nucleotide polymorphisms (SNPs) in genes regulating seasonal growth rhythm. Tree Genet. Genomes 2020, 16. [Google Scholar] [CrossRef]
  5. Xie, C.Y.; Knowles, P. Mating system and effective pollen immigration in a Norway spruce plantation (Picea abies). Silvae Genet. 1994, 43, 48–51. [Google Scholar]
  6. Burczyk, J.; Lewandowski, A.; Chalupka, W. Local pollen dispersal and distant gene flow in Norway spruce (Picea abies [L.] Karst.). For. Ecol. Manag. 2004, 197, 39–48. [Google Scholar] [CrossRef]
  7. Williams, C.G. Long-distance pine pollen still germinates after meso-scale dispersal. Am. J. Bot. 2010, 97, 846–855. [Google Scholar] [CrossRef]
  8. Mitton, J.B.; Williams, C.G. Gene flow in conifers. In Landscapes, Genomics and Transgenic Conifers. Managing Forest Ecosystems; Williams, C., Ed.; Springer: Dordrecht, The Netherlands, 2006; pp. 147–168. [Google Scholar] [CrossRef]
  9. Hagman, M. Incompatibility in forest trees. Proc. R. Soc. London. Ser. B. Biol. Sci. 1975, 188, 313–326. [Google Scholar] [CrossRef]
  10. Mergen, F.; Burley, J.; Furnival, G.M. Embryo and seedling development in Picea glauca (Moench) Voss after self-, cross-, and wind-pollination. Silvae Genet. 1965, 14, 188–194. [Google Scholar] [CrossRef]
  11. Skrøppa, T. Diallel crosses in Picea abies II. Perdormance and inbreeding depression of selfed families. For. Genet. 1996, 3, 69–79. [Google Scholar]
  12. Eriksson, G.; Schelander, B.; Åkerbrand, V. Inbreeding depression in an old experimental plantation of Picea abies. Hereditas 1973, 73, 185–193. [Google Scholar] [CrossRef]
  13. Di-Giovanni, F.; Kevan, P.G. Factors affecting pollen dynamics and its importance to pollen contamination: A review. Can. J. For. Res. 1991, 21, 1155–1170. [Google Scholar] [CrossRef]
  14. Di-Giovanni, F.; Kevan, P.G.; Arnold, J. Lower planetary boundary layer profiles of atmospheric conifer pollen above a seed orchard in northern Ontario, Canada. For. Ecol. Manag. 1996, 83, 87–97. [Google Scholar] [CrossRef]
  15. Tollefsrud, M.M.; Sønstebø, J.H.; Brochmann, C.; Johnsen, Ø.; Skrøppa, T.; Vendramin, G.G. Combined analysis of nuclear and mitochondrial markers provide new insight into the genetic structure of North European Picea abies. Heredity 2009, 102, 549–562. [Google Scholar] [CrossRef] [PubMed] [Green Version]
  16. Krutovsky, K.; Burczyk, J.; Chybicki, I. Gene Flow, Spatial Structure, Local Adaptation, and Assisted Migration in Trees. In Genomics of Tree Crops; Schnell, R.J., Priyadarshan, P.M., Eds.; Springer: New York, NY, USA; Heidelberg, Germany; Dordrecht, The Netherlands; London, UK, 2012; pp. 71–116. ISBN 9781461409199. [Google Scholar]
  17. Caré, O.; Müller, M.; Vornam, B.; Höltken, A.; Kahlert, K.; Krutovsky, K.; Gailing, O.; Leinemann, L. High morphological differentiation in crown architecture contrasts with low population genetic structure of German Norway spruce stands. Forests 2018, 9, 752. [Google Scholar] [CrossRef] [Green Version]
  18. Thüringer Landesamt für Bodenmanagement und Geoinformation (Ed.) Geoportal-Th. Available online: https://www.geoportal-th.de (accessed on 4 May 2020).
  19. Scotti, I.; Magni, F.; Paglia, G.P.; Morgante, M. Trinucleotide microsatellites in Norway spruce (Picea abies): Their features and the development of molecular markers. Theor. Appl. Genet. 2002, 106, 40–50. [Google Scholar] [CrossRef]
  20. Pfeiffer, A.; Olivieri, A.M.; Morgante, M. Identification and characterization of microsatellites in Norway spruce (Picea abies K.). Genome 1997, 40, 411–419. [Google Scholar] [CrossRef]
  21. Besnard, G.; Acheré, V.; Rampant, P.F.; Favre, J.M.; Jeandroz, S. A set of cross-species amplifying microsatellite markers developed from DNA sequence databanks in Picea (Pinaceae). Mol. Ecol. Notes 2003, 3, 380–383. [Google Scholar] [CrossRef]
  22. Rungis, D.; Bérubé, Y.; Zhang, J.; Ralph, S.; Ritland, C.E.; Ellis, B.E.; Douglas, C.; Bohlmann, J.; Ritland, K. Robust simple sequence repeat markers for spruce (Picea spp.) from expressed sequence tags. Theor. Appl. Genet. 2004, 109, 1283–1294. [Google Scholar] [CrossRef] [PubMed]
  23. Excoffier, L.; Lischer, H.E.L. Arlequin suite ver 3.5: A new series of programs to perform population genetics analyses under Linux and Windows. Mol. Ecol. Resour. 2010, 10, 564–567. [Google Scholar] [CrossRef]
  24. Paradis, E.; Schliep, K. ape 5.0: An environment for modern phylogenetics and evolutionary analyses in R. Bioinformatics 2019, 35, 526–528. [Google Scholar] [CrossRef]
  25. Hamming, R.W. Error Detecting and error correcting codes. Bell Syst. Tech. J. 1950, 29, 147–160. [Google Scholar] [CrossRef]
  26. Kamvar, Z.N.; Tabima, J.F.; Grünwald, N.J. Poppr: An R package for genetic analysis of populations with clonal, partially clonal, and/or sexual reproduction. PeerJ 2014, 2, e281. [Google Scholar] [CrossRef] [PubMed] [Green Version]
  27. Kamvar, Z.N.; Brooks, J.C.; Grünwald, N.J. Novel R tools for analysis of genome-wide population genetic data with emphasis on clonality. Front. Genet. 2015, 6, 208. [Google Scholar] [CrossRef] [PubMed] [Green Version]
  28. Hui, T.-Y. NB: Maximum Likelihood Method in Estimating Effective Population Size from Genetic Data. R Package Version 0.9. 2014. Available online: https://rdrr.io/cran/NB/ (accessed on 2 May 2020).
  29. Hui, T.-Y.J.; Burt, A. Estimating Effective Population Size from Temporally Spaced Samples with a Novel, Efficient Maximum-Likelihood Algorithm. Genetics 2015, 200, 285–293. [Google Scholar] [CrossRef] [PubMed] [Green Version]
  30. Wang, J. Triadic IBD coefficients and applications to estimating pairwise relatedness. Genet. Res. 2007, 89, 135–153. [Google Scholar] [CrossRef] [PubMed]
  31. Pew, J.; Muir, P.H.; Wang, J.; Frasier, T.R. related: An R package for analyzing pairwise relatedness from codominant molecular markers. Mol. Ecol. Resour. 2015, 15, 557–561. [Google Scholar] [CrossRef]
  32. Ritland, K. Estimators for pairwise relatedness and individual inbreeding coefficients. Genet. Res. 1996, 67, 175–185. [Google Scholar] [CrossRef]
  33. Milligan, B.G. Maximum-likelihood estimation of relatedness. Genetics 2003, 163, 1153–1167. [Google Scholar]
  34. Kalinowski, S.; Taper, M.; Marshall, T. Revising how the computer program CERVUS accommodates genotyping error increases success in paternity assignment. Mol. Ecol. 2007, 16, 1099–1106. [Google Scholar] [CrossRef]
  35. Bivand, R.; Keitt, T.; Rowlingson, B. rgdal: Bindings for the “Geospatial” Data Abstraction Library. R Package Version 1.3-6. Available online: https://CRAN.R-project.org/package=rgdal (accessed on 26 June 2020).
  36. Hijmans, R.J. Geosphere: Spherical Trigonometry. R Package Version 1.5-7. Available online: https://CRAN.R-project.org/package=geosphere (accessed on 26 May 2020).
  37. Lemon, J. Plotrix: A package in the red light district of R. R-News 2006, 6, 8–12. [Google Scholar]
  38. Breusch, T.S.; Pagan, A.R. A Simple test for heteroscedasticity and random coefficient variation. Econometrica 1979, 47, 1287–1294. [Google Scholar] [CrossRef]
  39. Andersson, E. Cone and seed studies in Norway spruce (Pices abies (L.) Karst). Studia For. Suec. 1965, 23, 214. [Google Scholar]
  40. Fowler, D.P.; Park, Y.S. Population studies of white spruce. I. Effects of self-pollination. Can. J. For. Res. 1983, 13, 1133–1138. [Google Scholar] [CrossRef]
  41. Coles, J.F.; Fowler, D.P. Inbreeding in neighboring trees in two white spruce populations. Silvae Genet. 1976, 25, 29–34. [Google Scholar]
  42. Kuittinen, H.; Savolainen, O. Picea omorika is a self-fertile but outcrossing conifer. Heredity 1992, 68, 183–187. [Google Scholar] [CrossRef] [PubMed] [Green Version]
  43. Mullin, T.J.; Persson, T.; Abrahamsson, S.; Andersson Gull, B. Effects of inbreeding depression on seed production in scots pine (Pinus sylvestris). Can. J. For. Res. 2019, 49, 854–860. [Google Scholar] [CrossRef] [Green Version]
  44. Berrill, J.; Libby, W.J. Comparing growth and form of coast redwood selfs and outcrosses. In Coast. Redwood Science Symposium—2016: Past Successes and Future Direction; Standiford, R.B., Valachovic, Y., Eds.; Gen. Tech. Rep. PSW-GTR-258; U.S. Department of Agriculture, Forest Service, Pacific Southwest Research Station: Albany, CA, USA, 2016; pp. 229–240. [Google Scholar]
  45. Woods, J.H.; Heaman, J.C. Effect of different inbreeding levels on filled seed production in Douglas-fir. Can. J. For. Res. 1989, 19, 54–59. [Google Scholar] [CrossRef]
  46. Müller-Starck, G.; Ziehe, M.; Schubert, R. Genetic Diversity Parameters Associated with Viability Selection, Reproductive Efficiency, and Growth in Forest Tree Species. In Forest Diversity and Function; Scherer-Lorenzen, M., Körner, C., Schulze, E.D., Eds.; Springer: Heidelberg, Germany, 2005; Volume 176, pp. 87–108. [Google Scholar]
  47. Wojacki, J.; Eusemann, P.; Ahnert, D.; Pakull, B.; Liesebach, H. Genetic diversity in seeds produced in artificial Douglas-fir (Pseudotsuga menziesii) stands of different size. For. Ecol. Manag. 2019, 438, 18–24. [Google Scholar] [CrossRef]
  48. Del Castillo, R.F.; Trujillo-Argueta, S.; Sánchez-Vargas, N.; Newton, A.C. Genetic factors associated with population size may increase extinction risks and decrease colonization potential in a keystone tropical pine. Evol. Appl. 2011, 4, 574–588. [Google Scholar] [CrossRef]
  49. Lynch, M. The genetic interpretation of inbreeding depression and outbreeding depression. Evolution 1991, 45, 622–629. [Google Scholar] [CrossRef]
  50. Kärkkäinen, K.; Savolainen, O.; Koski, V. Why do plants abort so many developing seeds: Bad offspring or bad maternal genotypes? Evol. Ecol. 1999, 13, 305–317. [Google Scholar] [CrossRef]
  51. Goto, S.; Iijima, H.; Ogawa, H.; Ohya, K. Outbreeding depression caused by intraspecific hybridization between local and nonlocal genotypes in Abies sachalinensis. Restor. Ecol. 2011, 19, 243–250. [Google Scholar] [CrossRef]
  52. Sønstebø, J.H.; Tollefsrud, M.M.; Myking, T.; Steffenrem, A.; Nilsen, A.E.; Edvardsen, M.; Johnskås, O.R.; El-Kassaby, Y.A. Genetic diversity of Norway spruce (Picea abies (L.) Karst.) seed orchard crops: Effects of number of parents, seed year, and pollen contamination. For. Ecol. Manag. 2018, 411, 132–141. [Google Scholar] [CrossRef]
  53. O’Connell, L.M.; Mosseler, A.; Rajora, O.P. Impacts of forest fragmentation on the mating system and genetic diversity of white spruce (Picea glauca) at the landscape level. Heredity 2006, 97, 418–426. [Google Scholar] [CrossRef] [PubMed] [Green Version]
  54. Shimono, A.; Wang, X.R.; Torimaru, T.; Lindgren, D.; Karlsson, B. Spatial variation in local pollen flow and mating success in a Picea abies clone archive and their implications for a novel “breeding without breeding” strategy. Tree Genet. Genomes 2011, 7, 499–509. [Google Scholar] [CrossRef]
  55. Wright, J.W. Pollen Dispersion of Some Forest Trees; Station Paper NE-46; United States Department of Agriculture, Forest Service, Northeastern Forest Experiment Station Upper Darby: Pennsylvania, PA, USA, 1952; p. 42.
  56. Finkeldey, R. Homogeneity of pollen allele frequencies of single seed trees in Picea abies (L.) Karst plantations. Heredity 1995, 74, 451–463. [Google Scholar] [CrossRef] [Green Version]
  57. Pakkanen, A.; Nikkanen, T.; Pulkkinen, P. Annual variation in pollen contamination and outcrossing in a Picea abies seed orchard. Scand. J. For. Res. 2000, 15, 399–404. [Google Scholar] [CrossRef]
  58. Dering, M.; Misiorny, A.; Chałupka, W. Inter-year variation in selfing, background pollination, and paternal contribution in a Norway spruce clonal seed orchard. Can. J. For. Res. 2014, 44, 760–767. [Google Scholar] [CrossRef]
  59. Muona, O.; Paule, L.; Szmidt, A.E.; Kärkkäinen, K. Mating system analysis in a central and northern European population of Picea abies. Scand. J. For. Res. 1990, 5, 97–102. [Google Scholar] [CrossRef]
  60. Rajora, O.P.; Mosseler, A.; Major, J.E. Indicators of population viability in red spruce, Picea rubens. II. Genetic diversity, population structure, and mating behavior. Can. J. Bot. 2000, 78, 941–956. [Google Scholar] [CrossRef]
Figure 1. (a) Map of the 200 genotyped adult trees (green dots) including 21 seed-sampled mother trees labelled by numbers corresponding to the half-sib family numbers in Table 1 and depicted by yellow cross symbols over green dots. Coordinates are given in WGS 84 (EPSG: 4326). Topographic map at 1:25,000 (b) and 1:1000,000 (c) scales with the stand location indicated by the red dot. Coordinates are given in ETRS89/UTM zone 32N (EPSG: 25832). Map source: www.geoportal-th.de [18], URI: L5330_col and C5530_col, respectively, and available under the “dl-de/by-2-0” licence at http://www.govdata.de/dl-de/by-2-0. Figure generated with QGIS 3.8.
Diversity 12 00266 g001
Figure 2. Scatter plot of mean seed germination percentage (x-axis) in 21 half-sib families plotted against the (a) rarefied mean within half-sib family relatedness (r(r)) or (b) rarefied mean effective pollen population size (Ne (P; r)) of the half-sib families. The line represents the corresponding linear regression trendline, excluding family 1 (downward triangle) due to very limited sample size. Grey symbols and lines correspond to rarefaction with replacement, black indicates rarefied results without replacement. (a) adjusted R2 = 0.33, p = 0.005; (b) with replacement adjusted R2 = 0.37, p = 0.003, without replacement adjusted R2 = 0.21, p = 0.02. Whiskers represented by solid lines in (a,b) show the standard deviation of the mean from the rarefaction resampling, whiskers represented by doted lines in (b) shown the mean confidence interval. Indicated by an upward triangle is the unrarefied value for family 13, because resampling in this family was impossible for rarefaction without replacement.
Diversity 12 00266 g002
Figure 3. Relative frequency of local, within the stand, pollen dispersal in 10 m distance interval classes and the 0 m distance class indicating self-fertilisation: (a) dark grey bars represent strict assignments without any mismatch at the genotyped simple sequence repeat (SSR) markers, grey bars represent strict assignments combined with assignments allowing for only one mismatch, where in cases of multiple possible assignments for a seed the nearest pollen donor was considered, and light grey bars represent the same conditions as previous, but mean distance is used in cases of multiple assignments; (b) dark and light grey bars represent assignments made by CERVUS 3.0.7 with 95% and 80% confidence, respectively. The simulated random mating distance of the sampled mother trees and the reference population is given as cubic spline interpolated black curve of 20,000 events. Both observed and simulated data do not include pollen flow from outside the stand.
Diversity 12 00266 g003
Table 1. Summary of statistical and descriptive parameters for the sampled half-sib families.
Halb-sib FamilyGermination 1 (%)Number of SeedsNe (P; r) [CI]Ho [SD]HeFISr(r) [SD]
GenotypedAssigned by Comparison 2Assigned by Cervus 3
13.64011.1 [1, 1.5]0.533 [0.076]0.616−0.0340.11 [0.03]
240.520673.7 [2.4, 6.1]0.700 [0.040]0.657−0.068 *0.19 [0.03]
313.113222.7 [1.8, 4.1]0.679 [0.035]0.628−0.106 *0.27 [0.02]
415.513301.7 [1.2, 2.9]0.554 [0.067]0.536−0.0810.33 [0.07]
548.820522.7 [1.8, 4.5]0.571 [0.040]0.587−0.0060.17 [0.03]
650.020882.8 [1.8, 4.5]0.667 [0.065]0.639−0.122**0.23 [0.04]
761.920473.0 [1.9, 5.1]0.558 [0.043]0.513−0.112**0.22 [0.03]
839.320752.7 [1.8, 4.3]0.552 [0.053]0.532−0.0480.28 [0.04]
958.320663.4 [2.1, 5.8]0.655 [0.032]0.581−0.131 **0.21 [0.03]
1045.2208102.5 [1.7, 4]0.582 [0.055]0.647−0.0240.23 [0.04]
1128.6208103.2 [2, 5.5]0.616 [0.045]0.584−0.065 *0.21 [0.03]
1247.6207102.4 [1.6, 3.9]0.571 [0.057]0.563−0.0480.21 [0.04]
139.59242.0 [1.4, 3.2]0.632 [0.051]0.636−0.0230.23 [0.03]
1448.820133.4 [2.1, 5.7]0.632 [0.029]0.616−0.079 *0.17 [0.03]
1551.220153.0 [1.9, 5]0.526 [0.054]0.5630.0240.18 [0.03]
1651.224483.0 [1.9, 4.9]0.607 [0.049]0.583−0.0470.21 [0.03]
1710.711431.8 [1.2, 2.7]0.555 [0.048]0.525−0.0960.32 [0.04]
1859.521323.4 [2.1, 6]0.717 [0.054]0.660−0.105 *0.20 [0.04]
1931.020583.2 [2.1, 5.4]0.624 [0.045]0.628−0.086 *0.19 [0.03]
2034.520652.5 [1.6, 4.2]0.606 [0.049]0.614−0.109 *0.23 [0.03]
2160.720263.0 [1.9, 4.9]0.598 [0.032]0.562−0.089 *0.22 [0.03]
pooled38.53759211285.3 [52.6, 159.2]0.607 [0.011]0.696−0.071 ***0.22 [0.03]
1 Based on 84 seeds per half-sib family; 2 allowing one mismatch; 3 relaxed confidence threshold; Ne (P; r)—rarefied effective pollen population size with mean lower and upper confidence interval (ØCI) limit values in square brackets, respectively; Ho—observed heterozygosity with standard deviation (sd) of the rarefaction resampling in square brackets; He—expected heterozygosity; FIS—fixation index; r(r)—mean rarefied triadic likelihood relatedness estimate with standard deviation (sd) in square brackets; * p < 0.05, ** p < 0.01, *** p < 0.001.

