Ecological and Conservation Correlates of Rarity in New World Pitvipers
by
 ,
,
Irina Birskis-Barros
1,2, 
Laura R. V. Alencar
2,
Paulo I. Prado
2,
Monika Böhm
3 and
Marcio Martins
2,* 1
School of Natural Sciences, University of California, Merced, CA 95340, USA
2
Departamento de Ecologia, Instituto de Biociências, Universidade de São Paulo, 05508-09 São Paulo, SP, Brazil
3
Institute of Zoology, Zoological Society of London, Regent’s Park, London NW1 4RY, UK
*
Author to whom correspondence should be addressed.
Diversity 2019, 11(9), 147; https://doi.org/10.3390/d11090147
Submission received: 30 June 2019
/
Revised: 16 August 2019
/
Accepted: 23 August 2019
/
Published: 27 August 2019
(This article belongs to the Special Issue Systematics and Conservation of Neotropical Amphibians and Reptiles)
Abstract
:Rare species tend to be especially sensitive to habitat disturbance, making them important conservation targets. Thus, rarity patterns might be an important guide to conservation efforts. Rabinowitz’s approach defines rarity using a combination of geographical range, habitat specificity, and local abundance, and is frequently used in conservation prioritization. Herein, we use Rabinowitz’s approach to classify the New World (NW) pitvipers (family Viperidae) regarding rarity. We tested whether body size and latitude could predict rarity, and we compared rarity patterns with extinction risk assessments and other prioritization methods in order to detect rare species not classified as threatened or prioritized. Most NW pitvipers have large geographical ranges, high local abundances, and narrow habitat breadths. There are 11.8% of NW pitviper species in the rarest category and they occur along the Pacific coast of Mexico, in southern Central America, in the Andean region of Ecuador, and in eastern Brazil. Rarity in NW pitvipers is inversely related to latitude but is not related to body size. Our results indicate that additional species of NW pitvipers are threatened and/or should be prioritized for conservation. Combining complementary approaches to detect rare and threatened species may substantially improve our knowledge on the conservation needs of NW pitvipers.

1. Introduction
There is growing evidence that rare species play key ecological roles in the functioning and structuring of communities [1,2,3]. Additionally, rare species tend to be more affected by habitat disturbance compared to common species [4,5,6], and should thus comprise important targets of conservation programs [6]. A better understanding of rarity patterns is therefore necessary to help with guiding conservation efforts [6].
In the context of populations and communities, ecologists tend to define rare species as those showing low abundance and/or a small distribution area (see reviews in [7,8]). In conservation biology, the meaning of rare is usually associated with extinction risk [6], given that low abundance and small distribution areas are linked to heightened extinction risk of species [9]. Although the term rarity has been broadly used, a more precise concept of rarity was proposed by Rabinowitz [10] as a combination of three components: Small geographical range, high habitat specificity, and low local abundance. The so-called “seven forms of rarity” of Rabinowitz [10] is often suggested to have some degree of subjectivity in the classification of species (e.g., [11,12,13]). However, although several other strategies for the classification of rarity have been proposed (see review [6]), the “seven forms of rarity” approach is still a simple, effective, and widely used framework to characterize rare species from ecological and conservation points of view (e.g., [14,15,16,17,18,19,20,21,22]).
Rarity patterns resulting from the “seven forms of rarity” approach tend to be strongly correlated with extinction risk assessed by traditional methods like the International Union for Conservation of Nature (IUCN) categories and criteria [14,22]. In fact, this correlation is expected because most methods aimed to detect extinction risk also use two of the criteria used to define rarity, geographical range and population size, among their main criteria [23]. However, using just one aspect of rarity, such as small geographical range, could lead to an underestimation of extinction risk of a species. On the other hand, the interplay between processes at different scales that make species common or rare can create associations between different components of rarity [24,25]. The investigation of such associations is thus necessary for a better understanding of rarity and also has practical consequences like the use of one aspect as a proxy for the other aspects when data are incomplete. Furthermore, detecting intrinsic factors that could predict rarity and its different aspects from species trait data would also help in conservation efforts by accelerating assessments of rarity and subsequent prioritization exercises. Rarity patterns in tropical woody plants, for example, have a strong phylogenetic component, indicating that related species tend to be similar regarding rarity [26]. In birds, abundance is negatively related to body size, and range sizes are better predicted by habitat specificity, migratory status, and clutch size of different species [27]. Thus, identifying correlations among the different aspects of rarity and possible intrinsic factors that can predict rarity would help us to increase the efficacy of conservation strategies.
Vipers (family Viperidae) comprise about 350 snake species distributed in most continents. New World (NW) vipers are all in the subfamily Crotalinae (pitvipers), comprising about 12 genera and 150 species (~ 43% of all vipers [28]) distributed throughout the Americas [29]. NW pitvipers diverged from their Old World relatives around 28 million years ago and arrived in the New World from a single invasion into North America [30,31,32]. Once their ancestor reached the NW, pitvipers rapidly occupied virtually all terrestrial habitats available [29,30,32,33] and are today conspicuous predators in most NW ecosystems. There is a large body of literature on the biology of NW pitvipers, especially focusing on their medical importance [34,35], complex venom apparatus [36,37,38], and feeding habits [29,39,40]. Additionally, compared to other snake lineages and reptiles in general, vipers are significantly more threatened, mainly due to habitat loss and persecution by humans [41,42,43]. Given their high extinction risk but substantial availability of biological information, NW pitvipers comprise an interesting snake lineage to explore rarity patterns, the intrinsic factors affecting these patterns, and the possible associations between rarity and extinction risk.
Herein, we compiled a dataset of NW pitvipers to categorize species according to Rabinowitz [10]. Additionally, we explored how rarity is distributed across space and among lineages. If rare species are located in a more restricted area and/or lineage, this could guide conservation efforts. We also investigated whether intrinsic factors predict rarity patterns. We expected that body size and latitude could predict rarity and thus could be used as proxies in circumstances where data on distribution, habitat breadth or population abundance are not available. We chose these variables because body size is frequently related to life history traits and range size, and abundance was found to be related to latitude in some clades (see additional details in Predicting rarity below). Finally, we compared the rarity patterns found with assessments of extinction risk and other prioritization methods in order to detect rare species which may have so far been overlooked in conservation efforts. As Rabinowitz’s classification uses three different criteria (geographical ranges, local abundances, and habitat breadths) to define rare species, we expect that some rare species would not be listed as threatened and/or prioritized for conservation, and thus, this would demonstrate that assessments of rarity could provide an additional tool to guide conservation efforts for these key ecological species.
2. Materials and Methods
2.1. Rarity Patterns
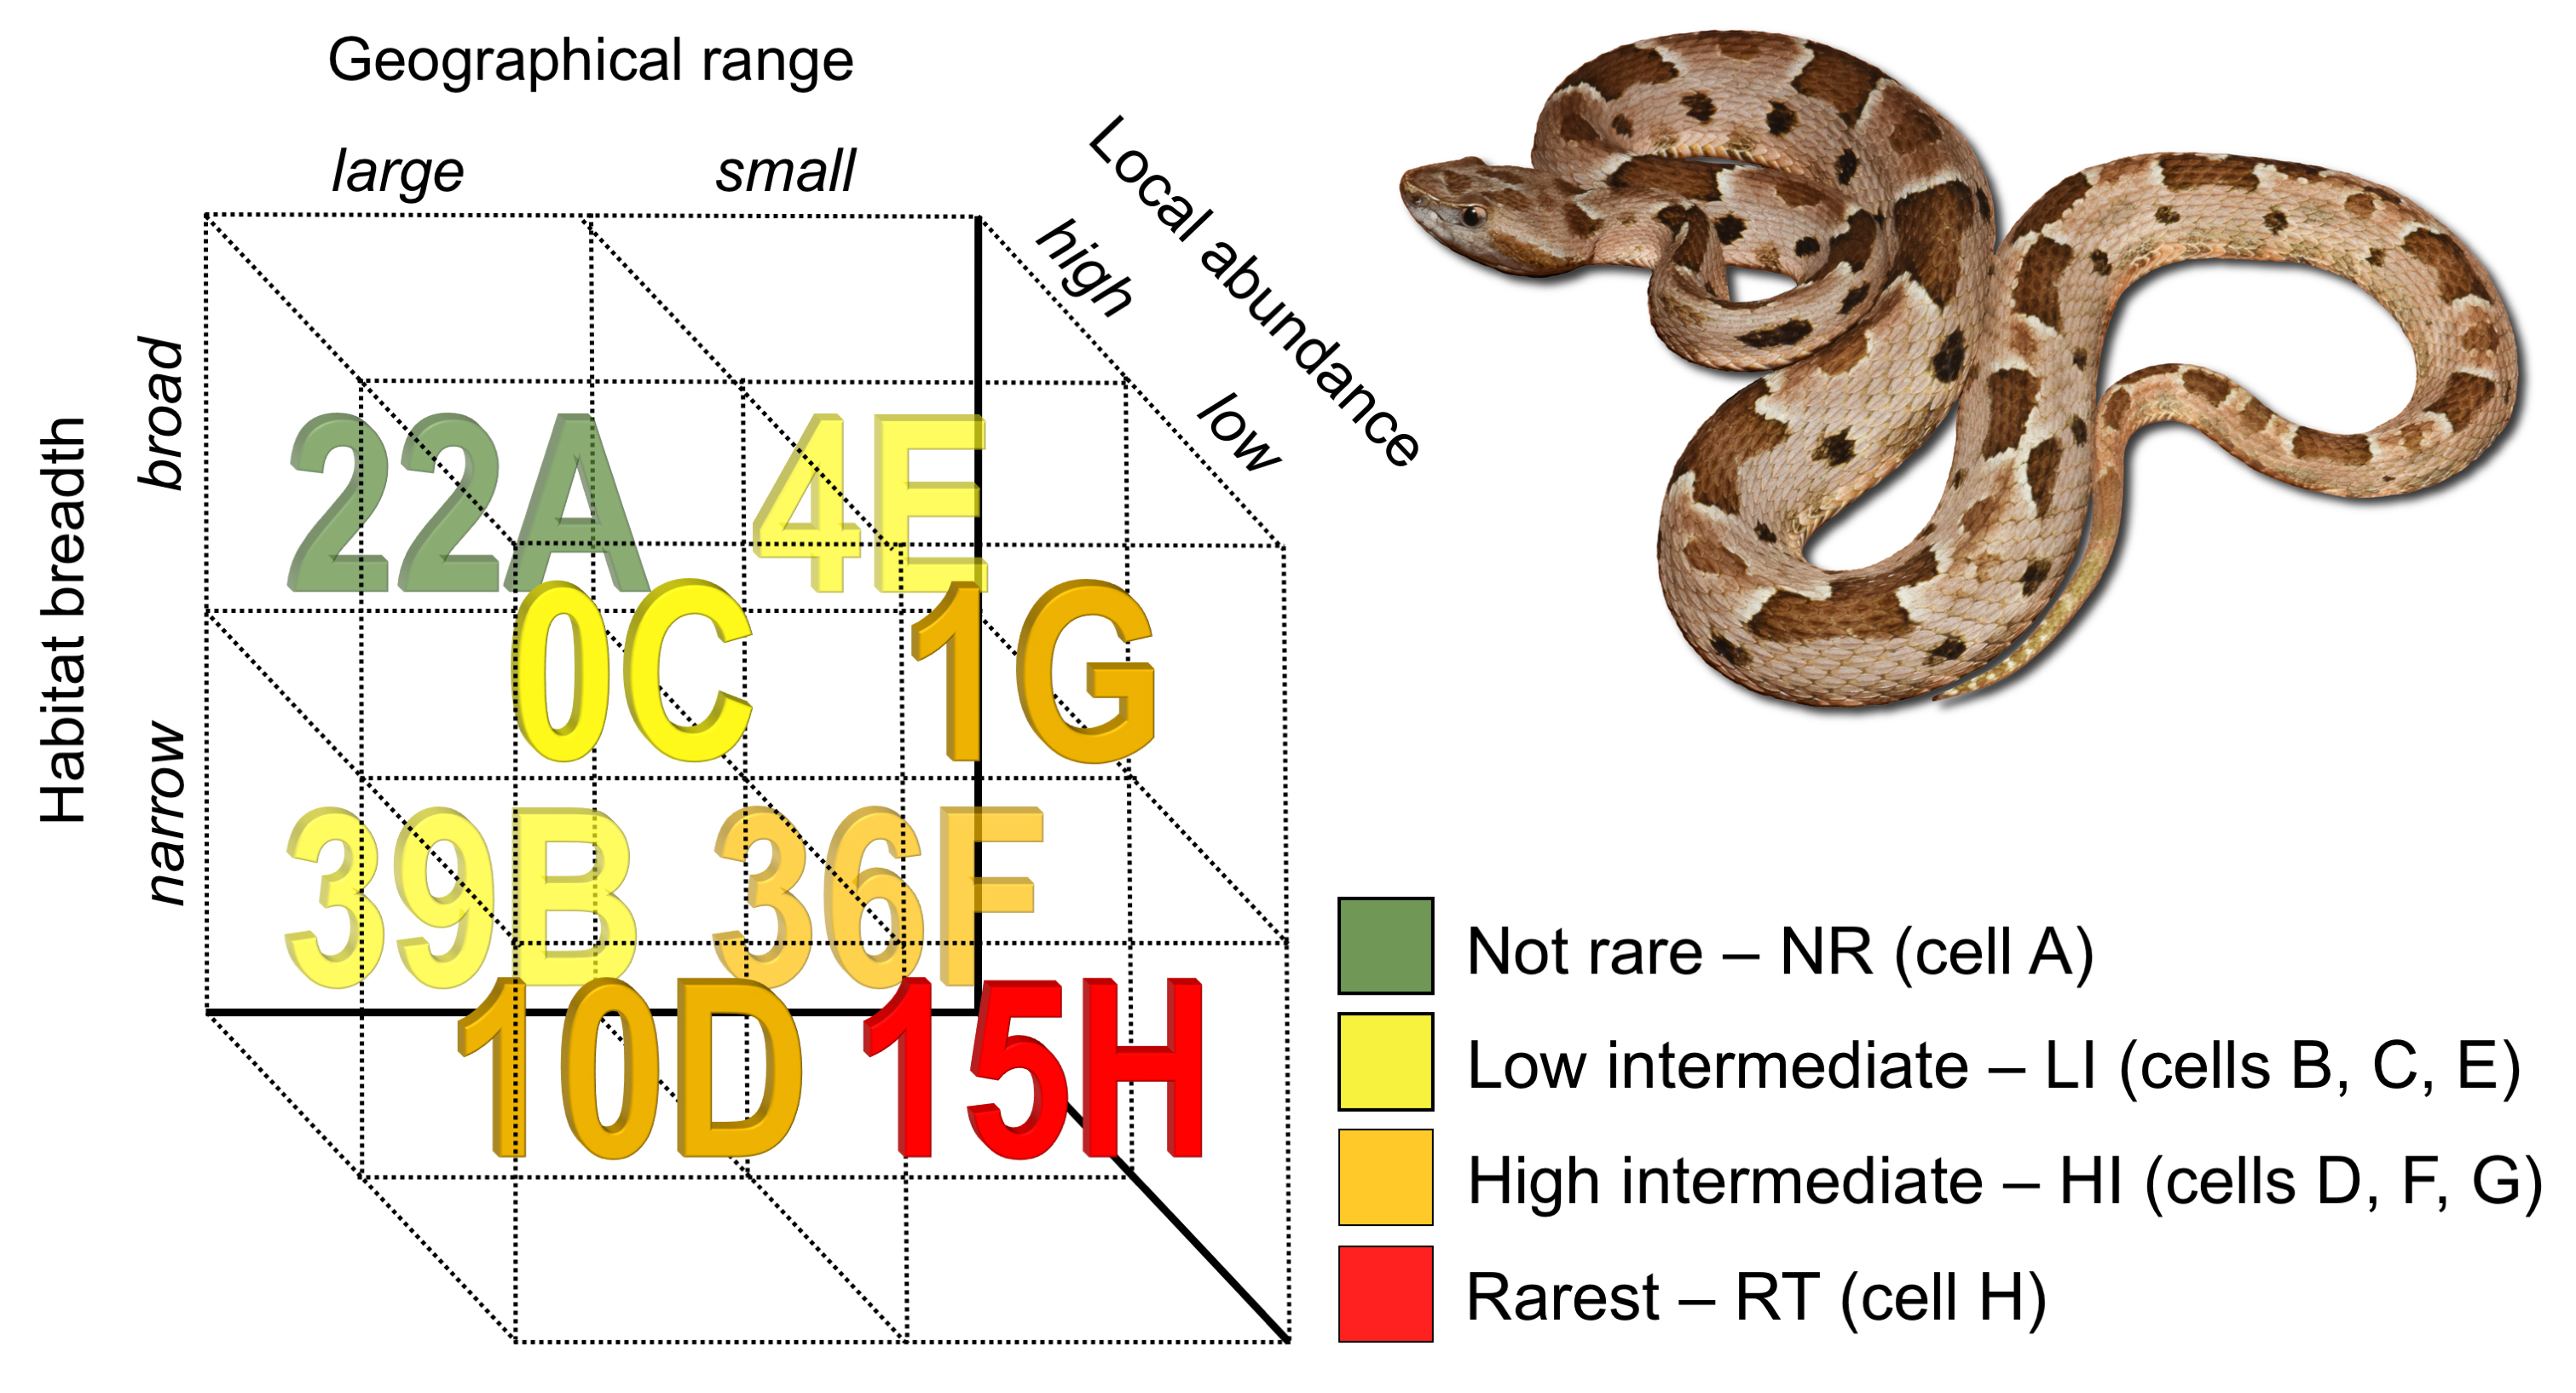
We used literature and unpublished information to characterize the geographical range (GR), habitat breadth (HB), and local abundance (LA) of 143 species of NW pitvipers (see Tables S1–S3). We follow the taxonomy of the Reptile Database as of August, 2015 [28], except for some island populations of Crotalus (see [43,44]). Each variable considered was dichotomized (see details below). As a result, we built a table with the eight combinations of these variables in the table cells (cf. Rabinowitz [10]). We then categorized species in four rarity categories (see [14]): Not rare (NR), which includes those species that are not rare in any of the three aspects of rarity; low intermediate (LI), with species that are rare in one aspect; high intermediate (HI), with species that are rare in two aspects; and rarest (RT), with species that are rare in all three aspects.
Locality data used to calculate GR of each species were gathered mostly from literature (scientific papers, theses, dissertations, books, reports etc.), but also from museum databases (including VertNet [45]), and from an unpublished database for species that occur in Brazil [46] (see Table S1). Each resulting map was compared to the maps provided by Campbell and Lamar [29] to exclude possible erroneous localities. In a few cases in which locality data were not available, we obtained data directly from published distribution maps.
We estimated GR using a map depicting the point occurrences of a given species and drawing the smallest convex polygon connecting external points and that encompasses the remaining points (cf. extent of occurrence, EOO [47]). We then excluded areas that were clearly unsuitable habitat (using literature and unpublished information on degree of habitat specialization) and that represented over 1% of the total polygon. In order to make very small distributions more realistic, we considered a buffer of five km radius centered at each point of occurrence. For island endemics, we used the area of the island as the species’ GR. For most species, the area of our GR was the same as the EOO [47], but in some, the GR obtained was up to one fourth the EOO (e.g., Bothrops asper; see Table S4). We then dichotomized the distribution of GRs using its median: GR > 82,900 km2 = wide distribution; GR < 82,900 km2 = restricted distribution). All spatial analyses were performed in the software Quantum GIS [48].
We estimated HB of each species using literature data to obtain the number of major habitat types in which the species can be found, considering gross vegetation types: Desert, non-desert open habitats (grassland, shrubland, and savanna), and forests (Table S2). We then dichotomized the distribution of number of habitat types using its median: > one habitat type = wide habitat breadth; one habitat type = narrow habitat breadth (Table S2). To estimate LA of each species, we used a simplification of the ACFOR (abundant, common, frequent, occasional, rare) scale [49] with three categories (abundant, common, and rare), which refer only to the apparent abundance found in the literature (see Table S3). For each species we assigned a value from one to three (rare to abundant). For dichotomization, we used the mean of these values (1.98; one = rare; two and three = not rare) instead of its median (2), as this would make dichotomization impossible. We failed to find LA data for 16 species. Thus, of the 143 species of New World pitvipers considered herein, we had enough data to analyze rarity for 127 species (88% of the species).
We analyzed the associations between the three rarity variables (GR, HB, and LA) using log-linear models [50,51]. We fitted alternative log-models to the frequencies of species in each combination of the three rarity variables. The models expressed all combinations of associations among variables in a multi-way contingency table. We started with a full model (all possible associations between two variables plus the association of the three variables) and then we tested sequentially the loss of fit caused by the removal of each one of these associations [51]. The loss of fit in these sequential comparisons was gauged by the log-likelihood ratio test (LRT) with the Chi-square test. A significant loss of fit when an association was removed was considered support for such association. The first step in this forward selection procedure was to compare through LRT the model with all interactions with the model without the three-way interaction. If the test showed a non-significant loss of fit, we inferred that the data did not support the three-way association between the three forms of rarity. In this case, we proceeded by testing the significance of the three two-way associations (that is, the association between GR and HB, GR and LA, HB and LA). In each of these tests we compared through LRT the model with the target two-way interaction (but with the other remaining interactions) with the model with all two-way interactions. Each of these three tests then allowed us to identify if there was evidence for one of the associations among pairs of rarity forms (for instance, if species with small geographic range and small populations were more frequent than expected if these two states were independent, and so on). We performed these analyses in R 3.1.3 (R Core Team, Vienna, Austria) [52].
2.2. Predicting Rarity
We explored if body size and latitude can predict rarity in NW pitvipers. Body size is frequently related to several life history aspects in animals [53], and might affect abundance (see [54]) and home range size (e.g., [55,56,57]). In snakes, body size can also be tied to aspects often predicting generation time, such as time of sexual maturity, fecundity, and lifespan (e.g., [58,59]). Thus, body size could potentially predict rarity in snakes. We collected data for body size (total length, i.e., snout-vent length plus tail length) through an extensive literature review (see Table S5).
Latitude could also predict rarity patterns among NW pitvipers. According to Rapoport’s rule, in temperate zones species tend to have larger geographical ranges than in the tropics [60,61,62,63,64] and species occurring in tropical regions tend to have narrower habitat breadth than those in temperate zones [65,66,67]. Additionally, there is evidence that species abundance is positively related to latitude [68,69]. To evaluate if latitude predicts rarity patterns across NW pitvipers, we used the latitude of the centroid of the geographical range of each species.
To investigate if body size and latitude predict rarity, we used Bayesian phylogenetic generalized mixed models implemented in the R package MCMCglmm [70]. Under this approach phylogenetic relatedness is incorporated as a covariance matrix. We followed the approach of Verde Arregoitia et al. [71] and used body size and latitude as fixed effects and the rarity ranking categories as an ordinal dependent variable. We assigned a rank ranging from 1 to 4 to our rarity categories (cf. [14]), in which the lower value represents the rarest category and the higher value indicates the not rare category. We implemented our models using the codes by Verde Arregoitia et al. [71] and the phylogeny generated in Alencar et al. [31]. We ran the analyses for at least 10,000,000 steps to achieve convergence, discarding the first 10% iterations as burn-in. We verified convergence using the Heidelberger and Welch’s convergence diagnostic [72], checking for the autocorrelation of successive samples and through visual inspection of trace plots. We considered associations as significant when the 95% credible intervals did not include zero.
2.3. Rarity and Other Assessments of Extinction Risk or Prioritization
Categorizations under the IUCN criteria [47] were gathered from the IUCN Red List [42], from assessments by the IUCN Snake and Lizard Red List Authority, and from the recent assessment of Brazilian snakes for species endemic to Brazil (see [43]). We assessed the remaining species for which previous IUCN categorizations were not available using the IUCN categories and criteria [47] (see Table S4). Continuing declines in habitat quality under criterion B were inferred visually using maps of human influence index [73], superimposed on distribution maps, combined with information on the ability of species to persist in disturbed habitats (obtained in the literature or by specialist consultation).
We also compared our rarity categorization of New World pitvipers of this study (only the rarest, RT category) with those of the Mexican red list [74], the Threat Index of Maritz et al. ([43] for the World vipers), and conservation status assessments using the Environmental Vulnerability Score (EVS; [75]) for Central American [76] and Mexican species [77].
3. Results
3.1. Rarity Patterns
We found marked rarity patterns within NW pitvipers (Figure 1 and Table S4). Considering each component separately, most species have a narrow habitat breadth (78.7% of the species inhabit a single habitat type) or are locally common (79.5%), and around half of them (55.9%) are widely distributed (GR > 82,900 km2).
Regarding the rarity types of Rabinowitz ([10]; cells A to H in Figure 1), one type does not occur in NW pitvipers (cell C in Figure 1; large GR, broad HB, and low LA; Table S4) and two types comprise less than 5% of the species, with 3.15% of species with small GR, broad HB, and high LA (cell E in Figure 1; Table S4) and 0.8% of species with small GR, broad HB, and low LA (cell G in Figure 1; Table S4). A great number of the NW pitvipers (30.7%) has large GR, narrow HB, and high LA (cell B in Figure 1; Table S4) and 28.3% of the species have small GR, narrow HB, and high LA (cell F in Figure 1; Table S4). Thus, cells B and F represent the majority (59%) of the rarity patterns characterizing the NW pitvipers (Figure 1; Table S4). Besides, 11.8% of the species are in cell H (small GR, narrow HB, and low LA) and 7.9% in cell D (large GR, narrow HB, low LA; Figure 1; Table S4). As for our rarity categories, 11.8% of the species are in the rarest category (cell H), 37.0% are in high intermediate (cells D, F, and G), 33.8% are in low intermediate (cells B, C, and E), and 17.3% are in the not rare category (cell A). Using log-linear models, we found significant, positive associations between GR and HB (χ2 = 7.75, p = 0.005, 1 df) and between HB and LA (χ2 = 5.66, p = 0.017, 1 df). This indicates that the most parsimonious model predicting the number of species in each rarity category includes the association between GR and HB and the association between HB and LA.
Species in the rarest category occur along the Pacific coast of Mexico, in southern Central America, especially in Costa Rica and Panamá, in the Andean region of Ecuador, and in a narrow area in eastern Brazil (Figure 2A). When both higher rarity categories (high intermediate and rarest) are considered together, rare pitvipers are found in the southwestern United States, throughout Central America from southwestern Mexico to Panamá, and in central and northern South America (Figure 2B). When the distribution of rare pitvipers (high intermediate and rarest; Figure 2A,B) is compared to pitviper richness hotspots throughout the Americas ("hottest" areas in Figure 2D), there is a relatively good congruence between them in North and Central America, but a generally low congruence in South America.
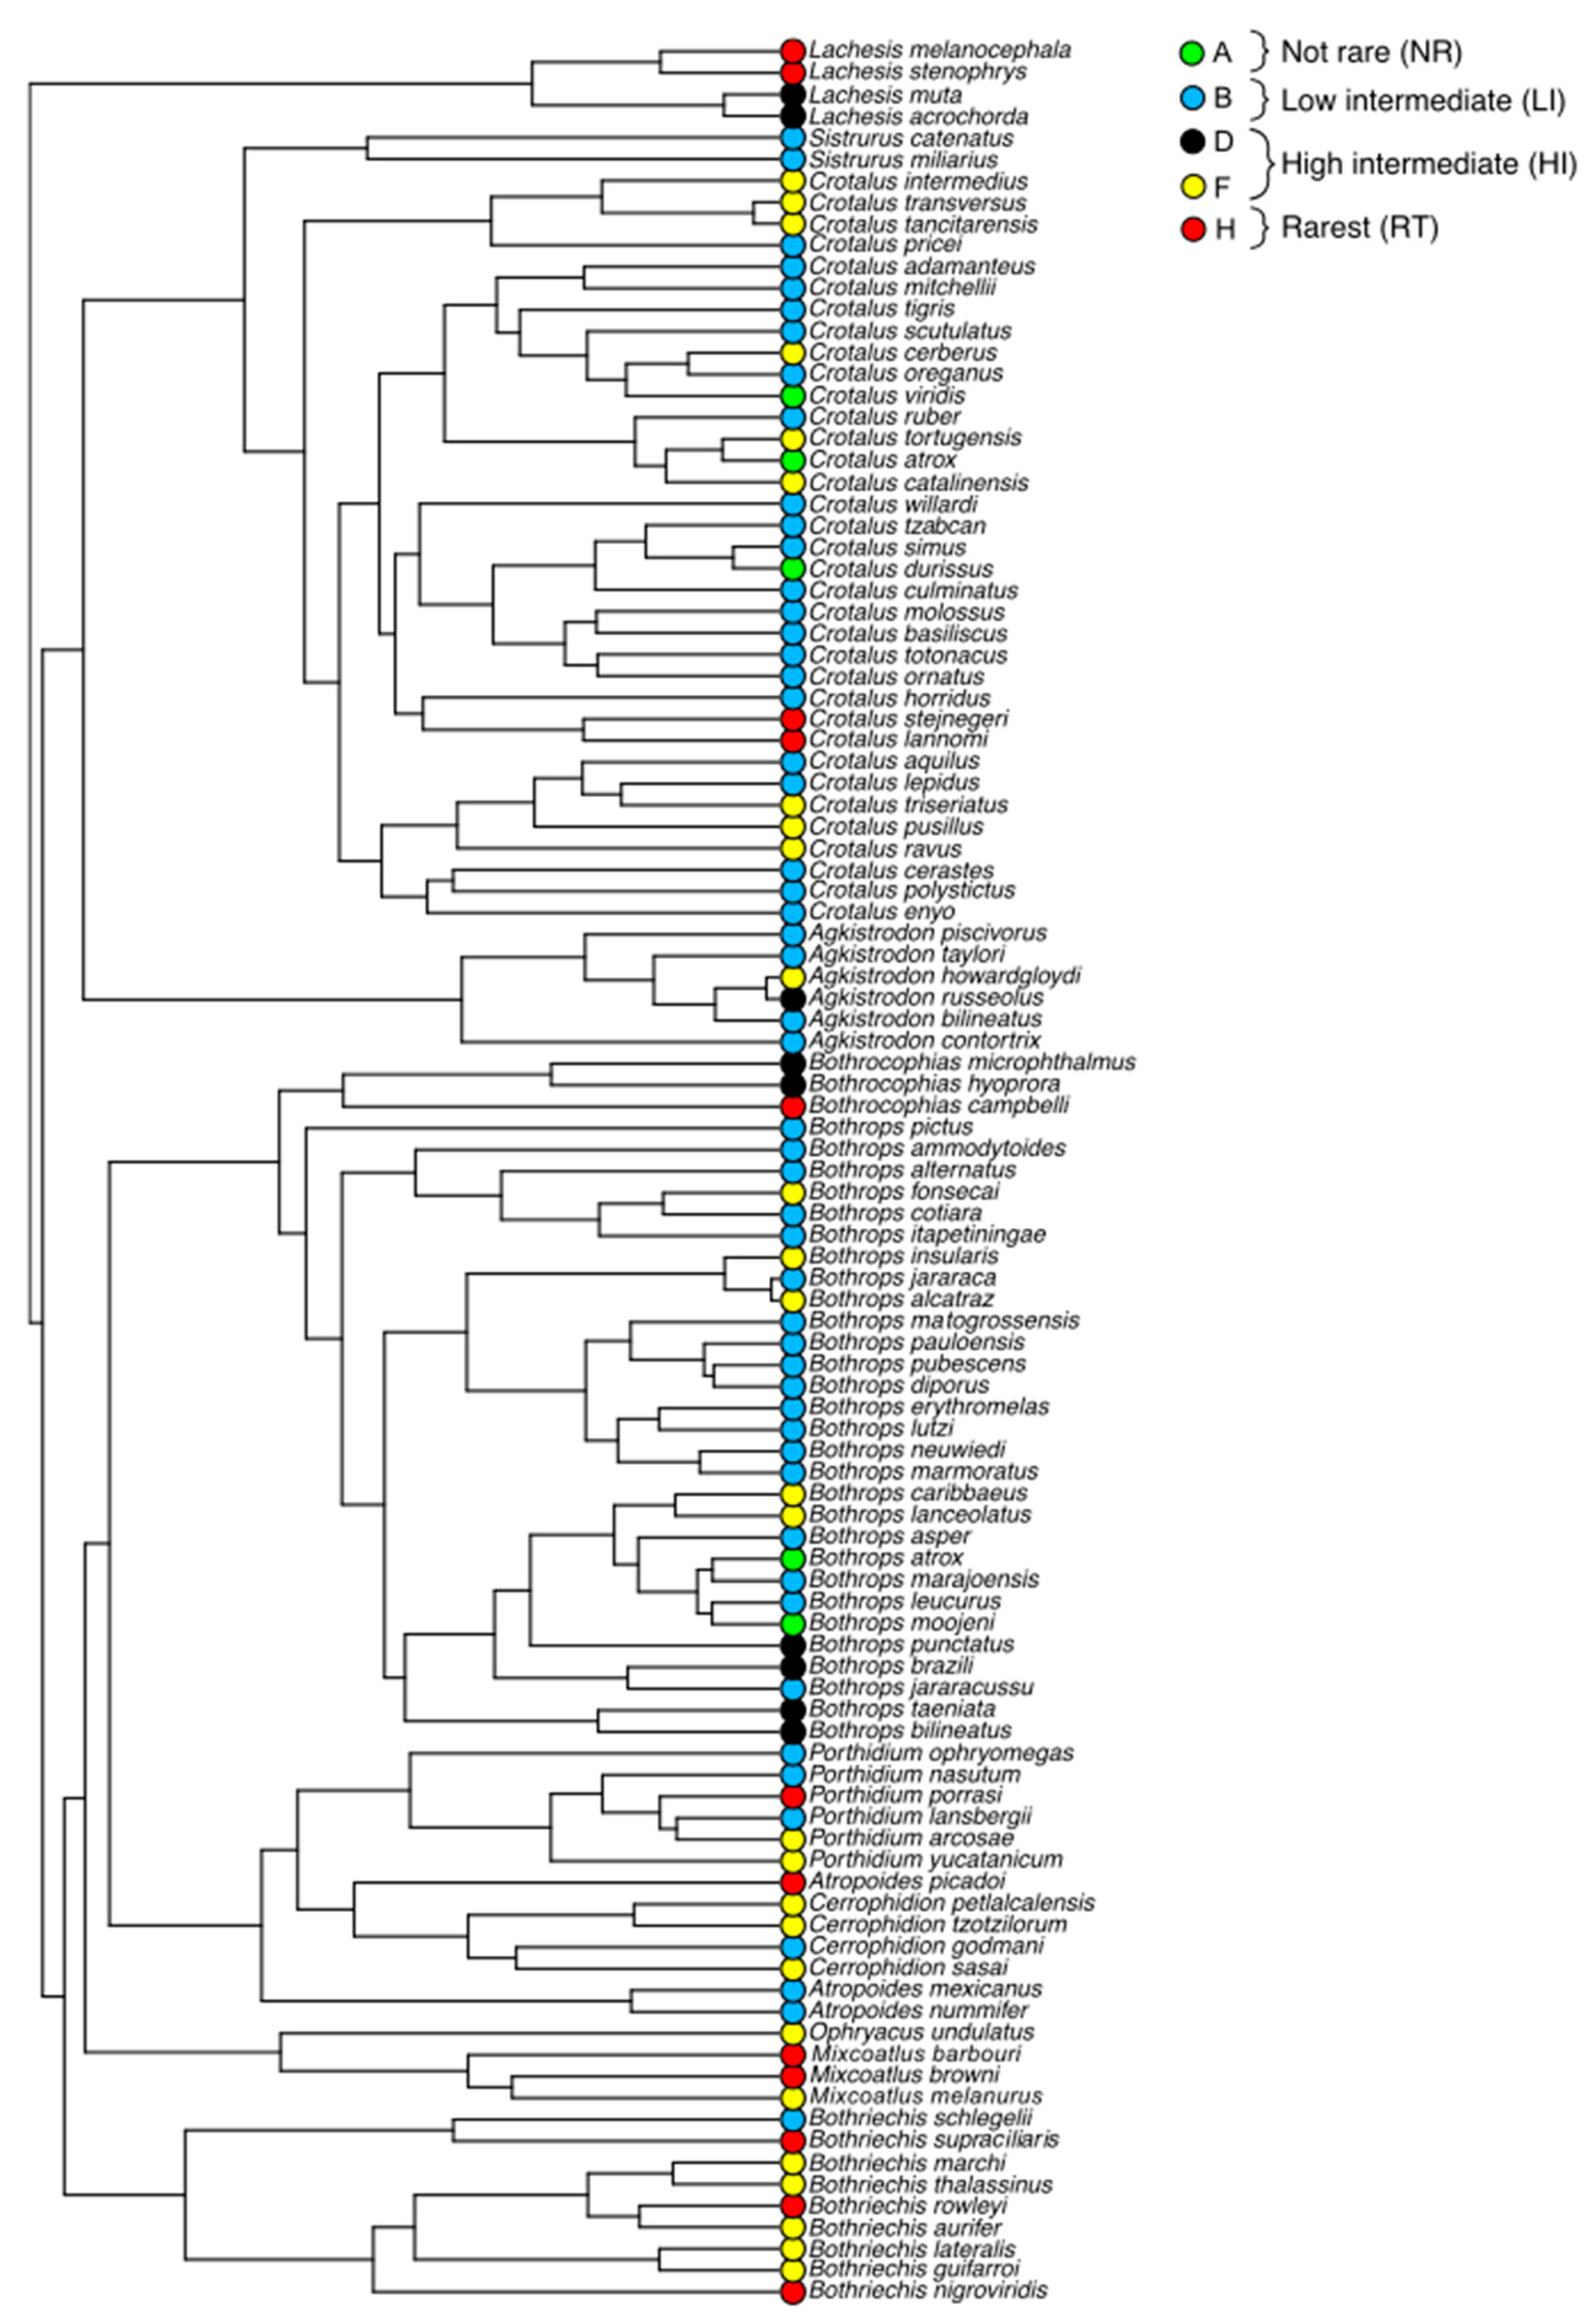
In general, rarity patterns do not seem to be phylogenetically conserved across NW pitvipers (Figure 3) with the exception of Central American lineages (Bothriechis, Cerrophidion, Mixcoatlus, and Ophryacus), which show high concentration of rare species (High Intermediate and Rarest; Figure 3). In other lineages (e.g., Bothrops, Crotalus), rare species are frequently endemic to islands or to Central and North American mountains (Figure 3 and Figure S1).
3.2. Predicting Rarity
Latitude but not body size predicted rarity in NW pitvipers. Bayesian phylogenetic models suggested an effect of latitude on rarity, i.e., the probability of a lineage being rare decreases with increasing latitude (Table S6).
3.3. Rarity and Other Assessments of Extinction Risk or Prioritization
When rarity patterns are compared to categorizations of extinction risk using IUCN categories and criteria (Table 1; Table S4), 20 species (91.0%) of the 22 threatened species (vulnerable, VU; endangered, EN; and critically endangered, CR) are in the higher rarity categories (high intermediate and rarest) and two (9.1%) are in the low intermediate category (specifically in the category E). For near threatened (NT) species, two (33.3%) are in low intermediate, three (50.0%) are in high intermediate, and one (16.7%) in the rarest category. Just 22 (23.7%) of least concern (LC) species are in not rare, 38 (40.9%) are in low intermediate, 29 (31.2%) are in high intermediate, and four (4.3%) are in rarest. Finally, one (16.7%) data deficient (DD) species is in low intermediate, three (50%) species are in high intermediate and two (33.3%) in rarest. Additionally, there is a relatively high congruence in the distribution of the species in the rarest category (RT; Figure 2A) and threatened species (Figure 2C).
Furthermore, among our 15 rarest species, four are listed as endangered or threatened in the Mexican red list of threatened species [74], two were assessed as having a high threat index in Maritz et al. [43] prioritization, and six and three species were already suggested to show high vulnerability to extinction through EVS in Mexico [77] and in Central America [76], respectively (Table 2).
4. Discussion
Our results show that most New World pitvipers have a narrow habitat breadth or are locally common, and around half of them are widely distributed. Twenty-two species (17.3%) are in the not rare category and fifteen (11.8%) are in the highest rarity category (Rarest). Most of the latter species are distributed in Central America, especially in highlands and islands, and seven of these rarest species are not classified as threatened by IUCN.
Pitvipers tend to be locally common and to have narrow habitat breadth (see Tables S2 and S3). As a consequence, two of the rarity types in the Rabinowitz cross-classification (cells E and G in Figure 1) together comprise less than 4% of species and one of the rarity types (cell C in Figure 1) was not occupied by any species. This result contrasts with those observed in other groups, like plants [74], mammals [14], and frogs [22], for which empty cells were not recorded, perhaps because the number of species considered herein is smaller than those of these studies. Further rarity studies involving other taxonomically restricted snake lineages (e.g., families, subfamilies) would show whether the patterns described herein are widespread amongst snakes.
A high frequency of habitat specialization and high local abundance was also detected in birds and plants [17,27]. Although few studies have explored patterns of habitat specialization in snakes (e.g., [79,80]), Luiselli [81], using a different approach, found that rare species (including vipers) tend to have narrow realized ecological niches, which can be related to habitat breadth (see below). Additionally, in most studies of NW snake communities, pitvipers tend to appear among the most frequently encountered species (e.g., [82,83,84,85,86,87]), suggesting a general trend to be locally common. Overall, these results are in accordance with our findings that many NW pitvipers are habitat specialists and locally common.
We found an association between geographical range and habitat breadth in NW pitvipers (see also [88] for snakes in general). Indeed, there seems to be a general trend of association between these traits in different taxa. In a review of the effects of niche breadth on range size in several groups of organisms (diatoms, algae, plants, and animals), Slatyer et al. [89] found that habitat breadth is a good predictor of range size (see also [90,91]). Indeed, many recent studies indicate that populations of specialist species tend to decline faster than populations of generalist species [89], no matter why this association occurs (see discussion in [89], see also [92]). Thus, the high degree of habitat specialization associated with small ranges in NW pitvipers (e.g., 50 species with ranges < 20,000 km2 have narrow habitat breadth; see also [88]) indicates that this group may be especially vulnerable to human disturbance in their habitats. The association between geographical range and habitat breadth also indicates that there is some redundancy within the rarity aspects included in the “seven forms of rarity” framework, and that it might be possible to use one of these aspects as a proxy for the other when data are incomplete. Additionally, when redundancy within the rarity aspects is high, a simplified framework could be used (e.g., with only two aspects).
The rarest species of NW pitvipers occur in Central America and Andean and Trans-Andean South America (see Figure 2A). Actually, many of the rare pitvipers are restricted to mountains or islands, which translates into small geographical ranges (Figure S2; Table S4) and narrow habitat breadth. In fact, Böhm et al. [88] showed that snakes with a narrow habitat breadth tend to have small geographical ranges, and that snakes have smaller ranges at higher altitudes. Additionally, when the geographical distribution of rare pitvipers (Rarest category; Figure 2A) is compared to pitviper richness hotspots throughout the Americas (Figure 2D), there is a relatively high congruence between them in North and Central America, but a generally lower congruence in South America. This lack of congruence in South America perhaps reflects the fact that most hotspots of pitviper richness in this region are dominated by widespread species, whereas in Central America these hotspots are determined mainly by species with small geographical ranges (see Table S4 and Figure S2).
As predicted, our results show that NW pitvipers occurring at lower latitudes tend to be rare. Indeed, there is evidence of Rapoport’s rule among these snakes (correlation between latitudinal midpoint and GR, this latter log-transformed, Pearson’s r = 0.245, p < 0.05, but see [57]), indicating that GR may have contributed to this result. There is also a significant correlation between latitude and number of habitats used by species (Spearman’s r = 0.474, p < 0.05), indicating that HB has also contributed to this trend. Indeed, analyzing snake communities worldwide, Luiselli [81] found that the percentage of rare species in a community is higher in the tropics than in temperate regions. Similar results were found for other groups, such as primates [93], Australian honeyeaters [69], and Australian mammals [68]. However, latitude is just an indicator of geographical location [94] and further studies should search for the factors that are actually explaining higher levels of rarity in the tropics. Letcher and Harvey [95], for instance, tested if climatic variability could explain Rapoports’s rule for mammals of the Palearctic region and their results showed that only annual temperature range could predict range size. Thus, an interesting future approach would be to test whether environmental variables, such as temperature, rainfall, and resource distribution, can predict the variation of rarity in New World pitvipers and other groups along the latitudinal gradient.
Although rarity (sensu Rabinowitz [10]) is not directly incorporated in the Red List classification using IUCN categories and criteria [96], there is some congruence between rarity and extinction risk [14,22]. This congruence may occur mainly because certain aspects of rarity, such as small geographical range and small population size, are captured in the IUCN Red List Criteria as symptoms of high extinction risk; thus, extinction risk and rarity may covary [96]. Indeed, there is a high congruence between rare and threatened New World pitvipers (Figure 2A,C, respectively; Table S4). This high congruence is somewhat surprising considering that nearly half of our Rare species are not threatened (four LC, two DD, and one NT) in the IUCN red list. This congruence probably reflects the fact that the extent of occurrence of three quarters of our Rare species falls below the threshold of IUCN Red List criterion B (20,000 km2; Table S4, [47]). This latter criterion is the most used for reptiles in general [41] and was used in the assessment of almost all threatened NW pitvipers (21 out of 22 species; [42]; this study). Furthermore, although not explicitly included as a specific criterion in the IUCN categories and criteria, local abundance is often taken into account during conservation assessments [97]. Additionally, the high congruence in the geographical distribution of rare and threatened species indicates that rarity is a useful spatial surrogate of endangerment in NW pitvipers. In fact, using a global database of fossil marine animals, Harnik et al. [19] showed that geographical range was the main factor determining extinction risk in the seven forms of rarity, followed by habitat breadth, while local abundance had a minor effect.
Even though we found an overall congruence between rare and threatened NW pitvipers, four species (Cerrophidion sasai, C. tzotzilorum, Crotalus stejnegeri, and C. transversus) classified in the rarest category are categorized as “least concern” on the IUCN Red List ([42]). Thus, special attention should be given to these species, as they may become threatened very easily in the near future because they may be disproportionately affected by habitat disturbance [4,6,68]. By the same token, both DD species that appeared in the rarest category (Bothrops ayerbei and B. venezuelensis) may prove to be threatened or NT when additional information becomes available for them.
Besides the congruence with the IUCN Red List, four of our rarest species are listed as endangered or threatened in the Mexican red list of threatened species ([78]) and additional species appear in Mexican and Central American extinction risk assessments using EVS [75,76,77] and with a high threat index in Maritz et al. [43] prioritization. Based on the complementary results presented herein and in the IUCN [42] and Mexican [43] red lists and EVS assessments [76,77,78], species that appear as high priorities in these lists and studies (see Table 2) should receive special attention in future conservation planning. Additionally, one species in the rarest category (Mixcoatlus browni) had a high ranking in Maritz et al.’s [43] Ecological and Evolutionary Distinctiveness index (EED). Thus, this species may also be ecologically and evolutionarily unique and therefore deserves special attention for conservation.
5. Conclusions
In this study, we used Rabinowitz’s rarity categories to classify New World pitvipers and our results show that although most NW pitvipers are not rare, several species have a combination of features (narrow habitat breadth and small geographical range) that may make them vulnerable to extinction in the near future. We detected regions where a concentration of rare pitvipers occurs (e.g., mountainous regions of Mexico, southern Central America, and Transandean South America), which may become target regions for new protected areas. Our results also show that rarity in NW pitvipers tends to decrease with increasing latitude and hence latitude can be used as a proxy in the lack of data, helping the efforts of conservation in some situations. Lastly, we compared rarity patterns with IUCN assessments and showed that among species in our rarest category, some were not listed as threatened. Thus, we propose the use of our rarity analyses as additional criteria for setting conservation priorities, which can contribute effectively to the conservation of NW pitvipers. Indeed, combining complementary approaches like Rabinowitz’s rarity method (this study) with those presented in the previous paragraphs (Table 2), may substantially improve our knowledge on the conservation needs of NW pitvipers.
Supplementary Materials
The following are available online at https://www.mdpi.com/1424-2818/11/9/147/s1, Figure S1: Relief maps showing the distribution of rare vipers in the New World (North and Central America above, South America below). Note that most rare pitvipers occur in mountainous areas. Grid details and richness as in Figure 1. Figure S2: Comparison of the size of viper geographical distribution among regions of the New World. Table S1: Sources of locality data used to calculate geographical range for New World vipers. Table S2: Habitats of New World vipers. Major habitats cited in the literature, number of major habitats, and the category considered in our analyses for habitat breadth. Table S3: Species abundance of New World pitvipers. The column “Abundance” (rare = 1, frequent = 2 and abundant = 3) is based on literature information for each species and LA is the category considered in our analyses based on the previous column (low local abundance for one in previous column, high local abundance for two and three). Table S4: Geographical range (GR1, in km2), extent of occurrence (EOO, cf. IUCN), region of the New World (CEAM = Central America; CISA = Cisandean South America; ISLA = island endemics; TRSA = Transandean South America; USNM = United States and northern Mexico), IUCN category (LC = least concern; DD = data deficient; NT = near threatened; VU = vulnerable; EN = endangered; CR = critically endangered), source of IUCN category (BRZ = Brazilian assessment by ICMBio; IUCN = IUCN Red List; SIS = IUCN Species Information System; TS = this study), rarity variables (GR2 = geographical range; HB = habitat breadth; LA = local abundance), rarity cell in Rabinowitz “seven forms of rarity” (see Figure 1), and rarity category (NR = not rare; LI = low intermediate; HI = high intermediate; RT = rarest) for all species of New World pitvipers. Table S5: Body size (maximum length, in milimeters) and absolute latitude used in the analysis for predicting rarity. The column “references” refers to the data on maximum length. Table S6: Parameter estimates of Bayesian phylogenetic mixed-models analyses. An asterisk indicates a statistically significant result (p < 0.01). CI = Confidence intervals.
Author Contributions
Conception of the work, I.B.-B., M.M., and L.R.V.A.; acquisition, analysis, and interpretation of data, I.B.-B., M.M., L.R.V.A., M.B., and P.I.P.; writing—original draft preparation, I.B.-B. and M.M.; writing—review and editing, I.B.-B., M.M., L.R.V.A., M.B., and P.I.P.; acquisition of funding, M.M.
Funding
I.B.-B. L.R.V.A. and M.M. thank São Paulo Research Foundation (FAPESP) (fellowships #2012/15398-7 and #2012/22197-8 to I.B.-B., #2012/02038-2 and #2016/14292-1 to L.R.V.A., grants #2011/50206-9, #2015/21259-8, and #2018/14091-1 to M.M.). M.M. and P.I.P. thank the Brazilian Research Council (CNPq) for research fellowships (306961/2015-6 and 310885/2017-5). M.B. receives funding from The Rufford Foundation.
Acknowledgments
We thank two anonymous reviewers for providing useful suggestions, C. Spencer for providing unpublished data on the distribution of Crotalus atrox and C. Nogueira and the group of collaborators of the database on the distribution of Brazilian snakes for providing updated unpublished distribution data.
Conflicts of Interest
The authors declare no conflict of interest.
References
- Fisher, R.A.; Corbet, A.S.; Williams, C.B. The relation between the number of species and the number of individuals in a random sample from an animal population. J. Anim. Ecol. 1943, 12, 42–58. [Google Scholar] [CrossRef]
- Hubbell, S.P. A Unified Theory of Biodiversity and Biogeography; Princeton University Press: Princeton, NJ, USA, 2001; pp. 1–392. [Google Scholar]
- Raphael, M.G.; Marcot, B.G. Introduction. In Conservation of Rare or Little-Known Species: Biological, Social and Economic Considerations; Raphael, M.T., Moline, R., Eds.; Island Press: Washington, DC, USA, 2007; pp. 1–16. [Google Scholar]
- Pimm, S.L.; Jones, H.L.; Diamond, J. On the risk of extinction. Am. Nat. 1988, 132, 757–785. [Google Scholar] [CrossRef]
- Johnson, C.N. Species extinction and the relationship between distribution and abundance. Nature 1998, 394, 272–274. [Google Scholar] [CrossRef]
- Flather, C.H.; Sieg, C.H. Species Rarity: Definition, Causes, and Classification. In Conservation of Rare or Little-Known Species: Biological, Social and Economic Considerations; Raphael, M.T., Moline, R., Eds.; Island Press: Washington, DC, USA, 2007; pp. 40–66. [Google Scholar]
- Gaston, K.J. Rarity; Chapman and Hall Press: London, UK, 1994; pp. 1–205. [Google Scholar]
- Gaston, K.J. What is rarity? In The Biology of Rarity; Kunin, W.E., Gaston, K.J., Eds.; Population and Community Biology Series; Springer: Dordrecht, The Netherlands, 1997; Volume 17, pp. 1–21. [Google Scholar]
- Mace, G.M.; Collar, N.J.; Gaston, K.J.; Hilton-Taylor, C.; Akçakaya, R.; Leader-Williams, N.; Milner-Gulland, E.J.; Stuart, S.N. Quantification of extinction risk: IUCN’s System for Classifying Threatened Species. Conserv. Biol. 2008, 22, 1424–1442. [Google Scholar] [CrossRef] [PubMed]
- Rabinowitz, D. Seven Forms of Rarity. In The Biological Aspects of Rare Plant Conservation; Synge, H., Ed.; John Wiley & Sons: Chichester, UK, 1981; pp. 205–217. [Google Scholar]
- Gaston, K.J.; Blackburn, T.M. Evolutionary age and risk of extinction in the global avifauna. Evol. Ecol. 1997, 11, 557–565. [Google Scholar] [CrossRef]
- Pitman, N.C.A.; Terborgh, J.; Silman, M.R.; Nuñez, P.V. Tree species distributions in an upper Amazonian forest. Ecology 1999, 80, 2651–2661. [Google Scholar] [CrossRef]
- Ricklefs, R.E. Rarity and diversity in Amazonian forest trees. Trends Ecol. Evol. 2000, 15, 83–84. [Google Scholar] [CrossRef]
- Yu, J.; Dobson, F.S. Seven forms of rarity in mammals. J. Biogeogr. 2000, 27, 131–139. [Google Scholar] [CrossRef]
- Casazza, G.; Barberis, G.; Minuto, L. Ecological characteristics and rarity of endemic plants of the Italian Maritime Alps. Biol. Conserv. 2005, 123, 361–371. [Google Scholar] [CrossRef]
- Esparza-Olguín, L.; Valverde, T.; Mandujano, M.C. Comparative demographic analysis of three Neobuxbaumia species (Cactaceae) with differing degree of rarity. Popul. Ecol. 2005, 47, 229–245. [Google Scholar] [CrossRef]
- Söderström, L.; Séneca, A.; Santos, M. Rarity patterns in members of the Lophoziaceae/Scapaniaceae complex occurring North of the Tropics—Implications for conservation. Biol. Conserv. 2007, 135, 352–359. [Google Scholar] [CrossRef]
- Espeland, E.K.; Emam, T.M. The value of structuring rarity: The seven types and links to reproductive ecology. Biodivers. Conserv. 2011, 20, 963–985. [Google Scholar] [CrossRef]
- Harnik, P.G.; Simpson, C.; Payne, J.L. Long-term differences in extinction risk among the seven forms of rarity. Proc. R. Soc. Lond B Biol. Sci. 2012, 279, 4969–4976. [Google Scholar] [CrossRef] [PubMed]
- Anacker, B.L.; Gogol-Prokurat, M.; Leidholm, K.; Schoenig, S. Climate change vulnerability assessment of rare plants in California. Madroño 2013, 60, 193–211. [Google Scholar] [CrossRef]
- Bennett, J.; Vellend, M.; Lilley, P.; Cornwell, W.; Arcese, P. Abundance, rarity and invasion debt among exotic species in a patchy ecosystem. Biol. Invasions 2013, 15, 707–716. [Google Scholar] [CrossRef]
- Toledo, L.F.; Becker, C.G.; Haddad, C.F.B.; Zamudio, K.R. Rarity as indicator of endangerment in neotropical frogs. Biol. Conserv. 2014, 179, 54–62. [Google Scholar] [CrossRef]
- Andelman, S.J.; Groves, C.; Regan, H.M. A review of protocols for selecting species at risk in the context of US Forest Service viability assessments. Acta Oecol. 2004, 26, 75–83. [Google Scholar] [CrossRef]
- Hanski, I. Dynamics of regional distribution: The core and satellite species hypothesis. Oikos 1982, 38, 210–221. [Google Scholar] [CrossRef]
- Giam, X.; Olden, J.D. Drivers and interrelationships among multiple dimensions of rarity for freshwater fishes. Ecography 2018, 41, 331–344. [Google Scholar] [CrossRef]
- Loza, M.I.; Jiménez, I.; Jorgenses, P.M.; Arellano, G.; Macía, M.J.; Torrez, V.W.; Ricklefs, R.E. Phylogenetic patterns of rarity in a regional species pool of tropical woody plants. Glob. Ecol. Biogeogr. 2017, 26, 1043–1054. [Google Scholar] [CrossRef]
- Cofre, H.L.; Böhning-Gaese, K.; Marquet, P.A. Rarity in Chilean forest birds: Which ecological and life-history traits matter? Divers. Distrib. 2007, 13, 203–212. [Google Scholar] [CrossRef]
- Uetz, P. (Ed.) The Reptile Database. Available online: http://www.reptile-database.org (accessed on 1 September 2015).
- Campbell, J.A.; Lamar, W.W. The Venomous Reptiles of the Western Hemisphere; Cornell University Press: Ithaca, NY, USA, 2004; pp. 1–528. [Google Scholar]
- Wüster, W.; Peppin, L.; Pook, C.E.; Walker, D.E. A nesting of vipers: Phylogeny and historical biogeography of the Viperidae (Squamata: Serpentes). Mol. Phylogenetics Evol. 2008, 49, 445–459. [Google Scholar] [CrossRef]
- Alencar, L.R.V.; Quental, T.B.; Grazziotin, F.G.; Alfaro, M.L.; Martins, M.; Venzon, M.; Zaher, H. Diversification in vipers: Phylogenetic relationships, time of divergence and shifts in speciation rates. Mol. Phylogenetics Evol. 2016, 105, 50–62. [Google Scholar] [CrossRef]
- Alencar, L.R.V.; Martins, M.; Greene, H.W. Evolutionary History of Vipers. In Encyclopedia of Life Sciences; John Wiley & Sons Ltd.: Chichester, UK, 2018. [Google Scholar]
- Castoe, T.A.; Parkinson, C.L. Bayesian mixed models and the phylogeny of pitvipers (Viperidae: Serpentes). Mol. Phylogenetics Evol. 2006, 39, 91–110. [Google Scholar] [CrossRef]
- Swaroop, S.; Grab, B. Snakebite mortality in the world. Bull. World Health Organ. 1954, 10, 35–76. [Google Scholar]
- Chippaux, J.P. Snake-bites: Appraisal of the global situation. Bull. World Health Organ. 1998, 75, 515–524. [Google Scholar]
- Galán, J.A.; Sánches, E.E.; Rodríguez-Acosta, A.; Pérez, J.C. Neutralization of venoms from two Southern Pacific Rattlesnakes (Crotalus helleri) with commercial antivenoms and endothermic animal sera. Toxicon 2004, 43, 791–799. [Google Scholar] [CrossRef]
- McCue, M.D. Cost of producing venom in three North American Pitvipers Species. Copeia 2006, 2006, 818–825. [Google Scholar] [CrossRef]
- Gibbs, H.L.; Mackessy, S.P. Functional basis of a molecular adaptation: Prey-specific toxic effects of venom from Sistrurus rattlesnakes. Toxicon 2009, 53, 672–679. [Google Scholar] [CrossRef]
- Klauber, L.M. Rattlesnakes: Their Habits, Life Histories, and Influence on Mankind, 2nd ed.; University of California Press: Berkeley, CA, USA, 1972; pp. 1–1533. [Google Scholar]
- Martins, M.; Marques, M.; Marques, O.; Sazima, I. Ecological and phylogenetic correlates of feeding habits in neotropical pitvipers of the genus Bothrops. In Biology of the Vipers; Schuett, G.W., Höggren, M., Douglas, M.E., Greene, H.W., Eds.; Eagle Mountain Publishing: Eagle Mountain, UT, USA, 2002; pp. 307–328. [Google Scholar]
- Böhm, M.; Collen, B.; Baillie, J.E.M.; Bowles, P.; Chanson, J.; Cox, N.; Hammerson, G.; Hoffmann, M.; Livingstone, S.R.; Rama, M.; et al. The conservation status of the world’s reptiles. Biol. Conserv. 2013, 157, 372–385. [Google Scholar] [CrossRef]
- IUCN. The IUCN Red List of Threatened Species. Version 2017-2. Available online: https://www.iucnredlist.org/ (accessed on 1 July 2017).
- Maritz, B.; Penner, J.; Martins, M.; Crnobrnja-Isailović, J.; Spear, S.; Alencar, L.R.V.; Sigala-Rodriguez, J.; Messenger, K.; Clark, R.; Jenkins, C.; et al. Identifying global priorities for the conservation of vipers. Biol. Conserv. 2016, 204, 94–102. [Google Scholar] [CrossRef] [Green Version]
- Grismer, L.L. An evolutionary classification of reptiles on islands in the Gulf of California, Mexico. Herpetologica 1999, 55, 446–469. [Google Scholar]
- Constable, H.; Guralnick, R.; Wieczorek, J.; Spencer, C.; Peterson, A.T. VertNet Steering Committee. VertNet: A New Model for Biodiversity Data Sharing. PLoS Biol. 2010, 8, e1000309. [Google Scholar] [CrossRef]
- Nogueira, C.C. Atlas of Brazilian Snakes. Manuscript in preparation.
- IUCN. IUCN Red List Categories and Criteria: Version 3.1, 2nd ed.; IUCN Species Survival Commission: Gland, Switzerland; IUCN: Cambridge, UK, 2012; pp. 1–32. [Google Scholar]
- QGIS Development Team. QGIS Geographic Information System. Version 2.8. Open Source Geospatial Foundation Project. Available online: http://www.qgis.org/ (accessed on 1 March 2016).
- Crisp, D.J.; Southward, A.J. The distribution of intertidal organisms along the coasts of the English Channel. J. Mar. Biol. Assoc. UK 1958, 37, 157–203. [Google Scholar] [CrossRef]
- Dobson, A.J.; Barnett, A. An Introduction to Generalized Linear Models; Chapman and Hall/CRC Press: Boca Raton, FL, USA, 2008; pp. 1–320. [Google Scholar]
- Agresti, A.; Kateri, M. Categorical data analysis. In International Encyclopedia of Statistical Science: 206–208; Lovric, M., Ed.; Springer: Berlin, Germany, 2011. [Google Scholar]
- R Core Team. R: A Language and Environment for Statistical Computing; R Foundation for Statistical Computing: Vienna, Austria, 2016; pp. 206–208. [Google Scholar]
- Bonner, J.T. Why Size Matters: From Bacteria to Blue Whales; Princeton University Press: Princeton, NJ, USA, 2011; pp. 1–176. [Google Scholar]
- White, E.P.; Ernest, S.M.; Kerkhoff, A.J.; Enquist, B.J. Relationships between body size and abundance in ecology. Trends Ecol. Evol. 2007, 22, 323–330. [Google Scholar] [CrossRef] [Green Version]
- Whitaker, P.B.; Shine, R. A radiotelemetric study of movements and shelter-site selection by free-randing brownsnakes (Pseudonaja textilis, Elapidae). Herpetol. Monogr. 2003, 17, 130–144. [Google Scholar] [CrossRef]
- Roth, E.D. Spatial ecology of a cottonmouth (Agkistrodon piscivorus) population in East Texas. J. Herpetol. 2005, 39, 308–313. [Google Scholar] [CrossRef]
- Reed, R.N. Interspecific patterns of species richness, geographic range size, and body size among New World venomous snakes. Ecography 2003, 26, 107–117. [Google Scholar] [CrossRef]
- Greene, H.W. Snakes: The Evolution of Mystery in Nature; University of California Press: Berkeley, CA, USA, 1997; pp. 1–366. [Google Scholar]
- Feldman, A.; Sabath, N.; Pyron, A.R.; Mayrose, I.; Meiri, S. Body sizes and diversification rates of lizards, snakes, amphisbaenians and the tuatara. Glob. Ecol. Biogeogr. 2016, 25, 187–197. [Google Scholar] [CrossRef]
- Rapoport, E.H. Areography: Geographical Strategies of Species; Pergamon Press: Oxford, UK, 1982; pp. 1–286. [Google Scholar]
- Stevens, G.C. The latitudinal gradient in geographical range: How so many species coexist in the tropics. Am. Nat. 1989, 133, 240–256. [Google Scholar] [CrossRef]
- Meliadou, A.; Troumbis, A.Y. Aspects of heterogeneity in the distribution of diversity of the European herpetofauna. Acta Oecol. 1997, 18, 393–412. [Google Scholar] [CrossRef]
- Arita, H.T.; Rodríguez, P.; Vázquez-Domínguez, E. Continental and regional ranges of North American mammals: Rapoport’s rule in real and null worlds. J. Biogeogr. 2005, 32, 961–971. [Google Scholar] [CrossRef]
- Whitton, F.J.S.; Purvis, A.; Orme, C.D.L.; Olalla-Tarraga, M.A. Understanding global patterns in amphibian geographic range size: Does Rapoport rule? Glob. Ecol. Biogeogr. 2012, 21, 179–190. [Google Scholar] [CrossRef]
- Dobzhansky, T. Evolution in the tropics. Am. Sci. 1950, 38, 209–221. [Google Scholar]
- Pagel, M.D.; May, R.M.; Collie, A.R. Ecological aspects of the geographical distribution and diversity of mammalian species. Am. Nat. 1991, 137, 791–815. [Google Scholar] [CrossRef]
- Eeley, H.A.C.; Foley, R.A. Species richness, species range size and ecological specialisation among African primates: Geographical patterns and conservation implications. Biodivers. Conserv. 1999, 8, 1033–1056. [Google Scholar] [CrossRef]
- Johnson, C.N. Rarity in the tropics: Latitudinal gradients in the distribution and abundance in Australian mammals. J. Anim. Ecol. 1998, 67, 689–698. [Google Scholar] [CrossRef]
- Symonds, M.R.R.; Christidis, L.; Johnson, C.N. Latitudinal gradients in abundance, and the causes of rarity in the tropics: A test using Australian honeyeaters (Aves: Meliphagidae). Oecologia 2006, 149, 406–417. [Google Scholar] [CrossRef]
- Hadfield, J.D. MCMC Methods for Multi-Response Generalized Linear Mixed Models: The MCMCglmm R Package. J. Stat. Softw. 2010, 33, 1–22. [Google Scholar] [CrossRef]
- Verde Arregoitia, L.D.; Leach, K.; Reid, N.; Fisher, D.O. Diversity, extinction, and threat status in Lagomorphs. Ecography 2015, 38, 1155–1165. [Google Scholar] [CrossRef]
- Heidelberger, P.; Welch, P.D. Simulation run length control in the presence of an initial transient. Oper. Res. 1983, 31, 1109–1144. [Google Scholar] [CrossRef]
- WCS/CIESIN (Wildlife Conservation Society/Center for International Earth Science Information Network, Columbia University). Last of the Wild Project, Version 2, 2005 (LWP-2): Global Human Influence Index (HII) Dataset (Geographic); NASA Socioeconomic Data and Applications Center (SEDAC): Palisades, NY, USA, 2005. Available online: http://sedac.ciesin.columbia.edu/data/set/wildareas-v2-human-footprint-geographic (accessed on 2 February 2014).
- Médail, F.; Verlaque, R. Ecological characteristics and rarity of endemic plants from southeast France and Corsica: Implication for biodiversity conservation. Biol. Conserv. 1997, 80, 269–281. [Google Scholar] [CrossRef]
- Wilson, L.D.; McCranie, J.R. The conservation status of the herpetofauna of Honduras. Amphib. Reptil. Conserv. 2004, 3, 6–33. [Google Scholar]
- Johnson, J.D.; Mata-Silva, V.; Wilson, L.D. A conservation reassessment of the Central American herpetofauna based on the EVS measure. Amphib. Reptil. Conserv. 2015, 9, 1–94. [Google Scholar]
- Wilson, L.D.; Mata-Silva, V.; Johnson, J.D. A conservation reassessment of the reptiles of Mexico based on the EVS measure. Amphib. Reptil. Conserv. 2013, 7, 1–47. [Google Scholar]
- SEMARNAT (Secretaría de Medio Ambiente y Recursos Naturales). Norma Oficial Mexicana NOM-059-SEMARNAT-2010-Protección Ambiental-Especies Nativas de México de Flora y Fauna Silvestres-Categorías de Riesgo y Especificaciones Para su Inclusión, Exclusión o Cambio-Lista de Especies en Riesgo. Diario Oficial de la Federación, 30 December 2010; 1–78. [Google Scholar]
- Foufopoulos, J.; Ives, A.R. Reptiles extinctions on Land-Bridge Islands: Life-history atributes and vulnerability to extinction. Am. Nat. 1999, 153, 1–25. [Google Scholar] [CrossRef]
- Reed, R.N.; Shine, R. Lying in wait for extinction: Ecological correlates of conservation status among Australian Elapid Snakes. Conserv. Biol. 2002, 16, 451–461. [Google Scholar] [CrossRef]
- Luiselli, L. Testing hypotheses on the ecological patterns of rarity using a novel model of study: Snake communities worldwide. Ecology 2006, 6, 44–58. [Google Scholar] [CrossRef]
- Dunn, E.R. Relative abundance of some Panamanian snakes. Ecology 1949, 30, 39–57. [Google Scholar] [CrossRef]
- Duellman, W.E. The Biology of An Equatorial Herpetofauna in Amazonian Ecuador. Misc. Publ. Mus. Nat. Hist. Univ. Kansas 1978, 65, 1–352. [Google Scholar]
- Martins, M.; Oliveira, M.E. Natural history of snakes in forests of the Manaus region, Central Amazonia, Brazil. Herpetol. Nat. Hist. 1998, 6, 78–150. [Google Scholar]
- Fitch, H.S. A Kansas Snake Community: Composition and Changes Over 50 Years; Krieger Publishing Company: Malabar, FL, USA, 1999; pp. 1–165. [Google Scholar]
- Ford, B.N.; Lancaster, D.L. The species-abundance distribution of snakes in a bottomland hardwood forest of the Southern United States. J. Herpetol. 2007, 41, 385–394. [Google Scholar] [CrossRef]
- Sawaya, R.J.; Marques, O.A.V.; Martins, M. Composition and natural history of a Cerrado snake assemblage at Itirapina, São Paulo state, southeastern Brazil. Biota Neotrop. 2008, 8, 129–151. [Google Scholar] [CrossRef]
- Böhm, M.; Kemp, R.; Williams, R.; Davidson, A.D.; Garcia, A.; McMillan, K.M.; Bramhall, H.R.; Collen, B. Rapoport’s rule and determinants of species range size in snakes. Divers. Distrib. 2017, 23, 1472–1481. [Google Scholar] [CrossRef]
- Slatyer, R.A.; Hirst, M.; Sexton, J.P. Niche breadth predicts geographical range size: A general ecological pattern. Ecol. Lett. 2013, 16, 1104–1114. [Google Scholar] [CrossRef]
- Laube, I.; Korntheuer, H.; Schwager, M.; Trautmann, S.; Rahbek, C.; Böhning-Gaese, K. Towards a more mechanistic understanding of traits and range sizes. Glob. Ecol. Biogeogr. 2013, 22, 233–241. [Google Scholar] [CrossRef]
- Estrada, A.; Meireles, C.; Morales-Castilla, I.; Poschlod, P.; Vieites, D.; Araújo, M.B.; Early, R. Species’ intrinsic traits inform their range limitations and vulnerability under environmental change. Glob. Ecol. Biogeogr. 2015, 24, 849–858. [Google Scholar] [CrossRef]
- Holt, R.D. Rarity and evolution: Some theoretical considerations. In The Biology of Rarity; Kunin, W.E., Gaston, K.J., Eds.; Population and Community Biology Series; Springer: Dordrecht, The Netherlands, 1997; Volume 17, pp. 209–234. [Google Scholar]
- Harcourt, A.H. Rarity in the tropics: Biogeography and macroecology of the primates. J. Biogeogr. 2006, 33, 2077–2087. [Google Scholar] [CrossRef]
- Hawkins, B.A.; Diniz-Filho, J.A.F. ‘Latitude’ and geographical patterns in species richness. Ecography 2004, 27, 268–272. [Google Scholar] [CrossRef]
- Letcher, A.J.; Harvey, P.H. Variation in Geographical Range Size Among Mammals of the Palearctic. Am. Nat. 1994, 144, 30–42. [Google Scholar] [CrossRef]
- Collen, B.; Dulvy, N.K.; Gaston, K.J.; Gärdenfors, U.; Keith, D.A.; Punt, A.E.; Regan, H.M.; Böhm, M.; Hedges, S.; Seddon, M.; et al. Clarifying misconceptions of extinction risk assessment with the IUCN Red List. Biol. Lett. 2016, 12, 20150843. [Google Scholar] [CrossRef] [Green Version]
- Martins, M.; (University of São Paulo, São Paulo, São Paulo, Brazil). Personal communication, 2018.
Figure 1.
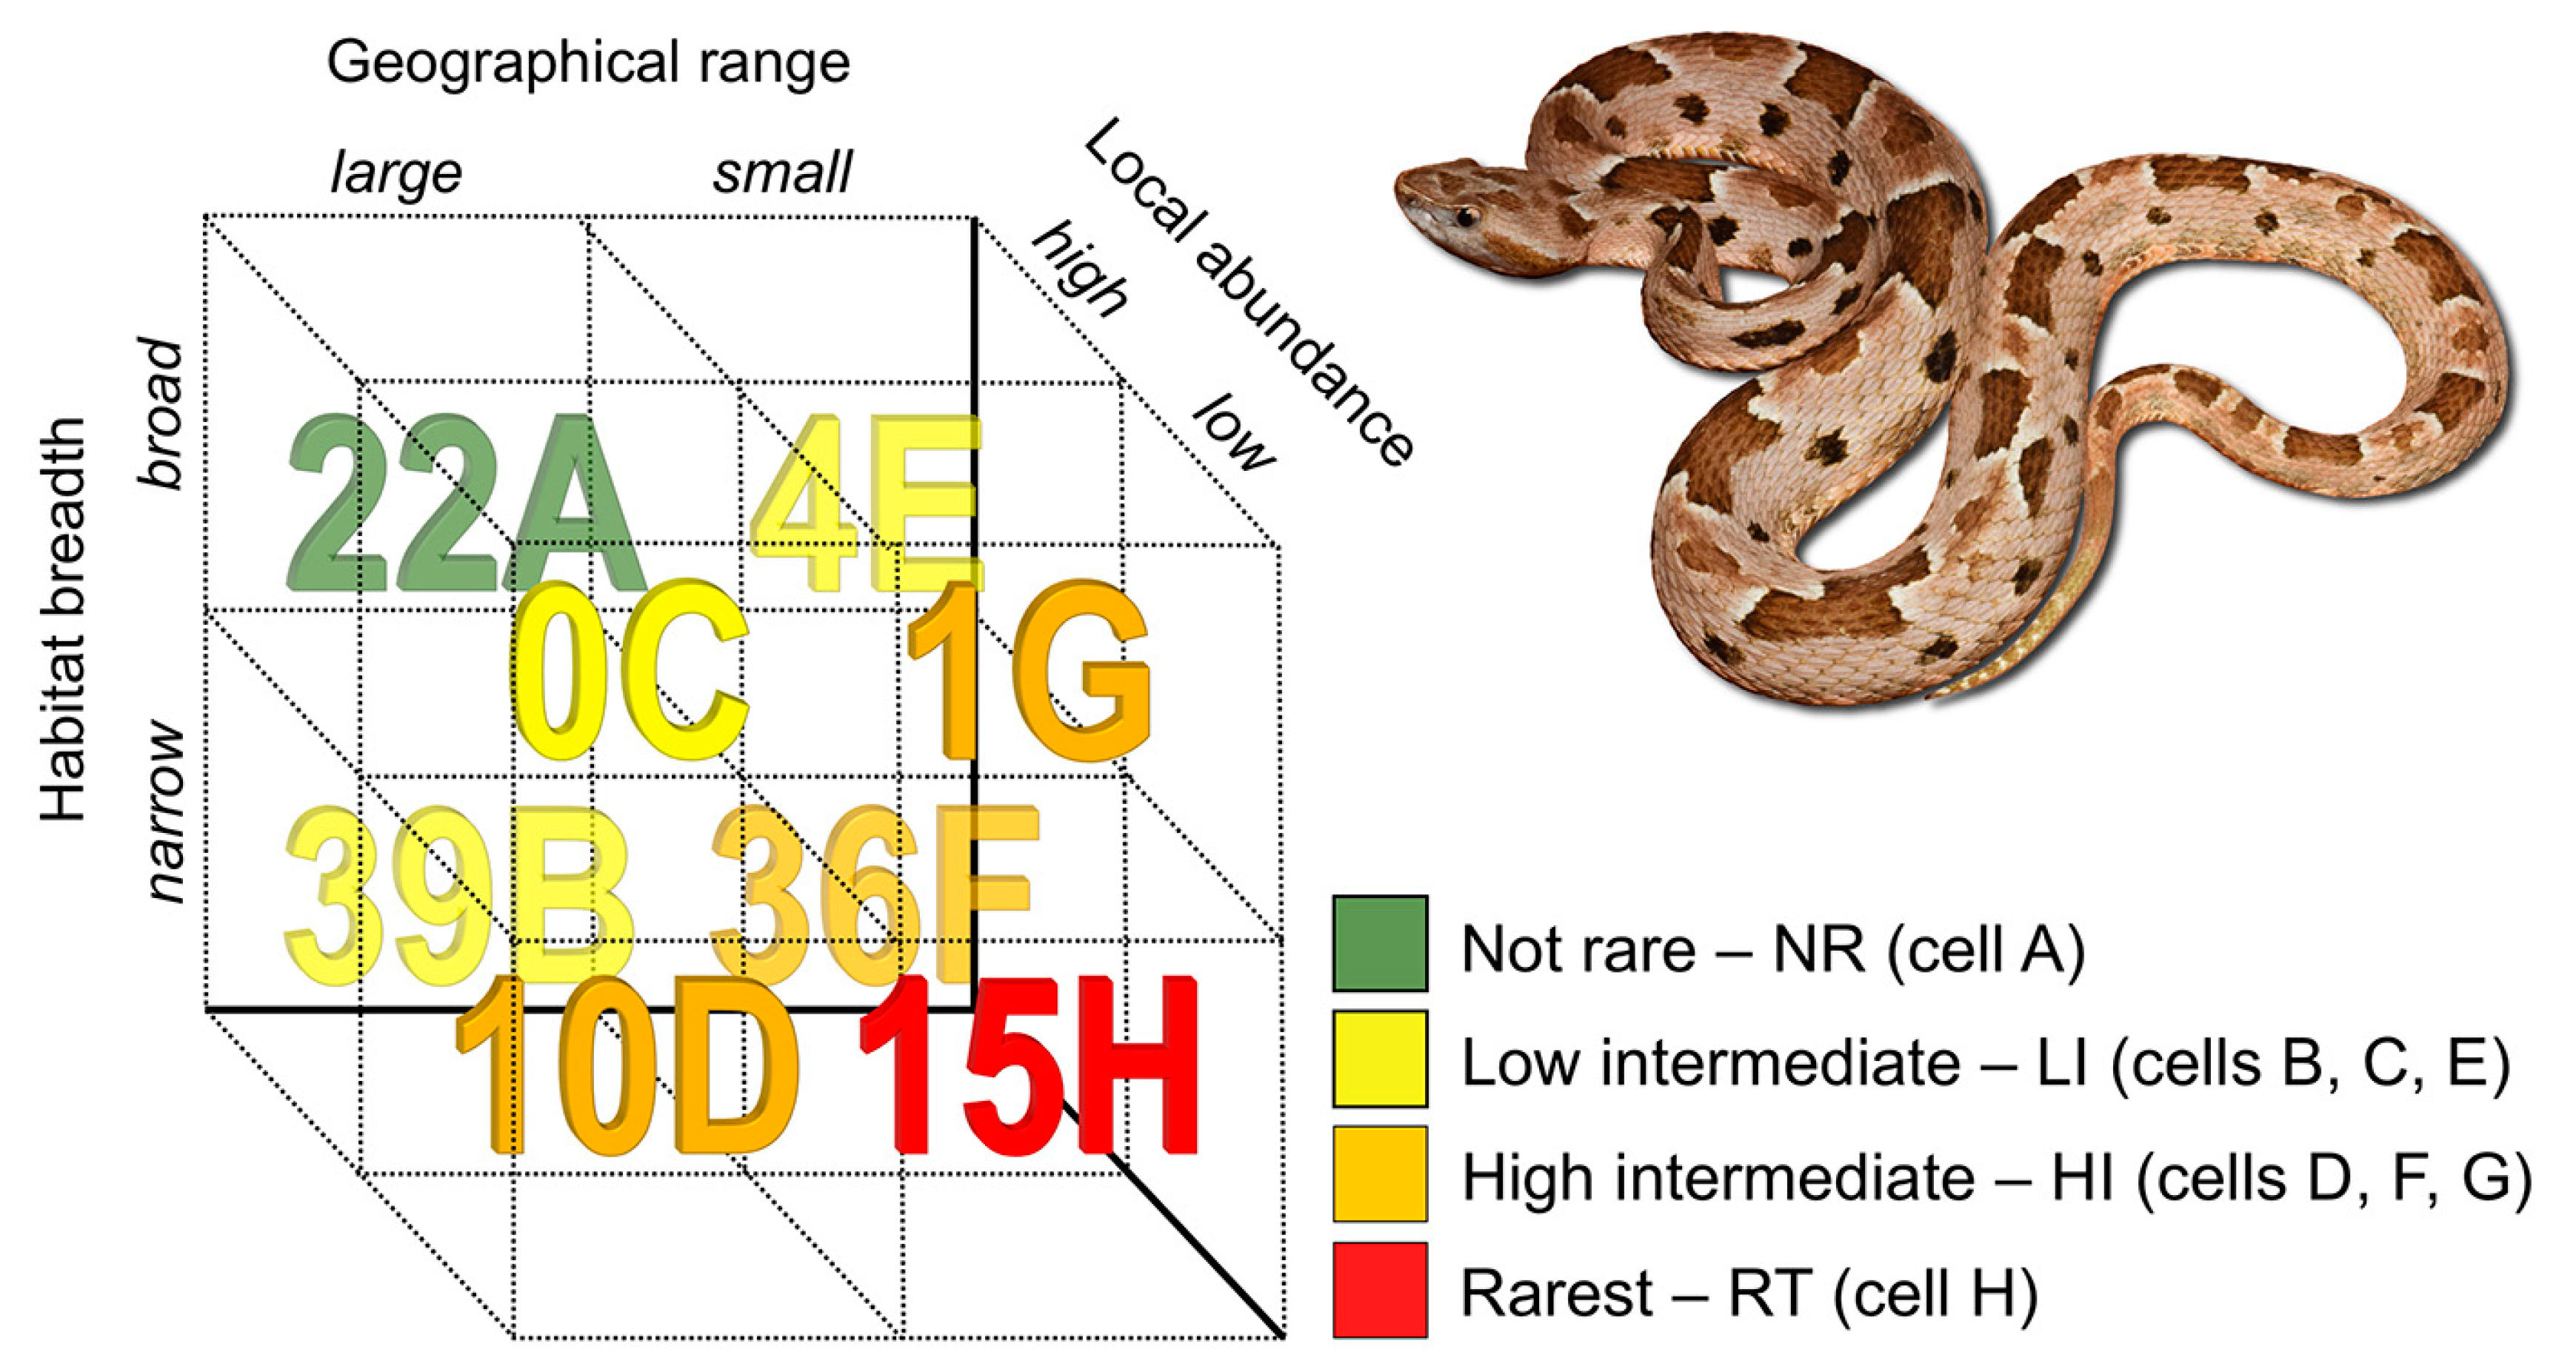
Number of species of New World pitvipers in each rarity cell (letters A to F after each number) of the method proposed by Rabinowitz [10]. The species depicted is Bothrops pauloensis, from southeastern Brazil.
Figure 1.
Number of species of New World pitvipers in each rarity cell (letters A to F after each number) of the method proposed by Rabinowitz [10]. The species depicted is Bothrops pauloensis, from southeastern Brazil.

Figure 2.
Maps depicting the species richness of New World pitvipers, according to different rarity and threat status categories. (A) Distribution of the rarest species (category RT); (B) distribution of rare species considering both higher rarity categories (HI and RT); (C) distribution of threatened species (IUCN (International Union for Conservation of Nature) categories critically endangered, endangered, and vulnerable); (D) species richness of all New World pitvipers.

Figure 3.
Phylogeny of the New World pitvipers, with colors representing different rarity categories.
Figure 3.
Phylogeny of the New World pitvipers, with colors representing different rarity categories.


Table 1.
Categories of rarity (based on Rabinowitz [10]) of New World pitvipers in relation to the categories of the IUCN. CR = Critically endangered; DD = data deficient; EX = extinct; EW = extinct in the wild; EN = endangered; LC = least concern; NT = near threatened; VU = vulnerable. Numbers for threatened categories (CR, EN, and VU) are in bold.
| IUCN Categories | |||||||||
|---|---|---|---|---|---|---|---|---|---|
| Rarity Category | EX | EW | CR | EN | VU | NT | LC | DD | Total |
| Not Rare | 0 | 0 | 0 | 0 | 0 | 0 | 22 | 0 | 22 |
| Low Intermediate | 0 | 0 | 0 | 2 | 0 | 2 | 38 | 1 | 43 |
| High Intermediate | 0 | 0 | 6 | 2 | 4 | 3 | 29 | 3 | 47 |
| Rarest | 0 | 0 | 1 | 3 | 4 | 1 | 4 | 2 | 15 |
| Total | 0 | 0 | 7 | 7 | 8 | 6 | 93 | 6 | 127 |
Table 2.
Comparison of the categorization of New World pitvipers of this study (only the rarest, RT category) with those of extinction risk assessments by IUCN ([42] for the World), Secretaría de Medio Ambiente y Recursos Naturales ([78] for Mexico), Johnson et al. ([76] for Central America), Wilson et al. ([77] for Mexico), and the Threat Index of Maritz et al. ([43] for the World). Categories in the Mexican red list are: A = Amenazada (threatened) and P = En Peligro de Extinción (endangered). Category H (high vulnerability species) in the studies using the Environmental Vulnerability Score (EVS) system indicates a score ≥ 14 (see [75]). An empty cell indicates that the species was not assessed.
| Rarest Species in this Study (Category RT) | IUCN | Mexican Red List | EVS Mexico | EVS Central America | Among top 30 Threat Index in Maritz et al. [43] |
|---|---|---|---|---|---|
| Bothriechis thalassinus | CR | H | no | ||
| Bothrocophias campbelli | EN | no | |||
| Bothrops ayerbei | DD | no | |||
| Bothrops venezuelensis | DD | no | |||
| Cerrophidion sasai | LC | H | no | ||
| Cerrophidion tzotzilorum | LC | yes | |||
| Cerrphidion wilsoni | EN | H | no | ||
| Crotalus caliginis | EN | no | |||
| Crotalus catalinensis | VU | A | H | no | |
| Crotalus intermedius | VU | A | H | no | |
| Crotalus muertensis | VU | H | no | ||
| Crotalus stejnegeri | LC | A | H | no | |
| Crotalus transversus | LC | P | H | yes | |
| Mixcoatlus browni | VU | H | no | ||
| Porthidium arcosae | NT | no |
© 2019 by the authors. Licensee MDPI, Basel, Switzerland. This article is an open access article distributed under the terms and conditions of the Creative Commons Attribution (CC BY) license (http://creativecommons.org/licenses/by/4.0/).
Share and Cite
MDPI and ACS Style
Birskis-Barros, I.; R. V. Alencar, L.; I. Prado, P.; Böhm, M.; Martins, M. Ecological and Conservation Correlates of Rarity in New World Pitvipers. Diversity 2019, 11, 147. https://doi.org/10.3390/d11090147
AMA Style
Birskis-Barros I, R. V. Alencar L, I. Prado P, Böhm M, Martins M. Ecological and Conservation Correlates of Rarity in New World Pitvipers. Diversity. 2019; 11(9):147. https://doi.org/10.3390/d11090147
Chicago/Turabian StyleBirskis-Barros, Irina, Laura R. V. Alencar, Paulo I. Prado, Monika Böhm, and Marcio Martins. 2019. "Ecological and Conservation Correlates of Rarity in New World Pitvipers" Diversity 11, no. 9: 147. https://doi.org/10.3390/d11090147
Note that from the first issue of 2016, this journal uses article numbers instead of page numbers. See further details here.