The Evolution and Population Diversity of Bison in Pleistocene and Holocene Eurasia: Sex Matters
by
 , , and
Thierry Grange
1, 
Jean-Philip Brugal
2,†,
Laurence Flori
3,†,
Mathieu Gautier
4,†,
Antigone Uzunidis
2,† and
Eva-Maria Geigl
1,* 1
Institut Jacques Monod, UMR 7592, CNRS, University Paris Diderot, 75013 Paris, France
2
Aix Marseille University, CNRS, Minist Culture, UMR 7269 LAMPEA, 13094 Aix-en-Provence, France
3
SELMET, INRA, CIRAD, Montpellier SupAgro, Univ Montpellier, 34398 Montpellier, France
4
CBGP, INRA, CIRAD, IRD, Montpellier SupAgro, Univ Montpellier, 34988 Montferrier sur Lez CEDEX, France
*
Author to whom correspondence should be addressed.
†
These authors contributed equally to this work.
Diversity 2018, 10(3), 65; https://doi.org/10.3390/d10030065
Submission received: 26 March 2018
/
Revised: 21 June 2018
/
Accepted: 11 July 2018
/
Published: 18 July 2018
(This article belongs to the Special Issue Ancient DNA)
Abstract
:Knowledge about the origin and evolutionary history of the bison has been improved recently owing to several genomic and paleogenomic studies published in the last two years, which elucidated large parts of the evolution of bison populations during the Upper Pleistocene and Holocene in Eurasia. The produced data, however, were interpreted in contradicting manners. Here, we have gathered, reanalyzed and compared previously published or unpublished morphometric and genetic data that have not yet been integrated and that we synthesize in a unified framework. In particular, we re-estimate dates of divergence of mitogenome lineages based on an extended dataset comprising 81 complete ancient bison mitogenomes and we revisit putative gene flow between the Bos and Bison genera based on comparative analyses of ancient and modern bison genomes, thereby questioning published conclusions. Morphometric analyses taking into account sexual dimorphism invalidate a previous claim that Bison schoetensacki was present in France during the Late Pleistocene. Both morphometric and genome analyses reveal that Eurasian bison belonging to different Bison priscus and Bison bonasus lineages maintained parallel evolutionary paths with gene flow during a long period of incomplete speciation that ceased only upon the migration of B. priscus to the American continent establishing the American bison lineage. Our nuclear genome analysis of the evolutionary history of B. bonasus allows us to reject the previous hypothesis that it is a hybrid of B. priscus and Bos primigenius. Based on present-day behavioral studies of European and American bison, we propose that apparently conflicting lines of evidence can be reconciled by positing that female bison drove the specialization of bison populations to different ecological niches while male bison drove regular homogenizing genetic exchanges between populations.
Keywords:
Bison; Bos; evolution; morphology; genome; paleogenomics; climate change; Pleistocene; Holocene; sexual dimorphism1. Introduction
Archeological and paleontological remains of bison are numerous. Nevertheless, its evolution and taxonomy are still elusive. If it is clearly established that the American bison, B. bison, derives from a Pleistocene migration of the Eurasiatic steppe bison, B. priscus [1,2], the emergence of the European bison or wisent, B. bonasus, is unclear. It appears in the paleontological record in Europe at the beginning of the Holocene (11.7 kiloyears ago (kya; all sample dates herein are expressed as calBP)) when it escaped extinction at the beginning of the 20th c. CE and is still present in the forests of East Europe. Its origin and evolution over the last 50,000 years, however, are still controversially discussed.
For the Quaternary, several species of bison in Eurasia are described, such as Bison shoetensacki, menneri, priscus and bonasus as well as several subspecies (e.g., [3,4]). Their taxonomical status, chronological succession and geographical range, however, remain unclear. This is due to the fact that the morphometric differences of these species are not always characteristic, in particular for the post-cranial skeleton. In addition, the pronounced sexual dimorphism was rarely taken into account in taxonomic studies of these species. To quote just two examples, paleontologists disagree on the persistence during the Upper Pleistocene (126–11.7 kya) of B. schoetensacki and even on its validity as a taxon (e.g., [5]). Similarly, the distinction based on post-cranial skeletal parts between B. priscus and B. bonasus is not firmly established [6]. Thus, the phylogenetic relationships between the ancestors of the European and American bison are not yet understood.
Genetics should be able to clarify the taxonomic situation of the genus Bison, and of Bovina in general. For this, genomic information from both modern and ancient specimens is needed. This situation was achieved only around 2016 when the genome of the extant B. bonasus (wisent) was sequenced [7,8], partial genomic information from historical specimens was obtained [9] and ancient Bison specimens from the Upper Pleistocene and the Holocene in Eurasia yielded sequencing results [10,11,12]. As a consequence, 2016 was declared the year of the wisent [13]. Likewise, in 2017, paleogenetic data focusing on the evolution of the B. priscus lineage in the American continent were produced [1]. Despite this unprecedented interest in the genus Bison and subsequent data production, numerous questions and, to some extent, contradictory conclusions remained. In particular, there are different interpretations to the long-standing observation that European and American bison harbor deeply divergent mitochondrial lineages but are much less divergent at the genomic level [14,15]. Therefore, in order to provide a synthetic view of the evolution of bison in Eurasia during the Late Pleistocene and the Holocene, we decided to (i) analyze osteometric data of Pleistocene bison remains, (ii) perform a re-estimation of the divergence dates of the various branches of Bovina via a Bayesian analysis of all mitogenomes published to date, and (iii) revisit published genomic sequence data suggesting interspecies hybridization between Bos and Bison. These analyses allowed us to identify weak points in published hypotheses concerning the taxonomic assignment of bison remains as well as the evolution and dynamics of bison populations. They also allow us to propose both a different timing and course of the speciation process of bison that contradict the recent hypothesis that the European bison is a hybrid species.
2. Materials and Methods
2.1. Morphometric Analysis of Bison Metapodials
Source of Osteometric Measurements of Bison Samples
To compare various bison populations, we focused on the metacarpal bones III–IV because of their relative abundance in the archeological and paleontological record. Furthermore, they are considered as the most diagnostic for identification so that many studies focused on metapodials. Here we distinguished female from male bones through a preliminary osteometric analysis to avoid confounding factors resulting from sexual dimorphism. We preferred female bones since they show lower interindividual variability within a population and are more frequent in the fossil record. Sexual dimorphism is pronounced in Bovini. Many studies deal with sex identification based on different skull or bone elements (e.g., [5,16,17,18,19]). In the case of metapodials, their length overlaps between the sexes, but the width is clearly distinct (vide infra). We gathered various bone measurements, maximal length (Lmax), transverse and anteroposterior diameters (TD and APD respectively), at the proximal (prox) and distal (dist) ends and at the midshaft (dia) that altogether summarize overall bone morphology. Other variables were not taken into account since they were not provided by all authors and would have restricted the number of bison populations available for analysis. The values of TD and APD discriminate well the sexes. This can be seen in a scatter diagram of the proximal TD and APD (data not shown), as well as with the measurements 3, 4, 5, and 7 presented in the Results sections. Thus, we considered only bones that could be clearly attributed to females to avoid the confounding factors of sexual dimorphism. We collected measurements representing bison populations originating from various Pleistocene and Holocene sites from Eurasia and America, several of which were analyzed paleogenetically [10,11,12]. From the Lower Pleistocene, we analyzed the population of Untermaβfeld (Germany, [4]), identified as Bison menneri, and from Durfort and Vallonnet (France, [20]) identified as Bison schoetensacki. From the Middle Pleistocene, we analyzed the population of Mosbach (Germany, [21]) and Chatillon-Saint-Jean (France, [22]) and from the Upper Pleistocene sites of Siréjol, Jaurens, Igue du Gral, Berbie and the Aven d’Arquet from the South of France and Willment’s Pit in England (unpublished data J.P. Brugal). The material from the Aven d’Arquet was divided into an upper, more recent ensemble (between 10 and 16 m depth) and a lower, more ancient ensemble (between 18 and 21 m). These various populations were all attributed to Bison priscus when male and female bones were distinguished, even though some authors proposed an attribution to Bison schoetensacki of the Jaurens and Siréjol populations when sexual dimorphism was not taken into account [23]. We also used osteometric data from various Eastern Eurasian populations identified as Bison priscus, as well as their sub-species from Siberia (B. p. priscus: sites of Krasny Yar (Riss-Würm: R-W), Taradanovo (W1-2), Krasny Yar (W2), Kurtak and Chumysh (W3)), Yakutia (B. p. crassicornis (W2) and B. p. occidentalis (W3) [these two sub-species are considered to be synonymous]), and Ukraine (B. p. mediator (W3) [24]. Moreover, we have included in our analyses the extant Bison bonasus according to the individual measurements based on sex [21,25]. Finally, several North American populations from the Late Pleistocene—Early Holocene sites of Scottsbluff (Nebraska), Lipscomb (Texas) and Folsom (New Mexico) have also been analyzed, which had been attributed to Bison antiquus and some modern forms of B. b. bison and B. b. athabascae (unpublished data J.P. Brugal, collections from State Museum, University of Nebrasaka, Lincoln and American Museum, New York, NY, USA).
2.2. Analyses of Osteometric Measurements
To compare osteometric data from various bison populations, we first used the log-size-index (LSI, [26,27]), represented as a Simpson’s ratio diagram [28]. The means of the metric data from each population were compared to the mean of the metacarpal bones of male Bos primigenius (n = 18–21) from the Middle-Upper Pleistocene site of Lunel-Viel (France, Hérault [17]) as a reference.
In a second step, we compared populations using a modified variable size index VSI* to normalize the means of the osteometrical data of both the studied (x) and reference (r) populations by the combined standard deviations of these measurements in both populations using the formula [29,30]. The reference population used was the Syncerus caffer population of Kenya (J.P. Brugal unpublished). The choice of a different reference from LSI analysis is justified due to better discrimination for factorial analysis. We calculated the VSI* for available parameters for all studied series (Lmax, proxTD, diaTD, proxAPD) to which we added an index of slenderness 100*distTD/Lmax instead of distTD and these values for the various populations were used for a PCA analysis performed with the software package Multi-SIST ([29]; package elaborated by G. Escarguel [30] and available upon request at UMR CNRS 5023, Laboratoire d’Ecologie des Hydrosystèmes Naturels et Anthropisés, Univ. Lyon 1, France). To evaluate the statistical significance of the relationships between populations identified with the PCA, we performed a bootstrapped spanning network analysis [31] using the Multi-SIST software. Finally, to identify clusters of related populations, we used the R function hclust to perform a hierarchical agglomerative clustering (HAC) with the Ward’s minimum variance method using the squared Euclidian distance and the first two components of the PCA (87.35% expressed). The optimal number of clusters minimizing total intra-cluster variation was determined using a distance criterion and the elbow method.
2.3. Phylogenetic Analyses of Published Bison Mitogenomes
Ancient bison mitochondrial sequences were gathered from five recent publications [1,9,10,11,12], and the modern sequences were from Massilani et al. [10]. Sequence alignments and phylogenetic analyses conducted under the Bayesian framework with the BEAST software were performed as described in Massilani et al. [10] with the following modifications: we used the bison mitogenome substitution rates estimated by Massilani et al. to set the priors (lognormal priors: HVR, mean = −15.0 stdev = 2.0, corresponding to a median of 3.0 × 10⁻⁷ and a 95% highest density interval of [6 × 10⁻⁹−1.5 × 10⁻⁵]; RNA, mean = −17.55 stdev = 2.0, corresponding to a median of 2.4 × 10⁻⁸ [4.7 × 10⁻¹⁰−1.2 × 10⁻⁶]; 1st and 2nd positions, mean = −17.42 stdev = 2.0, corresponding to a median of 2.7 × 10⁻⁸ [5.4 × 10⁻¹⁰−1.7 × 10⁻⁶]; 3rd position, mean = −16.65 stdev = 2.0 corresponding to a median of 5.9 × 10⁻⁸ [1.2 × 10⁻⁹−3 × 10⁻⁶]). We used the Bayesian skyline plot to model the four populations of Bos, Poephagus, Bison priscus and Bison bonasus using a lognormal prior for population sizes, mean = 11.0 stdev = 3.4 corresponding to a median of 6.0 × 10⁴ [76−4.7 × 10⁷]. To estimate the posterior distribution of each parameter of interest, we ran fifteen independent Markov Chain Monte Carlo chains for 20,000,000 iterations and for each parameter of interest, 6400 samples (one every 2500 generated ones) were drawn after discarding the first 20% (burn-in period).
2.4. Meta-Analysis of Publicly Available Genotyping Data Using PCA
The analyzed genotyping data from both modern and ancient wisents together with individuals from closely related species originated from three different sources (see Supplementary Materials Table S1 for details). First, the vcf file containing genotypes for 13 ancient bison sample was downloaded from the supplementary file S5 of Soubrier et al. [5]. The corresponding single nucleotide polymorphisms (SNP) position were derived from the sequencing of ca. 10,000 targeted loci that were part of the BovineSNP50 Illumina Beadchip. After removing duplicated positions (n = 690), genotypes for 9038 SNPs were retained. Note that the resulting data set was very sparsely genotyped. Indeed, among the 13 individuals, 9 displayed more than 70% of missing data (i.e., positions not covered by any sequencing read) with a proportion ranging from 72.4% to 99.1% and were discarded from further analyses. The four remaining ones (i) A15654 (hunted in 1911); (ii) A006 (with a reported age of 18,880 YBP); (iii) A3133 (with a reported age of 26,630 YBP); and (iv) A875 (with a reported age of >50,000 YBP) had 7.61%, 31.3%, 5.95% and 10.4% of missing data, respectively. In the following, we treated genotypes supported by only a single read as missing data making these individual proportions raising to 12.5%, 50.1%, 10.7% and 16.2%, respectively.
The second type of genotyping data, extracted from publicly available whole genome sequences (WGS), were obtained from the NCBI sra archive website (https://www.ncbi.nlm.nih.gov/sra) (see Supplementary Materials Table S1 for details on the corresponding run identifiers). They included nine Bison bonasus individuals: (i) 3569 and 3574 from Gautier et al. [7] and Z3 and 868 from Wecek et al. [9] that all belong to the so-called modern Lowland line; (ii) Dy from Wecek et al. [9] that belong to the Modern Lowland-Caucasian line; (iii) PLANTA (1904–1931) one of the founder of the modern Lowland line and her male offspring PLATEN (1926–1933) [9]; and (iv) Cc1-8853 (1911) and Cc2-22533 (1949) two early 20th century Caucasian wisent [9]. We also included WGS from 20 bovine individuals belonging to the European Angus (n = 10) [32] and the West-African N’Dama (n = 10) [33] breeds. The resulting 29 WGS were mapped onto the UMD3.1 bovine genome assembly [34], using default options of the mem program from the bwa (version 0.7.12) software package [35]. Read alignments with a mapping quality score < 20 and PCR duplicates were further removed using the view (option −q 20) and marked-up (with option −r) programs from the samtools (version 1.6) software package [36]. Variant and genotype calling was then performed on all the samples using the program call from the bcftools (version 1.2) software package implementing the multi-allelic caller option (−m). To be consistent with the above mild filtering criteria, only the genotypes supported by less than two reads were considered as missing. In total, 8611 out of the above 9038 SNPs retained from the data set by Soubrier et al. [11] could be unambiguously genotyped and the corresponding data sets were further combined. Note that only autosomal SNPs were considered.
Last, the third type of genotyping data was obtained from the public WIDDE repository [37] and consisted of genotypes obtained with the BovineSNP50 and BovineHD (that include most of the SNPs from the Bovine SNP50 assay) Illumina Beadchip for (i) 10 individuals different from above belonging to the European Angus bovine breed; (ii) 10 individuals different from above belonging to the West-African N’Dama bovine breed; (iii) 10 individuals belonging to the Indian zebu breed; (iv) 4 modern American bison (Bison bison) individuals [38]; (v) two modern Yak individuals (Peophagus grunniens); and (vi) the two B. bonasus individuals 3569 and 3574 from Gautier et al. [7], mentioned above, that were also newly genotyped on the BovineHD BeadChip. These Illumina BeadChip genotyping data were recoded using home-made awk scripts and combined with the two above data sets, keeping only SNPs that were common to the three experiments. The final data set thus consisted of 7572 SNPs genotyped for 68 individuals among which three were genotyped on two different experiments: (i) the B. bonasus individuals 3569 and 3574 genotyped with both the BovineHD Illumina BeadChip and using WGS data; and (ii) the 1911 Caucasian sample analyzed in Soubrier et al. [11] under the ID A15654 is identical to Cc1-8853 sequenced to 1X coverage by Wecek et al. [9] and correspond to a skull from Kuban Oblast stored in the Zoological Institute of the Russian Academy of Science from Saint Petersburg (numbered 8853). Thus, this allows cross-comparisons across genotyping experiments. Based on the genotyping data, standard PCA following Patterson et al. [39] was performed using custom-made R scripts after applying different filters on the individual genotyping call rate (see Results).
2.5. Estimation of the Divergence between European and American Bison under the CoalHMM Framework
Following Gautier et al. [7], the estimation of divergence between the B. bonasus and B. bison lineages was performed under the coalescent hidden Markov models (CoalHMM) framework [40] considering an isolation (I) model that assumes that the ancestral population split into two populations at time τ into the past [41]. To that end, the alignments of the B. bison genome assembly (GCA_000754665.1) onto the recently published B. bonasus assembly by Wang et al. [8] were extracted from the synteny alignments (bovine.SixSpecies.maf file) accompanying the latter publication using the program MafFilter [42]. The bovine sequence was used as a reference to merge the identified synteny blocks between the two lineages with a maximum distance of 50 kb between them and a minimal size of 10 Mb. In total, 37 non-overlapping autosomal segments (based on anchoring onto the bovine assembly) of 12.6 Mb on average (ranging from 10.1 to 17.5 Mb) were identified. Maximum-likelihood inference of the divergence time was then carried out independently for each segment using the script isolation-model.py (version 1.1) from the IMCoalHMM software package (https://github.com/mailund/IMCoalHMM). More precisely, the parameters underlying the I-model include (i) the split time τ in units of µyT where µy represents the mutation rate per year and T the time in years before present; (ii) the ancestral effective population size in scaled units of θ = 4Neµyg where g is the generation time; and (iii) the recombination rate ρ in scaled units µyg that both parameterize the underlying coalescent process. To translate the time scale in years before present, we assumed µy = 2.1 × 10⁻⁹ [43].
3. Results and Discussion
3.1. Phylogenetic Analyses of Ancient Bison Mitogenomes
Since our publication of 16 complete ancient bison mitogenomes from the Late Pleistocene and the Early Holocene in West Europe, the Caucasus and Siberia in October 2016 [10], several other groups have published complete ancient bison mitogenomes from complementary and overlapping areas in Europe and Asia from the same period [9,11,12], as well as in America [1]. Altogether there are now 86 good quality complete ancient bison mitogenomes available that prompted us to revisit the Bayesian phylogenetic analysis we performed in 2016 using these 86 dated ancient sequences, alongside 400 modern Bovina mitogenome sequences. This allowed us to estimate more robustly the nucleotide substitution rates and the dating of the various radiation events between the mitogenome lineages that we had estimated in 2016 [10]. Furthermore, as depicted in Figure 1A, we used a color code to indicate both the time period and the location of the various sequences that were analyzed to summarize the data, which revealed that the climatic fluctuations during the Late Pleistocene and its transition to the Holocene (11.7 kya to present) led to a succession of bison populations that differed between studies analyzing samples from different locations [10,11]. We considered the last three climatic phases, Marine Isotope Stages (MIS) 1 to 3 and, separately, the modern 20th century samples, as well as five areas of origin: West and central Europe, the Caucasus-Ural region, Siberia and, the North American continent. MIS1 corresponds roughly to the Holocene but starts ~14.5 kya with a stable temperate climate in Europe, North Asia and North America with the exception of the cold spill of the Younger Dryas (12.5–11.5 kya). MIS2, starting ~29 kya, corresponds to the very cold and stable final period of the Pleistocene known as the Last Glacial Maximum (LGM). MIS3, starting ~57 kya corresponds to a generally milder period with regular cold spills. The color-coded phylogenies are displayed in Figure 1, and the summarized distribution of the various bison populations through time in Figure 2. Figure 1A represents the overall Bayesian phylogenies where the bison (Bison priscus/Bison bison and Bison bonasus) lineages are represented in detail and the yak (Poephagus grunniens aka Bos grunniens) and the aurochs-cattle (Bos primigenius and B. p. taurus) lineages in a compacted form. The phylogenetic tree reveals the well-established closer affinities of both the Bison priscus/American bison mitogenomes to those of the yak and of the Bison bonasus mitogenomes to those of the aurochs/cattle. The inclusion of a larger diversity of ancient sequences tends to slow down the nucleotide evolutionary rates by about one third and to increase the ages of the nodes accordingly when compared to our previous estimates (Table 1 and [10]). The median age of the root of all Bovina mitogenomes is estimated at about 1.55 million years ago (Mya), with a 95% HPD between 1.74 and 1.37 Mya whereas the age of the node between the taurine and wisent mitogenome lineages is estimated at about 1.27 [1.44–1.12] Mya (Figure 1A and Table 1). All these dates are included within the estimated dates of the divergence period of the Bison and Bos lineages that seems to have occurred between 1.7 and 0.85 Mya through a speciation process involving an extended period of limited gene flow, as deduced from the comparative analyses of the modern wisent and taurine genomes ([7] and vide infra). Thus, as we discussed previously [10], the peculiar affiliation pattern of the two bison mitogenome lineages most likely results from incomplete lineage sorting within an ancestral Bovina metapopulation during an extended period of speciation rather than later gene flow after the speciation process was completed. Indeed, the latter hypothesis requires that a very rapid speciation event had taken place precisely within the short period between the two radiation events, which seems unlikely ([10] and Figure 1D).
3.2. Bison Priscus in Eurasia and Its Expansion in America
The evolutionary histories of the B. priscus/B. bison and wisent lineages during the Late Pleistocene/Holocene can be reconstituted from the mitogenome phylogeny (see magnifications of the phylogenetic tree in Figure 1B,C). As previously discussed [1], the phylogeny indicates that there were at least two migration events of the Eurasian B. priscus into North America, the first one occurring before 134 kya, which led to a diversification between various branches during the Late Pleistocene, only one of which contained the population that yielded present-day American bison (Figure 1B and Figure 2). The root age of all present-day American bison mitogenomes is estimated at 14 [17,12] kya (Supplementary Materials Table S1), which indicates that there was a major bottleneck at the very end of the Pleistocene and/or around the beginning of the Holocene, at the same time as the Eurasian B. priscus went extinct. This corresponds to a period of generalized megafaunal extinctions in North Eurasia and America that have been attributed to a combination of climate-driven environmental changes and human-mediated pressures [44,45]. It is thus likely that the extinction and severe bottlenecks experienced by B. priscus and its American descendant B. bison were due to the same global causes. On the Eurasian continent, during MIS3 and MIS2, all but one (12 out of 13) of the B. priscus specimens analyzed carry a mitogenome belonging to a single lineage whose root age is estimated at 90 [98,78] kya (Figure 1B). This suggests that the Eurasian B. priscus population already went through a severe bottleneck between the time of the first migration into North America and the beginning of MIS3. The only mitogenome identified outside this group corresponds to the last identified B. priscus specimen dated to 9.5 kya, which was found at the Rauchua river in Far North-East Siberia [46], suggesting that the last surviving pocket population was not a direct descendant of the major population that dominated Siberia during MIS3 and MIS2. This dominant population also colonized both West Europe and North America during MIS2. All bison specimens dating from this period in South France (8 out of 8) belong to this mitogenome branch (Figure 1B and [10]). Furthermore, three out of ten MIS2 specimens from the Yukon (Canada) belong to this same branch, which reveals a second migration event from North Asia to North America that, in contrast to the previous one, did not give rise to surviving present-day American bison (Figure 1B and [1]). Thus, this B. priscus lineage that thrived in the cold part of the Northern hemisphere during the last glacial maximum and that colonized the Holarctic realm from West Europe to North America did not survive the long-lasting warming event at the onset of the Holocene.
3.3. Bison Bonasus Origin and Evolution
The B. bonasus mitogenome lineage can be subdivided into two sublineages that we have termed Bb1 and Bb2 (Figure 1C and [10]. The date of the root of these two lineages is estimated at 395 [445–343] kya, an age that is ancient enough to allow the evolution of adaptations specific to each population if they were allopatric during a large proportion of this period. Bb1, also named Bison X [11] or presumed to belong to the paleontological species Bison schoetensacki [12], corresponds to a lineage that went extinct at the onset of the Holocene whereas Bb2 is the lineage that gave rise to modern-day wisent. Bb1 was found during the MIS3 in specimens from the North Caucasus and France, but then it disappeared from France during the MIS2 where it was replaced by the B. priscus lineage [10]. It remained, however, in East Europe and was found throughout the MIS2 in Ukraine and the Ural plains [11] (Figure 1C and Figure 2). The Bb1 and the B. priscus Bp mitogenome lineages were mostly found in non-overlapping periods and geographic areas, except at the transition between MIS3 and MIS2. For example, towards the end of MIS3, between 39 and 34 kya, during a period of temperature fluctuations of large amplitude with timespans of warmer periods becoming shorter than thousand years, both lineages were found in France [10,12]. Because of the uncertainty of 14C dating and the rapidity of the alternation between warmer and colder periods, it may well be that both lineages did never strictly overlap but occupied different ecological niches that were themselves expanding and contracting following the temperature fluctuations.
The modern wisent Bb2 lineage was found in specimens from periods and locations that differed from those where the Bb1 lineage was found ([10,11] and present study). An exception is the earliest MIS3 specimens of the North Caucasus from the Mezmaiskaya cave, dated at or even beyond the lowest limit of accuracy and reproducibility of 14C dating, i.e., before 47 kya, where two out of twenty analyzed samples belonged to the Bb2 lineage, whereas all the others belonged to the Bb1 lineage [10,11]. During MIS2, we found the Bb2 lineage in all bison specimens from the South Caucasus and then observed its spread into West Europe at the onset of the Holocene ([10] and Figure 1C and Figure 2). It was first detected at the Kesslerloch site in Switzerland 14 kya, and then shown to replace the Bp lineage in France. Most strikingly, we could witness the population turnover in a single site in South France called “Igue du Gral”, where the last Bp specimens were radiocarbon dated around 20–14 kya whereas the first Bb2 specimens were dated at 12.1 and 11.9 kya [10]. An independent analysis of Holocene central European specimens dating from 5.7 kya to the early 20th century [9], alongside the Bb2 samples we identified in France up to the Middle Ages [10] allows the reconstitution of a large proportion of the evolution and diversity reduction of the wisent in Europe during the Holocene (Figure 1C). The root of all the Bb2 mitogenomes has an estimated date of 116 [130–98] kya, but the most ancient (older than 33 kya) North and South Caucasus samples that were genotyped branch away shortly thereafter and the most recent common ancestor of all Holocene wisent mitogenomes, which are also ancestral to the most recent MIS2 South Caucasus specimen (Kud133, 22.3 kya), is dated at 47 [52–38] kya. Two branches separated: one branch led to the specimens from France dating from the Early Holocene to the Middle Ages (Figure 1C and Figure 1 in [10]) and includes the specimens from Austria dating from 1.9 to 1.4 kya (Figure 1C and [9]), while the other branch encompasses all specimens from the Caucasus dating from 22.3 kya to the early 20th century, the specimen from Switzerland dating to 14 kya and all present-day wisent from Poland. Thus, not only the most ancient specimens carrying the wisent Bb2 lineage originate from the Caucasus, but also the branch leading to the present-day wisent has its origin in the Caucasus and has survived there up to 1927. In contrast, the subclade of Bb2 that colonized France during the Holocene was not detected after the first millennium CE, neither in France [10] nor in Austria [9], suggesting that it disappeared from Europe around the Middle Ages. Thus, if climate changes apparently shaped the distribution and the evolution of the various bison populations during the Late Pleistocene, human intervention is the most likely culprit of the diversity reduction and extinction affecting the wisent during the Holocene since it is adapted to temperate climate.
3.4. Morphometric Analysis of Bison Metapodials
The observation that distinct bison populations, possibly corresponding to two species, alternated during the Late Pleistocene was unexpected to one of us (JPB) who has studied the morphology of fossil bison bones and has not observed major striking morphological differences in Western Europe populations between MIS5 and MIS2, except for body-size variations associated to minor phenotypic diversity. Furthermore, there were serious doubts about the validity of the attribution of the Bb1 lineage to the paleontological species of Bison schoetensacki by Palacio and colleagues [12]. Indeed, there is only scant and unconvincing evidence that this species, which had been defined on the ground of morphological features of skull and horn-cores from the Early to the early Middle Pleistocene (ca. 1.2–0.5 Mya), survived up to the Late Pleistocene [47,48]. These two considerations prompted us to revisit the osteometric measurements of bison bones from the Early Pleistocene to modern times in order to evaluate whether it was possible to identify morphological changes that remained unidentified or poorly established up to now.
We gathered morphometric data from multiple previous studies and our own database for one of the best preserved and most frequent bison bones from fossil assemblages that show sufficient morphological diversity and correlation to overall skeletal morphology to be diagnostic for skeletal evolution: the metacarpal bone (Figure 3C). When the length of this element is measured in the Pleistocene series and plotted chronologically separating the males from the females, it appears that there is, despite notable fluctuations, a general tendency of decreasing size over time during the Middle Pleistocene (Figure 3A). During the Late Pleistocene, a period witnessing the succession of bison with different mitotypes, a greater variability in the size of male bones between sites and global size fluctuations are observed. These populations are somewhat smaller than the Middle Pleistocene populations.
The sex-specific differences are reflected in the entire bison skeleton mainly through size differences, but also through morphological differences in some bones, including the metacarpus. This is illustrated through an LSI analysis of the bison metacarpals from the sites of Igue du Gral and Jaurens in France showing not only size differences but also differences in the shape according to sex (Figure 3B,C). This reveals that it is the slenderness, especially expressed at the midshaft, rather than the length of the metacarpus that constitutes the main difference between sexes. Thus, to avoid the confounding effects of sexual dimorphisms, it is essential to differentiate between the sexes for proper phylogenetic and taxonomic interpretations. Here, we focused the morphometrics analyses on bones attributed to females based on the pattern of bone diversity within each studied population.
We first compared various Late Pleistocene European bison populations to explore whether there were specific morphological traits that could be associated to the Bb1 or Bp mitotypes and to look for a possible connection to modern wisent. The curves established from the measurements of the fossil series from Western Europe are strikingly different from the one of extant B. bonasus (Figure 4A). Two different series of curves can be distinguished: (i) the series of Jaurens, La Berbie, Siréjol and Willment’s Pit are comparable, although the series of Siréjol and Willment’s Pit are smaller; (ii) the series of Chatillon-Saint-Jean is bigger and the curve similar to the one of the series of Igue du Gral and Aven d’Arquet with respect to the large TD of the diaphysis (measurement 4: m.4), although the distal end (m.6 and 7) has a slightly different shape. Thus, these comparisons cannot be used to identify specific morphological features that could allow distinction of bison harboring the Bb1 and Bp mitotypes.
It was proposed that one bone sample from the Siréjol cave dated at ca. 36.4 kya and carrying a Bb1 mitotype belonged to B. schoetensacki and thus that this mitotype was characteristic of this species [12]. B. schoetensacki, however, is an early Middle Pleistocene species and there are no robustly assigned specimens later on [47,48]. To explore whether there were similarities between B. schoetensacki samples and the Late Pleistocene samples harboring the Bb1 mitotype, we compared morphometric measurements of their metacarpals (Figure 4B). Bones from the Lower Pleistocene sites of Durfort and Vallonnet are longer (m.1) but with smaller ends and a narrower diaphysis than those of the Middle-Upper Pleistocene sites of Chatillon-Saint-Jean and Siréjol and thus have a more gracile overall appearance (Figure 4B). This is even more pronounced for the Lower Pleistocene B. menneri metacarpals of Untermaβfeld with a TD of the diaphysis that is particularly small (m.4). The metacarpals of the more recent Pleistocene bison have a stockier look, in particular on their two ends, where they are shorter. Thus, there is no clear morphological similarity, at least for the metacarpals, between the early Middle Pleistocene B. schoetensacki samples and the Upper Pleistocene samples that have been genotyped up to now, precluding any robust assignment of the available mitochondrial sequences to B. schoetensacki. The comparison of the measurements of B. priscus from the Siberian, Yakutian and Ukrainian sites [24] among each other and with the extant European bison shows the morphological homogeneity of the fossil series of B. priscus as well as their large size (Figure 4C). Interestingly, B. p. mediator has morphological traits that are very similar to the samples of La Berbie, a French Late Pleistocene site dominated by bison bones carrying the Bp mitotype. In contrast, B. occidentalis bones have a slightly different morphology with a smaller width at the proximal end (m.3). The B. priscus metacarpals are very distinct from those of B. bonasus that are smaller overall with smaller diaphysis dimensions (m.4 and 5) and thinner distal ends (ratio between m.6 and 7).
The North American bison are clearly distinct from the extant European bison, but also from the fossil Eurasian bison (e.g., the Würm I–II series of Taradonovo used for reference in Figure 4D), in particular with respect to their TD/APD ratio of the two ends for the fossil North American bison (B. antiquus) from the Late Pleistocene—Early Holocene sites of Scottsbluff (Nebraska), Lipscomb (Texas) and Folsom (New Mexico) while the modern forms do not show this particular feature of the proximal end (Figure 4D). The diaphysis of the North Canada wood bison B. b. athabascae is more gracile than the one of the Plains bison B. b. bison, while that of B. antiquus has intermediate slenderness. Thus, the morphology of the bison on the American continent has evolved notably after its separation from its ancestral Eurasian ancestor, an evolution that may have been driven by the environmental changes that have occurred since.
To better integrate the interindividual morphometric variability within each population, we used the modified variable size index (VSI*, [29]) and performed a PCA analyses using the combined morphometric values of the European bison (Figure 5A). The first two axes represent 52.15% and 39.12% of the variance, respectively, and the contribution of each variable can be appreciated on the correlation graph (Figure 5B). The network shows the most statistically robust connections between samples as estimated with bootstrapping using the minimal number of simultaneous links that have the best bootstraps values. Finally, samples were clustered together using an agglomerative hierarchical clustering approach and a distance criterion (tree represented in Figure 5C). As clearly visible in Figure 5A, this approach reveals that the Lower Pleistocene samples corresponding to B. schoetensacki (i.e., samples of Dufort and Vallonet) and B. menneri (i.e., sample of Untermassfeld) cluster together and are not related to the Upper Pleistocene samples of Sirejol and Jaurens, which themselves cluster together with the British Islands Willment’s Pit samples. One Sirejol sample has been genotyped to the Bb1 mitotype [12]. The Middle Pleistocene samples of Chatillon-Saint-Jean and Mosbach also cluster together and can be differentiated from the cluster of the end of the Middle Pleistocene to the Upper Pleistocene French samples of Coudoulous, Aven d’Arquet, La Berbie, and Igue du Gral. Samples originating from the sites constituting this latter cluster carried mitogenomes belonging to both the Bp and Bb1 mitotype [10], showing that there is indeed no clear morphological feature distinguishing these two lineages. Morphological differences are mostly correlated with periods, the samples from the Lower, Middle, and Upper Pleistocene, and those of the Holocene can all be distinguished. Strikingly, modern European bison are morphologically distinct from their European predecessors, just like the modern American bison are distinct from their East Asiatic ancestors suggesting that the climate and environmental changes between the Upper Pleistocene and the Holocene have favored similar trends of morphological adaptation to changing ecological niches.
3.5. Comparative Genomic Analyses of Ancient and Modern Bison
Mitochondrial DNA analyses of ancient bison samples indicated that populations with distinct mitotypes occupied successively different territories at different time periods that can be correlated to climatic fluctuations. Since most often a single mitotype was found in each geographic region during a given climatic period, with only partial overlap observed in transition periods between two distinct occupation phases, the most parsimonious interpretation would be that the distinct mitotypes identify independently evolving populations, which could eventually correspond to independent species. This interpretation, however, is challenged by the absence of detectable morphological features clearly distinguishing these populations. It remains possible that the metacarpals, even though providing an abundant source of data allowing analyses at the scale of populations, do not distinguish enough these populations but that other morphological traits could be more discriminative, in particular skull and horn-cores that are much less frequent in the fossil record. The mitogenome, however, is a single genetic locus tracing only the maternal lineage. In contrast, genomic sequences enable us to explore many more markers. In 2016–2018, several groups published genome sequences of present-day and early 20th century Bison bonasus, and sequence capture of genomic sequences corresponding to the modern variability of cattle genomes was performed on ancient European bison samples [11]. These various studies led to a diversity of conclusions regarding the extent, timing and direction of admixture events that occurred between the bison and cattle lineages. Using whole genome sequences from two individuals from the Lowland wisent line and a coalescent hidden Markov model (HMM), Gautier and collaborators estimated that the bison and cattle lineages started diverging about 1.7 Mya followed by an extended period of limited gene flow lasting up to about 850 kya [7]. These dates are corroborated by a recent study of modern genomes of the Bos and Bison species [49]. Furthermore, Gautier et al. found evidence of a small extent of later gene flow between the cattle and modern wisent lineages using D-statistics considering three taxons (Bos p. taurus, Bos p. indicus, and Bison bonasus) and Ovis aries as an outgroup. Given the phylogeny used to estimate D-statistic, only gene flow that occurred after the divergence between the B. p. taurus and B. p. indicus lineages (~260 kya) and in the direction from Bison bonasus to Bos primigenius could be assessed [7]. Wu et al., 2018 [49], detected an even smaller extent of gene flow using also D-statistics with additional genomes and Bubalus bubalis as an outgroup. The traces of wisent ancestry (~0.6%) that Gautier et al. observed in extant bovines suggested secondary contacts between both species and it can reasonably be assumed a mutual crossbreeding [7]. Indeed, Wecek and collaborators that exploited whole genome sequences at 0.9 to 1.6 coverage (and thus unascertained data) of both modern and early 20th century Lowland and Lowland-Caucasian wisent (including founders of both herds and an extinct Caucasian wisent) estimated that 2.4–3.2% of the genomes of the modern founding wisent originate from the cattle lineage and that the early 20th century Caucasian wisent harbored even a slightly lower percentage of cattle genome (1.7%) [9]. Interestingly the signal slightly increased in contemporary wisent when compared to the founder wisent that lived at the beginning of the 20th century. Since different extents of admixture of the cattle lineage with the modern Lowland wisent line, representative of the original founding herd and also extinct Caucasian wisent, were detected, it was proposed that admixture between cattle and wisent was widespread among wisent and that the variable admixture among the founding herd probably explained the variability of the excess of derived alleles shared among domestic cattle and modern wisent. Wecek and colleagues rejected very recent cattle admixture for the individuals they investigated because of the small size in modern wisent genomes of sequence blocks admixed from cattle, which were undetectable at the 1 Mb scale. Moreover, they estimated that admixture events between the Bos and wisent lineages (i) postdated the common ancestor of West European aurochs (represented by an English specimen dated to 6.74 kya [50]) and aurochs from South-West Asia (SWA) (represented by a present-day domestic cattle descending from the ca. 9000-year-old domestication event), (ii) involved a representative of the Bos SWA lineage, and (iii) predated the establishment of captive wisent breeding program in the 20th century. The age of the root of the mitogenomes that characterizes the European and SWA aurochs, belonging to the P and Q/T mitochondrial haplogroups, respectively, has been estimated to 75 kya [51]. In addition, it is likely that the European and SWA aurochs populations were separated by inhospitable ecosystems during the glacial periods of MIS4 and MIS2 and thus could have evolved to give rise to distinct local genetic structures. Altogether, this suggests that the introgression events involving SWA aurochs or domestic cattle detected in this setting postdates the beginning of MIS4, during the Late Pleistocene. The precise identity of the introgressor, SWA aurochs or domestic cattle, is, however, less certain since this introgression event could have happened even after cattle domestication. Using a TreeMix approach [52], Wu et al. observed also an extent of gene flow from the taurine lineage to the common ancestor of European and American bison [49]. They estimated nearly identical dates of divergence between the taurine and zebu lineages on one hand and between the two bison lineages on the other hand (between 200 and 100 kya). Thus, the gene flow detected must have occurred either during a very short time period when the taurine lineage started diverging from the zebu lineage but before gene flow stopped between the bison lineages, or it must have involved an extinct ancestral lineage more closely related to the cattle than to the zebu lineage, as was suggested by Wecek et al. [9].
Finally, comparative analyses of the wisent and American bison genomes revealed the proximity of these two genomes compared to the cattle genome [8]. The percentage of nucleotide differences between the two bison genomes was low, 0.37%, while either of these genomes was equally distant to the cattle genome with 0.93% differences. The percentage differences between the wisent and the American bison were very similar to that separating the taurine and indicine cattle lineages (0.39%). This indicates that the two bison lines have separated much later than their respective mitogenomes, at an age about 0.4-fold that of the separation between the bison and cattle mitochondrial lineages. Accordingly, alignments of the American and European bison assemblies allowed us to estimate, using a coalescent hidden Markov model (coalHMM, see Methods), that the genome divergence between these two lineages goes back to ca. 100 kya (Figure 6A). This date might be interpreted, given the isolation model considered, as the moment when populations ancestral to both lineages stopped exchanging migrants notwithstanding some structuring in the overall ancestral population that would lead to an estimated inflated effective population size Ne (Figure 6B). The production of more extensive genomic data, in particular from the American bison, led to an estimated divergence of the two bison lineages to start about 215 kya, and the gene flow to cease around 102 kya [49], in agreement with the estimation presented here. Hence, the ancestral populations that gave rise to the American and European bison might have started to diverge around the first migration f B. priscus to the American continent (195–135 kya, [1]). Since gene flow between the American and European bison lineages appears to have stopped only about 100 kya, exchanges must have occurred for a while after the two populations occupied different continents.
Even though whole genome analyses agree in indicating a moderate extent of gene flow between the wisent and cattle lineages and do not indicate that the wisent has experienced major gene flow events from cattle when compared to the American bison lineage, a study performed on ancient samples from the Late Pleistocene to the early 20th century led to the strong claim that the wisent is the product of hybridization between the extinct steppe bison Bison priscus and Bos primigenius, ancestors of modern cattle [11]. This claim was based on a sequence capture experiment targeting fewer than 10,000 SNPs included in the BovineSNP50 chip that was aimed at genotyping inter-individual DNA sequence variation within modern cattle breeds [38,53]. Using these data and the f4 ratios, the authors estimated that the wisent genome contained up to 10% aurochs genome ancestry. This is much higher than what was shown from the whole genome analysis mentioned previously [9]. Certain aspects of both the data structure and the methodology used, however, were problematic. First, estimation of bovine ancestry in the wisent genome from bovine ascertained SNPs might be prone to substantial biases. Indeed, the F-statistics approach used to that end implicitly assumes that SNPs were polymorphic at the root of the tree (i.e., in the population ancestral to all the populations surveyed) [54]. Such an assumption might be strongly violated here since the SNPs targeted were initially selected to differentiate individuals within modern cattle breeds with the aim to perform GWAS of traits of agronomic importance [38], and thus are unlikely to reflect genetic variation that preexisted in the common ancestor of bison and cattle. Second, while f4 ratios estimate up to 10.9% of aurochs genomic ancestry in the wisent genome, an ABC approach resulted in a far lower estimate with a 97.2% probability that there is at least 1% aurochs ancestry (and a 87.6% probability that there is at least 5%). Third, in their statistical analyses, the ancient bison sequences yielded strange results compared to the modern sequences: D-statistics showed that the ancient Pleistocene bison belonging to the mitochondrial clades Bp and Bb1, as well as a 1911 Lowland Caucasian wisent were more closely related to each other than to modern wisent, which is clearly not compatible with the evolution period separating the B. bison and B. bonasus lineages (about 100–200 kya, see above) and the one separating the 1911 and modern wisent. The fact that this surprising affinity was also visible on the PCA and on the phylogenetic tree [11] suggested that there were inconsistencies with the data themselves. Most interestingly, the 1911 Caucasian sample analyzed by Soubrier et al. (A15654; [11]) was identical to one of the samples whose genome was sequenced to 1X coverage by Wecek et al. (CC1; [9]): both corresponded to a skull from Kuban Oblast stored in the Zoological Institute from Saint Petersburg and numbered 8853. Since the same sample seemingly led to different conclusions, we reanalyzed using PCA all the various ancient sequences alongside modern ones (Figure 7A,B). In accordance to what was observed by Soubrier et al. [11], all their ancient samples, including the 1911 sample, cluster together and separately from the modern wisent. Strikingly, the ancient samples analyzed by Wecek et al. [9], cluster with modern wisent samples as common sense would predict. In particular, the 1911 Caucasian wisent analyzed concurrently occupies strikingly opposite positions alongside both the PC1 and PC2 axes of the PCA (compare the location of samples A15654 and Cc1 in Figure 6A,B). All 20th and 21st century wisent and American bison samples from various studies with the exception from those of Soubrier et al. [11], occupy neighboring positions on the PCA and show a position with respect to B. p. taurus and P. grunniens that is in agreement with the known genetic distance between these genomes. Furthermore, the data are resistant to differences in the genotyping methods since analyses of Bovine high-density genotyping data and whole genome sequencing data were remarkably consistent even for the two B. bonasus samples, 3569 and 3574 (Figure 7A,B). Thus, it is clear that the capture data of Soubrier et al. [11] must suffer from severe methodological biases that cast some serious doubts on the conclusions based on their nuclear markers. We have not identified with certainty whether the problems stem from reagent contamination with bovine DNA [55], index switching during Illumina sequencing [56], carry-over contamination during successive PCR amplifications [57], capture biases, SNP calling biases or combination of more than one of these causes. We have empirically observed that all these problems can be a source of erroneous data and should be carefully controlled, just as it was essential in the beginning of ancient DNA studies to carefully control PCR artifacts [58].
3.6. Integration of the Paleontological, Morphometrics, Genomic and Mitogenomic Data
3.6.1. Morphometric Data and Mitogenome Lineages
Morphometrics analyses of bison metacarpals of Holarctic fossil and extant series from Eurasia and North America reveals the evolution over time of bison morphology. Four to five different bison groups could be identified in West Europe: (1) B. schoetensacki and B. menneri from the Early and Early Middle Pleistocene; (2) bison of the Middle Pleistocene (Chatillon-Saint-Jean, Mosbach); (3) bison from the end of the Middle Pleistocene to the Late Pleistocene (from Coudoulous to Igue du Gral) that could eventually be divided into two subgroups with the series of Sirejol, Jaurens and Willment’s pit being distinguishable from the others; (4) B. bonasus (Figure 5). The archaic B. schoetensacki is morphologically clearly distinct from the late Middle Pleistocene and Late Pleistocene bison that have been genotyped and it is presently difficult to establish whether there was genetic continuity throughout the Pleistocene with morphological transformations or if there were lineage extinctions, bottlenecks, migrations and inbreeding between different lineages underlying these morphological transformations. Morphological transformations during the Pleistocene can also be seen in East Eurasiatic Bison priscus, as well as in the deriving lineage that migrated into the American continent and gave rise to Bison bison. In this latter continent, it appears unambiguous that the morphological transformations took place within a specific lineage with a Bp mitotype [1], whereas on the Eurasiatic continent, there could have been a wider diversity of lineages contributing to bison morphological evolution. This is still an open question, since, in particular, there are no specimens yet beyond 150 kya that have been genotyped and there are still large gaps in the space and time coverage of the characterization of morphological and genetic features of Eurasiatic bison. While, as previously discussed, there is no solid support for the claim of an association of a 36-ky-old specimen with the Bb1 mitotype to the B. schoetensacki lineage [12], it still remains to be determined whether there was continuity between B schoetensacki and the B. bonasus lineages. Our estimation of an age of the most recent common ancestor (MRCA) of the Bb1 and Bb2 mitotypes of 246 [283–212] kya indicates that this divergence postdates the most recent reliable B. schoetensacki specimen (about 0.7–0.4 Ma [59]), which argues against the idea that B. schoetensacki is ancestral to only one of these lineages. It would be essential to genotype a clearly identified ancient B. schoetensacki specimen to ascertain whether it is ancestral to these two Bb mitotypes. This is challenging, however, given the age of these specimens, but not fully beyond reach.
We could not establish diagnostic correlations between morphological features and mitotypes using the metacarpal. It remains possible, however, that other skeletal bones, like skull and horn-core elements, could be more diagnostic for differences between these two mitotypes. The rarity of these pieces makes it difficult, however, to distinguish intra- and inter-population morphological diversities. Cave art representation has the potential to be an interesting complement to identify such morphological differences. Indeed, distinct representations in cave art that could be associated to either B. priscus and B. bonasus have been proposed [60]. In accordance with this proposal, we could identify in the Chauvet cave two distinct side-by-side representations of bison from the Aurignacian period (ca. 40,000 to 30,000 BP) that were dated to the transition period when bison genotyped with either the Bp or Bb1 were present locally [10]. Interestingly, these bison representations showed the characteristic distinctive features identified by Spassov and Stoychev [60], suggesting that there could indeed be characteristic morphological features distinguishing these two lineages. The difficulty is that, even if there were an underlying biological basis to the diversity of artistic representations, other biological causes could also be considered, like sexual dimorphism or intra-population morphological diversity (ecotype). In favor of alternative interpretations, it is of note that a correlation was established between two distinct bison representations in Late Paleolithic cave art in South France and the identification of two distinct mitotypes at the other end of Europe, in Ural [11]. The various cave paintings showing these two bison forms, however, belong to the Magdalenian period (dating from ca. 17,000 to 12,000 BP) when only a single population carrying the Bp mitotype was present in the vicinity of the corresponding caves [10]. Thus, interpretation of cave art does not seem reliable enough to monitor the dynamics of bison populations during the Late Pleistocene in an unequivocal manner.
The morphometric data, on the other hand, can be used to monitor taxonomical differences, but also depend on several other factors including environmental adaptations [61]. Therefore, it is important to consider environmental aspects in the interpretation of the data, in particular for the Late Pleistocene where we have the highest number of sites, and thus more possibilities of comparison to the present-day situation. For instance, the diaphysis of the extant B. b. athabascae is more gracile than the one of the plains bison B. bison. This latter observation can be correlated with the environment, i.e., the open space of the plains for B. bison while the habitat of B. b. athabascae, the North of Canada, is more closed and wooded. When transferring this factor to the West European fossil bison, it is possible that the observed differences are the consequences of adaptations to different biotopes and climatic conditions. In this way, the large bison of Chatillon-Saint-Jean and of the Aven d’Arquet could correspond to an adaptation to more open environments. Alternatively, the larger size of the metacarpal of the Aven d’Arquet, compared to other series, could also be due to the arrival in South France of a new population of larger individuals. Different food resources could also underlie morphological differences. Based on the tooth microwear pattern, it was proposed that B. menneri and B. priscus were mixed feeders, whereas B. schoetensacki and B. bonasus were mostly grazers [62]. In contrast, based on tooth isotopic data, it was proposed that Late Pleistocene B. priscus of Western Europe were mostly grazer, whereas the early Holocene B. bonasus were mixed feeders [63]. Both studies, however, agree on a certain adaptation of the diet to changing environments. It is not fully clear what were the key environmental changes that triggered the waves of bison population replacement that was observed at various places in Europe during the Late Pleistocene and early Holocene. Based on genetic data collected mostly in France and to some extent in the Caucasus, we proposed that the bison with both the Bb1 and Bb2 mitotypes dominated during the milder periods (some phases of MIS3 and MIS1, respectively), whereas those with the Bp mitotype thrived in France during the LGM of MIS2 [10]. Soubrier et al., however, found an inverse distribution of Bb1 and Bp in Ukraine and in the Ural during MIS3 and MIS2 [11], comprising various climate zones and environments. Thus, the expansions and contractions of these various populations seem to follow a more complex pattern. The biotic and adaptive response of individuals, species and communities to climatic warming and cooling events is a highly complex phenomenon and both climate change and intrinsic biotic controls might have contributed to the reorganization of floral and faunal biomes at different geographic and temporal scales [64,65]. Response of biota to climatic stimuli was regionally distinct, sometimes occurring synchronously but most often diachronously, and the repeated cyclical climate changes have promoted landscape renewal, locally modifying, obliterating and creating specific and varied ecological biotopes [64]. These complex environmental variations must have tilted locally the outcome of the competition between different bison populations in diachronous manners. This makes it difficult to identify unambiguously the specific environmental variables that were the most favorable to the various lineages.
3.6.2. Mitogenome Lineages and Nuclear Genomes
The analyses of the mitogenomes indicate the alternation of two bison populations with mitotypes for which the age of the MRCA can be estimated to 1.55 [1.74–1.37] Mya whereas the age of the MRCA between the Bison bonasus and Bos primigenius mitotypes can be estimated to 1.27 [1.44–1.12] Mya. This is at odds with the distance separating the genome of Bison bonasus from that of Bison bison (0.37%) and of Bos primigenius f. taurus (0.93%) and reveals that the two bison species are closely related and have diverged long after the divergence of bisontine and taurine groups [8]. The analysis of two modern B. bonasus genomes has revealed that the bison and cattle lineages started diverging about 1.7 Mya followed by an extended period of limited gene flow lasting up to about 850 kya [7]. Thus, a model of incomplete lineage sorting of the mitogenomes during the 850 ky period that lasted between the initial and final separation of the bison and cattle lineages, as deduced from nuclear genome analyses, is fully compatible with the dates estimated for the age of the MRCAs of the various mitotypes (Figure 1D and Figure 8). The genomic proximity observed between the modern wisent and bison implies, however, that the two bison populations harboring the two bison mitotypes Bp and Bb must have continued for an extended period to regularly exchange genes. Indeed, coalescent HMM allows to estimate the age of the divergence of the Bison bonasus and Bison bison lineages in-between 200 and 100 kya, i.e., at about the date where the ancestors of Bison bison colonized the American continent (Figure 6A), which stopped exchanges with the Eurasiatic bison population ancestral to the wisent. Thus, this dating estimation, which is corroborated by the results of Wu et al., (2018) [49], suggests that the various bison lineages were still interbreeding from time to time when the Bb1 and Bb2 mitochondrial lineages started diverging (Figure 8). Such an extended period of gene flow lasting throughout the Late Pleistocene would account for the low extent of morphological differences found between the various Late Pleistocene bison in Europe.
Finally, the various genomic analyses of the wisent have shown secondary contacts between the cattle and wisent lineages after their divergence but suggest a complex picture of interbreeding (Figure 8). Gautier et al. date these contacts before the divergence from the Bos p. namadicus lineage, estimated to about 100–200 kya [49], with gene flow from the bison to the cattle genome [7]. Soubrier et al. identified admixture events between B. priscus and aurochs before 120 kya [11], but as discussed before, the underlying data are problematic and there is no evidence in the whole genome data that support the claim that ancient wisents are the product of hybridization between the extinct steppe bison and the aurochs. The study of Wecek et al. identified most recent admixture between cattle lineages and wisent that postdates the separation between the European and SWA aurochs, which may have occurred during the Late Pleistocene [9]. Taken together these results suggested that several gene flow events between the aurochs and bison lineages occurred after 260 kya and again after about 70 kya (Figure 8). Earlier gene flow events could have occurred as well but cannot be detected yet due to the absence of adapted outgroup genomes. The fact that regular gene flow between the Bos and Bison lineages took place for such a long period and up to recent times prompts us to revisit and support the previous proposals that these two genera should not be distinguished [66,67]. Such a unified genus could be called Boson.
3.6.3. Sex-Specific Differences
The extended periods with limited gene flow could account for most of the discrepancies discussed herein between the mitogenomes, nuclear genomes and morphological features. To account for the observation that the mitogenomes appear to characterize distinct populations, whereas the nuclear genomes and bone morphometrics suggest that regular gene flow between populations were occurring simultaneously, there could have been sex-specific differences in the direction of the gene flow, where females are preserving the distinct identities of each population, whereas males are ensuring gene flow between these distinct populations. There are multiple lines of evidence that support such a scenario. First, we observed that the morphological differences between the sexes are more or less pronounced depending on the chronological period. Observation of the evolution of bone morphology suggests that female bison react more with changing morphology to changing environments than do male bison. Females are also more homogeneous in terms of their morphology than males which are more subject, as in many ungulate species, to higher competition for reproduction. Sexual dimorphism is strong in all Bovini, including bison, and large size and fighting ability of bulls have been favored by natural selection [68]. Field studies revealed that the extant American bison observes sexual segregation where males and females form separate groups for most of the year [69]. When sexually segregated, adult males in bull groups used areas with greater per capita abundance of forage, higher proportion of weeds, less nutritious grasses compared with females in cow or mixed groups (with young bulls) which forage selectively on less abundant, higher-quality grasses [70]. These results were interpreted as support of the “sexual dimorphism-body size hypothesis” proposing that males segregate from females because their larger body size requires more abundant forage, while longer ruminal retention permits efficient use of lower-quality forage [70]. Thus, the sexual segregation enables males and females to use different strategies to maximize their fitness [70]. From wood bison, it is also known that cows feed more selectively than bulls, form nursery groups and that the differing foraging strategies result in temporal segregation of the sexes [71]. Finally, group size and composition of the European bison in the Białowieża forest also vary seasonally: mixed groups with calves and one or two young bulls have been observed that are joined by adult bulls for the rut, and groups composed entirely of cows have been observed outside this period [72]. Young bulls usually link up into bachelor groups of 2–7 individuals, while adult or old bulls generally go around on their own or in pairs [72]. Mixed groups of European bison are headed by (old) cows [72]. Bulls are more mobile than herds, occupying and dispersing, in particular during the breeding season, over large territories [72]. This indicates that the marked sexual dimorphism of all bison species is associated with different foraging and dispersal behavior, males being more mobile than females. This could be one of the reasons why females contribute mostly to herd identity and continuity while males ensure gene flow between groups and populations. Similar behavioral differences between sexes in African elephants have also been proposed to underlie the cytonuclear discordance that can be observed between Savannah and Forest elephants [73]. A similar phenomenon could also account for the links between distinct mitotypes and habitat occupation observed for ancient Holocene red deer populations [74]. We propose that low degree of morphological differences in the fossil series of the Late Pleistocene could be the consequence of male-mediated gene flow between overlapping populations of B. bonasus and B. priscus, while the mitochondrial DNA pattern would reflect the response of female-structured herds to changing environments, ultimately resulting in herd or population migrations.
4. Conclusions
The morphometric and genomic analyses performed here on the body of published and unpublished data reveals (i) that the ancestral wisent that was present in West Europe between around 150 and 29 kya is unlikely to represent B. schoetensacki from the Lower Pleistocene; (ii) that the metacarpals of the females of this ancestral wisent were not significantly different from those of the steppe bison suggesting a similar overall morphology; (iii) that the dynamics of the various bison populations followed a more complex pattern than thought, which might also involve different sex-related behaviors and that it is not possible currently to establish a clear relationship with the different Pleistocene environments; (iv) that the speciation process of the Bovina lineages was completed between the Bos and Bison branch by ca. 850 kya and of the various bison lineages by ca. 100 kya, and that further low-level gene flow occurred from Bison to Bos after 260 kya, estimated at 0.6%, and from Bos to Bison estimated at 2.4 to 3.2%, after 70 kya. We also propose that previous estimates of the hybridization between B. primigenius and B. bonasus were exaggerated due to methodological problems, so that the wisent B. bonasus cannot be described as a species that resulted from hybridization between B. priscus and B. primigenius.
Supplementary Materials
The following are available online at https://www.mdpi.com/1424-2818/10/3/65/s1. Table S1: Source and description of the samples included in the meta-analysis of nuclear SNP genotypes.
Author Contributions
All authors analyzed data and drafted their analyses. T.G. and E.-M.G. wrote the manuscript with input from all authors.
Funding
This research was funded by the French National Scientific Research Center CNRS. The genotyping of the two modern European bison (3569 and 3574) was funded by the National Institute of Agronomic Research (INRA, Animal Genetics Division). The genomics and bioinformatics facility of the Institut Jacques Monod were supported by grants to T.G. from the University Paris Diderot, the “Fondation pour la Recherche Médicale” (DGE20111123014), and the “Région Ile-de-France” (grant 11015901), as well as to E.-M.G. from the University Paris Diderot, ARS 2016-2018.
Acknowledgments
We thank E. Andrew Bennett for critical reading of the manuscript.
Conflicts of Interest
The authors declare no conflict of interest.
References
- Froese, D.; Stiller, M.; Heintzman, P.D.; Reyes, A.V.; Zazula, G.D.; Soares, A.E.; Meyer, M.; Hall, E.; Jensen, B.J.; Arnold, L.J.; et al. Fossil and genomic evidence constrains the timing of bison arrival in North America. Proc. Natl. Acad. Sci. USA 2017, 114, 3457–3462. [Google Scholar] [CrossRef] [PubMed] [Green Version]
- Shapiro, B.; Drummond, A.J.; Rambaut, A.; Wilson, M.C.; Matheus, P.E.; Sher, A.V.; Pybus, O.G.; Gilbert, M.T.; Barnes, I.; Binladen, J.; et al. Rise and fall of the Beringian steppe bison. Science 2004, 306, 1561–1565. [Google Scholar] [CrossRef] [PubMed]
- Flerow, C.C. Systematics and evolution. In European Bison—Morphology, Systematics, Evolution, Ecology (in Russian); Sokolov, V.E., Ed.; Nauka (USSR Ac. of Sc.): Moscou, Russia, 1979; pp. 9–127. [Google Scholar]
- Sher, A.V. An early quaternary bison population from untermassfeld: Bison menneri sp. nov. In Das Pleistozän von Untermassfeld bei Meiningen (Thüringen); Kahlke, R.D., Ed.; Römisch-Germanisches Zentralmuseum, Leibniz-Forschungsinstitut für Archäologie, Arbeitsbereich Wissenschaftlicher Verlag: Mainz, Germany, 1997; pp. 101–180. [Google Scholar]
- Drees, M. Sexual dimorphism in Pleistocene Bison priscus (Mammalia, Bovidae) with a discussion on the position of Bison schoetensacki. Senckenberg. Lethaea 2005, 85, 153–157. [Google Scholar] [CrossRef]
- Sala, B. Bison schoetensacki Freud. From Isernia la Pineta (early Mid-Pleistocene, Italy) and revision of the european species of bison. Palaeontogr. Ital. 1986, 74, 113–170. [Google Scholar]
- Gautier, M.; Moazami-Goudarzi, K.; Leveziel, H.; Parinello, H.; Groh, C.; Riall, S.; Kowalczyk, R.; Flori, L. Deciphering the wisent demographic and adaptive histories from individual whole-genome sequences. Mol. Biol. Evol. 2016, 33, 2801–2814. [Google Scholar] [CrossRef] [PubMed]
- Wang, K.; Wang, L.; Lenstra, J.A.; Jian, J.; Yang, Y.; Hu, Q.; Lai, D.; Qiu, Q.; Ma, T.; Du, Z.; et al. The genome sequence of the wisent (Bison bonasus). GigaScience 2017, 6, 1–5. [Google Scholar] [CrossRef] [PubMed]
- Wecek, K.; Hartmann, S.; Paijmans, J.L.A.; Taron, U.; Xenikoudakis, G.; Cahill, J.A.; Heintzman, P.D.; Shapiro, B.; Baryshnikov, G.; Bunevich, A.N.; et al. Complex admixture preceded and followed the extinction of wisent in the wild. Mol. Biol. Evol. 2016, 34, 598–612. [Google Scholar]
- Massilani, D.; Guimaraes, S.; Brugal, J.P.; Bennett, E.A.; Tokarska, M.; Arbogast, R.M.; Baryshnikov, G.; Boeskorov, G.; Castel, J.C.; Davydov, S.; et al. Past climate changes, population dynamics and the origin of Bison in Europe. BMC Biol. 2016, 14, 93. [Google Scholar] [CrossRef] [PubMed]
- Soubrier, J.; Gower, G.; Chen, K.; Richards, S.M.; Llamas, B.; Mitchell, K.J.; Ho, S.Y.; Kosintsev, P.; Lee, M.S.; Baryshnikov, G.; et al. Early cave art and ancient DNA record the origin of European bison. Nat. Commun. 2016, 7, 13158. [Google Scholar] [CrossRef] [PubMed] [Green Version]
- Palacio, P.; Berthonaud, V.; Guerin, C.; Lambourdiere, J.; Maksud, F.; Philippe, M.; Plaire, D.; Stafford, T.; Marsolier-Kergoat, M.C.; Elalouf, J.M. Genome data on the extinct Bison schoetensacki establish it as a sister species of the extant European bison (Bison bonasus). BMC Evol. Biol. 2017, 17, 48. [Google Scholar] [CrossRef] [PubMed]
- Lenstra, J.A.; Liu, J. The year of the wisent. BMC Biol. 2016, 14, 100. [Google Scholar] [CrossRef] [PubMed]
- Hassanin, A.; An, J.; Ropiquet, A.; Nguyen, T.T.; Couloux, A. Combining multiple autosomal introns for studying shallow phylogeny and taxonomy of Laurasiatherian mammals: Application to the tribe Bovini (Cetartiodactyla, Bovidae). Mol. Phylogenet. Evol. 2013, 66, 766–775. [Google Scholar] [CrossRef] [PubMed]
- Verkaar, E.L.; Nijman, I.J.; Beeke, M.; Hanekamp, E.; Lenstra, J.A. Maternal and paternal lineages in cross-breeding bovine species. Has wisent a hybrid origin? Mol. Biol. Evol. 2004, 21, 1165–1170. [Google Scholar] [CrossRef] [PubMed]
- Bedord, J.N. A technique for sex determination of mature bison metapodials. Plains Anthropol. 1978, 23, 40–43. [Google Scholar] [CrossRef]
- Brugal, J.-P. Le Bos primigenius Boj, 1827 du Pléistocène moyen des grottes de Lunel-Viel (Hérault). Bull. Mus. Anthropol. Préhist. Monaco Monaco 1985, 28, 7–62. [Google Scholar]
- Lewis, P.J.; Buchanan, B.; Johnson, E. Sexing bison metapodials using principal componentn analysis. Plains Anthropol. 2005, 50, 1–14. [Google Scholar] [CrossRef]
- Kobrynczuk, F.; Krasinska, M.; Szara, T. Sexual dimorphism in skulls of the lowland European bison, Bison bonasus bonasus. Ann. Zool. Fenn. 2008, 45, 335–340. [Google Scholar] [CrossRef]
- Brugal, J.P. Le bison (Bovinae, Artiodactyla) du gisement pléistocène moyen ancien de durfort (Gard, France). Bull. Mus. Natl. Hist. Nat. Paris 1995, 16, 349–381. [Google Scholar]
- Schertz, E. Der geschlechtsunterschied an metapodien von bison. Senckenberg. Lethaea 1936, 18, 357-38. [Google Scholar]
- Mourer-Chauvire, C. Etude de nouveaux restes de vertébrés provenant de la carrière Fournier à Chatillon-Saint-Jean (Drôme). III: Artiodactyles, chevaux et oiseaux. Bull. Assoc. Fr. Etud. Quat. 1972, 4, 271–302. [Google Scholar]
- Guérin, C.; Valli, A.M.F. Le gisement pléistocène supérieur de la grotte de Jaurens à Nespouls, Corrèze: Les Bovidae (Mammalia, Artiodactyla). Cah. Sci. Mus. Hist. Nat. Lyon 2000, 1, 7–39. [Google Scholar]
- Vasiliev, S.K. Late Pleistocene bison (Bison p. priscus bojanus, 1827) from the southeastern part of Western Siberia. Archaeol. Ethnol. Anthropol. Eurasia 2008, 34, 34–56. [Google Scholar] [CrossRef]
- Empel, W.; Roskosz, T. Das skelett der gliedmaβen des wisents, Bison bonasus linnaeus 1758. Acta Theriol. 1963, 7, 259–300. [Google Scholar] [CrossRef]
- Meadow, R.H. Early animal domestication in South Asia a first report of the faunal remains from mehrgarh pakistan. In South Asian Archaeology 1979; Härtel, H., Ed.; Dietrich Reimer: Berlin, Germany, 1981; pp. 143–179. [Google Scholar]
- Meadow, R.H. The use of size index scaling techniques for research on archaeozoological collections from the Middle East. In Historici Animalium ex Ossibus. Festschrift Angela Von Den Driesch Zum 65. Geburtstag; Becker, C., Manhart, H., Peters, J., Schibler, J., Eds.; Verlag Marie Leidorf: Rahden/Westf, Germany, 1999; pp. 285–300. [Google Scholar]
- Simpson, G.G. Large pleistocene felines of North America. Am. Mus. Novit. 1941, 1136, 1–27. [Google Scholar]
- Boudadi-Maligne, M.; Escarguel, G. A biometric re-evaluation of recent claims for early upper palaeolithic wolf domestication in Eurasia. J. Archaeol. Sci. 2014, 45, 80–89. [Google Scholar] [CrossRef]
- Escarguel, G. Macroécologie en Temps Profond: Motifs, Rythmes et Modalities des Changements de Biodiversité à L’échelle des Temps Géologiques; Université Claude Bernard Lyon 1: Lyon, France, 2008. [Google Scholar]
- Brayard, A.; Escarguel, G.; Bucher, H. The biogeography of early triassic ammonoid faunas: Clusters, gradients, and networks. Geobios 2007, 40, 749–765. [Google Scholar] [CrossRef]
- Daetwyler, H.D.; Capitan, A.; Pausch, H.; Stothard, P.; van Binsbergen, R.; Brondum, R.F.; Liao, X.; Djari, A.; Rodriguez, S.C.; Grohs, C.; et al. Whole-genome sequencing of 234 bulls facilitates mapping of monogenic and complex traits in cattle. Nat. Genet. 2014, 46, 858–865. [Google Scholar] [CrossRef] [PubMed]
- Kim, J.; Hanotte, O.; Mwai, O.A.; Dessie, T.; Bashir, S.; Diallo, B.; Agaba, M.; Kim, K.; Kwak, W.; Sung, S.; et al. The genome landscape of indigenous African cattle. Genome Biol. 2017, 18, 34. [Google Scholar] [CrossRef] [PubMed]
- Liu, Y.; Qin, X.; Song, X.Z.; Jiang, H.; Shen, Y.; Durbin, K.J.; Lien, S.; Kent, M.P.; Sodeland, M.; Ren, Y.; et al. Bos taurus genome assembly. BMC Genom. 2009, 10, 180. [Google Scholar] [CrossRef] [PubMed]
- Li, H.; Durbin, R. Fast and accurate short read alignment with Burrows-Wheeler transform. Bioinformatics 2009, 25, 1754–1760. [Google Scholar] [CrossRef] [PubMed] [Green Version]
- Li, H.; Handsaker, B.; Wysoker, A.; Fennell, T.; Ruan, J.; Homer, N.; Marth, G.; Abecasis, G.; Durbin, R.; Genome Project Data Processing Subgroup. The sequence alignment/map format and SAMtools. Bioinformatics 2009, 25, 2078–2079. [Google Scholar] [CrossRef] [PubMed]
- Sempere, G.; Moazami-Goudarzi, K.; Eggen, A.; Laloe, D.; Gautier, M.; Flori, L. WIDDE: A web-interfaced next generation database for genetic diversity exploration, with a first application in cattle. BMC Genom. 2015, 16, 940. [Google Scholar] [CrossRef] [PubMed]
- Matukumalli, L.K.; Lawley, C.T.; Schnabel, R.D.; Taylor, J.F.; Allan, M.F.; Heaton, M.P.; O’Connell, J.; Moore, S.S.; Smith, T.P.; Sonstegard, T.S.; et al. Development and characterization of a high density SNP genotyping assay for cattle. PLoS ONE 2009, 4, e5350. [Google Scholar] [CrossRef] [PubMed]
- Patterson, N.; Price, A.L.; Reich, D. Population structure and eigenanalysis. PLoS Genet. 2006, 2, e190. [Google Scholar] [CrossRef] [PubMed]
- Hobolth, A.; Christensen, O.F.; Mailund, T.; Schierup, M.H. Genomic relationships and speciation times of human, chimpanzee, and gorilla inferred from a coalescent hidden Markov model. PLoS Genet. 2007, 3, e7. [Google Scholar] [CrossRef] [PubMed]
- Mailund, T.; Dutheil, J.Y.; Hobolth, A.; Lunter, G.; Schierup, M.H. Estimating divergence time and ancestral effective population size of Bornean and Sumatran orangutan subspecies using a coalescent hidden Markov model. PLoS Genet. 2011, 7, e1001319. [Google Scholar] [CrossRef] [PubMed]
- Dutheil, J.Y.; Gaillard, S.; Stukenbrock, E.H. MafFilter: A highly flexible and extensible multiple genome alignment files processor. BMC Genom. 2014, 15, 53. [Google Scholar] [CrossRef] [PubMed]
- Liu, G.E.; Matukumalli, L.K.; Sonstegard, T.S.; Shade, L.L.; Van Tassell, C.P. Genomic divergences among cattle, dog and human estimated from large-scale alignments of genomic sequences. BMC Genom. 2006, 7, 140. [Google Scholar] [CrossRef] [PubMed]
- Cooper, A.; Turney, C.; Hughen, K.A.; Brook, B.W.; McDonald, H.G.; Bradshaw, C.J. Abrupt warming events drove Late Pleistocene Holarctic megafaunal turnover. Science 2015, 349, 602–606. [Google Scholar] [CrossRef] [PubMed]
- Lorenzen, E.D.; Nogues-Bravo, D.; Orlando, L.; Weinstock, J.; Binladen, J.; Marske, K.A.; Ugan, A.; Borregaard, M.K.; Gilbert, M.T.; Nielsen, R.; et al. Species-specific responses of Late Quaternary megafauna to climate and humans. Nature 2011, 479, 359–364. [Google Scholar] [CrossRef] [PubMed] [Green Version]
- Kirillova, I.V.; Zanina, O.G.; Chernova, O.F.; Lapteva, E.G.; Trofimova, S.S.; Lebedev, V.S.; Tiunov, A.V.; Soares, A.E.R.; Shidlovskiy, F.K.; Shapiro, B. An ancient bison from the mouth of the Rauchua River (Chukotka, Russia). Quat. Res. 2015, 84, 232–245. [Google Scholar] [CrossRef] [Green Version]
- Brugal, J.P.; Croitor, R. Evolution, ecology and biochronology of herbivore associations in Europe during the last 3 million years. Quaternaire 2007, 18, 129–152. [Google Scholar] [CrossRef]
- Maniakas, I.; Kostopoulos, D.S. Morphometric-palaeoecological discrimination between bison populations of the western Palaearctic. Geobios 2017, 50, 155–171. [Google Scholar] [CrossRef]
- Wu, D.-D.; Ding, X.-D.; Wang, S.; Wojcik, J.M.; Zhang, Y.; Tokarska, M.; Li, Y.; Wang, M.-S.; Faruque, O.; Nielsen, R.; et al. Pervasive introgression facilitated domestication and adaptation in the Bos species complex. Nat. Ecol. Evol. 2018, 1139–1145. [Google Scholar] [CrossRef] [PubMed]
- Park, S.D.; Magee, D.A.; McGettigan, P.A.; Teasdale, M.D.; Edwards, C.J.; Lohan, A.J.; Murphy, A.; Braud, M.; Donoghue, M.T.; Liu, Y.; et al. Genome sequencing of the extinct Eurasian wild aurochs, Bos primigenius, illuminates the phylogeography and evolution of cattle. Genome Biol. 2015, 16, 234. [Google Scholar] [CrossRef] [PubMed]
- Achilli, A.; Olivieri, A.; Pellecchia, M.; Uboldi, C.; Colli, L.; Al-Zahery, N.; Accetturo, M.; Pala, M.; Kashani, B.H.; Perego, U.A.; et al. Mitochondrial genomes of extinct aurochs survive in domestic cattle. Curr. Biol. 2008, 18, R157–R158. [Google Scholar] [CrossRef] [PubMed] [Green Version]
- Pickrell, J.K.; Pritchard, J.K. Inference of population splits and mixtures from genome-wide allele frequency data. PLoS Genet. 2012, 8, e1002967. [Google Scholar] [CrossRef] [PubMed]
- Gibbs, R.A.; Taylor, J.F.; Van Tassell, C.P.; Barendse, W.; Eversole, K.A.; Gill, C.A.; Green, R.D.; Hamernik, D.L.; Kappes, S.M.; Lien, S.; et al. Genome-wide survey of SNP variation uncovers the genetic structure of cattle breeds. Science 2009, 324, 528–532. [Google Scholar] [PubMed]
- Patterson, N.; Moorjani, P.; Luo, Y.; Mallick, S.; Rohland, N.; Zhan, Y.; Genschoreck, T.; Webster, T.; Reich, D. Ancient admixture in human history. Genetics 2012, 192, 1065–1093. [Google Scholar] [CrossRef] [PubMed]
- Champlot, S.; Berthelot, C.; Pruvost, M.; Bennett, E.A.; Grange, T.; Geigl, E.M. An efficient multistrategy DNA decontamination procedure of PCR reagents for hypersensitive PCR applications. PLoS ONE 2010, 5, e13042. [Google Scholar] [CrossRef] [PubMed]
- Kircher, M.; Sawyer, S.; Meyer, M. Double indexing overcomes inaccuracies in multiplex sequencing on the Illumina platform. Nucleic Acids Res. 2012, 40, e3. [Google Scholar] [CrossRef] [PubMed]
- Pruvost, M.; Grange, T.; Geigl, E.-M. Minimizing DNA contamination by using UNG-coupled quantitative real-time PCR on degraded DNA samples: Application to ancient DNA studies. Biotechniques 2005, 38, 569–575. [Google Scholar] [CrossRef] [PubMed]
- Cooper, A.; Poinar, H.N. Ancient DNA: Do it right or not at all. Science 2000, 289, 1139. [Google Scholar] [CrossRef] [PubMed]
- Kahlke, R.D.; García, N.; Kostopoulos, D.S.; Lacombat, F.; Lister, A.M.; Mazza, P.P.A.; Spassov, N.; Titov, V.V. Western Palaearctic palaeoenvironmental conditions during the Early and early Middle Pleistocene inferred from large mammal communities, and implications for hominin dispersal in Europe. Quat. Sci. Rev. 2011, 30, 1368–1395. [Google Scholar] [CrossRef]
- Spassov, N.; Stoytchev, T. On the origin of the wisent, Bison bonasus (Linnaeus, 1758): Presence of the wisent in the upper Palaeolithic art of Eurasia. In Advances in Vertebrate Paleontology “Hen to Panta”; “Emil Racoviță” Institute of Speleology: Bucharest, Romania, 2003; pp. 125–130. [Google Scholar]
- Pivonka, P. Multiscale Mechanobiology of Bone Remodeling and Adaptation; Springer: Cham, Switzerland, 2018; p. 286. [Google Scholar]
- van Asperen, E.N.; Kahlke, R.D. Dietary traits of the late early Pleistocene Bison menneri (Bovidae, Mammalia) from its type site Untermassfeld (Central Germany) and the problem of Pleistocene ‘wood bison’. Quat. Sci. Rev. 2017, 177, 299–313. [Google Scholar] [CrossRef]
- Bocherens, H.; Hofman-Kaminska, E.; Drucker, D.G.; Schmolcke, U.; Kowalczyk, R. European bison as a refugee species? Evidence from isotopic data on early Holocene bison and other large herbivores in northern Europe. PLoS ONE 2015, 10, e0115090. [Google Scholar] [CrossRef] [PubMed]
- Palombo, M.R. Deconstructing mammal dispersals and faunal dynamics in SW Europe during the Quaternary. Quat. Sci. Rev. 2014, 96, 50–71. [Google Scholar] [CrossRef]
- Markova, A.K.; Puzachenko, A.Y.; van Kolfschoten, T.; Kosintsev, P.A.; Kuznetsova, T.V.; Tikhonov, A.N.; Bachura, O.P.; Ponomarev, D.V.; van der Pflicht, J.; Kuitems, M. Changes in the Eurasian distribution of the musk ox (Ovibos moschatus) and the extinct bison (Bison priscus) during the last 50 ka BP. Quat. Int. 2015, 378, 99–110. [Google Scholar] [CrossRef]
- Simpson, G.G. Principles of Animal Taxonomy; Columbia University Press: New York, NY, USA, 1961. [Google Scholar]
- Van Gelder, R.G. Mammalian Hybrids and Generic Limits. Am. Mus. Novit. 1977, 2635, 1–25. [Google Scholar]
- Lott, D.F. American Bison: A Natural History; University of California Press: Berkeley, CA, USA, 2002. [Google Scholar]
- Post, D.M.; Armbrust, T.S.; Horne, E.A.; Goheen, J.R. Sexual segregation results in differences in content and quality of bison (Bos bison) diets. J. Mammal. 2001, 82, 407–413. [Google Scholar] [CrossRef]
- Mooring, M.S.; Reisig, D.D.; Osborne, E.R.; Kanallakan, A.L.; Hall, B.M.; Schaad, E.W.; Wiseman, D.S.; Huber, R.R. Sexual segregation in bison: A test of multiple hypotheses. Behaviour 2005, 142, 897–927. [Google Scholar] [CrossRef]
- Komers, P.E.; Messier, F.; Gates, C.C. Group structure in wood bison: Nutritional and reproductive determinants. Can. J. Zool. 1993, 71, 1367–1371. [Google Scholar] [CrossRef]
- Krasińska, M.; Krasiński, Z.A. European Bison: The Nature Monograph, 2nd ed.; Springer: Heidelberg, Germany, 2013. [Google Scholar]
- Rohland, N.; Reich, D.; Mallick, S.; Meyer, M.; Green, R.E.; Georgiadis, N.J.; Roca, A.L.; Hofreiter, M. Genomic DNA sequences from mastodon and woolly mammoth reveal deep speciation of forest and savanna elephants. PLoS Biol. 2010, 8, e1000564. [Google Scholar] [CrossRef] [PubMed] [Green Version]
- Schnitzler, A.; Granado, J.; Putelat, O.; Arbogast, R.M.; Drucker, D.; Eberhard, A.; Schmutz, A.; Klaefiger, Y.; Lang, G.; Salzburger, W.; et al. Genetic diversity, genetic structure and diet of ancient and contemporary red deer (Cervus elaphus L.) from north-eastern France. PLoS ONE 2018, 13, e0189278. [Google Scholar]
Figure 1.
Bayesian phylogeny of complete mitogenomes of Bos and Bison. We used the 86 complete mitogenomes of ancient Bison available in Genbank at the end of 2017, and all 420 modern Bison bison, Bison bonasus, Poephagus grunniens, and Bos primigenius taurus mitogenomes available in Genbank in 2015. The B. bison, P. grunniens and B. p. taurus sequences have been collapsed to preserve only their subclade structure. The estimates of the age of the nodes, in kya, are indicated in red, with the 95% HPD indicated by blue bars. The statistical supports of the nodes are indicated in red (Bayesian posterior probability). Sequence names were colored according to period and geographical origins of the samples following the color code depicted in the table insert in panel A. (A) Complete Bovina mitogenome tree. (B) Enlarged view of the Bison priscus/bison part of the tree. (C) Enlarged view of the Bison bonasus part of the tree. (D) Schematic representation of the two hypotheses describing the mtDNA segregation pattern between B. p. taurus, B. bonasus and B. priscus/bison.

Figure 2.
Schematic representation summarizing the population dynamics of bison on the Eurasiatic continent based on the various bison mitotypes from the Late Pleistocene to the present. The orange arrows indicate the migrations, and, for the migrations on the American continent, their putative date estimates are indicated alongside the arrows. (A–D) depict the situations at different time periods as indicated (Drawings of the Chauvet cave bison representations by E.M. Geigl).

Figure 3.
Sex-specific differences in bison metacarpus bone morphology. (A) Variations of the length of the metacarpi (minimal-average-maximal in mm) of a selection of series of Pleistocene bison for both sexes plotted in a chronological order from the most ancient at the left to the most recent ones at the right. Note the chronological gap between Middle Pleistocene and Later Pleistocene series (number of samples in bracket). (B) Log size index, LSI, of metacarpi from the Upper Pleistocene sites of the Igue du Gral and Jaurens (Jaur) in France according to their sex (M = male, F = female). Measurements: 1 = maximal length, 2 = proximal TD, 3 = proximal APD, 4 = middle of diaphysis TD, 5 = middle of diaphysis APD, 6 = distal TD, 7 = distal APD, 8 = sus-articular distal TD. (C) Bison Metacarpals (above: male, below: female) from the late Pleistocene (MIS 3) site of Les Plumettes (Vienne, France); coll. Musée National de Préhistoire, Les Eyzies-de-Tayac, Dordogne (photo J.P. Brugal).

Figure 4.
Comparisons of metacarpi morphology of Eurasiatic and American bison from the Pleistocene and the Holocene. (A) LSI comparison of Late Pleistocene European bison. The B. bonasus metacarpal measurements originating from either Schertz (1936) [21] or Empel and Roskosz (1963) [25] were distinguished (indicated by the letters S and E, respectively). Metacarpals from the Aven d’Arquet and Igue du Gral were subdivided in two groups according to the stratigraphy (Aven d’Arquet: Inf and Sup indicate inferior and superior layers respectively; Gral4 and 2 indicate inferior and superior layers respectively). (B) LSI comparison of Middle and Late Pleistocene European bison. (C) LSI comparison of Late Pleistocene Eurasiatic bison [24]. (D) LSI comparison of final Pleistocene-Holocene American bison. Sample size, n, is indicated in parentheses.

Figure 5.
Principal component analysis of the modified variable size index of Pleistocene and Holocene European bison metacarpal. (A) PCA of the VSI*. The most robust connections between samples were established using the bootstrapped spanning network [31] and the bootstrap values of the simplest connected network best supported by the data are indicated alongside the links. The red circles indicate the clusters identified using the HAC data shown in panel C. For sample description, see legend of Figure 4. (B) Correlation circle of the coefficients of the first two principal components showing the relationships between the variables. (C) HAC with Ward’s minimum variance method using, for each population, the squared Euclidian distance between the first two components of the PCA. The optimal number of clusters minimizing total intra-cluster variation was determined using a distance criterion and the elbow method. The threshold distance identified is indicated with a thick black line.

Figure 6.
Inference of the divergence time of the American and European bison and of the size of their ancestral population. Characterization of the divergence between the B. bonasus and B. bison lineages under an isolation model, which assumes a clean split, using CoalHMM [40]. (A) Violin plot showing the distribution of the estimates of divergence times over 37 non-overlapping and autosomal segments from the alignments of B. bonasus and B. bison genome assemblies [8]. Time scale was translated into years before present assuming µy = 2.1 × 10⁻⁹ [43]. (B) Violin plot showing the distribution of the estimates of the ancestral effective population size, Ne, scaled by assuming in addition a generation time g of 6 years [7].

Figure 7.
Principal component analysis of the combined autosomal SNP data of Bovini. The meta-analysis combines SNP data that originate from three different experiments: (i) sequence capture of the loci represented on the BovineSNP50 chip for four individuals [11]; (ii) whole genome sequencing (WGS) of 29 individuals [7,9,32]; and (iii) genotyping with the Illumina BovineSNP50 and Bovine HD BeadChip (Illumina) [37] (see Material and Methods). In total, the combined data set consists of genotypes for 7572 SNPs on 68 individuals among which three bison were genotyped in two different ways: (i) the present-day B. bonasus individuals 3569 and 3574 [7] genotyped with both the BovineHD Illumina BeadChip and using WGS data; and (ii) a 1911 Caucasian sample analyzed in Soubrier et al. [11] under the ID A15654 that is identical to Cc1-8853 sequenced to 1X coverage by Wecek et al. [9]. In PCA plots, individuals whose data originate from WGS data are represented with square, whereas circles were used for SNP-chip genotyping data. (A) PCA on the whole data set retaining only the 5196 SNPs that were called in at least 95% of the samples. Note that the positioning of the individuals genotyped with the Illumina assay and using WGS data are consistent since all Angus (ANG) individuals cluster together, as well as the two Bison bonasus individuals 3569 and 3574. In contrast, in accordance with their known variable proportion of indicine ancestry [33], N’Dama (NDA) individuals genotyped with the BovineHD assay separate from those genotyped using WGS [33] that are closer to the B. p. indicus individuals. (B) PCA on the data set without the bovine individuals and retaining only the 1703 SNPs that were called in at least 95% of the samples.

Figure 8.
Schematic representation of the evolutionary tree of Bovina genomes. The tree recapitulates the various evolutionary events deduced from the mitogenome and nuclear genomes analyses discussed herein. We have represented the mitogenome lineages as blue lines using the date estimates and their highest posterior densities estimated from the Bayesian analyses represented in Figure 1. We have depicted as beige envelopes around these lines the corresponding populations as deduced from the genome analyses discussed in the text. Uncertainties about the extent of separation of populations and/or species still undergoing bidirectional gene flow are indicated with dotted lines. The estimated and proposed extended periods of divergence with limited gene flow are represented by series of double-sided arrows, whereas the various directional gene flows identified are represented by single-sided arrows alongside the fraction of the genomes that results from this gene flow event(s). The color code indicates the study of origin of the data gathered as indicated in the box. The dates estimated for the various evolutionary events are indicated as a linear time scale on the right-hand side. The extinct lineages/species are indicated by a star alongside their estimated period of extinction.


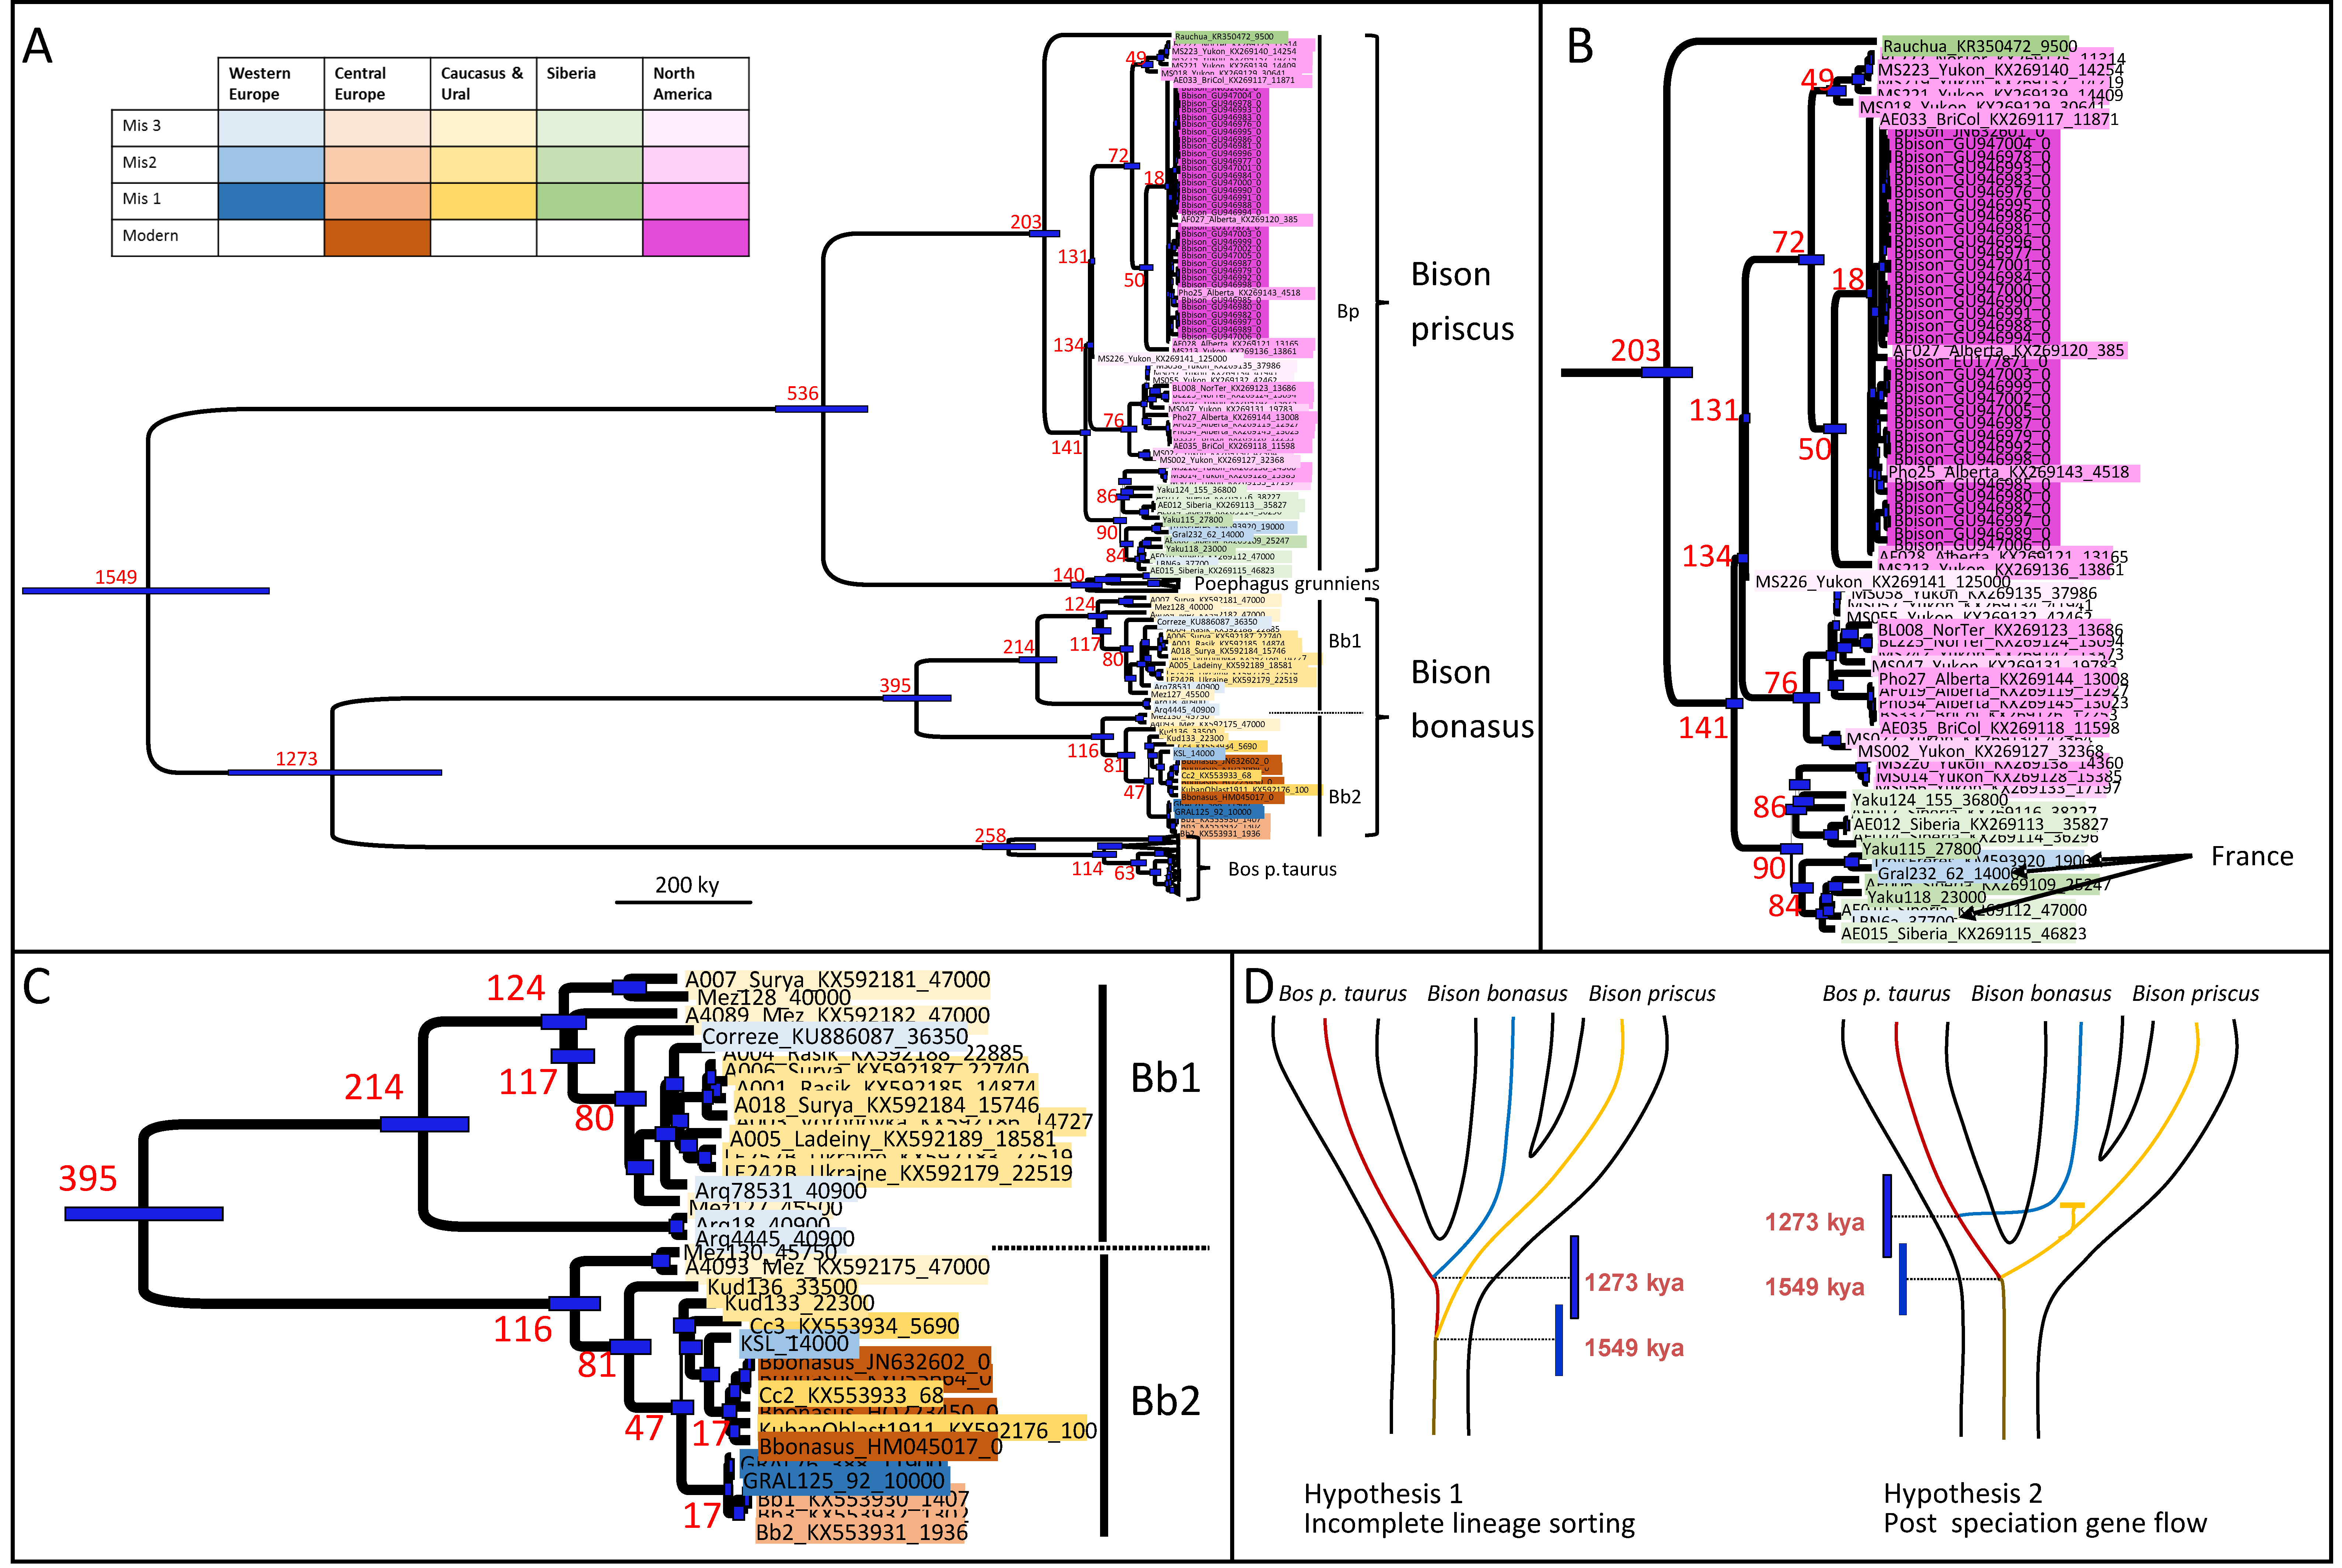
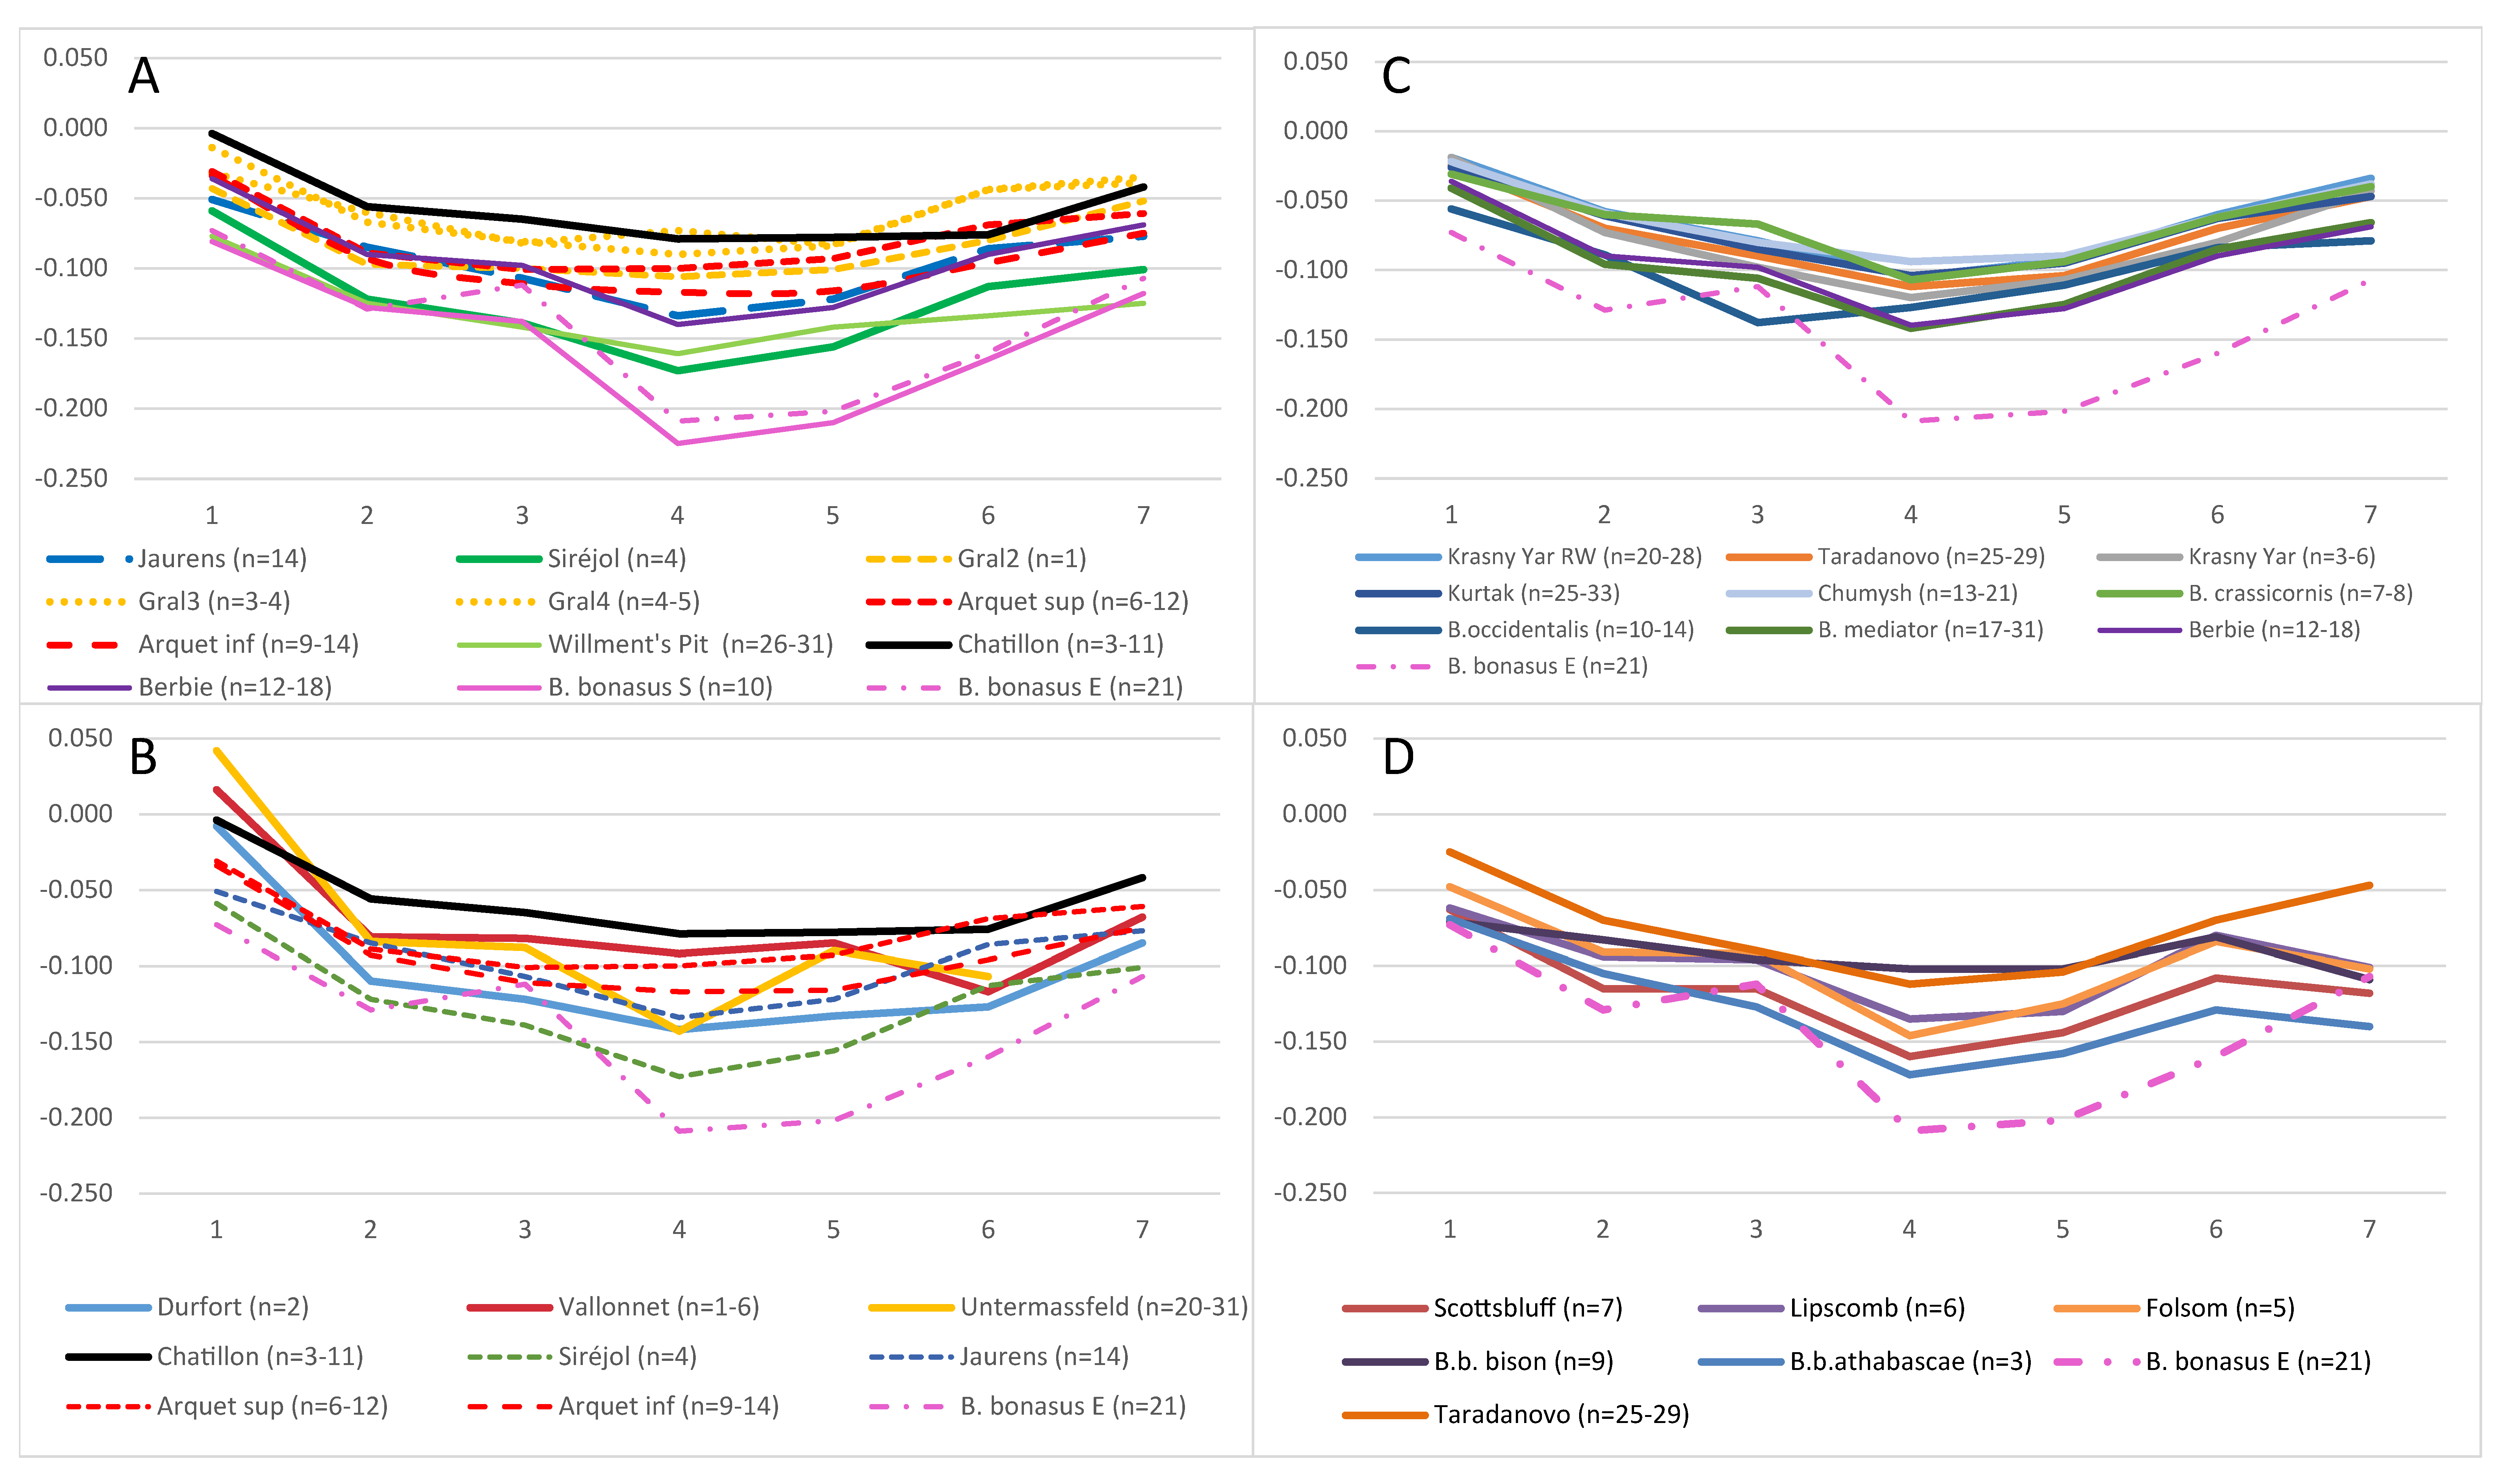
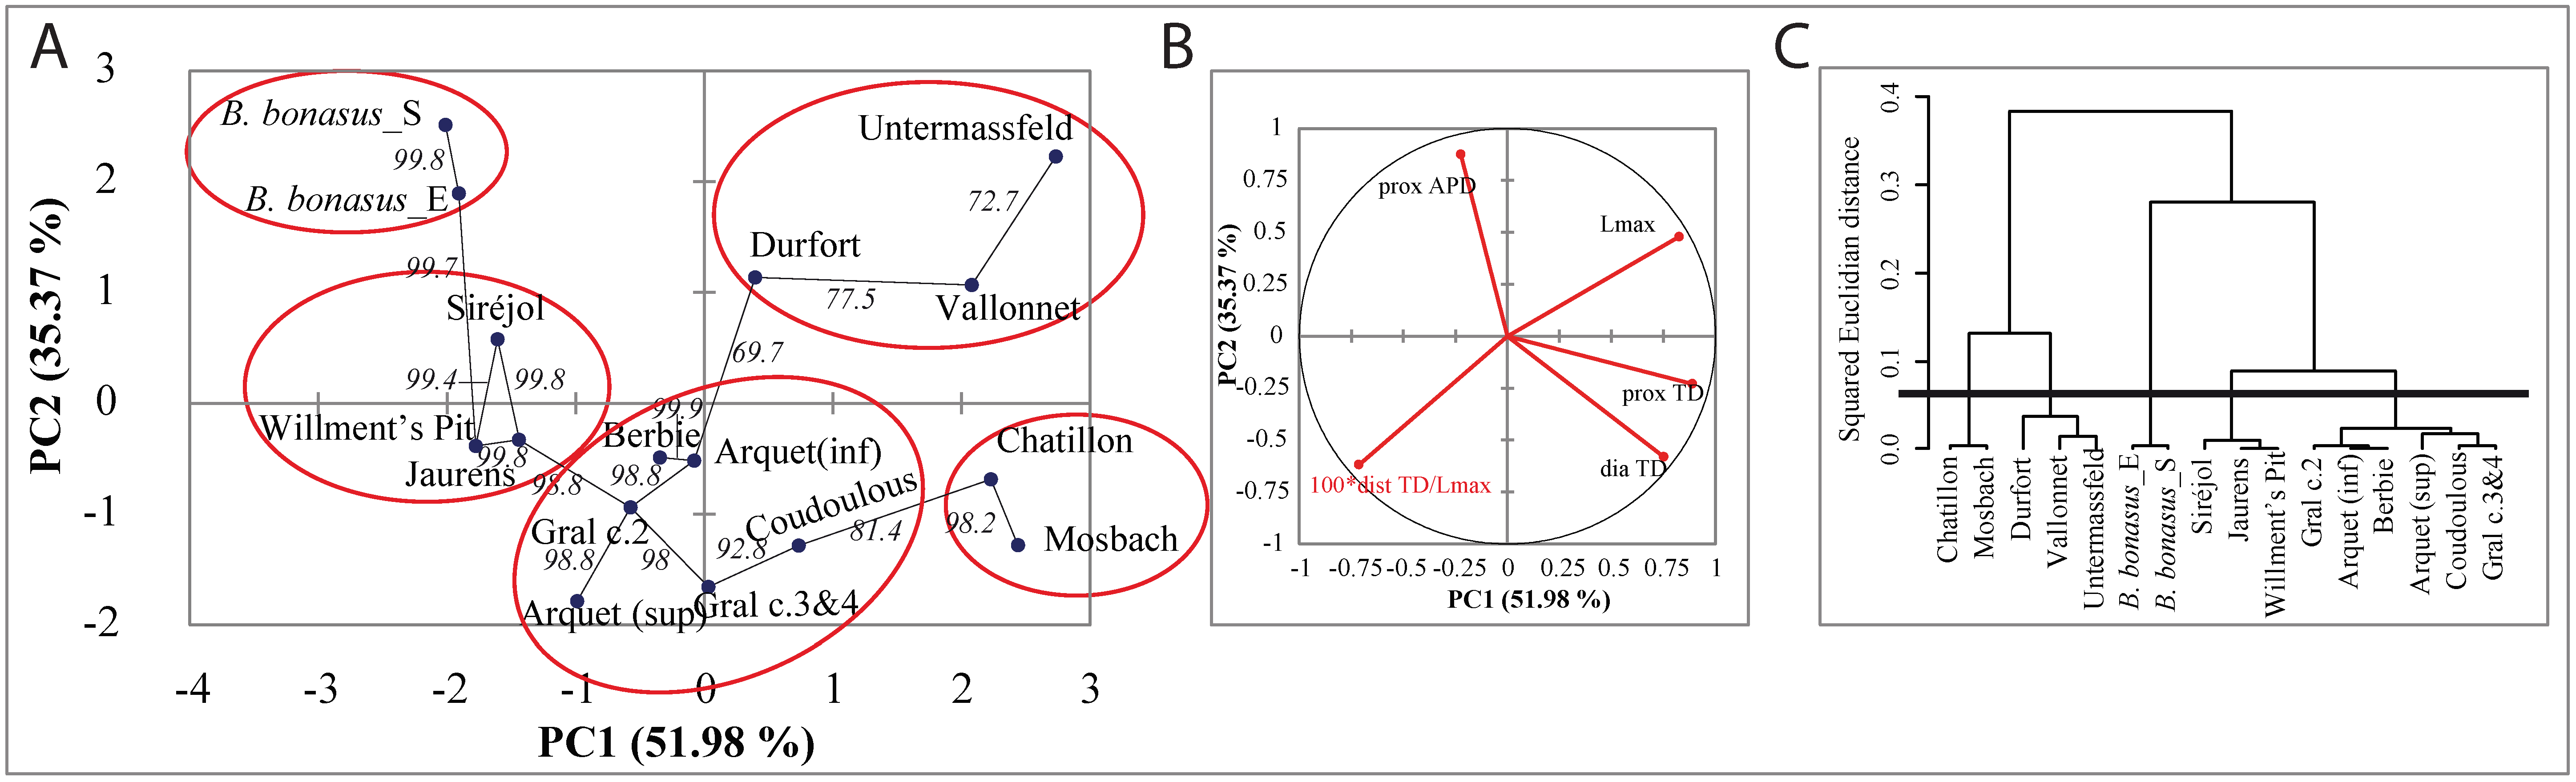
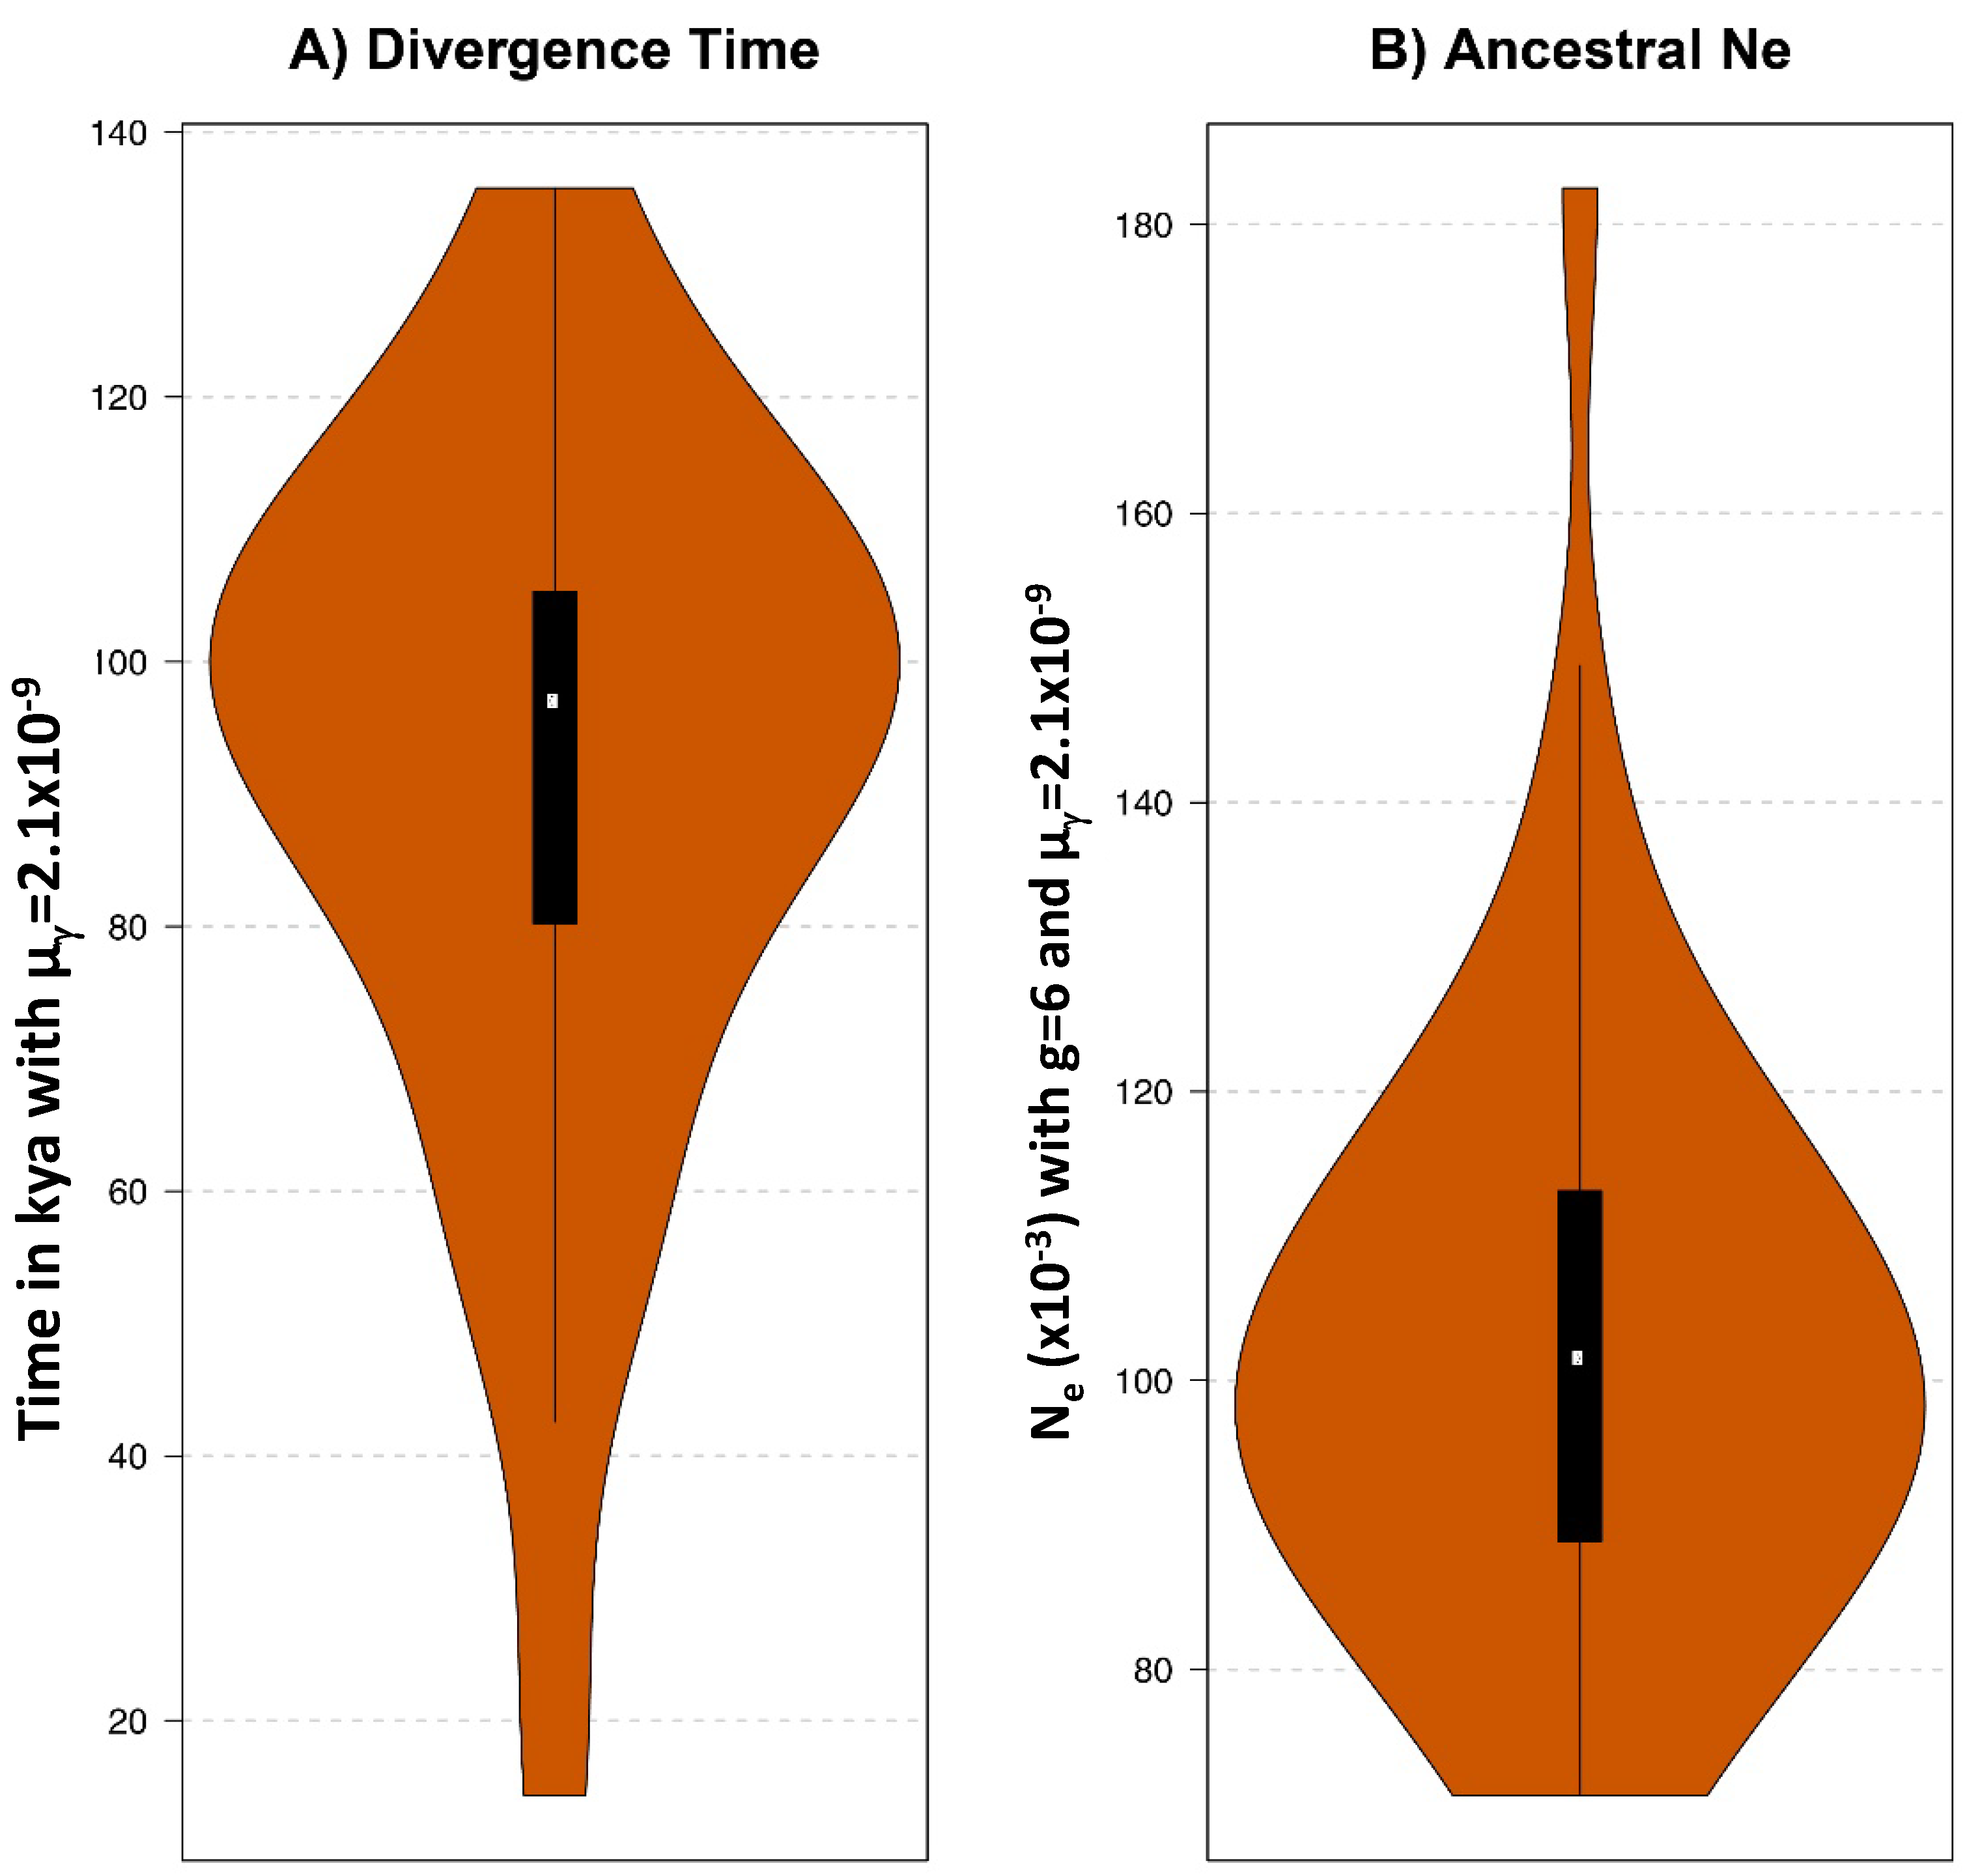
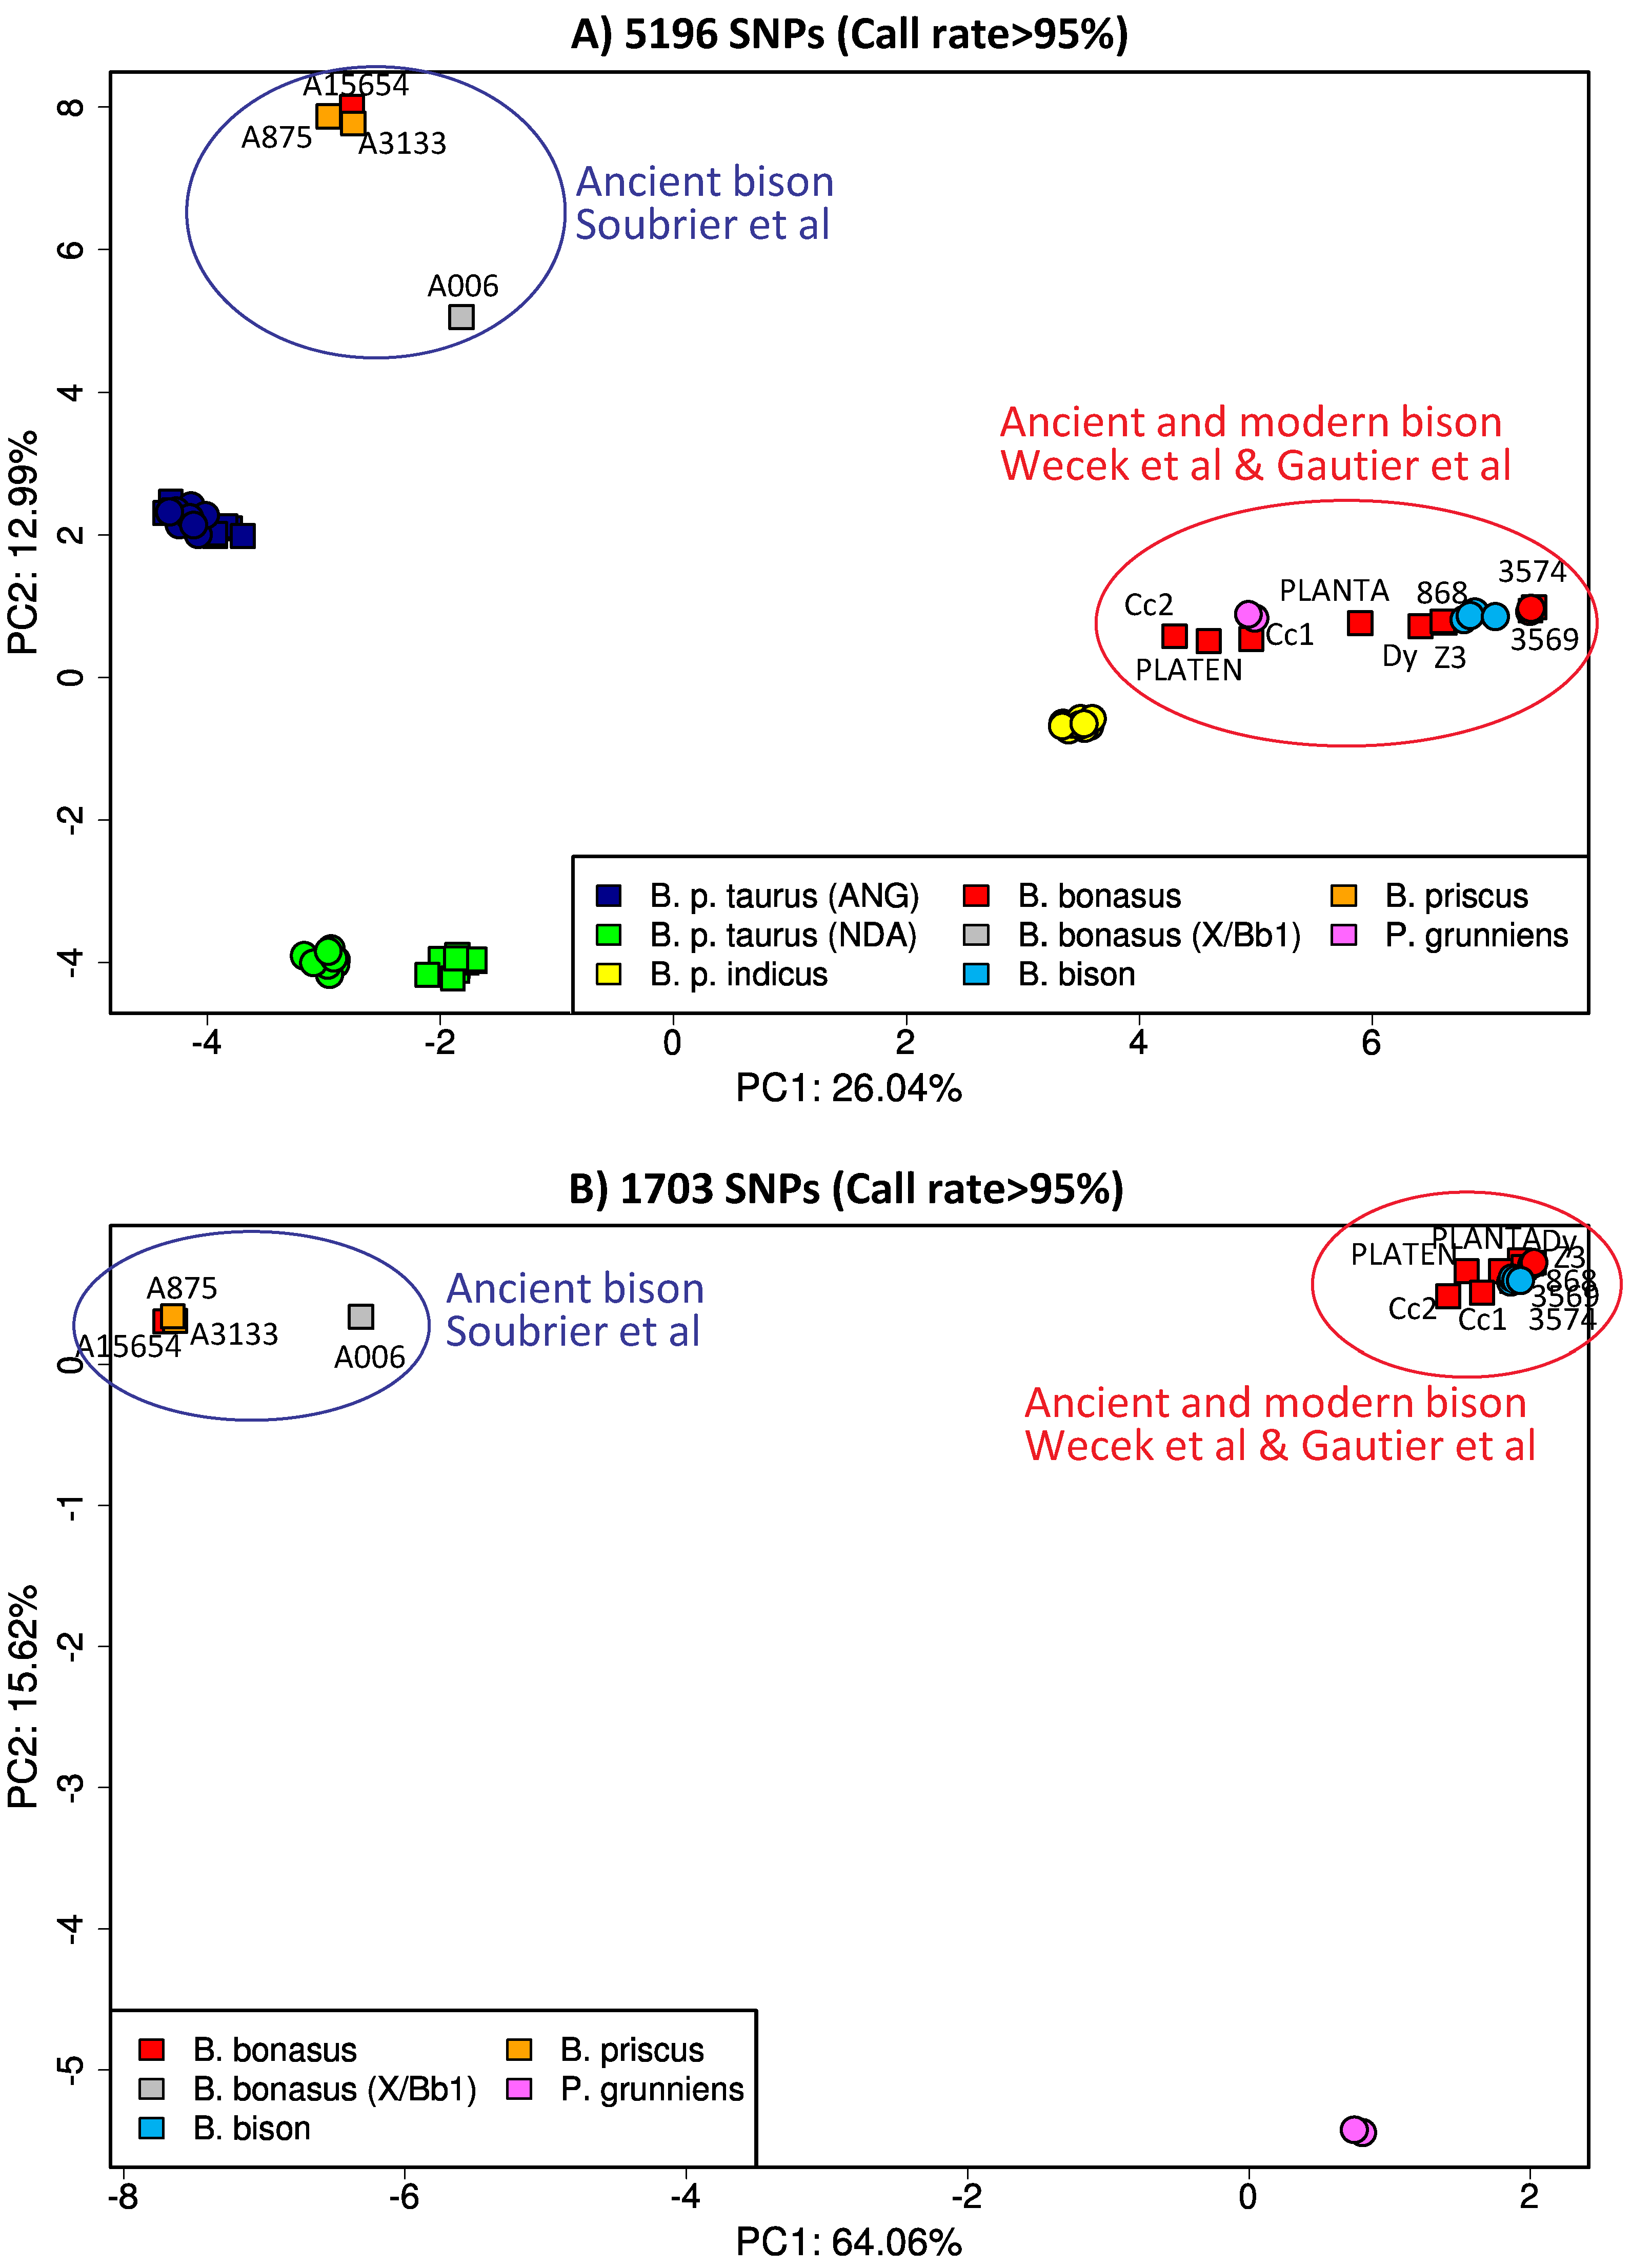
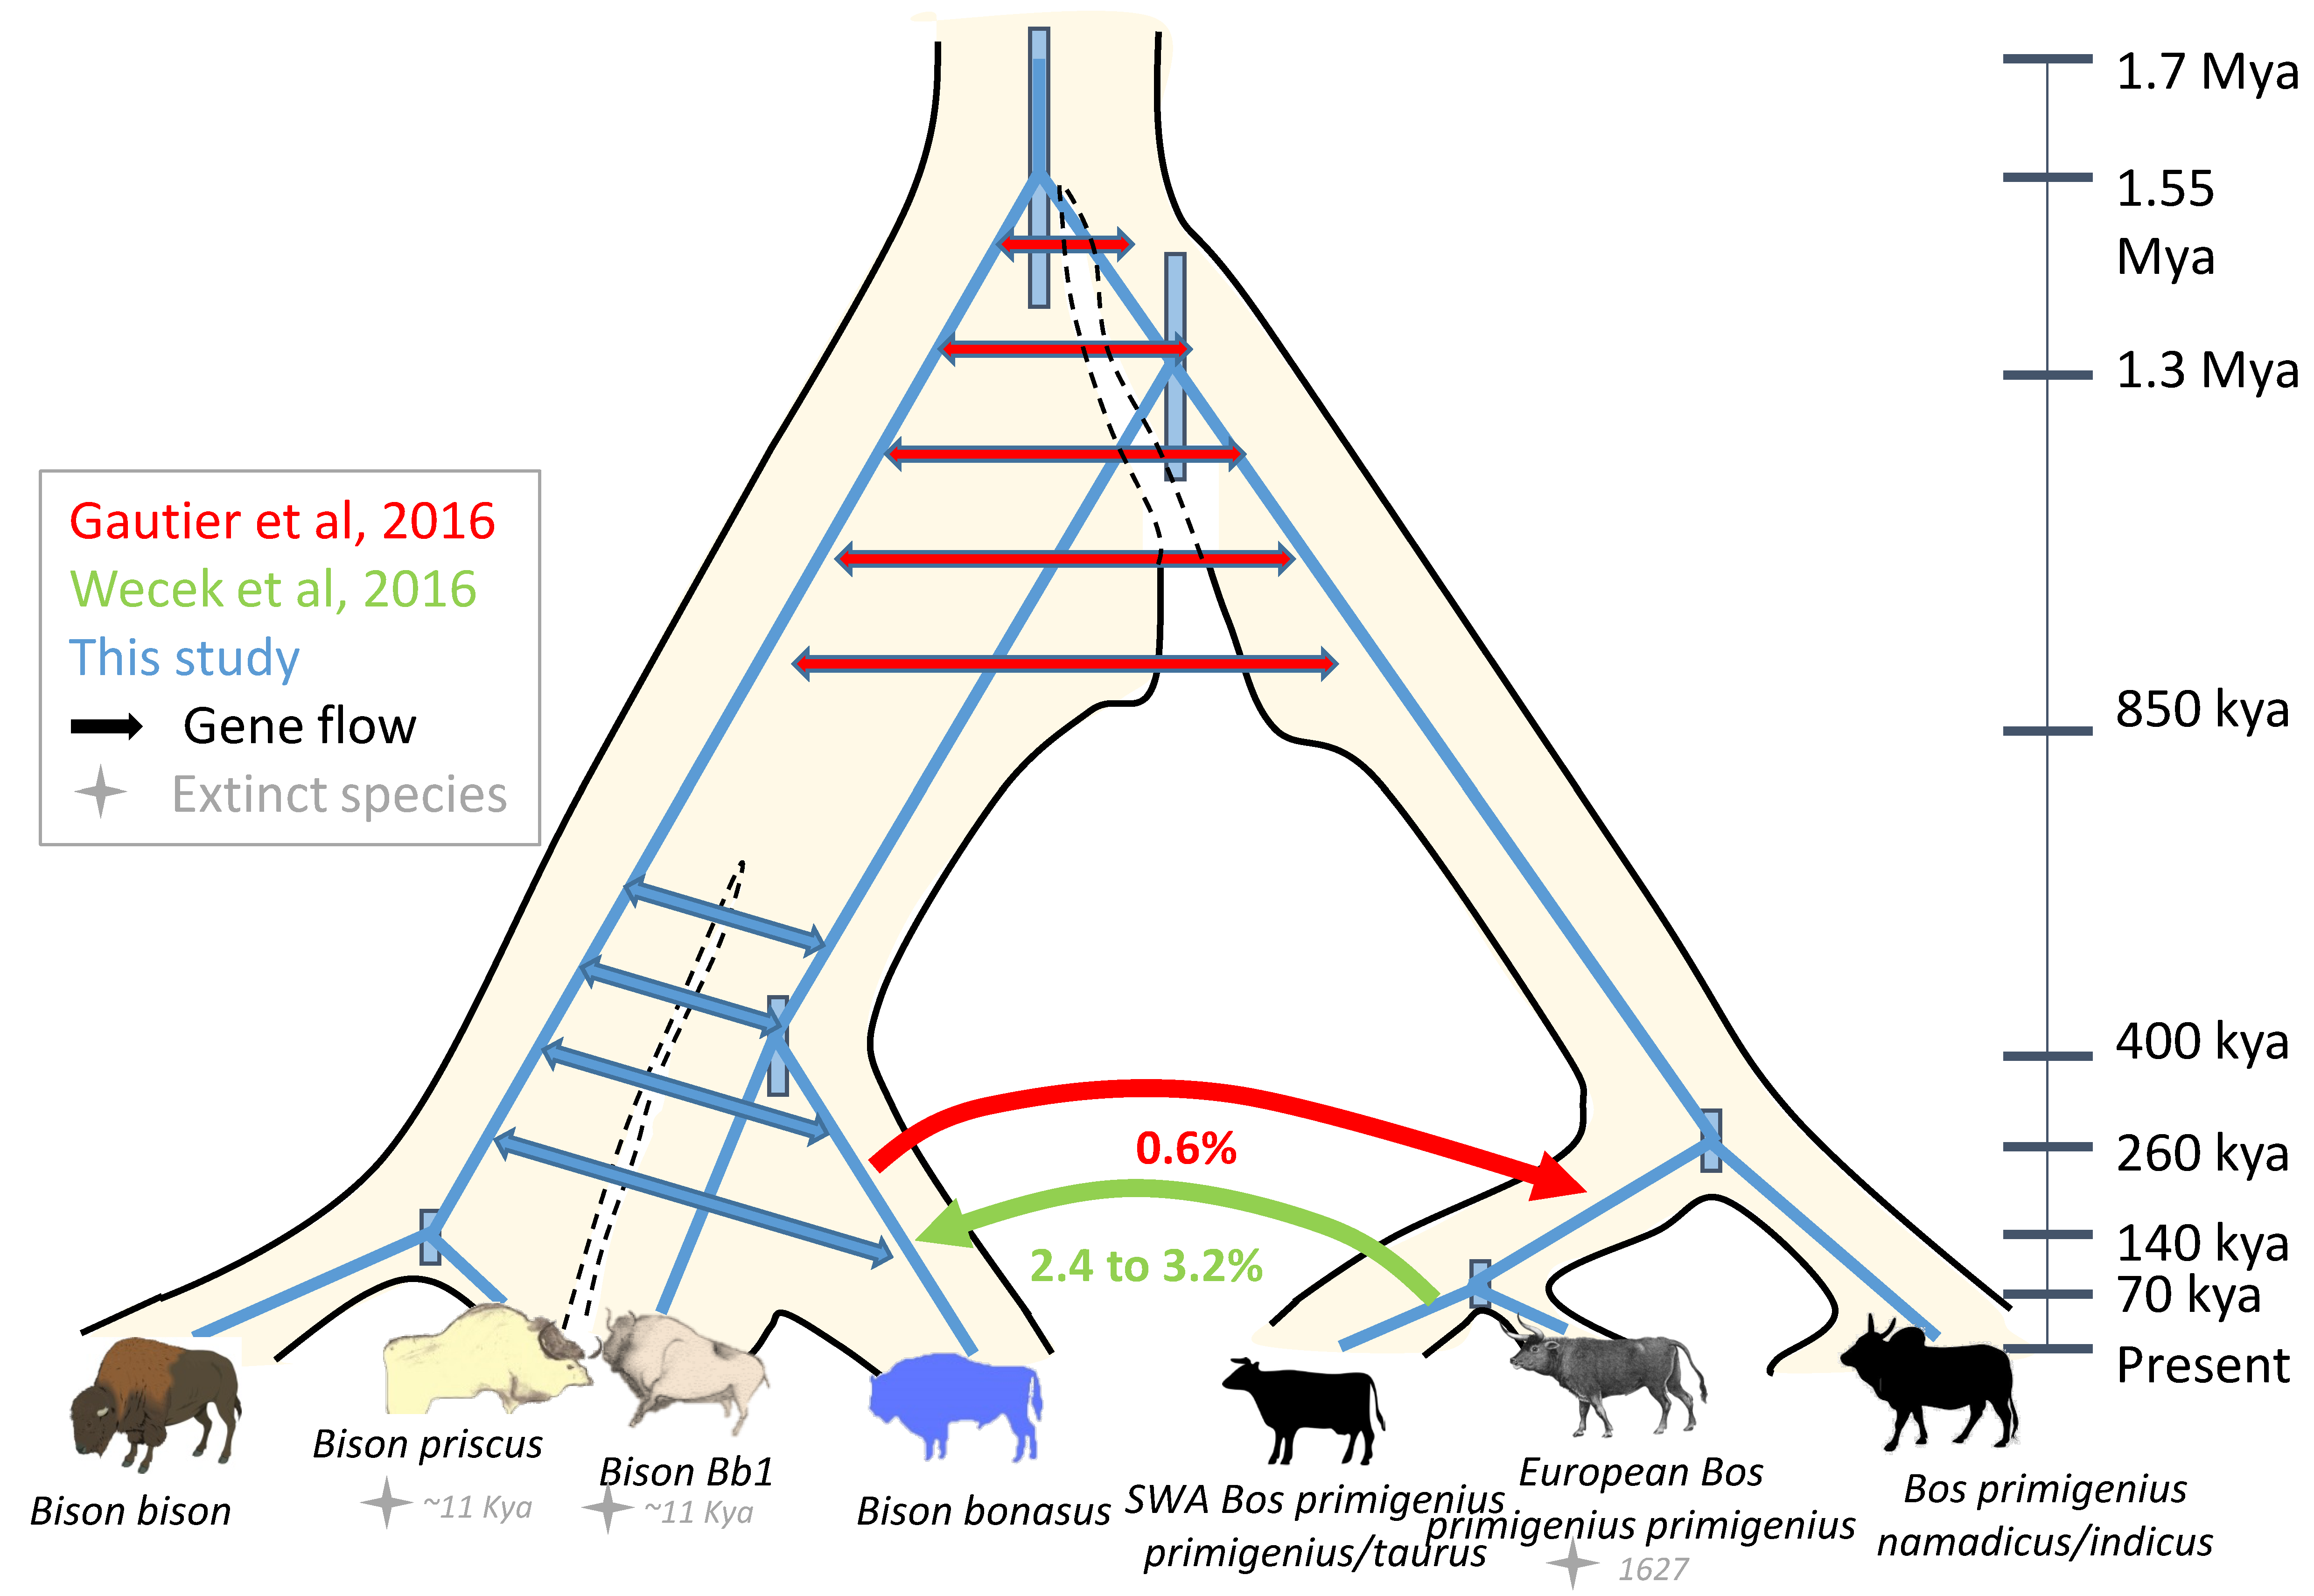
Table 1.
Node age estimates and clock rates estimates obtained through Bayesian analyses.
| Age Estimates of the Nodes (kya) | |
| Node | Age [95% HPD] |
| Root Bovina | 1549 [1736–1366] |
| Bos p. taurus/B. bonasus | 1273 [1436–1117] |
| P. grunniens/B. priscus | 536 [608,468] |
| B. priscus | 203 [224,177] |
| Modern B. bison | 14 [17,12] |
| All B. bonasus | 395 [445,343] |
| B. bonasus Bb1 | 214 [240,183] |
| B. bonasus Bb2 | 116 [130,98] |
| Clock Rate Estimates (Per Site * Year) | |
| Partition | Rate [95% HPD] |
| HVR | 3.0 [2.5–3.5] × 10−7 |
| RNA | 1.7 [1.4–1.9] × 10−8 |
| Coding (1st–2d positions) | 1.55 [1.35–1.75] × 10−8 |
| Coding (3d position) | 5.35 [4.75–6.0] × 10−8 |
© 2018 by the authors. Licensee MDPI, Basel, Switzerland. This article is an open access article distributed under the terms and conditions of the Creative Commons Attribution (CC BY) license (http://creativecommons.org/licenses/by/4.0/).
Share and Cite
MDPI and ACS Style
Grange, T.; Brugal, J.-P.; Flori, L.; Gautier, M.; Uzunidis, A.; Geigl, E.-M. The Evolution and Population Diversity of Bison in Pleistocene and Holocene Eurasia: Sex Matters. Diversity 2018, 10, 65. https://doi.org/10.3390/d10030065
AMA Style
Grange T, Brugal J-P, Flori L, Gautier M, Uzunidis A, Geigl E-M. The Evolution and Population Diversity of Bison in Pleistocene and Holocene Eurasia: Sex Matters. Diversity. 2018; 10(3):65. https://doi.org/10.3390/d10030065
Chicago/Turabian StyleGrange, Thierry, Jean-Philip Brugal, Laurence Flori, Mathieu Gautier, Antigone Uzunidis, and Eva-Maria Geigl. 2018. "The Evolution and Population Diversity of Bison in Pleistocene and Holocene Eurasia: Sex Matters" Diversity 10, no. 3: 65. https://doi.org/10.3390/d10030065
Note that from the first issue of 2016, this journal uses article numbers instead of page numbers. See further details here.