
Temperature Dependence of the Electroclinic Effect in the Twist-Bend Nematic Phase
 , , , , , , , and
Abstract
:1. Introduction
2. Theoretical Background
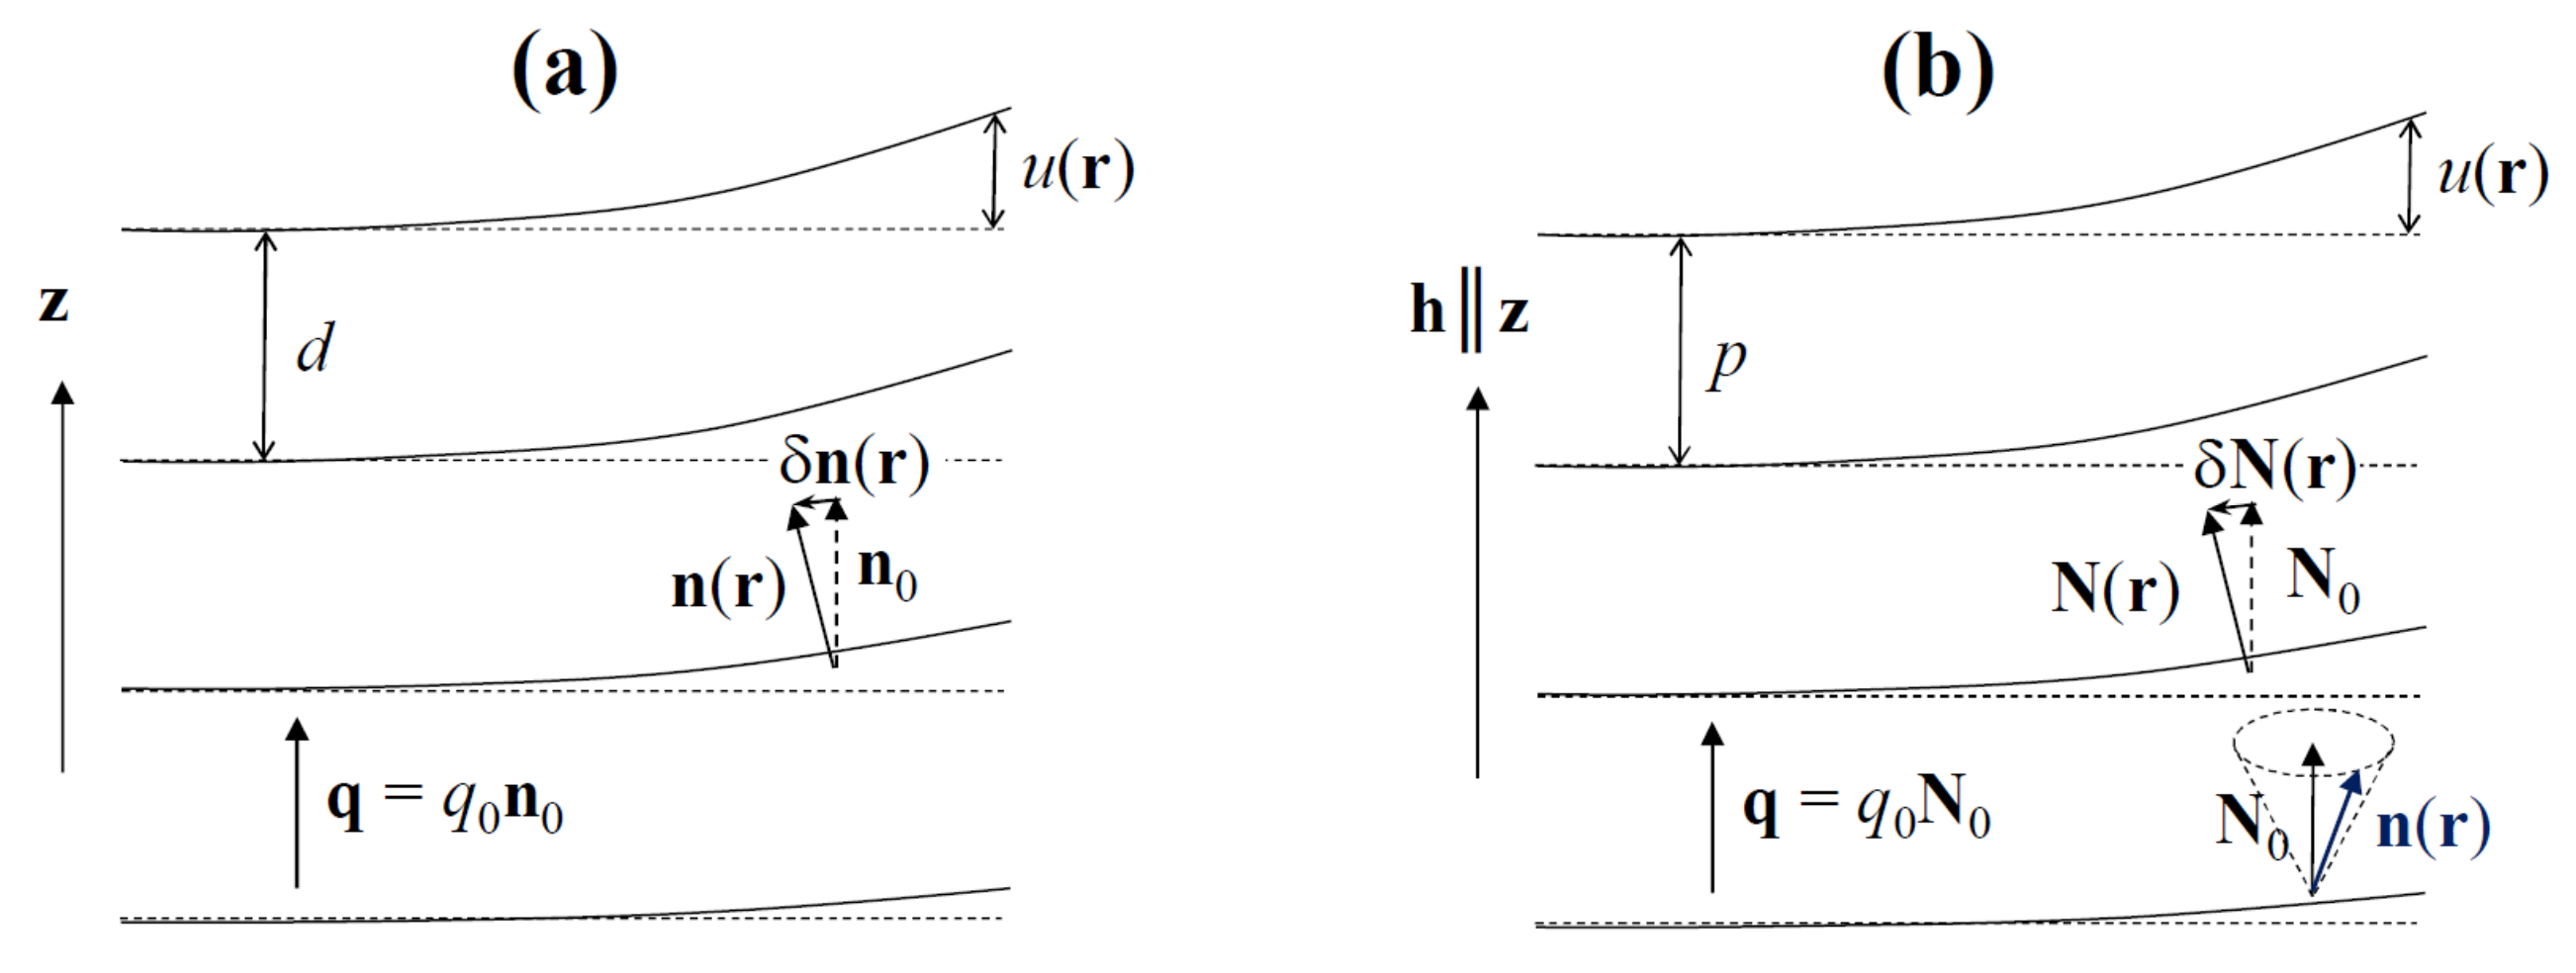
2.1. NTB-SmA* Analogy and CG Description of the NTB Phase
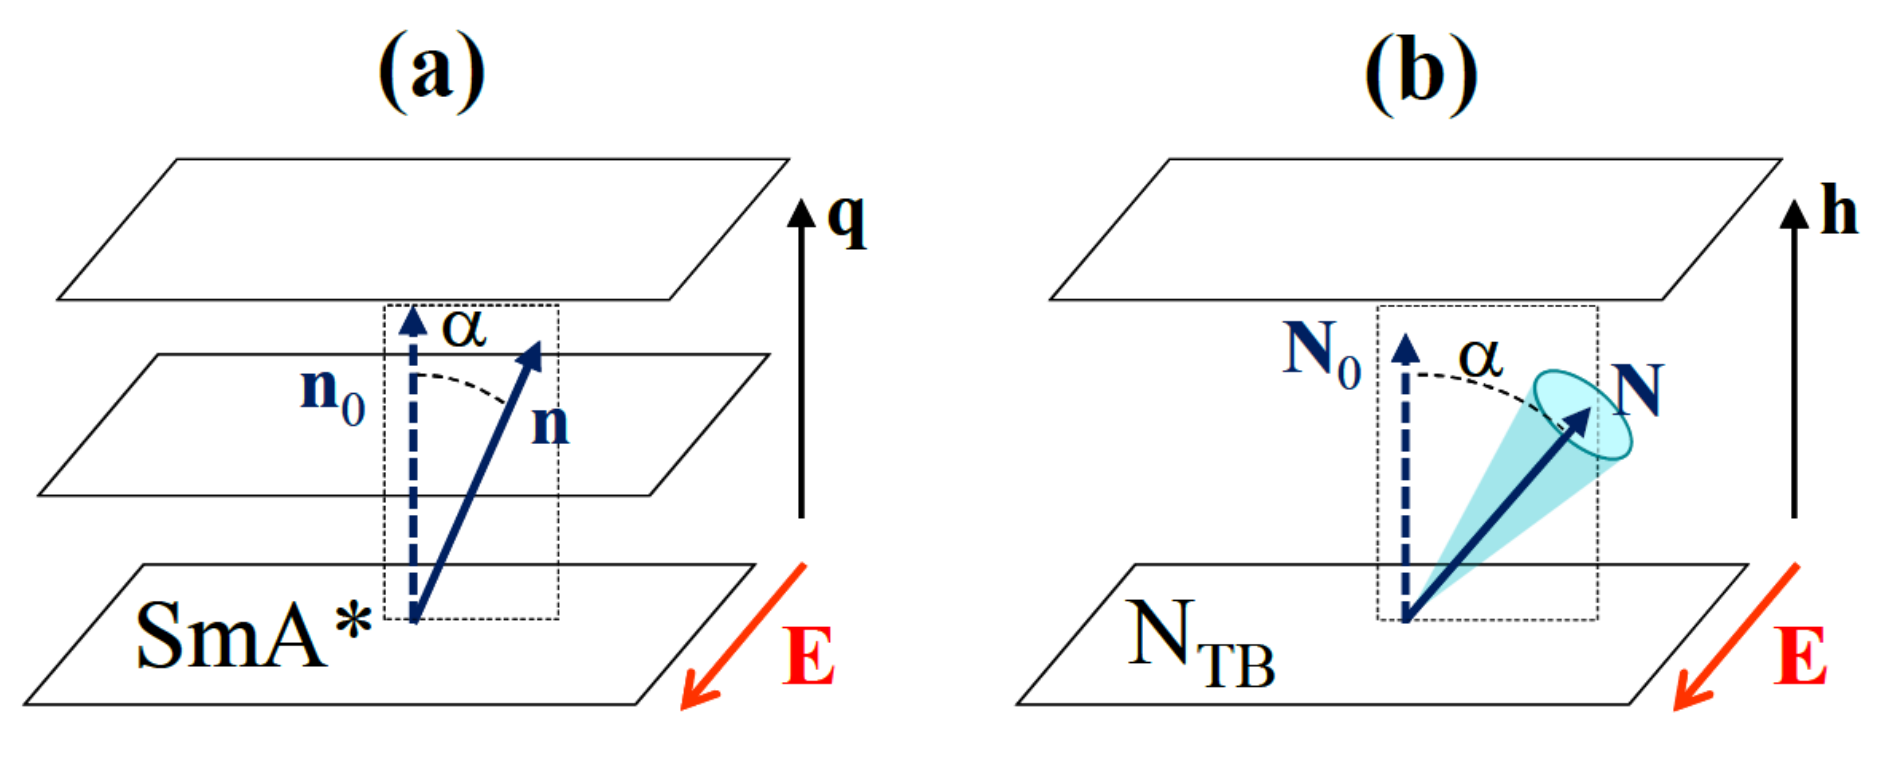
2.2. Behaviour under External Fields
3. Materials and Methods
3.1. NTB-Forming Mesogenic Dimers
3.1.1. CB7CB
3.1.2. CB9CB
3.1.3. CB6OCB
3.1.4. BNA76
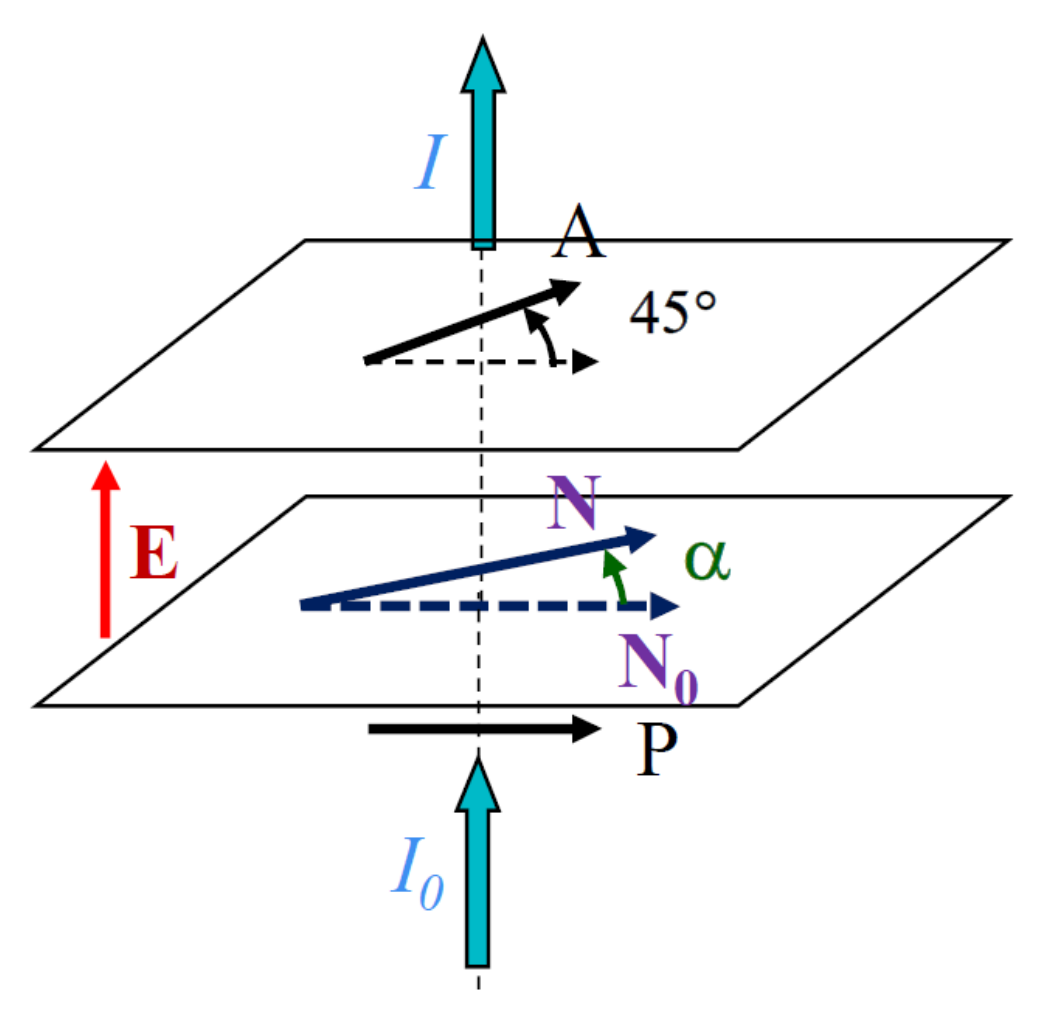
3.2. Measurement Technique
4. Results
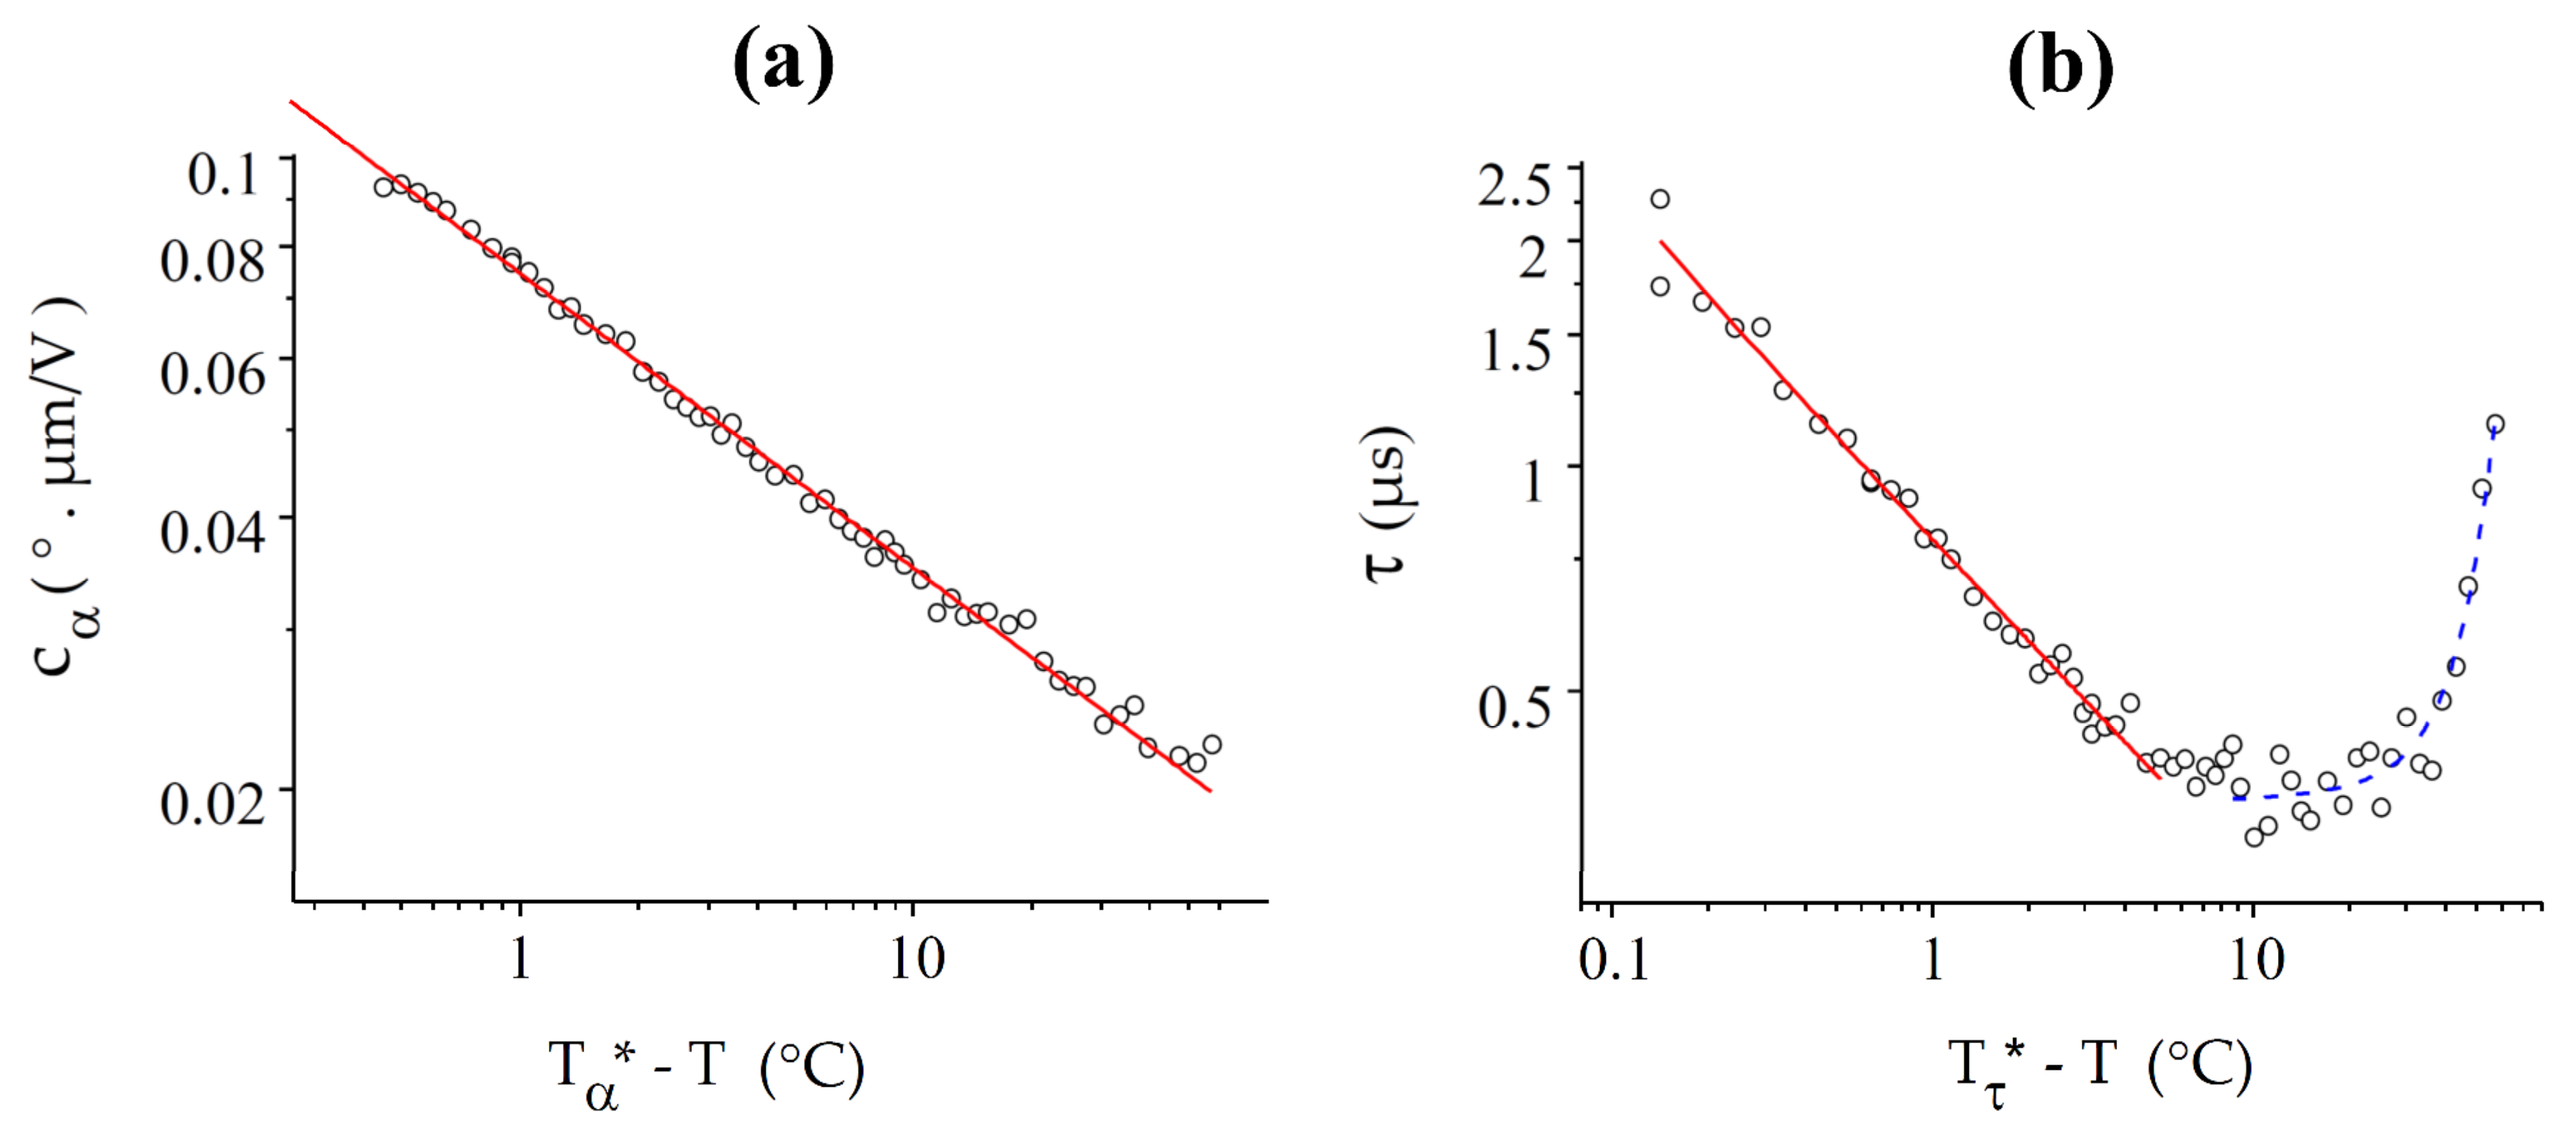
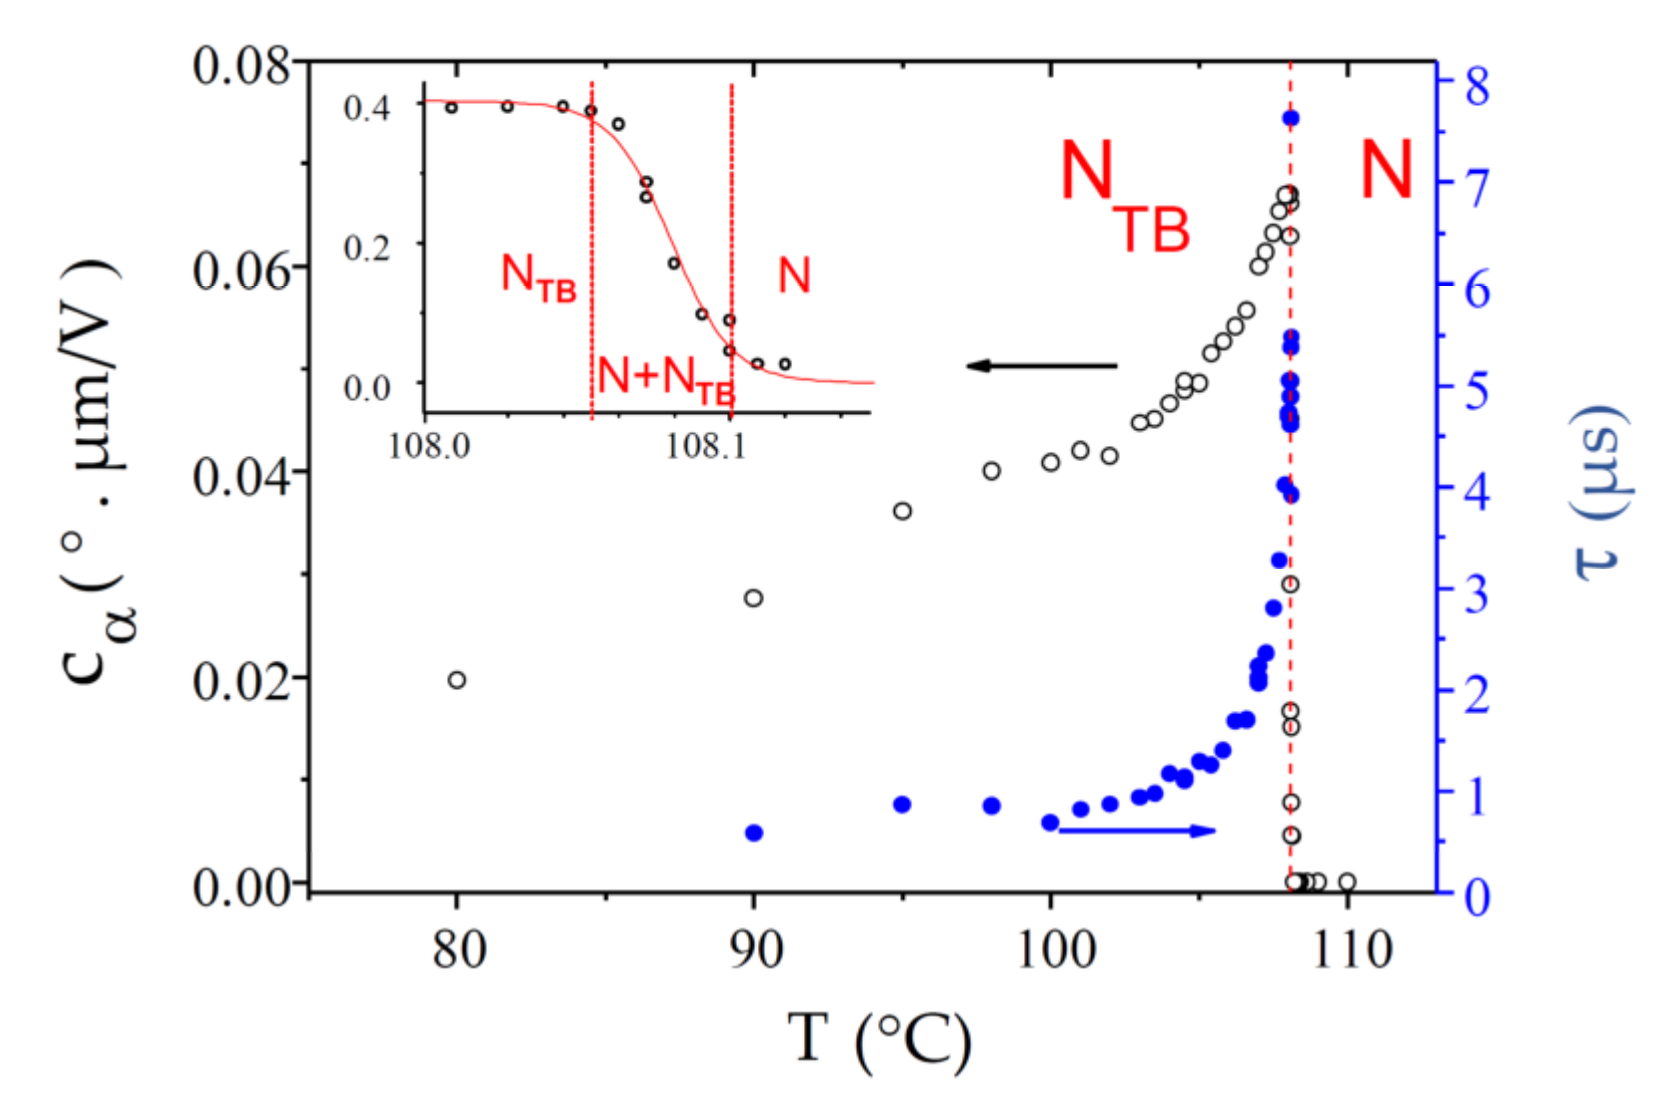
4.1. CB7CB
4.2. CB9CB
4.3. CB6OCB
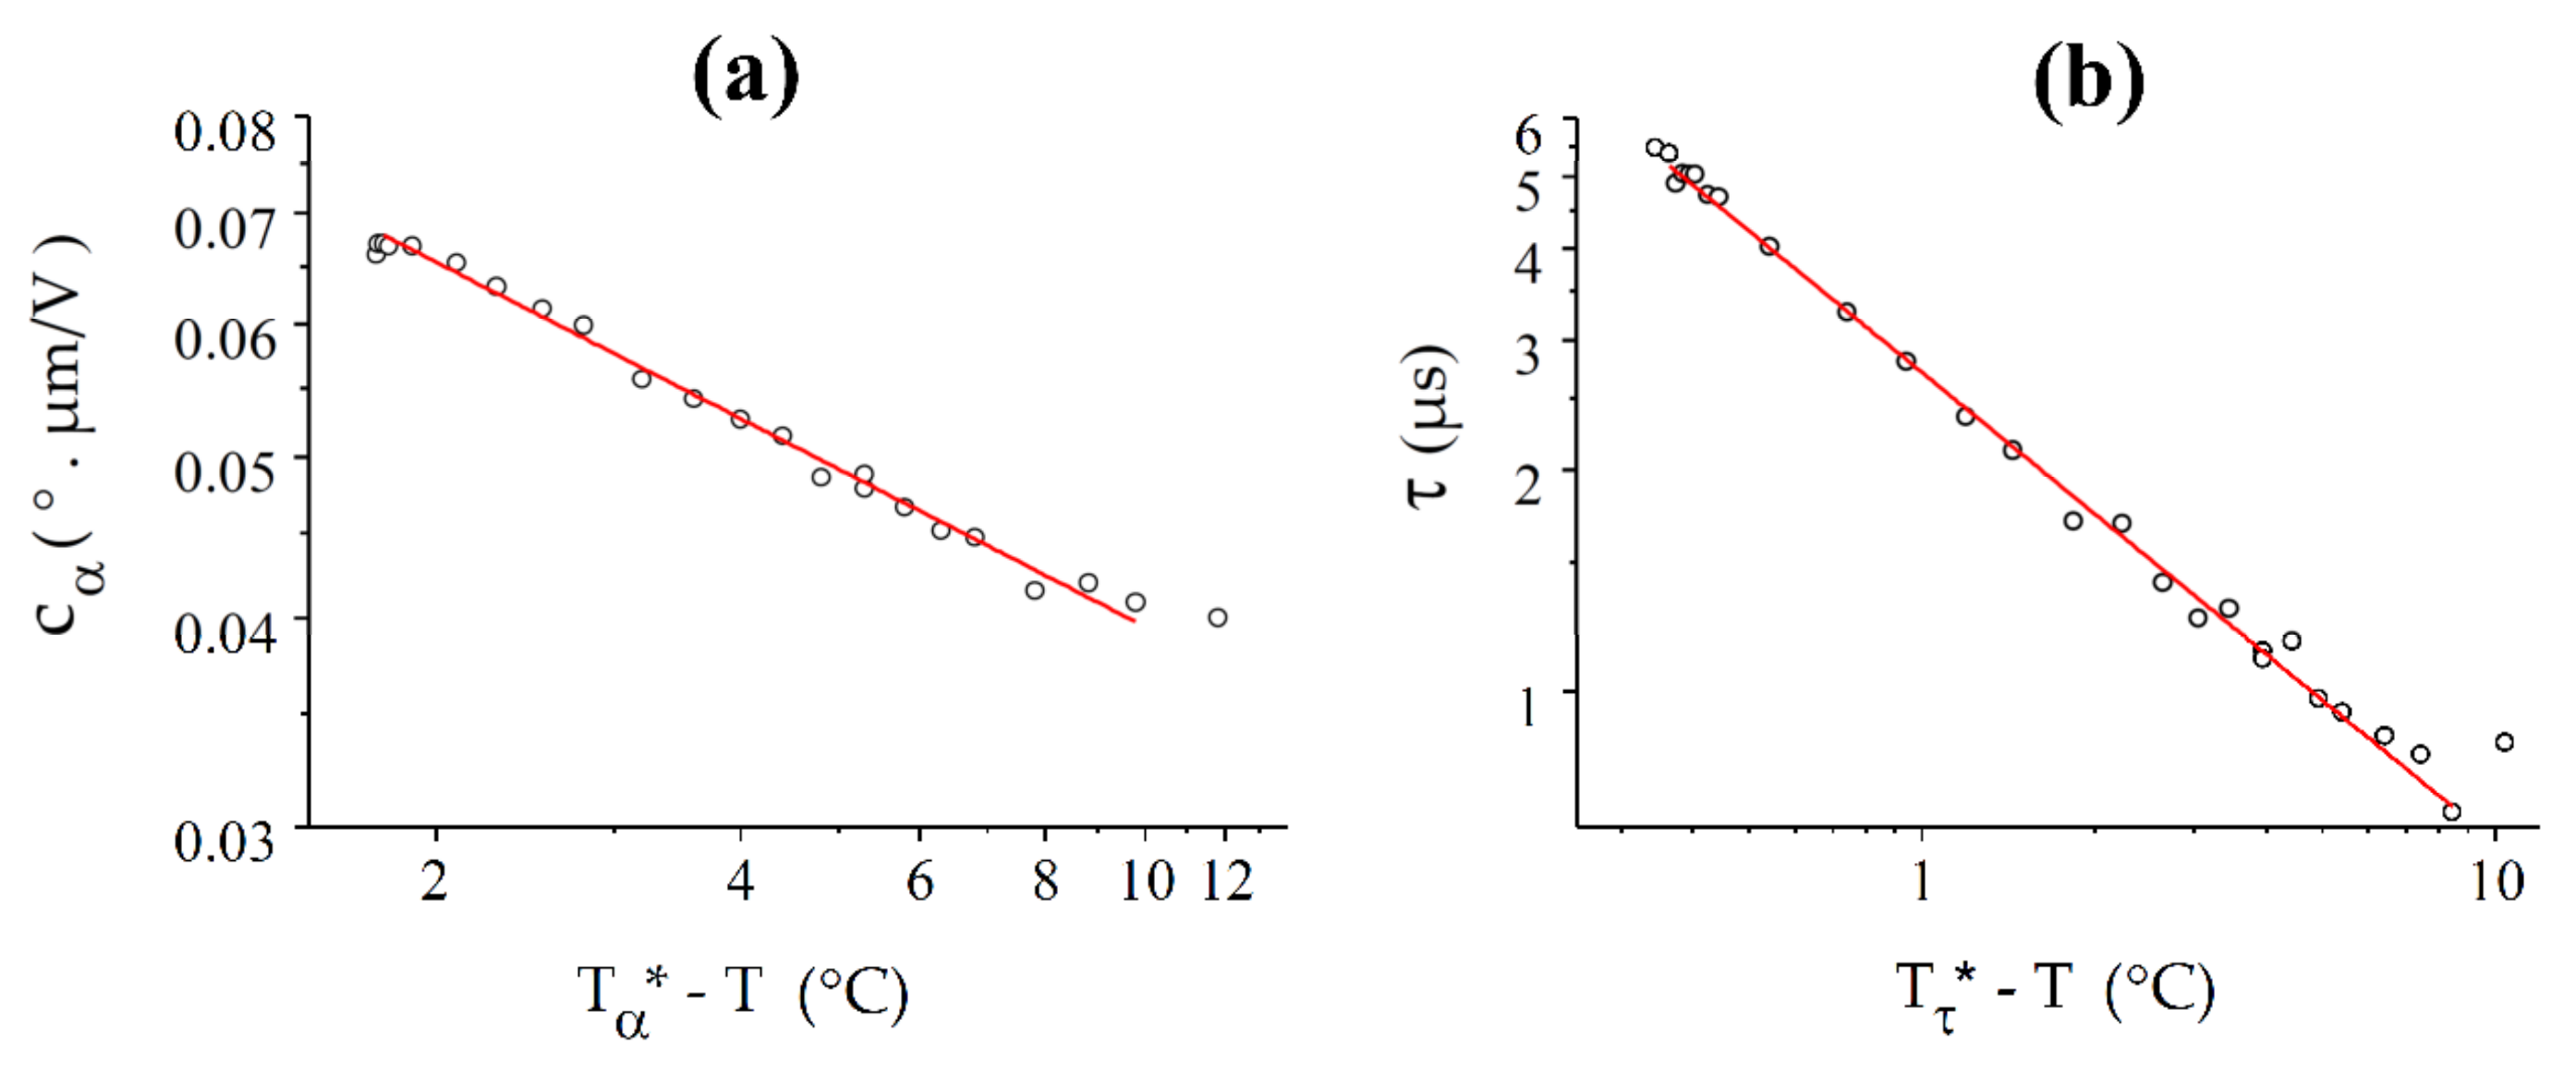
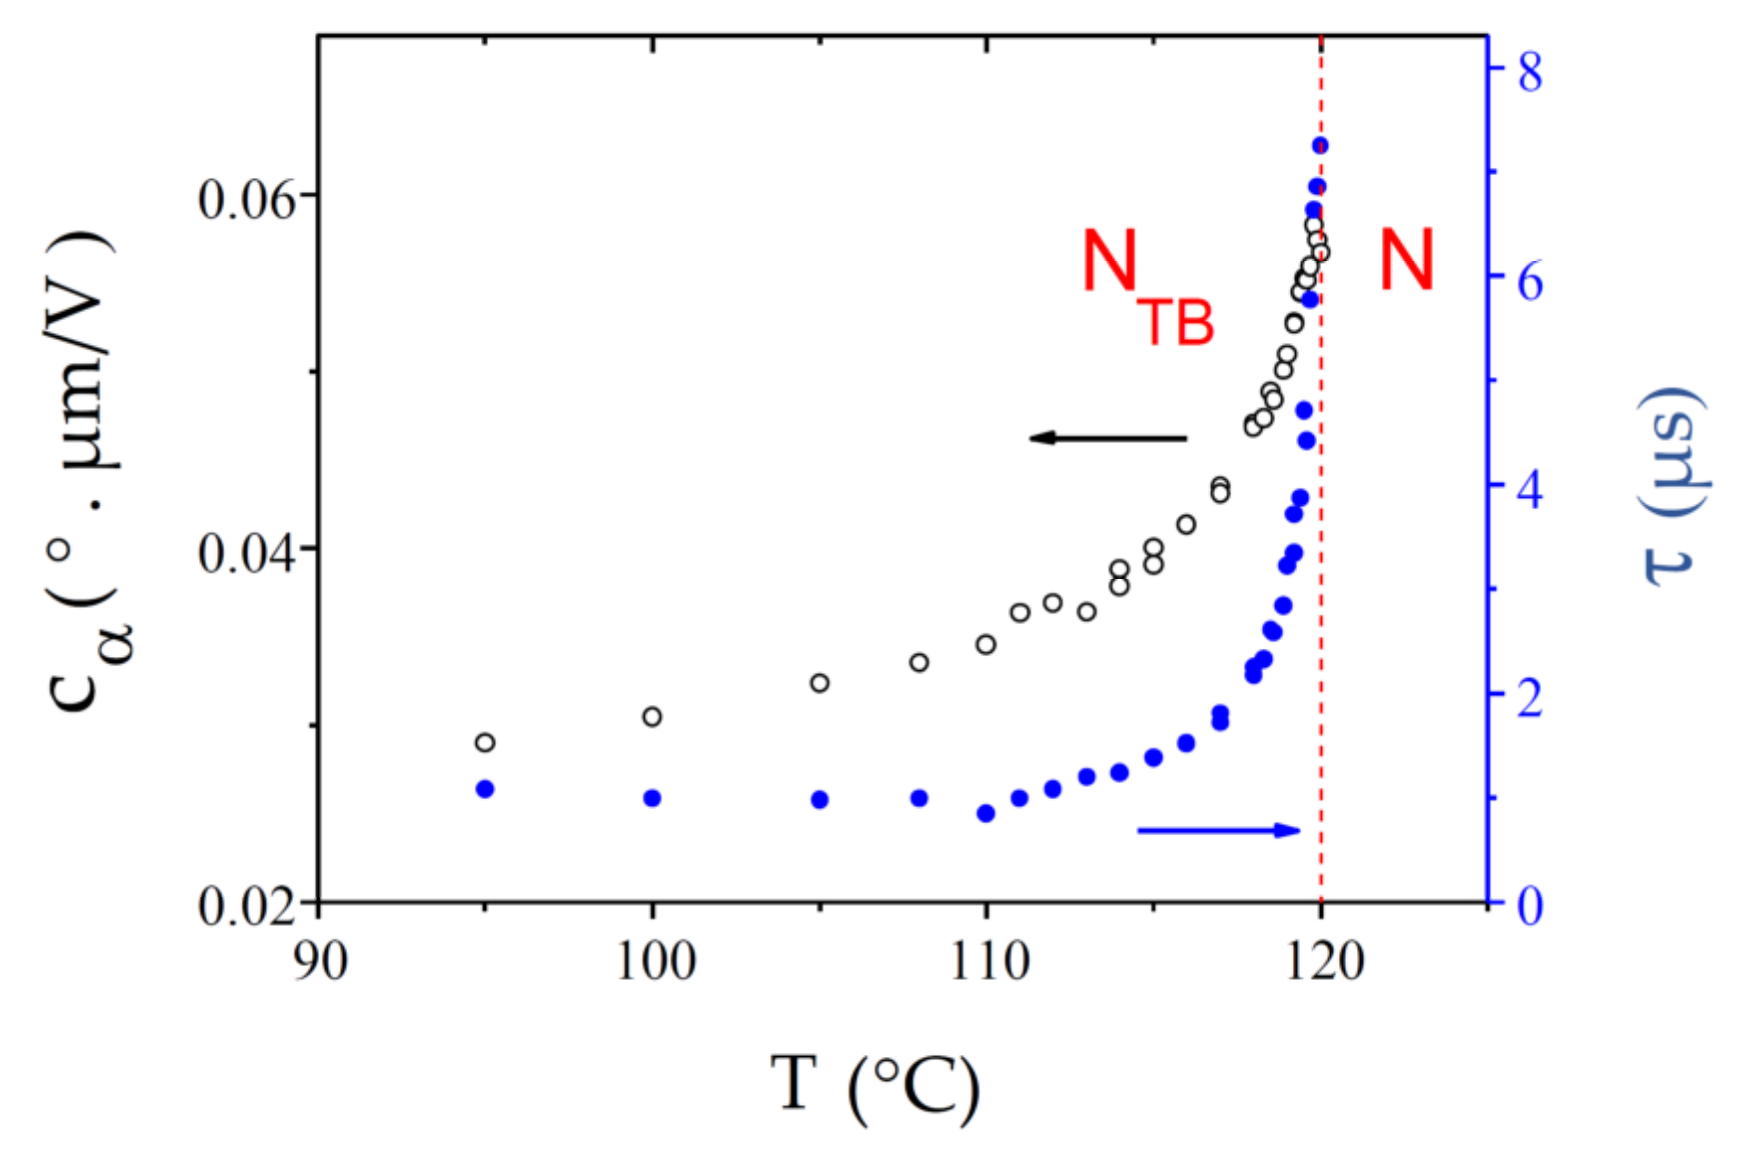
4.4. BNA76
5. Discussion
6. Conclusions
Author Contributions
Funding
Data Availability Statement
Conflicts of Interest
References
- Frank, F.C. On the theory of liquid crystals. Disc. Farad. Soc. 1958, 25, 19–28. [Google Scholar] [CrossRef]
- Freiser, M.J. Ordered states of a nematic liquid. Phys. Rev. Lett. 1970, 24, 1041. [Google Scholar] [CrossRef]
- Meyer, R.B. Molecular Fluids; Les Houches Summer School in Theoretical, Physics; Balian, R., Weill, G., Balian, R., Weill, G., Eds.; Gordon and Breach: New York, NY, USA, 1976; Volume XXV-1973, pp. 273–373. [Google Scholar]
- Lorman, V.L.; Mettout, B. Unconventional mesophases formed by condensed vector waves in a medium of achiral molecules. Phys. Rev. Lett. 1999, 82, 940–943. [Google Scholar] [CrossRef]
- Dozov, I. On the spontaneous symmetry breaking in the mesophases of achiral banana-shaped molecules. Europhys. Lett. 2001, 56, 247. [Google Scholar] [CrossRef]
- Memmer, R. Liquid crystal phases of achiral banana-shaped molecules: A computer simulation study. Liq. Cryst. 2002, 29, 483–496. [Google Scholar] [CrossRef]
- Cestari, M.; Diez-Berart, S.; Dunmur, D.A.; Ferrarini, A.; de la Fuente, M.R.; Jackson, D.J.B.; Lopez, D.O.; Luckhurst, G.R.; Perez-Jubindo, M.A.; Richardson, R.M.; et al. Phase behavior and properties of the liquid-crystal dimer 1″,7″-bis(4-cyanobiphenyl-4′-yl) heptane: A twist-bend nematic liquid crystal. Phys. Rev. E 2011, 84, 031704. [Google Scholar] [CrossRef] [Green Version]
- Meyer, C.; Davidson, P.; Constantin, D.; Sergan, V.; Stoenescu, D.; Knezevic, A.; Dokli, I.; Lesac, A.; Dozov, I. Freedericksz-Like Transition in a Biaxial Smectic-A Phase. Phys. Rev. X 2021, 11, 031012. [Google Scholar] [CrossRef]
- Meyer, C.; Luckhurst, G.R.; Dozov, I. Flexoelectrically Driven Electroclinic Effect in the Twist-Bend Nematic Phase of Achiral Molecules with Bent Shapes. Phys. Rev. Lett. 2013, 111, 067801. [Google Scholar] [CrossRef]
- Meyer, C.; Luckhurst, G.R.; Dozov, I. The temperature dependence of the heliconical tilt angle in the twist-bend nematic phase of the odd dimer CB7CB. J. Mater. Chem. 2015, 3, 318–328. [Google Scholar] [CrossRef]
- Imrie, C.T.; Walker, R.; Storey, J.M.D.; Gorecka, E.; Pociecha, D. Liquid Crystal Dimers and Smectic Phases from the Intercalated to the Twist-Bend. Crystals 2022, 12, 1245. [Google Scholar] [CrossRef]
- Mandle, R.J. A Ten-Year Perspective on Twist-Bend Nematic Materials. Molecules 2022, 27, 2689. [Google Scholar] [CrossRef]
- Borshch, V.; Kim, Y.K.; Xiang, J.; Gao, M.; Jakli, A.; Panov, V.P.; Vij, J.K.; Imrie, C.T.; Tamba, M.G.; Mehl, G.H.; et al. Nematic twist-bend phase with nanoscale modulation of molecular orientation. Nat. Commun. 2013, 4, 2635. [Google Scholar] [CrossRef] [Green Version]
- Chen, D.; Porada, J.H.; Hooper, J.B.; Klittnick, A.; Shen, Y.; Tuchband, M.R.; Korblova, E.; Bedrov, D.; Walba, D.M.; Glaser, M.A.; et al. Chiral heliconical ground state of nanoscale pitch in a nematic liquid crystal of achiral molecular dimers. Proc. Natl. Acad. Sci. USA 2013, 110, 15931–15936. [Google Scholar] [CrossRef] [Green Version]
- Paterson, D.A.; Abberley, J.P.; Harrison, W.T.; Storey, J.M.; Imrie, C.T. Cyanobiphenyl-based liquid crystal dimers and the twist-bend nematic phase. Liq. Cryst. 2017, 44, 127–146. [Google Scholar] [CrossRef]
- Paterson, D.A.; Gao, M.; Kim, Y.K.; Jamali, A.; Finley, K.L.; Robles-Hernandez, B.; Diez-Berart, S.; Salud, J.; de la Fuente, M.R.; Timimi, B.A.; et al. Understanding the twist-bend nematic phase: The characterisation of 1-(4-cyanobiphenyl-4′-yloxy)-6-(4-cyanobiphenyl-4′-yl)hexane (CB6OCB) and comparison with CB7CB. Soft Matter 2016, 12, 6827–6840. [Google Scholar] [CrossRef] [Green Version]
- Robles-Hernandez, B.; Sebastian, N.; Rosario de la Fuente, M.; Lopez, D.O.; Diez-Berart, S.; Salud, J.; Ros, M.B.; Dunmur, D.A.; Luckhurst, G.R.; Timimi, B.A. Twist, tilt, and orientational order at the nematic to twist-bend nematic phase transition of 1″,9″-bis(4-cyanobiphenyl-4′-yl) nonane: A dielectric, 2H NMR, and calorimetric study. Phys. Rev. E 2015, 92, 062505. [Google Scholar] [CrossRef] [Green Version]
- Salamonczyk, M.; Vaupotic, N.; Pociecha, D.; Wang, C.; Zhu, C.; Gorecka, E. Structure of nanoscale-pitch helical phases: Blue phase and twist-bend nematic phase resolved by resonant soft X-ray scattering. Soft Matter 2017, 13, 6694–6699. [Google Scholar] [CrossRef] [Green Version]
- Zhu, C.; Tuchband, M.R.; Young, A.; Shuai, M.; Scarbrough, A.; Walba, D.M.; Maclennan, J.E.; Wang, C.; Hexemer, A.; Clark, N.A. Resonant Carbon K-Edge Soft X-ray Scattering from Lattice-Free Heliconical Molecular Ordering: Soft Dilative Elasticity of the Twist-Bend Liquid Crystal Phase. Phys. Rev. Lett. 2016, 116, 147803. [Google Scholar] [CrossRef] [Green Version]
- Jokisaari, J.P.; Luckhurst, G.R.; Timimi, B.A.; Zhu, J.F.; Zimmermann, H. Twist-bend nematic phase of the liquid crystal dimer CB7CB: Orientational order and conical angle determined by Xe-129 and H-2 NMR spectroscopy. Liq. Cryst. 2015, 42, 708–721. [Google Scholar] [CrossRef]
- Adlem, K.; Copic, M.; Luckhurst, G.R.; Mertelj, A.; Parri, O.; Richardson, R.M.; Snow, B.D.; Timimi, B.A.; Tuffin, R.P.; Wilkes, D. Chemically induced twist-bend nematic liquid crystals, liquid crystal dimers, and negative elastic constants. Phys. Rev. E 2013, 88, 022503. [Google Scholar] [CrossRef]
- Panov, V.P.; Vij, J.K.; Balachandran, R.; Borshch, V.; Lavrentovich, O.D.; Tamba, M.G.; Mehl, G.H. Properties of the self-deforming Ntb phase in mesogenic dimers. In Liquid Crystals Xvii; Khoo, I.C., Ed.; SPIE: Bellingham, WA, USA, 2013; Volume 8828. [Google Scholar]
- Dawood, A.A.; Grossel, M.C.; Luckhurst, G.R.; Richardson, R.M.; Timimi, B.A.; Wells, N.J.; Yousif, Y.Z. Twist-bend nematics, liquid crystal dimers, structure-property relations. Liq. Cryst. 2017, 44, 106–126. [Google Scholar] [CrossRef]
- Mandle, R.J.; Cowling, S.J.; Goodby, J.W. Combined Microscopy, Calorimetry and X-ray Scattering Study of Fluorinated Dimesogens. Sci. Rep. 2017, 7, 13323. [Google Scholar] [CrossRef] [Green Version]
- Meyer, C.; Luckhurst, G.R.; Dozov, I. Broken-symmetry nematic banana phases: Predictions and reality. In Proceedings of the 24th International Liquid Crystal Conference, Mainz, Germany, 19–24 August 2012. [Google Scholar]
- Lewandowski, W.; Vaupotic, N.; Pociecha, D.; Gorecka, E.; Liz-Marzan, L.M. Chirality of Liquid Crystals Formed from Achiral Molecules Revealed by Resonant X-ray Scattering. Adv. Mater. 2020, 32, 1905591. [Google Scholar] [CrossRef]
- Mandle, R.J.; Goodby, J.W. Order parameters, orientational distribution functions and heliconical tilt angles of oligomeric liquid crystals. Phys. Chem. Chem. Phys. 2019, 21, 6839–6843. [Google Scholar] [CrossRef]
- Meyer, C.; Stoenescu, D.; Luckhurst, G.R.; Davidson, P.; Dozov, I. Smectic-like batonnets in nematic/twist-bend nematic biphasic samples. Liq. Cryst. 2017, 44, 232–243. [Google Scholar] [CrossRef]
- Salili, S.M.; Kim, C.; Sprunt, S.; Gleeson, J.T.; Parri, O.; Jákli, A. Flow properties of a twist-bend nematic liquid crystal. RSC Adv. 2014, 4, 57419–57423. [Google Scholar] [CrossRef]
- Meyer, C. Nematic twist-bend phase under external constraints. Liq. Cryst. 2016, 43, 2144–2162. [Google Scholar] [CrossRef]
- Meyer, C.; Dozov, I. Local distortion energy and coarse-grained elasticity of the twist-bend nematic phase. Soft Matter 2016, 12, 574–580. [Google Scholar] [CrossRef]
- Dozov, I.; Meyer, C. Analogy between the twist-bend nematic and the smectic A phases and coarse-grained description of the macroscopic N-TB properties. Liq. Cryst. 2017, 44, 4–23. [Google Scholar] [CrossRef]
- de Gennes, P.G. An analogy between superconductors and smectics A. Solid State Commun. 1972, 10, 753–756. [Google Scholar] [CrossRef]
- Shamid, S.M.; Dhakal, S.; Selinger, J.V. Statistical mechanics of bend flexoelectricity and the twist-bend phase in bent-core liquid crystals. Phys. Rev. E 2013, 87, 052503. [Google Scholar] [CrossRef] [Green Version]
- Garoff, S.; Meyer, R.B. Electro-clinic effect at AC phase-change in a chiral smectic liquid-crystal. Phys. Rev. Lett. 1977, 38, 848–851. [Google Scholar] [CrossRef]
- Panov, V.P.; Balachandran, R.; Nagaraj, M.; Vij, J.K.; Tamba, M.G.; Kohlmeier, A.; Mehl, G.H. Microsecond linear optical response in the unusual nematic phase of achiral bimesogens. Appl. Phys. Lett. 2011, 99, 261903. [Google Scholar] [CrossRef] [Green Version]
- Meyer, C.; Dozov, I.; Davidson, P.; Luckhurst, G.R.; Dokli, I.; Knezevic, A.; Lesac, A. Electric-field effects in the twist-bend nematic phase. In Emerging Liquid Crystal Technologies Xiii; Chien, L.C., Broer, D.J., Musevic, I., Chigrinov, V.G., Eds.; SPIE: Bellingham, WA, USA, 2018; Volume 10555. [Google Scholar]
- Barnes, P.J.; Douglass, A.G.; Heeks, S.K.; Luckhurst, G.R. An enhanced odd even effect of liquid-crystal dimers orientational order in the alpha, omega-bis(4′-cyanobiphenyl-4-yl)alkanes. Liq. Cryst. 1993, 13, 603–613. [Google Scholar] [CrossRef]
- Knežević, A.; Sapunar, M.; Buljan, A.; Dokli, I.; Hameršak, Z.; Kontrec, D.; Lesac, A. Fine-tuning the effect of π–π interactions on the stability of the NTB phase. Soft Matter 2018, 14, 8466–8474. [Google Scholar] [CrossRef]
- Parsouzi, Z.; Shamid, S.M.; Borshch, V.; Challa, P.K.; Baldwin, A.R.; Tamba, M.G.; Welch, C.; Mehl, G.H.; Gleeson, J.T.; Jakli, A.; et al. Fluctuation Modes of a Twist-Bend Nematic Liquid Crystal. Phys. Rev. X 2016, 6, 021041. [Google Scholar] [CrossRef] [Green Version]
- Pajak, G.; Longa, L.; Chrzanowska, A. Nematic twist-bend phase in an external field. Proc. Natl. Acad. Sci. USA 2018, 115, E10303–E10312. [Google Scholar] [CrossRef] [Green Version]
- Meyer, C.; Blanc, C.; Luckhurst, G.R.; Davidson, P.; Dozov, I. Biaxiality-driven twist-bend to splay-bend nematic phase transition induced by an electric field. Sci. Adv. 2020, 6, eabb8212. [Google Scholar] [CrossRef]
- Panov, V.P.; Song, J.K.; Mehl, G.H.; Vij, J.K. The Beauty of Twist-Bend Nematic Phase: Fast Switching Domains, First Order Freedericksz Transition and a Hierarchy of Structures. Crystals 2021, 11, 060621. [Google Scholar] [CrossRef]
- Patel, J.S.; Meyer, R.B. Flexoelectric electrooptics of a cholesteric liquid-crystal. Phys. Rev. Lett. 1987, 58, 1538–1540. [Google Scholar] [CrossRef]
- Meyer, R.B. Piezoelectric effects in liquid crystals. Phys. Rev. Lett. 1969, 22, 918. [Google Scholar] [CrossRef]
- López, D.O.; Robles-Hernandez, B.; Salud, J.; de la Fuente, M.R.; Sebastian, N.; Diez-Berart, S.; Jaen, X.; Dunmur, D.A.; Luckhurst, G.R. Miscibility studies of two twist-bend nematic liquid crystal dimers with different average molecular curvatures. A comparison between experimental data and predictions of a Landau mean-field theory for the NTB–N phase transition. Phys. Chem. Chem. Phys. 2016, 18, 4394–4404. [Google Scholar] [CrossRef] [Green Version]
- Wu, S.-T.; Wu, C.-S. Experimental confirmation of the Osipov-Terentjev theory on the viscosity of nematic liquid crystals. Phys. Rev. A 1990, 42, 2219–2227. [Google Scholar] [CrossRef]
- Kats, E.I.; Lebedev, V.V. Landau theory for helical nematic phases. JETP Lett. 2014, 100, 110–113. [Google Scholar] [CrossRef] [Green Version]
- Greco, C.; Luckhurst, G.R.; Ferrarini, A. Molecular geometry, twist-bend nematic phase and unconventional elasticity: A generalised Maier-Saupe theory. Soft Matter 2014, 10, 9318–9323. [Google Scholar] [CrossRef]


| Compound | Molecular Structure and Phase Transition Temperatures |
|---|---|
| CB7CB |  Iso—114.8 °C-N—99.85 ± 0.35 °C-NTB—37 °C-Cr (Cr—102 °C-NTB) |
| CB9CB |  Iso—124.1 °C-N—107.00 ± 0.0 °C-NTB—41 °C-Cr (Cr—86 °C-NTB) |
| CB6OCB |  Iso—156.6 °C-N—108.08 ± 0.03 °C-NTB—80 °C-Cr (Cr—99 °C-NTB) |
| BNA76 |  Iso—153.1 °C-N—120.00 ± 0.0 °C-NTB—89 °C-SmAb (Cr—121 °C-NTB) |
| Compound | ECE Experiment | Theory [9,31] | Theory [40] | |||||||||
|---|---|---|---|---|---|---|---|---|---|---|---|---|
(°C) | (°C) | (°C) | (°C) | |||||||||
| CB7CB | 0.20 | 0.35 | 0.23 | 0.42 | 0 | 0.5 | 2.0 | 0 | 0.5 | 2.0 | 0.25 | 1.0 |
| CB9CB | 0.45 | 0.14 | 0.33 | 0.45 | 0 | 0.5 | 2.0 | 0 | 0.5 | 2.0 | 0.25 | 1.0 |
| CB6OCB | 1.70 | 0.36 | 0.31 | 0.64 | 0 | 0.5 | 2.0 | 0 | 0.5 | 2.0 | 0.25 | 1.0 |
| BNA76 | 1.17 | 0.50 | 0.23 | 0.78 | 0 | 0.5 | 2.0 | 0 | 0.5 | 2.0 | 0.25 | 1.0 |
Disclaimer/Publisher’s Note: The statements, opinions and data contained in all publications are solely those of the individual author(s) and contributor(s) and not of MDPI and/or the editor(s). MDPI and/or the editor(s) disclaim responsibility for any injury to people or property resulting from any ideas, methods, instructions or products referred to in the content. |
© 2023 by the authors. Licensee MDPI, Basel, Switzerland. This article is an open access article distributed under the terms and conditions of the Creative Commons Attribution (CC BY) license (https://creativecommons.org/licenses/by/4.0/).
Share and Cite
Meyer, C.; Davidson, P.; Luckhurst, G.R.; Dokli, I.; Knežević, A.; Lesac, A.; Paterson, D.A.; Walker, R.; Storey, J.M.D.; Imrie, C.T.; et al. Temperature Dependence of the Electroclinic Effect in the Twist-Bend Nematic Phase. Crystals 2023, 13, 465. https://doi.org/10.3390/cryst13030465
Meyer C, Davidson P, Luckhurst GR, Dokli I, Knežević A, Lesac A, Paterson DA, Walker R, Storey JMD, Imrie CT, et al. Temperature Dependence of the Electroclinic Effect in the Twist-Bend Nematic Phase. Crystals. 2023; 13(3):465. https://doi.org/10.3390/cryst13030465
Chicago/Turabian StyleMeyer, Claire, Patrick Davidson, Geoffrey R. Luckhurst, Irena Dokli, Anamarija Knežević, Andreja Lesac, Daniel A. Paterson, Rebecca Walker, John M. D. Storey, Corrie T. Imrie, and et al. 2023. "Temperature Dependence of the Electroclinic Effect in the Twist-Bend Nematic Phase" Crystals 13, no. 3: 465. https://doi.org/10.3390/cryst13030465