
Rietveld Refinement, Structural Characterization, and Methylene Blue Adsorption of the New Compound Ba0.54Na0.46Nb1.29W0.37O5

 , ,
, ,  , ,
, , 
Abstract
:1. Introduction
2. Methods and Materials
2.1. Manufacturing of Adsorbent
2.2. X-ray Diffraction Technique
2.3. Raman Spectrometer
2.4. Study of Adsorption
- : adsorbed amount (mg/g),
- V: volume of solution (l),
- m: mass of adsorbent (g),
- C0: initial adsorbate concentration (mg/L),
- (Ce): steady-state concentration of adsorbate (mg/L).
3. Results and Discussion
3.1. Characterization of the Adsorbent
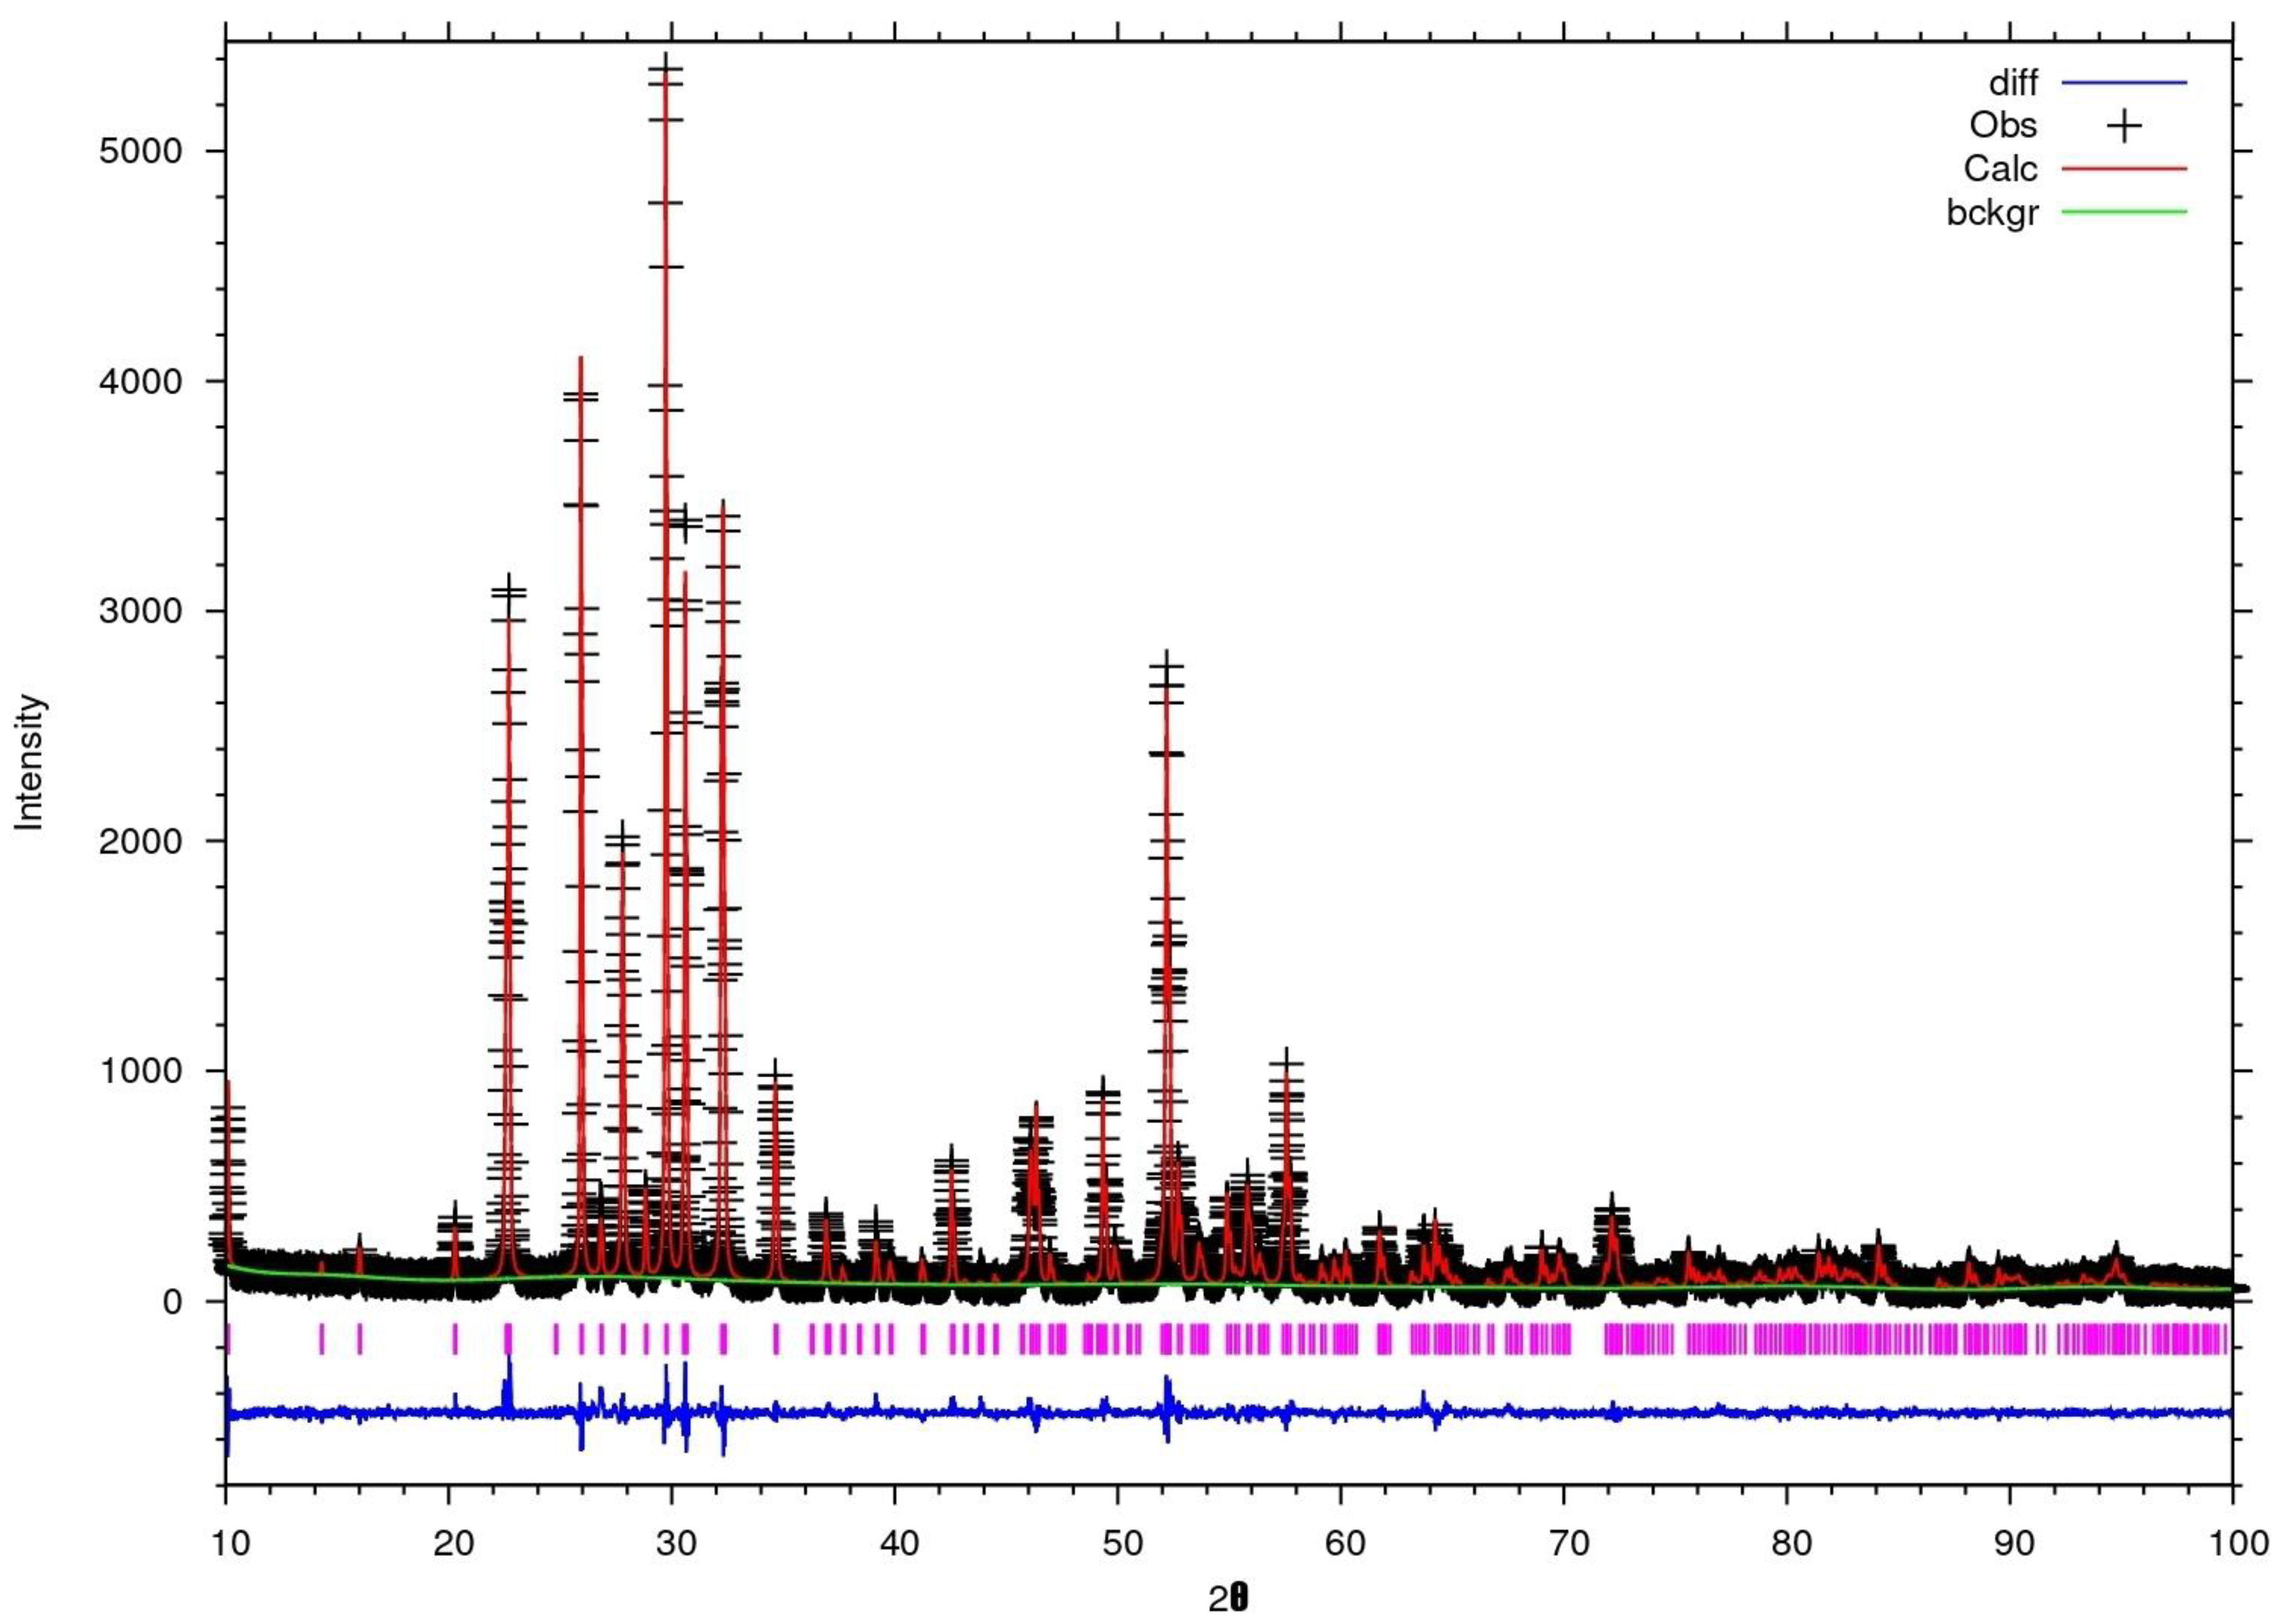
3.1.1. Characterization by X-ray Diffraction
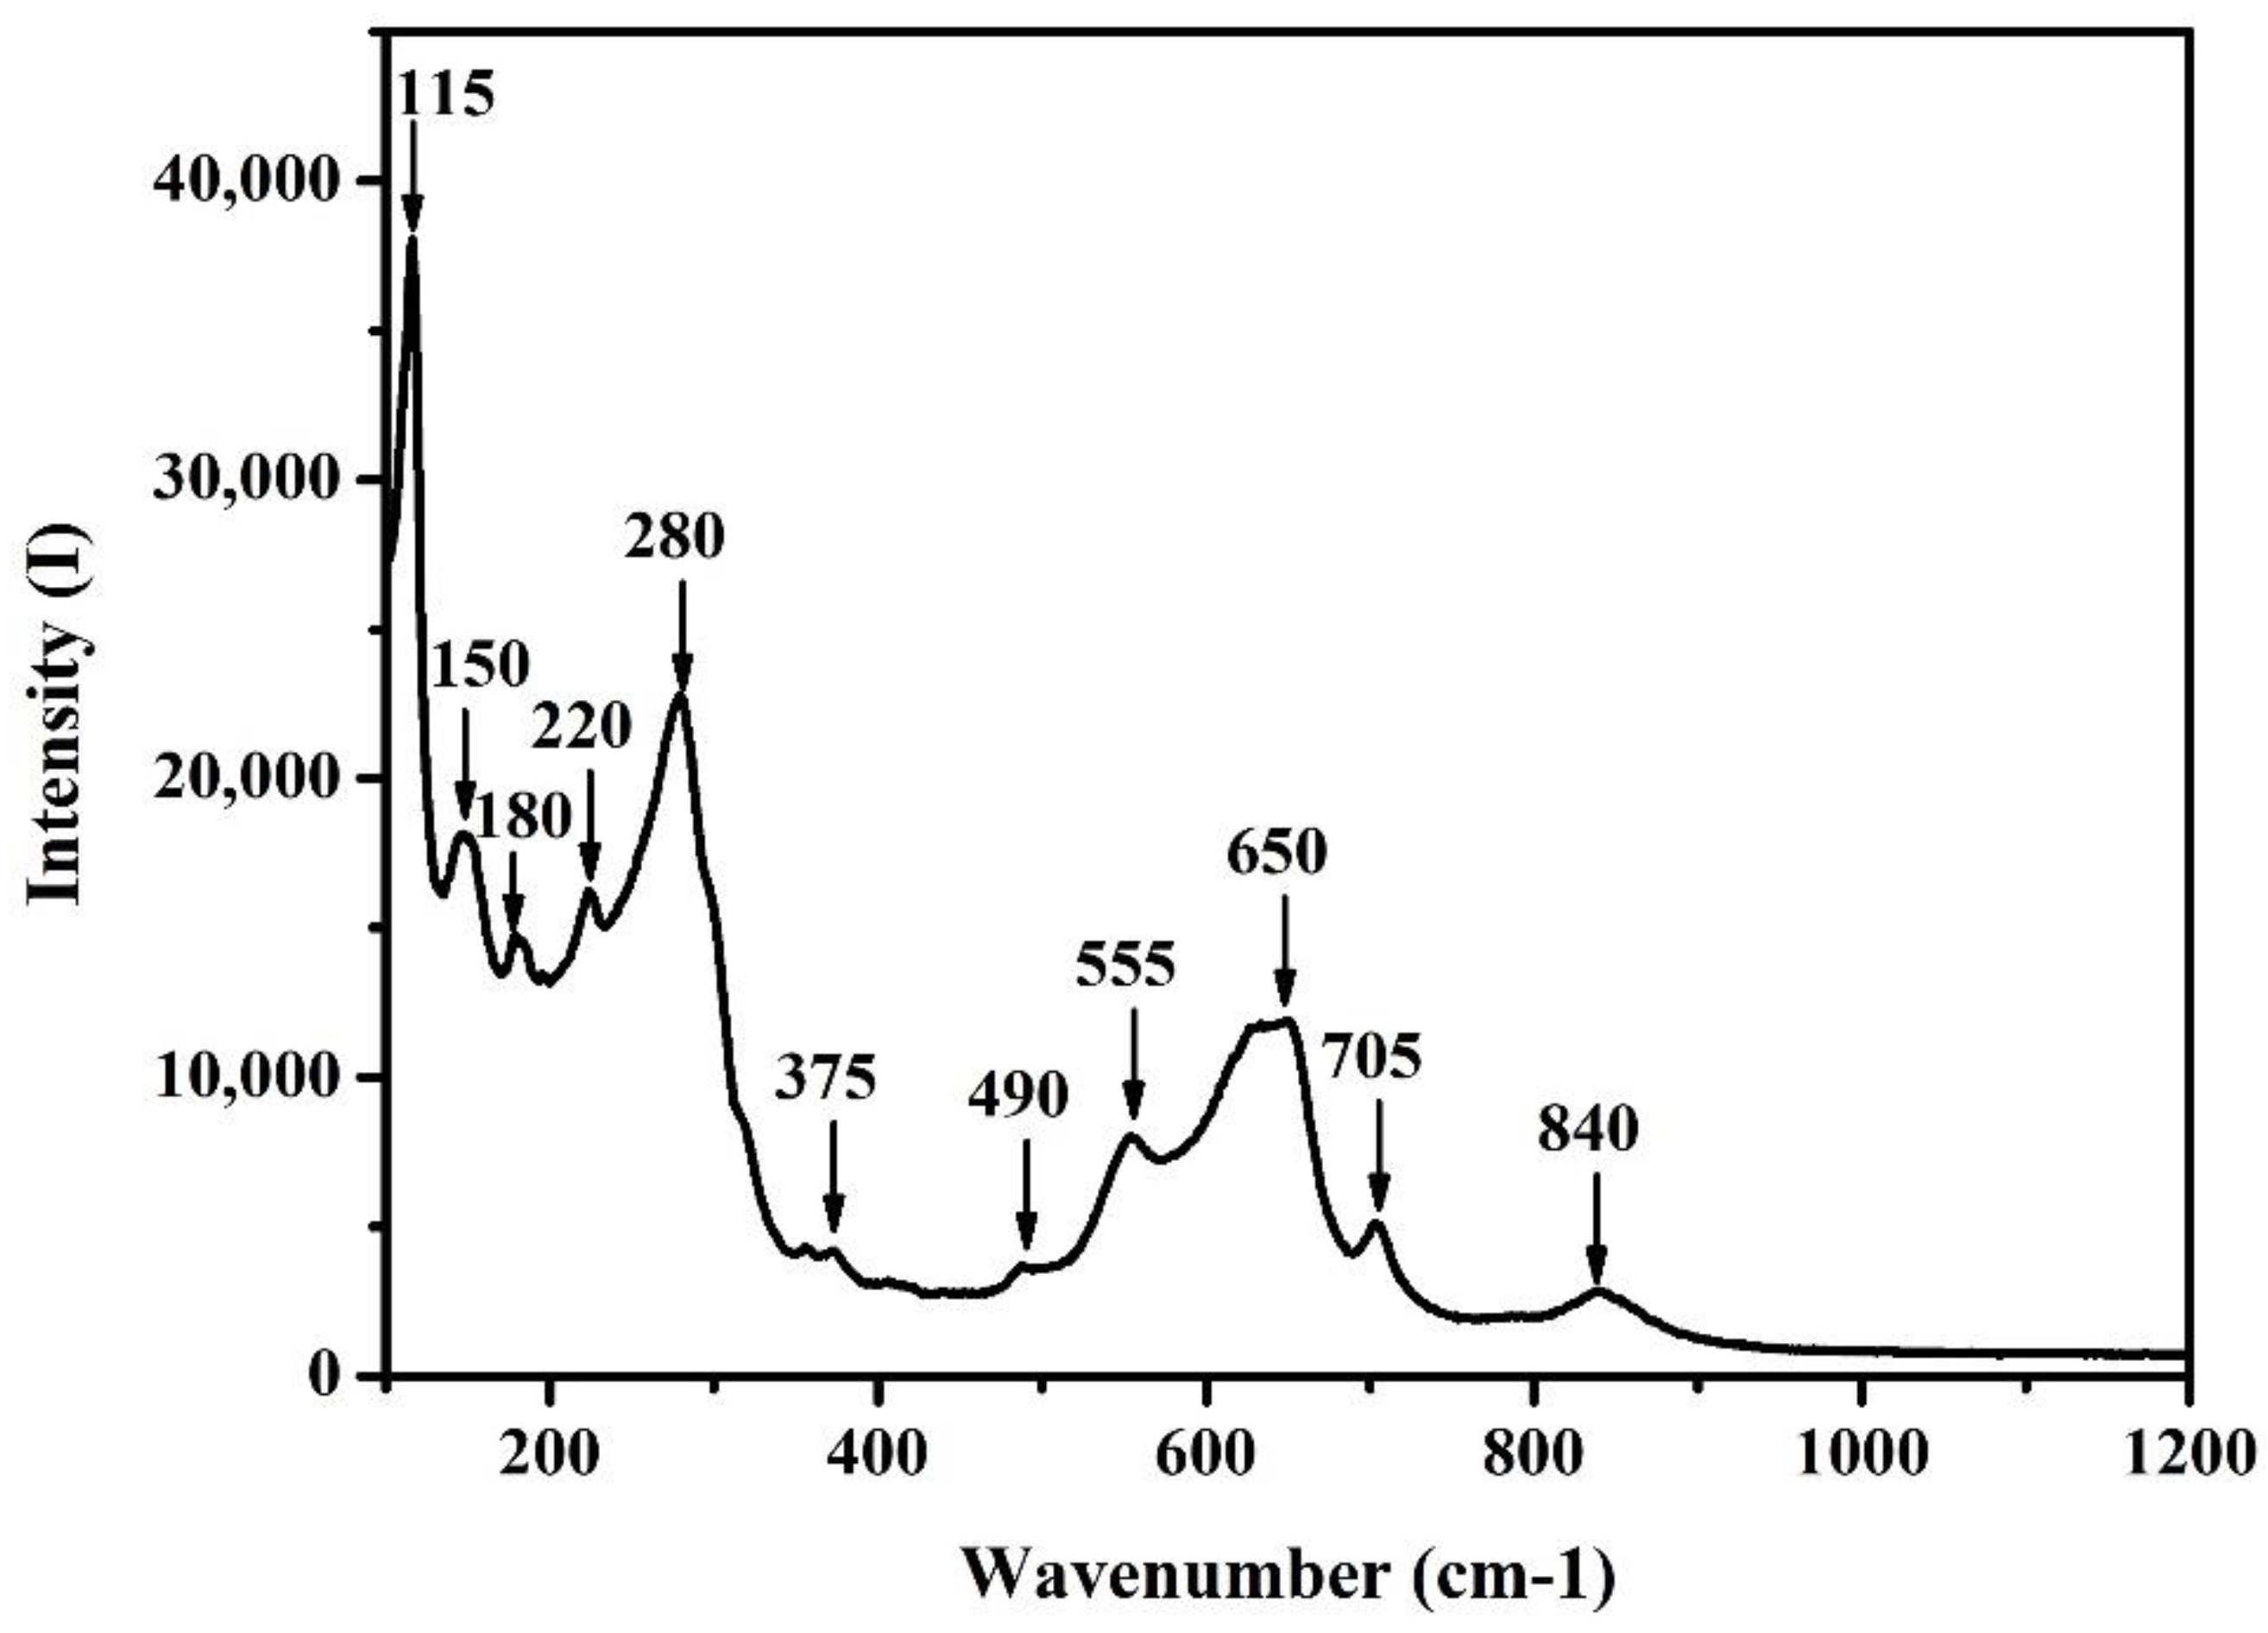
3.1.2. Characterization by Raman Spectroscopy
3.2. Application of Methylene Blue Adsorption to TTB
3.2.1. Effect of Mass on Methylene Blue Adsorption
3.2.2. Influence of the Contact Time on Methylene Blue Adsorption
3.3. Isotherm Studies
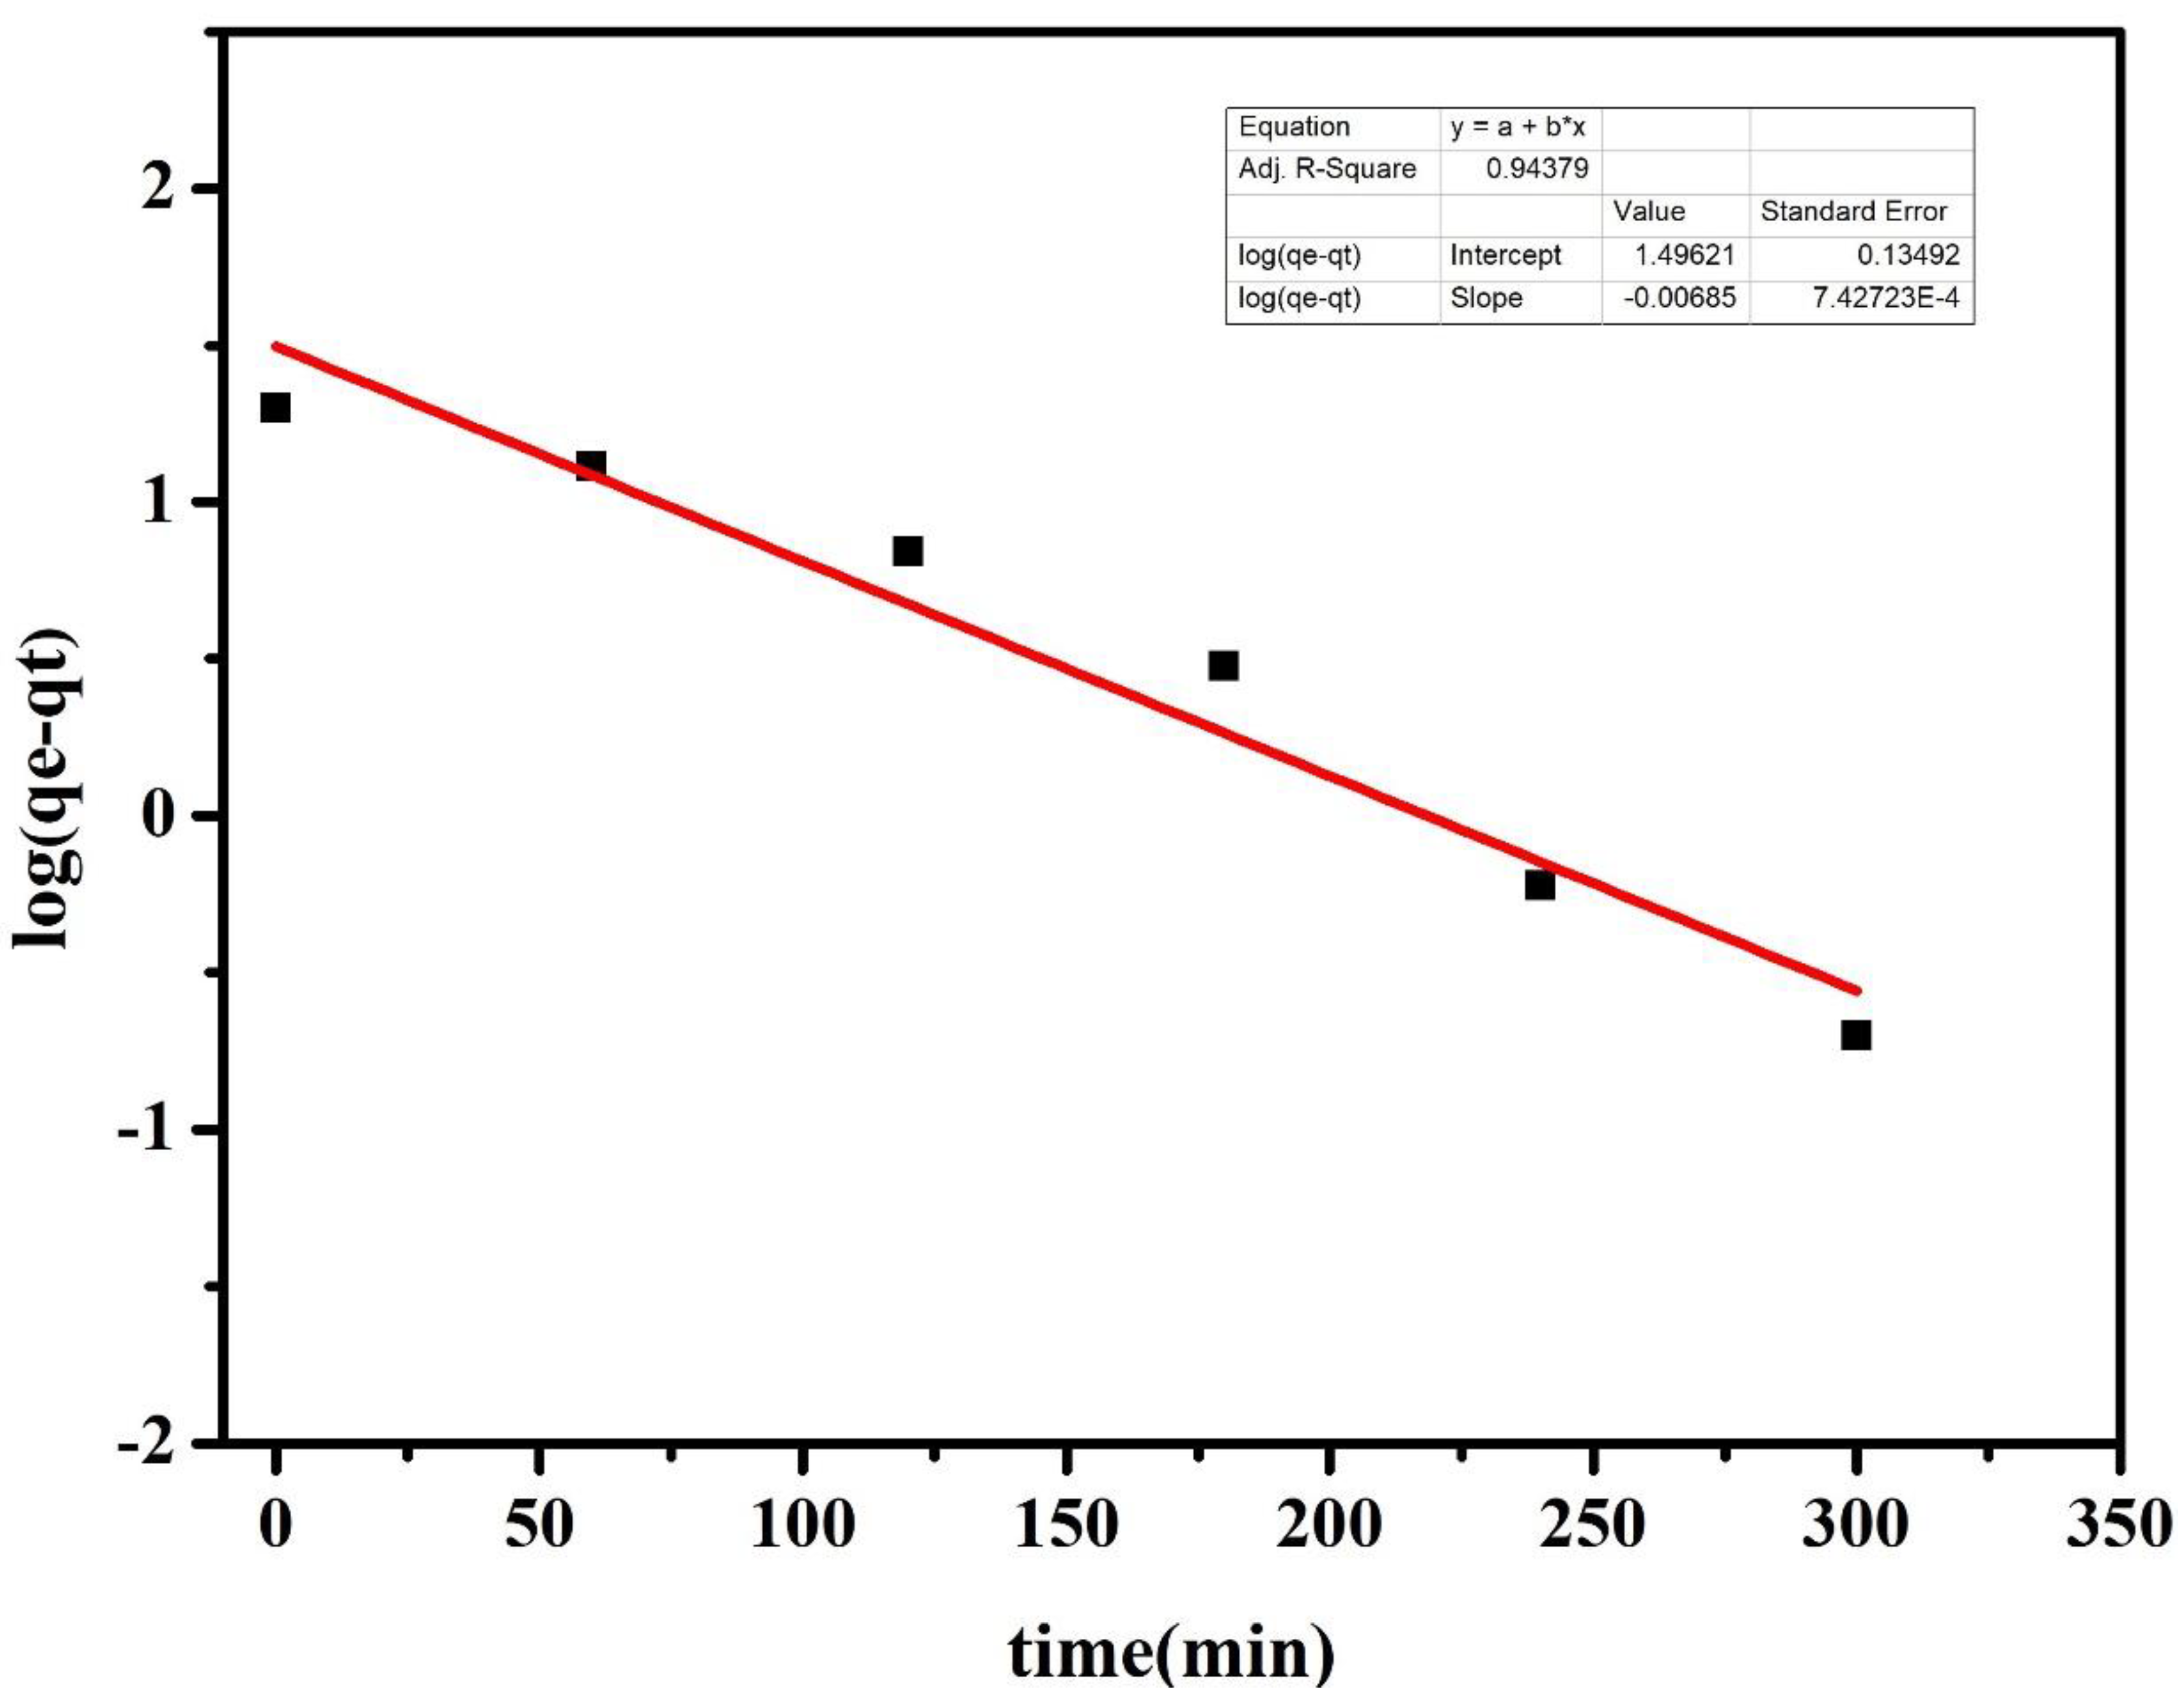
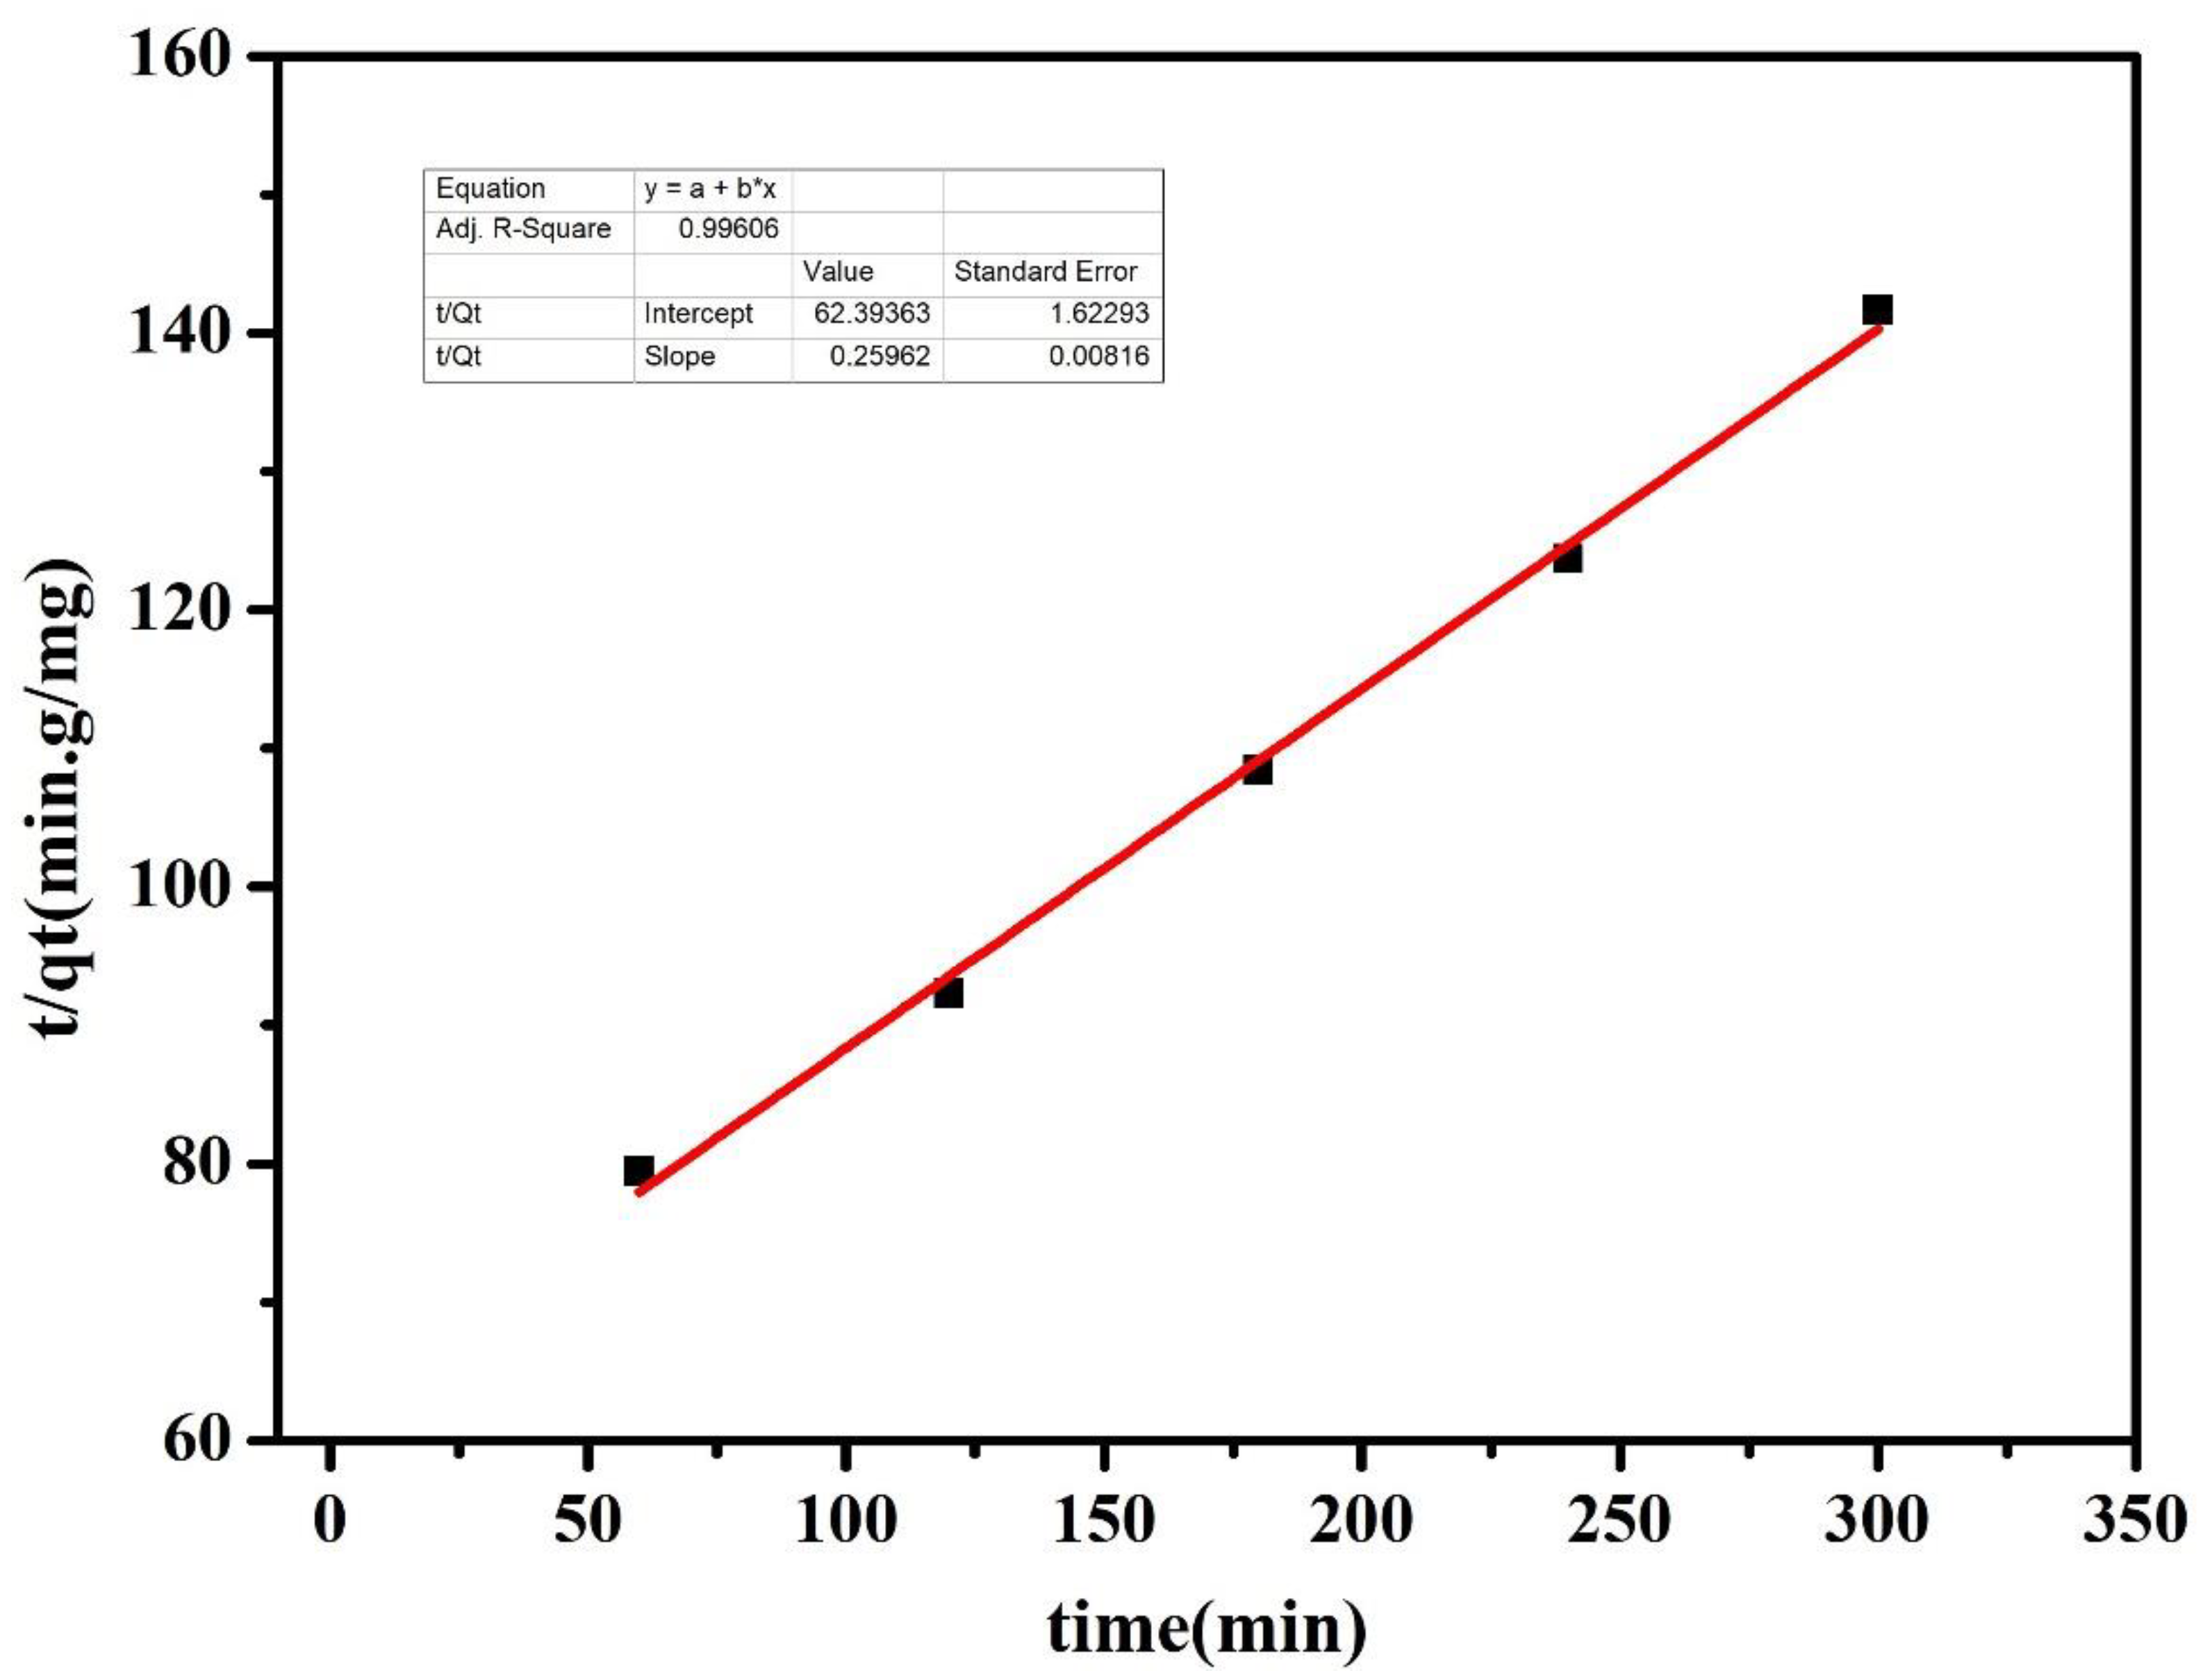
3.4. Kinetics Studies
4. Conclusions
Author Contributions
Funding
Data Availability Statement
Conflicts of Interest
References
- Li, C.; Wang, J.; Wang, B.; Gong, J.; Lin, Z. A novel magnetically separable tio2/cofe2o4 nanofiber with high photocatalytic activity under uv–vis light. Mater. Res. Bull. 2012, 47, 333–337. [Google Scholar] [CrossRef]
- Shao, Y.; Zhou, L.; Bao, C. A facile approach to the fabrication of rattle-type magnetic carbon nanospheres for removal of methylene blue in water. Carbon 2015, 89, 378–391. [Google Scholar] [CrossRef]
- Khakpash, N.; Simchi, A.; Jafari, T. Adsorption and solar light activity of transition-metal doped TiO2 nanoparticles as semiconductor photocatalyst. J. Mater. Sci. Mater. Electron. 2012, 23, 659–667. [Google Scholar] [CrossRef]
- Bhattacharjee, A.; Ahmaruzzaman, M. A green and novel approach for the synthesis of SnO2 nanoparticles and its exploitation as a catalyst in the degradation of methylene blue under solar radiation. Mater. Lett. 2015, 145, 74–78. [Google Scholar] [CrossRef]
- Chen, H.; He, J. Facile Synthesis of Monodisperse Manganese Oxide Nanostructures and Their Application in Water Treatment. J. Phys. Chem. C 2008, 112, 17540–17545. [Google Scholar] [CrossRef]
- Gan, Y.; Tian, N.; Tian, X.; Ma, L.; Wang, W.; Yang, C.; Zhou, Z.; Wang, Y. Adsorption behavior of methylene blue on amine-functionalized ordered mesoporous alumina. J. Porous Mater. 2015, 22, 147–155. [Google Scholar] [CrossRef]
- Ma, Y.; Wang, Q.; Wang, X.; Sun, X.; Wang, X. A comprehensive study on activated carbon prepared from spent shiitake substrate via pyrolysis with ZnCl2. J. Porous Mater. 2015, 2, 157–169. [Google Scholar] [CrossRef]
- Zhu, S.; Fang, S.; Huo, M.; Yu, Y.; Chen, Y.; Yang, X.; Geng, Z.; Wang, Y.; Bian, D.; Huo, H. A novel conversion of the groundwater treatment sludge to magnetic particles for the adsorption of methylene blue. J. Hazard. Mater. 2015, 292, 173–179. [Google Scholar] [CrossRef]
- Wang, W.; Tian, G.; Zhang, Z.; Wang, A. A simple hydrothermal approach to modify palygorskite for high-efficient adsorption of Methylene blue and Cu(II) ions. Chem. Eng. J. 2015, 265, 228–238. [Google Scholar] [CrossRef]
- Fu, J.; Fu, J.; Chen, Z.; Wang, M.; Liu, S.; Zhang, J.; Zhang, J.; Han, R.; Xu, Q. Adsorption of methylene blue by a high-efficiency adsorbent (polydopamine microspheres): Kinetics, isotherm, thermodynamics and mechanism analysis. Chem. Eng. J. 2015, 259, 53–61. [Google Scholar] [CrossRef]
- Han, Q.; Wang, J.; Goodman, B.A.; Xie, J.; Liu, Z. High adsorption of methylene blue by activated carbon prepared from phosphoric acid treated eucalyptus residue. Powder Technol. 2020, 366, 239–248. [Google Scholar] [CrossRef]
- Jaramillo-Fierro, X.; Capa, L.F.; Medina, F.; González, S. DFT study of methylene blue adsorption on ZnTiO3 and TiO2 surfaces (101). Molecules 2021, 26, 3780. [Google Scholar] [CrossRef]
- Kim, S.P.; Choi, M.Y.; Choi, H.C. Photocatalytic activity of SnO2 nanoparticles in methylene blue degradation. Mater. Res. Bull. 2016, 74, 85–89. [Google Scholar] [CrossRef]
- Doma, A.; Hassan, N.; Abd-Elhamid, A.I.; Soliman, H. Adsorption of methylene blue dye on hydrothermally prepared tungsten oxide nanosheets. Egypt. J. Chem. 2020, 63, 483–498. [Google Scholar] [CrossRef]
- Delgado, D.; Fernández-Arroyo, A.; la Salvia, N.; Domine, M.; Nieto, J.L. Reflux-synthesized bulk and diluted W-Nb-O mixed oxide bronzes for the valorization of short-chain oxygenates aqueous mixtures. Chin. J. Catal. 2019, 40, 1778–1787. [Google Scholar] [CrossRef]
- Griffith, K.; Wiaderek, K.; Cibin, G.; Marbell, L.; Grey, C. Niobium tungsten oxides for high-rate lithium-ion energy storage. Nature 2018, 559, 556–563. [Google Scholar] [CrossRef] [Green Version]
- Omata, K.; Izumi, S.; Murayama, T.; Ueda, W. Hydrothermal synthesis of W–Nb complex metal oxides and their application to catalytic dehydration of glycerol to acrolein. Catal. Today 2013, 201, 7–11. [Google Scholar] [CrossRef]
- Wang, C.; Ye, Y.; Tao, B.; Geng, B. Hydrothermal route to twinned-hemisphere-like CuO architectures with selective adsorption performance. CrystEngComm 2012, 14, 3677–3683. [Google Scholar] [CrossRef]
- Prasad, G.; Takei, T.; Yonesaki, Y.; Kumada, N.; Kinomura, N. Hybrid nanocomposite based on NbWO6 nanosheets and polyaniline. Mater. Lett. 2006, 60, 3727–3730. [Google Scholar] [CrossRef]
- Yu, J.; Han, Y.; Jong, H.; Jong, H.I.; Ra, G. Two-step hydrothermal synthetic method of niobium-tungsten complex oxide and its adsorption of methylene blue. Inorg. Chim. Acta 2020, 507, 119562. [Google Scholar] [CrossRef]
- Toby, B.H.; Von Dreele, R.B. What’s new in GSAS-II. Powder Diffr. 2014, 29, S2–S6. [Google Scholar] [CrossRef]
- Lanfredi, S.; Cardoso, C.X.; Nobre, M.A. Crystallographic properties of KSr2Nb5O15. Mater. Sci. Eng. B 2004, 112, 139–143. [Google Scholar] [CrossRef]
- Lanfredi, S.; Gênova, D.H.; Brito, I.A.; Lima, A.R.; Nobre, M.A. Structural characterization and Curie temperature determination of a sodium strontium niobate ferroelectric nanostructured powder. J. Solid State Chem. 2011, 184, 990–1000. [Google Scholar] [CrossRef]
- Zhang, G.; He, F.; Zou, X.; Gong, J.; He, F.; Zhang, H.; Zhang, Q.; Liu, Y.; Yang, X.; Hu, B. Preparation and photocatalytic property of potassium niobate K6Nb10.8O30. J. Alloys Compd. 2006, 425, 76–80. [Google Scholar] [CrossRef]
- El Alaoui-Belghiti, H.; Simon, A.; Gravereau, P.; Villesuzanne, A.; Elaatmani, M.; Ravez, J. Ferroelectric and crystallographic properties of the Sr2−xK1+xNb5O15−xFx solid solution. J. Solid States Sci. 2022, 4, 993. [Google Scholar] [CrossRef]
- Rietveld, H.M. A profile refinement method for nuclear and magnetic structures. J. Appl. Crystallogr. 1969, 2, 65. [Google Scholar] [CrossRef]
- Denton, A.R.; Ashcroft, N.W. Vegard’s law. Phys. Rev. A 1991, 43, 3161. [Google Scholar] [CrossRef]
- Bensaid, H.; Bih, L.; Manoun, B.; Azrour, M.; el Bouari, A.; Lazor, P. X-ray structure refinement of solid solution Ba2.15−xNa0.7+xNb5−xWxO15 and the investigation of the orthorhombic-tetragonal phase transition by Raman spectroscopy. J. Mol. Struct. 2011, 988, 136–143. [Google Scholar] [CrossRef]
- Caglioti, G.; Paoletti, A.; Ricci, F.P. Choice of collimators for a crystal spectrometer for neutron diffraction. Nucl. Instrum. 1958, 3, 223. [Google Scholar] [CrossRef]
- Burns, G.; Axe, J.D.; O’kane, D.F. Raman measurements of NaBa2Nb5O15 and related ferroelectrics. Solid State Commun. 1969, 7, 933. [Google Scholar] [CrossRef]
- Xia, H.R.; Yu, H.; Yang, H.; Wang, K.X.; Zhao, B.Y.; Wei, J.Q.; Wang, J.Y.; Liu, Y.G. Raman and infrared reflectivity spectra of potassium lithium niobate single crystals. Phys. Rev. B 1997, 55, 14892. [Google Scholar] [CrossRef]
- Wilde, R.E. Raman spectrum of Sr0.61Ba0.39Nb2O6. J. Raman Spectosc. 1991, 22, 321. [Google Scholar] [CrossRef]
- Xu, S.; Peng, Z.; Shi, H.; Chao, X.; Wu, D.; Liang, P.; Wei, L.; Yang, Z. Electrical conduction behavior in nonstoichiometric BaBixNb5O15±δ tungsten bronze ceramics. Ceram. Int. 2021, 47, 22382–22389. [Google Scholar] [CrossRef]
- Amira, Y.; Gagou, Y.; Menny, A.; Mezzane, D.; Zegzouti, A.; Elaatmani, M.; El Marssi, M. Structural and Raman properties of the tetragonal tungsten bronze ferroelectric Pb2(1−x)K1+xGdxNb5O15. Solid State Commun. 2010, 150, 419. [Google Scholar] [CrossRef]
- Langmuir, I. The adsorption of gases on plane surfaces of glass, mica and platinum. J. Am. Chem. Soc. 1916, 38, 2221–2295. [Google Scholar] [CrossRef] [Green Version]
- Freundlich, H. Über die Adsorption in Lösungen. Z. Für Phys. Chem. 1906, 57, 384–470. [Google Scholar] [CrossRef]
- Mahmud, K.; Islam, M.A.; Mitsionis, A.; Albanis, T.; Vaimakis, T. Adsorption of direct yellow 27 from water by poorly crystalline hydroxyapatite prepared via precipitation method. Desalination Water Treat. 2012, 41, 170–178. [Google Scholar] [CrossRef]
- Sljivi, M.; Smiciklas, I.; Plecas, I.; Mitri, M. The influence of equilibration conditions and hydroxyapatite physico-chemical properties onto retention of Cu2+ ions. Chem. Eng. J. 2009, 148, 80–88. [Google Scholar] [CrossRef]
- Walker, G.M.; Weatherley, L.R. Adsorption of dyes from aqueous solution—the effect of adsorbent pore size distribution and dye aggregation. Chem. Eng. J. 2001, 83, 201–206. [Google Scholar] [CrossRef]
- Hasnain Isa, M.; Lang, L.S.; Asaari, F.A.H.; Aziz, H.A.; Ramli, N.A.; Dhas, J.P.A. Low cost removal of disperse dyes from aqueous solution using palm ash. Dye. Pigment. 2007, 74, 446–453. [Google Scholar] [CrossRef]
- Li, C.; Ge, X.; Liu, S.; Liu, F. Synthesis of Novel Core-Shell Structured Hydroxyapatite/Meso-Silica for Removal of Methylene Blue from Aqueous Solutions. Adv. Mat. Res. 2012, 463–464, 543–547. [Google Scholar] [CrossRef]
- Wei, W.; Yang, L.; Zhong, W.H.; Li, S.Y.; Cui, J.; Wei, Z.G. An insight into methylene blue adsorption characteristics onto functionalized alginate bio-polymer gel beads with λ-carrageenan-calcium phosphate, carboxymethyl cellulose, and celite 545. Nan. Bio. 2015, 10, 1343–1363. [Google Scholar] [CrossRef]
- Wu, F.C.; Tseng, R.L.; Juang, R.S. Kinetic modeling of liquid-phase adsorption of reactive dyes and metal ions on chitosan. Water Res. 2001, 35, 613–618. [Google Scholar] [CrossRef] [PubMed]
- Rudzinsk, W.; Plazinski, W. Kinetics of Solute Adsorption at Solid/Solution Interfaces: A Theoretical Development of the Empirical Pseudo-First and Pseudo-Second Order Kinetic Rate Equations, Based on Applying the Statistical Rate Theory of Interfacial Transport. J. Phys. Chem. B 2006, 110, 16514–16525. [Google Scholar] [CrossRef]
- Heraldy, E.; Hidayat, Y.; Firdaus, M. The langmuir isotherm adsorption equation: The monolayer approach. In IOP Conference Series: Materials Science and Engineering; IOP Publishing: Bristol, UK, 2016; Volume 107, p. 012067. [Google Scholar] [CrossRef]


| Formula | Ba0.54Na0.46Nb1.29W0.37O5 |
|---|---|
| Crystallographic data | |
| Symmetry | Tetragonal |
| Space group | P4bm |
| Z | 6 |
| Lattice parameters (Å) | |
| Volume (Å3) | 602.983 (12) |
| Calculated density (g/cm3) | 5.836 |
| Experimental conditions for data collection | |
| Wavelength (Å) | and |
| 2θ range (°) | 10.00–100.00 |
| Step (2θ) | 0.01 |
| Integration time (s) | 30 |
| Rietveld data | |
| Program for Rietveld analysis | GSAS-II |
| Chemical formula weight (g/mol) | 353.18 |
| Z | 6 |
| Rp | 7.50 |
| Rwp | 9.76 |
| χ2 | 1.50 |
| GOF | 1.23 |
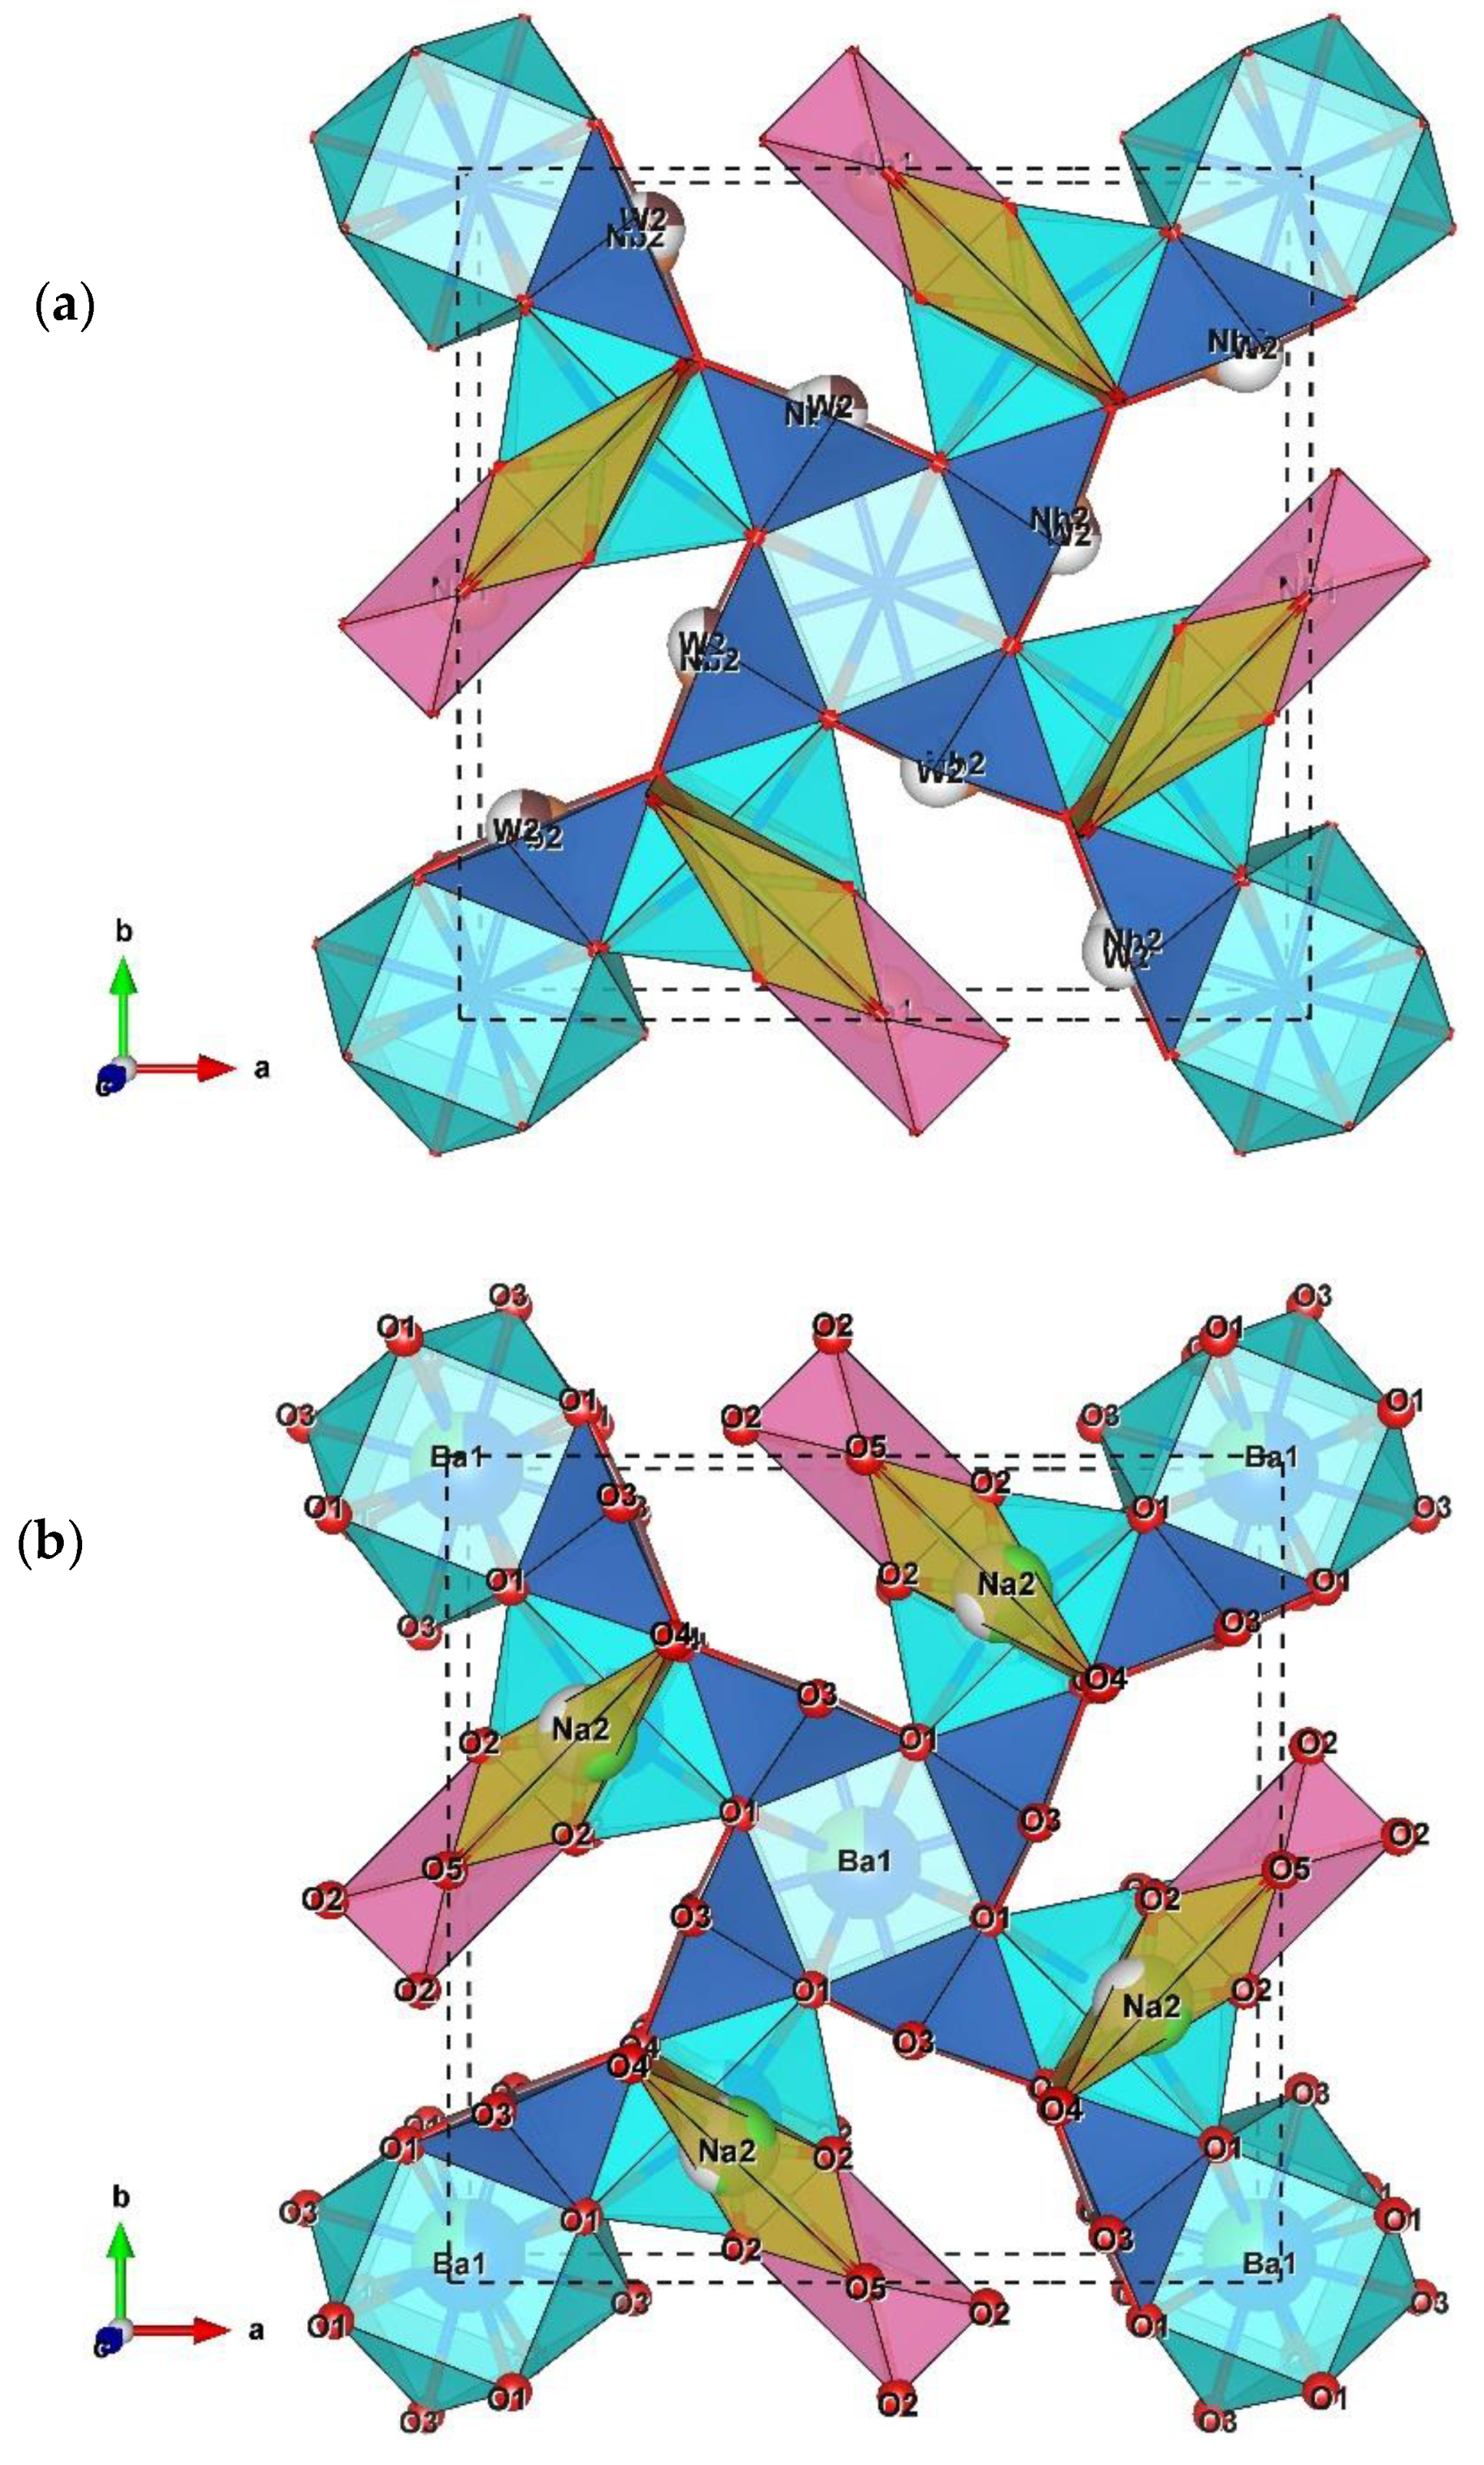
| Atom | Wyckoff | x | y | z | Occupation | Uiso |
|---|---|---|---|---|---|---|
| Ba1 | 2a | 0.0 | 0.0 | 0.05 | 0.716 | 0.800 (12) |
| Na1 | 2a | 0.0 | 0.0 | 0.05 | 0.284 | 0.01442 |
| Ba2 | 4c | 0.17611 (14) | 0.67611 (14) | 0.02135 (14) | 0.454 | 0.00157 |
| Na2 | 4c | 0.16428 (14) | 0.66428 (14) | −0.07711 (14) | 0.546 | 0.02092 |
| Nb1 | 2b | 0.0 | 0.5 | 0.5 | 0.82 | 0.0033 |
| W1 | 2b | 0.0 | 0.5 | 0.5 | 0.164 | 0.00014 |
| Nb2 | 8d | 0.08364 (17) | 0.20650 (18) | 0.4759 (30) | 0.761 | 0.0229 (6) |
| W2 | 8d | 0.06475 (32) | 0.21564 (32) | 0.518 (4) | 0.239 | 0.0206 (12) |
| O1 | 8d | 0.1535 (7) | 0.0650 (8) | 0.501 (24) | 1.0 | 0.0520 (27) |
| O2 | 8d | 0.3514 (13) | 0.0389 (17) | 0.771 (12) | 1.0 | 0.5757 (27) |
| O3 | 8d | 0.0574 (8) | 0.2069 (8) | −0.037 (9) | 1.0 | 0.0312 (27) |
| O4 | 4c | 0.2753 (7) | 0.7753 (7) | 0.419 (6) | 1.0 | 0.01142 |
| O5 | 2b | 0.0 | 0.5 | −0.02 | 1.0 | 0.7505 (27) |
| Principal Interatomic Distances (Å) Ba1/Na1–O | |
|---|---|
| Ba1/Na1–O1 | 2.99 (7) × 4 |
| Ba1/Na1–O1 | 2.72 (7) × 4 |
| Ba1/Na1–O3 | 2.680 (11) × 4 |
| (Ba1/Na1–O) | 2.7967 |
| Principal interatomic distances (Å) Ba2/Na2–O | |
| Ba2/Na2–O1 | 3.25 (6) × 2 |
| Ba2/Na2–O1 | 3.15 (6) × 2 |
| Ba2/Na2–O2 | 1.67 (3) × 2 |
| Ba2/Na2–O2 | 1.99 (3) × 2 |
| Ba2/Na2–O4 | 2.755 (18) × 2 |
| Ba2/Na2–O4 | 2.777 (18) × 2 |
| (Ba2/Na2–O) | 2.59866 |
| Principal interatomic distances (Å) Nb1/W1–O | |
| Nb1/W1–O2 | 2.18 (3) × 4 |
| Nb1/W1–O5 | 2.04634 (3) |
| Nb1/W1–O5 | 1.88892 (3) |
| (Nb1/W1–O) | 2.03842 |
| Principal interatomic distances (Å) Nb2/W2–O | |
| Nb2/W2–O1 | 1.782 (11) |
| Nb2/W2–O1 | 1.956 (12) |
| Nb2/W2–O2 | 2.34 (3) |
| Nb2/W2–O3 | 1.76 (4) |
| Nb2/W2–O4 | 2.149 (11) |
| Nb2/W2–O4 | 1.956 (10) |
| hNb2/W2–O | 1.99050 |
| Frequency (cm−1) | Band Assignment |
|---|---|
| 485→115 | Octahedra (W/NbO6) or cation translation vibrations (Ba2+, Na+) |
| 650→485 | W/Nb–O stretching vibrations caused by deformation |
| 840→650 | W/Nb–O bonds |
| Isotherme of Langmuir | Isotherme of Freundlich |
|---|---|
| (L/mg) = 0.002 | (mg/g) = 0.022 |
| qm,cal (mg/g) = 20.83 monocouche | n = 1.56 |
| R2 = 1 | R2 = 0.98625 |
| = 0.02 |
| Pseudo-First Order | Pseudo-Second Order | |||||
|---|---|---|---|---|---|---|
| R2 | R2 | |||||
| 19.41 | 20.83 | 0.016 | 0.9479 | 20.83 | 3.69 10−5 | 0.9960 |
Publisher’s Note: MDPI stays neutral with regard to jurisdictional claims in published maps and institutional affiliations. |
© 2022 by the authors. Licensee MDPI, Basel, Switzerland. This article is an open access article distributed under the terms and conditions of the Creative Commons Attribution (CC BY) license (https://creativecommons.org/licenses/by/4.0/).
Share and Cite
Es-soufi, H.; Bih, H.; Bih, L.; Rajesh, R.; Lima, A.R.F.; Sayyed, M.I.; Mezher, R. Rietveld Refinement, Structural Characterization, and Methylene Blue Adsorption of the New Compound Ba0.54Na0.46Nb1.29W0.37O5. Crystals 2022, 12, 1695. https://doi.org/10.3390/cryst12121695
Es-soufi H, Bih H, Bih L, Rajesh R, Lima ARF, Sayyed MI, Mezher R. Rietveld Refinement, Structural Characterization, and Methylene Blue Adsorption of the New Compound Ba0.54Na0.46Nb1.29W0.37O5. Crystals. 2022; 12(12):1695. https://doi.org/10.3390/cryst12121695
Chicago/Turabian StyleEs-soufi, Hicham, Hssain Bih, Lahcen Bih, Raman Rajesh, Alan Rogerio Ferreira Lima, M. I. Sayyed, and Rabih Mezher. 2022. "Rietveld Refinement, Structural Characterization, and Methylene Blue Adsorption of the New Compound Ba0.54Na0.46Nb1.29W0.37O5" Crystals 12, no. 12: 1695. https://doi.org/10.3390/cryst12121695