Review

Recent Advances in the Application of Characterization Techniques for Studying Physical Stability of Amorphous Pharmaceutical Solids

1
School of Pharmacy, Jiangsu Vocational College of Medicine, Yancheng 224005, China
2
Institute of Marine Biomedicine, Shenzhen Polytechnic, Shenzhen 518055, China
*
Authors to whom correspondence should be addressed.
Yanan Wang and Yong Wang contributed equally to this work.
Crystals 2021, 11(12), 1440; https://doi.org/10.3390/cryst11121440
Submission received: 9 October 2021 / Revised: 19 November 2021 / Accepted: 19 November 2021 / Published: 23 November 2021
(This article belongs to the Special Issue Multicomponent Pharmaceutical Solids)

Abstract

:
The amorphous form of a drug usually exhibits higher solubility, faster dissolution rate, and improved oral bioavailability in comparison to its crystalline forms. However, the amorphous forms are thermodynamically unstable and tend to transform into a more stable crystalline form, thus losing their advantages. In order to investigate and suppress the crystallization, it is vital to closely monitor the drug solids during the preparation, storage, and application processes. A list of advanced techniques—including optical microscopy, surface grating decay, solid-state nuclear magnetic resonance, broadband dielectric spectroscopy—have been applied to characterize the physicochemical properties of amorphous pharmaceutical solids, to provide in-depth understanding on the crystallization mechanism. This review briefly summarizes these characterization techniques and highlights their recent advances, so as to provide an up-to-date reference to the available tools in the development of amorphous drugs.

1. Introduction

Oral administration is a preferred route for drug delivery in many cases because of it is easy, convenient, and safe for most patients. However, many new drug candidates with low solubility fail to reach the target bioavailability via oral administration [1]. One effective approach to enhance the solubility of poorly water-soluble drugs is to keep the drugs in their amorphous form [2,3,4]. Compared to crystals, amorphous solids are inherently in the higher-energy state and thus their dissolution is more energy favorable [5]. However, the higher-energy of amorphous solids can also cause phase instability and drive them towards crystallization, causing the loss of their advantages being amorphous.
A common approach to improve the stability of the amorphous drugs is to disperse them into polymeric materials to yield kinetically stable amorphous solid dispersions [6,7,8,9,10,11,12,13,14,15,16]. To obtain a better insight into the physical stability of amorphous pharmaceutical solids, it is of special importance to investigate the key physicochemical properties governing the crystallization and phase separation. In the past few decades, key thermodynamic and kinetic properties of amorphous solids have been extensively studied, including configurational entropy, structural relaxation, secondary relaxation, surface molecular diffusion, etc. [17,18,19,20]. These thermodynamic and kinetic properties have attracted wide attentions because they are considered important parameters for predicting the physical stability of amorphous pharmaceutical solids.
Unique properties of crystalline and amorphous solids have been extensively investigated by several established and emerging techniques including polarized light microscope combined with a hot stage, surface grating decay, thermal analysis, broadband dielectric spectroscopy, and solid-state nuclear magnetic resonance (NMR). In this article, we will review the recent advances and highlight the applications of these characterization techniques. Moreover, we will also briefly discuss the limitations, challenges, and future development trends of these characterization techniques, and the aim is to provide a reference of current tools for developing robust amorphous pharmaceutical formulations.

2. Combination of Polarized Light Microscope and Hot Stage

Polarized light microscope is one of the most widely used techniques in characterizing nucleation [21,22,23], crystal growth [24,25], polymorphic transition [26], and phase separation [27] of amorphous pharmaceutical solids. In recent studies, polarized light microscopy was often combined with a hot stage to extend its experimental temperature range and achieve the goal of precise temperature control. Prior to investigating the nucleation and crystal growth processes, amorphous drug was firstly prepared by the melting-quenching method using a hot stage for precisely controlling the temperature. The drugs prepared by the melt-quenching method are confirmed to be amorphous by the absence of birefringence under the polarized light microscope.
Cai and co-workers systemically investigated the crystal growth behaviors of a classical antifungal drug griseofulvin as a function of temperature by a polarized light microscope equipped with a hot stage [24]. As shown in Figure 1, growth morphologies of griseofulvin crystals exhibit strong temperature dependence, producing faceted coarse crystals near the melting point (Tm), fiber-like fine crystal near the glass transition temperature (Tg), and even finer compact spherulites below Tg [24]. In addition, the velocity of crystal growth of griseofulvin could also be measured by recording the advancing growth front of the crystal into the supercooled liquid or glass as a function of time [24]. In the supercooled liquid, the rate of crystal growth decreases with the temperature decreasing near Tm while it increases with the temperature further decreasing near Tg. This bell-shaped curve of crystal growth rate vs. temperature is mainly attributed to the competition between the negative dependence of the thermodynamic driving force and the positive dependence of the bulk molecular diffusion on the temperature. For some small-molecule drugs, one fast crystal growth mode termed as glass-to-crystal (GC) growth, is activated as the temperature decreases near or below Tg, with a rate orders of magnitude faster than those predicted by bulk diffusion controlled modes [24,28]. Several models have been proposed to explain the GC growth; however, its mechanism remain imperfectly understood. In a very recent model, voids and free surface is proposed to be continuously created by fracture, leading the fast GC growth by taking advantage of the fast surface mobility.
For the crystal growth in drug–polymer binary systems, one interesting phenomenon, polymer enrichment as a function of temperature and polymer concentration, could be observed at the advancing growth front of crystal using polarized light microscopy combined with a hot stage [29,30]. Visual observations can directly provide a reasonable explanation for the fact that the increase of global molecular mobility alone is insufficient to account for the accelerating effects of a low-Tg polymer—e.g., poly (ethylene oxide) (PEO)—on the crystal growth of small-molecule drug griseofulvin and indomethacin [31,32]. In addition to the high global molecular mobility, PEO enrichment at the growth front could also accelerate the mass transport of drug molecules entering the crystalline phase by the high segmental mobility of PEO [29,30]. Moreover, polymer enrichment could also be one of the key factors rendering the selective effect of polymer on the crystal growth of different drug polymorphs [30]. In a very recent study, Zhang et al. found that the extent of the accelerating effect of PEO on the crystal growth of indomethacin polymorphs is very consistent with the concentration of PEO enrichment at the crystal–liquid interface [30]. They proposed that distinct drug–polymer distribution at the growth front of indomethacin polymorphs strongly affects the mass transport of drug molecules and the energy barrier, thus leading to the selective accelerating effects of PEO on crystal growth of indomethacin polymorphs [30].
Apart from studying crystal growth behaviors, polarized light microscope combined with hot stage can be used to explore the nucleation of amorphous pharmaceutical solids [21,22,23]. According to the different kinetics of nucleation and crystal growth, studies on drug nucleation can be mainly defined as one-stage method and two-stage method [21,22,23]. One-stage method can be used to determine the number of nucleation events per unit volume for the drug systems showing both fast nucleation and fast crystal growth behaviors. Herein, individual nucleation is allowed to grow to the observable size for some time t0 in the supercooled liquid. The size and growth rates of the crystal are measured by using the combined technology of polarized light microscope and hot stage. On the basis of the crystal size (radius r) and growth rate (u), the birth time t of individual nucleus as a function of time can be calculated as
t = t 0 r / u
In general, drug nucleation follows a steady rate after an induction period, followed by a slower rate due to the decreased available liquid volume for nucleation.
If a drug crystal grows relatively slow, one-stage method is not suitable, and two-stage method needs to be applied for this situation. Unlike one-stage method, two-stage method is briefly summarized as a two-step process consisting of a nucleation step at a relatively low temperature and then quickly switch to an elevated temperature to allow the nuclei grow to visible dimensions under a polarized microscope. The temperature selected for crystal growth is required to ensure the rapid growth of nuclei but meanwhile prevent the formation of new nuclei.
Huang et al. compared the crystal nucleation rates of four polyalcohols exhibiting the similar kinetics of crystal growth on the T/Tg scale [21]. On the same scale of T/Tg, nucleation rates of these four polyalcohols are vastly different, indicating the fundamentally different mechanisms of nucleation [21]. In a recent study, Yao et al. compared the inhibitory effects of polymer on the crystal nucleation and growth via polarized light microscope combined with a hot stage [22]. Interestingly, the inhibitory effects of polymer on the crystal nucleation rates are similar to those on the crystal growth [22]. At a given temperature, the ratios between the rates of nucleation and growth are nearly identical, and are independent of the concentration and molecular weight of the polymer [22]. Moreover, in a very recent study, Zhang et al. found that the accelerating effects of low-Tg polymer (PEO) on crystal nucleation and growth of fluconazole are also approximately the same [23]. Based on these studies, both the crystal nucleation and growth were proposed to be molecular mobility-limited processes [22,23]. Herein, dissolved polymer in the amorphous matrix acts as a mobility modifier, imposing similar degrees of inhibitory and accelerating effects on the crystal nucleation and growth [22,23].
One important nucleation phenomenon, termed as cross-nucleation, could also be observed under a polarized light microscope, in which another polymorph nucleates on the early nucleating polymorph [33]. Compared to the early nucleating polymorph, the newly nucleated polymorph could be less or more thermodynamically stable [34]. This interesting nucleation behavior is quite different from the classical Ostwald’s law of stages, would lead to the ineffectiveness of the seeding method for obtaining the required polymorph. The newly nucleated polymorph always exhibits a faster or same crystal growth rate as the initial polymorph. If the frequency of cross-nucleation is sufficiently high, thesurface of the early nucleating polymorph will eventually be occupied by the cross-nuclei of newly nucleated polymorph.
Polarized light microscope combined with hot stage can also be used to obtain high-quality single crystals [35,36]. For instance, high-quality single crystals of the metastable form II of griseofulvin, was obtained from the melt under a polarized light microscope equipped with a hot stage [35]. Large and faceted single crystals of griseofulvin form II were observed after a rapid growth at 200 °C in the presence of 10% w/w PEO, which is reported to effectively accelerate the crystal growth [35]. Single-crystal X-ray diffraction analysis as a function of temperature revealed that griseofulvin form II exhibited an anomalously large coefficient of thermal expansion [35]. In a recent study, a creative strategy of cultivating single crystal was developed for rapidly obtaining the desired polymorph from the melt microdroplets near Tm [35]. Herein, a hot stage was used to control the temperature near Tm, at which the secondary nucleation was effectively inhibited to avoid the formation of polycrystals. Meanwhile, polarized microscope was used to monitor the growth of single crystals until a proper size was reached. In addition, polarized light microscope combined with hot stage can also be applied into the downstream processing of the preparation of amorphous pharmaceutical formulations [37].Yang et al. used this combined technique to analyze the microstructure and state of the samples at various temperature, facilitating the determination of temperature range for amorphous drug formulations during the hot melt extrusion process [37].

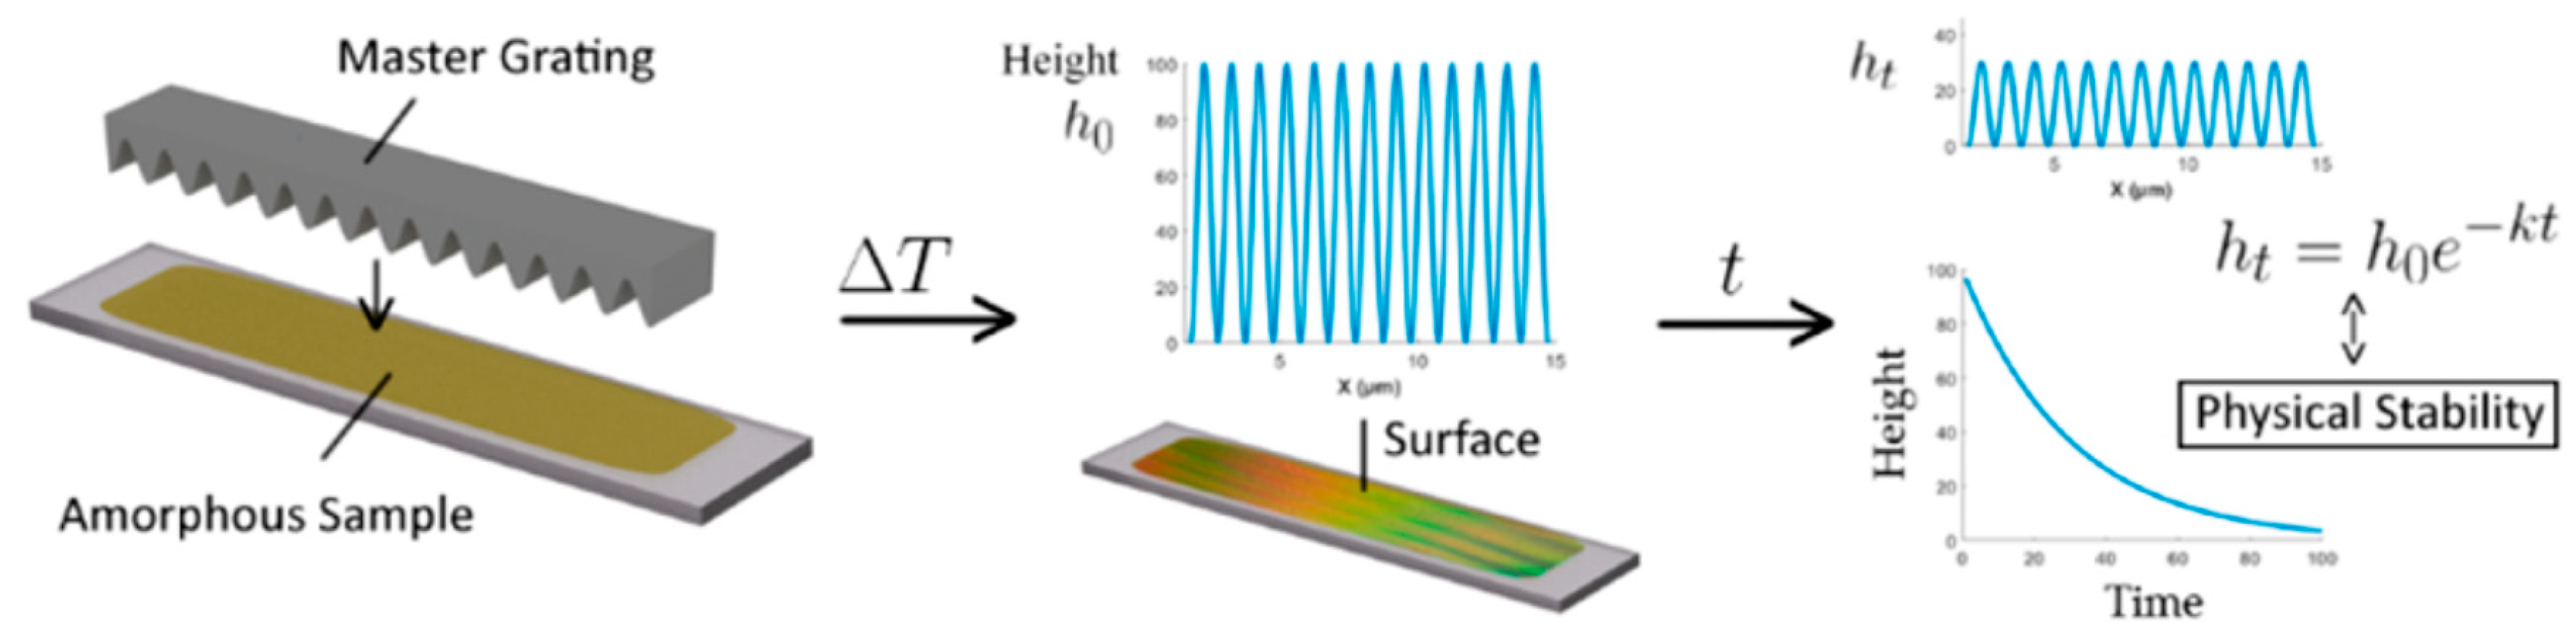
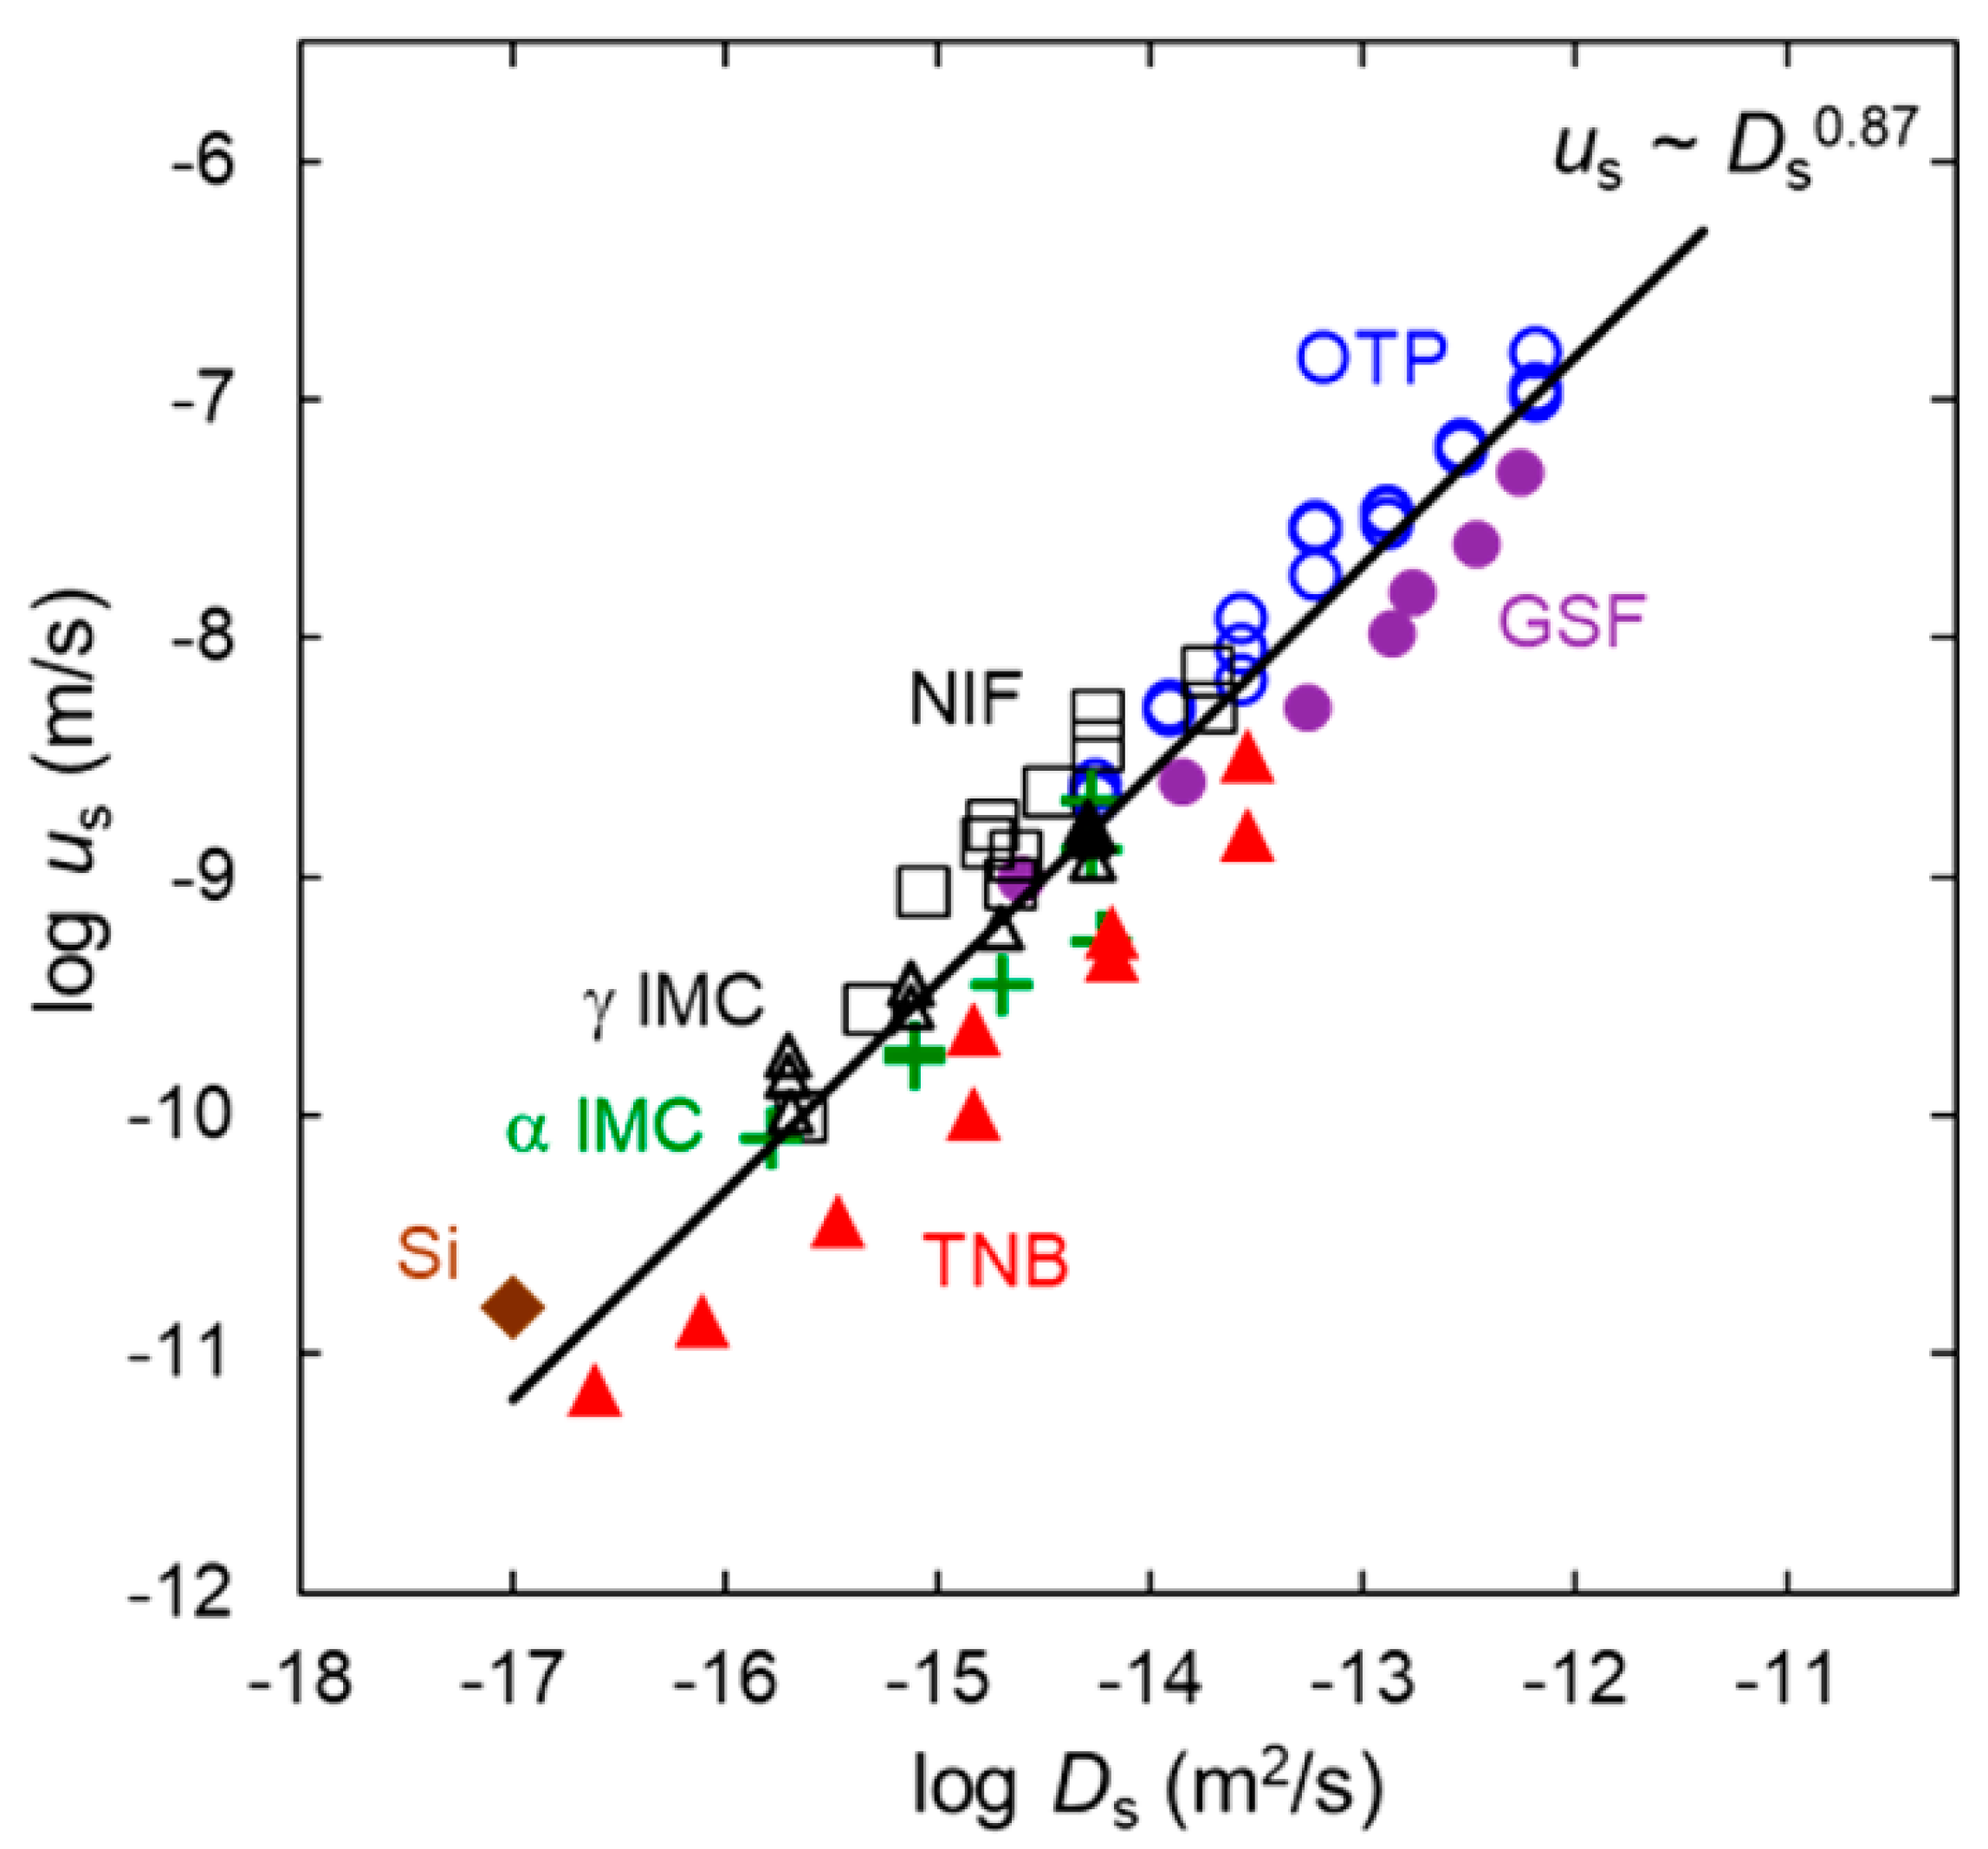
3. Surface Grating Decay and Surface Diffusion

Surface mobility can considerably affect processes including nucleation, crystal growth, catalysis, and sintering. The high mobility of surface molecules originates from the special coordination environment, where molecules have fewer neighbors and a greater degree of freedom compared to the molecules in the interior [20,38,39]. For amorphous pharmaceutical solids, a high surface mobility causes the rapid nucleation and crystal growth at the free surface or interior interface, largely determining the physical stability [20,25,27,40]. Moreover, a high surface mobility could also allow the efficient equilibrium of newly deposited molecules in vapor deposition, facilitating the formation of highly stable glass with exceptionally low energy and high density [41,42].
Surface grating decay method has been widely used to measure the surface diffusion of pure amorphous drug and polymer-doped solid dispersion in the pharmaceutical field [20,43,44,45]. Herein, surface diffusion represents the lateral movement of molecules at the free surface. As shown in Figure 2, a master grating with gold coating is placed on the surface of drug liquid below Tg to print the surface grating. The master can be detached at a lower temperature and a pharmaceutical glass with a corrugated surface is produced. The smoothing of the surface grating is followed with an atomic force microscope or optical microscope under nitrogen atmosphere. The amplitude of surface grating could be obtained by the Fourier transformation of the height profile of each scan line. In general, grating amplitude h decreases exponentially following h = h0 exp(−Kt) in the supercooled liquid state. For comparison, h decays slightly deviating from exponentially and could be described as h = h0 exp[−(Kt) β] in the glassy state, one phenomenon mainly attributed to the glass aging. Here, K represents the decay constant and β is slightly smaller than 1. According to the Mullin’s model, the decay constant K can be described as a combination of individual processes including viscous flow (F), evaporation condensation (A and A’), bulk diffusion (C), and surface diffusion (B) in the following equation.
K = F q + A q 2 + D q 3 + B q 4
q = 2 π λ           F = γ 2 η         A = p 0 γ Ω 2 ( 2 π m ) 0.5 ( k T ) 1.5
D = A + C = ρ 0 D G γ Ω 2 k T + D v γ Ω k T             B = D s γ Ω 2 v k T .
where γ represents the surface free energy, η represents the viscosity, p0 represents the equilibrium vapor pressure, Ω represents the molecular volume, m represents the molecular mass, ρ0 represents the equilibrium vapor density, DG represents the diffusion coefficient of evaporated molecules, and v represents the number of molecules per unit area of surface. Dv and Ds is the coefficient of bulk diffusion and surface diffusion, respectively.
In 2011, Zhu et al. investigated the surface diffusion of a small-molecular drug indomethacin by the method of surface grating decay for the first time [44]. Surface evolution of amorphous indomethacin is mainly controlled by the viscous flow at high temperature while the mechanism of surface evolution changes to the surface diffusion with the temperature decreasing to near and below Tg [20,43,44,45]. Compared to the bulk diffusion, surface diffusion of amorphous drugs can be orders of magnitude faster [44,45,46]. Moreover, as shown in Figure 3, surface diffusion coefficient Ds has been shown to be roughly proportional to the velocity of surface crystal growth us (us~Ds0.87), indicating the controlling role of Ds in the process of surface crystal growth [45].
Recent studies showed that surface diffusion of molecular glasses can be strongly affected by several factors, including strength of molecular interaction [47,48], molecular size [49], and the addition of polymer [43]. With the increase in the strength of molecular interaction and molecular size, surface diffusion of amorphous solids exhibits a tendency to slow down [47,48,49,50,51]. For instance, Chen et al. found that the surface diffusion of polyalcohol glasses showing extensive hydrogen bonding is much slower than that of the molecular glasses of comparable size but with no or limited hydrogen bonds [48]. They proposed that the inhibition of surface diffusion in systems containing extensive hydrogen bonding interactions is mainly attributed to the abundance of hydrogen bonds near the surface [48]. As a result, the loss of nearest neighbors could not induce a proportional decrease in the kinetic barrier of surface diffusion [48]. Surface diffusions of posaconazole and itraconazole were also investigated by surface grating decay method, and the diffusion rates of these two rod-like molecules are much lower than those of quasi-spherical molecules of similar volume, a result of the deep penetration of rod-like molecules in the bulk where molecular mobility is slow [52]. In amorphous systems without extensive hydrogen bonds, surface diffusion coefficients of molecular glasses were proposed to decrease with an increase in their penetration depth [52]. In addition, Mokshin et al. proposed that surface diffusion coefficient Ds is directly related to the kinetic coefficient (also termed as attachment coefficient) of crystallized molecular glasses [53]. In a very recent study, Bannow et al. investigated the effects of a commercial polymeric excipient Soluplus on the surface diffusion of amorphous indomethacin [43]. The addition of low-concentration Soluplus significantly slowed down the surface diffusion of indomethacin [43]. Further increase in the concentration of Soluplus would lead to turnover, where the increasing inhibitory effect of Soluplus on the surface diffusion with the Soluplus concentration increasing becomes less pronounced [43]. Moreover, the decrease in surface diffusion of amorphous indomethacin by doping low content Soluplus correlates well with the enhanced physical stability [43].

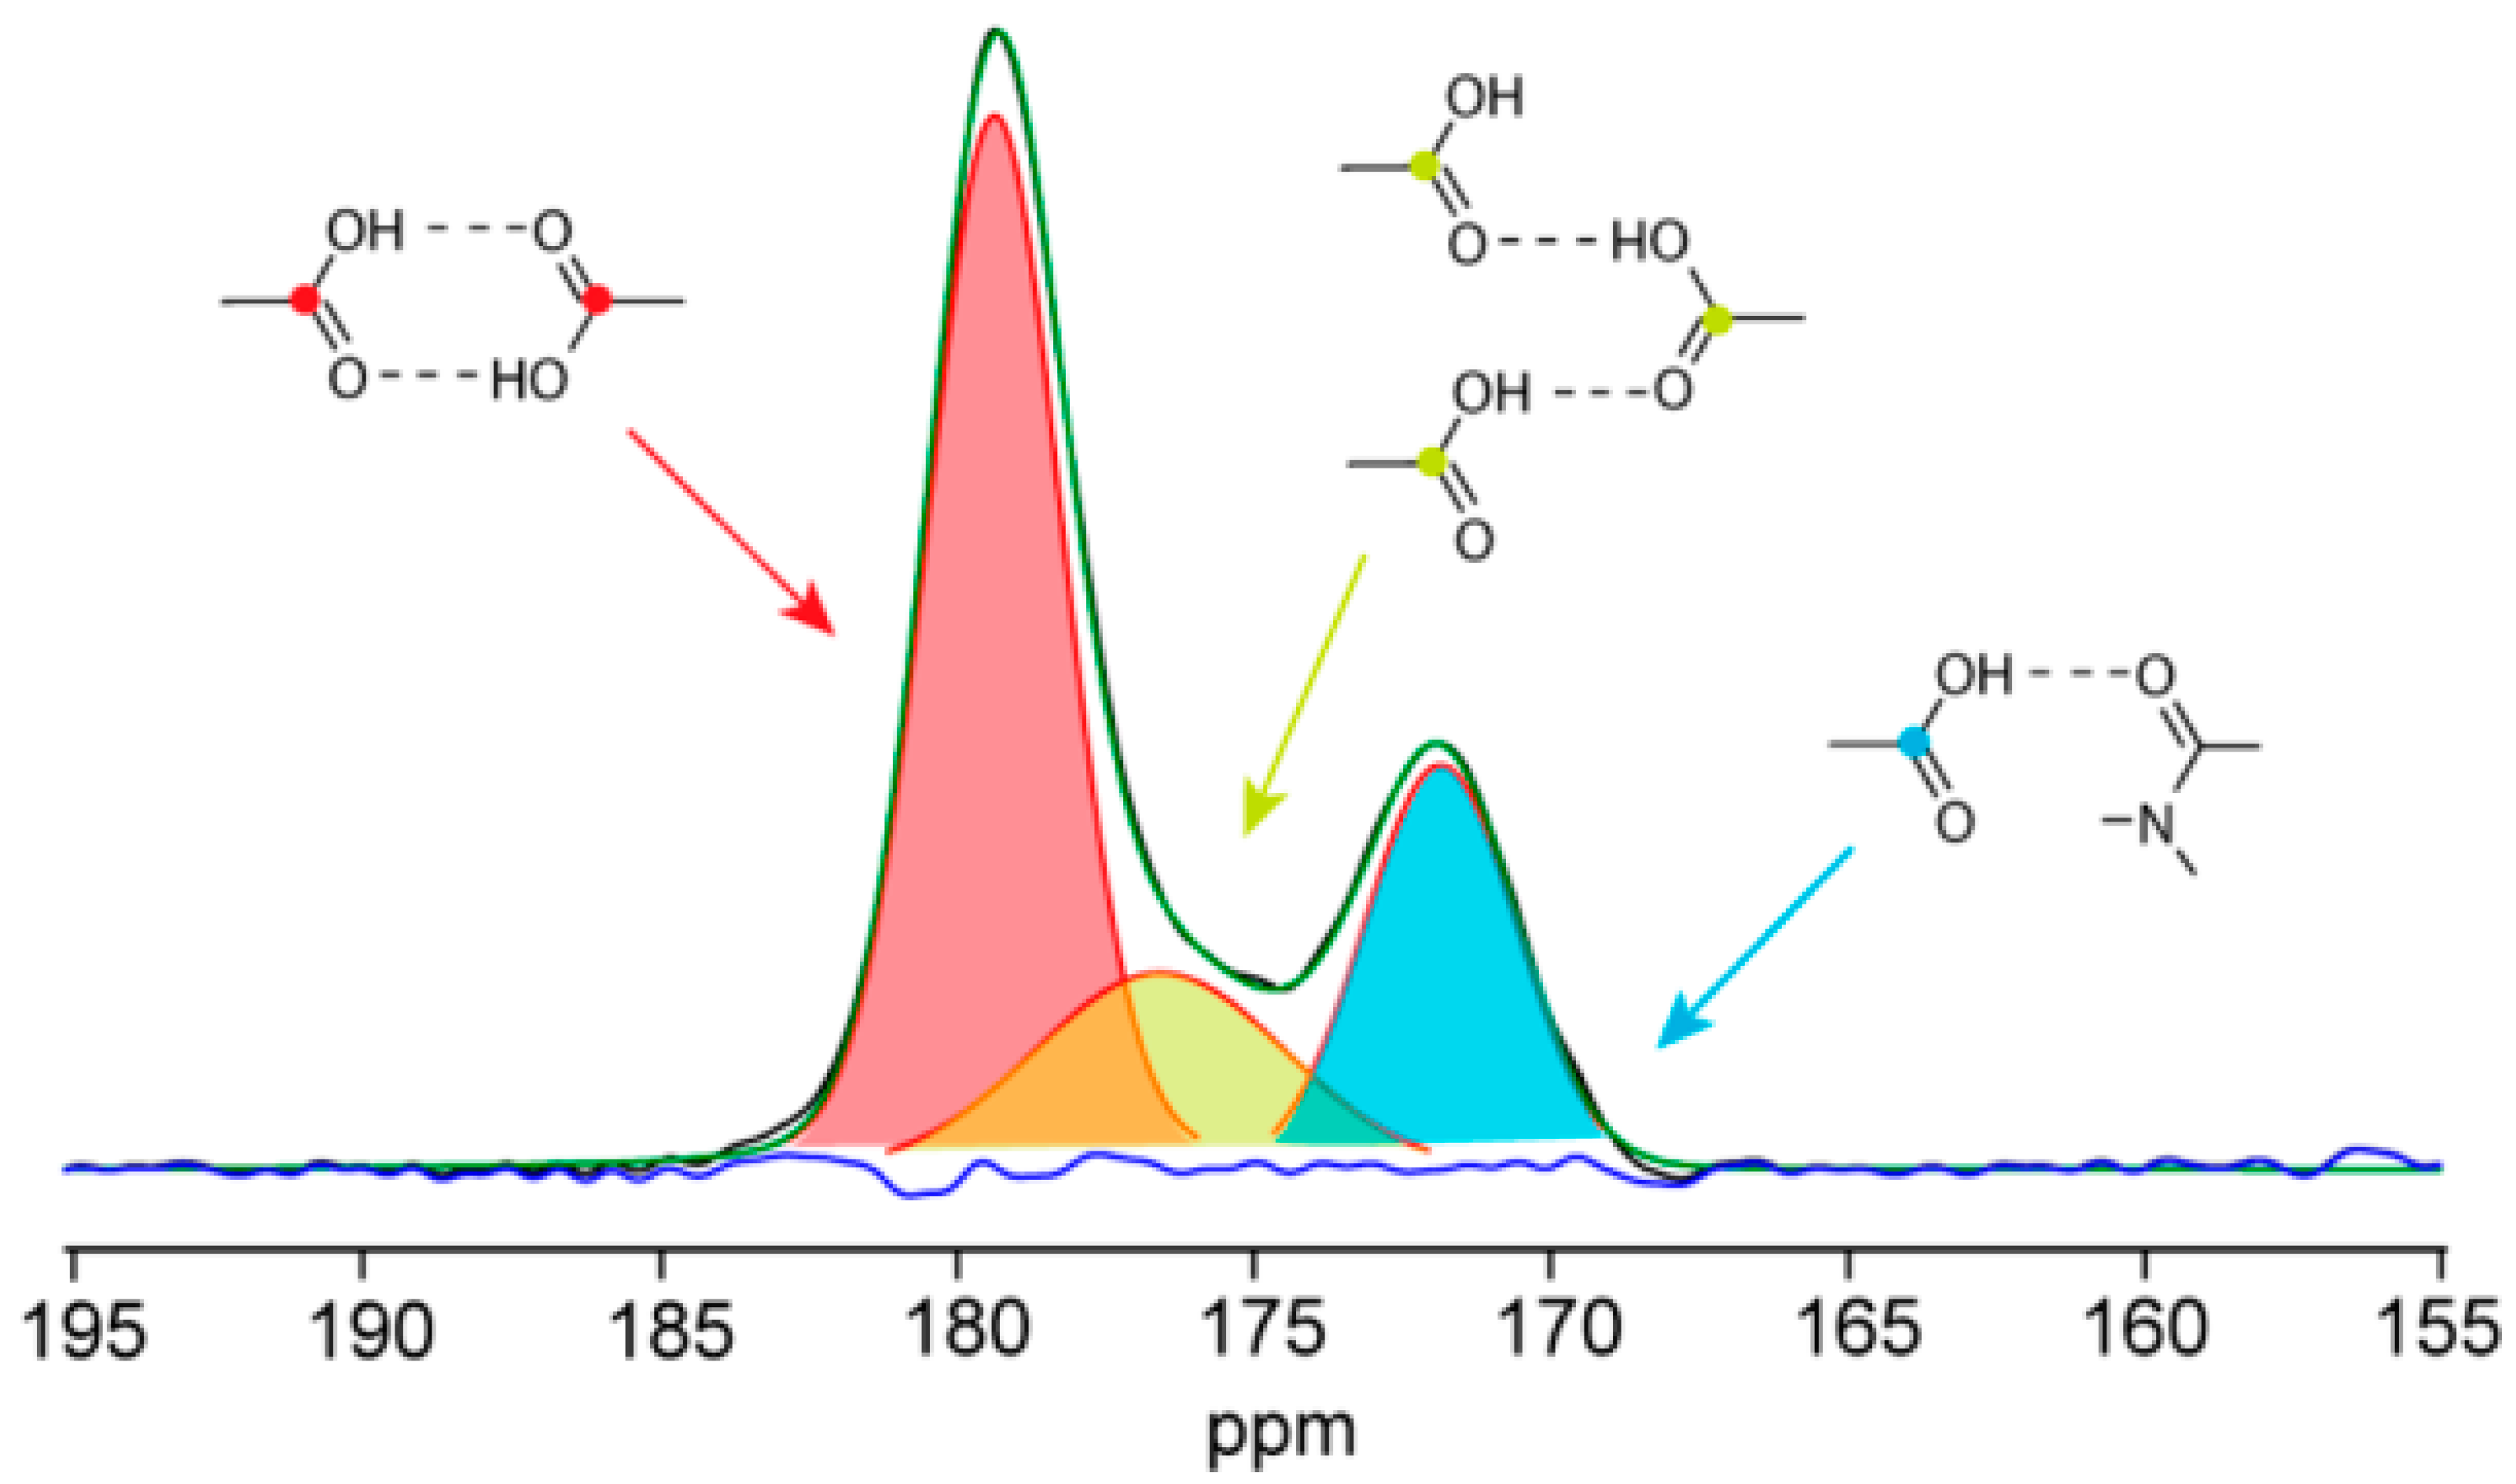
4. Solid-State Nuclear Magnetic Resonance (NMR)

Solid-state nuclear magnetic resonance (SS-NMR) has also been introduced into the pharmaceutical field for studying the dynamics and phase composition of amorphous solid dispersions [54,55]. In addition, crystalline and amorphous drug generally exhibit different spectra of SS-NMR [37,56]. Compared to the crystalline form, 13C peaks of amorphous drug are much broader, which is mainly attributed to the disordered molecular packing [56]. SS-NMR spectroscopy could provide diverse and critical information of complex amorphous dispersions from the atomic level, which is barely realized by other existing methods [54]. One main application of SS-NMR is to study the site-specific molecular mobility of amorphous solids by measuring the spin–lattice relaxation times and their spin–spin relaxation [57]. Herein, the spin–lattice relaxation times of rare nuclei consist of the static and rotating frame form (T1 and T) [57]. T1 and T relaxations (e.g., 13C) could provide pure dynamic information including the most kinds of local motions [57]. Moreover, relaxations representing the primary and secondary molecular motions can be identified from the spin–lattice relaxation in the SS-NMR [58]. Herein, T1 relaxation generally represents the secondary molecular relaxations due to its sensitivity towards the local and rapid motions [58]. T relaxation could be affected by the slower molecular motions of amorphous solid, which is associated with the primary relaxation [58]. For instance, in the case of pharmaceutical polymer methylcellulose and polyvinylpyrrolidone, T relaxation originates from the motions of polymer backbone. For comparison, T1 relaxations come from the local dynamics originated from the side chain motions.
High resolution 13C SS-NMR could be used to investigate the hydrogen bonding interactions of amorphous pharmaceutical solids [59]. With the aid of SS-NMR, Yuan et al. quantitatively studied the hydrogen bonding interactions in amorphous indomethacin with and without the presence of poly (vinylpyrrolidone) (PVP) and poly(vinylpyrrolidone-co-vinyl acetate) (PVPVA) [59]. For the pure amorphous indomethacin system, 13C SS-NMR revealed that its hydrogen bonding interaction consists of three main types including disordered carboxylic acid chains, carboxylic acid cyclic dimer, and the carboxylic acid hydrogen bonded to the amide carbonyl (Figure 4) [59]. This self-interaction of indomethacin could be disrupted once indomethacin formed a solid dispersion with the addition of polymer [59]. The extent of drug–polymer hydrogen bonding interactions increase with the increase in polymer concentration. For comparison, the carboxylic dimers between two indomethacin molecules could not be observed any more as the polymer concentration increased to 50% w/w. In a recent study, Sarpal et al. used the SS-NMR technique to compare the molecular interactions in amorphous ketoconazole (KET), KET binary dispersions, and KET ternary dispersions [60]. A detailed 13C SS-NMR deconvolution study showed that binary KET and poly (acrylic acid) (PAA) system exhibits higher prevalence of ionic and hydrogen bonds in comparison with its ternary system containing hydroxypropyl methyl cellulose (HPMC) [60].
In recent studies, two-dimensional (2D) ss-NMR was also developed to identify the type and strength of various drug–polymer interactions in ASDs with enhanced sensitivity and resolution [61,62]. Lu et al. used 2D 1H-19F ss-NMR to investigate the molecular interaction between the difluorophenyl group of posaconazole and the hydroxyl group of hydroxypropyl methylcellulose acetate succinate (HPMCAS) in the ASD. For hydrogen bond patterns, they proposed that the hydroxyl groups of HPMCAS act as acceptors while the fluorine or difluorophenyl rings of posaconazole act as donors [62]. Moreover, a 19F-13C rotational echo and double resonance technique was used to measure the atomic distance, and it revealed the close proximity between 13C of the hydroxyl group and 19F of posaconazole at 4.3 Å [62].
Moreover, the miscibility between drug and polymer can also be investigated using the T1 and T relaxation times obtained from 1H SS-NMR [59,63,64,65,66,67]. At present, measuring the Tg using differential scanning calorimetry (DSC) is the most widely used approach for determining the miscibility of amorphous solids. Generally, a single Tg between those of drug and polymer indicates a miscible system, while two separated Tgs suggest a phase-separated system. However, Tg is sometimes not a reliable indicator of system miscibility, as some studies reported that phase-separated system could exhibit a single Tg and vice versa [63]. Moreover, the miscibility assessed by Tg generally has a detection limit of 20–30 nm, meaning that a two-phase system with smaller domain size would be indistinguishable by DSC. For comparison, SS-NMR is suggested to be a more accurate technique, which could measure the drug–polymer miscibility for small domain sizes.
For the miscibility measurement using SS-NMR, length scale of 1H spin diffusion is important and could be calculated by
L = 6 D t
Herein, t represents the relaxation time, D represents the spin diffusion coefficient and is typically assumed as 10−12 cm2/s for the organic solids. The length scale of spin diffusion is ca. 20–50 nm for a typical T1 value as 1–5 s. For a typical T as 5–50 ms, the length scale is ca. 2–5 nm. It is expected that three scenarios might occur depending on the domain size. A common T1 and T values could be obtained for drug and polymer for the domain size smaller than 2–5 nm. If the domain size is 5–20 nm, T1 values of drug and polymer are the same while T values are different. If both the T1 and T values of drug and polymer are different, the domain size is larger than 20–50 nm. Pham et al. used the SS-NMR cross-polarization hetero-nuclear correlation technique to investigate the spin diffusion effects of the amorphous pharmaceutical solids, facilitating the detection of the drug–polymer molecular interaction and phase separation [64]. Litvinov et al. investigated the phase behavior of miconazole-poly(ethylene glycol)-g-vinyl alcohol (PEG-g-PVA) solid dispersions by a combination of modulated DSC, XRPD, and SS-NMR [63]. In their work, miconazole (10% w/w) was identified to form the amorphous nanocluster with ~1.6 nm average cluster size in the amorphous matrix of PEG-g-PVA, indicating the miscibility at the molecular level [65].
Sarpal et al. compared the phase homogeneity of felodipine ASDs doped with PVP, PVPVA, and poly(vinylacetate) (PVAc) by measuring the 1H T1 and T1ρ of drug and polymer [66]. Better compositional homogeneity was observed in felodipine-PVP and felodipine-PVPVA ASDs compared to felodipine-PVAc ASD. 13C ss-NMR was also used to investigate the strength and extent of drug–polymer hydrogen bonding interactions, and it revealed a ranking of PVP > PVPVA > PVAc [66]. The results also suggested that hydrogen bonding interaction in ASDs could impact system phase homogeneity [66]. Recently, an 1H double-filtering SS-NMR technique with 1H spin diffusion and 13C detection was developed to provide the highest-resolution quantification of molecular miscibility and homogeneity of amorphous solid dispersions [68]. However, spectrum acquisition typically requires one week for obtaining sufficient signal-to-noise ratio, therefore, low-field and benchtop NMR techniques are to be developed to shorten the acquisition times, which would make SS-NMR a useful technique for capturing structural evolution that occurs within a short time period [69].

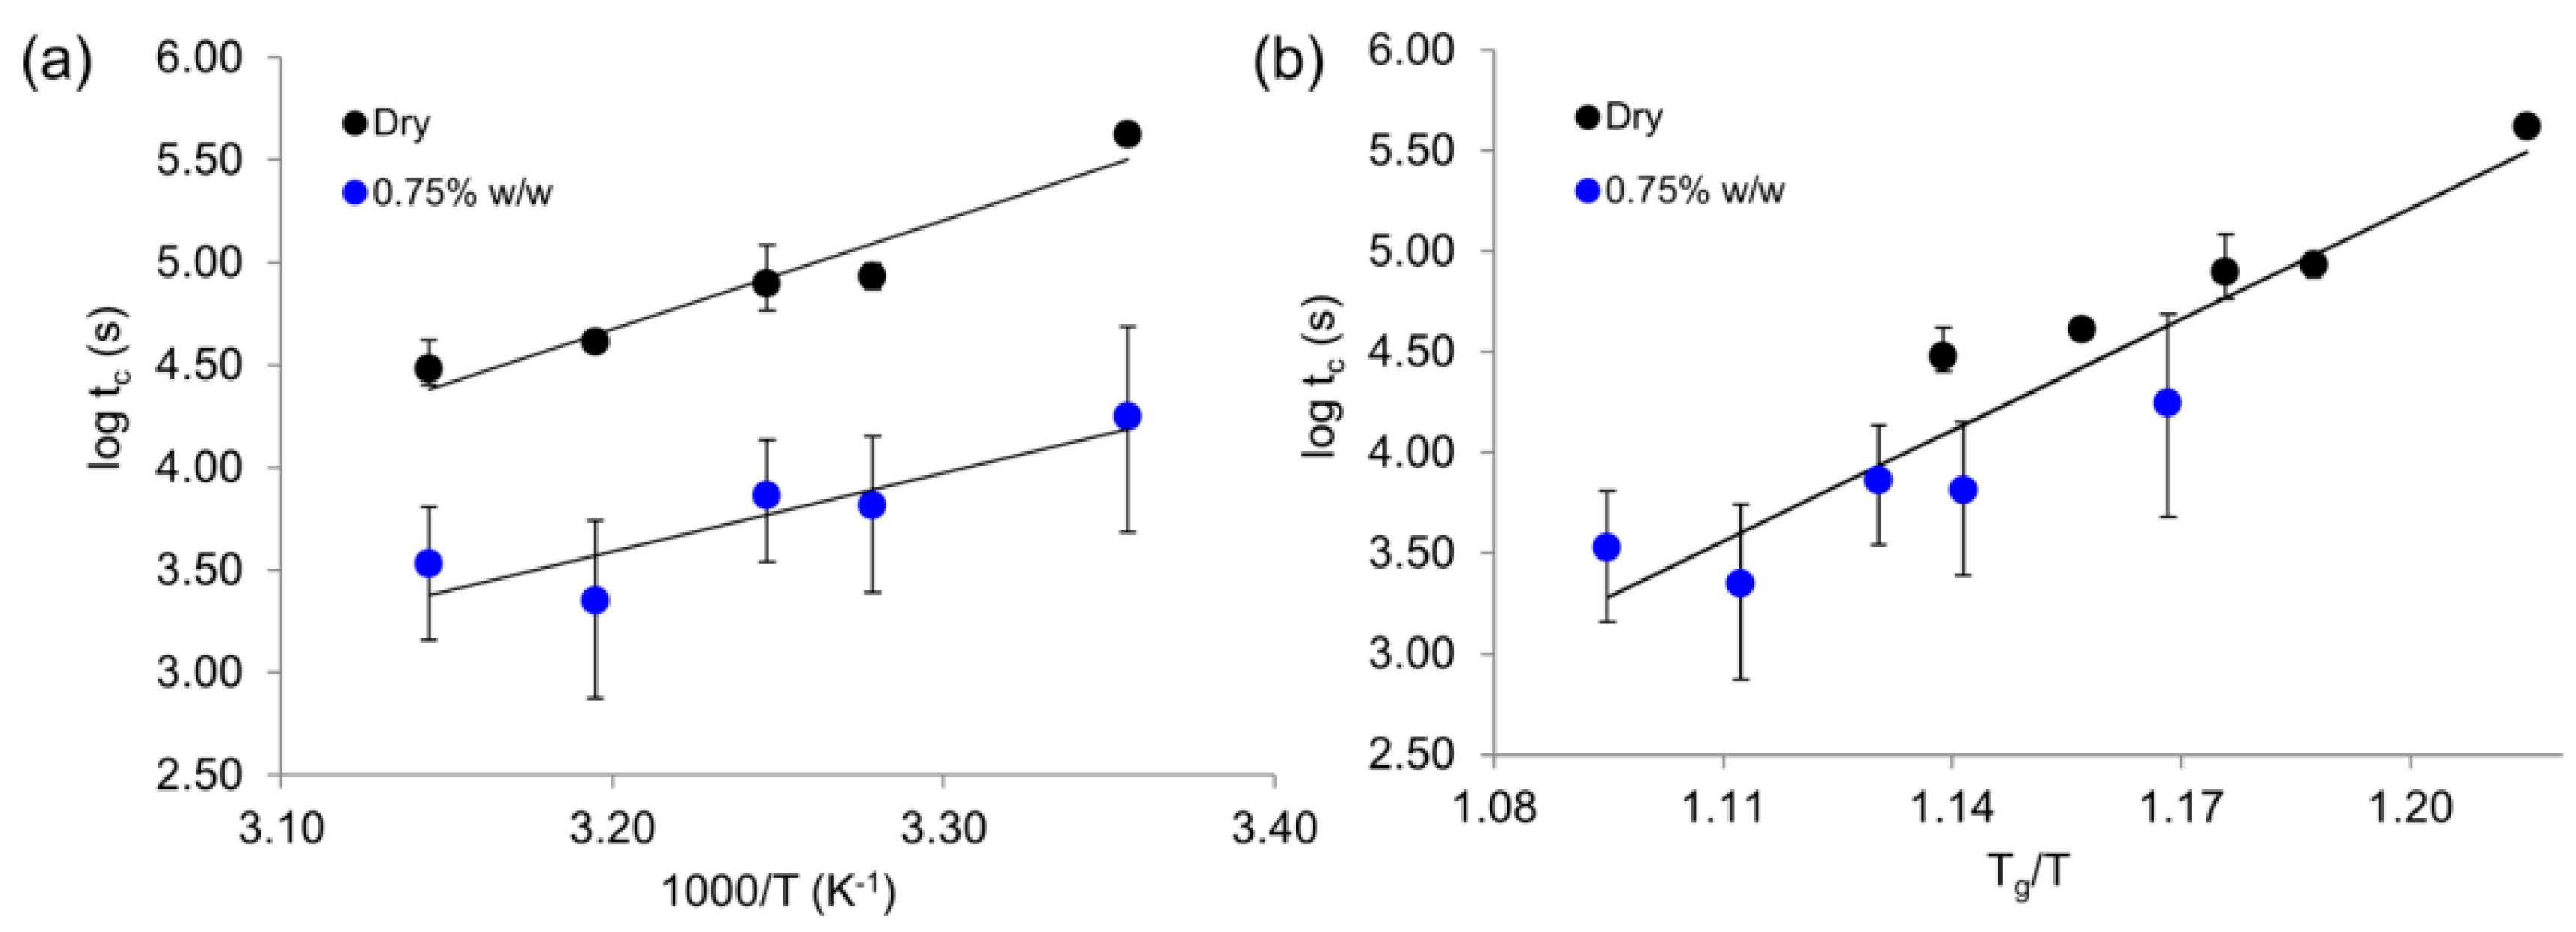
5. Broadband Dielectric Spectroscopy

Recent studies showed that molecular mobility is probably the most relevant factor for reliably predicting the crystallization behavior of amorphous pharmaceutical solids [19,70]. However, it should be noted that amorphous pharmaceutical solids exhibit complex molecular structures accompanied with various configurational topologies and a variety of molecular interactions. Consequently, molecular mobility of amorphous pharmaceutical solids is rather complex in general, and it could be reflected in various relaxation processes originated from different natures. As a result, establishing proper correlations between molecular mobility and physical stability of amorphous pharmaceutical solids is quite challenging.
In recent studies, a variety of strategies have been exploited to investigate the molecular mobility in glassy and supercooled liquid state—including light scattering, mechanical spectroscopy, temperature modulated differential scanning calorimetry (TMDSC), and nuclear magnetic resonance (NMR). Among these approaches, broadband dielectric spectroscopy is able to explore different relaxation processes and has been demonstrated to distinguish the global and local molecular motions. The measurement of broadband dielectric spectroscopy could be performed over an extremely wide frequency range from mHZ to THz, and concurrently in wide temperature and pressure ranges.
In an excellent review, Paluch and coworkers give a detailed introduction for the equipment principle and basic parameters of broadband dielectric spectroscopy [19]. In brief, dielectric measurement is based on the interactions between the electric dipole moment and the charges of the sample when an external electric field is applied. The investigated pharmaceutical material is firstly placed in a sample capacitor. Herein, a generator (e.g., sine wave generator) could apply an alternating voltage U*(ω) to the capacitor. Consequently, the external alternating electric field E (ω) is generated on the sample capacitor. The complex impedance Z*(ω) of the samples is determined by the impedance analyzer through measuring the sample capacitor complex voltage and the current. From the basic quantity of complex electrical impedance Z*(ω) measured by BDS, other complex quantities such as complex dielectric permittivity ε*(ω) could be derived.
In the field of pharmaceuticals, the Havriliak–Negami (HN) functions plus dc-conductivity term are usually used for the analysis of measured isothermal dielectric spectrum.
ε * ( ω ) = ε ( ω ) i ε ( ω ) = ε + ε s ε ( 1 + ( i ω τ H N ) α ) β + σ Ü i ω ε 0
Here, ε’ and ε” respectively represent the real and imaginary parts of the complex dielectric permittivity. ε represents the high-frequency limit permittivity and εs represents the static dielectric constant. α, β are shape parameters of the dielectric peaks and they respectively represent the asymmetry and width. σdc/iε0ω represents the conductivity component, where σdc represents the level of dc-conductivity and ε0 represents the vacuum permittivity.
α-relaxation reflects the reorientations of entire molecules for the low-molecular weight materials. In the case of polymer, α-relaxation, also termed as segmental relaxation, is related to some segmental motions for the polymer chain, which would lead the conformational change. α-relaxation time (τα), representing the relaxation time at a maximum loss (τmax). The value of τα was calculated by the following equation on the basis of the parameters obtained by the HN function.
τ α = τ max = τ HN [ sin ( π α 2 + 2 β ) ] 1 / α [ sin ( π α β 2 + 2 β ) ] 1 / α
Empirical Vogel–Fulcher–Tamman (VFT) equation is most widely used for describing the temperature dependence of τα in the supercooled liquid state.
τ α = τ 0 exp ( D T 0 ( T T 0 ) )
In this equation, τα represents the α-relaxation time and τ0 is the relaxation time of the unrestricted material. D represents the strength parameter for a measure of fragility and T0 represents the zero mobility temperature. Moreover, the dependence of τα in the glassy state could be also predicted by the extended VFT equation.
Local motions have either intra- or intermolecular origins, could be reflected in different secondary relaxations. For the secondary relaxation times, their temperature dependence in the glassy state can be commonly fitted to the Arrhenius equations
τ = τ 0 exp ( E R T )
Herein, ΔE represents the activation energy and R represents the universal gas constant.
One important goal is to reveal the dominant type of molecular mobility responsible for physical stability, which has been fervently debated for the past decades. Some argue that global relaxation is responsible for the physical stability while other propose that secondary relaxation is the key controlling factor of physical stability. Kothari et al. investigated the molecular mobility and crystallization kinetics of amorphous drug griseofulvin and nifedipine [71]. In their work, the crystallization kinetics of these amorphous drugs is monitored by powder X-ray diffraction technique (PXRD) above Tg while by PXRD technique equipped with synchrotron X-ray source below Tg [71]. They found that physical stability both in the glassy state and supercooled liquid is strongly related to the α-relaxation rather than the secondary relaxations [71]. Similar strong correlations between α-relaxation and physical stability could also been observed in several other pharmaceuticals including itraconazole [72], trehalose [73], celecoxib [74].
In addition to the pure drug system, α-relaxation has also been reported to play the controlling role for the physical stability in the polymer-based amorphous solid dispersions (ASD) [75,76,77]. Suryanarayanan and co-workers proposed that the formation of nifedipine-polymer hydrogen bonding interactions could translate to a high resistance to the crystallization by reducing the global mobility, as evidenced by longer system α-relaxation time [76]. Further study revealed that α-relaxation times of nifedipine ASD increase linearly with the polymer concentration increasing [75]. In addition, the established relationship between α-relaxation time and crystallization kinetics of nifedipine ASD doped with a low content of polymer could be used as a reliable predictor for the crystallization of nifedipine ASD containing a higher content of polymer [75]. The usefulness of this predictive model is well confirmed as the matching of the predictive and experimental results of physical stability [75]. Moreover, Mistry et al. reported that the stronger drug–polymer interactions could lead to a longer delay before the onset of crystallization, indicating the enhanced physical stability [78]. Interestingly, the correlation between α-relaxation and crystallization times is almost unaffected by the formation and strength of drug–polymer molecular interactions [78]. Mohapatra et al. investigated the effects of molecular weight of PVP on the molecular mobility and crystallization of PVP-indomethacin ASDs [77]. SS-NMR revealed that drug–polymer hydrogen bonding interaction is independent of the molecular weight of PVP [77]. For comparison, the dependences of viscosity and molecular mobility on temperature are reasonably similar for indomethacin ASDs containing PVP with various molecular weight [77]. It is concluded that increased viscosity would also translate to reduced global molecular mobility (e.g., α-relaxation times), and thus effectively inhibit the crystallization of ASDs [77].
Recent studies revealed that molecular mobility of amorphous drug and ASD could be enhanced by the addition of water [79,80], glycerol [81], and low-Tg polymer, e.g., poly(ethylene oxide) [31,32]. Mehta et al. proposed that the increased molecular mobility of amorphous system by the sorbed water is attributed to the plasticization effect [79]. This view is strongly supported by the fact that relaxation times of systems containing different water content overlapped on a temperature scaling of Tg/T [79]. Moreover, as shown in Figure 5, a single linear relationship could be observed for the temperature dependence of crystallization tc in both dry and water-sorbed griseofulvin systems [79]. Herein, tc represents the time taken for 0.5% of griseofulvin to crystallize. These results indicate that plasticization effect is also the underlying mechanism for the physical stability of amorphous solids [79]. Given that the coupling extent between α-relaxation and crystallization times of ASD remain the same in the presence of low content of water, a predictive model was built by using the sorbed water for studying the crystallization of some slow crystallizing systems [80]. Similarly, Fung et al. demonstrated that glycerol could also act as a plasticizer, which facilitates the development of an accelerated physical stability testing model of ASDs [81]. The success of this predictive model is mainly attributed to the idea that glycerol could effectively accelerate the crystallization without affecting the mobility–crystallization coupling [81].
However, some studies found that change in the global molecular mobility characterized by BDS might not be sufficient for explaining the accelerating or inhibitory effects in the crystallization of amorphous drugs [31,32,82]. For instance, PEO plasticizes amorphous drug systems and increases their global mobility from the liquid dynamic perspective, which is evidenced by the overlapping of α-relaxation time at the scale of Tg/T [31,32]. However, from the perspective of crystallization kinetics, the accelerating growth rates of griseofulvin crystals cannot be simply explained by the increased molecular mobility, as evidenced by the fact that growth rates of pure griseofulvin could not overlap with that of griseofulvin containing low content PEO at the scale of Tg/T [31,32]. Moreover, the increase in global mobility (i.e., the decrease in α-relaxation time) also has difficulty in explaining the selective accelerating effects of PEO on the crystallization of different polymorphs of a drug [32]. In addition, the coupling between crystallization kinetics and α-relaxation times could also be affected by the addition of some excipients, indicating that factors other than global mobility for governing the physical stability [82]. In addition, an increasing number of studies proposed that local mobility rather than global mobility could be the major factor for influencing the physical stability in the glassy state [83,84]. For instance, in the case of glassy celecoxib and indomethacin, strong correlations could be observed between the physical instability and Johari–Goldstein (β) relaxation time rather than the α-relaxation time [84]. This intermolecular secondary β-relaxation is proposed to be a precursor of the global molecular mobility, which indicates that these small-angle reorientations would lead the cooperative α-relaxation process.
Analogous to the polymer-based ASDs, BDS has also been performed to study the molecular dynamics in coamorphous formulations [85,86,87,88,89]. Knapik et al. investigated the molecular mobility of ezetimib-indapamide coamorphous systems and its correlations with physical stability [85]. With the increase of indapamid content, physical stability of this binary coamorphous system was progressively enhanced, as evidenced by the longer α-relaxation time and smaller fragility [85]. In addition, Tgs of ezetimib-indapamid coamorphous systems rose with the increasing content of indapamid in accordance with the prediction by Gordon-Taylor equations [85]. They proposed that antiplasticizing effect exerted by indapamid is the main mechanism for improving system physical stability [85]. Fung et al. explored the effects of organic acid for stabilizing amorphous ketoconazole, a weakly basic active pharmaceutical ingredient (API) [88]. With an increase in the strength of drug–acid molecular interactions, molecular mobility of these coamorphous systems decreases, as evidenced by the longer α-relaxation time [88]. However, in the case of ketoconazole–tartaric acid and ketoconazole–citric acid, the decreased global molecular mobility was not sufficient to explain the enhanced physical stability [88]. They proposed that structural factors would also enhance the physical stabilization of these drug–acid coamorphous systems [88]. Unlike oxalic and succinic acids, each critic acid molecule has three carboxylic acid groups, which are more beneficial to the formation of drug–acid hydrogen bonding interaction [88]. The hydroxyl group in tartaric and citric acid would also act as the donors of hydrogen bonds and further facilitate the formation of stronger drug–acid hydrogen bonding interactions [88].
BDS can also be applied for studying the molecular mobility of amorphous drug under the nanoconfinement effects [90,91]. Knapik et al. investigated the effects of nanoconfinement on the molecular mobility and crystallization of amorphous drug ezetimibe [90]. Amorphous ezetimib would still exhibit the tendency to crystallize in the pores of Aeroperl 300 (~30 nm pore size), while no crystallization occurs once the drug was incorporated in the pores of Neusilin US2 (<5 nm pore size) [90]. As shown in Figure 6, compared to the ezetimib-Aeroperl 300 system, α-relaxation time of ezetimib increases once incorporated into the pores of Neusilin US2 [90]. Moreover, BDS experiments also revealed the distinguishable phases of the loaded ezetimib in these two commercially used porous materials [90]. One is associated with the molecules at the pore surface–liquid interface while the other one is connected to the molecules in the inner of pores [90]. Herein, the dramatic stabilization of amorphous ezetimib in the pores of Neusilin US2 could be attributed to an interplay of three factors [90]. One factor is the decreased global molecular mobility of amorphous ezetimib under the nanoconfinement [90]. The other two factors are mainly attributed to immobilization effects of the pore wall and the smaller pore size in comparison to the critical nucleation size of amorphous ezetimib, respectively [90]. In a recent study, Zhang et al. explored the molecular mobility of amorphous drug griseofulvin and indomethacin in anodic aluminum oxide (AAO) templates as a function of pore size [91]. A typical two-layer model was also observed in the indomethacin/AAO system, as evidenced by two separated Tgs and interfacial polarization relaxation in BDS experiments [91]. For the core–shell two-layer model, shell molecules interacting with the walls of nanopores show the higher Tg, while the core molecules exhibit the fast dynamics with the lower Tg. In the case of griseofulvin/AAO system, fast cooling would lead to a metastable three-layer model, featuring the existence of thermodynamic nonequilibrium interlayer in addition to the core and interfacial layer [91]. For comparison, stable core–shell two-layer model instead of unstable three-layer model was observed for griseofulvin in AAO templates using the slow cooling process (0.5 °C/min) [91].

6. Other Characterization Techniques

In addition to the above-mentioned techniques, several classical characterization techniques have also been widely used in the field of pharmaceuticals for several decades such as FT-IR, Raman spectroscopy, powder X-ray diffraction (PXRD), differential scanning calorimeter (DSC), etc. [92,93,94,95]. These classical characterization techniques have found new applications and they are integrated with other techniques [96,97]. For instance, Purohit et al. investigated the miscibility of itraconazole ASDs by the atomic force microscopy technique coupled with nanoscale IR spectroscopy and nanothermal analysis [97]. These combined analytical techniques are proposed to be promising for investigating the phase behaviors of ASDs with high resolution [97]. In the case of PXRD technique, recent studies revealed that it could monitor the extremely low levels of crystallization with enhanced sensitivity by using the synchrotron X-ray source [71].
Moreover, several emerging approaches are also developed for characterizing amorphous pharmaceutical solids including terahertz spectroscopy, X-ray photoelectron spectroscopy, fluorescence lifetime imaging microscopy, etc. [98,99,100]. Chen et al. systemically investigated the surface enrichment or depletion of components in ASDs by XPS technique [100]. For these spray dried ADSs, surface composition is quite different from those in the bulk [100]. In addition, enrichment or depletion of the drug on the surface of ASDs was found to be strongly dependent on the drug–polymer combination as well as the molecular weight of polymer [100]. In a recent study, an advanced surface characterization platform was developed by combining XPS and time-of-flight secondary ion mass spectrometry [101]. This platform could provide the quantitative measurement of surface composition with high sensitivity and spatial resolution [101].

7. Concluding Remarks

Amorphization of drugs has great value in research and application due to the benefits of improving the solubility, dissolution, and bioavailability of poorly water-soluble drugs. It is of importance to develop characterization methods for studying the physicochemical properties of ASDs, especially for maintaining their physical stability. With a better understanding on the recent development of the characterization methods, it is expected that the commercialization of ASDs with desired pharmaceutical properties would be greatly accelerated.

Author Contributions

Conceptualization, Q.S., C.Z. and Y.W. (Yanan Wang); Writing—original draft preparation, Y.W. (Yanan Wang) and Y.W. (Yong Wang); Writing—review and editing, Q.S., J.C., H.C., J.X. and Z.L.; Funding acquisition, Q.S. and C.Z. All authors have read and agreed to the published version of the manuscript.

Funding

The authors are grateful for financial support of this work by the National Natural Science Foundation of China (nos. 81803452, 21803004), the Natural Science Foundation of Jiangsu Province (no. BK20211114), Shenzhen Science and Technology Innovation Committee (no. JCYJ20200109141808025) and the National Subject Cultivation Project of Jiangsu Vocational College of Medicine (no. 20204304).

Conflicts of Interest

The authors declare no conflict of interest.

References

  1. Di, L.; Fish, P.V.; Mano, T. Bridging solubility between drug discovery and development. Drug Discov. Today 2012, 17, 486–495. [Google Scholar] [CrossRef] [PubMed]
  2. Murdande, S.B.; Pikal, M.J.; Shanker, R.M.; Bogner, R.H. Solubility advantage of amorphous pharmaceuticals: I. A thermodynamic analysis. J. Pharm. Sci. 2010, 99, 1254–1264. [Google Scholar] [CrossRef] [PubMed]
  3. Yu, L. Amorphous pharmaceutical solids: Preparation, characterization and stabilization. Adv. Drug Deliver. Rev. 2001, 48, 27–42. [Google Scholar] [CrossRef]
  4. Brough, C.; Williams, R.O. Amorphous solid dispersions and nano-crystal technologies for poorly water-soluble drug delivery. Int. J. Pharm. 2013, 453, 157–166. [Google Scholar] [CrossRef] [PubMed]
  5. Babu, N.J.; Nangia, A. Solubility advantage of amorphous drugs and pharmaceutical cocrystals. Cryst. Growth Des. 2011, 11, 2662–2679. [Google Scholar] [CrossRef]
  6. Mooter, G.V.D. The use of amorphous solid dispersions: A formulation strategy to overcome poor solubility and dissolution rate. Drug Discov. Today Tech. 2012, 9, 79–85. [Google Scholar] [CrossRef]
  7. Yan, H.; Chris, H. Amorphous solid dispersions: Utilization and challenges in drug discovery and development. J. Pharm. Sci. 2015, 104, 3237–3258. [Google Scholar]
  8. Powell, C.T.; Cai, T.; Hasebe, M.; Gunn, E.M.; Gao, P.; Zhang, G.; Gong, Y.; Yu, L. Low-concentration polymers inhibit and accelerate crystal growth in organic glasses in correlation with segmental mobility. J. Phys. Chem. B 2013, 117, 10334–10341. [Google Scholar] [CrossRef]
  9. Kestur, U.S.; Taylor, L.S. Role of polymer chemistry in influencing crystal growth rates from amorphous felodipine. CrystEngComm 2010, 12, 2390–2397. [Google Scholar] [CrossRef]
  10. Cai, T.; Zhu, L.; Yu, L. Crystallization of organic glasses: Effects of polymer additives on bulk and surface crystal growth in amorphous nifedipine. Pharm. Res. 2011, 28, 2458–2466. [Google Scholar] [CrossRef]
  11. Huang, C.; Powell, C.T.; Sun, Y.; Cai, T.; Yu, L. Effect of low-concentration polymers on crystal growth in molecular glasses: A controlling role for polymer segmental mobility relative to host dynamics. J. Phys. Chem. B 2017, 121, 1963–1971. [Google Scholar] [CrossRef]
  12. Ilevbare, G.A.; Liu, H.; Edgar, K.J.; Taylor, L.S. Inhibition of solution crystal growth of ritonavir by cellulose polymers—Factors influencing polymer effectiveness. CrystEngComm 2012, 14, 6503–6514. [Google Scholar] [CrossRef]
  13. Ilevbare, G.A.; Liu, H.; Edgar, K.J.; Taylor, L.S. Maintaining supersaturation in aqueous drug solutions: Impact of different polymers on induction times. Cryst. Growth Des. 2013, 13, 740–751. [Google Scholar] [CrossRef]
  14. Schram, C.J.; Beaudoin, S.P.; Taylor, L.S. Polymer inhibition of crystal growth by surface poisoning. Cryst. Growth Des. 2016, 16, 2094–2103. [Google Scholar] [CrossRef]
  15. Li, N.; Taylor, L.S. Tailoring supersaturation from amorphous solid dispersions. J. Control Release 2018, 279, 114–125. [Google Scholar] [CrossRef]
  16. Taylor, L.S.; Zhang, G.G. Physical chemistry of supersaturated solutions and implications for oral absorption. Adv. Drug Deliv. Rev. 2016, 101, 122–142. [Google Scholar] [CrossRef]
  17. Zhou, D.; Grant, D.J.; Zhang, G.G.; Law, D.; Schmitt, E.A. A calorimetric investigation of thermodynamic and molecular mobility contributions to the physical stability of two pharmaceutical glasses. J. Pharm. Sci. 2010, 96, 71–83. [Google Scholar] [CrossRef]
  18. Laitinen, R.; Lobmann, K.; Strachan, C.J.; Grohganz, H.; Rades, T. Emerging trends in the stabilization of amorphous drugs. Int. J. Pharm. 2013, 453, 65–79. [Google Scholar] [CrossRef]
  19. Grzybowska, K.; Capaccioli, S.; Paluch, M. Recent developments in the experimental investigations of relaxations in pharmaceuticals by dielectric techniques at ambient and elevated pressure. Adv. Drug Deliv. Rev. 2016, 100, 158–182. [Google Scholar] [CrossRef]
  20. Yu, L. Surface mobility of molecular glasses and its importance in physical stability. Adv. Drug Deliv. Rev. 2016, 100, 3–9. [Google Scholar] [CrossRef] [Green Version]
  21. Huang, C.; Chen, Z.; Gui, Y.; Shi, C.; Zhang, G.G.; Yu, L. Crystal nucleation rates in glass-forming molecular liquids: D-sorbitol, D-arabitol, D-xylitol, and glycerol. J. Chem. Phys. 2018, 149, 054503. [Google Scholar] [CrossRef]
  22. Yao, X.; Huang, C.; Benson, E.G.; Shi, C.; Zhang, G.G.; Yu, L. Effect of polymers on crystallization in glass-forming molecular liquids: Equal suppression of nucleation and growth and master curve for prediction. Cryst. Growth Des. 2019, 20, 237–244. [Google Scholar] [CrossRef]
  23. Zhang, J.; Liu, Z.; Wu, H.; Cai, T. Effect of polymeric excipients on nucleation and crystal growth kinetics of amorphous fluconazole. Biomater. Sci 2021, 9, 4308–4316. [Google Scholar] [CrossRef]
  24. Shi, Q.; Cai, T. Fast crystal growth of amorphous griseofulvin: Relations between bulk and surface growth modes. Cryst. Growth Des. 2016, 16, 3279–3286. [Google Scholar] [CrossRef]
  25. Shi, Q.; Tao, J.; Zhang, J.; Su, Y.; Cai, T. Crack- and bubble-induced fast crystal growth of amorphous griseofulvin. Cryst. Growth Des. 2020, 20, 24–28. [Google Scholar] [CrossRef]
  26. Srirambhatla, V.K.; Guo, R.; Dawson, D.M.; Price, S.L.; Florence, A.J. Reversible, two-step single-crystal to single-crystal phase transitions between desloratadine forms I., II, and III. Cryst. Growth Des. 2020, 20, 1800–1810. [Google Scholar] [CrossRef] [Green Version]
  27. Shi, Q.; Li, F.; Yeh, S.; Wang, Y.; Xin, J. Physical stability of amorphous pharmaceutical solids: Nucleation, crystal growth, phase separation and effects of the polymers. Int. J. Pharm. 2020, 590, 119925. [Google Scholar] [CrossRef]
  28. Wang, K.; Sun, C.C. Crystal growth of celecoxib from amorphous state: Polymorphism, growth mechanism, and kinetics. Cryst. Growth Des. 2019, 19, 3592–3600. [Google Scholar] [CrossRef]
  29. Zhang, J.; Shi, Q.; Tao, J.; Peng, Y.; Cai, T. Impact of polymer enrichment at the crystal-liquid interface on crystallization kinetics of amorphous solid dispersions. Mol. Pharm. 2019, 16, 1385–1396. [Google Scholar] [CrossRef]
  30. Zhang, J.; Shi, Q.; Guo, M.; Liu, Z.; Cai, T. Melt crystallization of indomethacin polymorphs in the presence of poly(ethylene oxide): Selective enrichment of the polymer at the crystal-liquid interface. Mol. Pharm. 2020, 17, 2064–2071. [Google Scholar] [CrossRef]
  31. Shi, Q.; Zhang, C.; Su, Y.; Zhang, J.; Zhou, D.; Cai, T. Acceleration of crystal growth of amorphous griseofulvin by low-concentration poly(ethylene oxide): Aspects of crystallization kinetics and molecular mobility. Mol. Pharm. 2017, 14, 2262–2272. [Google Scholar] [CrossRef] [PubMed]
  32. Shi, Q.; Zhang, J.; Zhang, C.; Jiang, J.; Tao, J.; Zhou, D.; Cai, T. Selective acceleration of crystal growth of indomethacin polymorphs by low-concentration poly(ethylene oxide). Mol. Pharm. 2017, 14, 4694–4704. [Google Scholar] [CrossRef] [PubMed]
  33. Yu, L. Nucleation of one polymorph by another. J. Am. Chem. Soc. 2003, 125, 6380–6381. [Google Scholar] [CrossRef] [PubMed]
  34. Chen, S.; Xi, H.; Yu, L. Cross-nucleation between ROY polymorphs. J. Am. Chem. Soc. 2005, 127, 17439–17444. [Google Scholar] [CrossRef] [PubMed]
  35. Su, Y.; Xu, J.; Shi, Q.; Yu, L.; Cai, T. Polymorphism of griseofulvin: Concomitant crystallization from the melt and a single crystal structure of a metastable polymorph with anomalously large thermal expansion. Chem. Commun. 2018, 54, 358–361. [Google Scholar] [CrossRef] [PubMed]
  36. Ou, X.; Li, X.; Rong, H.; Yu, L.; Lu, M. A general method for cultivating single crystals from melt microdroplets. Chem. Commun. 2020, 56, 9950–9953. [Google Scholar] [CrossRef]
  37. Yang, F.; Su, Y.; Zhang, J.; DiNunzio, J.; Leone, A.; Huang, C.; Brown, C.D. Rheology guided rational selection of processing temperature to prepare copovidone/nifedipine amorphous solid dispersions via hot melt extrusion (HME). Mol. Pharm. 2016, 13, 3494–3505. [Google Scholar] [CrossRef]
  38. Chai, Y.; Salez, T.; Mcgraw, J.D.; Benzaquen, M.; Dalnokiveress, K.; Raphaël, E.; Forrest, J.A. A direct quantitative measure of surface mobility in a glassy polymer. Science 2014, 343, 994–999. [Google Scholar] [CrossRef] [Green Version]
  39. Yang, Z.; Fujii, Y.; Lee, F.K.; Lam, C.H.; Tsui, O.K. Glass transition dynamics and surface layer mobility in unentangled polystyrene films. Science 2010, 328, 1676–1679. [Google Scholar] [CrossRef] [Green Version]
  40. Su, Y.; Yu, L.; Cai, T. Enhanced crystal nucleation in glass-forming liquids by tensile fracture in the glassy state. Cryst. Growth Des. 2018, 19, 40–44. [Google Scholar] [CrossRef]
  41. Swallen, S.F.; Kearns, K.L.; Mapes, M.K.; Kim, Y.S.; Mcmahon, R.J.; Ediger, M.D.; Wu, T.; Yu, L.; Satija, S. Organic glasses with exceptional thermodynamic and kinetic stability. Science 2007, 315, 353–356. [Google Scholar] [CrossRef] [Green Version]
  42. Brian, C.W.; Zhu, L.; Yu, L. Effect of bulk aging on surface diffusion of glasses. J. Chem. Phys. 2014, 140, 054509. [Google Scholar] [CrossRef] [PubMed]
  43. Bannow, J.; Karl, M.; Larsen, P.E.; Hwu, E.T.; Rades, T. Direct measurement of lateral molecular diffusivity on the surface of supersaturated amorphous solid dispersions by atomic force microscopy. Mol. Pharm. 2020, 17, 1715–1722. [Google Scholar] [CrossRef] [PubMed]
  44. Zhu, L.; Brian, C.W.; Swallen, S.F.; Straus, P.T.; Ediger, M.D.; Yu, L. Surface self-diffusion of an organic glass. Phys. Rev. Lett. 2011, 106, 256103. [Google Scholar] [CrossRef] [Green Version]
  45. Huang, C.; Ruan, S.; Cai, T.; Yu, L. Fast surface diffusion and crystallization of amorphous griseofulvin. J. Phys. Chem. B 2017, 121, 9463–9468. [Google Scholar] [CrossRef]
  46. Brian, C.W.; Yu, L. Surface self-diffusion of organic glasses. J. Phys. Chem. A 2013, 117, 13303–13309. [Google Scholar] [CrossRef] [PubMed]
  47. Zhang, W.; Brian, C.W.; Yu, L. Fast surface diffusion of amorphous o-terphenyl and its competition with viscous flow in surface evolution. J. Phys. Chem. B 2015, 119, 5071–5078. [Google Scholar] [CrossRef]
  48. Chen, Y.; Zhang, W.; Yu, L. Hydrogen bonding slows down surface diffusion of molecular glasses. J. Phys. Chem. B 2016, 120, 8007–8015. [Google Scholar] [CrossRef]
  49. Zhang, W.; Yu, L. Surface diffusion of polymer glasses. Macromolecules 2016, 49, 731–735. [Google Scholar] [CrossRef]
  50. Barták, J.; Málek, J.; Bagchi, K.; Ediger, M.D.; Li, Y.; Yu, L. Surface mobility in amorphous selenium and comparison with organic molecular glasses. J. Chem. Phys. 2021, 154, 074703. [Google Scholar] [CrossRef]
  51. Chen, Y.; Chen, Z.; Tylinski, M.; Ediger, M.D.; Yu, L. Effect of molecular size and hydrogen bonding on three surface-facilitated processes in molecular glasses: Surface diffusion, surface crystal growth, and formation of stable glasses by vapor deposition. J. Chem. Phys. 2019, 150, 024502. [Google Scholar] [CrossRef] [Green Version]
  52. Li, Y.; Zhang, W.; Bishop, C.; Huang, C.; Ediger, M.D.; Yu, L. Surface diffusion in glasses of rod-like molecules posaconazole and itraconazole: Effect of interfacial molecular alignment and bulk penetration. Soft Matter 2020, 16, 5062–5070. [Google Scholar] [CrossRef]
  53. Mokshin, A.V.; Galimzyanov, B.N.; Yarullin, D.T. Scaling relations for temperature dependences of the surface self-diffusion coefficient in crystallized molecular glasses. JETP Lett. 2019, 110, 511–516. [Google Scholar] [CrossRef] [Green Version]
  54. Paudel, A.; Geppi, M.; Mooter, G.V.D. Structural and dynamic properties of amorphous solid dispersions: The role of solid-state nuclear magnetic resonance spectroscopy and relaxometry. J. Pharm. Sci. 2014, 103, 2635–2662. [Google Scholar] [CrossRef] [PubMed]
  55. Thrane, L.W.; Berglund, E.A.; Wilking, J.N.; Vodak, D.; Seymour, J.D. NMR relaxometry to characterize the drug structural phase in a porous construct. Mol. Pharm. 2018, 15, 2614–2620. [Google Scholar] [CrossRef] [Green Version]
  56. Yang, F.; Su, Y.; Zhu, L.; Brown, C.D.; Rosen, L.A.; Rosenbery, K.J. Rheological and solid-state NMR assessments of copovidone/clotrimazole model solid dispersions. Int. J. Pharm. 2016, 500, 20–31. [Google Scholar] [CrossRef] [PubMed]
  57. Carpentier, L.; Decressain, R.; Gusseme, A.; Neves, C.; Descamps, M. Molecular mobility in glass forming fananserine: A dielectric, NMR, and TMDSC investigation. Pharm. Res. 2006, 23, 798–805. [Google Scholar] [CrossRef] [PubMed]
  58. Dudek, M.K.; Kamierski, S.; Potrzebowski, M.J. Fast and very fast MAS solid state NMR studies of pharmaceuticals. Annu. Rep. NMR Spectro. 2021, 103, 97–189. [Google Scholar]
  59. Yuan, X.; Sperger, D.; Munson, E.J. Investigating miscibility and molecular mobility of nifedipine-PVP amorphous solid dispersions using solid-state NMR spectroscopy. Mol. Pharm. 2014, 11, 329–337. [Google Scholar] [CrossRef] [PubMed]
  60. Sarpal, K.; Tower, C.W.; Munson, E.J. Investigation into intermolecular interactions and phase behavior of binary and ternary amorphous solid dispersions of ketoconazole. Mol. Pharm. 2020, 17, 787–801. [Google Scholar] [CrossRef]
  61. Lu, X.; Huang, C.; Lowinger, M.B.; Yang, F.; Xu, W.; Brown, C.D.; Hesk, D.; Koynov, A.; Schenck, L.; Su, Y. Molecular Interactions in Posaconazole Amorphous Solid Dispersions from Two-Dimensional Solid-State NMR Spectroscopy. Mol. Pharm. 2019, 16, 2579–2589. [Google Scholar] [CrossRef] [PubMed]
  62. Lu, X.; Li, M.; Huang, C.; Lowinger, M.B.; Xu, W.; Yu, L.; Byrn, S.R.; Templeton, A.C.; Su, Y. Atomic-Level Drug Substance and Polymer Interaction in Posaconazole Amorphous Solid Dispersion from Solid-State NMR. Mol. Pharm. 2020, 17, 2585–2598. [Google Scholar] [CrossRef] [PubMed]
  63. Qian, F.; Huang, J.; Zhu, Q.; Haddadin, R.; Gawel, J.; Garmise, R.; Hussain, M. Is a distinctive single Tg a reliable indicator for the homogeneity of amorphous solid dispersion? Int. J. Pharm. 2010, 395, 232–235. [Google Scholar] [CrossRef]
  64. Paudel, A.; Van Humbeeck, J.; Van den Mooter, G. Theoretical and experimental investigation on the solid solubility and miscibility of naproxen in poly(vinylpyrrolidone). Mol. Pharm. 2010, 7, 1133–1148. [Google Scholar] [CrossRef]
  65. Litvinov, V.M.; Guns, S.; Adriaensens, P.; Scholtens, B.J.; Quaedflieg, M.P.; Carleer, R.; Van den Mooter, G. Solid state solubility of miconazole in poly[(ethylene glycol)-g-vinyl alcohol] using hot-melt extrusion. Mol. Pharm. 2012, 9, 2924–2932. [Google Scholar] [CrossRef]
  66. Sarpal, K.; Delaney, S.; Zhang, G.G.; Munson, E.J. Phase Behavior of Amorphous Solid Dispersions of Felodipine: Homogeneity and Drug−Polymer Interactions. Mol. Pharm. 2019, 16, 4836–4851. [Google Scholar] [CrossRef]
  67. Sarpal, K.; Munson, E.J. Amorphous Solid Dispersions of Felodipine and Nifedipine with Soluplus®: Drug-Polymer Miscibility and Intermolecular Interactions. J. Pharm. Sci. 2021, 110, 1457–1469. [Google Scholar] [CrossRef]
  68. Duan, P.; Lamm, M.S.; Yang, F.; Xu, W.; Skomski, D.; Su, Y.; Schmidt-Rohr, K. Quantifying molecular mixing and heterogeneity in pharmaceutical dispersions at sub-100 nm resolution by spin diffusion NMR. Mol. Pharm. 2020, 17, 3567–3580. [Google Scholar] [CrossRef] [PubMed]
  69. Ricarte, R.G.; Van Zee, N.J.; Li, Z.; Johnson, L.M.; Lodge, T.P.; Hillmyer, M.A. Recent advances in understanding the micro- and nanoscale phenomena of amorphous solid dispersions. Mol. Pharm. 2019, 16, 4089–4103. [Google Scholar] [CrossRef]
  70. Knapik-Kowalczuk, J.; Rams-Baron, M.; Paluch, M. Current research trends in dielectric relaxation studies of amorphous pharmaceuticals: Physical stability, tautomerism, and the role of hydrogen bonding. TrAC-Trend Anal. Chem. 2021, 134, 116097. [Google Scholar] [CrossRef]
  71. Kothari, K.; Ragoonanan, V.; Suryanarayanan, R. Influence of molecular mobility on the physical stability of amorphous pharmaceuticals in the supercooled and glassy States. Mol. Pharm. 2014, 11, 3048–3055. [Google Scholar] [CrossRef]
  72. Bhardwaj, S.P.; Arora, K.K.; Kwong, E.; Templeton, A.; Clas, S.D.; Suryanarayanan, R. Mechanism of amorphous itraconazole stabilization in polymer solid dispersions: Role of molecular mobility. Mol. Pharm. 2014, 11, 4228–4237. [Google Scholar] [CrossRef] [PubMed]
  73. Bhardwaj, S.P.; Suryanarayanan, R. Molecular mobility as an effective predictor of the physical stability of amorphous trehalose. Mol. Pharm. 2012, 9, 3209–3217. [Google Scholar] [CrossRef] [PubMed]
  74. Dantuluri, A.K.; Amin, A.; Puri, V.; Bansal, A.K. Role of alpha-relaxation on crystallization of amorphous celecoxib above T(g) probed by dielectric spectroscopy. Mol. Pharm. 2011, 8, 814–822. [Google Scholar] [CrossRef]
  75. Kothari, K.; Ragoonanan, V.; Suryanarayanan, R. The role of polymer concentration on the molecular mobility and physical stability of nifedipine solid dispersions. Mol. Pharm. 2015, 12, 1477–1484. [Google Scholar] [CrossRef]
  76. Kothari, K.; Ragoonanan, V.; Suryanarayanan, R. The role of drug-polymer hydrogen bonding interactions on the molecular mobility and physical stability of nifedipine solid dispersions. Mol. Pharm. 2015, 12, 162–170. [Google Scholar] [CrossRef]
  77. Mohapatra, S.; Samanta, S.; Kothari, K.; Mistry, P.; Suryanarayanan, R. Effect of polymer molecular weight on the crystallization behavior of indomethacin amorphous solid dispersions. Cryst. Growth Des. 2017, 17, 3142–3150. [Google Scholar] [CrossRef]
  78. Mistry, P.; Suryanarayanan, R. Strength of drug-polymer interactions: Implications for crystallization in dispersions. Cryst. Growth Des. 2016, 16, 5141–5149. [Google Scholar] [CrossRef]
  79. Mehta, M.; Kothari, K.; Ragoonanan, V.; Suryanarayanan, R. Effect of water on molecular mobility and physical stability of amorphous pharmaceuticals. Mol. Pharm. 2016, 13, 1339–1346. [Google Scholar] [CrossRef] [PubMed]
  80. Mehta, M.; Suryanarayanan, R. Accelerated physical stability testing of amorphous dispersions. Mol. Pharm. 2016, 13, 2661–2666. [Google Scholar] [CrossRef] [PubMed]
  81. Fung, M.H.; Suryanarayanan, R. Use of a plasticizer for physical atability prediction of amorphous solid dispersions. Cryst. Growth Des. 2017, 17, 4315–4325. [Google Scholar] [CrossRef]
  82. Madejczyk, O.; Kaminska, E.; Tarnacka, M.; Dulski, M.; Jurkiewicz, K.; Kaminski, K.; Paluch, M. Studying the crystallization of various polymorphic forms of nifedipine from binary mixtures with the use of different experimental techniques. Mol. Pharm. 2017, 14, 2116–2125. [Google Scholar] [CrossRef] [PubMed]
  83. Bhattacharya, S.; Suryanarayanan, R. Local mobility in amorphous pharmaceuticals-characterization and implications on stability. J. Pharm. Sci. 2009, 98, 2935–2953. [Google Scholar] [CrossRef]
  84. Mehta, M.; Ragoonanan, V.; McKenna, G.B.; Suryanarayanan, R. Correlation between molecular mobility and physical stability in pharmaceutical glasses. Mol. Pharm. 2016, 13, 1267–1277. [Google Scholar] [CrossRef]
  85. Knapik, J.; Wojnarowska, Z.; Grzybowska, K.; Jurkiewicz, K.; Tajber, L.; Paluch, M. Molecular dynamics and physical stability of coamorphous ezetimib and indapamide mixtures. Mol. Pharm. 2015, 12, 3610–3619. [Google Scholar] [CrossRef]
  86. Knapik-Kowalczuk, J.; Wojnarowska, Z.; Rams-Baron, M.; Jurkiewicz, K.; Cielecka-Piontek, J.; Ngai, K.L.; Paluch, M. Atorvastatin as a promising crystallization inhibitor of amorphous probucol: Dielectric studies at ambient and elevated pressure. Mol. Pharm. 2017, 14, 2670–2680. [Google Scholar] [CrossRef] [PubMed]
  87. Knapik-Kowalczuk, J.; Tu, W.; Chmiel, K.; Rams-Baron, M.; Paluch, M. Co-stabilization of amorphous pharmaceuticals-The case of nifedipine and nimodipine. Mol. Pharm. 2018, 15, 2455–2465. [Google Scholar] [CrossRef]
  88. Fung, M.H.; Berzins, K.; Suryanarayanan, R. Physical stability and dissolution behavior of ketoconazole-organic acid coamorphous systems. Mol. Pharm. 2018, 15, 1862–1869. [Google Scholar] [CrossRef]
  89. Fung, M.H.; DeVault, M.; Kuwata, K.T.; Suryanarayanan, R. Drug-excipient interactions: Effect on molecular mobility and physical stability of ketoconazole-organic acid coamorphous systems. Mol. Pharm. 2018, 15, 1052–1061. [Google Scholar] [CrossRef] [PubMed]
  90. Knapik, J.; Wojnarowska, Z.; Grzybowska, K.; Jurkiewicz, K.; Stankiewicz, A.; Paluch, M. Stabilization of the amorphous ezetimibe drug by confining its dimension. Mol. Pharm. 2016, 13, 1308–1316. [Google Scholar] [CrossRef]
  91. Zhang, C.; Sha, Y.; Zhang, Y.; Cai, T.; Li, L.; Zhou, D.; Wang, X.; Xue, G. Nanostructures and dynamics of isochorically confined amorphous drug mediated by cooling rate, interfacial, and intermolecular interactions. J. Phys. Chem. B 2017, 121, 10704–10716. [Google Scholar] [CrossRef]
  92. Thakral, S.; Terban, M.W.; Thakral, N.K.; Suryanarayanan, R. Recent advances in the characterization of amorphous pharmaceuticals by X-ray diffractometry. Adv. Drug Deliv. Rev. 2016, 100, 183–193. [Google Scholar] [CrossRef]
  93. Hedoux, A. Recent developments in the Raman and infrared investigations of amorphous pharmaceuticals and protein formulations: A review. Adv. Drug Deliv. Rev. 2016, 100, 133–146. [Google Scholar] [CrossRef]
  94. Duggirala, N.K.; Li, J.; Kumar, N.S.K.; Gopinath, T.; Suryanarayanan, R. A supramolecular synthon approach to design amorphous solid dispersions with exceptional physical stability. Chem. Commun. 2019, 55, 5551–5554. [Google Scholar] [CrossRef] [PubMed]
  95. Sahoo, A.; Kumar, N.S.K.; Suryanarayanan, R. Crosslinking: An avenue to develop stable amorphous solid dispersion with high drug loading and tailored physical stability. J. Control Release 2019, 311–312, 212–224. [Google Scholar] [CrossRef] [PubMed]
  96. Li, N.; Taylor, L.S. Nanoscale infrared, thermal, and mechanical characterization of telaprevir-polymer miscibility in amorphous solid dispersions prepared by solvent evaporation. Mol. Pharm. 2016, 13, 1123–1136. [Google Scholar] [CrossRef] [PubMed]
  97. Purohit, H.S.; Taylor, L.S. Miscibility of itraconazole-hydroxypropyl methylcellulose blends: Insights with high resolution analytical methodologies. Mol. Pharm. 2015, 12, 4542–4553. [Google Scholar] [CrossRef]
  98. Sibik, J.; Zeitler, J.A. Direct measurement of molecular mobility and crystallisation of amorphous pharmaceuticals using terahertz spectroscopy. Adv. Drug Deliv. Rev. 2016, 100, 147–157. [Google Scholar] [CrossRef] [Green Version]
  99. Chen, Z.; Yang, K.; Huang, C.; Zhu, A.; Yu, L.; Qian, F. Surface enrichment and depletion of the active ingredient in spray dried amorphous solid dispersions. Pharm. Res. 2018, 35, 38. [Google Scholar] [CrossRef]
  100. Rautaniemi, K.; Vuorimaa-Laukkanen, E.; Strachan, C.J.; Laaksonen, T. Crystallization kinetics of an amorphous pharmaceutical compound using fluorescence lifetime imaging microscopy. Mol. Pharm. 2018, 15, 1964–1971. [Google Scholar] [CrossRef] [Green Version]
  101. Bhujbal, S.V.; Zemlyanov, D.; Cavallaro, A.A.; Mangal, S.; Taylor, L.S.; Zhou, Q.T. Qualitative and quantitative characterization of composition heterogeneity on the surface of spray dried amorphous solid dispersion particles by an advanced surface analysis platform with high surface-sensitivity and superior spatial resolution. Mol. Pharm. 2018, 15, 2045–2053. [Google Scholar] [CrossRef] [PubMed]
Figure 1. Bulk crystal growth morphologies of GSF as a function of temperature from 210 °C to 60 °C, (a) 210 °C, (b) 130 °C, (c) 100 °C, (d) 90 °C, (e) 80 °C, and (f) 60 °C. Adapted from the [24] with the permission. Copyright © 2016 American Chemical Society.
Crystals 11 01440 g001
Figure 2. The experimental scheme of surface grating decay for surface diffusion measurement. Adapted from [43] with the permission. Copyright © 2020 American Chemical Society.
Crystals 11 01440 g002
Figure 3. Surface crystal growth rate us, plotted against surface diffusion coefficients Ds for reported glasses and silicon. Adapted from [45] with the permission. Copyright © 2017 American Chemical Society.
Crystals 11 01440 g003
Figure 4. CPMAS 13C spectrum of the carboxylic acid of amorphous indomethacin. Simulated peaks are shown in red, yellow, and blue to illustrate the various hydrogen bonds. Adapted from the [59] with the permission. Copyright © 2015 American Chemical Society.
Crystals 11 01440 g004
Figure 5. Plot of crystallization times tc as a function of (a) inverse temperature (1000/T), and (b) Tg/T for the griseofulvin dry powder (black rounds) and powder containing low content water (blue rounds). Adapted from the [79] with the permission. Copyright © 2015 American Chemical Society.
Crystals 11 01440 g005
Figure 6. Temperature dependence of α and α′ relaxation times determined by using BDS technique for bulk ezetimibe, ezetimibe-Aeroperl 300 and ezetimibe-Neusilin US2 systems. Adapted from [90] with the permission. Copyright © 2016 American Chemical Society.
Crystals 11 01440 g006
Publisher’s Note: MDPI stays neutral with regard to jurisdictional claims in published maps and institutional affiliations.

