
Bio-Surfactant Assisted Aqueous Exfoliation of High-Quality Few-Layered Graphene
by
 , and
, and
Nasima Akter
1,2,3,*, 
Muhammad Taqiyuddin Mawardi Ayob
1,
Shahidan Radiman
1,
Mayeen Uddin Khandaker
4,* ,
,
Hamid Osman
5 and
and
Sultan Alamri
5 1
School of Applied Physics, Faculty of Science and Technology, Universiti Kebangsaan Malaysia, Bangi 43600, Malaysia
2
Centre for Environment & Sustainability, Presidency Education, 51 Panchlaish, Chittagong 4203, Bangladesh
3
Directorate of Secondary and Higher Education (DSHE), 16 Abdul Gani Road, Dhaka 1000, Bangladesh
4
Centre for Applied Physics and Radiation Technologies, School of Engineering and Technology, Sunway University, Bandar Sunway 47500, Malaysia
5
Department of Radiological Sciences, College of Applied Medical Sciences, Taif University, Taif 21944, Saudi Arabia
*
Authors to whom correspondence should be addressed.
Crystals 2021, 11(8), 944; https://doi.org/10.3390/cryst11080944
Submission received: 10 July 2021
/
Revised: 2 August 2021
/
Accepted: 11 August 2021
/
Published: 13 August 2021
Abstract
:Realizing the efficacy of the liquid-phase exfoliation technique to obtain a greater quantity of graphene, this study demonstrates a cost-effective technique of bio-surfactant-assisted liquid-phase exfoliation of few-layer graphene (FLG) with a low defect ratio. An ultrasonic bath without any toxic chemicals or chemical modification was employed to exfoliate the graphene at room temperature. Several state-of-the-art characterization techniques such as TEM, AFM, XRD UV-Vis, and Raman spectroscopy were used to confirm the presence of the graphene. The dispersion exhibits a typical Tyndall scattering to the red laser beam. After a 7-h sonication of the dispersion, followed by a centrifugation frequency of 500 rpm for half an hour, the graphene concentration was found to be 1.2 mg/mL. The concentration decreases monotonically with an increase in the frequency, as a higher frequency causes sedimentation of the larger flakes or removes the adsorbed surfactant molecules from the graphene structures that collapse the graphene sheets into the graphite. The presence of an amino acid head-group in the surfactant facilitated exfoliation in an aqueous solution at well below the critical micelle concentration (CMC) of the surfactant. The product demonstrates all characteristic features of an FLG system. The TEM and AFM image reveals large-area graphene with a wrinkle-free surface; these morphological properties are confirmed by XRD and Raman spectroscopy. This study suggests that a sonication-induced process with a biocompatible surfactant can produce a cheap, large-surface-area graphene system for a wide range of applications. Moreover, the use of a probe sonicator as an alternative to the bath-type sonicator, together with the demonstrated technique, may reduce the time needed, and leads to a manifold increase in the yield.
1. Introduction
Graphene is the two-dimensional form of the carbon monolayer of graphite; it was proven to be stable under average room conditions. The unique properties of graphene in terms of its thermal, electrical, and mechanical conditions are utilized in many areas of technology. It has proven to be efficient for each of these uses [1]. Its applications include electrodes for capacitive deionization, sensors, photodetectors, in the environmental barrier as a coating material, and in the biological systems [2,3,4,5,6,7].
Since its discovery, from a simple micromechanical cleavage of graphite crystal, graphene has been a prominent research focus due to its versatile properties. Although micromechanical cleavage is the most efficient method in terms of quality, as it gives monolayer graphene a very large size without any defects, this method has significant limitations in terms of yield and quantity, similar to other novel inventions. Many other exfoliation methods were found to increase yield, minimize defects, and achieve mono- or few-layered graphens. Chemical vapor deposition (CVD), the reduction in single-layered graphene oxide, and liquid-phase exfoliations are the most common strategies. However, for the production of large quantities, a cost-effective and environmentally friendly system is very important. Considering this fact, liquid-phase exfoliation has attracted the attention of many scientists, as it is easy to produce using the available resources; it can be produced using a kitchen blender or ultra-sonication energy [8,9]. Nevertheless, exploration of a suitable liquid phase exfoliation system remains a challenge. Therefore, efforts are being made to obtain a cost-effective and environmentally friendly production process that may enable the successful application of graphene in diverse fields.
To date many liquids have been investigated for graphene production; these are the organic/inorganic liquids (NMP, DMP, and Toluene, etc.), salt, and surfactant solution with or without polymer or organic/inorganic liquids, etc. [10,11,12,13,14]. The reason for emphasizing the liquid phase exfoliation process is that it provides very low defects, which appear near the graphene edges, not on the basal plane [15,16]. Instead of the many advantages, CVD has a limited scope because of the harsh chemicals used; this system needs high pressure, expensive equipment and a high-energy input. Toxic fumes result as a byproduct, making the system very complex for mass production. Among the other alternatives, the reduction in graphene oxide contains a large defect population, and it is impossible to remove these defects completely, which disrupts its electrical properties [17,18].
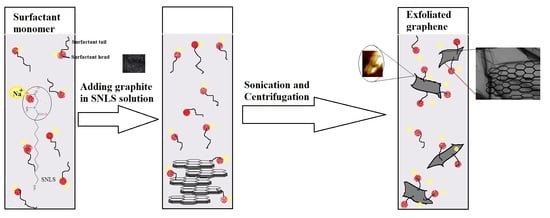
As every system has advantages and disadvantages, optimization of the costs and benefits is very important, to ensure that the system is applicable to a wide range of applications. In this case, a balance between costs and the scaling-up its production, emphasizing the environmental aspects, is of prime importance. Among all liquid-phase exfoliation systems, aqueous surfactant-based systems proved to be an ideal way of prepare high-concentration graphene, as it can avoid the toxic organic solvents, and is a non-covalent solution phased method [19]. They are scalable and require very small amounts of surfactant in water. Additionally, only sonication energy, or any kind of vigorous mixing, is needed to exfoliate, enabling the supply of affordable graphene products to the market. Surfactants are self–assembled molecular structures that form different aggregates in aqueous and oily phases, depending on their concentration. This property is exploited in a wide range of applications, such as drug delivery to a cosmetic product, or fuel cells to layered materials [20,21,22,23]. The hydrophilic head-group and hydrophobic tails facilitate such properties. In the case of layered materials, the weak Van der Waals forces play the key role of keeping them together. In an aqueous surfactant solution, the hydrophobic CH3 group adsorbs on the graphite surface, while its hydrophilic counterpart points towards the aqueous phase, forming monolayers below the critical micelle concentration. Adding too much surfactant turns these into micelle structures, thus destabilizing the dispersed graphene phase, leading to the macroscopic phase separation of micelle phase and restacked graphite thick material. Thus, the selection of an appropriate concentration of surfactant is very important to achieving the stable and concentrated phase of single- or few-layer graphene phases.
The intercalation of surfactant molecules into the atomic layers of graphite prevents agglomeration and assists in the separation of a single graphene layer by weakening or breaking the Van der Waals force. The yields depend on the influence of ultrasonic power, time, volume and boiling temperature of the solvent, centrifugation rate and time, aggregation behavior of surfactant in the solvent, and graphite intercalation. For successful exfoliation, a suitable system must be selected that will optimize the cost and quality. At a certain mixing ratio of surfactant and water, a noticeable exfoliation was observed. The exfoliation rate depends on different parameters, such as surfactant–water ratio, sonication time, graphite concentration, types of sonicator, and centrifugation time and rate. Moreover, to ensure a completely non-toxic environment, the selection of an appropriate ingredient is very important.
In this work, we used an amino-acid-based biosurfactant “Sodium N-lauroylsarcosinate hydrate (SNLS)”, which is commonly used in toothpaste and other cosmetic products. This offers strong self-assembling properties in water, alcohol, and oil. The molecular geometry of this surfactant consists of an amino-acid-based head group with a medium hydrophobic chain [24]. The amide group has high solubility in water, owing to its hydrogen bonding property, and sodium ion provides electrostatic stabilization. These properties of SNLS are already well established in soft-matter physics [25,26,27]. To explore its efficacy in 2D matter, we inspected its ability to exfoliate graphite in an aqueous SNLS solution. The comparatively higher surface-active properties of this surfactant minimize the necessity of a higher surfactant concentration, and thus assist in its easy removal from the final graphene product. Moreover, the higher water attraction prevents the basal plane from attaching to any oxidation or other kinds of defect.
A stable graphene dispersion was confirmed by examining different parameters using a UV-Vis spectrometer. We gradually checked the relationship between graphene concentration and exfoliation time, surfactant concentration, and centrifugation frequency. The UV absorption spectrum shows a typical peak at 265 nm, which is flat in the visible range; this is the characteristic feature of this two-dimensional matter. TEM, AFM images revealed few-layered graphene film; this result is further supported by XRD and Raman results, which show a small defect ratio that usually appeared due to the sonication energy as the graphene edge increases.
2. Materials and Methods
Graphite powder (99.9%) with a particle size of 50 μm was purchased from Asbury, Carbon. Sodium N-lauroylsarcosinate hydrate (SNLS) with a molecular weight of 293.38 gm/mol. was purchased from TCI, Japan. All chemicals were analytical grade and used as received, without further purification or chemical modification. Deionized water was used as an exfoliation liquid.
To prepare the graphene dispersions, we combined 8 g of natural graphite powder with 0.8 g SNLS in 400 mL deionized water. A bath-type ultrasonicator was used to exfoliate graphene directly from the graphite flakes through ultrasonic cavitation. The sonicated mixture was left undisturbed for one week, so that the flakes went down, and then the supernatant solution was centrifuged to remove the poorly dispersed graphitic material. The experiment was divided into three parts: in the first part, 400 mL aqueous solution of graphite was prepared, and an aliquot of 3 mL dispersion was taken at a different time, to study the effect of sonication time (t) on the concentration of graphene (Cg). The absorption measurements were taken with a Lambda 35 UV-Vis Spectrophotometer using optical-grade quartz cuvettes.
In the second series of experiments, we determined the effect of centrifugation frequency, where 10 mL dispersion was prepared in 10 mL test tubes. A total of 3 mL of dispersion was separated after 7 h sonication and centrifuged for frequencies of 500 rpm, 1000 rpm, 1500 rpm, 2000 rpm, 3000 rpm, 4000 rpm, and one of 1500 rpm for half an hour, followed by 3000 rpm for another half an hour (double centrifugation).
In the third experiment, optimum surfactant concentration (Cs) was determined; 10 mL of graphene dispersion was prepared using the same proportion of graphite in an aqueous solution for different surfactant concentrations, and then centrifuged. The supernatant was separated to determine the concentration of graphene.
Here, all the characterizations were performed using the sample sonicated for 7 h after (1500 + 3000 rpm) double centrifugation.
Transmission electron microscope (TEM): TECNAI G212, TWIN, a 120 kV/LaB6 was employed to obtain images that could be used to study the nanostructure of the prepared sample. TEM samples were prepared by pipetting a few milliliters of this dispersion onto holey carbon mesh grids (400 mesh). After drying, the carbon grid was washed with DI water to remove the unadsorbed graphene. For the atomic force microscope (AFM) topographic study, 0.2 mL of graphene dispersion was mixed with 10 mL DI water and then sonicated for 5 min. A freshly peeled mica was placed on the dispersion for 5 min, washed three times to remove the unadsorbed graphene, then dried on the hot plate.
The crystalline structure of graphite and graphene was characterized using XRD, D8 Advance X-ray diffractometer (Bruker AXS, Karlsruhe, Germany). The system employed Cu K-α as a radiation source at λ = 0.15406 nm and the 1-D fast detector (Lynx-Eye) was powered at 40 kV and 40 mA. The measured diffraction angle (2θ), ranging from 5° to 80°, was scanned at a step size of 0.025°. Raman spectra of graphene and graphite powder were performed using a Renishaw In ViaTM Raman spectrometer (Kingswood, Bristol, UK) with an Ar+ laser with the excitation wavelength of 532 nm, 2.34 eV.
3. Results and Discussion
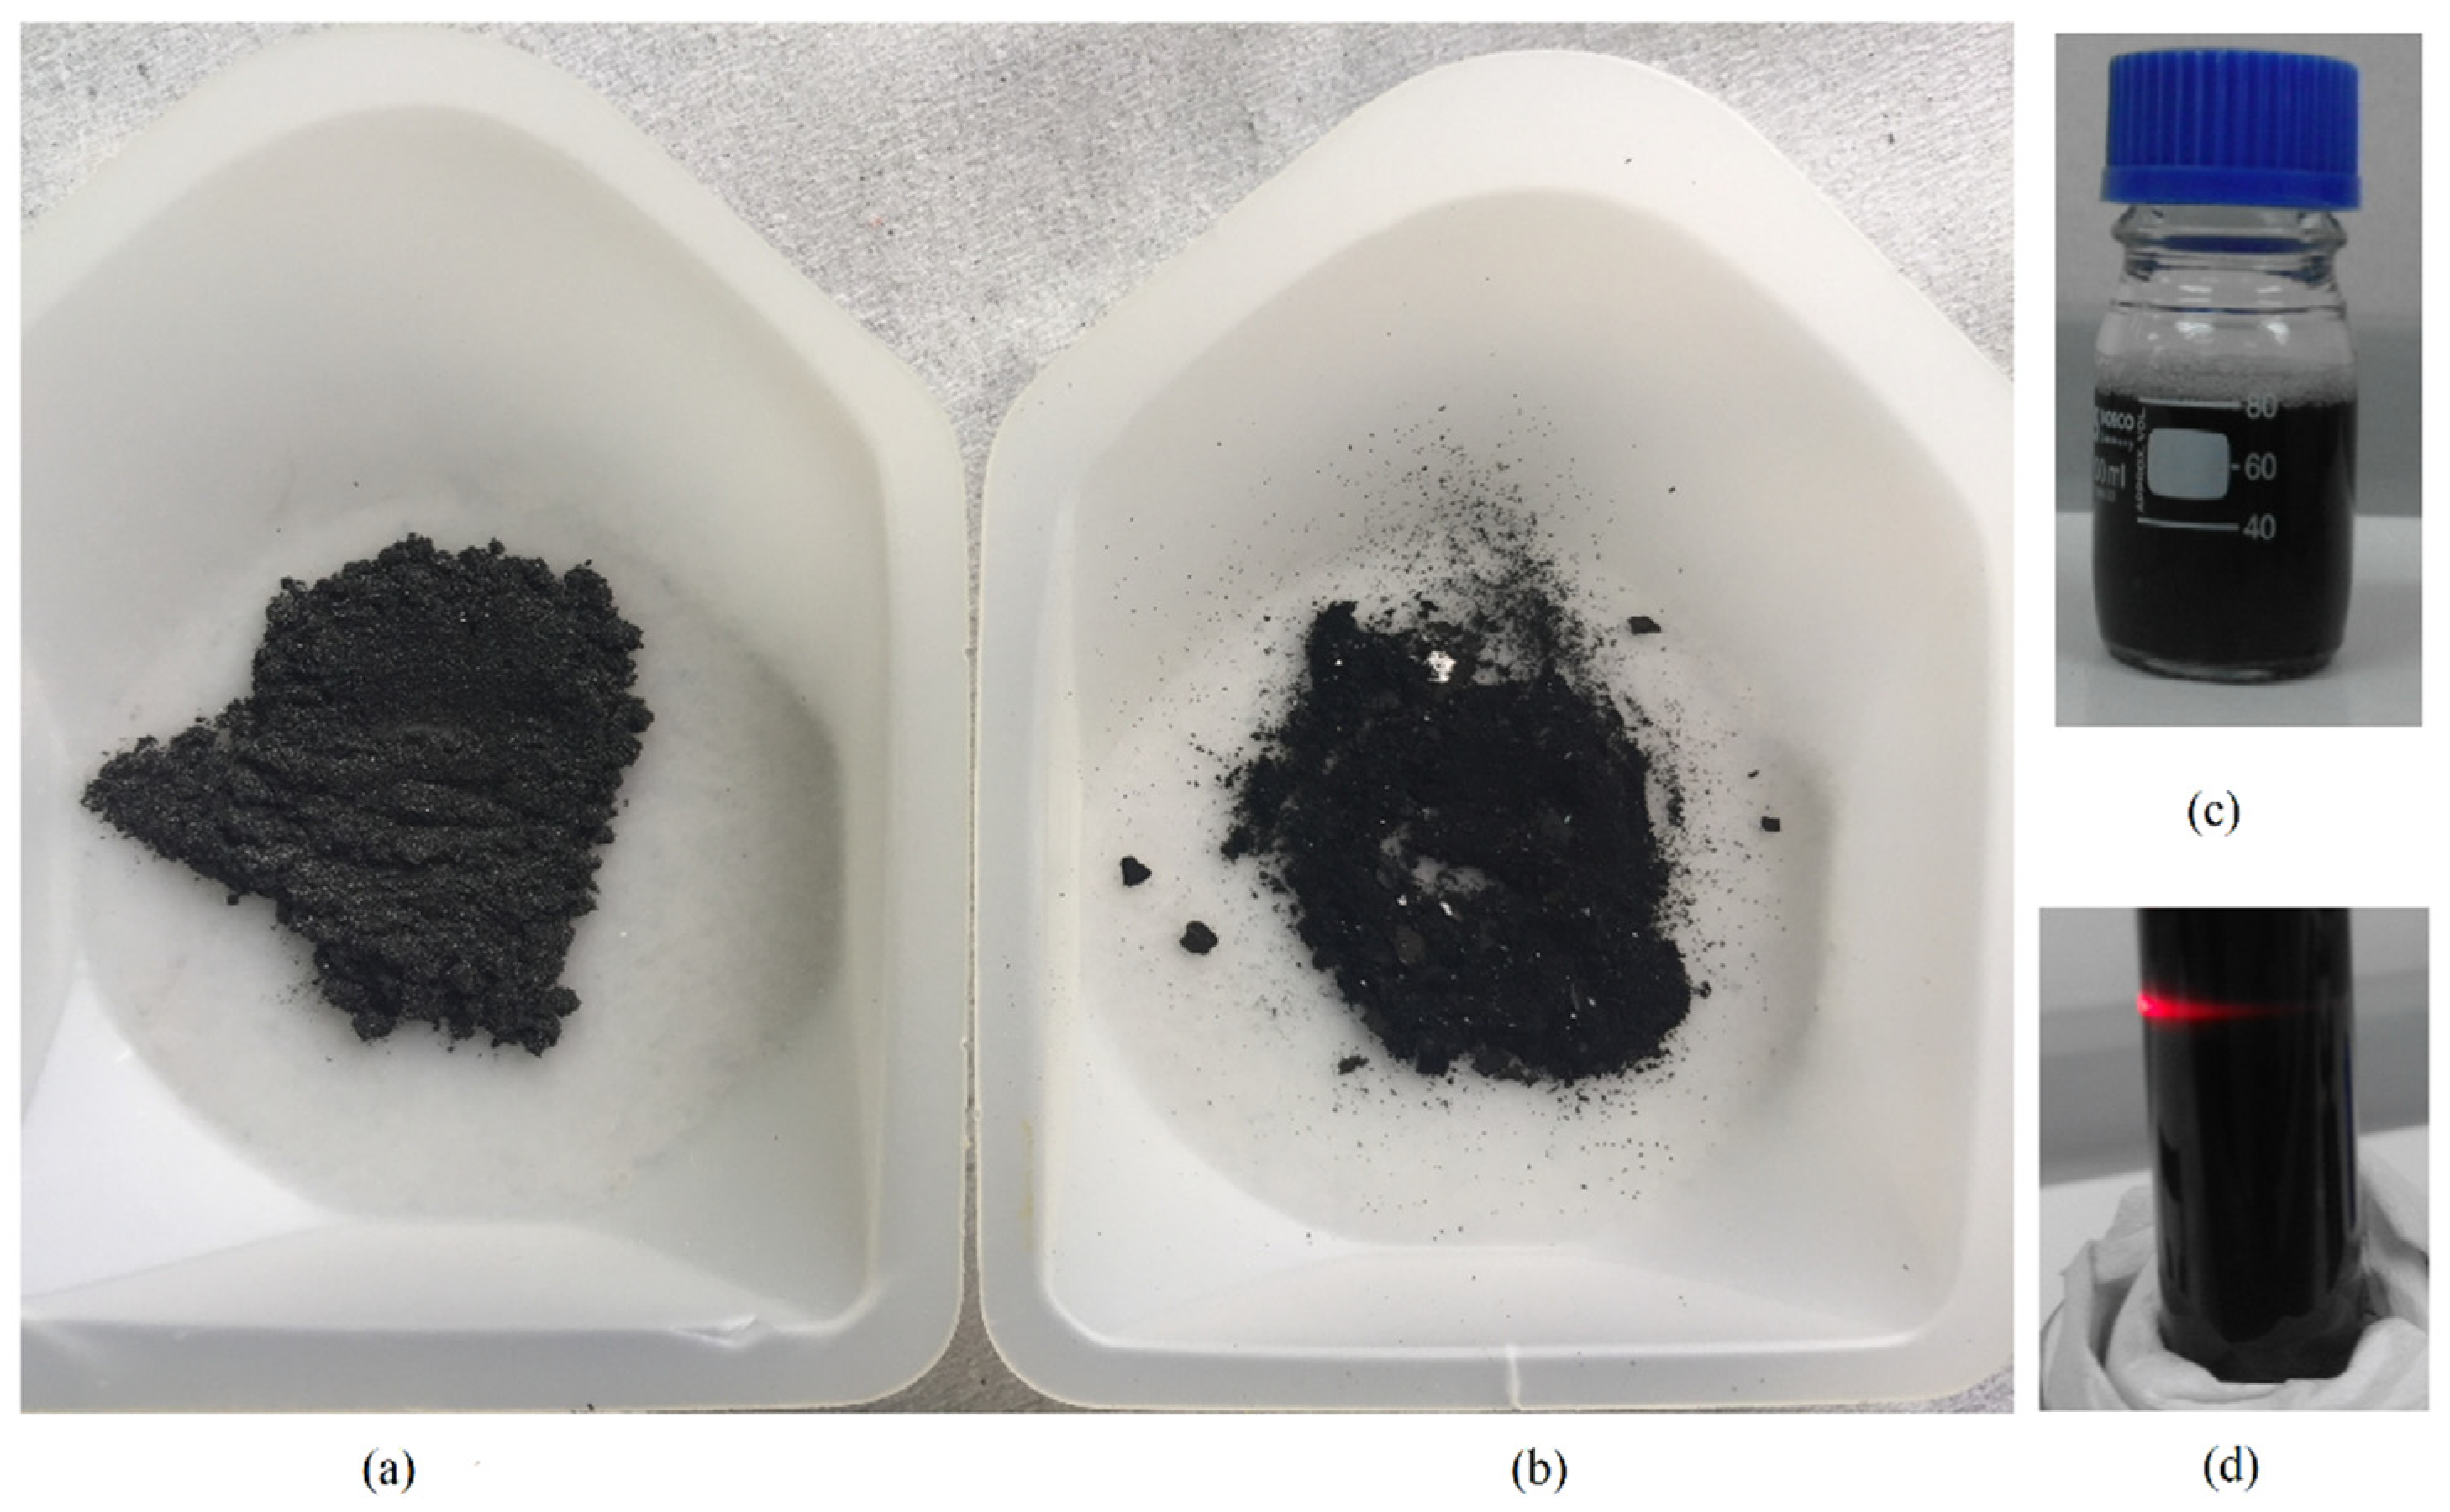
To explore a new exfoliation media, we prepared the dispersion of graphite powder (Figure 1a) with SNLS solution using a bath-type ultrasonicator. After sonication, the dispersion turned into a black homogenous phase, consisting of large, grey-colored macroscopic aggregates. These aggregates were removed by mild centrifugation, providing a homogenous dark dispersion. Even though the surfactant-based system led to some problems concerning the complete removal of surfactant molecules from the final product, it has many advantages, since a minimal amount of surfactant is needed for exfoliation. Moreover, water is nontoxic, and the cheapest and most abundant liquid on the Earth; a combination of these two ingredients, along with sonication, provides electrostatic stabilization (for ionic surfactants) and steric stabilization (for non-ionic), as well as amphiphilic stabilization, by forming a monolayer in the aqueous phase.
The concentration of the exfoliated graphene dispersed in an aqueous solvent of surfactant depends on several parameters, such as sonication energy, concentration of the surfactant, beaker size, and centrifugation speed. A series of UV experiments were conducted to ensure the quality and quantity of the graphene. We monitored the dispersion quality as a function of sonication time, centrifugation rate, and surfactant concentration. We selected a dispersion of 7-h sonication time, with centrifugation frequency for 1500 rpm for 30 min, followed by 3000 rpm for 30 min, to confirm all morphological properties.
3.1. Graphene Concentration as a Function of Sonication Time (Cg vs. t)
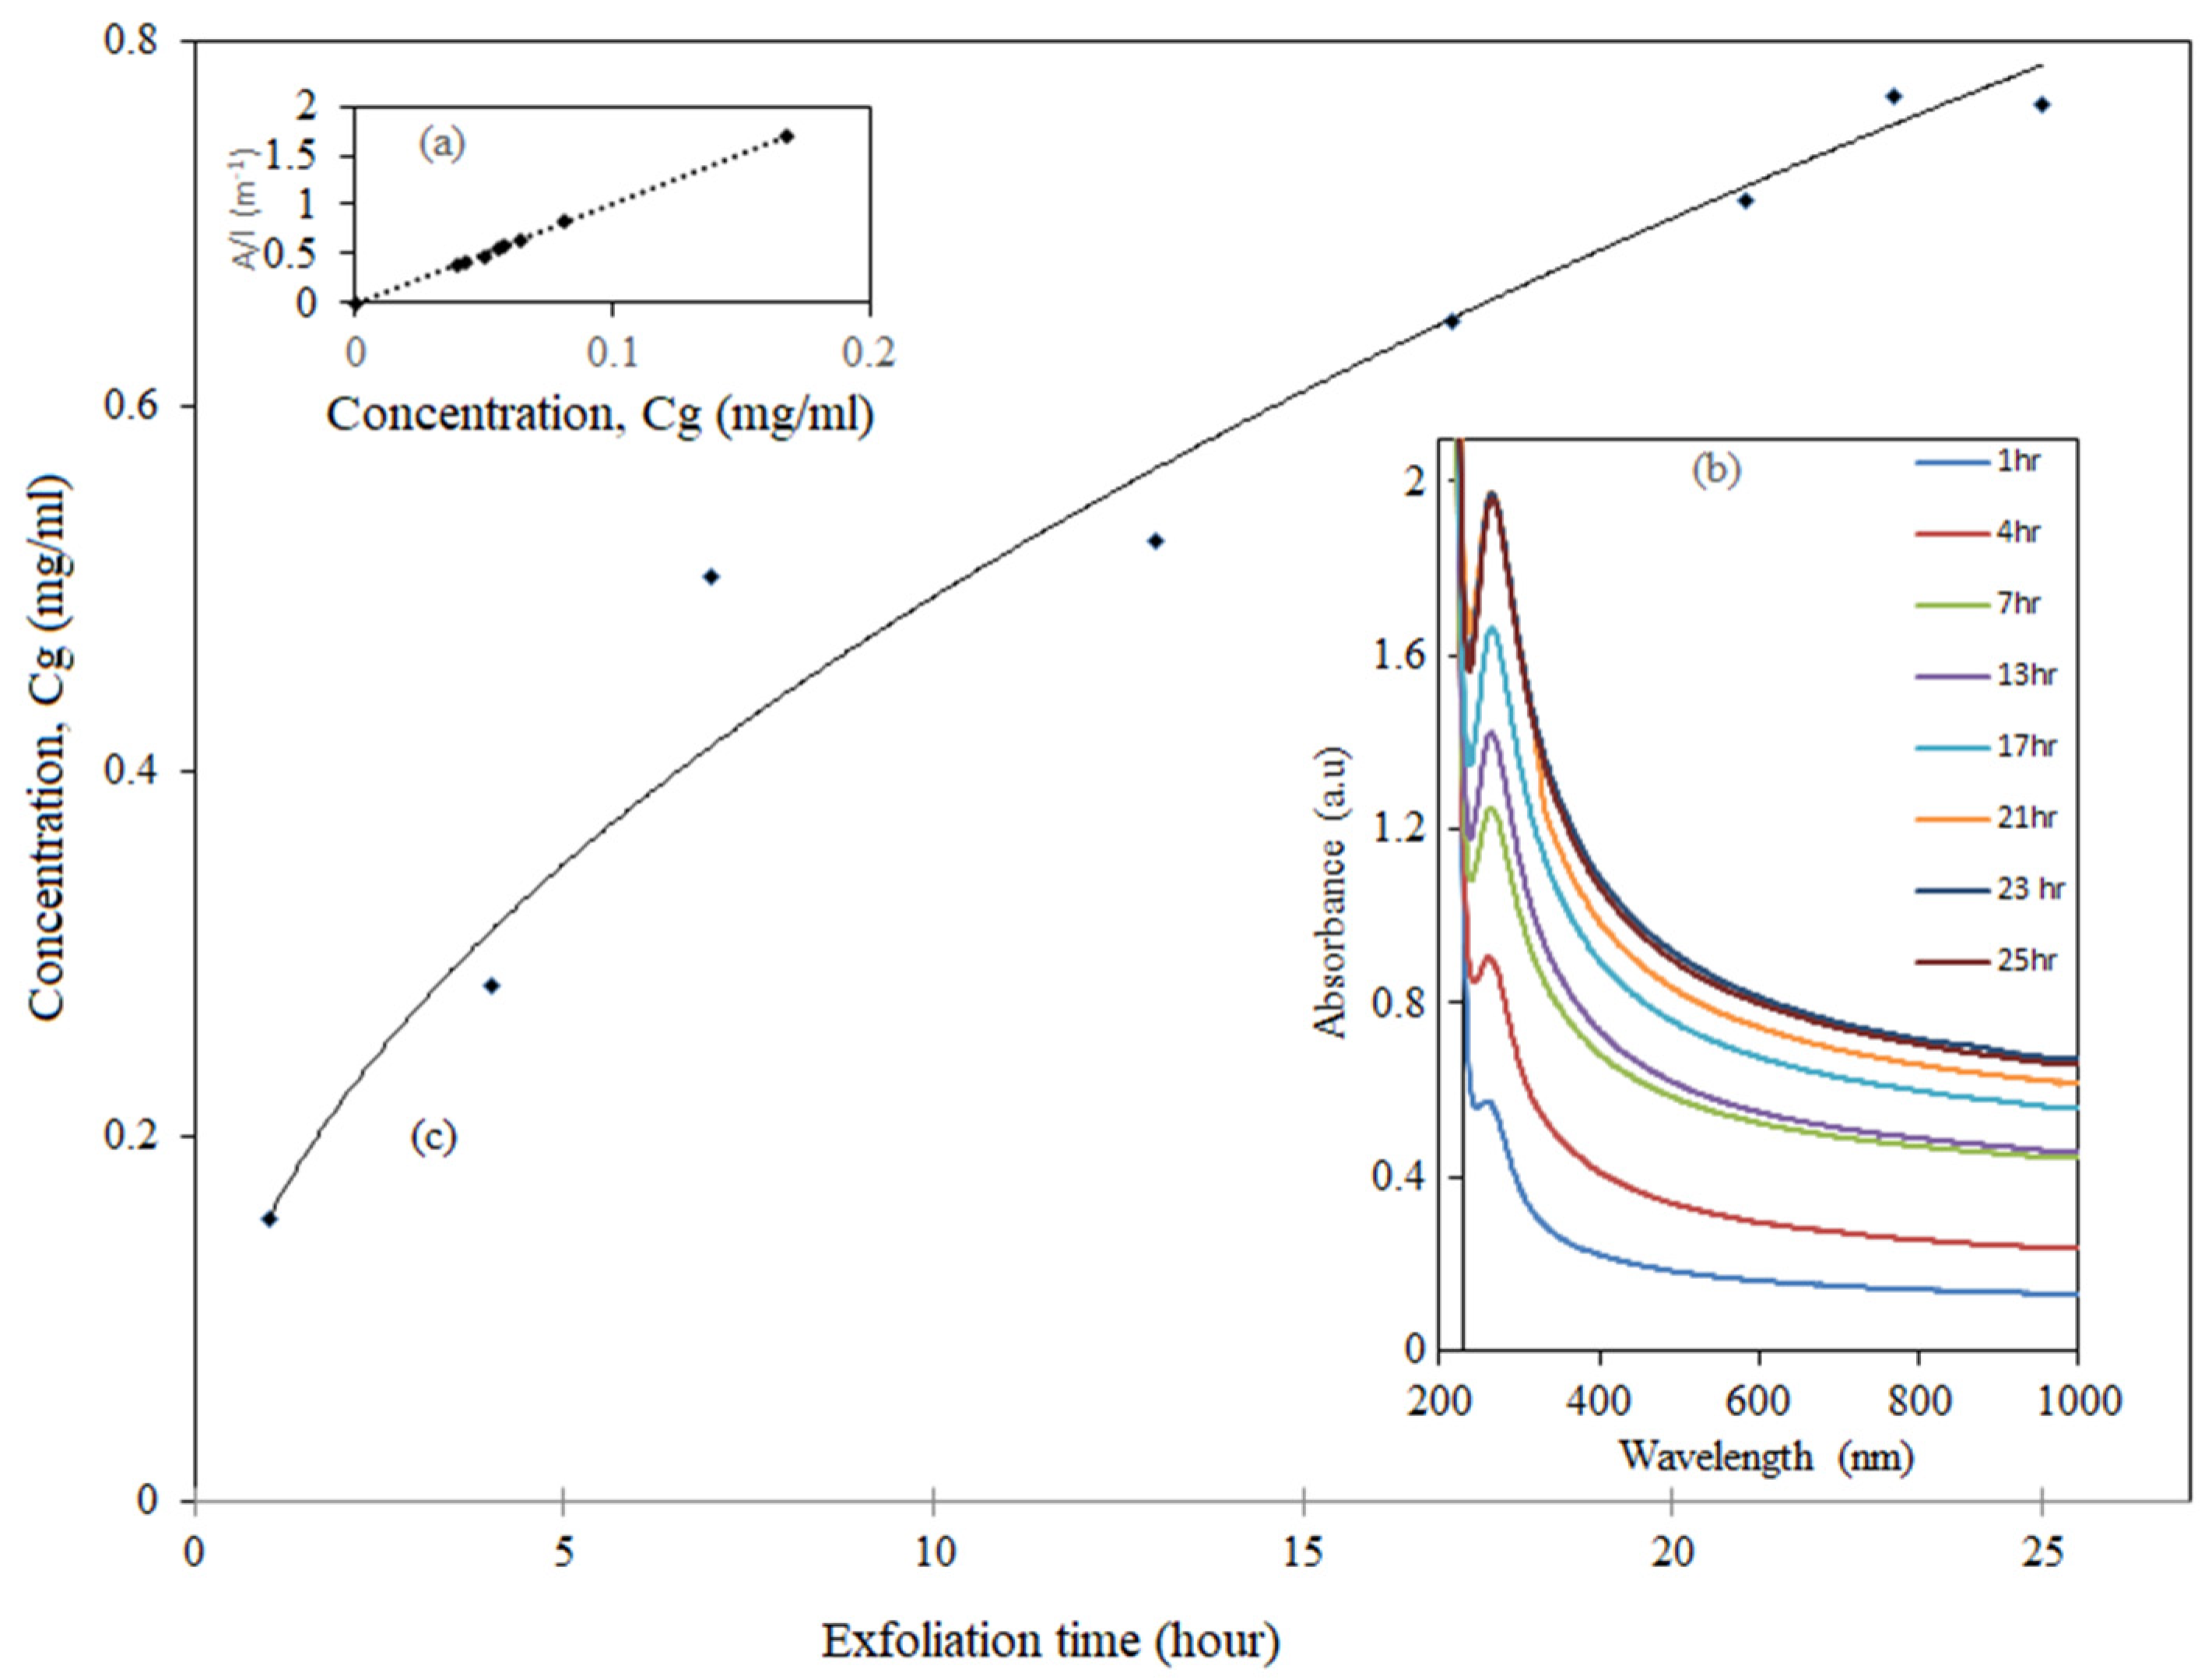
The graphene dispersion was confirmed by a red laser beam, which shows the typical Tyndall effect, proof of a homogeneous dispersion (Figure 1c,d). To quantify the concentration of the graphene dispersion, we measured the absorption coefficient, α from the known concentration of dry graphene powder (as shown in Figure 1b). A series of dilutions were performed to obtain the absorption peak of the known concentration of graphene. The absorbance per cell length, A/L (m−1) of those dispersions at 660 nm vs. concentration, Cg, was plotted to obtain the calibration curve. The mean value was found to be 1013 mL mg−1 m−1 (Figure 2a); this value is comparable to the other published values [28]. By using this absorption coefficient, the unknown concentrations were calculated and plotted.
After 1 h sonication, dark black graphene dispersions were achieved. The UV-vis spectrometer (Figure 2b) gives a strong peak at approximately 267 nm, which arises from π to π* transition around the K point of the Brillouin Zone; this is the characteristic peak for a graphene dispersion. In the visible range, the spectrum is featureless, contrary to other 2D materials, such as transition metal dichalcogenides [29,30,31]. The graphene concentration increases considerably with sonication time, from 0.16 mg/mL to 0.80 mg/mL (Figure 2c), closely following the Cg ∞ √t equation [32]. This trend can be attributed to the sonication effect on graphene dispersion. The graphene yield reported here is much higher compared to other research findings, which reported exfoliation by a bath-type sonicator [33]. The longer sonication time might remove the adsorbed surfactants from the graphene, leading to a decrease in the graphene concentration. It is reported that a longer sonication time is detrimental to both the size and quality of graphene [34,35].
3.2. Graphene Concentration as a Function of Surfactant Concentration (Cg vs. Cs)
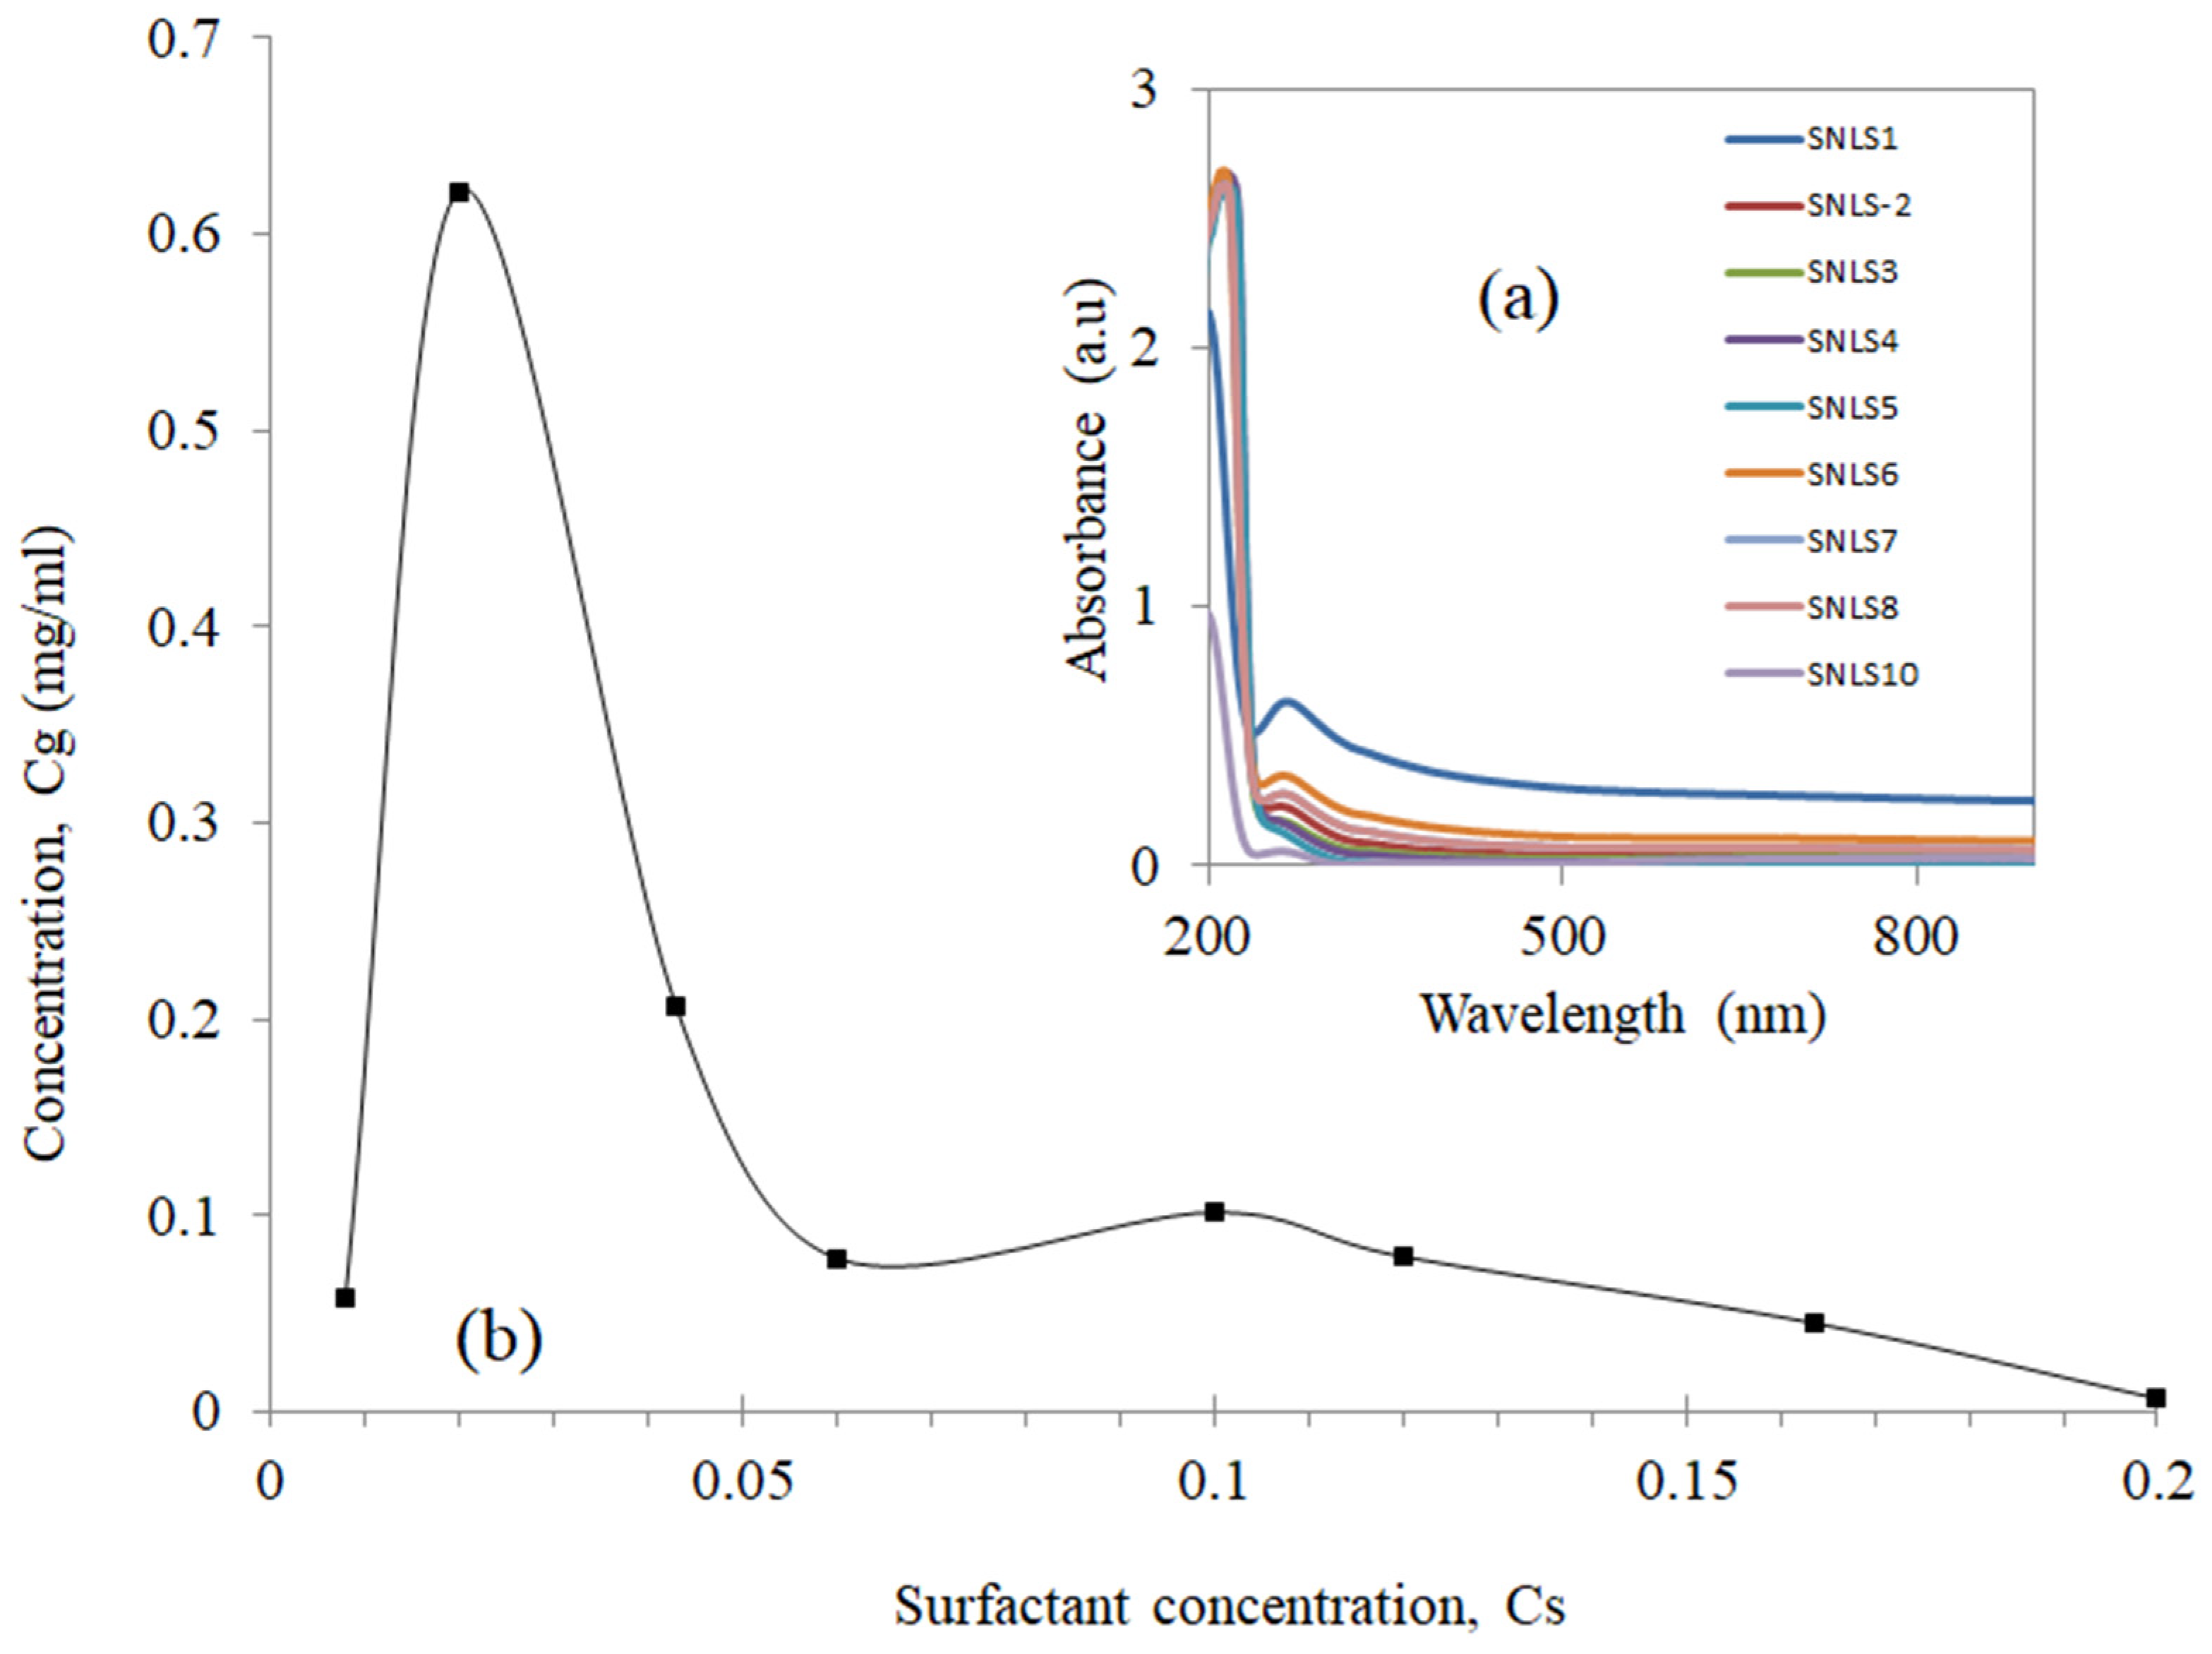
Surfactant concentration needs to be optimized to strongly interface the graphene surface, in order to separate from its bulk state and prevent aggregation into a spherical/rod-like micelle state. To achieve this, we prepared graphene dispersions with eight different surfactant concentrations (Cs) to determine effective surfactant concentration that allowed the highest graphene concentration (Figure 3a). By keeping a constant sonication time of 7 h in a 10 mL test tube, Cg was found to be as high as 0.6 mg/mL. However, with the same Cs and graphite ratio, the Cg value of 7-h sonication time was 0.5 mg/mL, which was prepared in a 400 mL beaker. This indicates that colloidal structure is sensitive to beaker size and shape. It is reported that the exfoliation rate in an aqueous surfactant solution is highest near the CMC of the surfactant [36]. The highest concentration of SNLS had the lowest graphene output (shown in Figure 3b); this property can be attributed to the self-assembling behavior of surfactant molecules. At the monomer concentration, the hydrophobic chain of surfactant molecules adsorbed on the graphene surface tends to face their polar head-groups, towards the aqueous phase. However, the second-highest concentration was achieved at the CMC. Above the CMC value, two phases were clearly visible. The higher the Cs value, the lower the Cg that was found in the dispersion because, at a higher concentration, the surfactant molecules have a higher probability of being transformed from spherical to rod-like micelles, which would force the graphene to restack into their bulk state [37,38,39].
At surfactant monomer concentration, the dispersion was stable for several months, but a higher surfactant concentration gave significant sedimentation. The solution provides a sufficient potential barrier among the neighboring graphite layers with their amide group, and thus prevents restacking; this behavior is in agreement with other reported results. The potential barrier arises from the hydration layer due to the hydrogen bonding formation between the hydrophilic head group and the water molecules and surfactant intermolecular hydrogen bonding. Besides this, the Na+ layers provide an additional electrostatic stabilization. The hydrogen bonding is stronger than the Van der walls force that keeps the graphite layers in crystallized form. Hence, this study indicates that the potential barrier can be maximized by using an amino acid surfactant, which can provide double the potential barriers.
3.3. Graphene Concentration as a Function of Centrifugation Frequency (Cg vs. Cf)
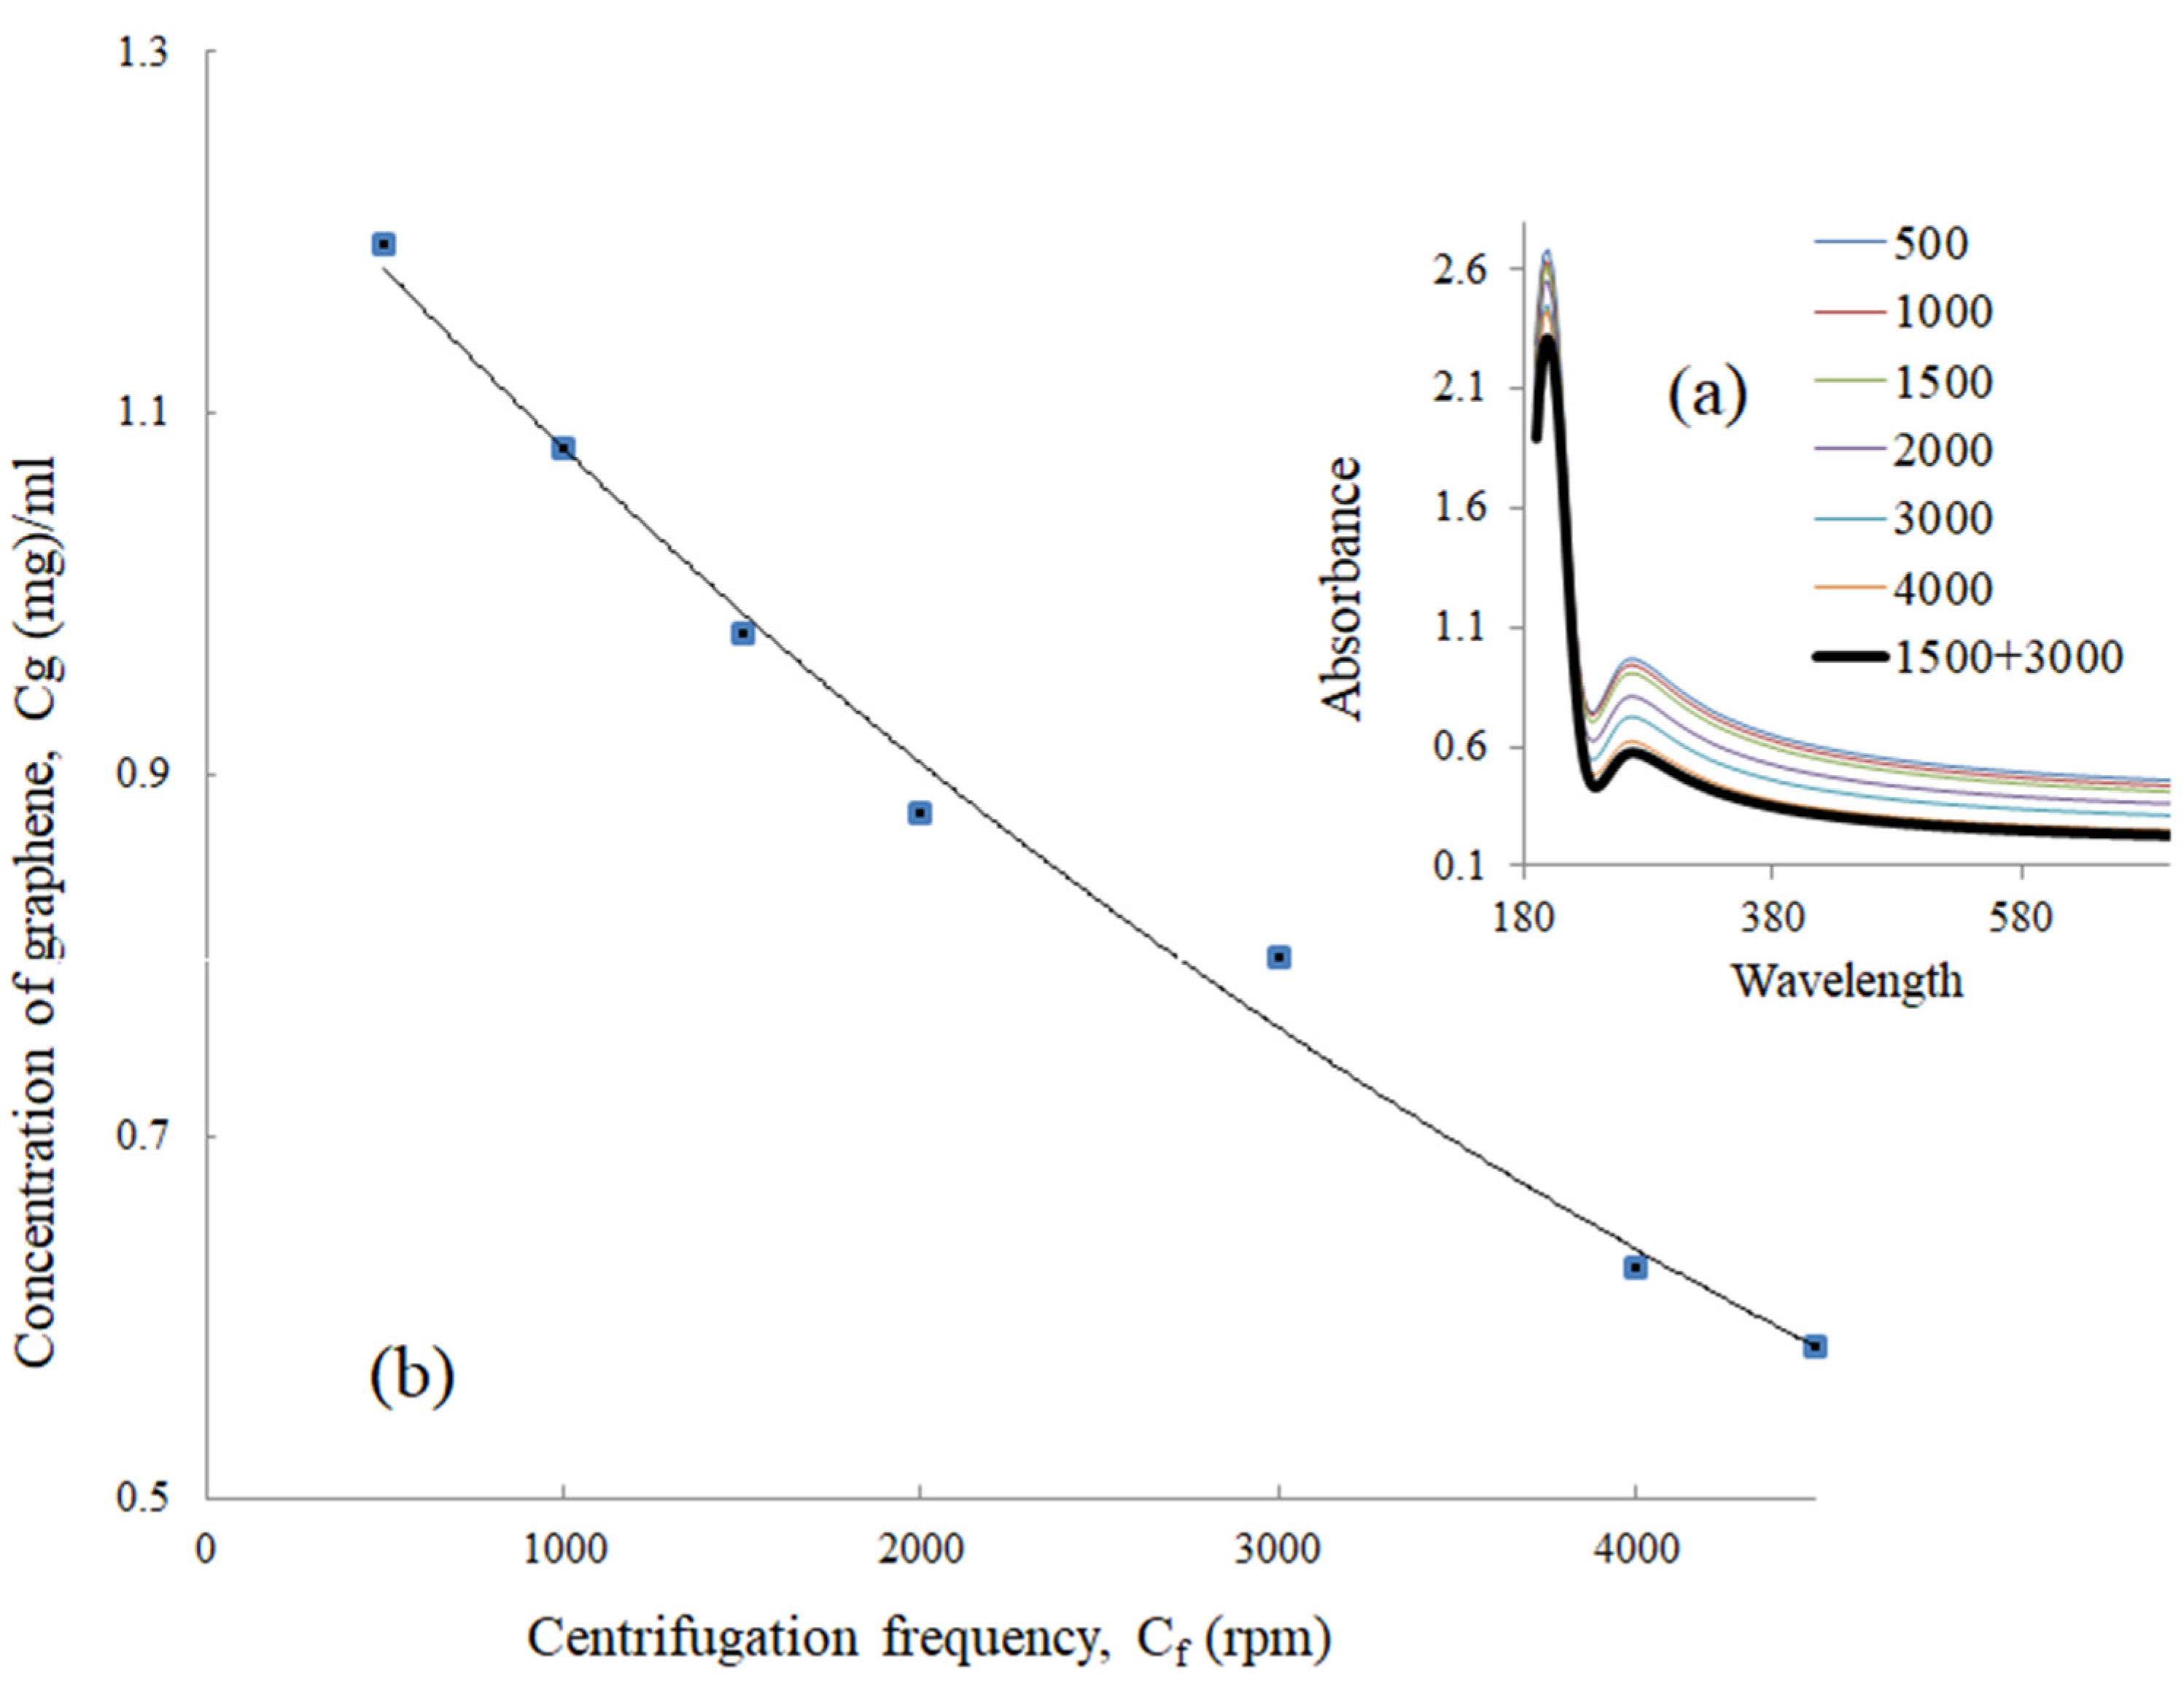
To ensure the high quality of graphene, we studied the effect of centrifugation rate on the dispersion. In all cases, the sample macroscopic appearance was very dark. Only the high dilution for the UV study shows a visible difference. From previous studies, it was found that the most-studied centrifugation frequencies for graphene dispersions were 500 rpm and 1500 rpm for 30 to 90 min, which could avoid any structural defect. We studied the effect of different centrifugation frequencies, ranging from 500 rpm to 4000 rpm, and also 1500 rpm followed by another 3000 rpm (both for half an hour), on the maximization of the sedimentation of unexfoliated graphite (Figure 4a). The concentration decreases monotonically with an increase in the frequency, as a higher frequency causes sedimentation of the larger flakes or removes the adsorbed surfactant molecules from the graphene structures that collapse the graphene sheets into the graphite (Figure 4b). The absorption peak at 200 nm is related to the N, O of the amide functional group of surfactant changes, proportionally with the π-π* transition that appeared at 267 nm, indicating that the changes in frequency do not deteriorate the adsorbed surfactant on the graphene sheets in the dispersed condition.
Although the double centrifugation Cf gave the minimum concentration, we selected this value as our final centrifugation rate to characterize via TEM, AFM, micro Raman, XRD, and the results are consistent with each other.
Despite the disadvantages of a bath-type sonicator, our system provides a much higher concentration of graphene than other reported results. Usually, poor intensity and a heating problem creates some disadvantages in bath-type sonication that are difficult to overcome, as the heating problem deteriorates when heat is transmitted through the sample. Above the melting temperature, the surfactant chain breaks down, thus collapsing the molecular symmetry. Moreover, another problem arises from the heating problem: the solvent vapor covers the cavitation bubbles, which weakens the sonication energy. However, the use of a probe sonicator as an improvement in bath sonication helps to reduce the time and enhance the yield, i.e., the probe sonication technique leads to a manifold increase in the yield [40].
3.4. XRD Analysis
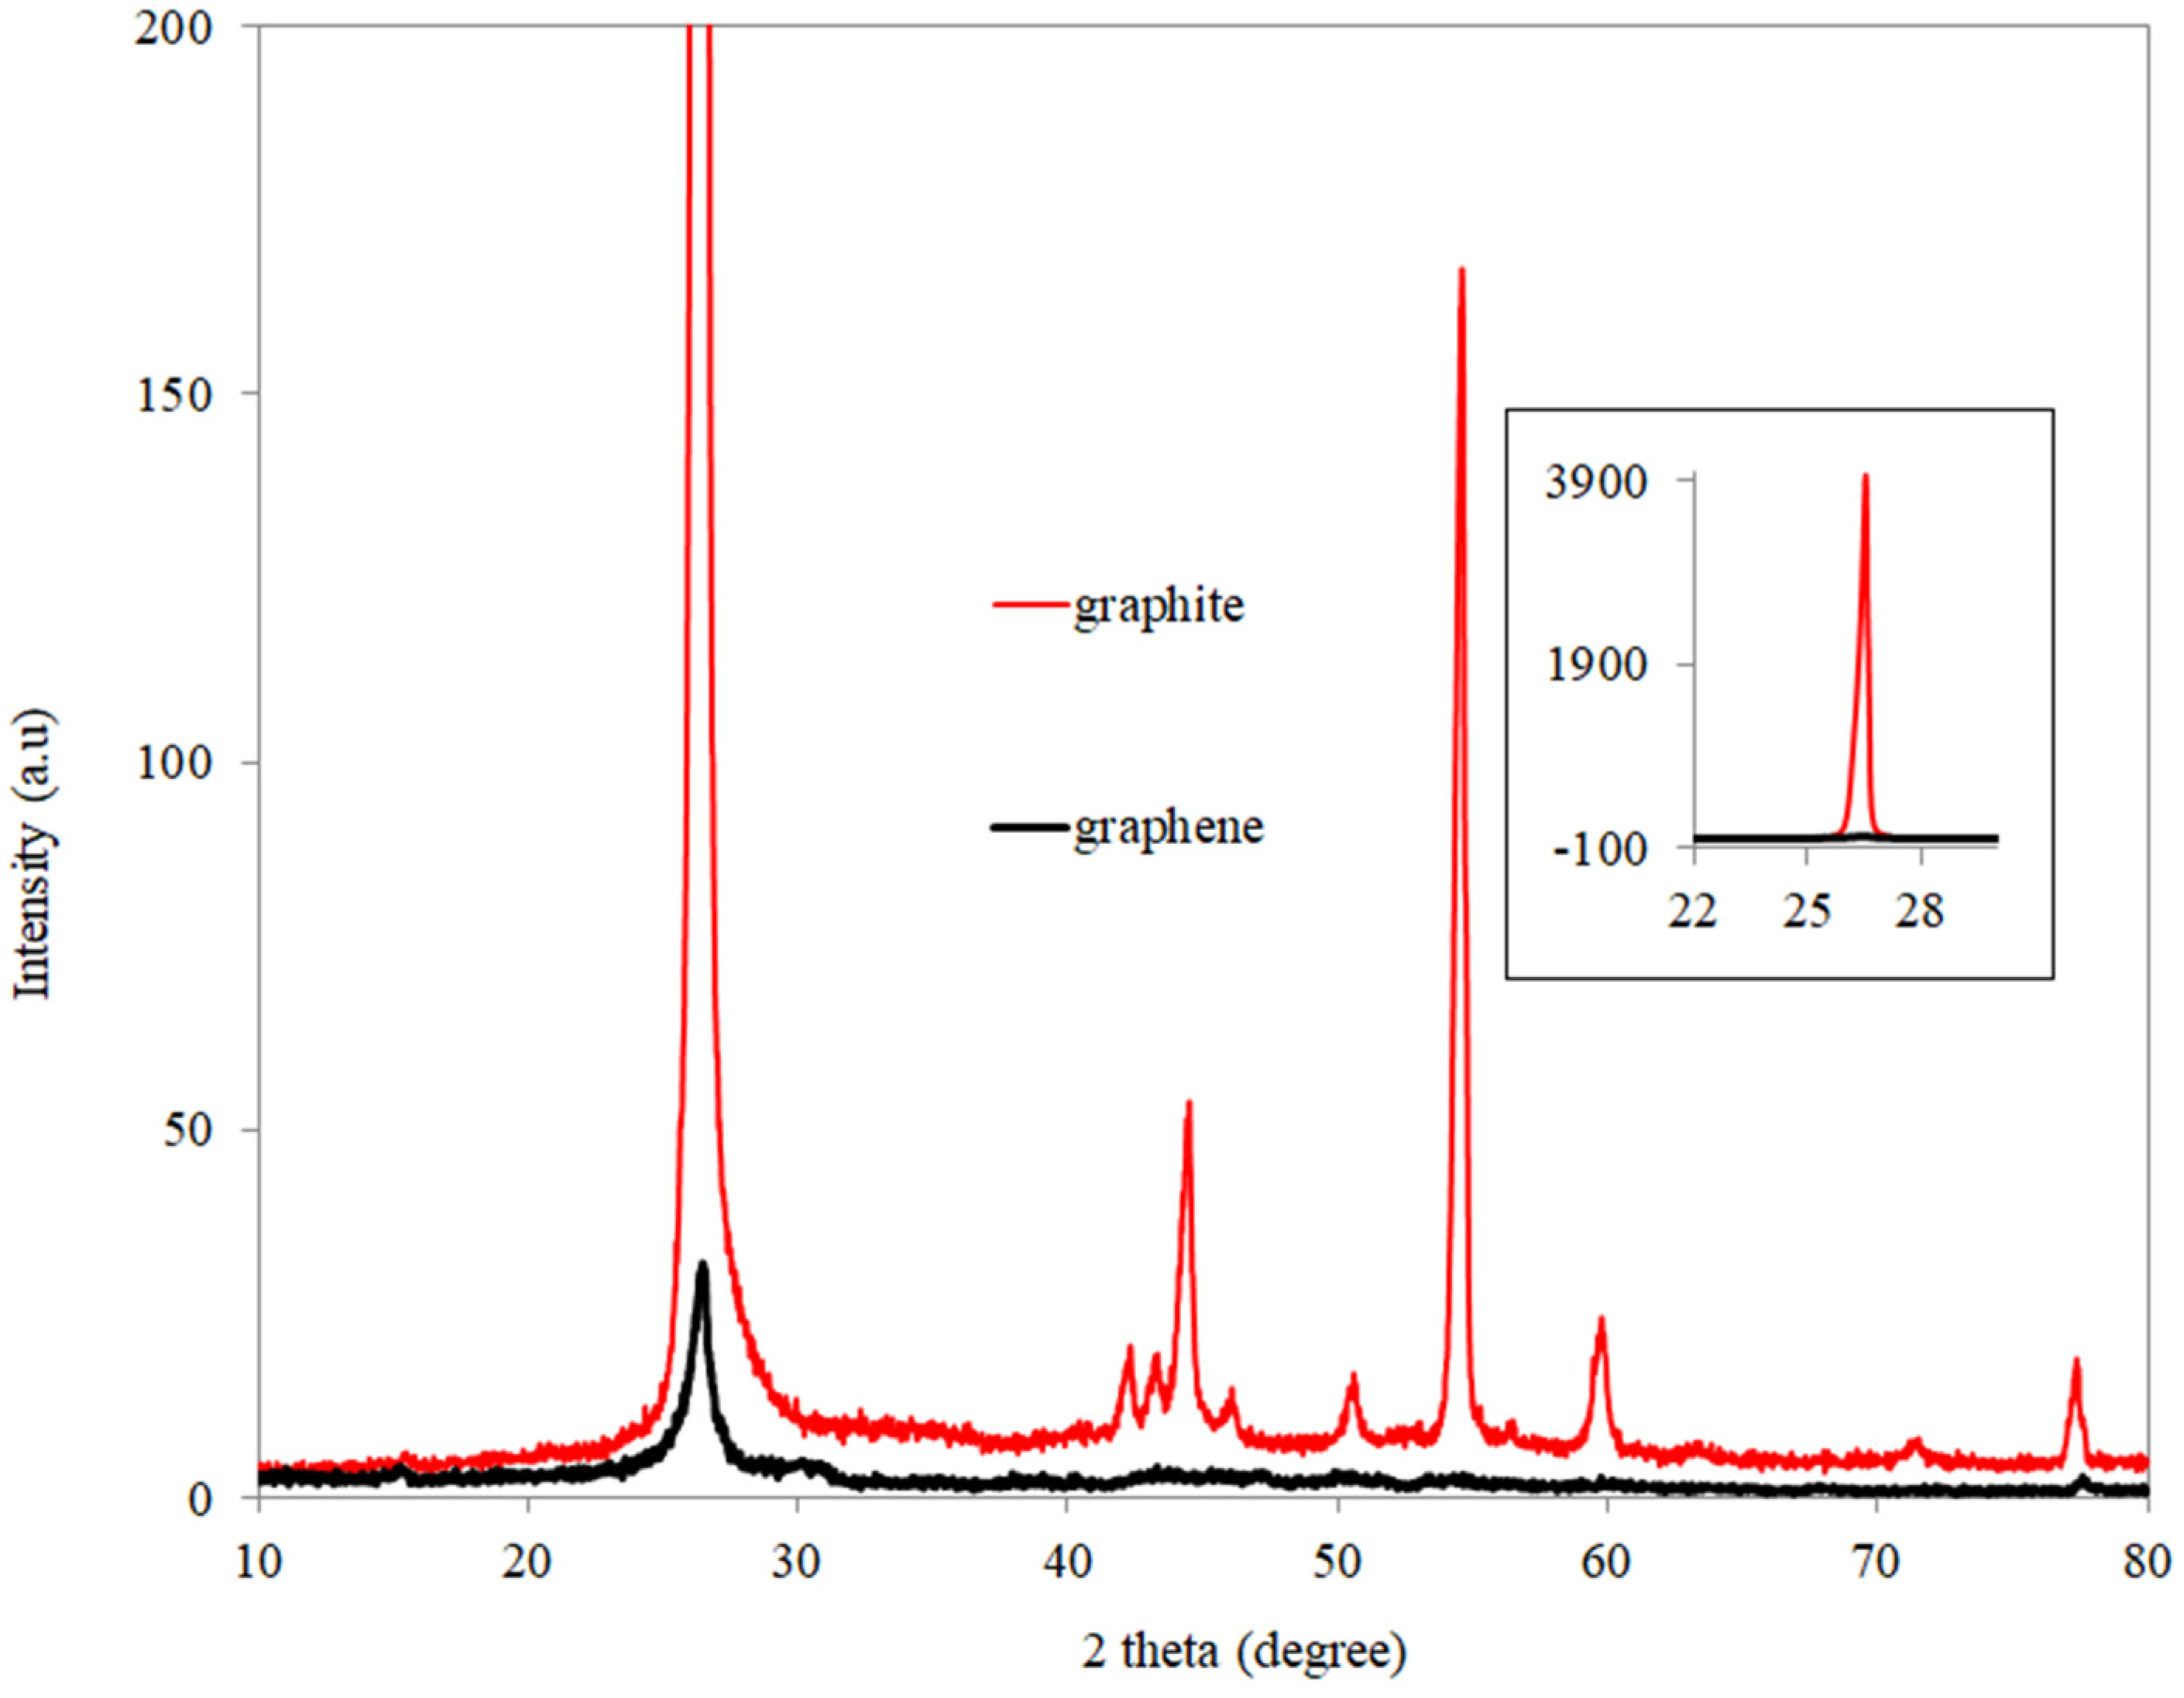
The dry graphene powder is black. Figure 5 shows its XRD pattern, corresponding to graphite and graphene (JCPDS 41-1487). The inset of this figure represents 100% intensity. The peak of graphene flakes at (002) is almost identical to that in graphite, indicating that, after drying, the surfactant monolayers are mostly removed, and the graphite lattice parameters are restored. However, the relative intensity of the peak decreased significantly from the graphite, while the other peaks disappeared from the exfoliated system. The intensity of the peak at 002 from the natural graphite is 132 times of that exfoliated graphene. This behavior is related to the poor ordering of the graphene nanosheets along their stacking direction, and reflects sonication results in well-exfoliated, few-layered graphene in an aqueous surfactant solution [41].
3.5. Characterization of Graphene Using TEM and AFM
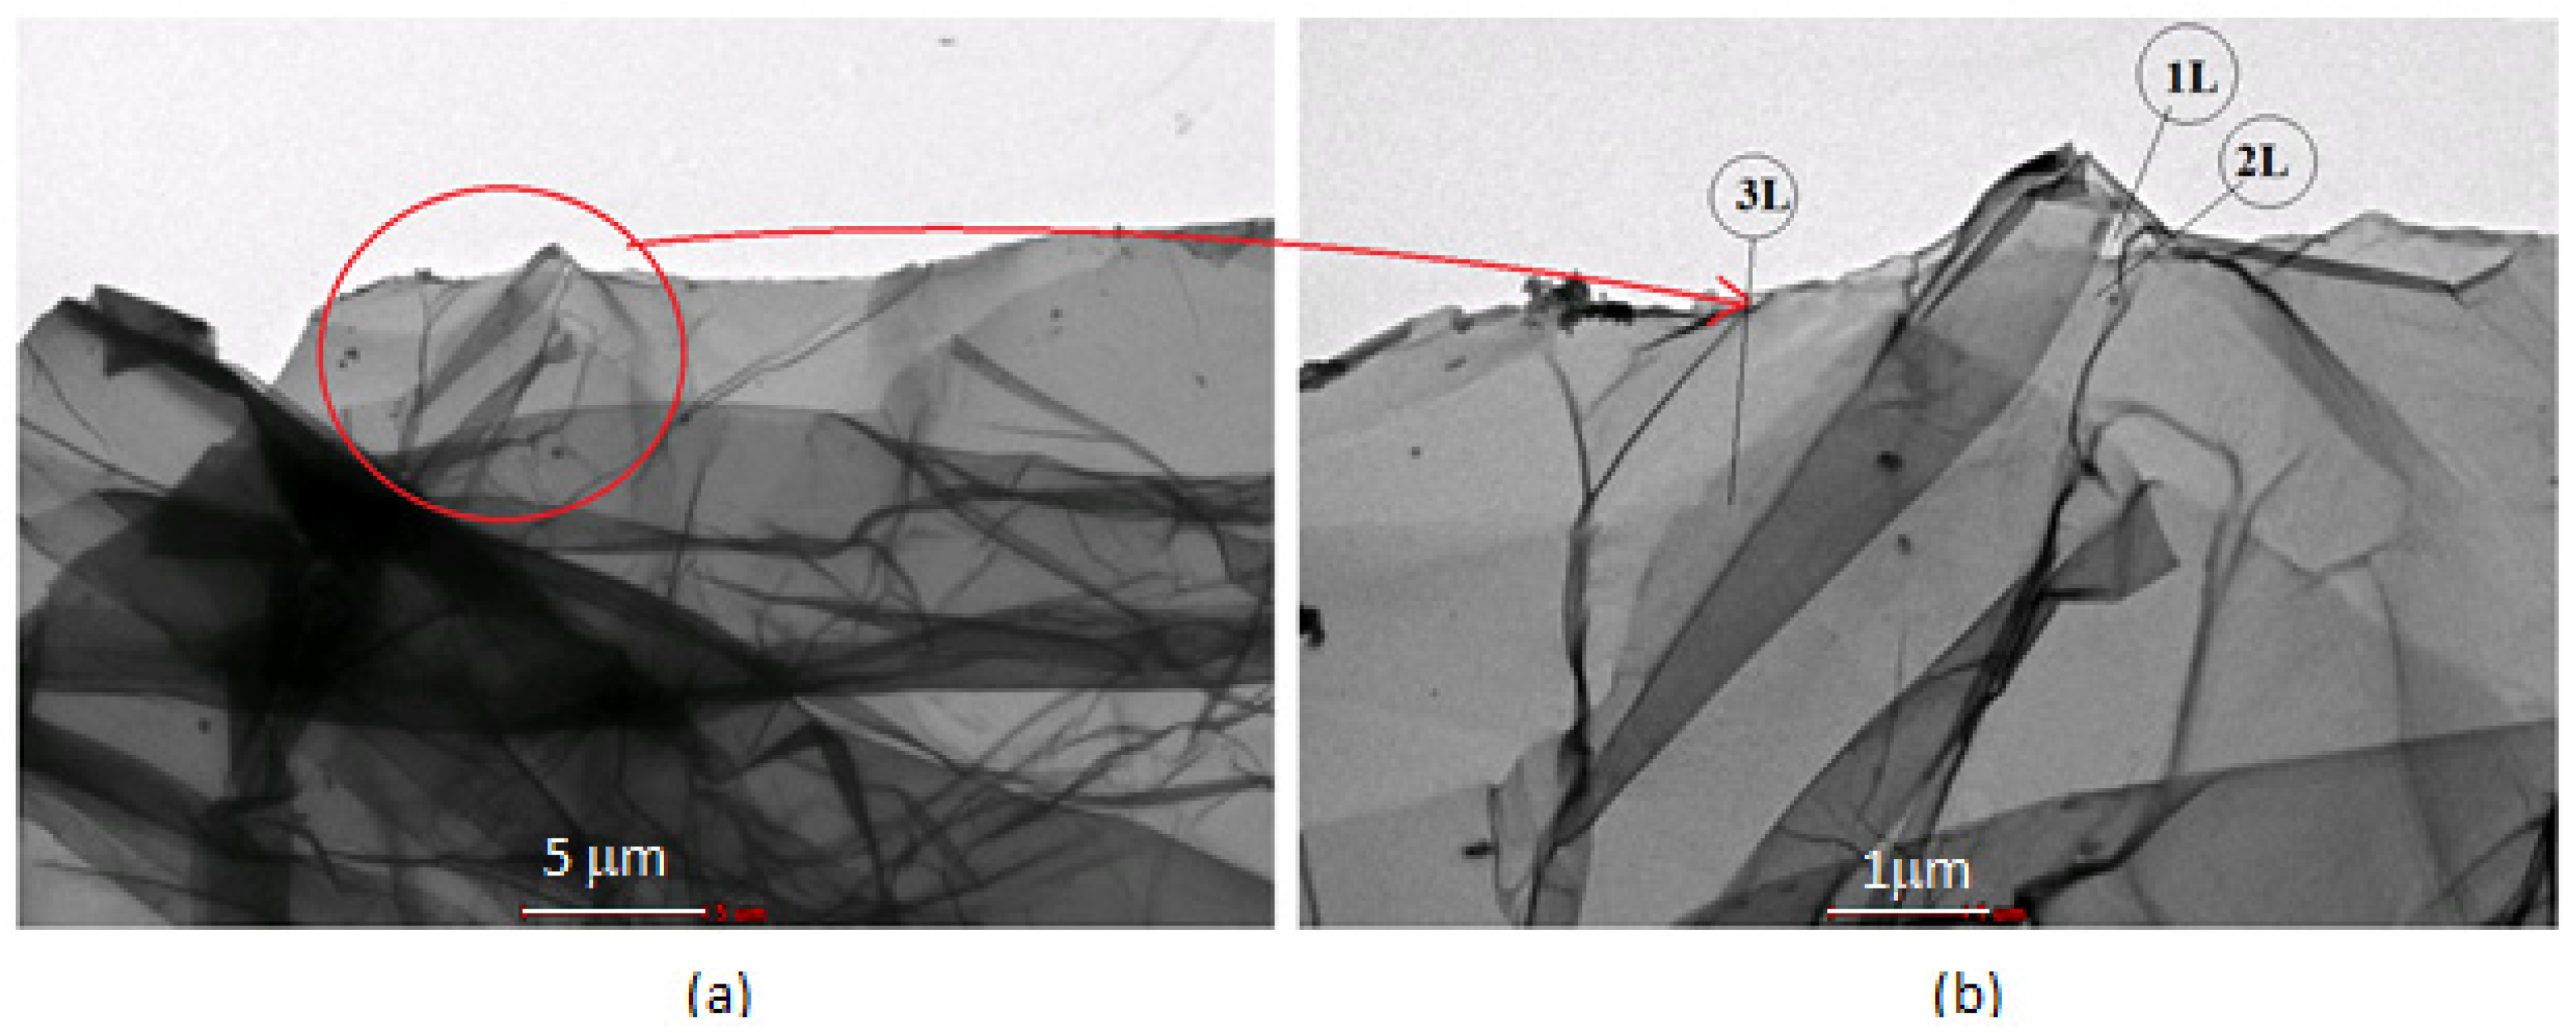
Figure 6a,b showed representative TEM images of the graphene sheets, adsorbed onto a copper grid covered with carbon film. The TEM images revealed that the graphene sheets were transparent under the electron beam and besides some folding, the layers were confirmed by TEM. However, the visibility of different layers through the 1 L layer suggest a very small thickness, with a large area. The transparency can be confirmed from 1 L, where the carbon grid is visible. The graphene flakes are very large, indicating that this system can produce larger flakes with sufficient stabilization, which is important for different applications. No smaller flakes or graphite aggregates were visible on the whole grid. We identified several foldings in the first picture, which is normal for a large sheet. We attributed this folding to the intermolecular hydrogen bonding between the head groups of the adsorbed surfactant on the graphene edge and that of its nearest basal plane in the aqueous solution.
To gather information on the morphology and thickness of the exfoliated graphene through AFM analysis, we prepared our AFM sample with the dip-coating method. A freshly cleaved mica substrate was dipped down on the diluted dispersion of graphene for 5 min, then dried on a hot plate. After drying the dispersion, the mica plate was washed three times to remove the soap molecules and the unadsorbed graphene. As the amount of deposited material was low enough, we observed individual layers. Figure 7a represents a topographic image of the graphene, where one edge with three pronounced layers of stacking is noticeable; the area is marked by a rectangle. Figure 7b shows the 2–3-layer stacking with a smooth surface. The step height of the individual layers that are visible is 0.6–0.7 nm, with very well-defined edges (Figure 7c,d), which matches the reported results [42,43]. The thickness of the graphene layers might vary due to different factors, such as humidity, chemical contrast, adsorbed additives, and the rough surface of mica [44,45]. The AFM topographic image, together with the TEM image, supported the exfoliation of few-layered graphene with a large, wrinkle-free surface area. As in the TEM image, several foldings are visible in the area marked with an arrow.
3.6. Raman Characteristics
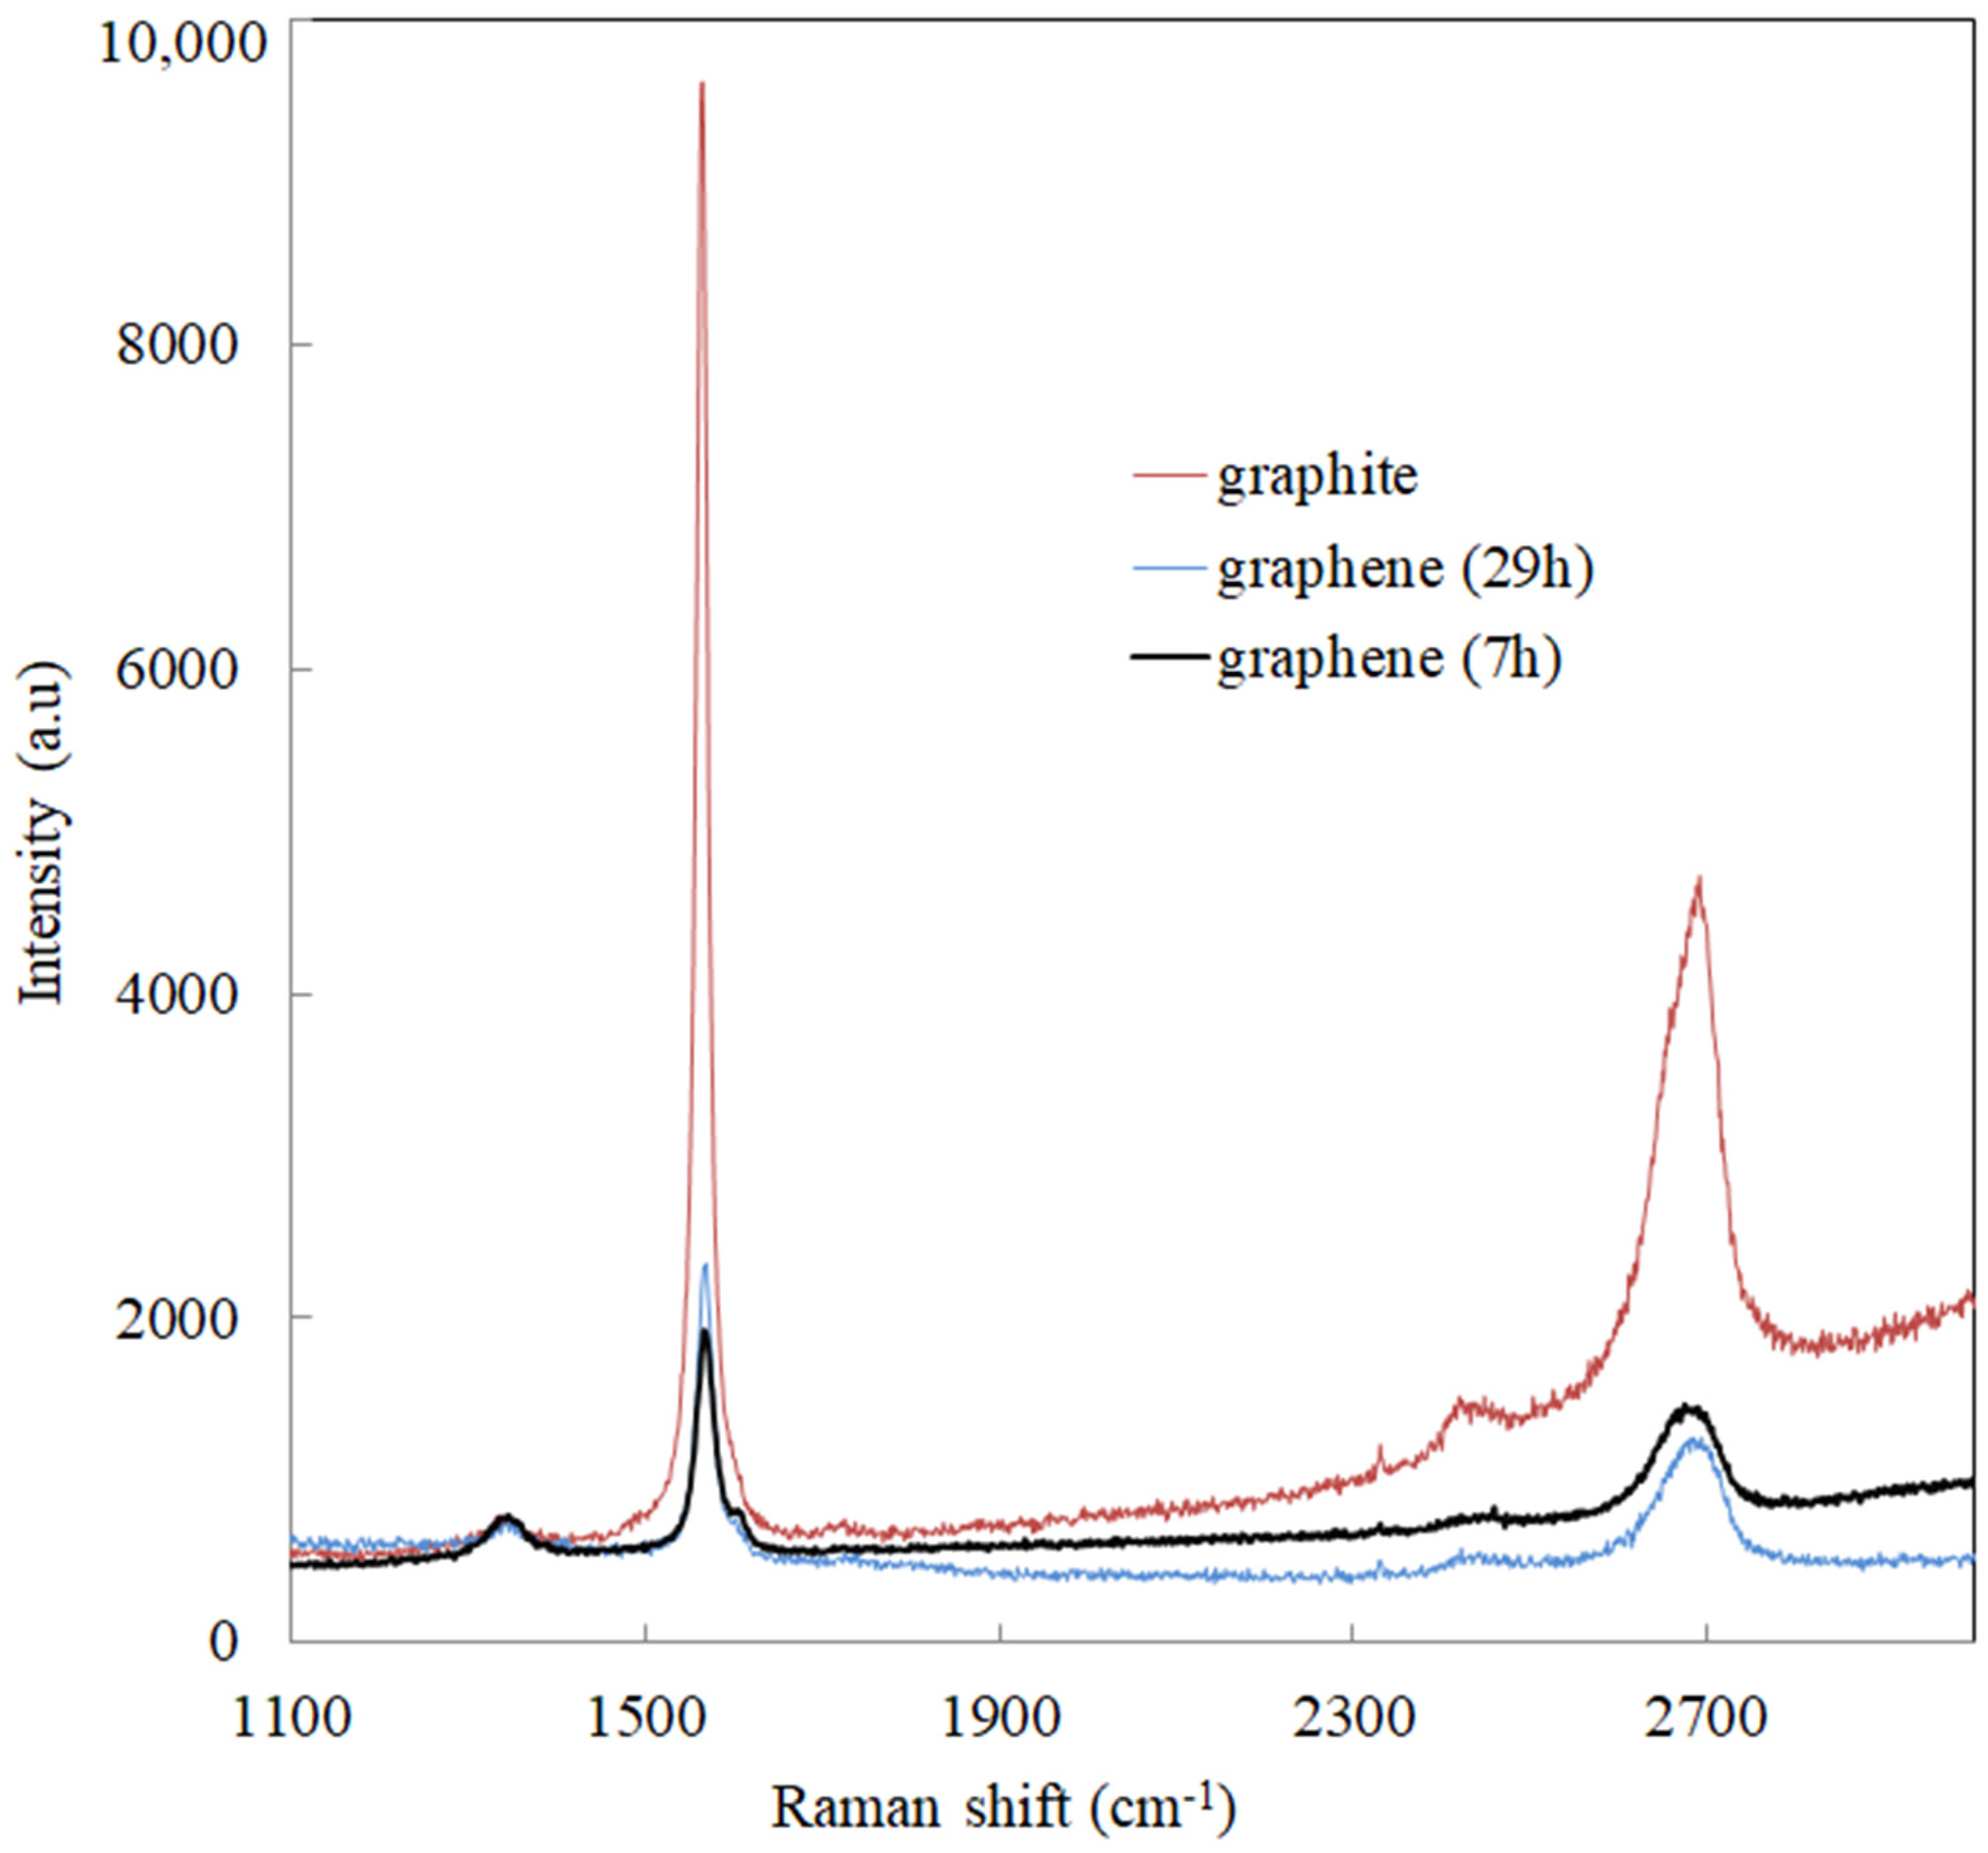
Raman is another important characterization method, which provides important information about the crystalline structure, stacking order, and defects of the layered matters. We used this method to further characterize the graphite materials; the spectra of graphitic materials are characterized by a D-band at 1350 cm−1, the G-band appears at 1565 cm−1, and a 2D band appear at 2700 cm−1. As in the starting graphite powder, a similar D-band (1350 cm−1) is observed for the exfoliated graphene, with similar intensity (Figure 8). The D peak is attributed to the structural imperfections, while the G peak is related to the doubly degenerate (iTO and LO) phonon mode (E2g symmetry), with a relative motion of sp2 bonded C-C atoms [46,47]. A small upshifting of the G band (7 cm−1) with reduced peak intensity is observed in the case of exfoliated graphene, indicating the reduced crystalline structure of graphene, which modified the C-C bond vibrations [48,49]. A small D′ band has also appeared in the exfoliated graphene. The ratio between I (D) and I (D′) was used to obtain information on the nature of the defects. We would like to establish that the D and D’ signals mainly originate from sample edges or other defects created by sonication power in the surfactant solution. It is reported that the ratio of ID/ID′ is (≃13) for defects associated with sp3 hybridization, (≃7) vacancy-like defects, and (≃3.5), related to boundary-like defects in graphite [48]. The 7 h and 29 h graphene flakes nearly showed the same ID/ID′ ratio, which varied from 0.97 to 0.99, much smaller than the above-mentioned defects related to sp3 hybridization, or vacancy-like defects. Therefore, we can rule out any of these disorders and attribute this defect to the graphene boundary/edges. The ID/IG ratio of the graphite and graphene samples was found to be 0.082, 0.4, and 0.3 for 7 h and 29 h samples. The increasing value of ID/IG is an indication of a low edge defect rather than a basal plane defect that arises from sonication. This result is consistent with the findings reported for sonication-based exfoliated graphene systems elsewhere [50,51]. Sonication almost gave the same defect ratio for these samples, indicating that the longer sonication did not significantly deteriorate the graphite structure. The UV result also shows a nearly constant exfoliation rate after 20 h sonication. The UV result of the sonication time effects shows that the graphene concentration decreases with time, which implies the decreasing edges of individual graphene layers. The graphene concentrations change following a second-order polynomial rule for the exfoliation rate, leading to changes in the D peak, where the edges act as defects. We found that the D peak in the exfoliated graphene increases from the base material with the sonication time, and then decreases again. Therefore, we can conclude that the D peak is an outcome of the increasing amount of exfoliated graphene. It is reported that carboxylate groups promote exfoliation even in poor solvent [52].
The number of layers in this system can also found from the I2D/IG ratio. The ratio for graphite is 0.46, and, for graphene, the ratio varies between 0.6 and 0.7, a signature of three-layer graphene [53]. The final peak is a 2D band at around 2700 cm−1, ascribed to a breathing-like mode of graphene in-plane lattice. The shape and position of the 2D-band of this graphene changed from that of graphite, and downshifted from 2690 cm−1 to 2679 cm−1. Many reports indicate that the 2D peak position of single-layer graphene appears at about 2679 cm−1; however, our TEM and AFM images show from two to three layers. Thus, we considered our system to be few-layered graphene. The downward shifting of the wavenumber is consistent with other research findings, which correspond to few-layer graphene [19]. The asymmetric shape of the 2D band typical of graphite is lost, a good sign of effective exfoliation, since the restacking of individual graphene layers does not correspond to the ordered stacking in graphite. Moreover, the FWHM width is approximately 70 cm−1 and this value indicates the formation of few-layered graphene [54,55,56].
4. Conclusions
Considering the graphene’s potential in different applications, it is important to find an easy, environmentally friendly, and cost-effective technique to produce large quantities of high-quality graphene using available resources. In this work, graphene dispersion in water is reported using an amino-acid-based biosurfactant, which is commonly used in toothpaste, mouthwash, and drug delivery. The system yields 1.2 mg/mL of graphene within a 7 h sonication time (500 rpm). The sonication easily breaks down the Van der Walls force between the graphite layers with an optimum concentration of aqueous surfactant solution. The monomer concentration of this surfactant gives the highest concentration of graphene, and the macroscopic appearance remains stable for several months. The absence of a micelle-like structure gives them stability in monomer concentrations. The sheet-like morphologies of the FLG stacking were evident in the AFM topographic image, where the edge of folded graphene clearly shows three layers. The TEM and AFM results are in full agreement. The broad XRD peak, with reduced graphene powder intensity, also implies the poor ordering of the FLG sheets along their staking direction. The Raman spectra show a very small defect ratio for our powdered graphene samples. Analyzing the 2D band of the Raman spectrum provides evidence of a 2–3-layer graphene, which confirms the conclusions we drew from our previous experiments. Using the same technique, a preliminary study was also carried out on graphene–Molybdenum disulfide (MoS2) hybridization at room temperature; the morphologies were studied using the same characterization methods. The initial analysis confirmed the structure of this 2D layered composite material. The results will be published in the future. Therefore, it is expected that the new system we demonstrated will enable the exfoliation of stable graphene for multiple applications.
Author Contributions
Conceptualization, N.A. and S.R.; methodology, N.A. and S.R.; software, N.A. and M.U.K.; validation, M.T.M.A. and M.U.K.; formal analysis, N.A.; investigation, N.A.; resources, S.R. and M.T.M.A.; data curation, N.A.; writing—original draft preparation, N.A.; writing—review and editing, M.U.K.; visualization, H.O. and S.A.; supervision, S.R. and M.T.M.A.; project administration, S.R. and M.T.M.A.; funding acquisition, H.O. and S.A. All authors have read and agreed to the published version of the manuscript.
Funding
The APC was funded by Taif University researchers supporting project number (TURSP-2020/287), Taif, Saudi Arabia.
Institutional Review Board Statement
Not Applicable.
Informed Consent Statement
Not Applicable.
Data Availability Statement
All data are available in the manuscript.
Acknowledgments
The authors would like to thank the University of Kebangsaan Malaysia for providing the lab facilities in doing this work. Also, we deeply acknowledge Taif University for supporting the researchers through Taif University Researchers Supporting Project number (TURSP-2020/287), Taif University, Taif, Saudi Arabia.
Conflicts of Interest
There are no conflicts of interest to declare.
References
- Nguyen, B.H.; Nguyen, V.H. Promising applications of graphene and graphene-based nanostructures. Adv. Nat. Sci. Nanosci. Nanotechnol. 2016, 7, 23002. [Google Scholar] [CrossRef] [Green Version]
- Radich, J.G.; McGinn, P.J.; Kamat, P.V. Graphene-based composites for electrochemical energy storage. Electrochem. Soc. Interface 2011, 20, 63–66. [Google Scholar] [CrossRef] [Green Version]
- Justino, C.I.L.; Gomes, A.R.; Freitas, A.C.; Duarte, A.C. Graphene-based sensors and biosensors T.A.P. Rocha-Santos. TrAC Trends Anal. Chem. 2017, 91, 53–66. [Google Scholar] [CrossRef]
- Liu, C.H.; Chang, Y.; Norris, T.B.; Zhong, Z. Graphene photodetectors with ultra-broadband and high responsivity at room temperature. Nat. Nanotech. 2014, 9, 273–278. [Google Scholar] [CrossRef]
- Tong, Y.; Bohmb, S.; Song, M. Graphene-based materials and their composites as coatings. Austin. J. Nanomed. Nanotechnol. 2013, 1, 1003. [Google Scholar]
- Liu, J.; Cui, L.; Losic, D. Graphene, and graphene oxide as new nanocarriers for drug delivery applications. Acta Biomater. 2013, 9, 9243–9257. [Google Scholar] [CrossRef]
- Shen, H.; Zhang, L.; Liu, M.; Zhang, Z. Biomedical applications of graphene. Theranostics 2012, 2, 283. [Google Scholar] [CrossRef] [Green Version]
- Ismail, Z.; Abdullah, A.H.; Abidin, A.S.Z.; Yusoh, K. Production of functional graphene by kitchen mixer: Mechanism and metric development for in situ measurement of sheet size. J. Nanostruct. Chem. 2017, 7, 231–242. [Google Scholar] [CrossRef]
- Güler, O.; Güler, S.H.; Selen, V.; Albayrak, M.G.; Evin, E. Production of graphene layer by liquid-phase exfoliation with low sonication power and sonication time from synthesized expanded graphite. Fuller. Nanotub. Carbon Nanostruct. 2015, 24, 123–127. [Google Scholar] [CrossRef]
- Xu, J.; Dang, D.K.; Tran, V.T.; Liu, X.; Chung, J.S.; Hur, S.H.; Choi, W.M.; Kim, E.J.; Kohl, P.A. Liquid-phase exfoliation of graphene in organic solvents with addition of naphthalene. J. Colloid Interface Sci. 2014, 418, 37–42. [Google Scholar] [CrossRef] [PubMed]
- Wei, L.W.; Nong, W.J. Direct exfoliation of graphene in organic solvents with addition of “NaOH”. Chem. Commun. 2011, 47, 6888–6890. [Google Scholar]
- Wencheng, D.; Jie, L.; Peipei, S.; Yinyan, Z.; Xiaoqing, O. Organic salt-assisted liquid-phase exfoliation of graphite to produce high-quality graphene. J. Chem. Phys. Lett. 2013, 198, 568–569. [Google Scholar]
- Deshmukh, K.; Khatake, S.M.; Joshi, G.M. Surface properties of graphene oxide reinforced polyvinylchloride nanocomposites. J. Polym. Res. 2013, 20, 286. [Google Scholar] [CrossRef]
- Wang, Z.-D.; Inagaki, M. Stage Formation of Graphite Intercalation Compounds in Molten Salts. J. Mater. Chem. 1992, 2, 629–632. [Google Scholar] [CrossRef]
- Coleman, J.N. Liquid exfoliation of Defect-free graphene. Acc. Chem. Res. 2013, 46, 14–22. [Google Scholar] [CrossRef]
- Nicolosi, V.; Chhowalla, M.; Kanatzidis, M.G.; Strano, M.S.; Coleman, J.N. Liquid exfoliation of layered materials. Science 2013, 340, 1226419. [Google Scholar] [CrossRef] [Green Version]
- Creighton, J.R.; Ho, P. Introduction to chemical vapor deposition (CVD). Chem. Vap. Depos. 2001, 2, 1–22. [Google Scholar]
- Hunt, A.T.; Pohl, M. Combustion chemical vapor deposition (CCVD). In Chemical Vapor Deposition; Surface Engineering Series; Park, J.-H., Sudarshan, T.S., Eds.; ASM International: Materials Park, OH, USA, 2001; Volume 2, pp. 81–102. [Google Scholar]
- Lotya, M.; Hernandez, Y.; King, P.J.; Smith, R.J.; Nicolosi, V.; Karlsson, L.S.; Blighe, F.M.; De, S.; Wang, Z.; McGovern, I.T.; et al. Liquid phase production of graphene by exfoliation of graphite in surfactant/water solutions. J. Am. Chem. Soc. 2009, 131, 3611–3620. [Google Scholar] [CrossRef] [Green Version]
- Gupta, A.; Eral, H.B.; Hatton, T.A.; Doyle, P.S. Nanoemulsions: Formations, properties, and applications. Soft Matter 2016, 12, 2826–2841. [Google Scholar] [CrossRef] [Green Version]
- Hanno, I.; Centini, M.; Anselmi, C.; Bibiani, C. Green cosmetic surfactant from rice: Characterization and application. Cosmetics 2015, 2, 322–341. [Google Scholar] [CrossRef]
- Chen, D.; Li, Z.; Wan, Y.; Tu, X.; Shi, Y.; Chen, Z.; Shen, W.; Yu, C.; Tua, B.; Zhao, D. Anionic surfactant induced mesophase transformation to synthesize highly ordered large-pore mesoporous silica structures. J. Mater. Chem. 2006, 16, 1511–1519. [Google Scholar] [CrossRef]
- Ranieri, D.; Preisig, N.; Stubenrauch, C. On the Influence of Intersurfactant H-bonds on Foam Stability: A Study with Technical Grade Surfactants. Tenside Surf. Det. 2018, 55, 1. [Google Scholar] [CrossRef]
- Akter, N.; Radiman, S.; Mohamed, F.; Rahman, I.A.; Reza, M.I.H. Ternary phase and vesicle formation of a sodium Nlauroylsarcosinate hydrate/1-decanol/water system. Sci. Rep. 2011, 1, 71. [Google Scholar] [CrossRef]
- Ambühl, M.; Bangerter, F.; Luisi, P.L.; Skrobal, P.; Watzke, H.J. Configurational changes accompanying vesiculation of mixed single-chain amphiphiles. Langmuir 1993, 9, 36–38. [Google Scholar] [CrossRef]
- Ghosh, S.; Dey, J. Interaction of sodium N-lauroyl sarcosinate with N-alkyl pyridinium chloride surfactants: Spontaneous formation of pH-responsive, stable vesicles in aqueous mixtures. J. Colloid Interface Sci. 2011, 358, 208–216. [Google Scholar] [CrossRef]
- Akter, N.; Radiman, S. Effect of polyethylene glycol-2000 on amino acid surfactant-based vesicles. Colloid Polym. Sci. 2014, 292, 1619–1625. [Google Scholar] [CrossRef]
- Nuvoli, D.; Valentini, L.; Alzari, V.; Scognamillo, S.; Bon, S.B.; Piccinini, M.; Illescasd, J.; Mariani, A. High concentration few-layer graphene sheets obtained by liquid-phase exfoliation of graphite in ionic liquid. J. Mater. Chem. 2011, 21, 3428–3431. [Google Scholar] [CrossRef]
- Choi, W.S.; Lee, Y.B.; Noh, Y. Production of graphene by exfoliation of graphite in a volatile organic solvent. Nanotechnology 2011, 22, 365601. [Google Scholar] [CrossRef] [PubMed]
- Kravets, V.G.; Grigorenko, A.N.; Nair, R.P.; Blake, P.; Anisimova, S.; Novoselov, K.S.; Geim, A.K. Spectroscopic ellipsometry of graphene and an exciton-shifted van Hove peak in absorption. Phys. Rev. B 2010, 81, 155413. [Google Scholar] [CrossRef] [Green Version]
- Elliott, J.D.; Xu, Z.; Umari, P.; Jayaswal, G.; Chen, M.; Zhang, X.; Martucci, A.; Marsili, M.; Merano, M. Surface susceptibility and conductivity o MoS and WSe2 monolayers: A first-principles and ellipsometry characterization. Phys. Rev. B 2020, 101, 045414. [Google Scholar] [CrossRef] [Green Version]
- Khan, U.; O’Neill, A.; Lotya, M.; De, S.; Coleman, J.N. High-concentration solvent exfoliation of graphene. Small 2010, 6, 864–871. [Google Scholar] [CrossRef] [PubMed]
- Xu, Y.; Cao, H.; Xue, Y.; Li, B.; Cai, W. Liquid-phase exfoliation of graphene: An overview on exfoliation media, techniques. Nanomaterials 2018, 8, 942. [Google Scholar] [CrossRef] [PubMed] [Green Version]
- Salavagione, H.J.; Sherwood, A.; De Bruyn, M.; Budarin, V.L.; Ellis, G.J.; Clark, J.H.; Shuttleworth, P.S. Identification of high-performance solvents for the sustainable processing of graphene. Green Chem. 2017, 19, 2550–2560. [Google Scholar] [CrossRef] [Green Version]
- Ciesielski, A.; Samorì, P. Graphene via sonication assisted liquid-phase exfoliation. Chem. Soc. Rev. 2014, 43, 381–398. [Google Scholar] [CrossRef]
- Wang, S.; Yi, M.; Liang, S.; Shen, Z.; Zhang, X.; Ma, S.S.; Wang, M.; Yi, Z.; Shen, T. The effect of surfactants and their concentration on the liquid exfoliation of graphene. RSC Adv. 2016, 6, 56705–56710. [Google Scholar] [CrossRef] [Green Version]
- Fendler, J.H. Membrane Mimetic Chemistry; Wiley-InterScience: New York, NY, USA, 1982. [Google Scholar]
- Alargova, R.G.; Ivanova, V.P.; Kralchevsky, P.A.; Mehreteab, A.; Broze, G. Growth of rod-like micelles in anionic surfactant solutions in the presence of Ca 2+ counterions. Colloids Surf. A 1998, 142, 201–218. [Google Scholar] [CrossRef]
- Shirley, S.; Sonia, V.P.; Eneida, P. Surface active drugs: Self-association and interaction with membranes and surfactant. Physiochemical and biological aspects. Biophys. Acta 2000, 1508, 210–234. [Google Scholar]
- Santos, H.M.; Lodeiro, C.; Capelo-Martinez, J.L. The power of ultrasound. In Ultrasound in Chemistry: Analytical Applications; Wiley: New York, NY, USA, 2009. [Google Scholar]
- Lotya, M.; King, P.J.; Khan, U.; De, S.; Coleman, J.N. High-concentration, surfactant-stabilized graphene dispersions. ACS Nano 2010, 4, 3155–3162. [Google Scholar] [CrossRef]
- Lee, H.; Park, J.Y. Height determination of single-layer graphene on mica at controlled humidity using atomic force microscopy. Rev. Sci. Instrum. 2019, 90, 103702. [Google Scholar] [CrossRef]
- Wu, Z.; Ren, W.; Gao, L.; Liu, B.; Jiang, C.; Cheng, H. Synthesis of high-quality graphene with a pre-determined number of layers. Carbon 2009, 47, 493–499. [Google Scholar] [CrossRef]
- Nemes-Incze, P.; Osváth, Z.; Kamarás, K.; Biró, L.P. Anomalies in thickness measurements of graphene and few-layer graphite crystals by tapping mode atomic force microscopy. Carbon 2008, 46, 1435–1442. [Google Scholar] [CrossRef] [Green Version]
- Rao, C.N.R.; Biswas, K.; Subrahmanyam, K.S.; Govindaraj, A. Graphene, the new Carbon. J. Mater. Chem. 2009, 19, 2457–2469. [Google Scholar] [CrossRef]
- Vidano, R.P.; Fishbach, D.B.; Willis, L.J.; Loehr, T.M. Observation of Raman band shifting with excitation wavelength for carbons and graphites. Solid State Commun. 1981, 39, 341–344. [Google Scholar] [CrossRef]
- Ferrari, A.C.; Meyer, J.C.; Scardaci, V.; Casiraghi, C.; Lazzeri, M.; Mauri, F.; Piscanec, S.; Jiang, D.; Novoselov, K.S.; Roth, S.; et al. Raman spectrum of graphene and graphene layers. Phys. Rev. Lett. 2006, 97, 187401. [Google Scholar] [CrossRef] [Green Version]
- Eckmann, A.; Felten, A.; Mishchenko, A.; Britnell, L.; Krupke, R.; Novoselov, K.S.; Casiraghi, C. Probing nature of defects in graphene by Raman spectroscopy. Nano Lett. 2012, 12, 3925–3930. [Google Scholar] [CrossRef] [Green Version]
- Kim, S.; Kelly, P.B.; Clifford, A.J. Biological/biomedical accelerator mass spectrometry targets. 2. Physical, morphological, and structural characteristics. Anal. Chem. 2008, 80, 7661. [Google Scholar] [CrossRef] [Green Version]
- Arao, Y.; Mizuno, Y.; Araki, K.; Kubouchi, M. Mass production of high-aspect-ratio few-layer-graphene by high-speed laminar flow. Carbon 2016, 102, 330–338. [Google Scholar] [CrossRef]
- Ou, E.; Xie, Y.; Peng, C.; Song, Y.; Peng, H.; Xiong, Y.; Xu, W. High concentration and stable few-layer graphene dispersions prepared by the exfoliation of graphite in different organic solvents. RSC Adv. 2013, 3, 9490–9499. [Google Scholar] [CrossRef]
- Haar, S.; Ciesielski, A.; Clough, J.; Yang, H.; Mazzaro, R.; Richard, F.; Conti, S.; Merstorf, N.; Cecchini, M.; Morandi, V.; et al. A supramolecular strategy to leverage the liquid-phase exfoliation of graphene in the presence of surfactants. Unraveling the role of the length of fatty acids. Small 2015, 11, 1691. [Google Scholar] [CrossRef] [PubMed]
- Seo, H.-K.; Kim, T.-S.; Park, C.; Xu, W.; Baek, K.; Bae, S.-H.; Ahn, J.-H.; Kim, K.; Choi, H.C.; Lee, T.-W. Value-added Synthesis of Graphene: Recycling Industrial carbon waste into electrodes for high-performance electronic devices. Sci. Rep. 2015, 5, 16710. [Google Scholar] [CrossRef] [PubMed] [Green Version]
- Unalan, I.U.; Wan, C.; Trabattoni, S.; Piergiovanni, L.; Farris, S. Polysaccharire-assisted rapid exfoliation of graphite platelets into high-quality water-dispersible graphene sheets. RSC Adv. 2015, 5, 26482–26490. [Google Scholar] [CrossRef] [Green Version]
- Shen, Y.; Lua, A.C. A facile method for the large-scale continuous synthesis of graphene sheets using a novel catalyst. Sci. Rep. 2013, 3, 3037. [Google Scholar] [CrossRef] [PubMed] [Green Version]
- Valles, C.; Drummond, C.; Saadaoui, H.; Furtado, C.A.; He, M.; Rouleau, O.; Ortolani, L.; Monthioux, M.; Penicaud, A. Solutions of negatively charged graphene sheets and ribbons. J. Am. Chem. Soc. 2008, 130, 15802–15804. [Google Scholar] [CrossRef] [PubMed]
Figure 1.
(a) Graphite powder, (b) graphene, (c) represents 80 mL of homogeneous graphene dispersion, and (d) exhibiting the Tyndall effect when a red laser beam is passed through it, indicating the formation of a uniform dispersion.
Figure 1.
(a) Graphite powder, (b) graphene, (c) represents 80 mL of homogeneous graphene dispersion, and (d) exhibiting the Tyndall effect when a red laser beam is passed through it, indicating the formation of a uniform dispersion.

Figure 2.
(a) Absorbance per unit path length (λ = 660 nm), A/l, as a function of the concentration of graphene, Cg, in water/acetone mixtures (75-wt % acetone). The graph follows Lambert–Beer behavior, with an absorption coefficient of α = 1013 mL mg−1 m−1. (b) UV-vis absorption spectra for different sonication times. (c) Sonication times vs. concentration graph with centrifugation frequency of 1500 rpm for half an hour, followed by another centrifugation with a frequency of 3000 rpm for another half an hour; 0.2 mL graphene dispersion was mixed with 5 mL water.

Figure 3.
(a) UV-vis absorption spectra for different surfactant concentrations. (b) Variation in the concentration of graphene, Cg with the surfactant concentration, Cs graph with centrifugation frequency of 1500 rpm for half an hour, followed by another centrifugation with a frequency of 3000 rpm for another half an hour, 0.2 mL graphene dispersion was mixed with 5 mL water.

Figure 4.
(a) The UV absorption spectra for different centrifugation frequencies, Cf; (b) Cf vs. Cg curve for 0.2 mL dispersion in 5 mL DI water. Here, the centrifugation 1500 rpm for half an hour followed by another 3000 rpm for half an hour is considered as 4500 rpm in the graph.
Figure 4.
(a) The UV absorption spectra for different centrifugation frequencies, Cf; (b) Cf vs. Cg curve for 0.2 mL dispersion in 5 mL DI water. Here, the centrifugation 1500 rpm for half an hour followed by another 3000 rpm for half an hour is considered as 4500 rpm in the graph.

Figure 5.
XRD pattern of graphene and graphite.

Figure 6.
(a) TEM image of graphene; (b) is the red line marks the highlighted part of image (a).

Figure 7.
AFM images after dip coating onto mica and rinsing with deionized water: (a) representative topographic selected height image of graphene flakes with clear edges (b) two to three layers FLG stacking, (c) surface of two-layered graphene, (d) height profile of the regions marked by red and blue color, demonstrating the different thickness of graphene layers.

Figure 8.
Raman shift for graphite and graphene. Raman spectra of G showing few-layer graphene (7 h and 29 h) and starting graphite for reference.
Figure 8.
Raman shift for graphite and graphene. Raman spectra of G showing few-layer graphene (7 h and 29 h) and starting graphite for reference.

Publisher’s Note: MDPI stays neutral with regard to jurisdictional claims in published maps and institutional affiliations. |
© 2021 by the authors. Licensee MDPI, Basel, Switzerland. This article is an open access article distributed under the terms and conditions of the Creative Commons Attribution (CC BY) license (https://creativecommons.org/licenses/by/4.0/).
Share and Cite
MDPI and ACS Style
Akter, N.; Mawardi Ayob, M.T.; Radiman, S.; Khandaker, M.U.; Osman, H.; Alamri, S. Bio-Surfactant Assisted Aqueous Exfoliation of High-Quality Few-Layered Graphene. Crystals 2021, 11, 944. https://doi.org/10.3390/cryst11080944
AMA Style
Akter N, Mawardi Ayob MT, Radiman S, Khandaker MU, Osman H, Alamri S. Bio-Surfactant Assisted Aqueous Exfoliation of High-Quality Few-Layered Graphene. Crystals. 2021; 11(8):944. https://doi.org/10.3390/cryst11080944
Chicago/Turabian StyleAkter, Nasima, Muhammad Taqiyuddin Mawardi Ayob, Shahidan Radiman, Mayeen Uddin Khandaker, Hamid Osman, and Sultan Alamri. 2021. "Bio-Surfactant Assisted Aqueous Exfoliation of High-Quality Few-Layered Graphene" Crystals 11, no. 8: 944. https://doi.org/10.3390/cryst11080944
Note that from the first issue of 2016, this journal uses article numbers instead of page numbers. See further details here.