
Application of Hollow-Core Photonic Crystal Fibers in Gas Raman Lasers Operating at 1.7 μm

1
Environmental Economy and Information Department, Changsha Environmental Protection Vocational College, Changsha 410004, China
2
College of Advanced Interdisciplinary Studies, National University of Defense Technology, Changsha 410073, China
3
State Key Laboratory of Pulsed Power Laser Technology, Changsha 410073, China
*
Author to whom correspondence should be addressed.
Crystals 2021, 11(2), 121; https://doi.org/10.3390/cryst11020121
Submission received: 30 December 2020
/
Revised: 18 January 2021
/
Accepted: 25 January 2021
/
Published: 27 January 2021
(This article belongs to the Special Issue Specialty Photonic Crystal Fibres and Their Applications)
Abstract
:A 1.7 μm pulsed laser plays an important role in bioimaging, gas detection, and so on. Fiber gas Raman lasers (FGRLs) based on hollow-core photonic crystal fibers (HC-PCFs) provide a novel and effective method for fiber lasers operating at 1.7 μm. Compared with traditional methods, FGRLs have more advantages in generating high-power 1.7 μm pulsed lasers. This paper reviews the studies of 1.7 μm FGRLs, briefly describes the principle and characteristics of HC-PCFs and gas-stimulated Raman scattering (SRS), and systematical characterizes 1.7 μm FGRLs in aspects of output spectral coverage, power-limiting factors, and a theoretical model. When the fiber length and pump power are constant, a relatively high gas pressure and appropriate pump peak power are the key to achieving high-power 1.7 μm Raman output. Furthermore, the development direction of 1.7 μm FGRLs is also explored.
1. Introduction
In recent years, lasers operating in the 1.7 μm band (1650–1750 nm) have received much attention due to the growing number of promising applications, such as bioimaging, gas detection, medical treatment, and mid-infrared laser generation. Compared with other types of lasers, 1.7 μm fiber lasers have been more intensively studied due to good stability, compactness, and beam quality. However, reported works mainly involve 1.7 μm continuous-wave (CW) fiber lasers [1,2], and the pulsed fiber lasers operating in this wavelength region have not been researched fully, though they have unique advantages in some applications. For example, in bioimaging applications such as multiphoton microscopy [3,4], optical coherence tomography [5], and spectroscopic photoacoustic (PA) imaging [6,7], 1.7 µm pulsed lasers can be used to realize three-dimensional (3D) volumetric imaging by time-resolved ultrasonic detection [7]. Similarly, in methane detection, the 3D distribution of the CH4 concentration in space can be measured by using the time-of-flight ranging method to analyze the temporal characteristics of pulsed lasers when the pulsed lasers are in the 1.7 μm band used as the detection signal [8]. In fact, whether in bioimaging or gas detection, high-power 1.7 μm pulsed lasers are conducive to achieving higher sensitivity and deeper penetration/detection [7,9]. Thus, it is important and necessary to increase the output power of 1.7 μm pulsed fiber lasers.
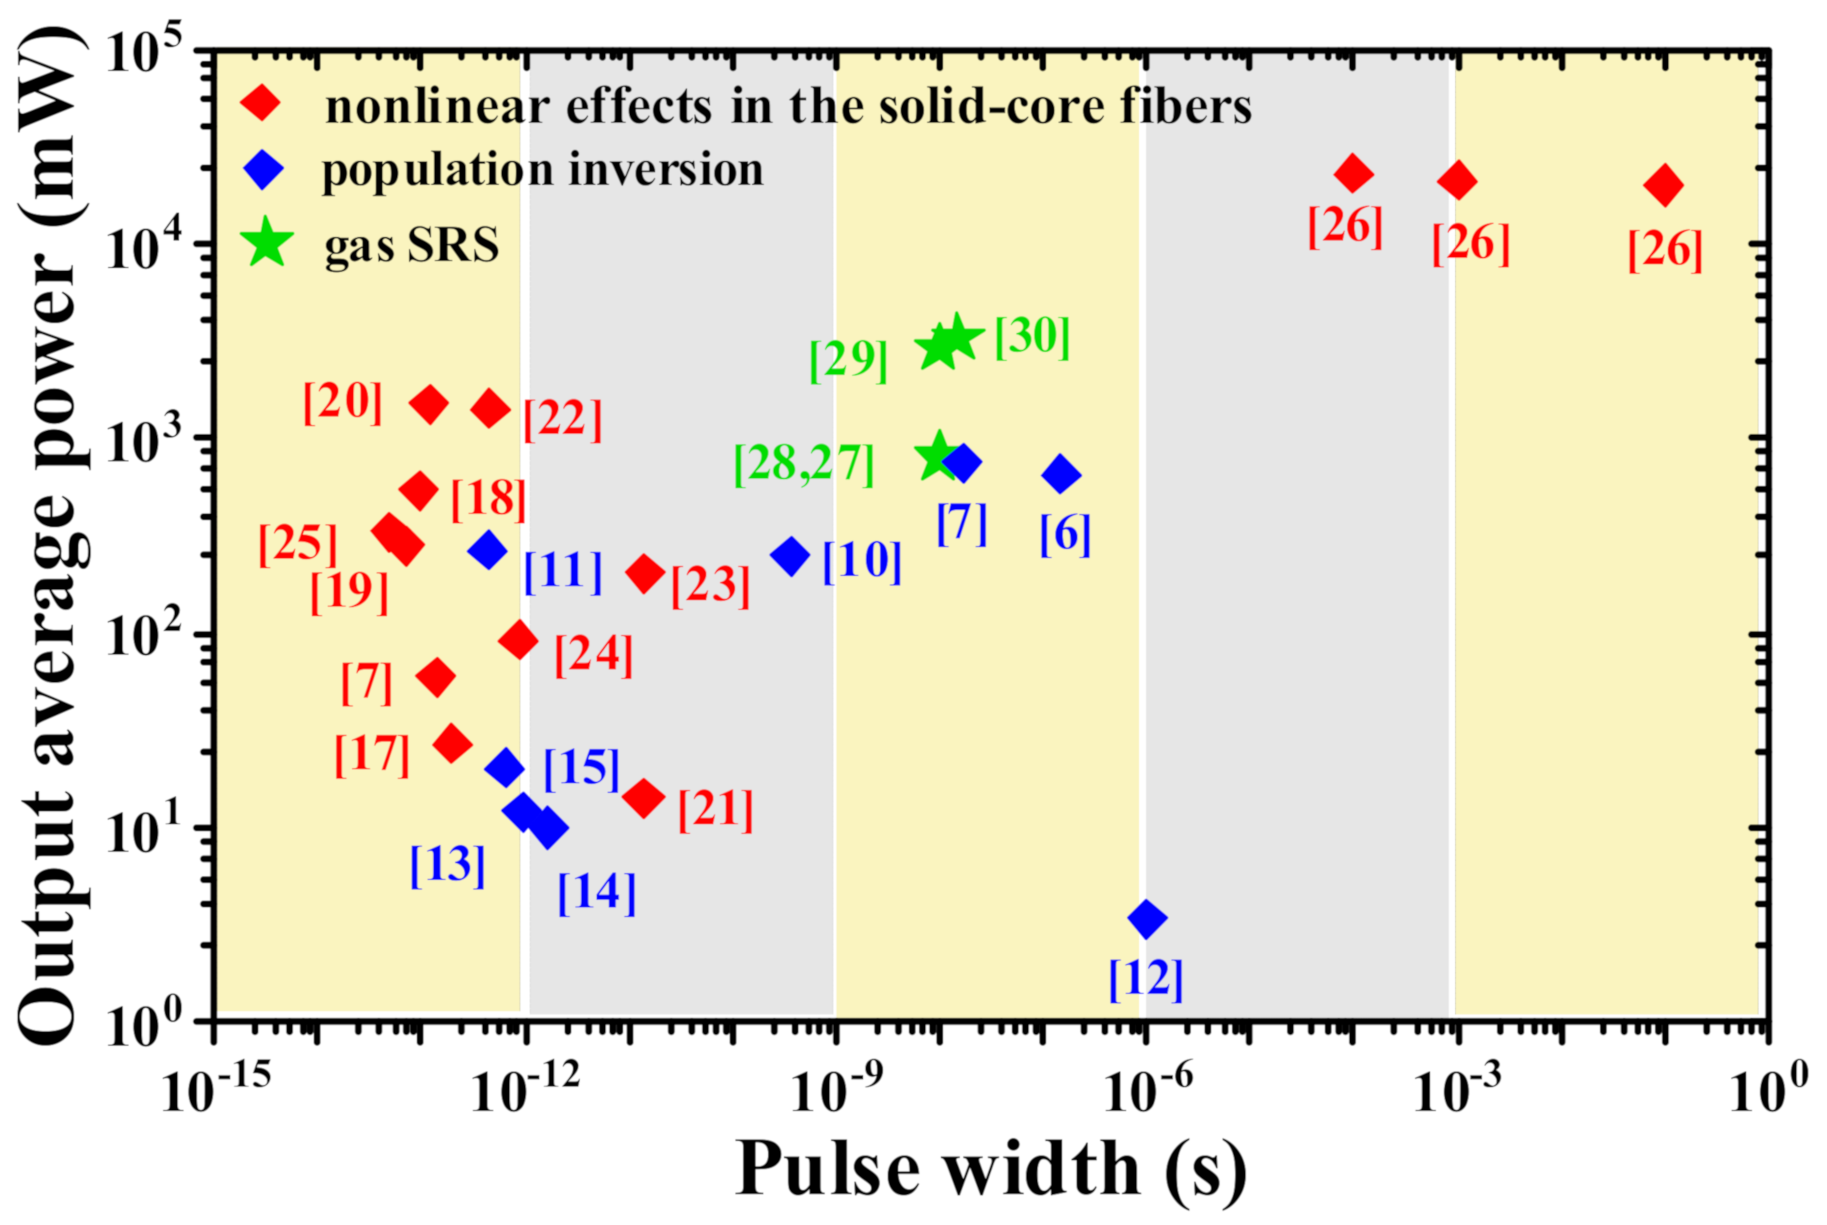
The traditional methods of realizing 1.7 μm pulsed fiber lasers can be mainly classified into two categories. One is based on population inversion to generate 1.7 μm pulsed lasers by using rare-earth-doped fibers, such as thulium-doped fibers [6,7,10,11], thulium–holmium-codoped fibers [12,13], and bismuth-doped fibers [14,15,16]. The other is based on nonlinear effects in solid-core fibers to realize a frequency conversion, such as soliton self-frequency shift [17,18,19,20], four-wave mixing [21,22,23], self-phase modulation [7,24,25], and stimulated Raman scattering (SRS) [26]. Recently, fiber gas Raman lasers (FGRLs) based on hollow-core photonic crystal fibers (HC-PCFs) have opened a new opportunity for 1.7 μm pulsed fiber lasers [27,28,29,30]. The principle of FGRLs is to realize a frequency conversion by gas SRS in HC-PCFs. The output average powers and corresponding pulse widths of reported 1.7 μm pulsed fiber lasers are plotted in Figure 1.
It can be seen that the pulse widths of 1.7 μm pulsed lasers based on solid-core fibers are mostly in femtosecond and picosecond regions and their output average powers are mostly less than 1 W. Only a pulsed Raman fiber laser can achieve an output power of up to 23 W [26], but its pulse width is at the millisecond level. Thus, it is very challenging to obtain high-power 1.7 μm pulsed lasers with a short pulse width based on solid-core fibers. The 1.7 μm FGRLs fill this gap and achieve nanosecond pulsed lasers with an output average power of over 3 W [30]. In fact, 1.7 μm nanosecond short pulsed lasers have more advantages in bioimaging. To realize volumetric imaging with higher resolution, the pulse duration should be around 10 ns or even shorter [7]. Furthermore, 1.7 μm FGRLs with continuous wavelength tunability and narrow linewidth also have more advantages in gas detection. Continuous wavelength tunability is conducive to the detection of different kinds of gas molecules, and narrow-linewidth pulsed lasers can not only accurately distinguish the absorption peaks but also have a longer coherent distance that is helpful in long-distance detection [9]. Therefore, compared with traditional 1.7 μm pulsed fiber lasers, 1.7 μm FGRLs have unique advantages and strong competitiveness due to the characteristics of high power, high efficiency, continuous wavelength tunability, and a narrow linewidth.
In this paper, we review the studies of 1.7 μm FGRLs based on HC-PCFs. Section 2 briefly introduces the classification, light guide mechanism, and development of HC-PCFs. In Section 3, a comparison of gas SRS in free space and in HC-PCFs is made and the characteristics of candidate Raman gas media for 1.7 μm FGRLs are discussed. Section 4 describes the typical experimental structure of 1.7 μm FGRLs and characterizes 1.7 μm FGRLs in aspects of output spectral coverage, power-limiting factors, and a theoretical model. When the fiber length and pump power are constant, a relatively high gas pressure and appropriate pump peak power are the key to achieving high output Raman power in 1.7 μm FGRLs. In Section 5, we discuss the future development of 1.7 μm FGRLs based on HC-PCFs.
2. Hollow-Core Photonic Crystal Fibers
HC-PCFs are the core components of FGRLs, which provide a platform for the interaction of laser and gas. The fiber core of an HC-PCF is an air hole, so the refractive index of the fiber core is less than that of the fiber cladding and the law of total reflection is not suitable for HC-PCFs. According to the light guide mechanism, there are two major classifications of HC-PCFs, namely photonic bandgap hollow-core fibers (PBG-HCFs) [31,32,33,34,35] and anti-resonance hollow-core fibers (AR-HCFs) (or inhibited-coupling fibers) [36,37,38,39,40,41,42,43,44,45,46,47,48,49].
2.1. Photonic Bandgap Hollow-Core Fibers
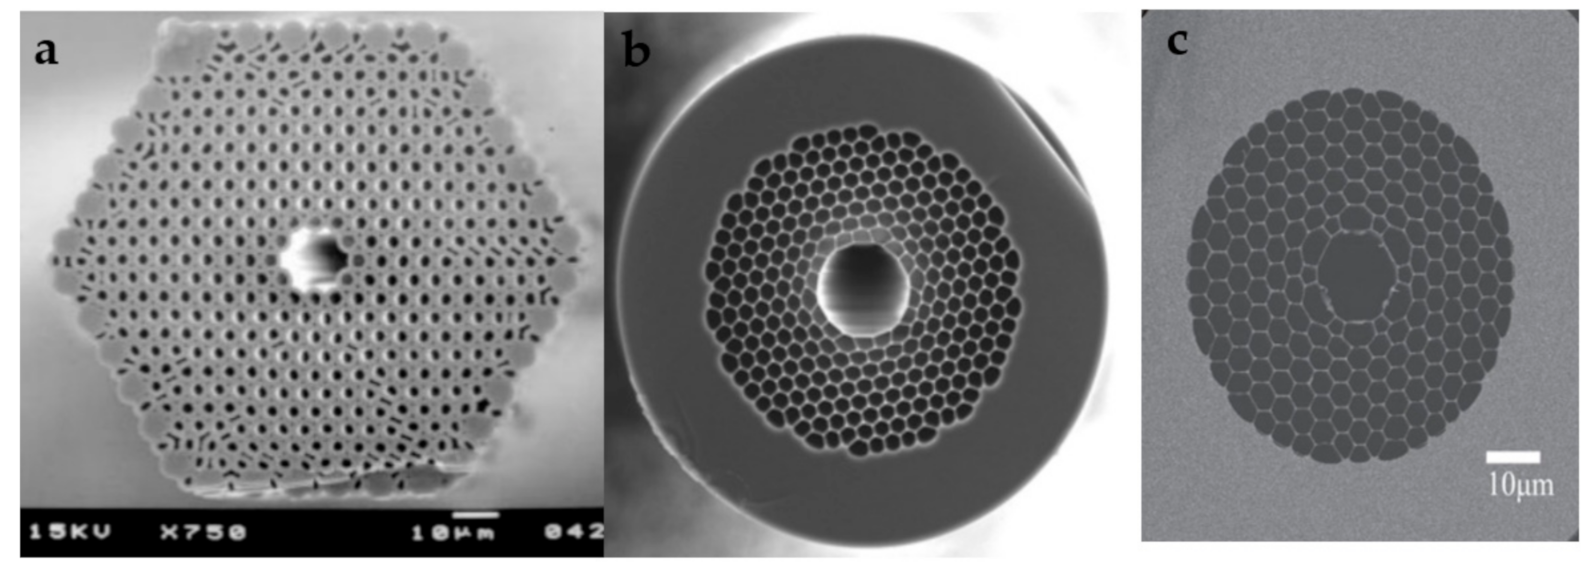
In 1999, Russell et al. demonstrated the first PBG-HCFs [31], the schematic cross section of which is shown in Figure 2a. It can be seen that the fiber core is a larger air hole and periodic small air holes are distributed in the cladding of the PBG-HCFs. These periodic air holes in the cladding form a two-dimensional photonic bandgap, so light cannot pass through the cladding and be confined in the fiber core when the wavelength of light is located in the photonic bandgap. Since then, HC-PCFs have been developed toward lower loss and greater bandwidths. In 2004, the University of Bath demonstrated low-loss PBG-HCFs of 1.72 dB/km at 1565 nm [32], the schematic cross section of which is shown in Figure 2b. In 2005, they further reduced the fiber loss to 1.2 dB/km at 1620 nm [33], which is currently the lowest loss of PBG-HCFs. Figure 2c shows the schematic cross section of PBG-HCFs with a broad transmission band and low loss demonstrated by the Beijing University of Technology in 2019 [34]. The minimum loss of 6.5 dB/km at 1633 nm and a 3 dB bandwidth at 458 nm were achieved, which is the broadest bandwidth in PBG-HCFs. The main factors affecting the loss of PBG-HCFs are the scattering caused by the surface roughness of the fiber core boundary [33] and the coupling between the core and the surface modes [35]. Moreover, the coupling also causes multiple loss peaks in the transmission band, affecting the transmission bandwidth of the PBG-HCFs.
2.2. Anti-Resonance Hollow-Core Fibers
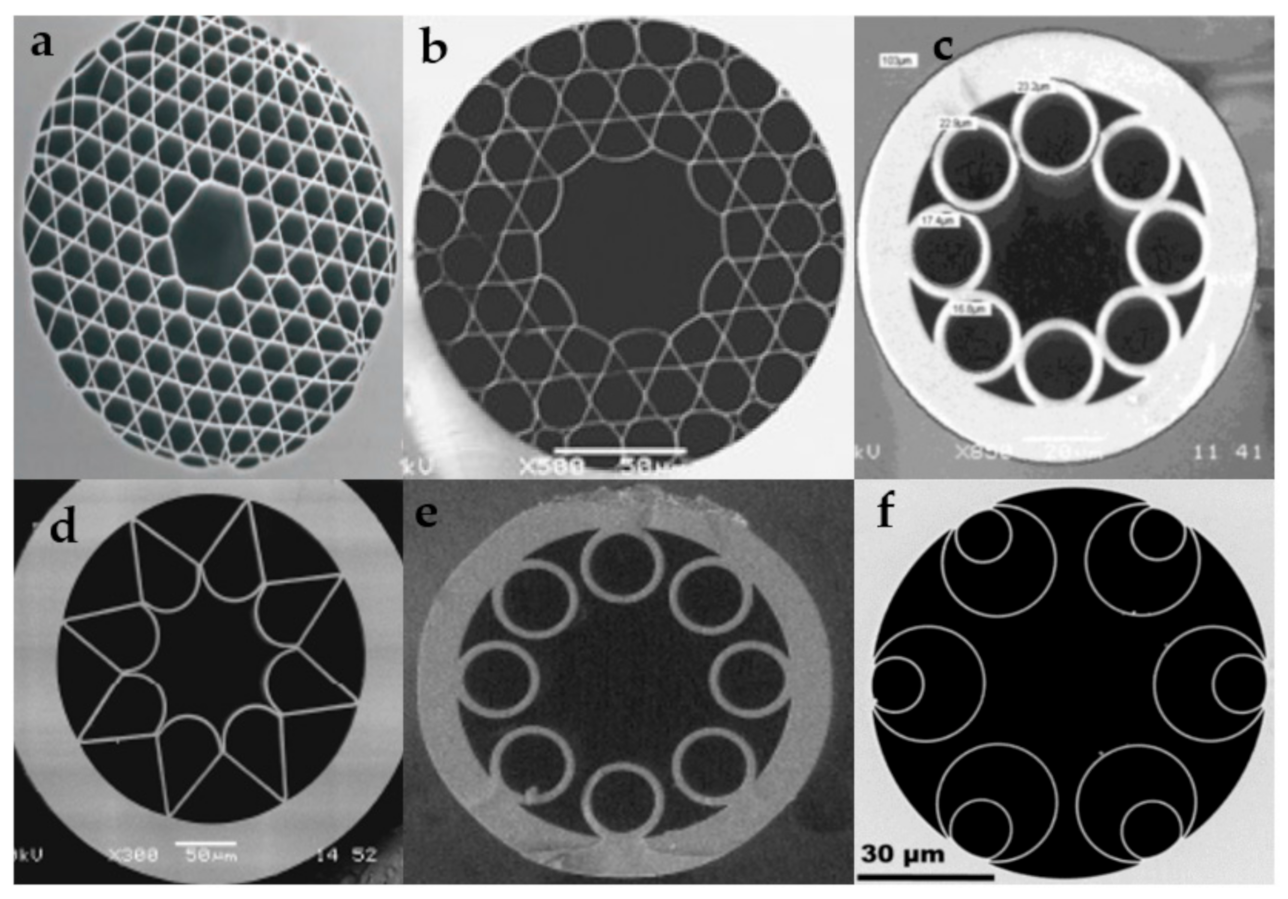
The Kagome HCFs reported in 2002 are the first AR-HCFs [36], the schematic cross section of which is shown in Figure 3a. Compared with PBG-HCFs, the cladding structure pitch of Kagome HCFs is larger, which can widen the optical transmission band [37]. Furthermore, there is no complete photonic bandgap in the Kagome hollow fiber, and its light-guiding mechanism can be explained by inhibited coupling [38] or the anti-resonant reflection optical waveguide (ARROW) [39]. According to the inhibited-coupling mechanism, a core-guide mode can be strongly inhibited from channeling out through the cladding by a mismatch between the core and cladding modes [40]. According to ARROW, the microstructure in the cladding is similar to a Fabry–Perot cavity. The light that meets the cavity resonance conditions will leak out through the cladding, while the light that cannot resonate in the cavity is prevented from leaking from the cladding and confined to the fiber core [41]. Figure 3b shows the schematic cross section of hypocycloid Kagome HCFs, and the design of the fiber core boundary with negative curvature reduces the transmission loss of the fiber [42]. With further study of the light-guiding mechanism of AR-HCFs, it has been found that the transmission performance of AR-HCFs is mainly determined by the first ring microstructure of the fiber core boundary. Subsequently, AR-HCFs with simpler microstructures and better optical performance have emerged [43,44,45,46,47,48,49], and all of these AR-HCFs obey the ARROW guiding mechanism. Figure 2c presents the schematic cross section of the first tube-structure AR-HCFs reported in 2011, the cladding of which is composed of single-ring tubes [44]. The attenuation of the single-ring AR-HCFs in the mid-infrared band is much lower than that of the silica glass solid-core fiber. Figure 3d shows the schematic cross section of ice-cream-type AR-HCFs [45], the transmission band of which is located in the mid-infrared band and the minimum loss of which is 34 dB/km at 3050 nm. With further study of AR-HCFs, it has been found that the touching points of adjacent capillaries in the cladding behave as independent waveguides supporting their own lossy modes, which would introduce additional transmission loss [50,51]. Thus, nodeless single-ring AR-HCFs were first demonstrated in 2013 [46]. In addition, it was demonstrated that the elimination of the tube’s contact point helps to reduce the bending loss [47]. In 2019, nodeless nested AR-HCFs with the attenuation of 0.65 dB/km in the C and L telecommunications bands were demonstrated, which means this was the first time that HC-PCFs realized a loss comparable to that of silica glass solid-core fibers [48]. The attenuation of nodeless nested AR-HCFs was further recued to 0.28 dB/km in 2020 [49].
Compared with PBG-HCFs, the mode field of AR-HCFs overlaps the silica glass of the fiber core boundary less [52]. Thus, the surface scattering loss of AR-HCFs is lower than that of PBG-HCFs, which means that AR-HCFs have advantages of realizing lower loss and reducing the nonlinearities caused by silica glass. Furthermore, although both AR-HCFs and PBG-HCFs are multimode, the attenuation of high-order modes in AR-HCFs is higher than that of PBG-HCFs, which means that with AR-HCFs it is easier to obtain a fundamental mode guidance at a short fiber length [53].
3. Gas Stimulated Raman Scattering
3.1. Traditional Gas Raman Lasers Versus Fiber Gas Raman Lasers
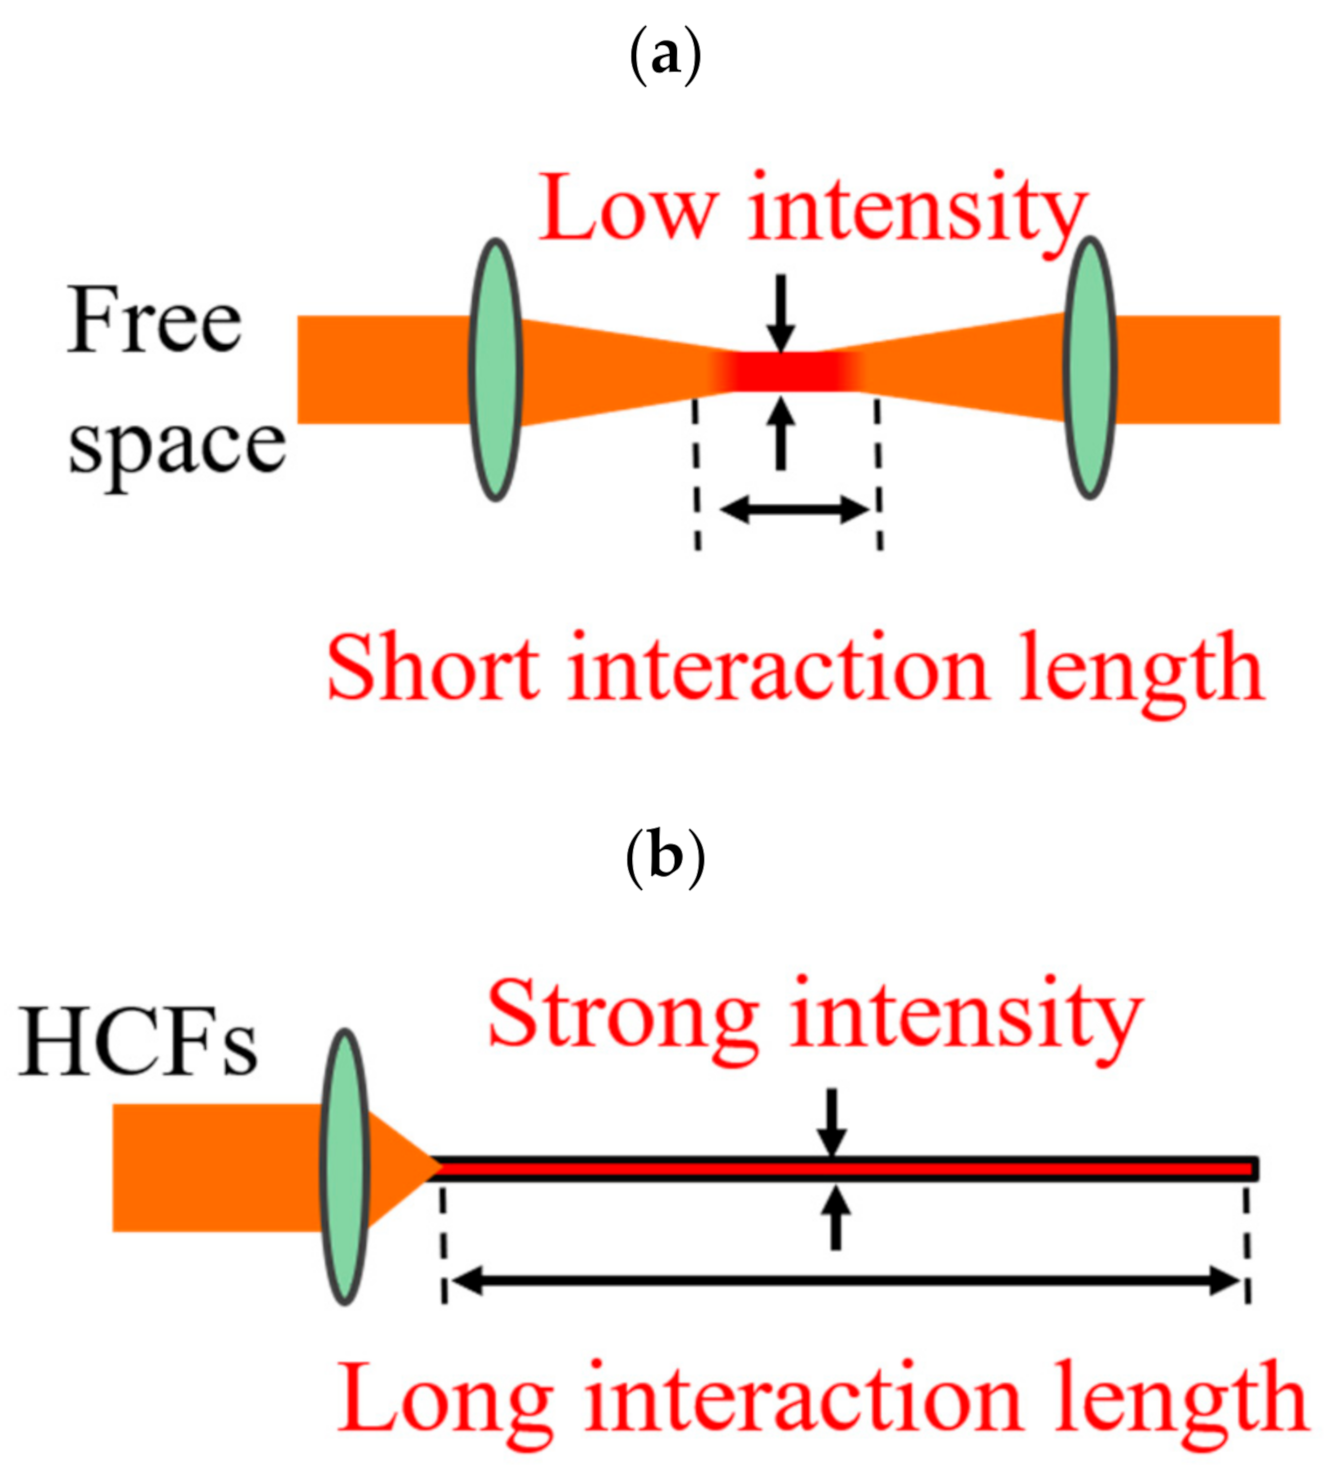
Since gas SRS was first reported in 1963 [54], gas SRS has been considered as a significant method to realize a laser of a new wavelength by frequency conversion. Gas SRS can cover the ultraviolet-to-infrared band [55,56], which is an effective extension of the laser output band. Figure 4a is a simplified schematic diagram of the interaction between lasers and gas in traditional Raman gas lasers. Owing to the diffraction effect of laser transmission in free space and some other factors, the gas SRS in free space has a short interaction length and low intensity, leading to an extremely high Raman threshold. Normally, traditional gas Raman lasers require pump pulsed lasers with megawatt peak power to reach the Raman threshold. Moreover, there would be many Stokes waves generated, so it is difficult to realize efficient conversion of a single Stokes wavelength in traditional gas Raman lasers. These problems limit the applications of traditional gas Raman lasers. However, for FGRLs, gas SRS occurs in HC-PCFs, and a simplified schematic diagram of the interaction between lasers and gas in FGRLs is shown in Figure 4b. HC-PCFs can confine lasers to the small core for long-distance transmission, so an extremely low Raman threshold can be achieved. Furthermore, the output Stokes waves can be controlled by designing the transmission band of HC-PCFs. Thus, HC-PCFs provide an ideal environment for efficient gas SRS, meeting the requirements of strong interaction intensity, a long interaction length, and a controllable Raman gain spectrum at the same time.
3.2. Candidate Gas Media for 1.7 μm Raman Wavelength
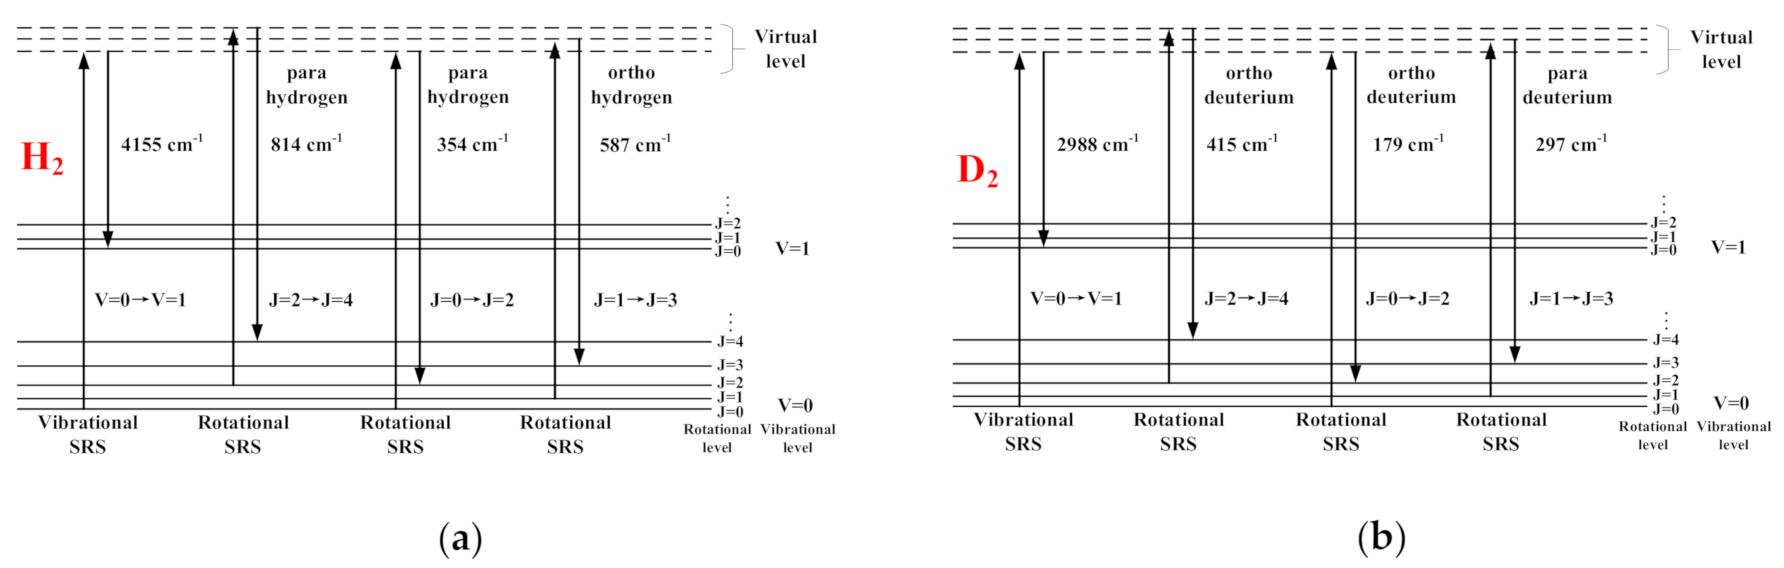
For gas SRS, the Raman frequency shift is due to the energy-level transitions of gas media. Thus, different output Raman wavelengths can be flexibly realized by changing the gas media or using different energy-level transitions of one gas medium. Because hydrogen (H2) and deuterium (D2) are the main candidate gas media for 1.7 μm FGRLs, Figure 5a,b present the schematic diagrams of the energy-level transitions of H2 [57] and D2 SRS [58], respectively. It can be seen that H2 molecules’ vibrational SRS has a Raman frequency shift coefficient of ~4155 cm−1 and the rotational SRS of different energy levels has Raman frequency shift coefficients of ~587, ~354, and ~814 cm−1. D2 molecules’ vibrational SRS has a Raman frequency shift coefficient of ~2988 cm−1, and the rotational SRS of different energy levels has Raman frequency shift coefficients of ~179, ~297, and ~415 cm−1.
The relationship between the pump wavelength, Raman frequency shift coefficient, and Raman wavelength is given by
where ∆ω is the Raman frequency shift coefficient and λP and λS are the pump wavelength and Raman wavelength, respectively. When the pump wavelength is set in the 1 or 1.5 μm band, H2 or D2 SRS can realize different output Raman wavelengths, as shown in Table 1. It can be seen that when the pump wavelength is set in the 1.5 μm band, the output Raman wavelength at the 1.7 μm band can be realized by H2 or D2 rotational SRS.
4. Fiber Gas Raman Lasers Operating at 1.7 μm
4.1. Typical Experimental Setup
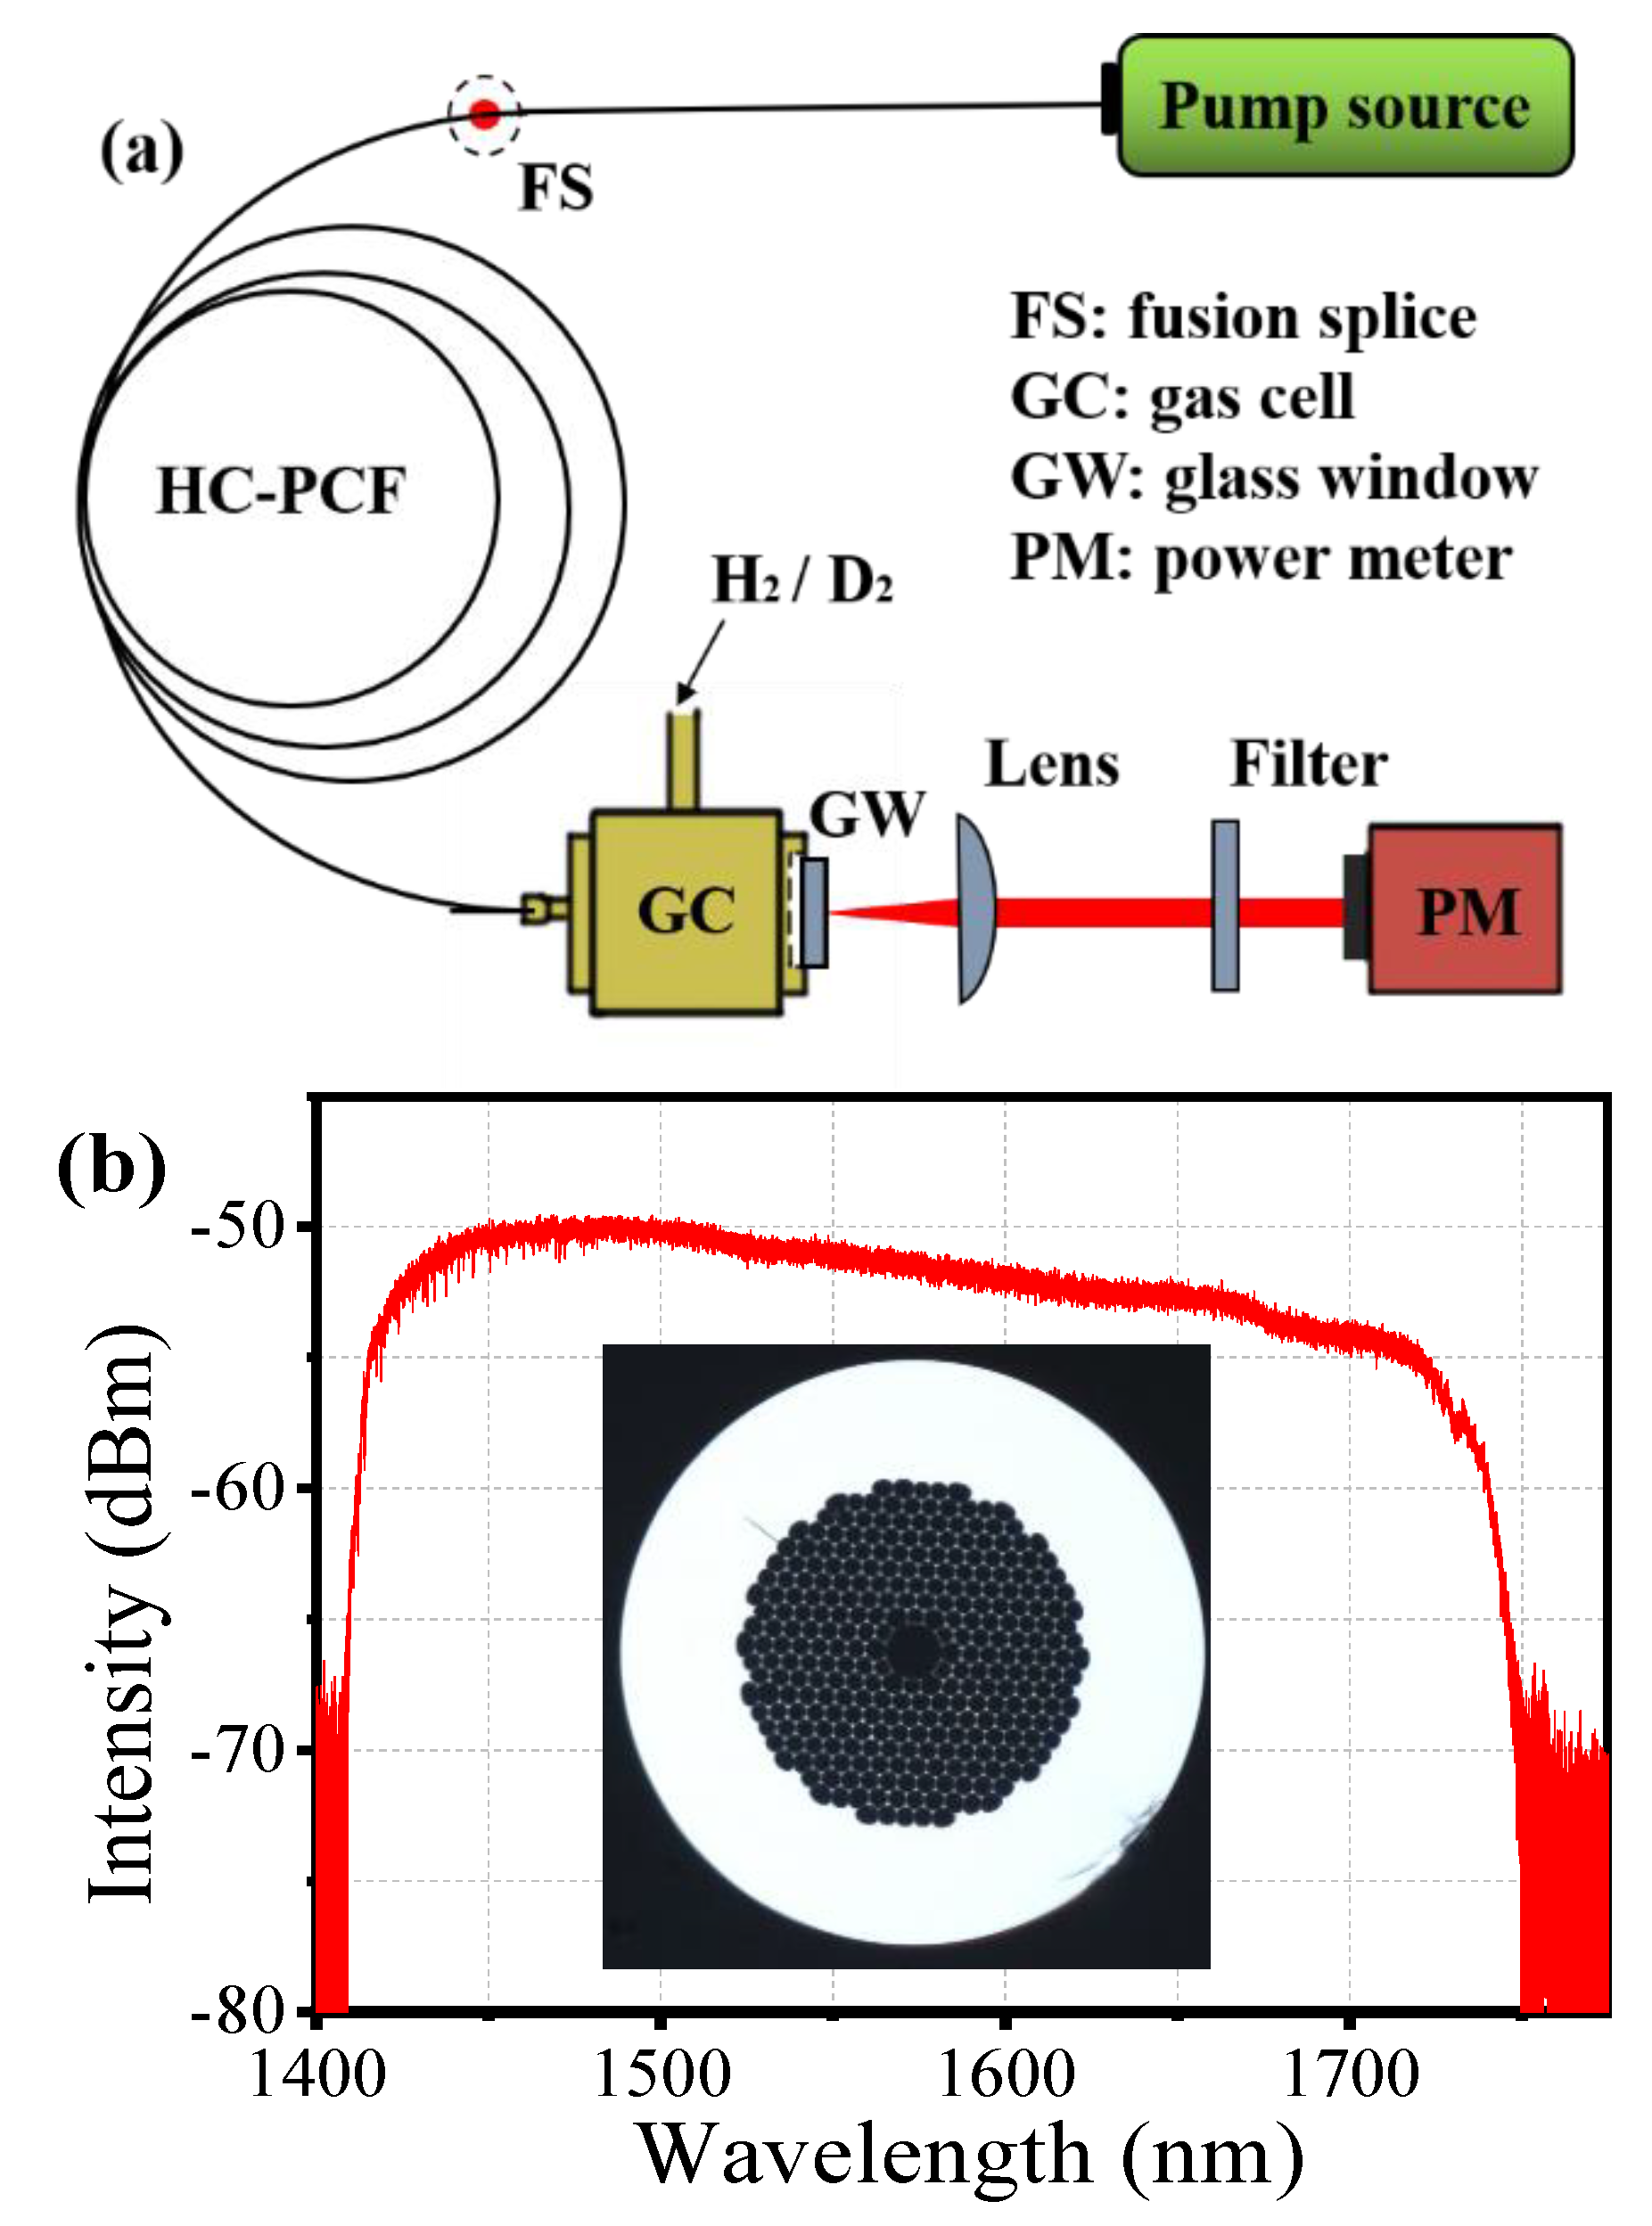
Figure 6a presents the typical experimental setup of 1.7 μm FGRLs, comprising mainly a pump source, HC-PCFs, a gas cell, and a set of lenses. The pump laser is a 1.5 μm pulsed erbium-doped fiber amplifier (EDFA), the pigtail fiber (Corning, SMF-28e) of which is fusion-spliced with the HC-PCFs (NKT Photonics, HC-1550-02) due to a similar mode field area and numerical aperture, and the theoretical minimum loss can be as low as 1.3 dB [59]. The output end of the HC-PCFs is sealed in a gas cell with a glass window, and the HC-PCFs can be filled with a gas medium through the gas cell. The output lasers being transmitted through the glass window are collimated and are filtered by a set of lenses.
Figure 6b presents the transmission spectrum and optical micrograph of a cross section of HC-PCFs [57]. The low-loss transmission band of HC-PCFs is from 1415 to 1740 nm, covering both the 1.5 μm pump wavelengths and the 1.7 μm output Raman wavelengths. Furthermore, it can be seen from the insert that the used HC-PCFs are PBG-HCFs with a multilayer microstructure in the cladding. Compared with the AR-HCFs with a single-ring microstructure in the cladding, fusion splicing has less impact on the optical performance of the used HC-PCFs. Thus, mature commercial HC-PCFs (NKT Photonics, HC-1550-02) are very suitable for 1.7 μm FGRLs.
4.2. Spectral Coverage
A pulsed fiber amplifier with a wavelength tuning range of 1535–1565 nm was used to pump 20-m-long HC-PCFs filled with D2 or H2, and the output spectra are shown in Figure 7a [27] and Figure 7b [28], respectively. It can be seen that one pump line in the 1.5 um band is converted into one Raman line in the 1.7 μm band (415 and 587 cm−1 Raman frequency shift coefficients of D2 and H2, respectively), which greatly improves the power conversion efficiency. This is not difficult to explain. Take D2 SRS as an example; if the pump wavelength is 1550 nm, because the 2886 nm Raman line generated by vibrational SRS (with a Raman frequency shift of 2987 cm−1) is located outside the low-loss transmission band, it is strongly suppressed. Moreover, because the Raman gain of the 1656 nm rotational Raman line (with a Raman frequency shift of 415 cm−1) is higher than that of 1625 and 1594 nm rotational Raman lines (with Raman frequency shifts of 297 and 179 cm−1, respectively), the 1550 nm pump line will first be converted into a 1656 nm Raman line, and the residual pump power is too low to generate 1625 and 1594 nm Raman lines. The explanation of the output spectrum of H2 SRS is also similar. Therefore, the output Raman wavelengths are determined by the gas media, pump wavelength, and fiber attenuation.
4.3. Power-Limiting Factors
Compared to the solid-core fiber, only less than 1% of the mode field energy overlaps the silica glass of the fiber core boundary when the lasers are transmitted in HC-PCFs. So HC-PCFs have a higher damage threshold, which means that HC-PCFs are more capable of transmitting comparatively higher power and energy. In this section, the influence of the pump wavelength, gas pressure, repetition frequency of the pump pulse, and fiber length on the output Raman power is fully discussed based on the reported experimental results of the 1.7 μm fiber deuterium gas Raman laser [27,29], and the key factors for achieving high-power 1.7 μm FGRLs are analyzed.
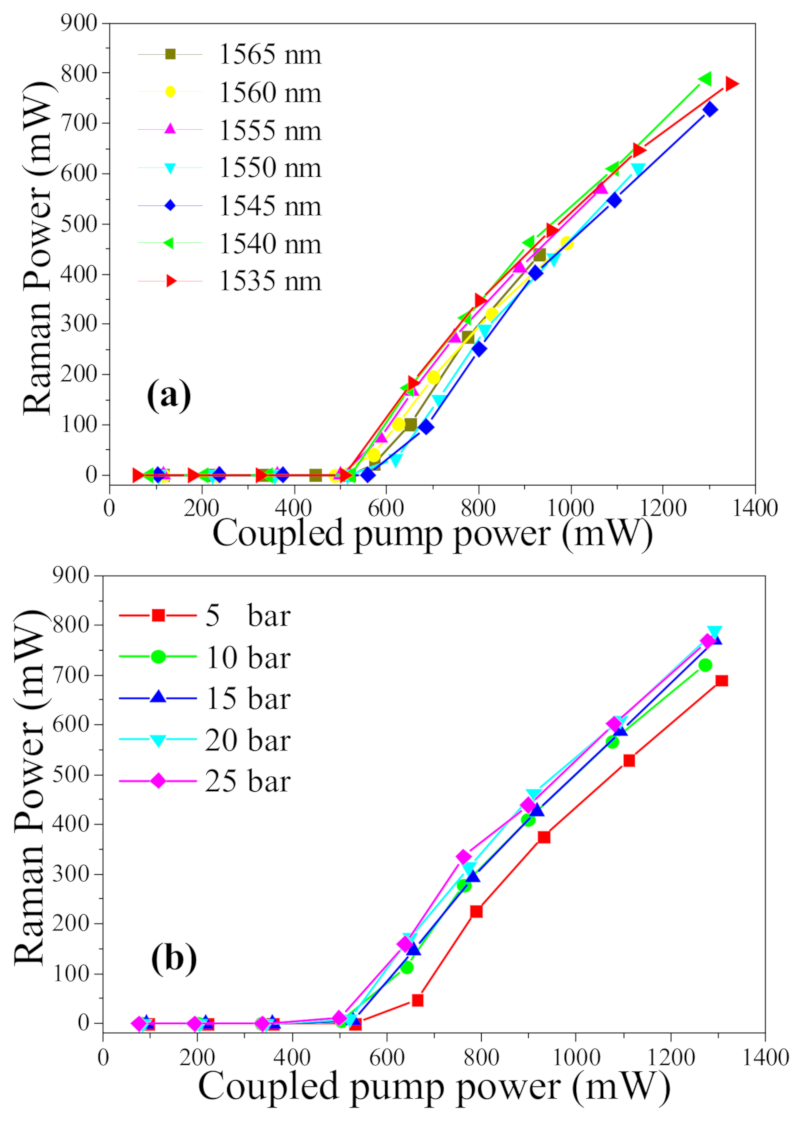
Figure 8a shows the output Raman power as a function of coupled average pump power at different pump wavelengths when the fiber length is 20 m [27]. The maximum Raman power decreases toward the long wavelength. It can be attributed to the amplification performance of the pump source. The output power of the pump source is slightly reduced as the wavelength increases. In fact, when the fiber attenuation in the pump band and output Raman band is basically unchanged, the wavelength change has little effect on the output Raman power. Figure 8b shows the output Raman power as a function of coupled average pump power at different gas pressures when the fiber length is 20 m [27]. Since the molecular density of the gain gas in the HC-PCFs can be adjusted by the barometer of the gas cell, this provides new freedom in the optimization of the 1.7 μm FGRL performance for high-power laser emission. When the gas pressure is too low, the Raman threshold is relatively higher due to the small Raman gain [60], thereby affecting the output Raman power. While the Raman gain is saturated at a high gas pressure level, the contribution of increasing gas pressure to the Raman gain becomes extremely small. Therefore, it can be seen from Figure 7b that when the gas pressure is higher than 15 bar, the Raman power does not increase obviously.
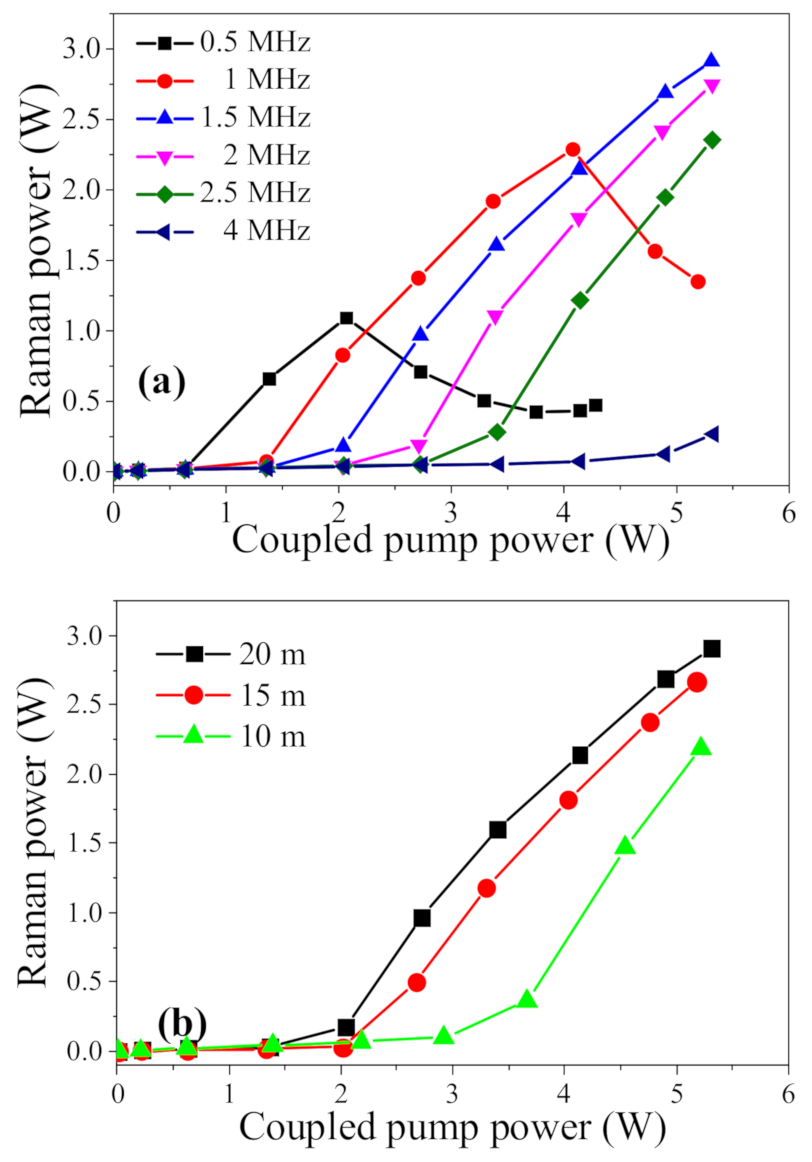
Figure 9 presents the experimental results of using a higher-power pump source [29], and cascaded Raman conversion is more likely to occur under high pump power. Figure 9a presents the output Raman power as a function of the coupled average pump power at different repetition frequencies of the pump pulse when the fiber length is 20 m and the gas pressure is 16 bar. It can be seen that the repetition frequency has a great influence on the output Raman power, and there is an optimal repetition frequency to achieve the maximum output Raman power. This is because when the fiber length and the gas pressure are constant, the Raman threshold of the pump peak power is also constant. Thus, it is necessary to adjust the repetition frequency to obtain a suitable peak power so that the peak power is much higher than the first-order Raman threshold but does not exceed the second-order Raman threshold. When the peak power is much higher than the first-order Raman threshold, more pump pulse energy can undergo Raman conversion. When the peak power does not exceed the second-order Raman threshold, the first-order to second-order cascaded Raman conversion will not occur, which means that the first-order Raman power will not fall at the high pump power level. Figure 8b presents the output Raman power as a function of the coupled average pump power at different fiber lengths when the repetition is 1.5 MHz and the gas pressure is 16 bar. It can be seen that the Raman threshold increases with a decrease in the fiber length, which means that less pump pulse energy is converted into Raman pulse energy, so the maximum output Raman power also decreases. Therefore, when the fiber length is reduced, a higher peak power of the pump pulse is required to improve the power conversion efficiency.
4.4. Theoretical Model
Because there are many adjustable experimental parameters in 1.7 μm FGRLs, it is necessary to establish a corresponding theoretical model to guide the actual experiment to obtain a higher output Raman power. In fact, the 1.7 μm fiber hydrogen Raman laser has the following characteristics: First, there is only a pure rotational SRS process in the HC-PCFs; second, there is only one rotational Raman line generated by the rotational SRS; and third, there is only one second-order Raman line generated by the cascade Raman conversion. Therefore, the theoretical model is greatly simplified, and a steady-state coupled wave equation considering cascaded Raman conversion and pulse shape is established [57].
where Ix is the intensity, αx is the fiber loss, υx is the frequency, and gx is the steady-state Raman gain coefficient (x means S1 for the first-order Stokes wave, S2 for the second-order Stokes wave, and P for the pump wave); z is the position of the fiber along the propagation. The boundary conditions of Equation (2) are set as follows [57]:
where I0 is the initial pump intensity, h is the Planck constant, ΔυR is the Raman linewidth, Aeff is the mode field area of the HC-PCFs, σ is the variance of the Gaussian distribution, and t is the pump pulse width.
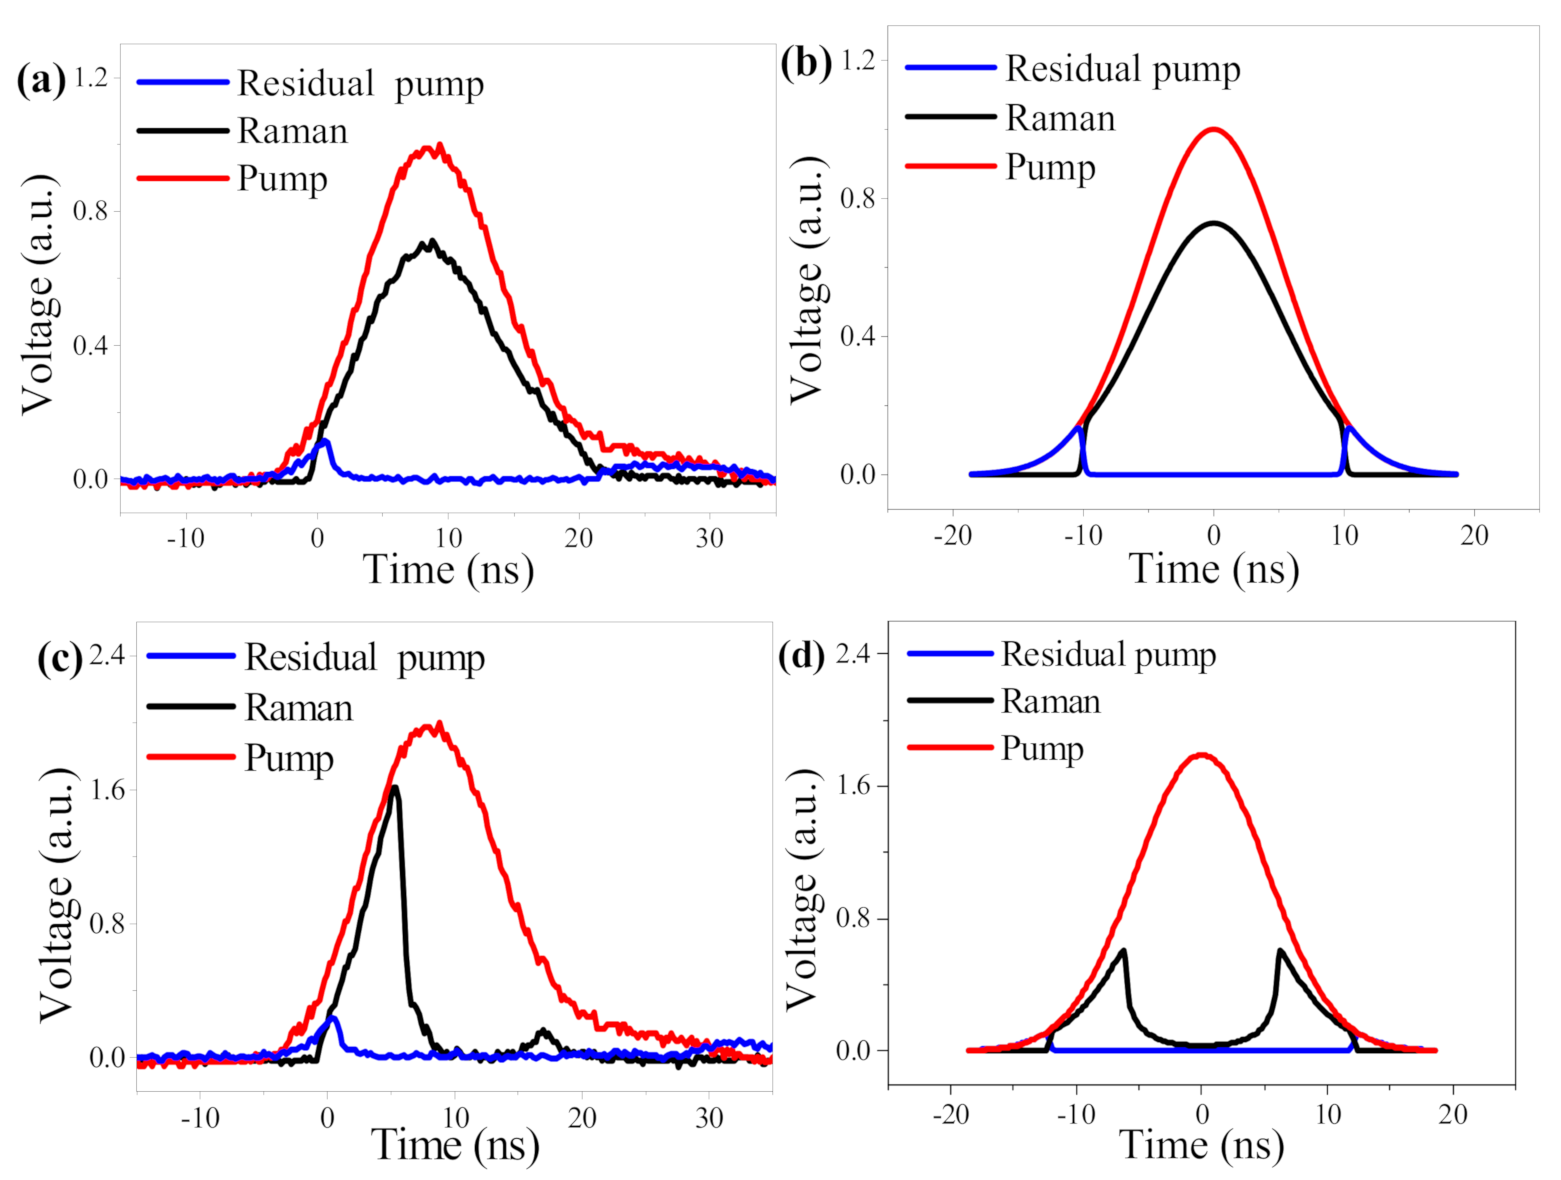
The above theoretical model is used for simulation, and simulation parameters such as fiber length, pump power, and Raman gain are set according to actual experimental conditions. The simulation and measured results of pulse shapes are shown in Figure 10 [57]. Figure 10a,b present the pulse shapes in the condition of no cascaded Raman conversion, and the simulation results reproduce the measured results very well. The center part of the pump pulse is converted into a Raman pulse, so there is a dip in the middle of the residual pump pulse. When the peak power is extremely high, the first-order Raman light is converted into second-order Raman light, so there is also a dip in the middle of the first-order Raman pulse, as shown in Figure 10c,d. The difference between the simulation and the measured results of the Raman pulse shape is caused by the gain accumulation [61], and the gain accumulation is not considered in the simulation as the pump pulse builds up.
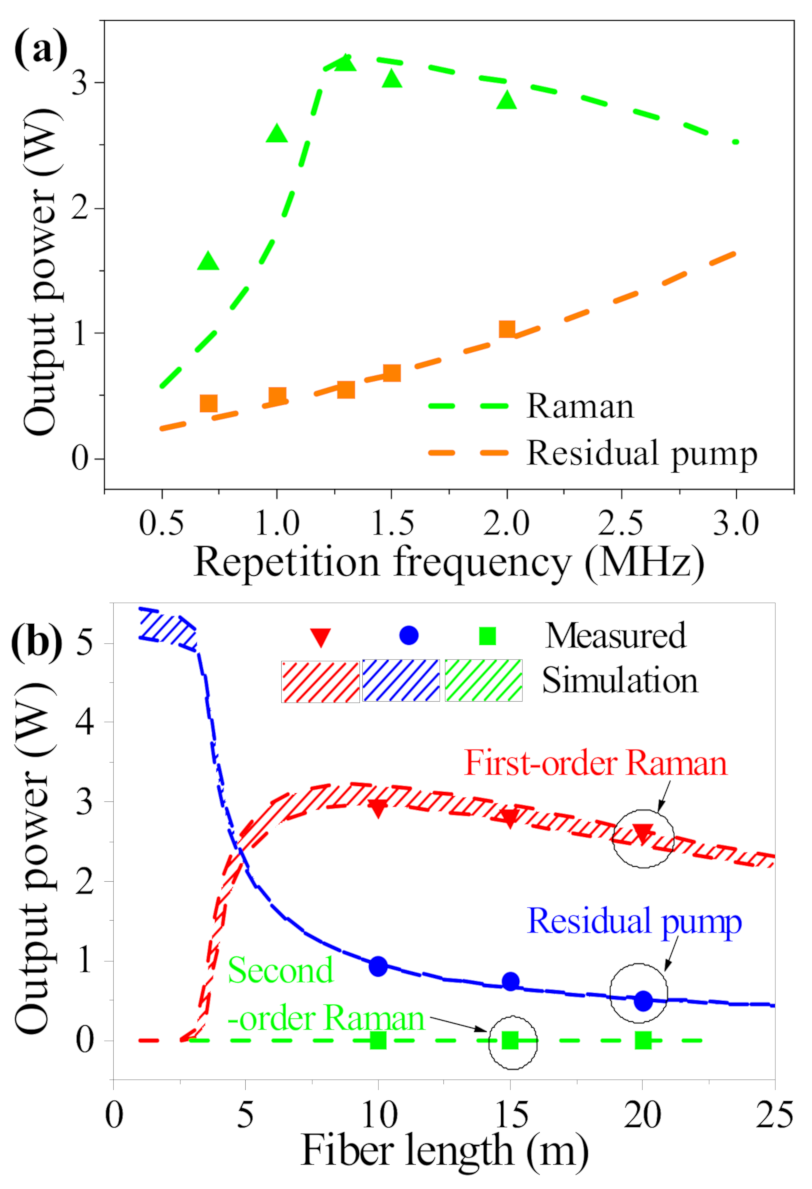
Similarly, the simulation evolution curves of the output power with the repetition frequency of the pump pulse are calculated when the fiber length, gas pressure, and average pump power are constant [30], as shown in Figure 11a. The simulation and measured results are plotted using dotted lines and solid-core patterns, respectively. It can be seen that simulation results can find the optical repetition frequency relatively accurately. Furthermore, the simulation evolution curves of the output power with the fiber length are also calculated when the pump power and gas pressure are constant [57], as shown in Figure 11b. It can be seen that the measured results are basically consistent with the simulation results. Thus, the theoretical model is relatively reliable and can have an important guiding role in achieving high-power 1.7 μm FGRLs.
5. Summary and Outlook
In summary, we reviewed the studies of 1.7 μm FGRLs based on HC-PCFs. We briefly described the principle and characteristics of HC-PCFs and the gas SRS process and systematically characterized 1.7 μm FGRLs in aspects of output spectral coverage, power-limiting factors, and a theoretical model. There are two important facts to improve the output Raman power for 1.7 μm FGRLs when the fiber length and pump power are constant. One is to keep the gas pressure at a high level to ensure Raman gain saturation in the HC-PCFs. The other is to adjust the parameters of the pump pulse so the peak power is of an appropriate value, that is, the peak power is much larger than the first-order Raman threshold and slightly smaller than the second-order Raman threshold.
We believe that 1.7 μm FGRLs will develop toward higher power and an all-fiber structure. There is no Raman power saturation in the current works, so if more pump power were coupled into the HC-PCFs, a higher output Raman power would be obtained. A useful way is to use a higher-power 1.5 μm pump source and introduce transition fibers to reduce the fusion-splice loss between HC-PCFs and solid-core fibers [62]. To realize an all-fiber structure, it is necessary to solve the problem of HC-PCFs being fusion-spliced with the solid-core fibers in the gas-filled state, which may face the danger of gas leakage and combustion [63]. Furthermore, a 1.7 μm all-fiber gas Raman laser with a Fabry–Perot cavity is also one of the development directions, and the introduction of the Fabry–Perot cavity can further reduce the Raman threshold [64]. However, because H2 molecules and D2 molecules are extremely small, they can penetrate the silica glass and overflow from the HC-PCFs, which could affect the long-term reliability of the 1.7 μm FGRL. This problem also needs to be further studied and solved.
Author Contributions
Conceptualization, Z.W.; software, H.L.; investigation, J.L. and H.L.; writing—original draft preparation, J.L.; and writing—review and editing, H.L. and Z.W. All authors have read and agreed to the published version of the manuscript.
Funding
This research was funded by the Outstanding Youth Science Fund Project of the Hunan Province Natural Science Foundation (2019JJ20023), the National Natural Science Foundation of China (NSFC) (11974427, 12004431), and the Fund of State Key Laboratory of Pulsed Power Laser Technology (SKL 2020 ZR05).
Conflicts of Interest
The authors declare no conflict of interest.
References
- Burns, M.D.; Shardlow, P.C.; Barua, P.; Jefferson-Brain, T.L.; Sahu, J.K.; Clarkson, W.A. 47 W continuous-wave 1726 nm thulium fiber laser core-pumped by an erbium fiber laser. Opt. Lett. 2019, 44, 5230–5233. [Google Scholar] [CrossRef] [PubMed]
- Zhang, Y.; Song, J.; Ye, J.; Xu, J.; Yao, T.; Zhou, P. Tunable random Raman fiber laser at 1.7 μm region with high spectral purity. Opt. Express 2019, 27, 28800–28807. [Google Scholar] [CrossRef]
- Cheng, H.; Tong, S.; Deng, X.; Liu, H.; Du, Y.; He, C. Deep-brain 2-photon fluorescence microscopy in vivo excited at the 1700 nm window. Opt. Lett. 2019, 44, 4432–4435. [Google Scholar] [CrossRef] [PubMed]
- Horton, N.G.; Xu, C. Dispersion compensation in three-photon fluorescence microscopy at 1700 nm. Biomed. Opt. Express 2015, 6, 1392–1397. [Google Scholar] [CrossRef] [PubMed] [Green Version]
- Kawagoe, H.; Ishida, S.; Aramaki, M.; Sakakibara, Y.; Omoda, E.; Kataura, H. Development of a high-power supercontinuum source at the 1.7 μm wavelength region for highly penetrative ultrahigh-resolution optical coherence tomography. Biomed. Opt. Express 2014, 5, 932–943. [Google Scholar] [CrossRef] [Green Version]
- Li, C.; Shi, J.; Gong, X.; Kong, C.; Luo, Z.; Song, L. 1.7 μm wavelength tunable gain-switched fiber laser and its application to spectroscopic photoacoustic imaging. Opt. Lett. 2018, 43, 5849–5852. [Google Scholar] [CrossRef]
- Li, C.; Shi, J.; Wang, X.; Wang, B.; Gong, X.; Song, L. High-energy all-fiber gain-switched thulium-doped fiber laser for volumetric photoacoustic imaging of lipids. Photonics Res. 2020, 8, 160–164. [Google Scholar] [CrossRef]
- Li, B.; Zheng, C.; Liu, H.; He, Q.; Ye, W.; Zhang, Y.; Pan, J.; Wang, Y. Development and measurement of a near-infrared CH4 detection system using 1.654 μm wavelength-modulated diode laser and open reflective gas sensing probe. Sens. Actuators B Chem. 2016, 225, 188–198. [Google Scholar] [CrossRef]
- Yin, T.; Qi, Z.; Chen, F.; Song, Y.; He, S. High peak-power and narrow-linewidth all-fiber Raman nanosecond laser in 1.65 μm waveband. Opt. Express 2020, 28, 7175–7181. [Google Scholar] [CrossRef]
- Li, C.; Kong, C.; Wong, K.K.Y. High Energy Noise-Like Pulse Generation from a Mode-Locked Thulium-Doped Fiber Laser at 1.7 μm. IEEE Photonics J. 2019, 11, 1–6. [Google Scholar] [CrossRef]
- Li, C.; Wei, X.; Kong, C.; Tan, S.; Chen, N.; Kang, J. Fiber chirped pulse amplification of a short wavelength mode-locked thulium-doped fiber laser. APL Photonics 2017, 2, 121302. [Google Scholar] [CrossRef] [Green Version]
- Du, T.; Ruan, Q.; Yang, R.; Li, W.; Wang, K.; Luo, Z. 1.7-μm Tm/Ho-Codoped All-Fiber Pulsed Laser Based on Intermode-Beating Modulation Technique. J. Lightwave Technol. 2018, 36, 4894–4899. [Google Scholar] [CrossRef]
- Noronen, T.; Okhotnikov, O.; Gumenyuk, R. Electronically tunable thulium-holmium mode-locked fiber laser for the 1700–1800 nm wavelength band. Opt. Express 2016, 24, 14703–14708. [Google Scholar] [CrossRef]
- Noronen, T.; Firstov, S.; Dianov, E.; Okhotnikov, O.G. 1700 nm dispersion managed mode-locked bismuth fiber laser. Sci. Rep. 2016, 6, 24876. [Google Scholar] [CrossRef] [PubMed] [Green Version]
- Khegai, A.; Melkumov, M.; Riumkin, K.; Khopin, V.; Firstov, S.; Dianov, E. NALM-based bismuth-doped fiber laser at 1.7 μm. Opt. Lett. 2018, 43, 1127–1130. [Google Scholar] [CrossRef]
- Thipparapu, N.K.; Wang, Y.; Wang, S.; Umnikov, A.A.; Barua, P.; Sahu, J.K. Bi-doped fiber amplifiers and lasers [Invited]. Opt. Mater. Express 2019, 9, 2446–2465. [Google Scholar] [CrossRef]
- Fang, X.; Wang, Z.Q.; Zhan, L. Efficient generation of all-fiber femtosecond pulses at 1.7 μm via soliton self-frequency shift. Opt. Eng. 2017, 56, 046107. [Google Scholar] [CrossRef]
- Nguyen, T.N.; Kieu, K.; Churin, D.; Ota, T.; Miyawaki, M.; Peyghambarian, N. High Power Soliton Self-Frequency Shift with Improved Flatness Ranging From 1.6 to 1.78 μm. IEEE Photonics Technol. Lett. 2013, 25, 1893–1896. [Google Scholar] [CrossRef]
- Wang, K.; Xu, C. Tunable high-energy soliton pulse generation from a large-mode-area fiber and its application to third harmonic generation microscopy. Appl. Phys. Lett. 2011, 99, 071112. [Google Scholar] [CrossRef]
- Zach, A.; Mohseni, M.; Polzer, C.; Nicholson, J.W.; Hellerer, T. All-fiber widely tunable ultrafast laser source for multimodal imaging in nonlinear microscopy. Opt. Lett. 2019, 44, 5218–5221. [Google Scholar] [CrossRef]
- Becheker, R.; Tang, M.; Hanzard, P.H.; Tyazhev, A.; Mussot, A.; Kudlinski, A. High-energy dissipative soliton-driven fiber optical parametric oscillator emitting at 1.7 μm. Laser Phys. Lett. 2018, 15, 115103. [Google Scholar] [CrossRef]
- Qin, Y.; Batjargal, O.; Cromey, B.; Kieu, K. All-fiber high-power 1700 nm femtosecond laser based on optical parametric chirped-pulse amplification. Opt. Express 2020, 28, 2317–2325. [Google Scholar] [CrossRef] [PubMed] [Green Version]
- Tang, M.; Becheker, R.; Hanzard, P.H.; Tyazhev, A.; Oudar, J.L.; Mussot, A. Low Noise High-Energy Dissipative Soliton Erbium Fiber Laser for Fiber Optical Parametric Oscillator Pumping. Appl. Sci. 2018, 8, 2161. [Google Scholar] [CrossRef] [Green Version]
- Zeng, J.; Akosman, A.E.; Sander, M.Y. Supercontinuum Generation from a Thulium Ultrafast Fiber Laser in a High NA Silica Fiber. IEEE Photonics Technol. Lett. 2019, 31, 1787–1790. [Google Scholar] [CrossRef]
- Chung, H.Y.; Liu, W.; Cao, Q.; Kartner, F.X.; Chang, G. Er-fiber laser enabled, energy scalable femtosecond source tunable from 1.3 to 1.7 μm. Opt. Express 2017, 25, 15760–15771. [Google Scholar] [CrossRef] [PubMed] [Green Version]
- Grimes, A.; Hariharan, A.; Sun, Y.; Ovtar, S.; Kristensen, P.; Westergaard, P.G.; Rako, S.; Baumgarten, C.; Stoneman, R.C.; Nicholson, J.W.; et al. Hundred-watt CW and Joule level pulsed output from Raman fiber laser in 1.7-μm band. In Proceedings of the SPIE 11260, Fiber Lasers XVII: Technology and Systems, San Francisco, CA, USA, 21 February 2020. [Google Scholar]
- Cui, Y.; Huang, W.; Li, Z.; Zhou, Z.; Wang, Z. High-efficiency laser wavelength conversion in deuterium-filled hollow-core photonic crystal fiber by rotational stimulated Raman scattering. Opt. Express 2019, 27, 30396–30404. [Google Scholar] [CrossRef]
- Huang, W.; Li, Z.; Cui, Y.; Zhou, Z.; Wang, Z. Efficient, watt-level, tunable 1.7 µm fiber Raman laser in H2-filled hollow-core fibers. Opt. Lett. 2020, 45, 475–478. [Google Scholar] [CrossRef]
- Li, H.; Huang, W.; Cui, Y.; Zhou, Z.; Wang, Z. 3W tunable 1.65 µm fiber gas Raman laser in D2-filled hollow-core photonic crystal fibers. Opt. Laser Technol. 2020, 132, 106474. [Google Scholar] [CrossRef]
- Li, H.; Pei, W.; Huang, W.; Cui, Y.; Wang, M.; Wang, Z. Highly efficient nanosecond 1.7 μm fiber gas Raman laser by H2-filled hollow-core photonic crystal fibers. Crystals 2021, 11, 32. [Google Scholar] [CrossRef]
- Cregan, R.F.; Mangan, B.J.; Knight, J.C.; Birks, T.A.; Russell, P.S.J.; Roberts, P.J.; Allan, D.C. Single-Mode Photonic Band Gap Guidance of Light in Air. Science 1999, 285, 1537–1539. [Google Scholar] [CrossRef] [Green Version]
- Mangan, B.J.; Farr, L.; Langford, A.; Roberts, P.J.; Williams, D.P.; Couny, F.; Lawman, M.; Mason, M.; Coupland, S.; Flea, R. Low loss (1.7 dB/km) hollow core photonic bandgap fiber. In Proceedings of the Optical Fiber Communication Conference, Los Angeles, CA, USA, 22 February 2004. [Google Scholar]
- Roberts, P.J.; Couny, F.; Sabert, H.; Mangan, B.J.; Russell, P.S.J. Ultimate low loss of hollow-core photonic crystal fibres. Opt. Express 2005, 13, 236–244. [Google Scholar] [CrossRef] [PubMed] [Green Version]
- Zhang, X.; Gao, S.; Wang, Y.; Ding, W.; Wang, X.; Wang, P. 7-cell hollow-core photonic bandgap fiber with broad spectral bandwidth and low loss. Opt. Express 2019, 27, 11608–11616. [Google Scholar] [CrossRef] [PubMed]
- Smith, C.M.; Venkataraman, N.; Gallagher, M.T.; Muller, D.; West, J.A.; Borrelli, N.F.; Allan, D.C.; Koch, K.W. Low-loss hollow-core silica/air photonic bandgap fibre. Nature 2003, 424, 657–659. [Google Scholar] [CrossRef] [PubMed]
- Benabid, F.; Knight, J.C.; Antonopoulos, G.; Russell, P.S.J. Stimulated Raman scattering in hydrogen-filled hollow-core photonic crystal fiber. Science 2002, 298, 399–402. [Google Scholar] [CrossRef]
- Couny, F.; Benabid, F.; Light, P.S. Large-pitch kagome-structured hollow-core photonic crystal fiber. Opt. Lett. 2006, 31, 3574–3576. [Google Scholar] [CrossRef]
- Couny, F.; Benabid, F.; Roberts, P.J.; Light, P.S.; Raymer, M.G. Generation and photonic guidance of multi-octave optical-frequency combs. Science 2007, 318, 1118–1121. [Google Scholar] [CrossRef]
- Pearce, G.J.; Wiederhecker, G.S.; Poulton, C.G.; Burger, S. Models for guidance in kagome-structured hollow-core photonic crystal fibres. Opt. Express 2007, 15, 12680–12685. [Google Scholar] [CrossRef] [Green Version]
- Debord, B.; Amsanpally, A.; Chafer, M.; Baz, A.; Maurel, M.; Blondy, J.M.; Hugonnot, E.; Scol, F.; Vincetti, L.; Gérôme, F.; et al. Ultralow transmission loss in inhibited-coupling guiding hollow fibers. Optica 2017, 4, 209–217. [Google Scholar] [CrossRef] [Green Version]
- Litchinitser, N.M.; Abeeluck, A.K.; Headley, C. Antiresonant reflecting photonic crystal optical waveguides. Opt. Lett. 2002, 27, 1592–1594. [Google Scholar] [CrossRef]
- Wang, Y.Y.; Wheeler, N.V.; Couny, F. Low loss broadband transmission in hypocycloid-core Kagome hollow-core photonic crystal fiber. Opt. Lett. 2011, 36, 669–671. [Google Scholar] [CrossRef]
- Gérôme, F.; Jamier, R.; Auguste, J.L. Simplified hollow-core photonic crystal fiber. Opt. Lett. 2010, 35, 1157–1159. [Google Scholar] [CrossRef] [PubMed]
- Pryamikov, A.D.; Biriukov, A.S.; Kosolapov, A.F.; Plotnichenko, V.G.; Semjonov, S.L.; Dianov, E.M. Demonstration of a waveguide regime for a silica hollow-core micro structured optical fiber with a negative curvature of the core boundary in the spectral region >3.5 μm. Opt. Express 2011, 19, 1441–1448. [Google Scholar] [CrossRef] [PubMed]
- Yu, F.; Wadsworth, W.J.; Knight, J.C. Low loss silica hollow core fibers for 3–4 μm spectral region. Opt. Express 2012, 20, 11153–11158. [Google Scholar] [CrossRef] [Green Version]
- Kolyadin, A.N.; Kosolapov, A.F.; Pryamikov, A.D.; Biriukov, A.S.; Plotnichenko, V.G.; Dianov, E.M. Light transmission in negative curvature hollow core fiber in extremely high material loss region. Opt. Express 2013, 21, 9514–9519. [Google Scholar] [CrossRef] [PubMed]
- Gao, S.F.; Wang, Y.Y.; Liu, X.L. Bending loss characterization in nodeless hollow-core anti-resonant fiber. Opt. Express 2016, 24, 14801–14811. [Google Scholar] [CrossRef]
- Bradley, T.D.; Jasion, G.T.; Hayes, J.R. Antiresonant Hollow Core Fibre with 0.65 dB/km Attenuation across the C and L Telecommunication bands. In Proceedings of the 45th European Conference on Optical Communication, Dublin, Ireland, 26 September 2019. [Google Scholar]
- Jasion, G.T.; Bradley, T.D.; Harrington, K.; Sakr, H.; Chen, Y.; Fokoua, E.N.; Davidson, I.A.; Taranta, A.; Hayes, J.R.; Richardson, D.J. Hollow Core NANF with 0.28 dB/km Attenuation in the C and L Bands. In Proceedings of the 2020 Optical Fiber Communications Conference and Exhibition, San Diego, CA, USA, 8 March 2020. [Google Scholar]
- Vincetti, L.; Setti, V. Extra loss due to Fano resonances in inhibited coupling fibers based on a lattice of tubes. Opt. Express 2012, 20, 14350–14361. [Google Scholar] [CrossRef] [Green Version]
- Jaworski, P.; Yu, F.; Maier, R.R.J.; Wadsworth, W.J.; Knight, J.C.; Shephard, J.D.; Hand, D.P. Picosecond and nanosecond pulse delivery through a hollow-core Negative Curvature Fiber for micro-machining applications. Opt. Express 2013, 21, 22742–22753. [Google Scholar] [CrossRef] [Green Version]
- Bufetov, I.A.; Kosolapov, A.F.; Pryamikov, A.D.; Gladyshev, A.V.; Kolyadin, A.N.; Krylov, A.A.; Yatsenko, Y.P.; Biriukov, A.S. Revolver Hollow Core Optical Fibers. Fibers 2018, 6, 39. [Google Scholar] [CrossRef] [Green Version]
- Komanec, M.; Dousek, D.; Suslov, D.; Zvanove, S. Hollow-Core Optical Fibers. Radioengineering 2020, 29, 417–430. [Google Scholar] [CrossRef]
- Minck, R.W.; Terhune, R.W.; Rado, W.G. Laser stimulated Raman effect and resonant four-photon interactions in gases H2, D2, and CH4. Appl. Phys. Lett. 1963, 3, 181–183. [Google Scholar] [CrossRef]
- Brink, D.J.; Proch, D. Efficient tunable ultraviolet source based on stimulated Raman scattering of an excimer-pumped dye laser. Opt. Lett. 1982, 7, 494–496. [Google Scholar] [CrossRef] [PubMed]
- Loree, T.R.; Cantrell, C.D.; Barker, D.L. Stimulated Raman emission at 9.2 μm from hydrogen gas. Opt. Commun. 1976, 17, 160–162. [Google Scholar] [CrossRef]
- Li, H.; Huang, W.; Cui, Y.; Zhou, Z.; Wang, Z. Pure rotational stimulated Raman scattering in H2-filled hollow-core photonic crystal fibers. Opt. Express 2020, 28, 23881–23897. [Google Scholar] [CrossRef]
- Teal, G.K.; MacWood, G.E. The Raman Spectra of the Isotopic Molecules H2, HD, and D2. J. Chem. Phys. 1935, 3, 760–764. [Google Scholar] [CrossRef]
- Aghaie, K.Z.; Digonnet, M.J.F.; Fan, S. Optimization of the splice loss between photonic-bandgap fibers and conventional single-mode fibers. Opt. Lett. 2010, 35, 1938–1940. [Google Scholar] [CrossRef] [Green Version]
- Bischel, W.K.; Dyer, M.J. Wavelength dependence of the absolute Raman gain coefficient for the Q(1) transition in H2. J. Opt. Soc. Am. B 1986, 3, 677–682. [Google Scholar] [CrossRef]
- Benabid, F.; Antonopoulos, G.; Knight, J.C.; Russell, P.S.J. Stokes amplification regimes in quasi-cw pumped hydrogen-filled hollow-core photonic crystal fiber. Phys. Rev. Lett. 2005, 95, 213903. [Google Scholar] [CrossRef]
- Gao, S.; Wang, Y.; Tian, C.; Wang, P. Splice Loss Optimization of a Photonic Bandgap Fiber via a High V-Number Fiber. IEEE Photonics Technol. Lett. 2014, 26, 2134–2137. [Google Scholar] [CrossRef]
- Benabid, F.; Couny, F.; Knight, J.C.; Birks, T.A.; Russell, P.S. Compact, stable and efficient all-fibre gas cells using hollow-core photonic crystal fibres. Nature 2005, 434, 488–491. [Google Scholar] [CrossRef]
- Couny, F.; Benabid, F.; Light, P.S. Subwatt threshold cw Raman fiber-gas laser based on H2-filled hollow-core photonic crystal fiber. Phys. Rev. Lett. 2007, 99, 143903. [Google Scholar] [CrossRef]
Figure 1.
The output average powers and corresponding pulse widths of reported 1.7 μm pulsed fiber lasers.
Figure 1.
The output average powers and corresponding pulse widths of reported 1.7 μm pulsed fiber lasers.

Figure 2.
The schematic cross section of HC-PCFs. (a) The first PBG-HCF [31], (b) low-loss PBG-HCF [32], and (c) broadband PBG-HCF [34].

Figure 3.
The schematic cross section of HC-PCFs. (a) The first AR-HCF [36], (b) hypocycloid Kagome AR-HCFs [42], (c) single-ring AR-HCFs [44], (d) ice-cream-type AR-HCF [45], (e) nodeless single-ring AR-HCFs [46], and (f) nodeless nested AR-HCFs [48].

Figure 4.
The simplified schematic diagram of the interaction between lasers and gas in (a) traditional gas Raman lasers and (b) fiber gas Raman lasers.
Figure 4.
The simplified schematic diagram of the interaction between lasers and gas in (a) traditional gas Raman lasers and (b) fiber gas Raman lasers.


Figure 6.
(a) The schematic diagram of a typical experimental setup of 1.7 μm FGRLs and (b) the transmission spectrum of the used HC-PCFs. Insert: optical micrograph of a cross section of the used HC-PCFs [57].
Figure 6.
(a) The schematic diagram of a typical experimental setup of 1.7 μm FGRLs and (b) the transmission spectrum of the used HC-PCFs. Insert: optical micrograph of a cross section of the used HC-PCFs [57].

Figure 7.
The output spectra of 1.7 μm FGRLs based on (a) D2-filled [27] and (b) H2-filled HC-PCFs [28] when the pump wavelength is from 1535 to 1565 nm and the fiber length is 20 m.

Figure 8.
The output Raman power as a function of coupled pump power at different (a) pump wavelengths and (b) gas pressures when the fiber length is 20 m [27].
Figure 8.
The output Raman power as a function of coupled pump power at different (a) pump wavelengths and (b) gas pressures when the fiber length is 20 m [27].

Figure 9.
The output Raman power as a function of coupled pump power (a) at different repetition frequencies of the pump pulse when the fiber length is 20 m and the gas pressure is 16 bar and (b) at different fiber lengths when the repetition frequency is 1.5 MHz and the gas pressure is 16 bar [29].

Figure 10.
(a,c) Measured pulse shapes of pump light, first-order Raman light, and residual pump light; (b,d) corresponding simulation results [57].
Figure 10.
(a,c) Measured pulse shapes of pump light, first-order Raman light, and residual pump light; (b,d) corresponding simulation results [57].

Figure 11.
(a) The output power as a function of repetition frequency of the pump pulse when the fiber length, gas pressure, and average pump power are constant, and the dotted lines and solid-core patterns represent simulation and measured results, respectively [30]; (b) the output power as a function of fiber length when the pump power and gas pressure are constant [57].


Table 1.
Different pump wavelengths, Raman frequency shift, and corresponding output Raman wavelengths.
Table 1.
Different pump wavelengths, Raman frequency shift, and corresponding output Raman wavelengths.
| Gain Gases | Raman Frequency Shift | Raman Wavelength Pumped at 1064 nm | Raman Wavelength Pumped at 1550 nm |
|---|---|---|---|
| H2 | 4155 cm−1 | 1907 nm | 4354 nm |
| 814 cm−1 | 1165 nm | 1773 nm | |
| 587 cm−1 | 1135 nm | 1705 nm | |
| 354 cm−1 | 1106 nm | 1640 nm | |
| D2 | 2987 cm−1 | 1560 nm | 2886 nm |
| 415 cm−1 | 1113 nm | 1656 nm | |
| 297 cm−1 | 1098 nm | 1625 nm | |
| 179 cm−1 | 1084 nm | 1594 nm |
Publisher’s Note: MDPI stays neutral with regard to jurisdictional claims in published maps and institutional affiliations. |
© 2021 by the authors. Licensee MDPI, Basel, Switzerland. This article is an open access article distributed under the terms and conditions of the Creative Commons Attribution (CC BY) license (http://creativecommons.org/licenses/by/4.0/).
Share and Cite
MDPI and ACS Style
Li, J.; Li, H.; Wang, Z. Application of Hollow-Core Photonic Crystal Fibers in Gas Raman Lasers Operating at 1.7 μm. Crystals 2021, 11, 121. https://doi.org/10.3390/cryst11020121
AMA Style
Li J, Li H, Wang Z. Application of Hollow-Core Photonic Crystal Fibers in Gas Raman Lasers Operating at 1.7 μm. Crystals. 2021; 11(2):121. https://doi.org/10.3390/cryst11020121
Chicago/Turabian StyleLi, Jun, Hao Li, and Zefeng Wang. 2021. "Application of Hollow-Core Photonic Crystal Fibers in Gas Raman Lasers Operating at 1.7 μm" Crystals 11, no. 2: 121. https://doi.org/10.3390/cryst11020121
Note that from the first issue of 2016, this journal uses article numbers instead of page numbers. See further details here.