Capillary Flows of Nematic Liquid Crystal
by
 and
and
Dina V. Shmeliova
1, 
Sergey V. Pasechnik
1,*,
Semen S. Kharlamov
1,
Alexandre V. Zakharov
1,2,
Eugeny P. Pozhidaev
3,
Vadim A. Barbashov
3 and
Timofey P. Tkachenko
3 1
Problem Laboratory of Molecular Acoustics, MIREA—Russian Technological University, 78 Vernadsky Avenue, 119454 Moscow, Russia
2
Saint Petersburg Institute for Machine Sciences, The Russian Academy of Sciences, 199178 Saint Petersburg, Russia
3
P. N. Lebedev Physical Institute, Leninsky Pr. 53, 119991 Moscow, Russia
*
Author to whom correspondence should be addressed.
Crystals 2020, 10(11), 1029; https://doi.org/10.3390/cryst10111029
Submission received: 8 October 2020
/
Revised: 2 November 2020
/
Accepted: 5 November 2020
/
Published: 11 November 2020
(This article belongs to the Special Issue Structural and Optical Properties of Smectic Films)
Abstract
:In this paper we report the new experimental results on the rise of a liquid crystal in flat capillaries with inner photosensitive surfaces. The capillaries with different surface orientations were prepared by the use of the photo-alignment technique. Such a surface treatment makes it possible to eliminate the noncontrollable influence of a nanorelief on the wetting process, which takes place in the rubbing treatment technique previously used in similar experiments. The dynamics of the capillary rise of a nematic liquid crystal 5CB (4-cyano-4′-pentylbiphenyl) in vertical plane capillaries with photo-aligned substrates were studied for the first time. It was found that the stationary value of a contact angle weakly depends on the direction of a planar surface orientation relative to the direction of a capillary rise. It has been shown that the application of strong electric fields resulted in a decreasing of the contact angle. The results, obtained for the nematic liquid crystal, are compared with the results of an investigation of the capillary flow in a shock-free ferroelectric smectic phase.
1. Introduction
The investigation of the wetting of solid surfaces by different liquids is an interesting issue, both from an academic and a technological point of view [1,2]. It is important to explore the dynamics of the director reorientation in a nematic liquid crystal (LC) phase confined to thin or ultrathin channels or capillaries [1,3]. These processes were investigated using different experimental methods, for example by the study of liquid (isotropic and anisotropic) drops spreading over both isotropic and anisotropic surfaces [4,5,6,7,8], including those with the micro (nano) relief [7]. In turn, the alternative well-established technique is based on the arising of liquids in vertical capillaries with different cross sections. This technique allows the determination of static parameters (surface tension coefficient, static contact angle) and the investigation of a specific decay capillary flow. It should be noted that both experimental and theoretical studies of the capillary rise of isotropic liquids have a long history [9,10,11,12]. At the same time, the dynamics of the capillary decay flow of liquid crystals are not well explored. In particular, the roles of anisotropic surface interactions and the bulk anisotropy of the nematic phase in this process are still unclear. In the presence of external and internal forces, the relaxation of the director n(r,t) into its equilibrium orientation neq(r) is governed by elastic, electric, viscous, and anchoring torques, as well as by forces exerted per unit of LC volume [13]. The intrinsic connection between flow gradients and the overall orientation of LC molecules described in terms of the director field n(r,t) is responsible for the non-Newtonian character of liquid crystal flows. The fact that in the case of a Poiseuille flow of LC through capillaries of different cross sections the effective shear viscosity ηeff depends on the flow rate, the size of capillaries and the orientation of the boundaries were experimentally established and explained in the framework of the Ericksen–Leslie hydrodynamic theory [14]. It is also established that a strong magnetic field B applied to the flowing liquid crystals has a stabilizing effect on the equilibrium director orientation neq(r) = n0, which ultimately provides the Newtonian-like behavior of an effective shear viscosity ηeff = ηeff (n0) [13]. For the flow through the flat capillary of a gap h that is much smaller than the width A, the three principal shear viscosity coefficients (Miesowicz viscosities) are η1 = η1(n0 IIez) when n0 is parallel to ez, η2 = η2(n0 IIv) when n0 is parallel to v, and η3 = η3(n0 Iez,v) when n is orthogonal to both v and ez [14], respectively. Here, ez is the unit vector oriented along the normal to the boundaries of the flat capillary. The precise measurements of the Miesowicz viscosities [15] can provide the most reliable information about dissipative and reactive parameters (the so-called Leslie coefficients αi, i = 1…6) that are used in Ericksen–Leslie theory [16].
Previously, it was shown that the stabilizing effect of the magnetic field in shear viscosity measurements can be replaced by surface induced orientation [17]. In this case, the three Miesowicz viscosities can be obtained by means of different surface treatments of the inner surfaces of the flat capillary. Such a technique is more suitable for the us of newly synthesized LC materials because it demands small amounts of LC material. Experimental realization of this idea was achieved via the use of a decay Poiseuille flow, arising in a flat capillary under the difference in hydrostatic pressure ΔP(t) = ρgΔH(t). Here, ρ is the density of the LC phase, g is the gravitational constant, and ΔH(t) is the difference between the levels in two vertical open tubes connected with a capillary. In this case, the decay time of the flow τd is proportional to the effective viscosity coefficient ηeff, and can be used to derive the three principal viscosities corresponding to the abovementioned geometries. Later, an additional modification of this method accounting for the electric field and photo-controlled surfaces is proposed [18,19].
In turn, the current investigations are also based on the usage of the decay flow of the LC phase through the flat vertically oriented capillary. Contrary to the abovementioned flow, the current case is controlled by three forces:
- i.
- first, the capillary force Fc, which induces the rise of a meniscus;
- ii.
- second, the gravity force Fg, which is proportional to the height of the rise of the LC phase and acts against the capillary force until the total stop of a meniscus motion;
- iii.
- third, the viscous force Fv, proportional to the velocity of a meniscus motion and also acting against the capillary force.
The investigation of such types fulfilled with isotropic liquids turned out to be useful for the study of both the bulk (viscosity) and the surface (wetting) phenomena [10]. The latter are controlled by the physical mechanisms acting on both the mesoscopic and microscopic lengths, including the absorption–desorption processes during the motion of the precursor film. Previously, such a phenomena of spreading the LC droplets over the anisotropic surfaces with submicron relief has been investigated [7]. The main aim of our experiments is to clarify the effects of both the surface and the bulk properties of the liquid crystal phase on the wetting processes, which are responsible for the decay of the capillary flow of anisotropic liquids.
A significant difference between our research and numerous experiments on the capillary rise of isotropic liquids in capillaries with a circular cross section [10] is the use of flat capillaries with photo-controlled surfaces. The latter provides surfaces with essentially identical properties, except for surface orientation (easy axes direction), which defines, in combination with the flow and electric field, the orientational structure in the bulk of the LC layer. This approach is proposed here, to our knowledge, for the first time.
2. Materials and Methods
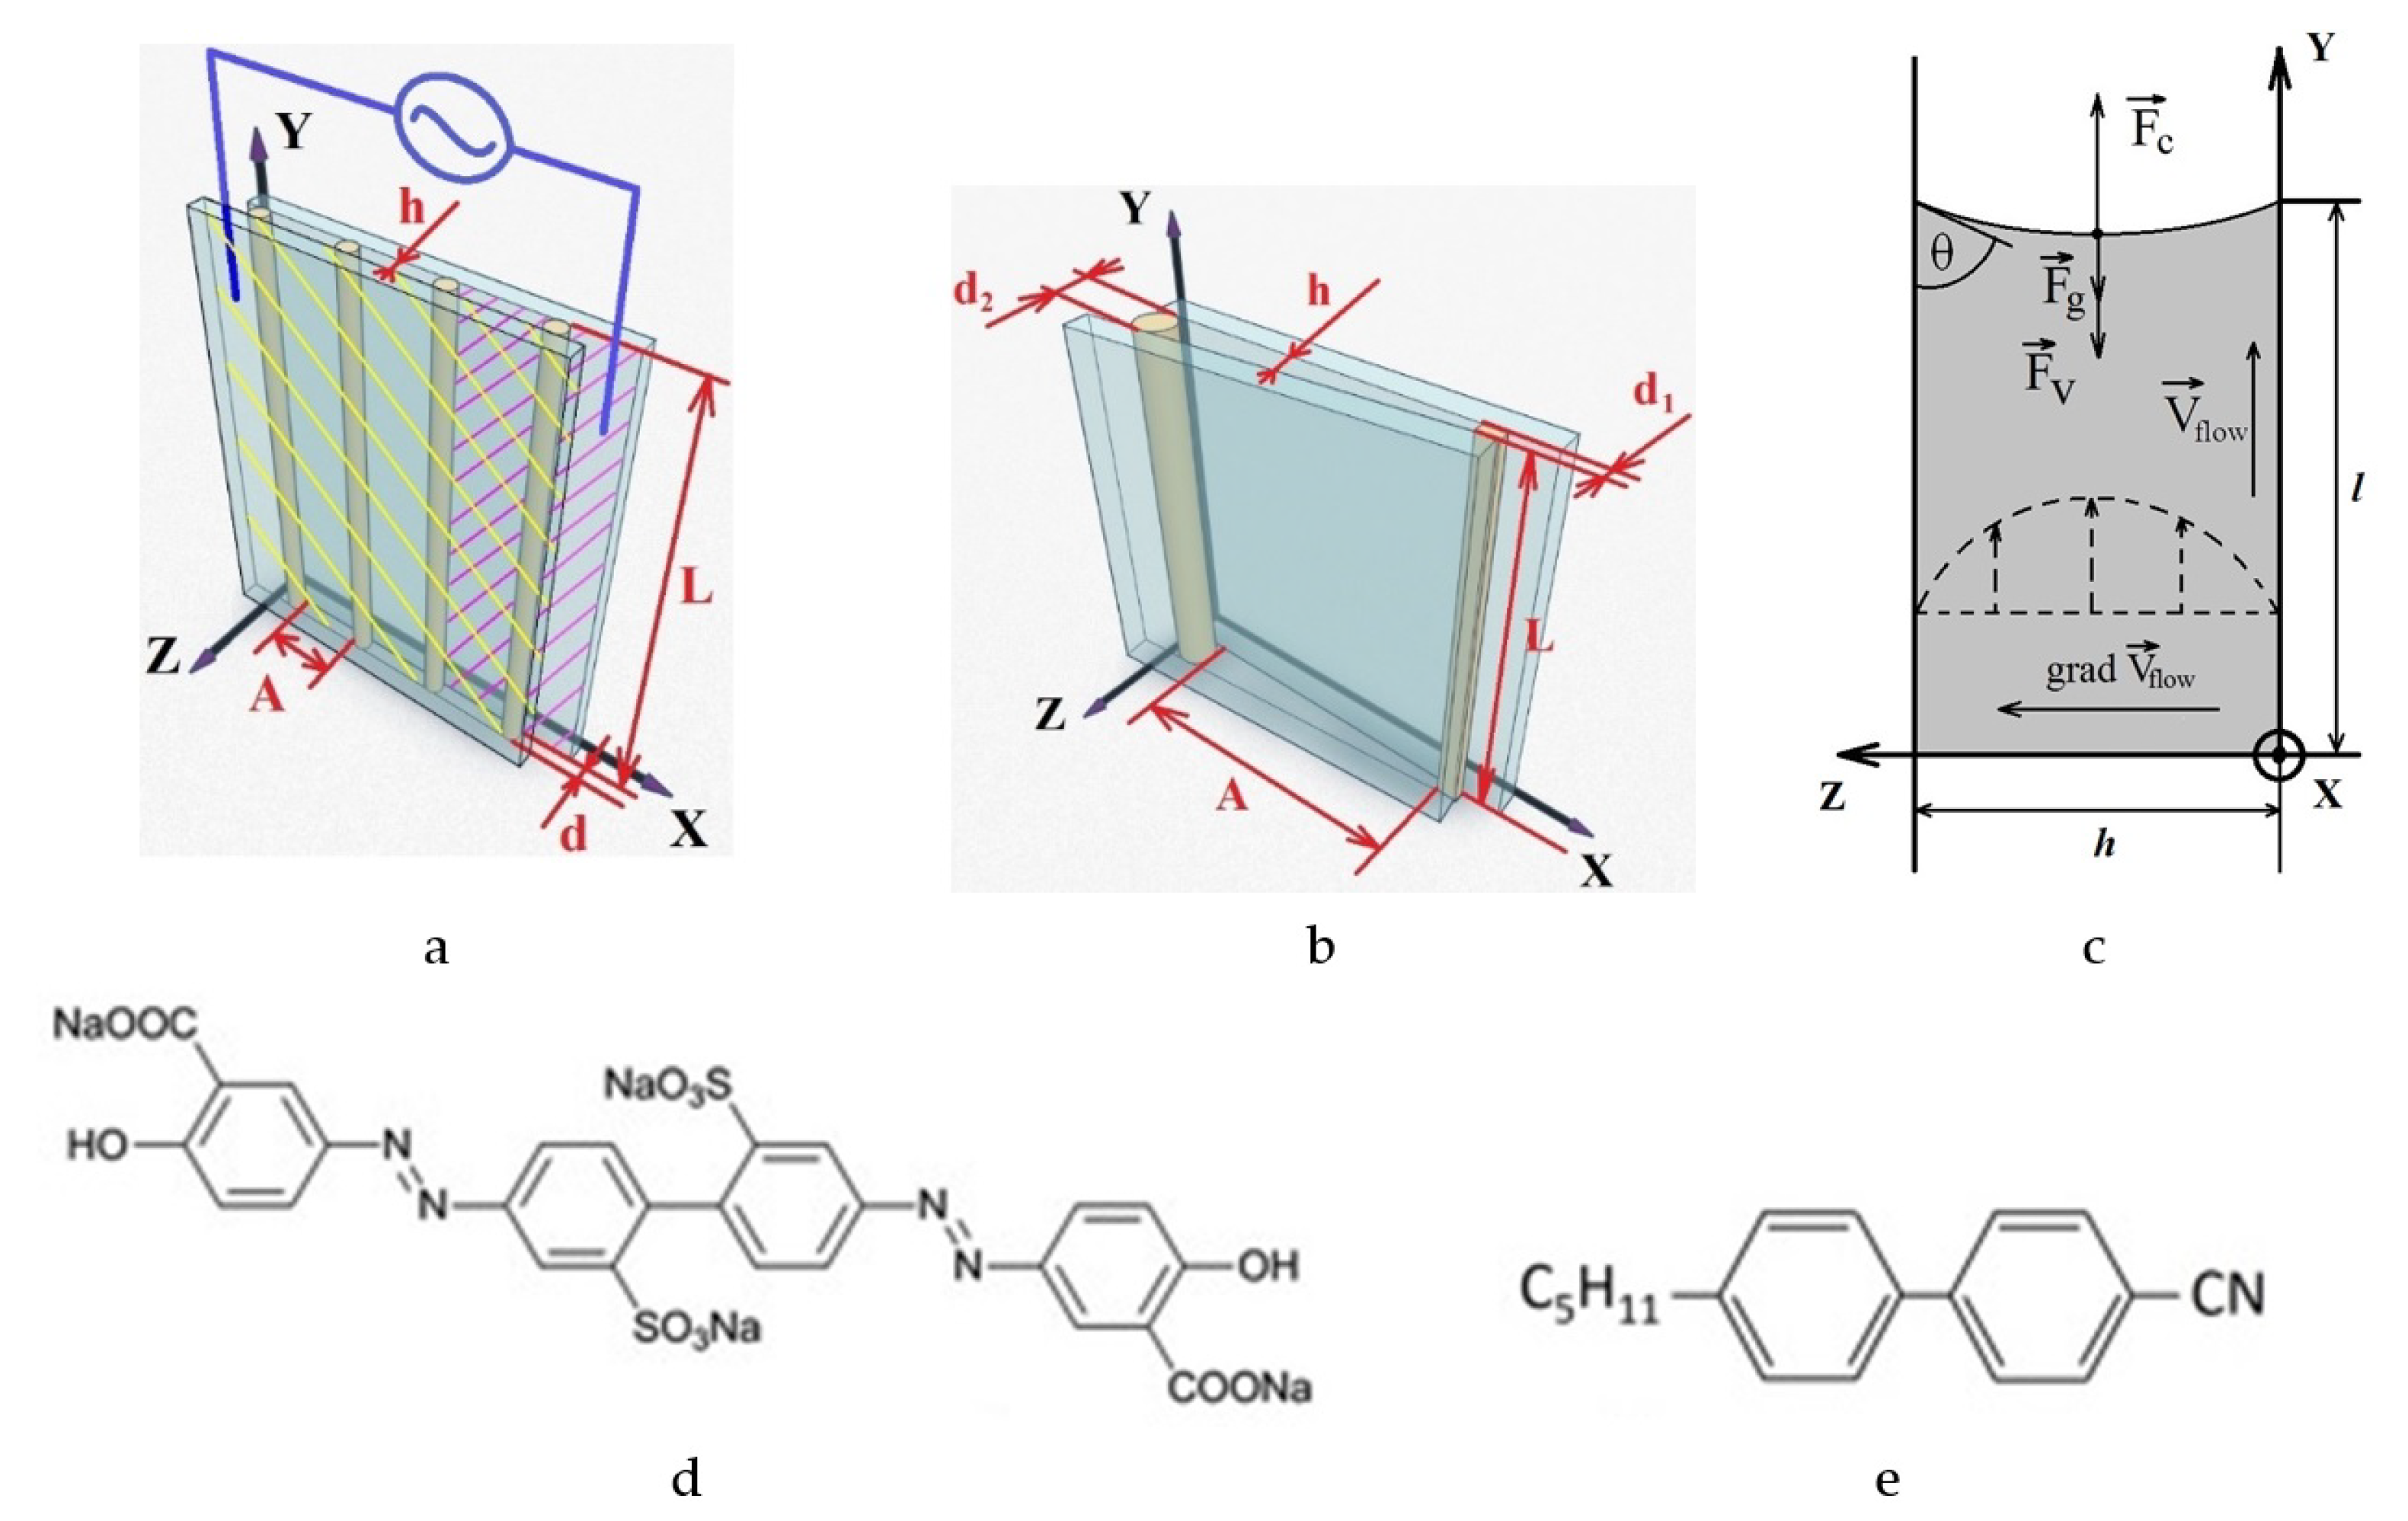
The construction of the sandwich-like LC cells of the first type (cells 1 and 2) with a constant gap is shown in Figure 1a. It consists of the two glass plates (of thickness 1.1 mm) coated with ITO (indium tin oxide) transparent electrodes. In our experiments, the ITO coating on one of the glass substrates was partly deleted to provide the application of alternating electric voltage U of frequency f to one of the two local capillaries with the same surface orientation. This revealed the effect of the electric field on the wetting and viscosity properties of liquid crystals. The inner surfaces of the plates were thoroughly cleaned to establish strongly water-wet glass surfaces and spin coated by 0.5% solution of azo sulphiric dye (SD-1) in dimethyl formamide (DMF) and baked at 90 °C for a 1 h to provide a thin nanometer layer of a dye.
Afterwards, the plates were stacked with the help of spacers (nylon thread of the given diameter d) and fixed by clue to form the three or two flat channels of the gap h, width A and length L (see Table 1). Each of the channels were treated by ultraviolet (UV) linear polarized irradiation (λ = 345 nm) of the same exposure dose (D = 0.45 W/cm2) but different orientation of a polarization plane. In accordance with the photoalignment technique, previously used in photonics [20,21], this procedure provides different orientation of azo dye molecules without changes in the nano scaled relief of the surface and corresponding surface orientation of LC, described by the surface director ns, after filling the cell. Contrary to the similar experiments [22] where the rubbing technique was used, it allows to study the net effect of anisotropy on wetting and capillary phenomena.
The cell of the second type (wedge-like cell 3), shown in Figure 1b, was prepared mostly in the same manner as that described above except for the use of two linear spacers of an essentially different diameters (d1 and d2) fixed at the distance A (see Table 1). This allowed us to study the capillary flow with a continuous change in the thickness h of the LC layer in the direction normal to the flow direction. The photoalignment technique, described above provided the initial surface orientation of LC layer normal to the flow direction. The small value of the wedge angle (about 0.1 deg) gave reason to consider the wedge-like capillary as a large number of independent parallel capillaries with a constant gap. Thus, the theoretically predicted dependences of the flow parameters on the thickness of the LC layer can be verified experimentally.
After filling the cell with a liquid crystal, the values of a capillary gap h were additionally determined by measuring the electrically induced birefringence changes as polarized laser radiation propagated through the LC layer. These values, presented in Table 1 slightly exceeded the spacers’ diameters most likely due to insufficient compression of the cell during cluing.
After preparation, the vertically oriented cell was quickly immersed in the rectangular vessel filled with LC, which led to the appearance of a capillary flow recorded by a digital camera. The use of two crossed polarizers, oriented at an angle of 45 degrees to the flow direction, provided control of orientational structure of LC. Digital image processing allowed us to identify the time dependence of the contact line displacement l(t) in different parts of the cell.
In our experiments we used the standard nematic liquid crystal 5CB (4-cyano-4′-pentylbiphenyl) with a measured clearing temperature Tc = 35 ± 0.2 °C. All measurements in the nematic phase were carried out at temperature T = 24 ± 0.5 °C for cell 1 and T = 27 ± 0.5 °C for cells 2 and 3. The experiments were carried out in a thermostatically controlled chamber. Before the start of the experiment, the empty cell and the vessel with LC were placed in a thermostat for half an hour to minimize temperature gradients. The temperature deviation from the given value did not exceed ±0.5 K during the entire experimental period.
The choice of 5CB was dictated by the available information on electrical, optical, viscous and elastic properties [13,14]. In addition, the large positive value of ∆ε = 11 for 5CB provided the effective electrical control of the rheological behavior of this nematic in the capillary flow. In particular, the use of a strong electric field stabilized the orientation of the LC, which made it possible to use the approximation of a conditionally Newtonian fluid in the analysis of flow phenomena.
3. Results and Discussion
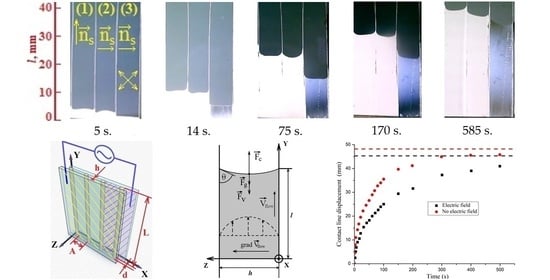
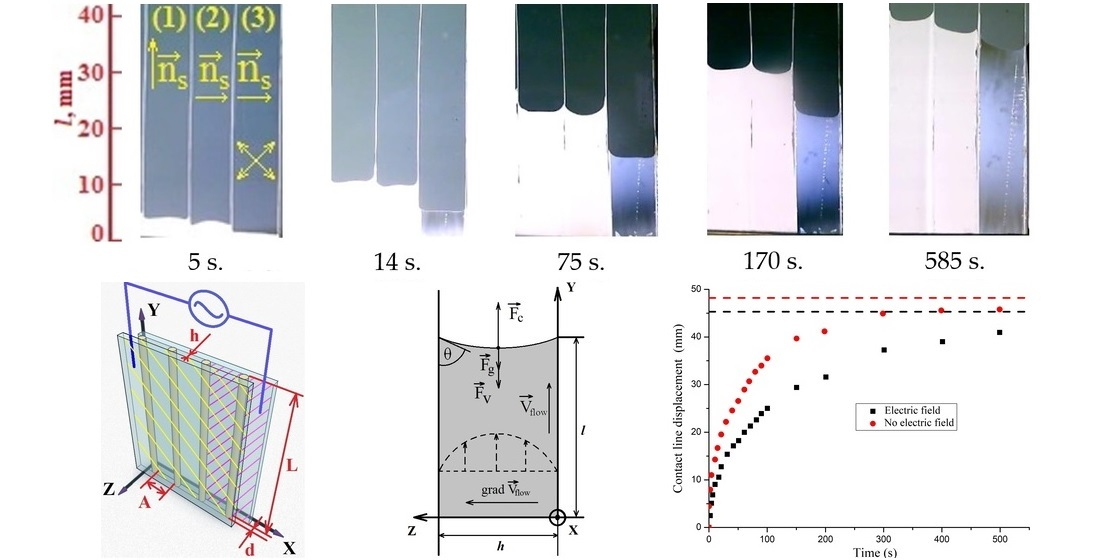
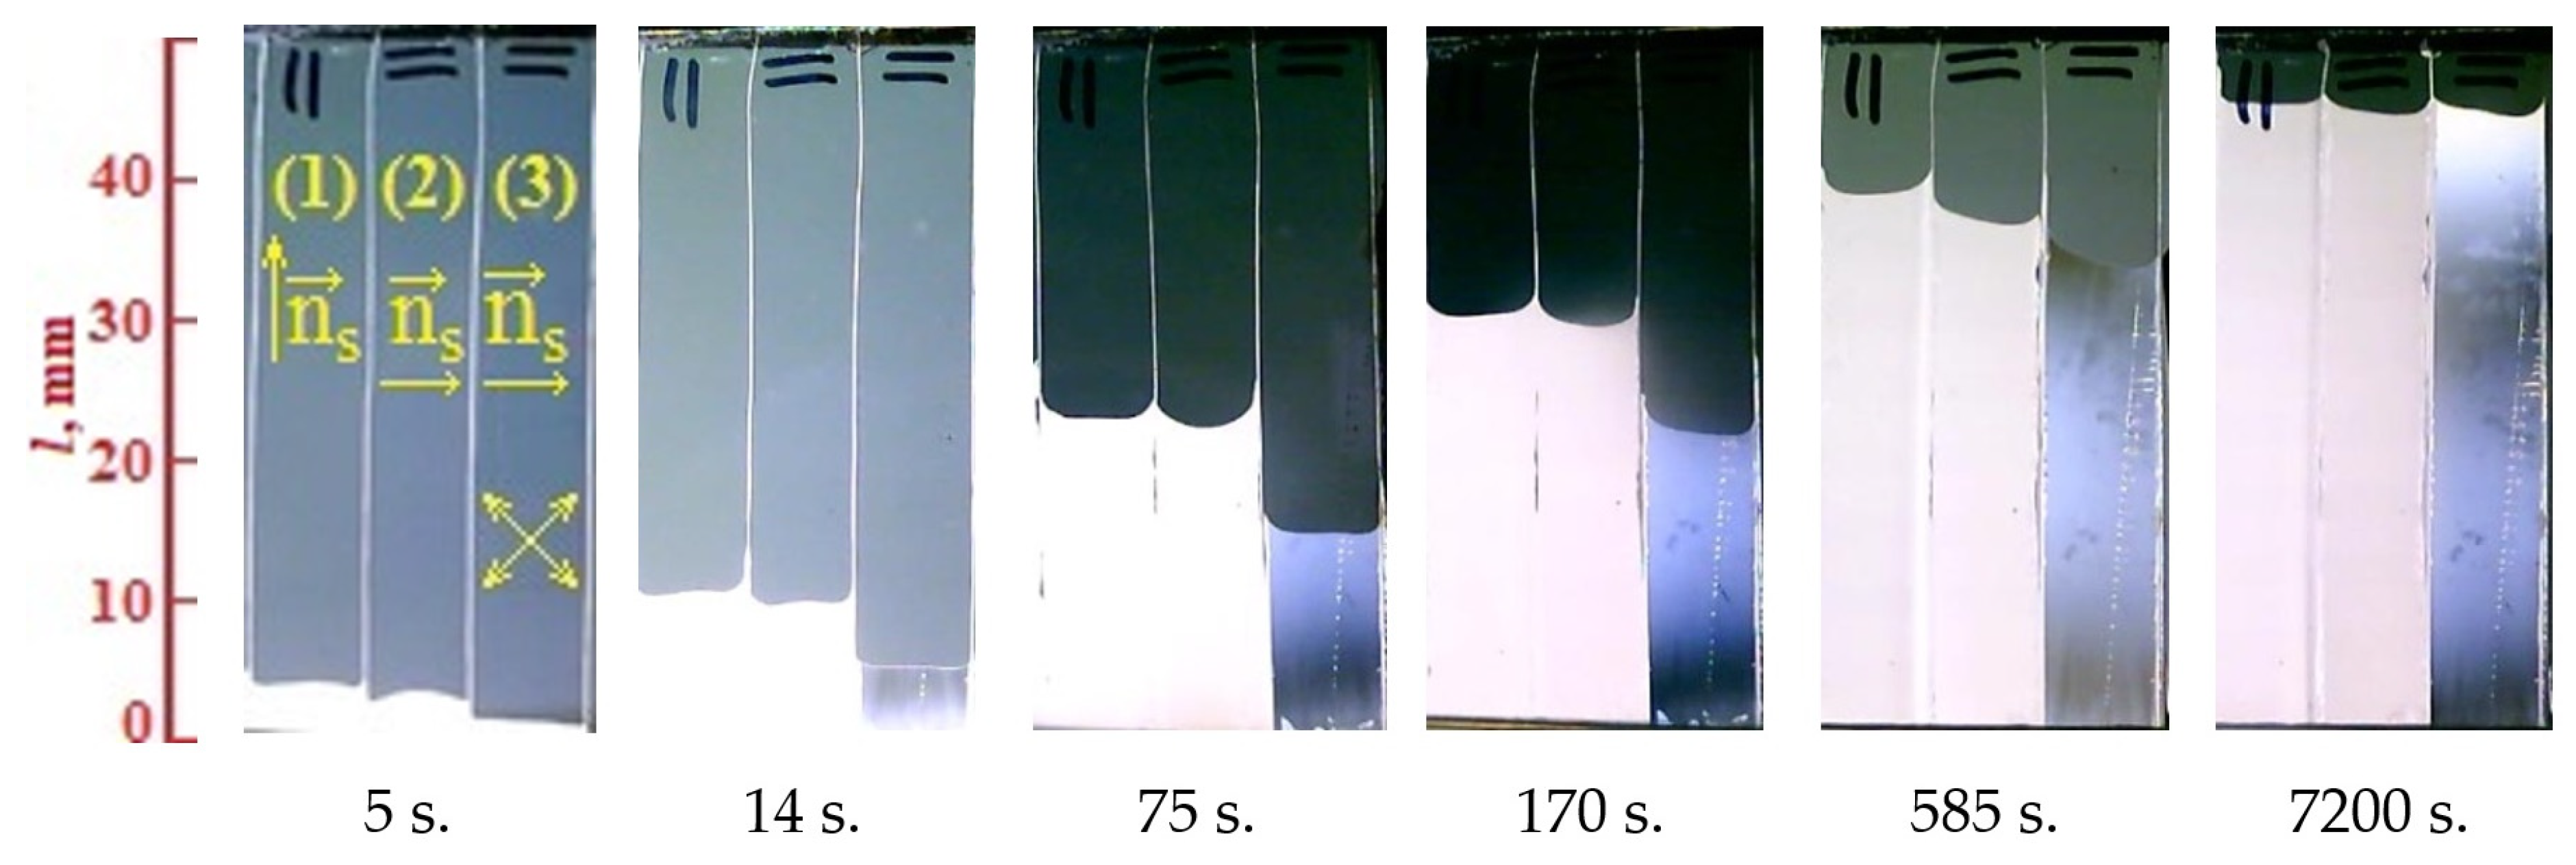
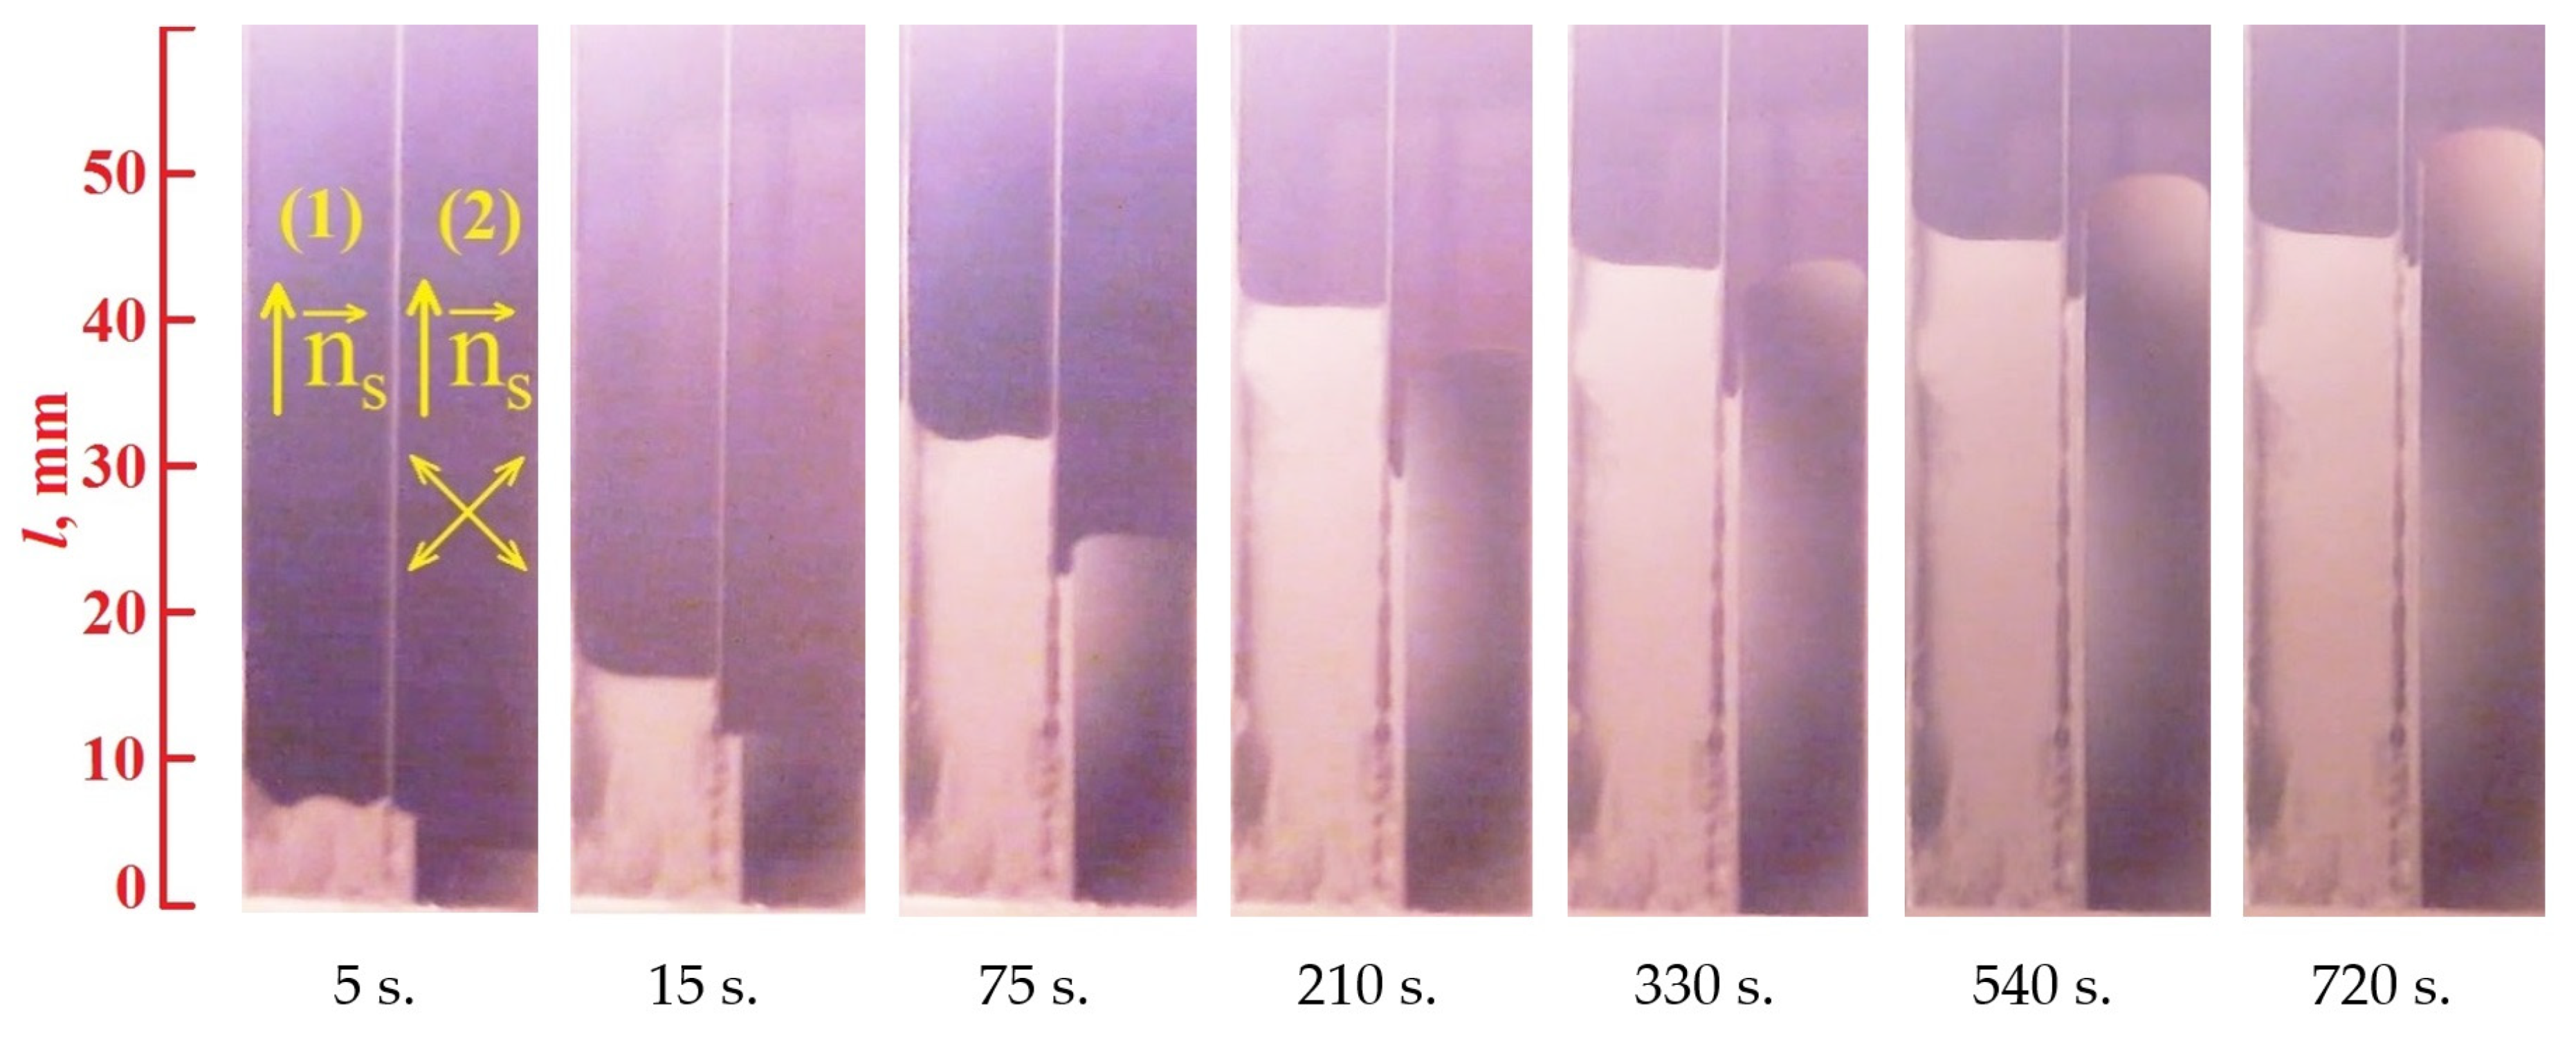
The typical images of the cell with a constant gap obtained at different times passed after beginning of the capillary flow are shown in Figure 2. One can see a slight difference in the instantaneous values of capillary rise l(t) recorded for the channels with different surface orientation. At the same time, applying of the electric field resulted in pronounced slowing of the capillary flow. This effect can be attributed to a significant increase in the viscous forces originating due to the reorientation of LC layers from the initial planar towards the quasi homeotropic structure. The dark fields in the images of the electrically controlled channels, shown in Figure 2 and Figure 3 and as well as the absence of interference stripes indicate that the real orientational structure in the bulk of LC layers is close to the hometropic one, with the exception of boundary quasi planar layers with the thickness less than the visible light wavelength (about 0.5 μm). At the same time, it was found that the use of a high electric voltage (150 V) induces the pronounced increase in the Δl(e) of the stationary levels l0 of the capillary rise. The values of the ratio Δl(e)/l0 were approximately 0.1 for two types of surface orientation. So, this increase can obviously be assigned to the electrowetting phenomenon well studied for isotropic liquids [1]. Such a phenomenon is probably also responsible for the field induced transformation of the profile of the contact line profile shown in Figure 3.
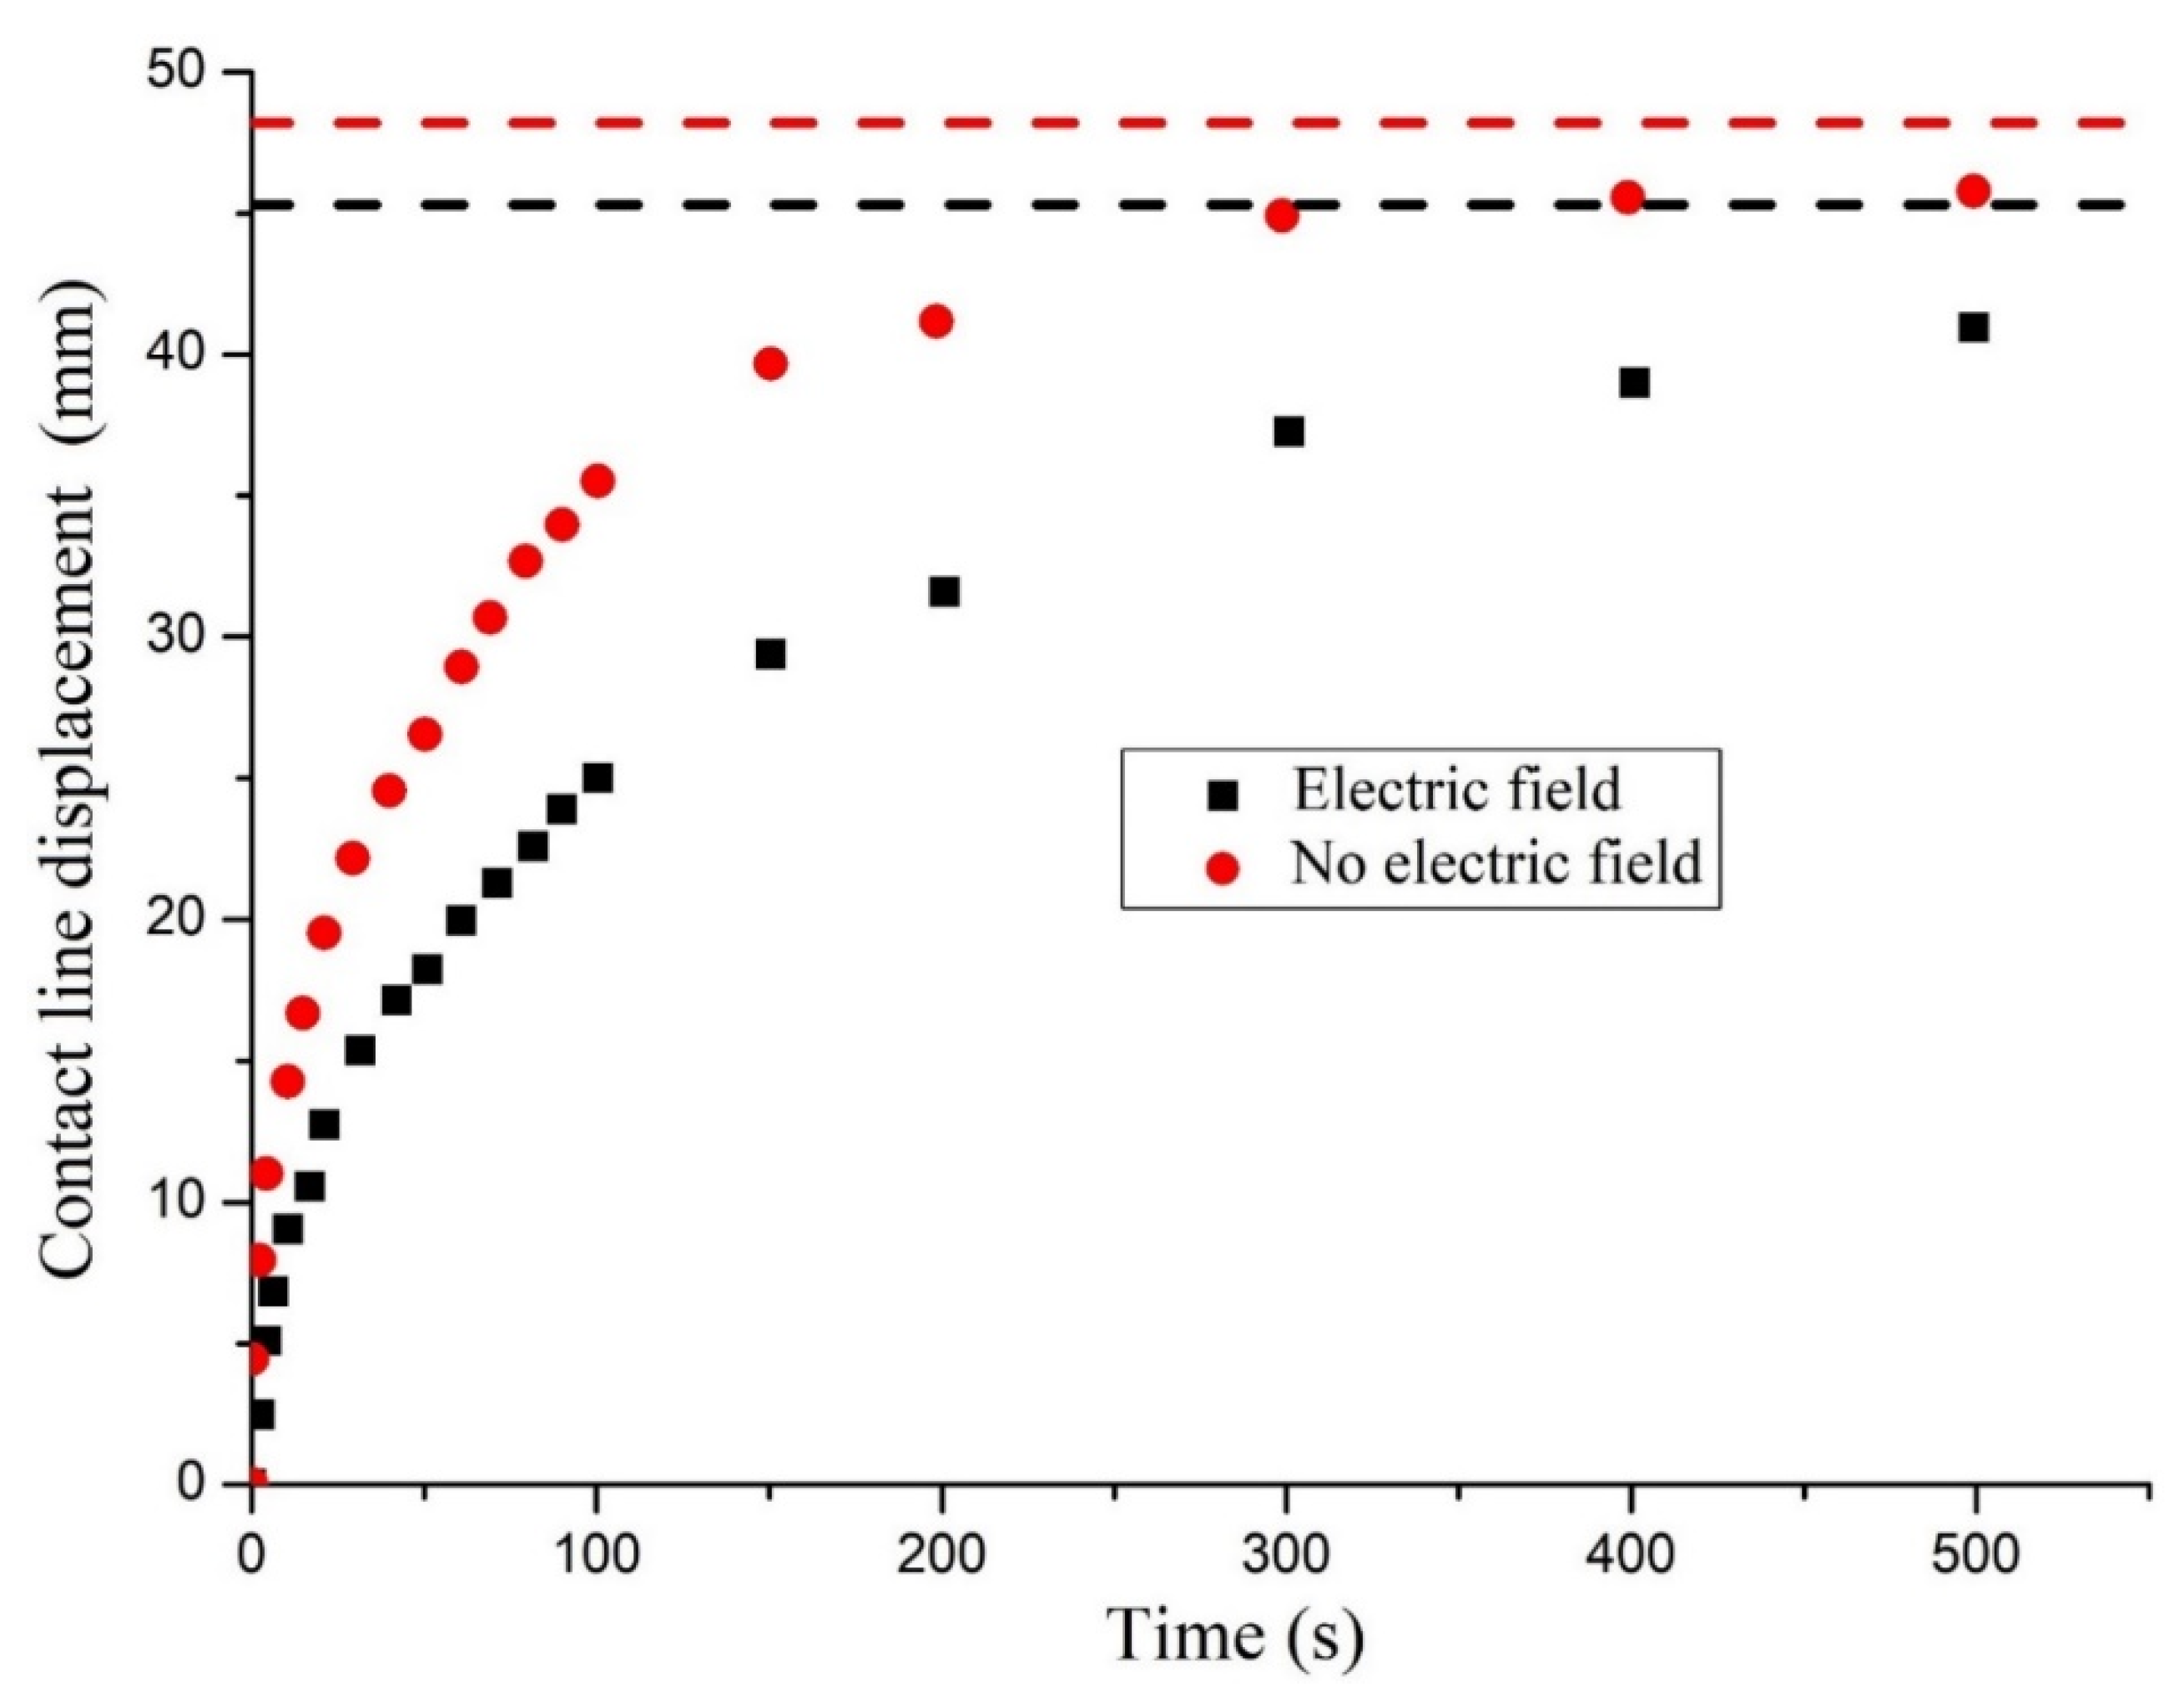
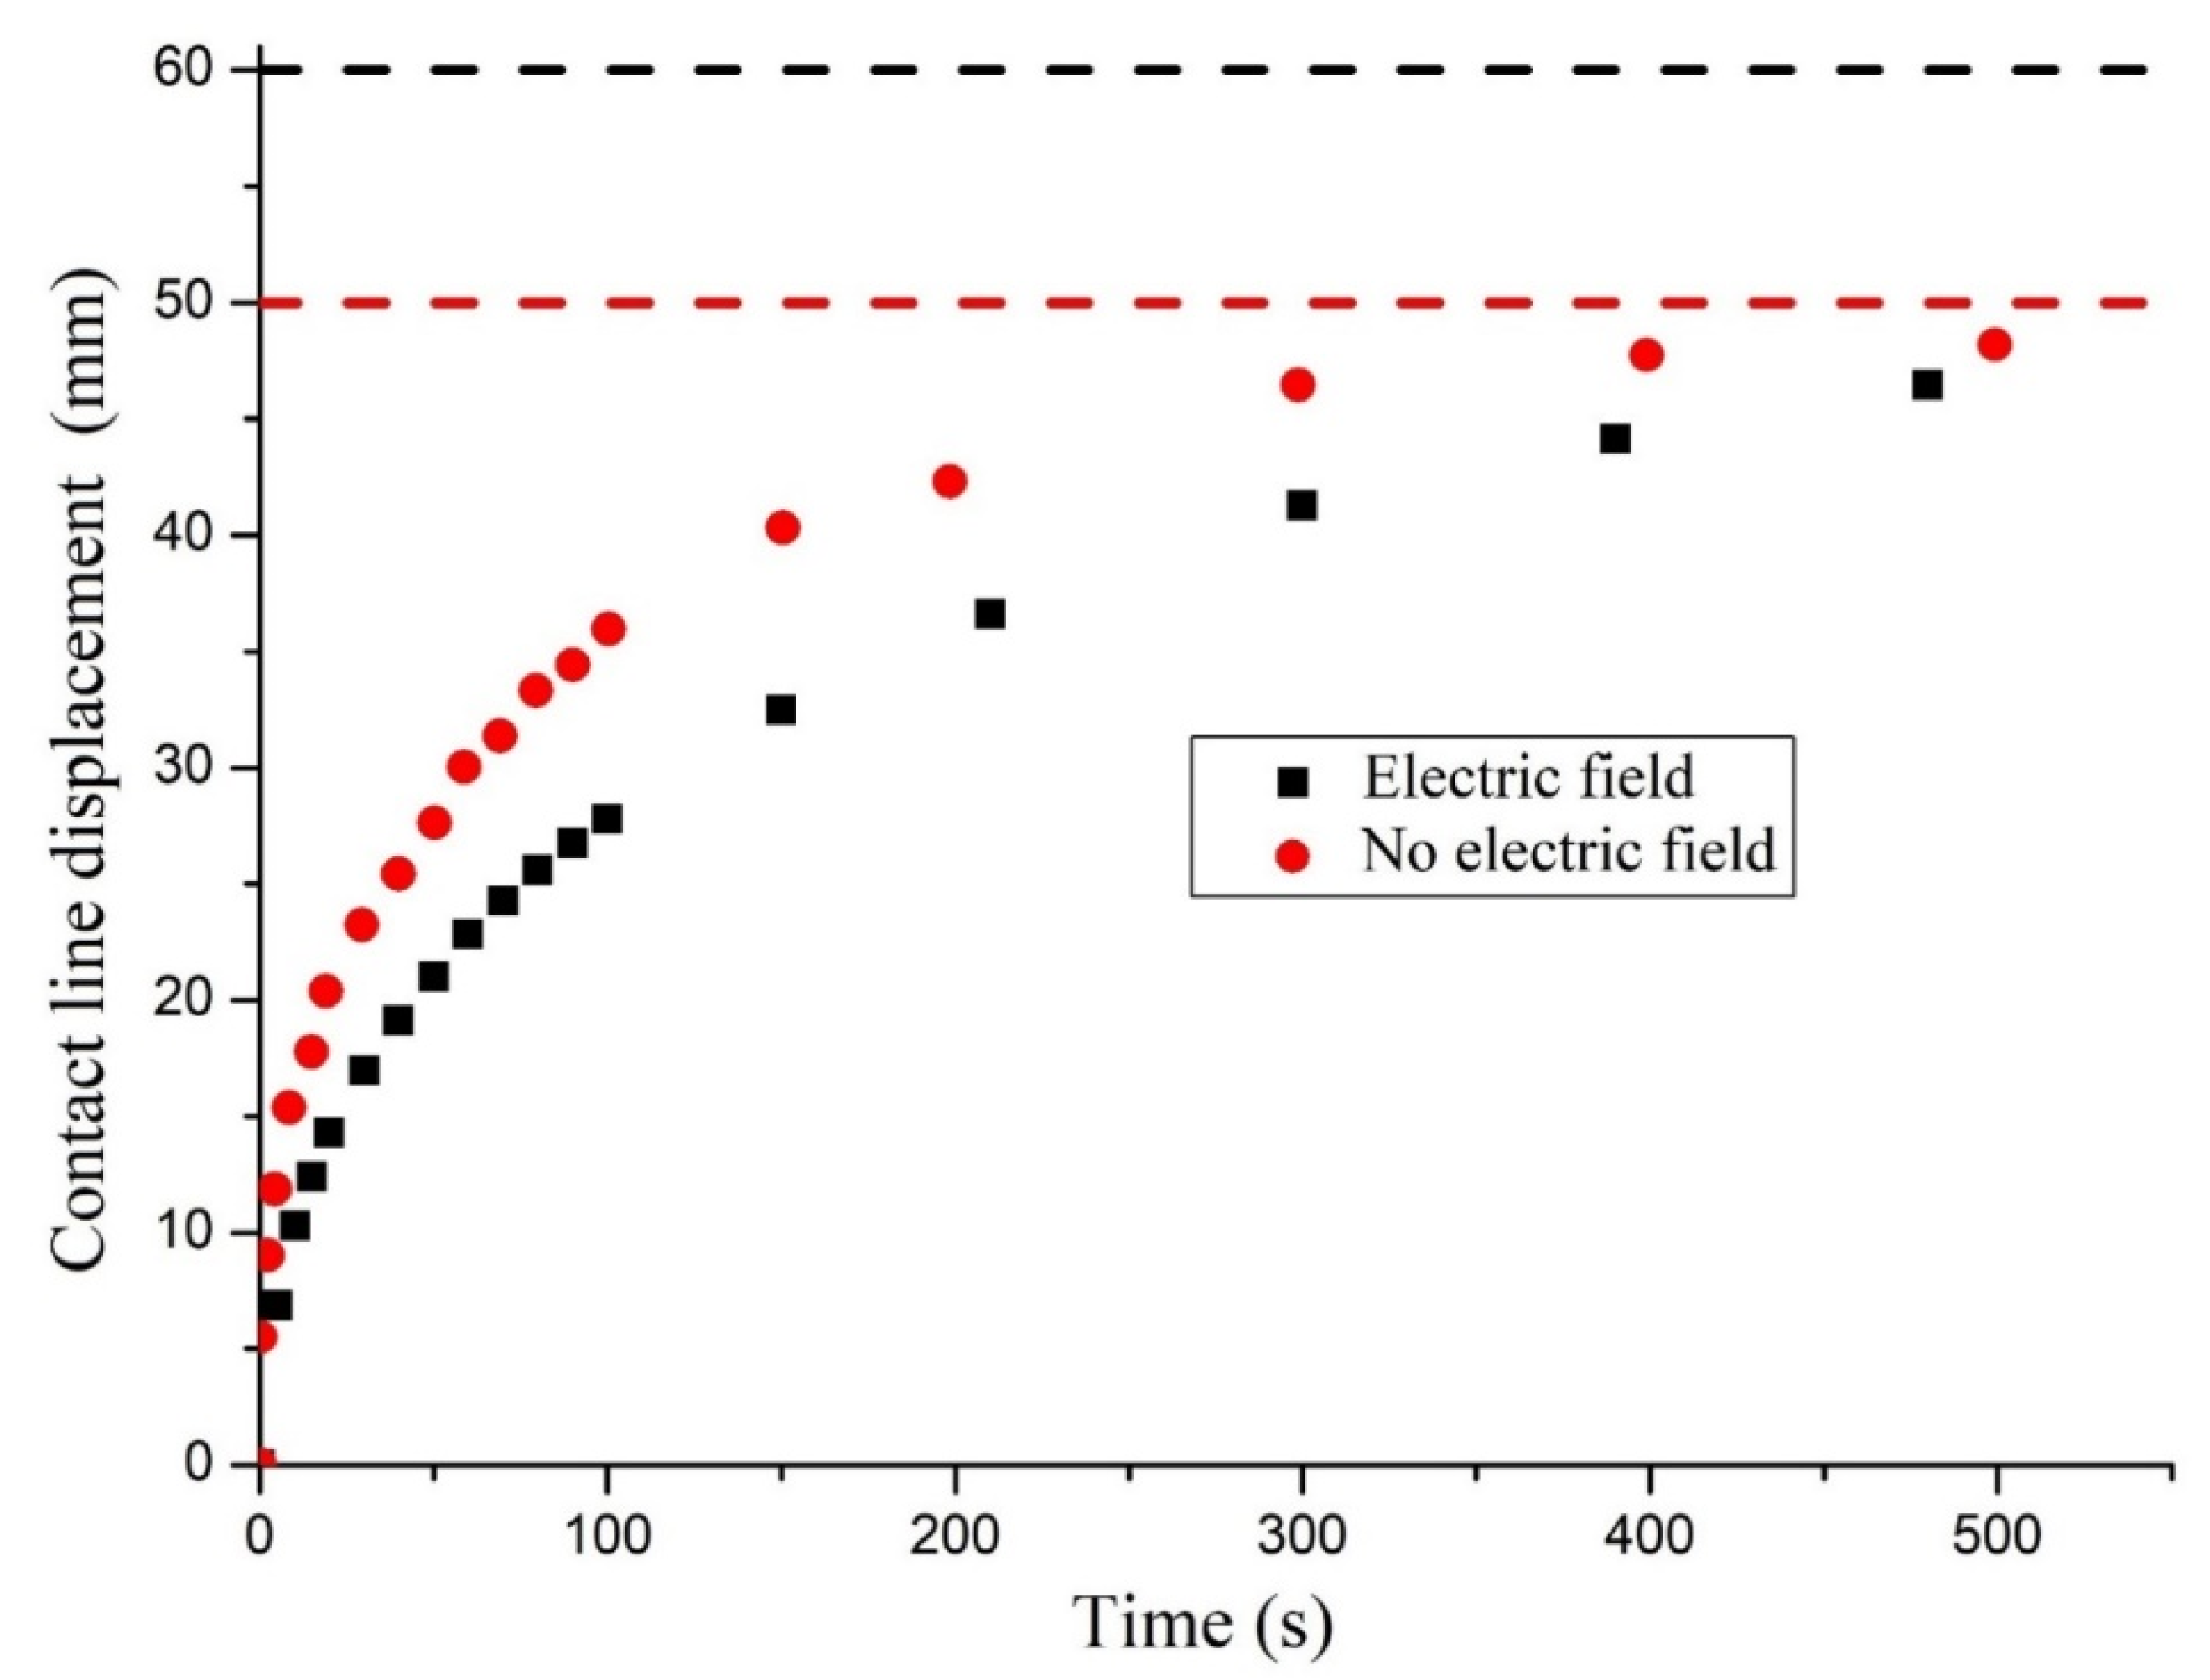
The dependences of l(t), obtained as a result of digital image processing, are shown in Figure 4 and Figure 5. The registered decrease in the instantaneous velocity dl/dt of the contact line movement can be explained by the increase in the gravitational and viscous forces that slow down the capillary flow over time. The application of the electric field leads to a significant decrease in the instant rate dl/dt in the comparison with this parameter for the field-free motion of the contact line.
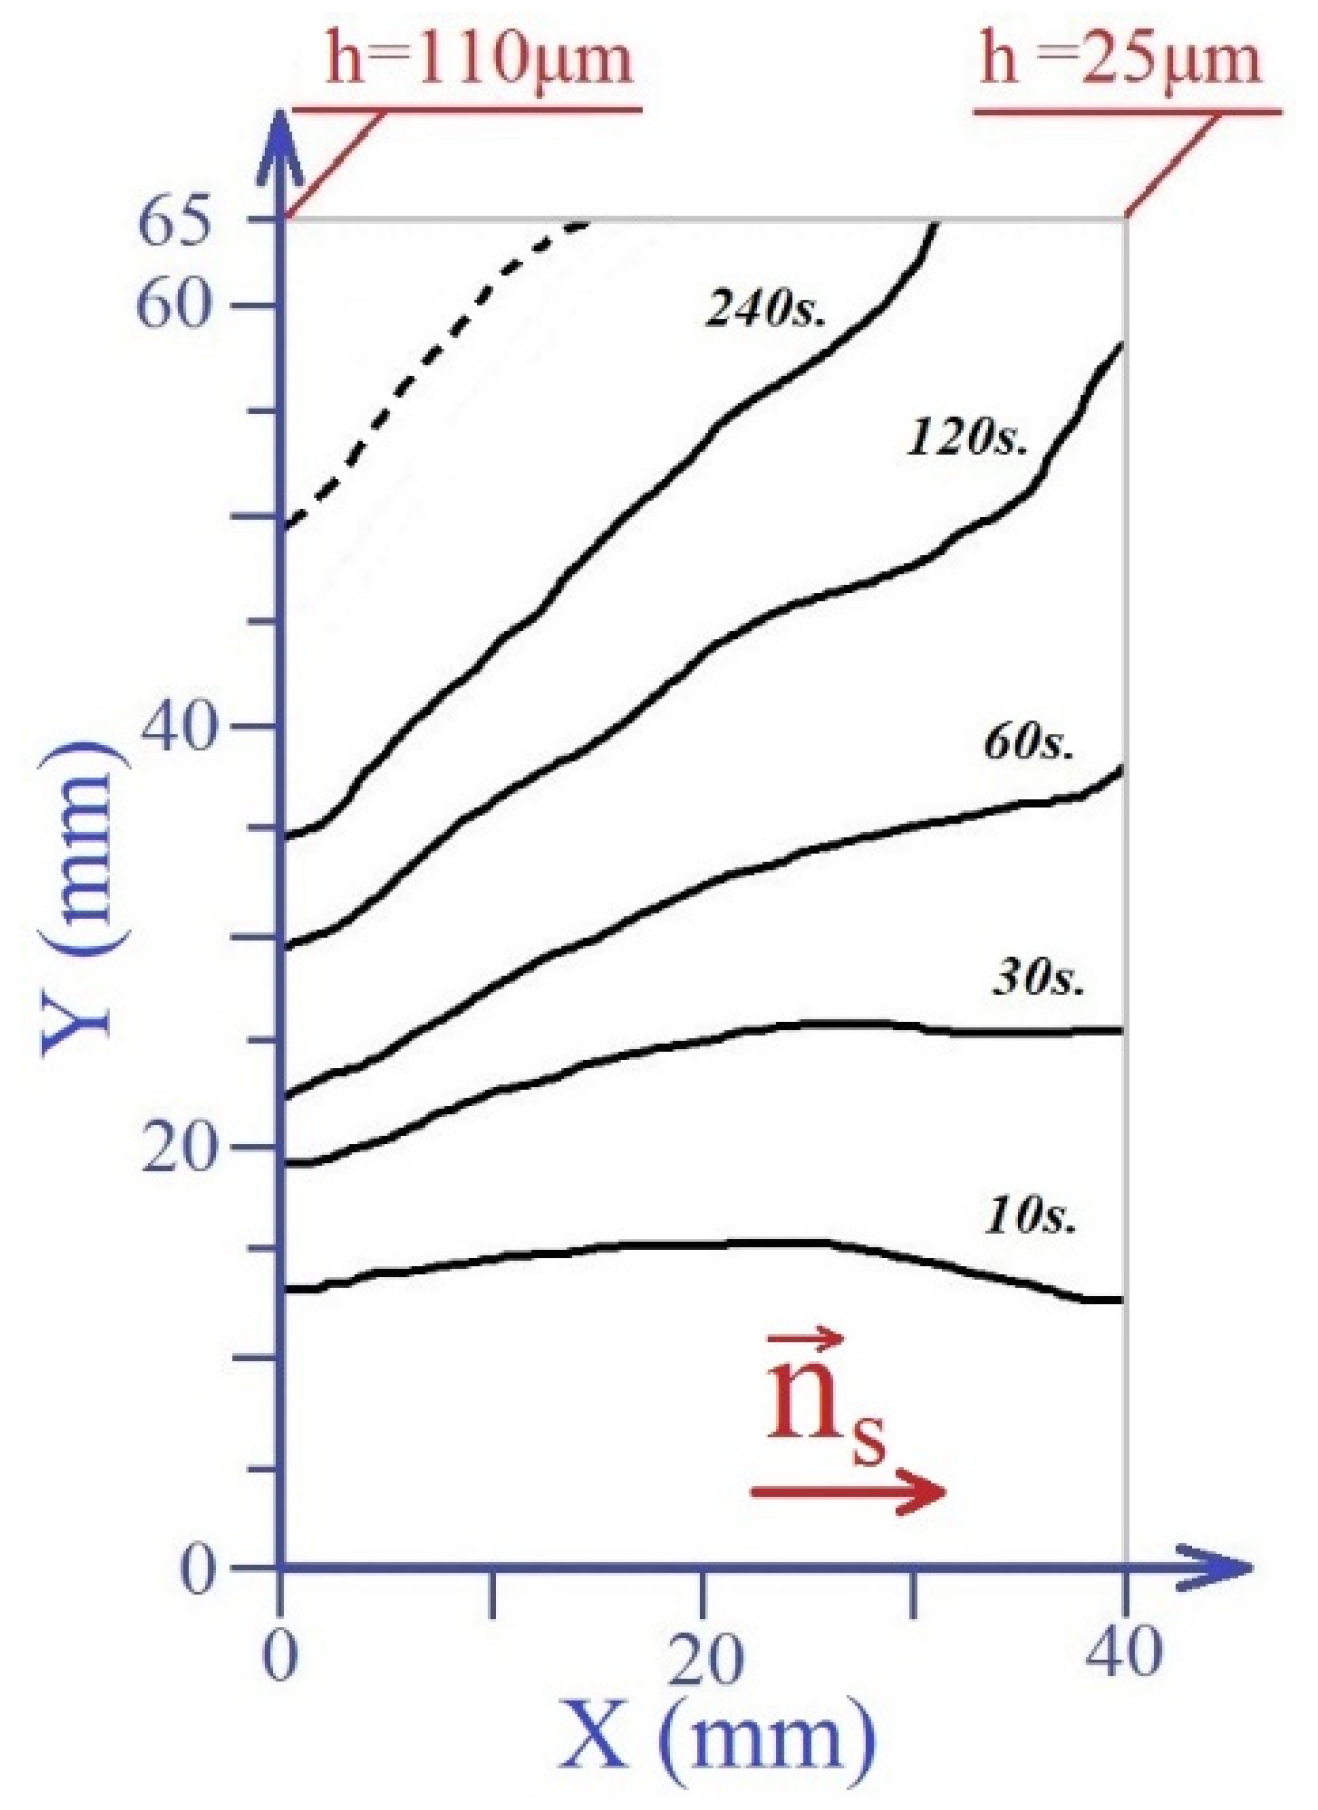
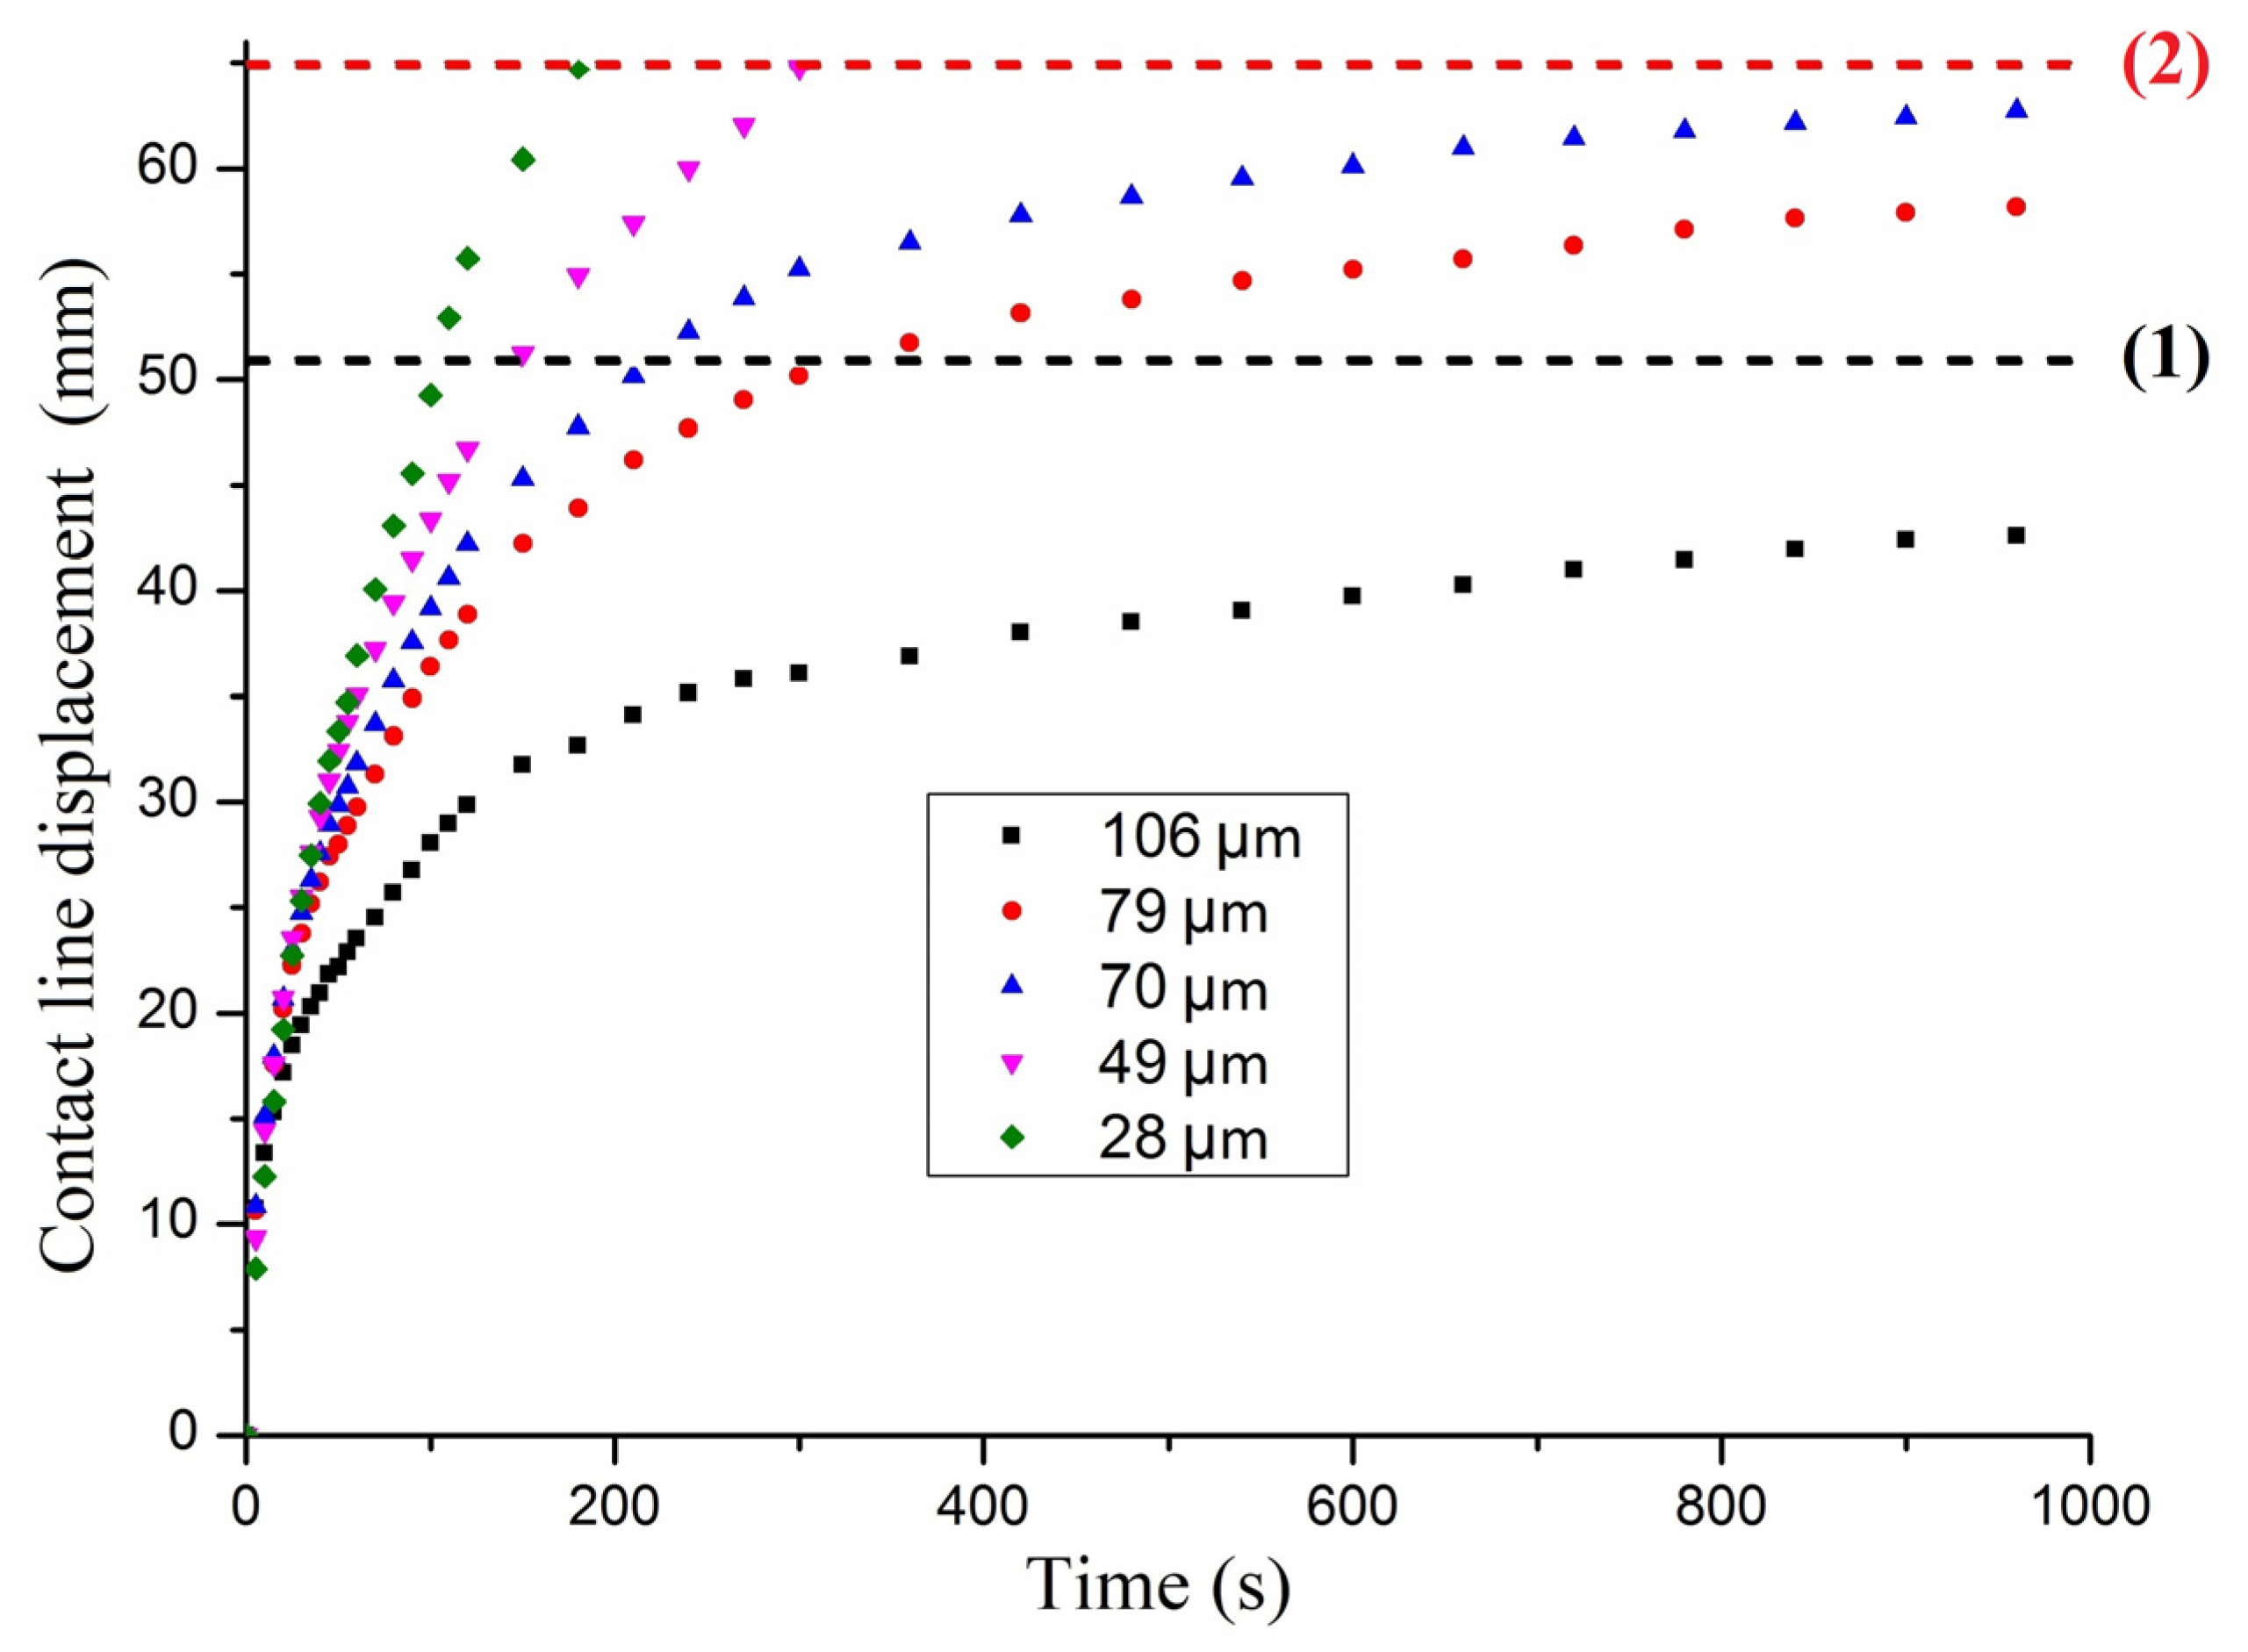
Analysis of similar photos of the wedge-like cell made it possible to record the instant lateral profiles of the contact line at different times. The examples of such profiles are shown in Figure 6. A significant difference can be observed in the shape of the profile recorded at the initial and final stages of the capillary flow. The quasi stationary profile l0(x), obtained in the region of high local values of h after almost complete decay of the flow is close to the linear dependence. The time dependences of the capillary rise l(t) at different local values of the gap, obtained via processing of the instant profiles are shown in Figure 7.
Analysis of the experimental data, presented above, reveals the features of a capillary flow of anisotropic liquids. It should be noted that the theoretical description of the dynamics of capillary rise is quite difficult even in the case of isotropic liquids. To explain some features of this phenomenon, both microscopic and hydrodynamic approaches were used together with empirical equations [10]. This applies, in particular, to the time dependence of the contact angle, are observed experimentally.
The experimental results were analyzed using a continuum approach that takes into account the flow characteristics of liquid crystals [13]. It should be noted that this approach was previously used to describe the dynamics of the rise of the isotropic Newtonian liquids in the vertical capillaries of various cross-sections and sizes [10]. Now we used the well-known Poiseullie Equation, describing the volumetric flow rate Q
induced by the pressure difference ∆P in the capillary of length l. Here V is the pumped volume. For the plane capillary with the large value of the aspect ratio R = A/h (here A and h are the width and the gap of the capillary) the Poiseullie Equation is written as:
where ∑ΔP is the resulting pressure difference, which includes both the hydrostatic
and the capillary
pressures, respectively.
In these equations the density ρ and the shear viscosity η are the parameters describing the bulk properties of the liquid, whereas both the surface tension coefficient σ and the contact angle θ are the parameters which characterize the interaction of the liquid phase with the air and the solid surface, respectively. Taking into account the expression for the pumping volume
and using the Equations (1)–(4), one can get the next differential equation for a description of the motion of the contact line:
This equation can be considered as the simplified (and modified) version of the well-known Washburn Equation [10] proposed for a describing the motion of the contact line in the circular capillary.
In our calculation the contact angle θ was chosen to be independent on time and equal to the static value. This approximation is confirmed by the estimation of the time dependent contribution to the value of the contact angle θ, made in accordance with the semi empirical expression [10], which is read as:
where θd is the dynamic contact angle, θe is the static contact angle,
is the capillary number, whereas v = dl/dt is the velocity of a contact line.
The maximal value of the dynamical contribution to cos(θd) takes place at the initial stage of the flow and does not exceed 15…20% at typical values η ≈ 0.05 Pa*s, σ = 0.033 N/m and registered values of v ≤ 2 cm/s.
We also neglected the possible effect of the roughness of the internal surfaces on the capillary flow [23,24]. The latter seems to be reasonable, since UV irradiation of the azo dye layer does not lead to any changes in the surface relief.
The solution of Equation (6) for the constant value of the contact angle θe with the zero initial condition (l = 0 at t = 0) is defined by the next expression:
where the maximal value of the capillary rise l0 and characteristic decay time τ of the flow are expressed as:
and
respectively.
Thus, the parameter l0 depends on both the surface tension coefficient σ and the contact angle θ. Each of these parameters may depend on a surface orientation of the LC, but the surface orientation on the boundary LC/air is fixed and does not depend on the orientation on the boundary LC/dye, with the exception of the wall area.
Comparison of the experimental results with the predictions of the theoretical model includes analysis of both the static and dynamic characteristics of the capillary rise. In particular, the maximal values of the capillary rise l0 measured in different cells were used in accordance with expression (10), to calculate the corresponding contact angles (see Table 2).
The results obtained for 5CB and for the different directions of surface orientation (cell 1) show a weak (about 10%) anisotropy of the contact angle, which is comparable to the error (about 5%) when determining this parameter from the stationary meniscus profile in the wedge-like cell 3 shown in Figure 6.
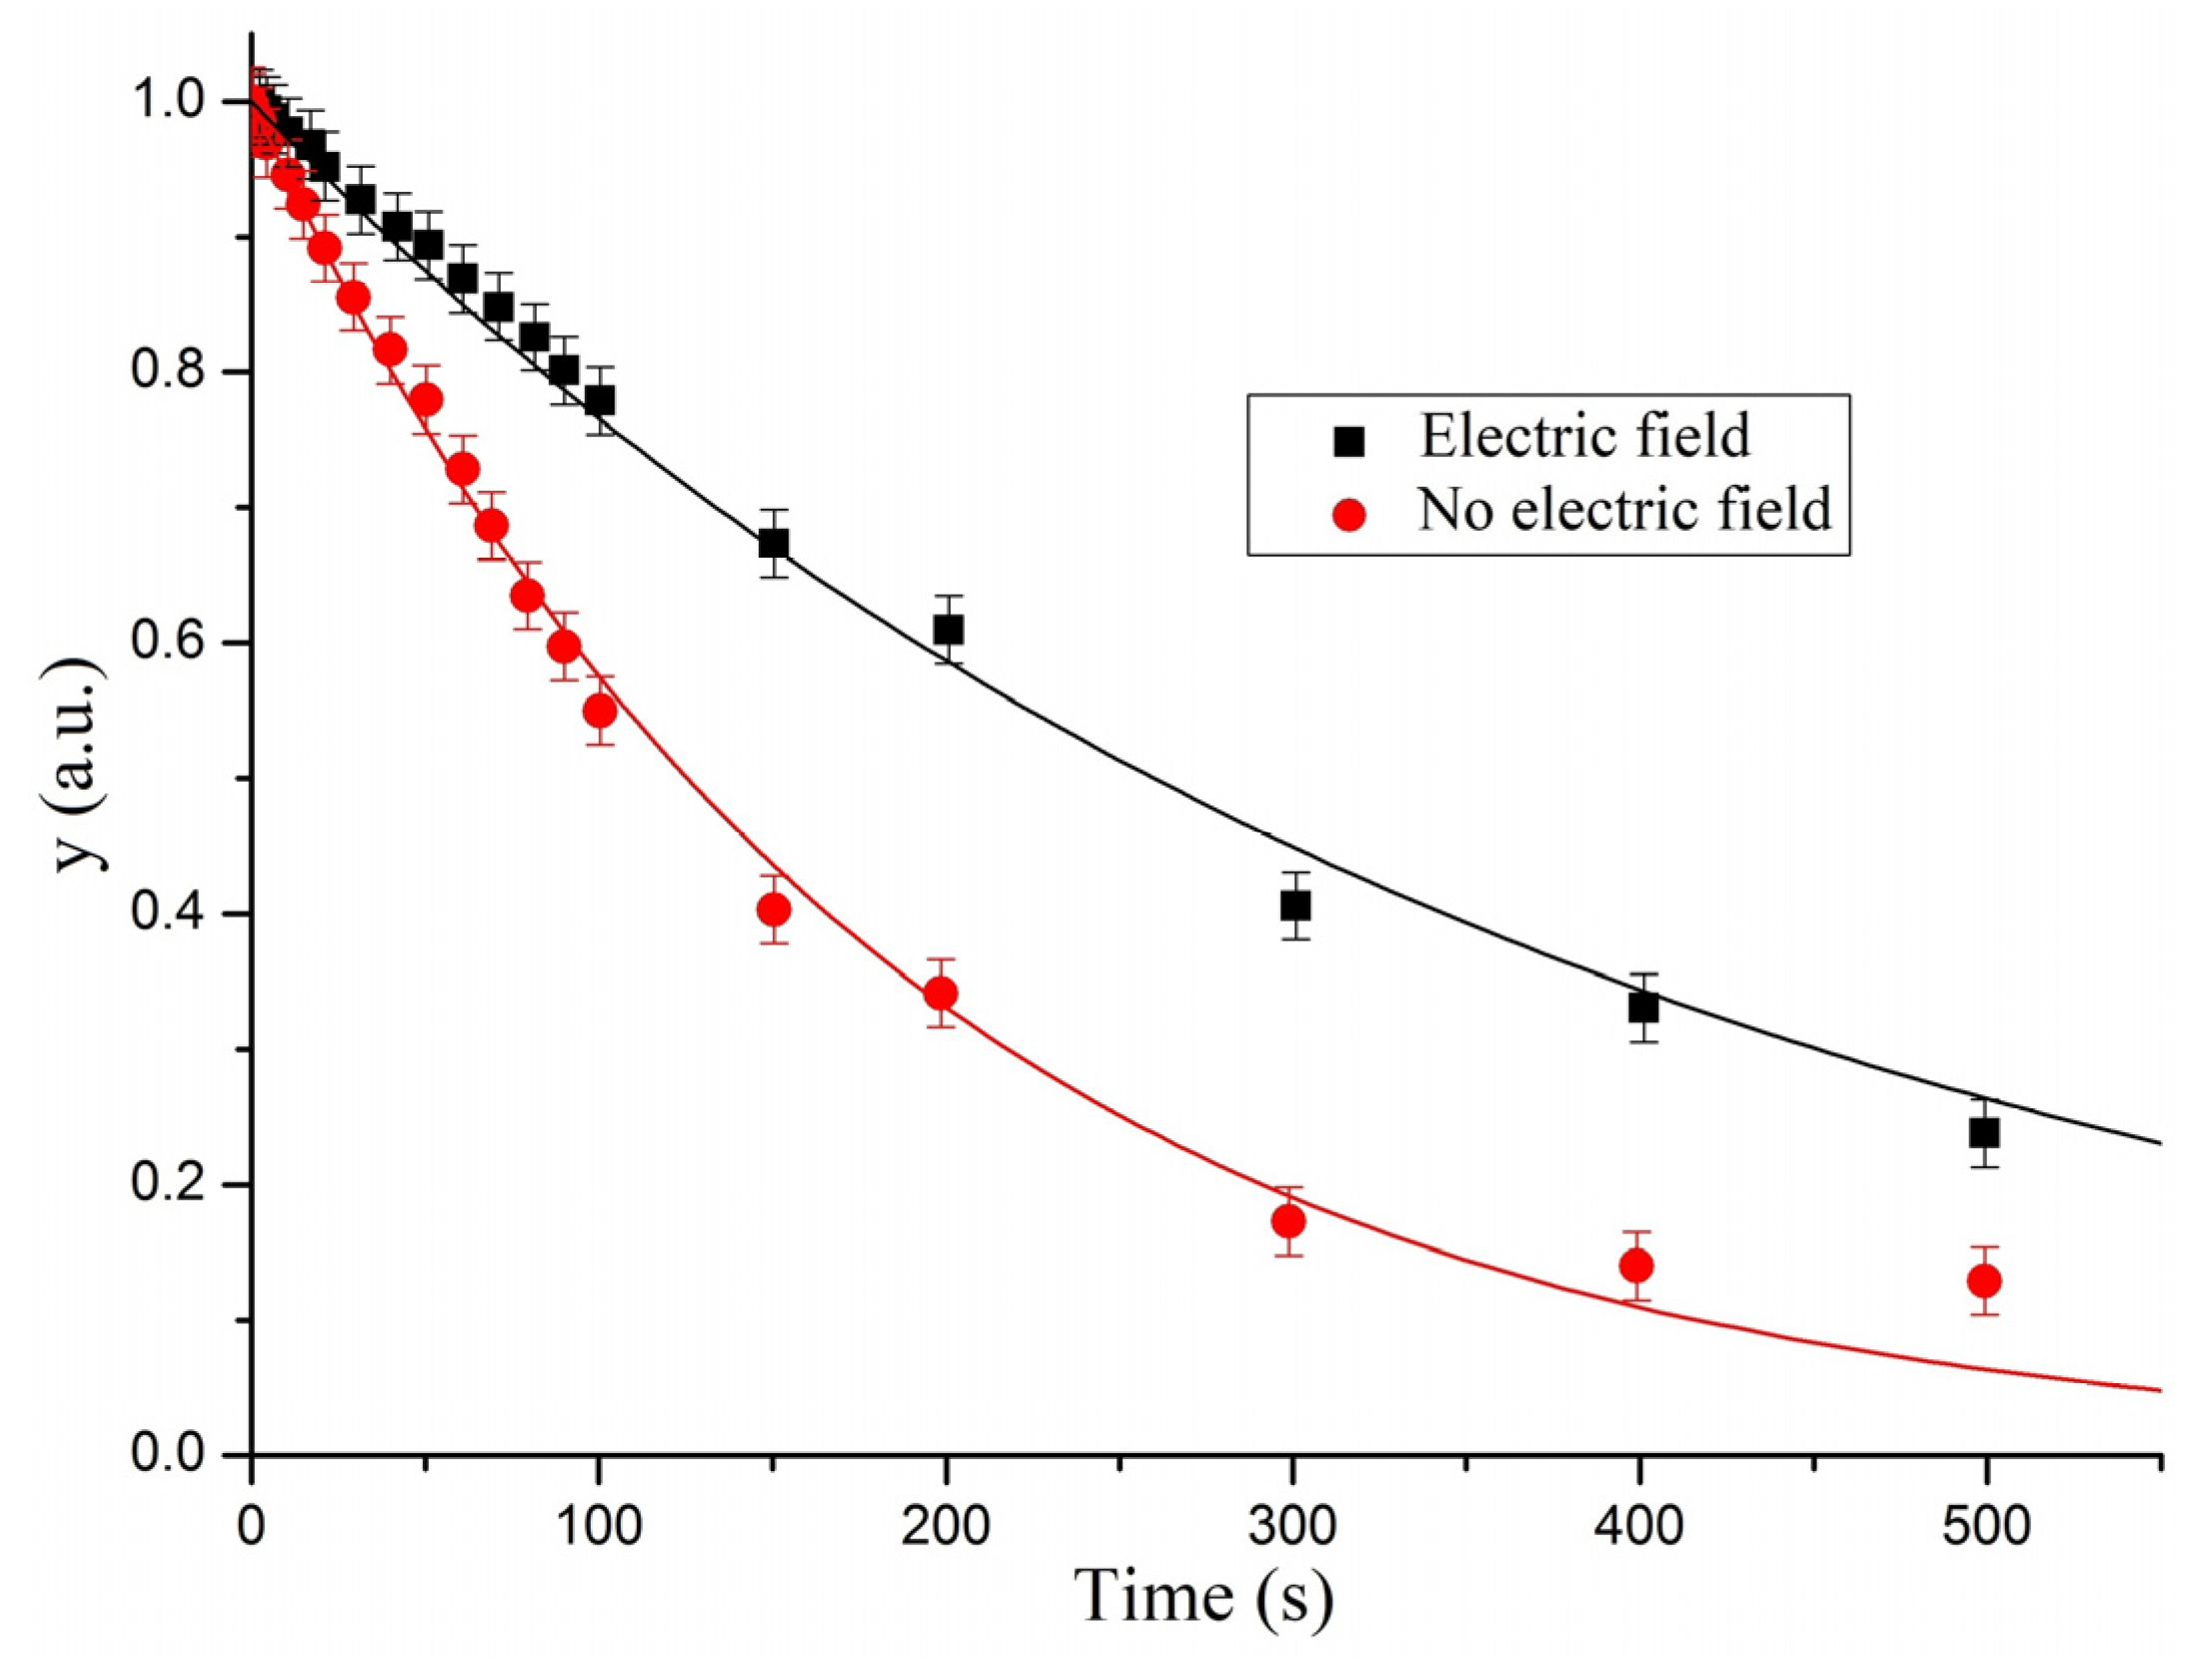
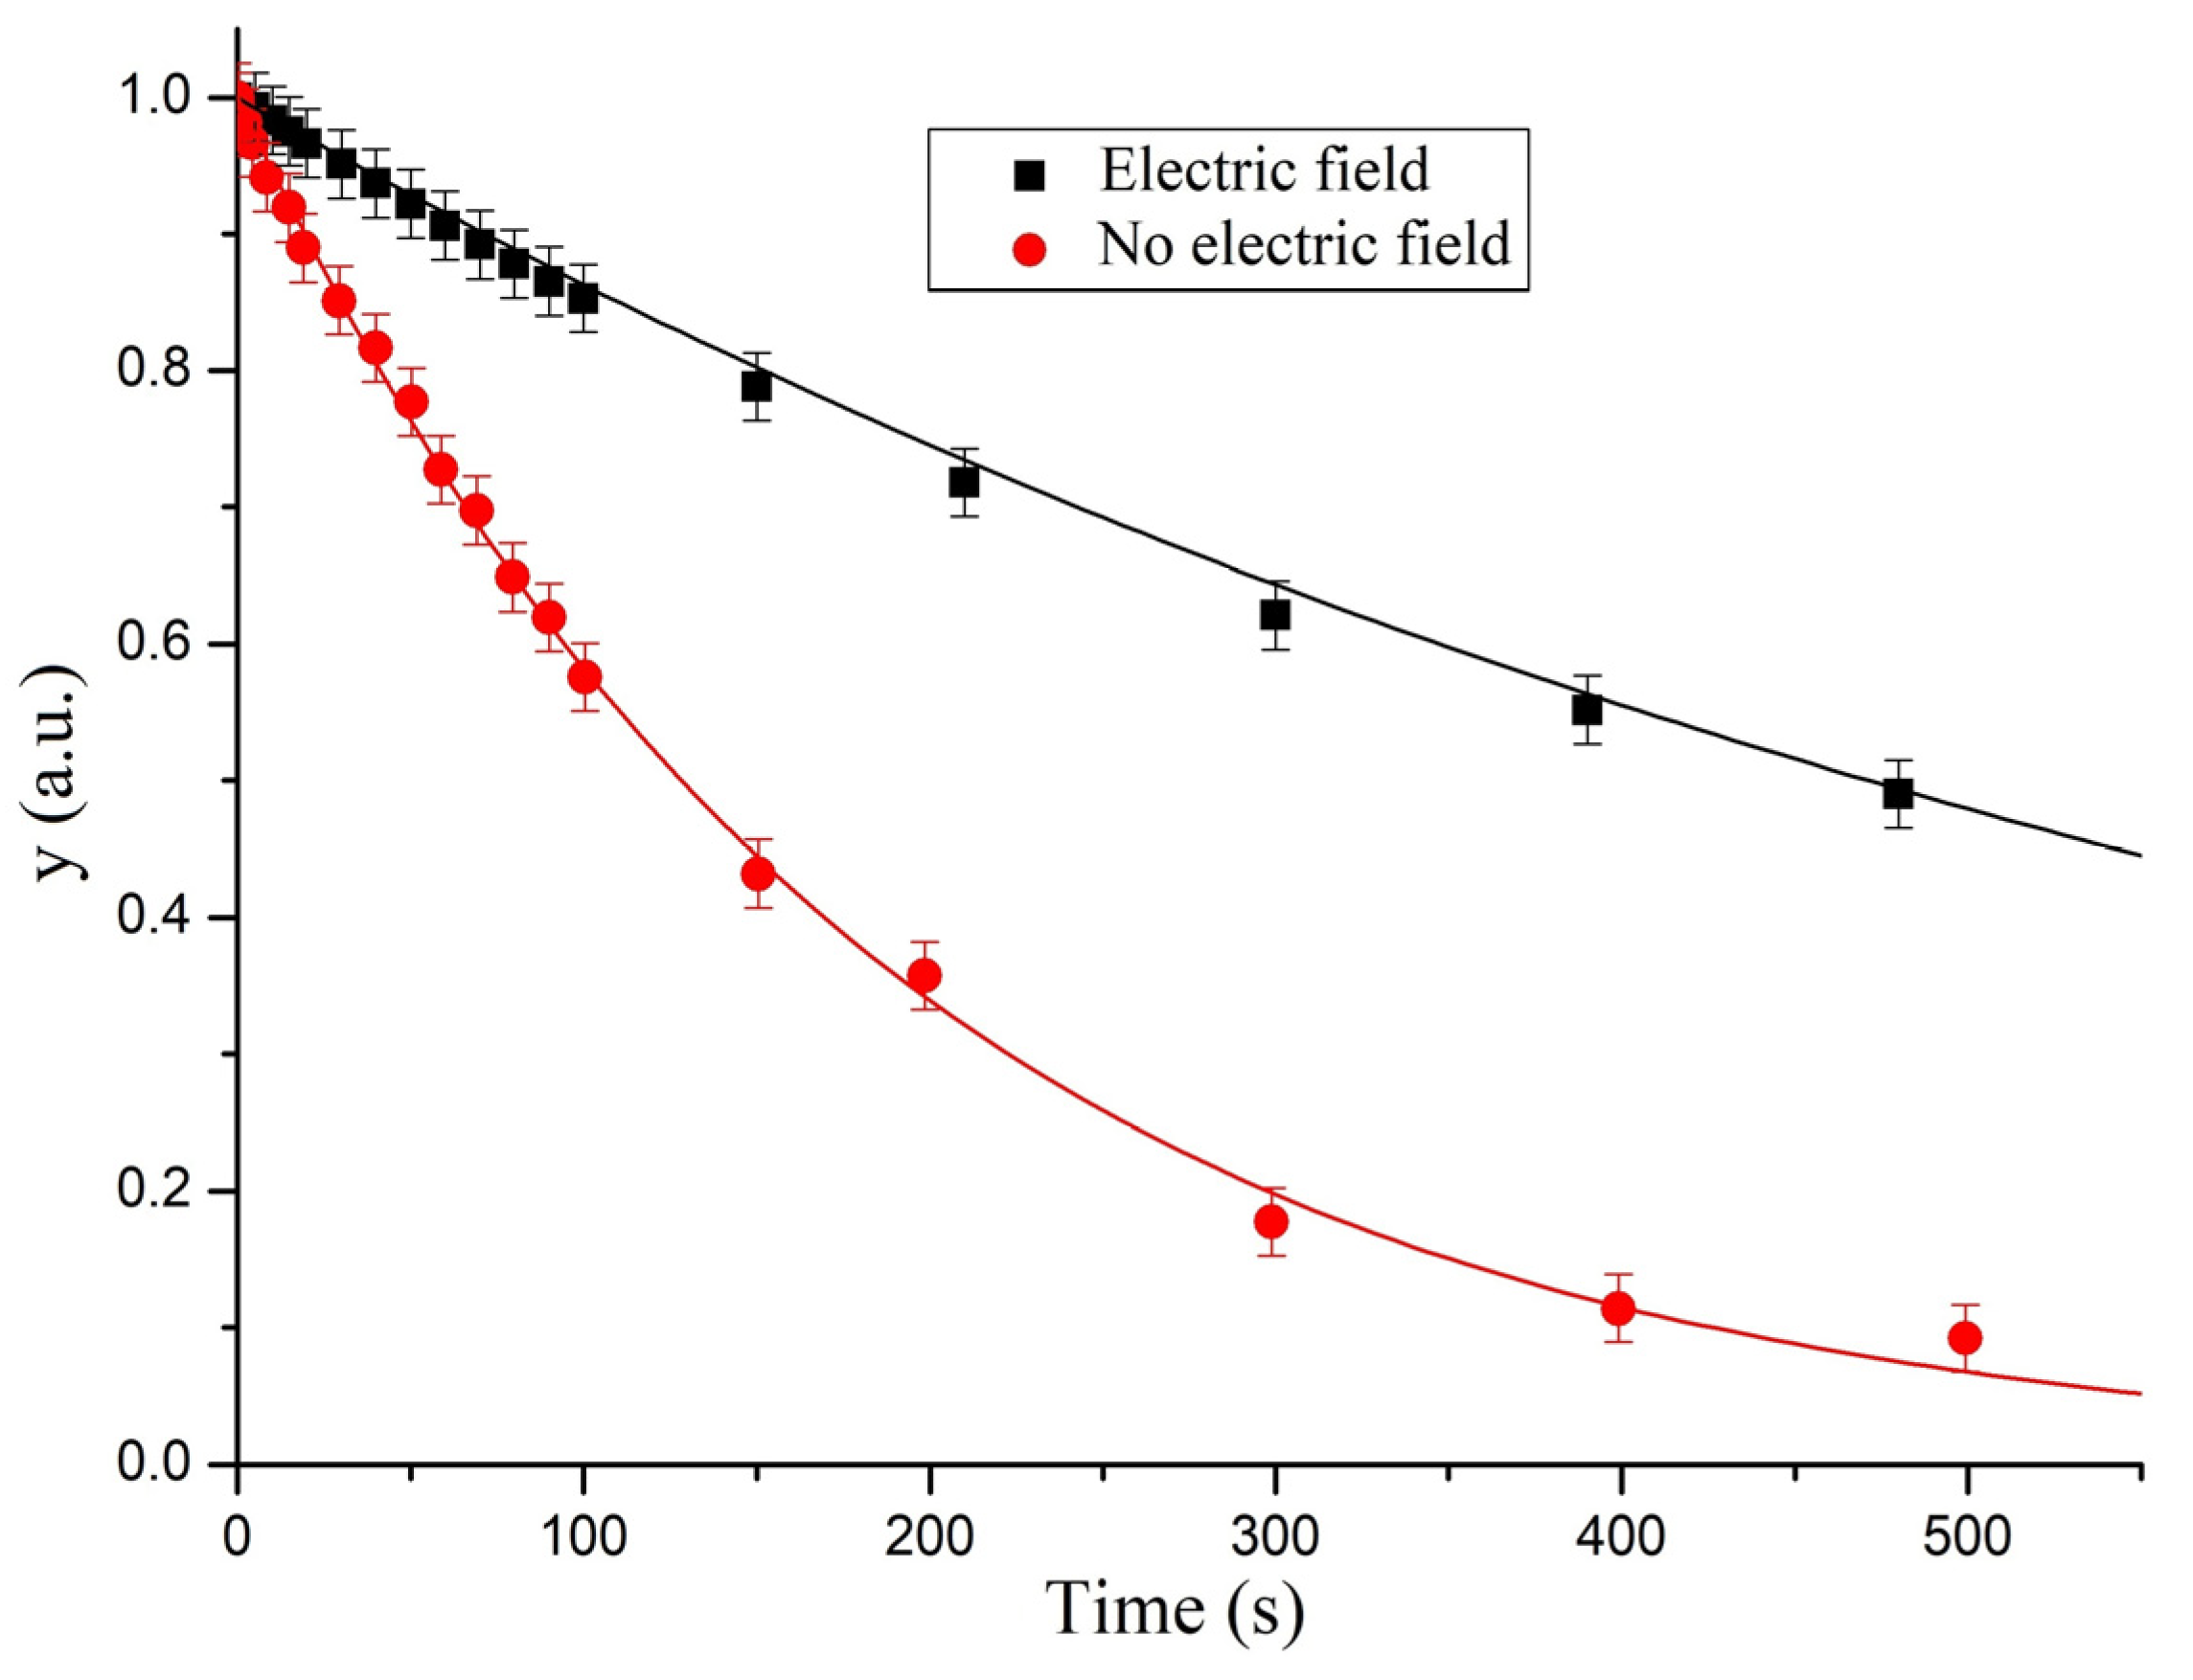
The approximation of the experimental dependences by the function (see Equation (9)) for different directions of surface orientation, both with and without accounting for the electric field is presented in Figure 8 and Figure 9.
The parameters of approximation of the experimentally obtained data by Equation (9) for different values of the surface orientation, both in the absence (cell 1) and presence of the electric field are shown in Table 3.
The best agreement between the theory and the experiment in the absence of electric field occurs for the channel with the surface orientation parallel to the flow direction. At the same time, the value of the shear viscosity coefficient obtained using the least squares approximation significantly exceeds the values of the Miesowicz coefficient η2 [15] which corresponds to the homogeneous orientation of the director along the flow direction. Some difference can be assigned to the flow induced declination θfl of the polar angle θ, which describes the bulk orientation from the planar structure (θ = 0), stabilized by surfaces. The maximal value of θfl, corresponding to the case of intensive flows can be calculated from the well-known expression
where α3 and α2 are the Leslie’s coefficients, which are equal to 0.0036 Pa*s and 0.0812 Pa*s, respectively, for 5CB [14]. Using these values for the Leslie coefficients, one can estimate, according to Equation (12), the value of θfl, which is equal to ≈ 12°. The maximal difference Δη between the effective shear viscosity measured in the intensive flow and the Miesowicz viscosity η2 can be estimated by using the dependence of the shear viscosity on the polar θ and the azimuthal φ angles [13]:
where the viscosity η12 is essentially smaller than η1. The estimate of Δη in accordance with Equation (13) for the case of variation of the director in the flow plane (φ = 0) at values η1 = 0.105 Pa*s and η2 = 0.0204 Pa*s at T = 26 °C [15] gives the value Δη/η2 ≈ 0.18. It partly explains the above mentioned deviation of the effective shear viscosity from Miesowicz viscosity η2.
The agreement of the theoretical curve with the experimental results becomes essentially significant for the case of surface orientation normal to the flow plane (Figure 8). This may indicate a deviation of the capillary flow from the Newtonian behavior. The latter may occur due to the well-known hydrodynamic instabilities resulting in the rotation of the bulk director from the initially planar orientation, stabilized by surfaces and normal to the flow plane, towards the flow plane [25,26]. The threshold pressure gradient is determined by the critical value of the Ericksen number [27]:
where α2 and α3 are the Leslie coefficients, K11 and K22 are the splay and twist Frank elastic constants, respectively, η3 is the shear viscosity coefficient (Miesowicz viscosity), corresponding to the initial planar orientation, normal to the flow plane, and is the average value of the velocity gradient.
In accordance with the theoretical estimates [25], the critical value of the Ericksen number, corresponding to the threshold of the abovementioned instability is defined as Erc = 17.3 [25].
The experimental value of the instantaneous pressure gradient can be easily expressed as
what allows us to calculate of the Ericksen number at different stages of the flow. The estimates of the Ericksen number show that this parameter varies from about 120, at l = 1cm, to 25, at l = 3 cm, respectively. Thus, the flow at the initial stage is relatively strong and orients the LC presumably close to the flow direction, and only at the final stage of the flow a significant influence of surfaces can be observed, leading to the reverse transition of the LC layer to a uniform plane orientation. This explains the fact that the effective value of the shear viscosity (Table 3) is intermediate between the Miesowicz viscosities η2 = 0.0221 Pa*s and η3 = 0.0358 Pa*s, at corresponding temperature T = 24 °C.
The experimental time dependences obtained by applying the electric field to LC layers with the planar surface orientation parallel (or normal) to the flow direction are in a good agreement with the time dependences obtained using the Equation (9) (see Figure 8 and Figure 9). This indicates the Newtonian nature of the capillary flow decay. Nevertheless, the calculated values of the effective shear viscosity ηeff are lower than the maximal value of the Miesowicz viscosity η1 = 0.1215 (0.0991) Pa*s, for T = 25(27) °C [14], respectively. This can be partly explained by the effect of thin surface layers with presumably flat orientation on viscous losses and the orientation effect of the flow. The thickness of the surface layers can be estimated by the calculating the electric coherence length ξE in accordance with the well-known expression [13]
where Kii = K11 or K22 for the surface orientation along the flow direction or perpendicular to the flow plane. Using the material parameters of 5CB [13] K11 = 6.2 pN and K22 = 6.2 pN, respectively, one can get for the electric voltages U = 150 V and U = 100 V, applied to the 100 μm capillaries, with different surface orientation the values ξE = 0.16 μm and 0.19 μm, respectively. This values of ξE is essentially smaller than the thickness of yhe LC layer. This means that the electric field effectively suppresses the orientation effect of surfaces, with the exception of near-surface layers and can induce a slight decrease δη in the effective shear viscosity η relative to the Miesowicz viscosity η1 due to the slipping effect. The details of estimation of this decreasing was described in Reference [28]. In particular, it was shown that for the case of surface orientation along the flow direction, the next expression for δη is valid:
The similar expression with a substitution of η3 instead of η2 can be obtained for the second type of surface orientation. In both cases, the above-mentioned decreasing of the effective shear viscosity is of about 5% at voltages, used in experiments. Taking into account this effect, one can conclude that there is a satisfactory correspondence between the effective shear viscosity obtained for the initial surface orientation parallel to the flow and the Miesowicz coefficient η1.
Outside the surface layers, the maximal anglular deviation θm of the director from the initially homeotropic orientation stabilized by the strong electric field can be estimated in accordance with the next expression [13]:
The estimation of the last parameter corresponding to 5CB [14] leads to the value θm ≈ 0.05 rad. This was done for the pressure gradient G ≈ 105 Pa/m, corresponding to the initial stage (l = 0.5 cm) of the capillary rise. According to Equation (14), this results in the negligible influence of the flow. Thus, in this case, the electric field effectively suppresses the orientation effect of both the surface and the flow, which is also confirmed by the digital images presented above (see Figure 2 and Figure 3). In accordance with the above conclusion, the electrically stabilized LC behaves as a conventionally Newtonian liquid with the constant value of the effective shear viscosity close to the Miesowicz coefficient η1. The last fact is confirmed by the results of the analysis of the experimental data presented above.
The rigorous description of experimental results, in the absence of the electric field, is a very difficult task, which is beyond the scope of this article. In particular, it is interesting to understand how the abovementioned hydrodynamic instability at the initial planar surface orientation normal to the flow direction can play any role in the decay of 5CB capillary flow. Our estimates made in accordance with Equation (14), using the exact values of 5CB material parameters, lead to the threshold values of the pressure gradient Gc = (ΔP/Δx)c = 1.27 × 10⁴ Pa/m for h = 100 μ, which corresponds to the value of the capillary rise lc = 25 mm and time tc ≈ 50 s, respectively. At the same time, the declination of the experimental dependence from the theoretically obtained data, shown in Figure 8, takes place only for the time t > 100 s. Nevertheless, one has to take into account the rather slow motion of the director in the absence of the electric field, which may lead to additional time required for the director to return to the initial planar state, normal to the flow direction. The typical time scale for such a motion can be defined by a well-known expression [13]:
which gives for 5CB, the value of τn equal to be ≈ 20 s. It is also known [13], that the typical times of reverse relaxation of the strongly deformed orientation structure induced by hydrodynamic instabilities to its initial state can be significantly longer than those, defined by Equation (19). It may be responsible for the difference between the experimental data and the abovementioned theoretical estimate.
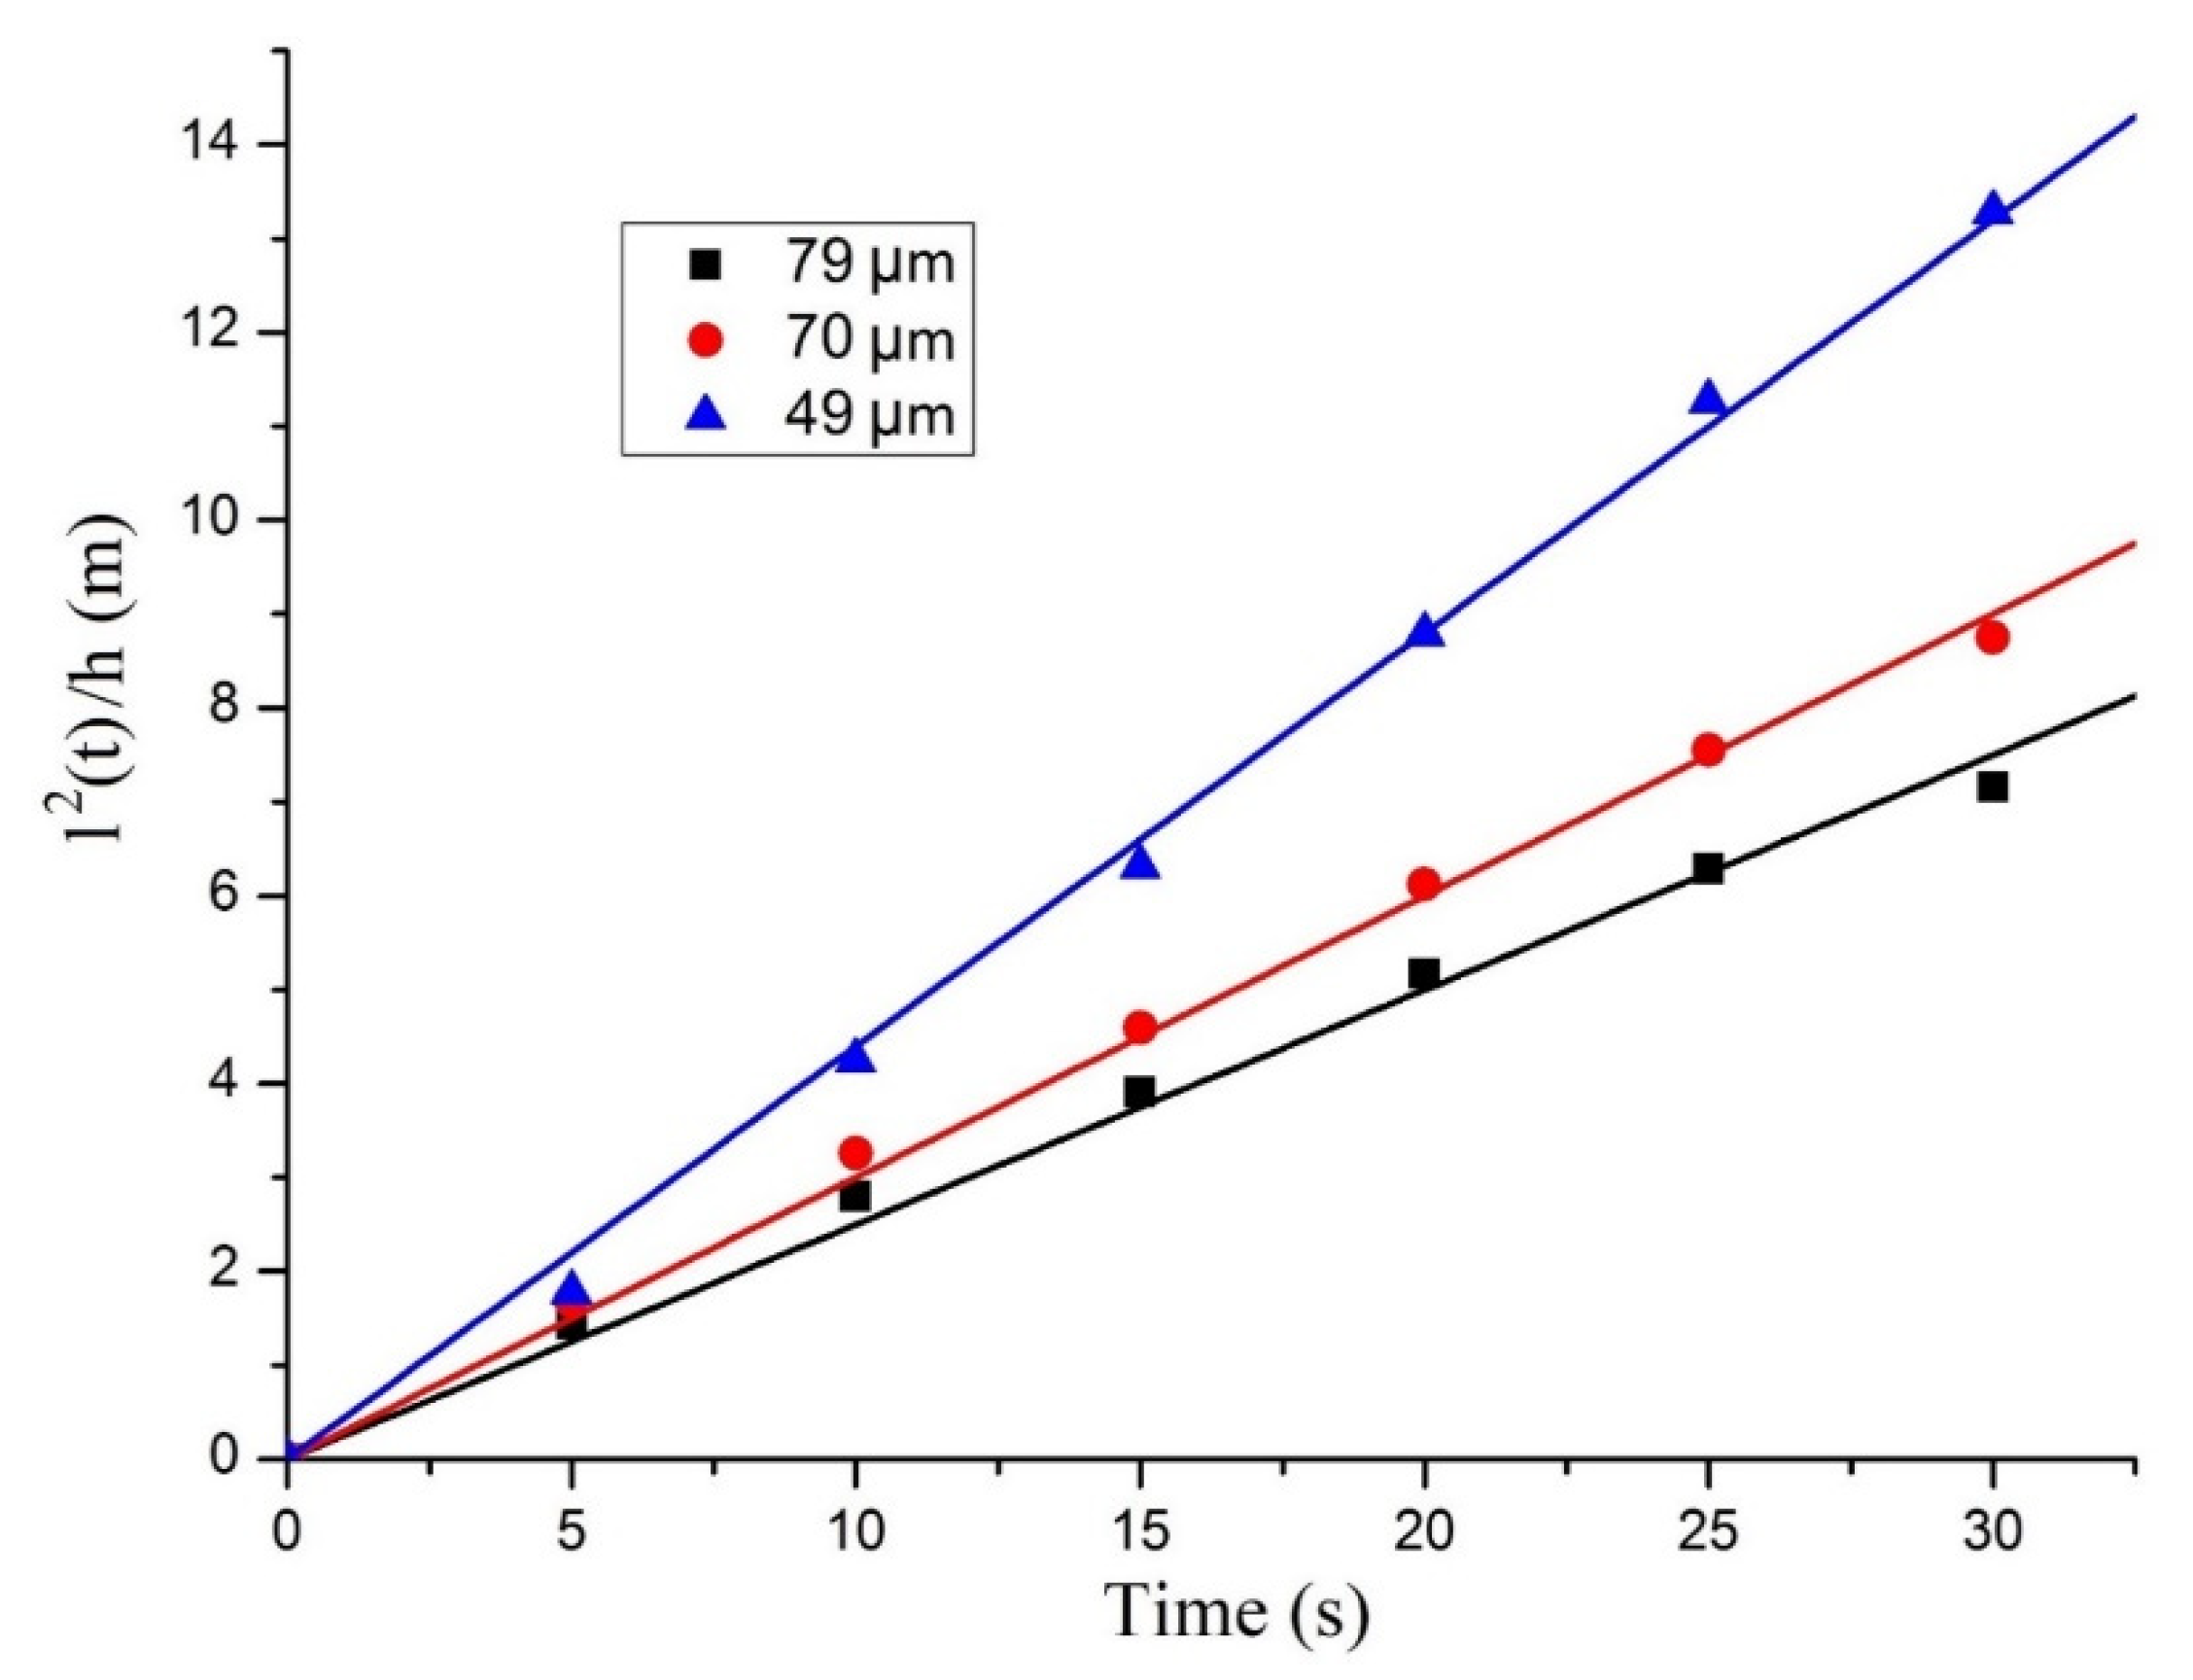
Some additional information on the shear viscosity of liquid crystals can be extracted from the analysis of the experimental dependences l(t) (see Figure 7) obtained for various local values of the gap in the wedge-like cell. In particular, at the initial stage of the capillary rise, one can neglect by influence of the hydrostatic pressure difference on the motion of the contact line. The solution (9) in this case is simplified and expressed as:
The comparison of the experimental results with this law at different values of the capillary gap at the beginning of flow (0–30 s.) is presented in Figure 10. The slope of straight lines provides a determination of the effective shear viscosity of LC. The obtained values of this parameter are intermediate between Miesowicz viscosities η2 and η3, which confirms the possibility of estimating of the shear viscosity using such a simple law.
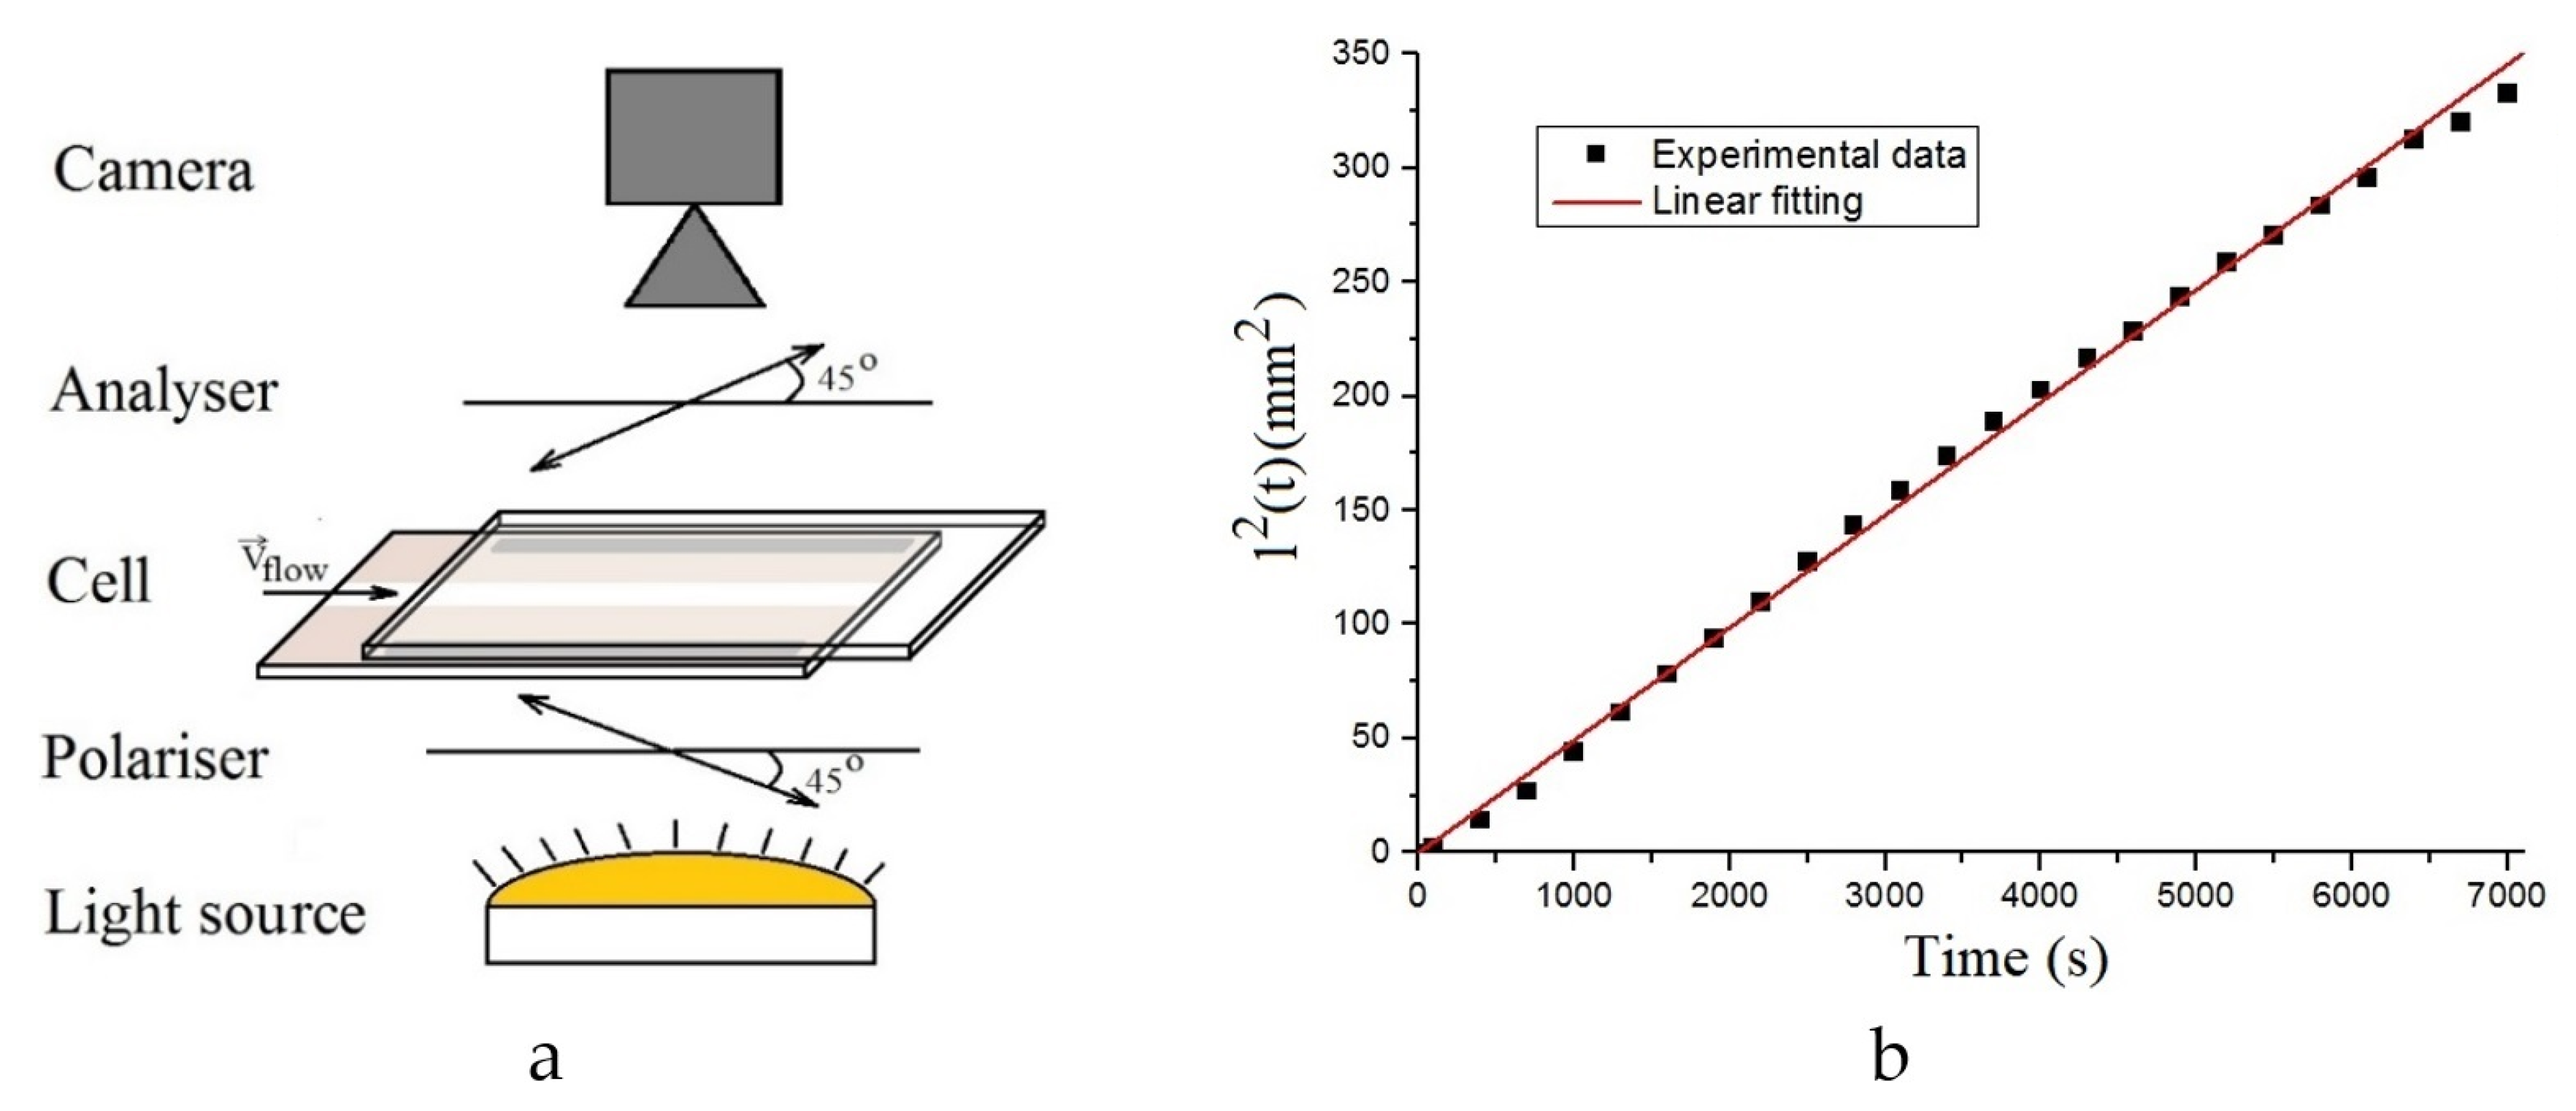
Recently, this approach has been applied to describe the capillary flow of the shock free ferroelectric smectic C* liquid crystal in a flat capillary with the gap in 23 μm and with homeotropic boundary conditions [29]. The corresponding geometry of the experiment is shown in Figure 11a. The horizontal position of the capillary made it possible to neglect the hydrostatic pressure difference. The result of the comparing the experimental data with data obtained by the theoretical law of Equation (20), is shown in Figure 11b. It is interesting, that contrary to nematics, the capillary flow resulted in an arising of long living defects, which occupied only a small part of the LC cell. The good agreement between the experiment and the theory in this case confirms the perspectives of using the capillary flow to study the viscous properties of both the nematic and smectic C* phases.
4. Conclusions
The first experimental studies of liquid crystal (LC) rise in flat capillaries with internal photosensitive surfaces have been performed. The capillaries with different surface orientations were prepared using the photoalignment technique. The influence of the surface and bulk orientation of LC molecules on the dynamics of a decay capillary flow in the absence and presence of an electric field has been experimentally studied, analyzed and compared with the previously obtained results. The results, obtained for the nematic liquid crystal (5CB) are compared with the results of an investigation of a capillary flow in shock-free ferroelectric smectic C* phase. In summary, we note the following results:
1. The dynamics of capillary rise of nematic liquid crystal 5CB in the vertical plane of capillaries with photo-oriented substrates is studied for the first time. It was found, that the stationary value of the contact angle weakly depends on the direction of the planar surface orientation relatively to the direction of the capillary rise. Application of the strong electric fields resulted in a decreasing of the contact angle.
2. The theoretical model of the capillary flow, describing the capillary rise of isotropic Newtonian liquids, was applied to study the dynamics of the capillary flow of anisotropic liquids.
3. It was established, that application of the strong electric field provided the best agreement of the experimental data with the theoretically obtained results describing the capillary flow of the conventionally Newtonian anisotropic liquid with the constant value of the shear viscosity.
4. In the case when the initial surface orientation was normal compared to the flow plane, the experimental results indicated on the flow induced an orientational transition between homogeneous planar structure and distorted twisted configuration described by the Guion—Pieranski mechanism.
5. The comparison of the results of the investigation of capillary flows in nematics and shock-free ferroelectric smectic C* phases revealed the perspectives of usage of such flows for determination of anisotropic shear viscosities of liquid crystals.
Author Contributions
D.V.S., S.S.K., V.A.B. and T.P.T. performed the experiments, analyzed the optical patterns and orientational structures of LC. D.V.S., S.V.P., E.P.P. and A.V.Z. supervised the study. All authors wrote and reviewed the manuscript. All authors have read and agreed to the published version of the manuscript.
Funding
This work was supported by Ministry of Education and Science of Russian Federation (Grant N° FSFZ-2020-0019). The reported study also was funded by Russian Foundation for Basic Research (RFBR and DFG project N° 20-52-12040, RFBR Project N° 20-02-00746 A, RFBR Project N° 19-52-06005 MSTI_a).
Conflicts of Interest
The authors declare no conflict of interest.
References
- Squires, T.M.; Quake, S.R. Microfluidics: Fluid physics at the nanoliter scale. Rev. Mod. Phys. 2005, 77, 977–1026. [Google Scholar] [CrossRef] [Green Version]
- Blake, T.D. Surfactant science series, Wettability. Surfactant Sci. Ser. 1993, 49, 251–309. [Google Scholar]
- Rey, A.D. Nematic contact lines and the Neumann and Young equations for liquid crystals. J. Chem. Phys. 1999, 111, 7675–7684. [Google Scholar] [CrossRef]
- Viswanath, P.; Suresh, K.A. Spreading and retraction dynamics of smectic liquid crystal domains at interfaces. Liquid Cryst. 2014, 41, 320–327. [Google Scholar] [CrossRef]
- Cummings, L.J.; Lin, T.-S.; Kondic, L. Modeling and simulations of the spreading and destabilization of nematic droplets. Phys. Fluids 2011, 23, 043102–043112. [Google Scholar] [CrossRef] [Green Version]
- Bénichou, O.; Cachile, M.; Cazabat, A.M.; Poulard, C.; Valignat, M.P.; Vandenbrouck, F.; Van Effenterre, D. Thin films in wetting and spreading. Adv. Colloid Interface Sci. 2003, 100–102, 381–398. [Google Scholar] [CrossRef]
- Shmeliova, D.V.; Tsvetkov, V.A.; Pasechnik, S.V.; Kozenkov, V.M.; Dorozhkina, G.N.; Angelutz, A.A.; Lezhnev, A.V. Anisotropic spreading of liquid crystals and isotropic fluids on anisometric surface of DVD discs. Mol. Cryst. Liq. Cryst. 2008, 495, 212/[564]–220/[572]. [Google Scholar] [CrossRef]
- Cox, R.G. The Dynamics of the Spreading of the Liquids on a Solid Surface. Part 1. Viscous Flow. J. Fluid Mech. 1986, 168, 169–194. [Google Scholar] [CrossRef]
- Washburn, E.W. The dynamics of capillary flow. Phys. Rev. 1921, 17, 273–283. [Google Scholar] [CrossRef]
- Heshmati, M.; Piri, M. Experimental investigation of dynamic contact angle and capillary rise in tubes with circular and noncircular cross sections. Langmuir 2014, 30, 14151–14162. [Google Scholar] [CrossRef]
- Ponomarenko, A.; Quere, D.; Clanet, C. A Universal Law for Capillary Rise in Corners. J. Fluid Mech. 2011, 666, 146–154. [Google Scholar] [CrossRef] [Green Version]
- Dreyer, M.; Delgado, A.; Rath, H.-J. Capillary Rise of Liquid between Parallel Plates under Microgravity. J. Colloid Interface Sci. 1994, 163, 158–168. [Google Scholar] [CrossRef]
- Pasechnik, S.V.; Chigrinov, V.G.; Shmeliova, D.V. Liquid Crystals: Viscous and Elastic Properties in Theory and Applications; Wiley: New York, NY, USA, 2009; p. 424. [Google Scholar]
- Stewart, I.W. The Static and Dynamic Continuum Theory of Liquid Crystals: A Mathematical Introduction; Tailor and Francis: Abingdon, UK, 2004; p. 351. [Google Scholar]
- Kneppe, H.; Schneider, F.; Sharma, N.K. A Comparative Study of the Viscosity Coefficients of Some Nematic Liquid Crystals, Ber. Bunsenges. Phys. Chem. 1981, 85, 784–789. [Google Scholar]
- Leslie, F.M. Some constitutive equations for liquid crystals. Arch. Ration. Mech. Anal. 1968, 28, 265–283. [Google Scholar] [CrossRef]
- Pasechnik, S.V.; Chigrinov, V.G.; Shmeliova, D.V.; Tsvetkov, V.A.; Voronov, A.N. Anisotropic shear viscosity in nematic liquid crystals: New optical measurement method. Liq. Cryst. 2004, 31, 585–592. [Google Scholar] [CrossRef]
- Pasechnik, S.V.; Shmeliova, D.V.; Semerenko, D.A.; Voronov, A.N.; Semina, O.A. Modified optical method for measurements of anisotropic shear viscosities of nematic liquid crystals. Liq. Cryst. Appl. 2011, 3, 41–46. [Google Scholar]
- Pasechnik, S.V.; Shmeliova, D.V.; Kharlamova, O.A.; Chigrinov, V.G.; Sun, J.; Dubtsov, A.V. Photoalignment in rheology of liquid crystals. Mol. Cryst. Liq. Cryst. 2012, 560, 131–142. [Google Scholar] [CrossRef]
- Chigrinov, V.G.; Kozenkov, V.M.; Kwok, H.-S. Photoalignment of Liquid Crystalline Materials: Physics and Applications; Wiley: New York, NY, USA, 2008; p. 231. [Google Scholar]
- Chigrinov, V.G. Photoalignment and photopatterning: New liquid crystal technology for displays and photonics. Fine Chem. Technol. 2020, 15, 7–20. [Google Scholar] [CrossRef]
- Tsvetkov, V.A.; Tsvetkov, O.V.; Balandin, V.A. Anisotropic properties of the LC surface tension. Mol. Cryst. Liq. Cryst. Sci. Technol. Sect. A Mol. Cryst. Liq. Cryst. 1999, 329, 917–924. [Google Scholar] [CrossRef]
- Girardo, S.; Palpacelli, S.; De Maio, A.; Cingolani, R.; Succi, S.; Pisignano, D. Interplay between Shape and Roughness in Early-Stage Microcapillary Imbibition. Langmuir 2012, 28, 2596–2603. [Google Scholar] [CrossRef] [PubMed]
- Tang, L.-H.; Tang, Y. Capillary Rise in Tubes with Sharp Grooves. J. Phys. II 1994, 4, 881–890. [Google Scholar]
- Manneville, P. Theoretical Analysis of Poiseuille Flow Instabilities in Nematics. J. Phys. Paris 1979, 40, 713–724. [Google Scholar]
- Pieranski, P.; Guyon, E. Instability of certain shear flows in nematic liquids. Phys. Rev. A 1974, 9, 404–417. [Google Scholar]
- Janossy, I.; Pieranski, P.; Guyon, E. Poiseuille Flow in nematics: Experimental study of the instabilities. J. Phys. 1976, 37, 1105–1113. [Google Scholar]
- Shmeliova, D.V.; Kharlamov, S.S.; Semina, O.A.; Bluzhin, A.V.; Pasechnik, S.V. Decay flow of liquid crystals in the presence of magnetic and electric fields for viscosity measurements. Liq. Cryst. Appl. 2020, 20, 49–56. [Google Scholar]
- Shmeliova, D.V.; Pozhidaev, E.P.; Kharlamov, S.S.; Pasechnik, S.V.; Barbashov, V.A.; Chigrinov, V.G. Capillary flow and shear viscosity of ferroelectric liquid crystal. Liq. Cryst. Appl. 2018, 18, 88–94. [Google Scholar]
Figure 1.
Designs of experimental cells. (a)—design of the cells 1 and 2 with a constant gap, shaded areas indicate the presence of ITO electrodes; (b)—design of the cell 3 with a variable gap; (c)—scheme illustrating the capillary flow of LC under the effect of capillary and viscous forces; (d)—structural formula of the azo dye SD-1; (e)—structural formula of the liquid crystal 5CB.

Figure 2.
Snapshots showing the movement of the contact line in capillaries with different surface orientations in the cell 1 (h = 110 μm). The polarizer and analyzer are crossed and oriented at 45° relatively to the flow direction. (1)—ns parallel to the flow velocity and perpendicular to the flow velocity gradient; (2)—ns perpendicular to the flow velocity and the flow velocity gradient; (3)—ns perpendicular to the flow velocity and the flow velocity gradient. The applied electric voltage is U = 100 V, f = 5 kHz, respectively.

Figure 3.
Snapshots showing the movement of a contact line in capillaries in the cell 2 (h = 95 μm). Polarizer and analyzer are crossed and oriented at 45° relatively to the flow direction. (1)—ns parallel to the flow velocity and perpendicular to the flow velocity gradient; (2)—ns parallel to the flow velocity and perpendicular to the flow velocity gradient. The applied electric voltage is U = 150 V, f = 1 kHz, respectively.

Figure 4.
Time dependences of the meniscus displacement l(t) for the channels with the initial surface orientation ns perpendicular to the flow velocity and the flow velocity gradient in the absence (cell 1 (2), red circles) and presence (cell 1 (3), black squares) of the electric voltage U = 100 V, f = 5 kHz. Dashed lines show the corresponding stationary levels (the level reached by the meniscus 10 h after the start of the experiment).

Figure 5.
Time dependences of the meniscus displacement l(t) for the channels with the initial surface orientation ns parallel to the flow velocity and perpendicular to the flow velocity gradient in the absence (cell 1 (1), red circles) and presence (cell 2 (2), black squares) of the electric voltage U = 150 V, f = 1 kHz. Dashed lines show the corresponding stationary levels (the level reached by the meniscus 10 h after the start of the experiment).

Figure 6.
Experimentally obtained instant lateral profiles in cell 3 at different times. Dashed line shows the stationary level (the level reached by the meniscus 10 h after the start of the experiment), ns perpendicular to the flow velocity and the flow velocity gradient.
Figure 6.
Experimentally obtained instant lateral profiles in cell 3 at different times. Dashed line shows the stationary level (the level reached by the meniscus 10 h after the start of the experiment), ns perpendicular to the flow velocity and the flow velocity gradient.

Figure 7.
Time dependences of the meniscus displacement l(t) at different local values of the gap h in cell 3 with the initial surface orientation ns perpendicular to the flow velocity and the flow velocity gradient. Dashed lines shows the corresponding stationary levels (the level reached by the meniscus 10 h after the start of the experiment, red dashed line (2) for h = 79 μm, black dashed line (1) for h = 106 μm, respectively.

Figure 8.
Approximation by Equation (9) from experimental data with the relaxation time τ as the fitting parameter in the absence and presence of electric voltage U = 100 V, f = 5 kHz for the initial surface orientation ns perpendicular to the flow velocity and the flow velocity gradient. Black squares correspond to the results obtained for the cell 1 (3), red circles—for the cell 1 (2). The values of τ and l0 are presented in Table 3.

Figure 9.
Approximation by Equation (9) from experimental data with the relaxation time τ as the fitting parameter in the absence and presence of electric voltage U = 150 V, f = 1 kHz for the initial surface orientation ns parallel to the flow velocity and perpendicular to the flow velocity gradient. Black squares correspond to the results obtained for the cell 2 (2), red circles—for the cell 1 (1). The values of τ and l0 are presented in Table 3.

Figure 10.
Time dependences of the function l2(t)/h, for a number of values of the capillary gap h: 79 μm (squares, η = 0.037 Pa*s), 70 μm (circles, η = 0.030 Pa*s), and 49 μm (triangles η = 0.02 Pa*s), respectively.
Figure 10.
Time dependences of the function l2(t)/h, for a number of values of the capillary gap h: 79 μm (squares, η = 0.037 Pa*s), 70 μm (circles, η = 0.030 Pa*s), and 49 μm (triangles η = 0.02 Pa*s), respectively.

Figure 11.
(a) Experimental setup scheme. (b) Time dependence of the function l2(t), for the value of ηeff = 0.47 Pa*s.
Figure 11.
(a) Experimental setup scheme. (b) Time dependence of the function l2(t), for the value of ηeff = 0.47 Pa*s.


Table 1.
Characteristics of experimental cells.
| Cell Number | d (μm)/h (μm) | A (cm) | L (cm) |
|---|---|---|---|
| 1 | 100/110 | 1 | 5 |
| 2 | 90/95 | 0.8 | 6 |
| 3 | 23/25 100/110 | 4 | 6.5 |
Table 2.
The static parameters of the capillary rise when there is no electric voltage for cells 1 and 3. Cell 1 (2) and the cell 3—ns perpendicular to the flow velocity and the flow velocity gradient; cell 1 (1)—ns parallel to the flow velocity and perpendicular to the flow velocity gradient. The contact angle is calculated using Equation (10).
| Cell 3 | Cell 1 (2) | Cell 1 (1) | ||||||
|---|---|---|---|---|---|---|---|---|
| Capillary gap, h (μm) | 80 | 85 | 90 | 95 | 100 | 105 | 110 | 110 |
| Stationary level, l0 (mm) | 64.9 | 62.9 | 60.6 | 57.5 | 54.6 | 50.8 | 48.2 | 49.9 |
| Contact angle, θ (deg) | 37 | 36 | 33 | 33 | 33 | 35 | 36 | 33 |
Table 3.
The parameters for approximating experimental data in accordance with Equation (9) are shown in Figure 8 and Figure 9 and the values of effective shear viscosities calculated by using Equation (11).
| Cell 1 (1) | Cell 2 (2) | Cell 1 (2) | Cell 1 (3) | |
|---|---|---|---|---|
| τ (sec.) | 185 | 680 | 181 | 375 |
| l0 (mm) | 49.9 | 59.9 | 45.3 | 48.2 |
| η (Pa*s) | 0.037 | 0.086 | 0.038 | 0.085 |
Publisher’s Note: MDPI stays neutral with regard to jurisdictional claims in published maps and institutional affiliations. |
© 2020 by the authors. Licensee MDPI, Basel, Switzerland. This article is an open access article distributed under the terms and conditions of the Creative Commons Attribution (CC BY) license (http://creativecommons.org/licenses/by/4.0/).
Share and Cite
MDPI and ACS Style
Shmeliova, D.V.; Pasechnik, S.V.; Kharlamov, S.S.; Zakharov, A.V.; Pozhidaev, E.P.; Barbashov, V.A.; Tkachenko, T.P. Capillary Flows of Nematic Liquid Crystal. Crystals 2020, 10, 1029. https://doi.org/10.3390/cryst10111029
AMA Style
Shmeliova DV, Pasechnik SV, Kharlamov SS, Zakharov AV, Pozhidaev EP, Barbashov VA, Tkachenko TP. Capillary Flows of Nematic Liquid Crystal. Crystals. 2020; 10(11):1029. https://doi.org/10.3390/cryst10111029
Chicago/Turabian StyleShmeliova, Dina V., Sergey V. Pasechnik, Semen S. Kharlamov, Alexandre V. Zakharov, Eugeny P. Pozhidaev, Vadim A. Barbashov, and Timofey P. Tkachenko. 2020. "Capillary Flows of Nematic Liquid Crystal" Crystals 10, no. 11: 1029. https://doi.org/10.3390/cryst10111029
Note that from the first issue of 2016, this journal uses article numbers instead of page numbers. See further details here.