Article

Cocrystal Formation through Solid-State Reaction between Ibuprofen and Nicotinamide Revealed Using THz and IR Spectroscopy with Multivariate Analysis

1
Graduate School of Medical Photonics, Shizuoka University, 3-5-1 Johoku Naka-ku, Hamamatsu, Shizuoka 432-8011, Japan
2
Research Institute of Pharmaceutical Sciences, Musashino University, 1-1-20 Shin-machi, Nishi-Tokyo, Tokyo 202-8585, Japan
3
Research Institute of Electronics, Shizuoka University, 3-5-1 Johoku Naka-ku, Hamamatsu, Shizuoka 432-8011, Japan
*
Author to whom correspondence should be addressed.
Crystals 2020, 10(9), 760; https://doi.org/10.3390/cryst10090760
Submission received: 31 July 2020 / Revised: 24 August 2020 / Accepted: 26 August 2020 / Published: 28 August 2020
(This article belongs to the Special Issue Multivariate Analysis Applications to Crystallography)

Abstract

:
Cocrystallisation can enhance the solubility and bioavailability of active pharmaceutical ingredients (APIs); this method may be applied to improve the availability of materials that were previously considered unsuitable. Terahertz (THz) spectroscopy provides clear, substance-specific fingerprint spectra; the transparency of the THz wave allows us to probe inside a sample to identify medicinal materials. In this study, THz and infrared (IR) spectroscopy were used to characterise cocrystallisation in solid-phase reactions between ibuprofen and nicotinamide. Multivariate curve resolution with alternating least squares (MCR-ALS) was applied to both time-dependent THz and IR spectra to identify the intermolecular interactions between these cocrystallising species. The analytical results revealed cocrystal formation through a two-step reaction, in which the steps were dominated by thermal energy and water vapour, respectively. We infer that the presence of water molecules significantly lowered the activation energy of cocrystal formation.

1. Introduction

Cocrystallisation can be used to enhance the solubility and bioavailability of active pharmaceutical ingredients (APIs), classified according to the Biopharmaceutical Classification System (BCS) as Class II materials. Cocrystallisation can also improve key manufacturing parameters, such as flowability, tablet formation and storage stability [1,2].
Cocrystals are a molecular complex of APIs with a highly water-soluble cocrystal former (coformer). Complex formation is based on weak non-ionic intermolecular interactions, such as hydrogen bonding and van der Waals forces, such that no structural changes occur in the APIs. Hence, the European Medicines Agency (EMA) and Food and Drug Administration (FDA) have released guidelines that consider cocrystals identical to APIs as long as they do not exhibit different pharmacokinetics [3,4]. This led to the introduction of cocrystal-based medicines in 2014. Moreover, four candidate cocrystalline materials are currently in clinical trials [5]. For at least 30% of currently marketed drugs, the replacement of APIs with cocrystals is expected to significantly improve patients’ quality of life. Candidate compounds previously deemed unsuitable may be acceptable when incorporated into a cocrystal.
Cocrystals can be prepared using methods based on slurry, anti-solvents, hot-melt extrusion and supercritical fluid [6,7,8,9,10,11,12,13,14,15,16]. A method for preparing disordered cocrystals involving co-grinding of the constituents and storage of the mixture under controlled temperature and humidity conditions has also been reported [17,18,19,20,21]. This method satisfies the requirements of green chemistry and yields high-quality cocrystals, but it requires many steps and is not suitable for industrialisation. Therefore, cocrystal formation without mechanical activation is desirable for industrial production.
The structure and characterisation of ibuprofen/nicotinamide (IBF/NA) cocrystals, as well as their in vivo effects, have been reported [22,23,24]. We previously reported the mechanism underlying the formation of IBF/NA cocrystals prepared using the hot melt method. The mechanism underlying the formation of IBF/NA cocrystals prepared using the slurry method has also been discussed [25,26]. Together, these findings have allowed the strict control of cocrystallisation and the close monitoring of the process; however, several phenomena related to cocrystallisation remain unknown, due to the presence of a liquid phase during the preparation process.
Ultraviolet (UV)–visible [27], infrared (IR) [28,29,30], near-IR [30,31] and Raman [30,31] spectroscopy are commonly used to analyse medicinal materials. Terahertz (THz) spectroscopy can also be used to examine low-frequency molecular vibrations that correspond to particular intermolecular interactions [32,33]. THz spectroscopy is nondestructive and provides a clear, substance-specific spectral fingerprint. Due to the transparency of many medicinal materials in the THz regime, THz spectroscopy allows researchers to probe the interior of a sample. These features are consistent with the concept of process analytical technology (PAT), which was introduced by the FDA in 2004, making THz spectroscopy a promising new type of PAT [34,35,36,37,38,39]. However, as THz spectroscopy is a relatively new technology, its effects on the physical properties of samples and the optical assignment of vibrational modes remain poorly understood. Further fundamental research on the interactions between THz radiation and samples is required for the full application of THz spectroscopy to pharmaceutical manufacturing.
In this study, we used THz and IR spectroscopy to characterise cocrystallisation in solid-phase reactions between IBF and NA. Multivariate curve resolution with alternating least squares (MCR-ALS) was applied to time-dependent THz and IR spectra to identify the intermolecular interactions between these cocrystallising species.

2. Materials and Methods

2.1. Materials

Racemic IBF (Lot I2HJD-DM) was purchased from Tokyo Chemical Industry Co., Ltd. (Tokyo, Japan) and NA (Lot CAN6328) was purchased from FUJIFILM Wako Pure Chemical Corporation (Osaka, Japan). The molecular structures of IBF and NA are shown in Figure 1A,B. An equimolecular physical mixture (PM) of IBF and NA was prepared by mixing the two compounds using a mortar and pestle. Tablets (200 mg, 8 mm diameter) were pressed from the mixture using a single punch tableting machine (TabAll; Okada Seiko, Tokyo, Japan) with flat-face punches.

2.2. Methods

2.2.1. Storage of Tablets

Three tablets were kept in a 25 mL glass container. The relative humidity (RH) inside the container was held at 0%, 30% or 75%, and the container was stored in an oven at 60 °C. The oven was constantly purged with dry air (dew point < −60 °C, 0.08% RH) at 1 L/min. The 30% and 75% RH conditions were achieved by including 9 mL of saturated aqueous solutions of magnesium chloride and sodium chloride, respectively, in the container holding the tablets. The storage time was set according to the reaction (Table 1). The stored tablets were removed and ground to a powder immediately prior to spectroscopic measurements.
In addition, three tablets were stored at 45, 50, 55 and 60 °C for 72 h to determine the contributions of thermal energy to the solid-state cocrystallisation reaction. To maintain a constant water vapour atmosphere of 51.12 ± 3.5 g/m3 (absolute humidity) at these temperatures, saturated aqueous solutions of potassium bromide, potassium iodide, sodium bromide or magnesium nitrate, respectively, were added to the tablet container.

2.2.2. Fourier-Transform Infrared Spectroscopy (FT-IR) Measurements

IR spectra were acquired with an FT-IR spectrometer (FT/IR-6300; JASCO, Tokyo, Japan) using KBr plates. Each sample was sandwiched between KBr plates and scanned 32 times from 400 to 4000 cm−1 at a resolution of 4 cm−1.

2.2.3. Terahertz Spectroscopy Measurements

Polyethylene (PE)-diluted pellets were prepared for THz transmission measurements. To dilute the sample and obtain a uniform particle size, 20 mg of powdered sample was mixed with 380 mg of PE powder (particle size <20 μm) in an agate mortar and pestle. The mixed powder was compressed at 1000 psi to obtain 333 mg pellets 20 mm in diameter and 1 mm in thickness. The pellets featured a wedge-shaped cross section with an angle of 2° to prevent etalon artifacts in the THz data. THz spectra were acquired on a double-beam gallium-phosphide (GaP) THz spectrometer equipped with a GaP THz signal generator and two deuterated triglycine sulphate (DTGS) [40]. Each sample was scanned in 15 GHz (0.5 cm−1) steps from 0.45 to 6.04 THz (15.0–201 cm−1). The measurement chamber was filled with dry air and measurements were performed at room temperature.

2.2.4. Multivariate Analysis

To determine the PM-to-cocrystal reaction rate at each sampling point, reference cocrystals (R-cocrystals) were prepared by grinding PM with 10 agate balls (12 mm diameter) in a planetary ball mill for 240 min. The resulting cocrystal powder was analysed by FT-IR and THz spectroscopy, and each spectrum was incorporated into a comprehensive data set. All of the FT-IR and THz spectra thus obtained were analysed via MCR-ALS using Unscrambler X (CAMO Software, Oslo, Norway).
MCR can deconvolve mixed spectra to show the relative contributions of each constituent using the following Equation:
X = C S T + E ,
( X 11 X 1 k X n 1 X n k ) = ( C 11 C 1 m C n 1 C n m ) ( S 11 S 1 k S m 1 S n k ) + E
where X represents the experimental data, C is the concentration profile of a given component, ST is the component spectrum, E is the residual, n is the number of spectra for different storage times, k represents spectral intensity as a function of wavenumber and frequency, and m is the deconvoluted contribution. The ALS algorithm is frequently used to solve the above matrix. Details of the MCR-ALS algorithm have been reported elsewhere [41,42,43,44].
Prior to multivariate analysis, FT-IR spectra were subjected to area normalisation and multiple signal correction (MSC). THz spectra were smoothed using a moving average and then subjected to area normalisation and MSC. Calculations based on the FT-IR spectra were performed within the spectral ranges of 1832–2229 and 3275–3360 cm−1. THz spectra were collected between 0.8 and 6.0 THz (26.6–200 cm−1).

3. Results and Discussion

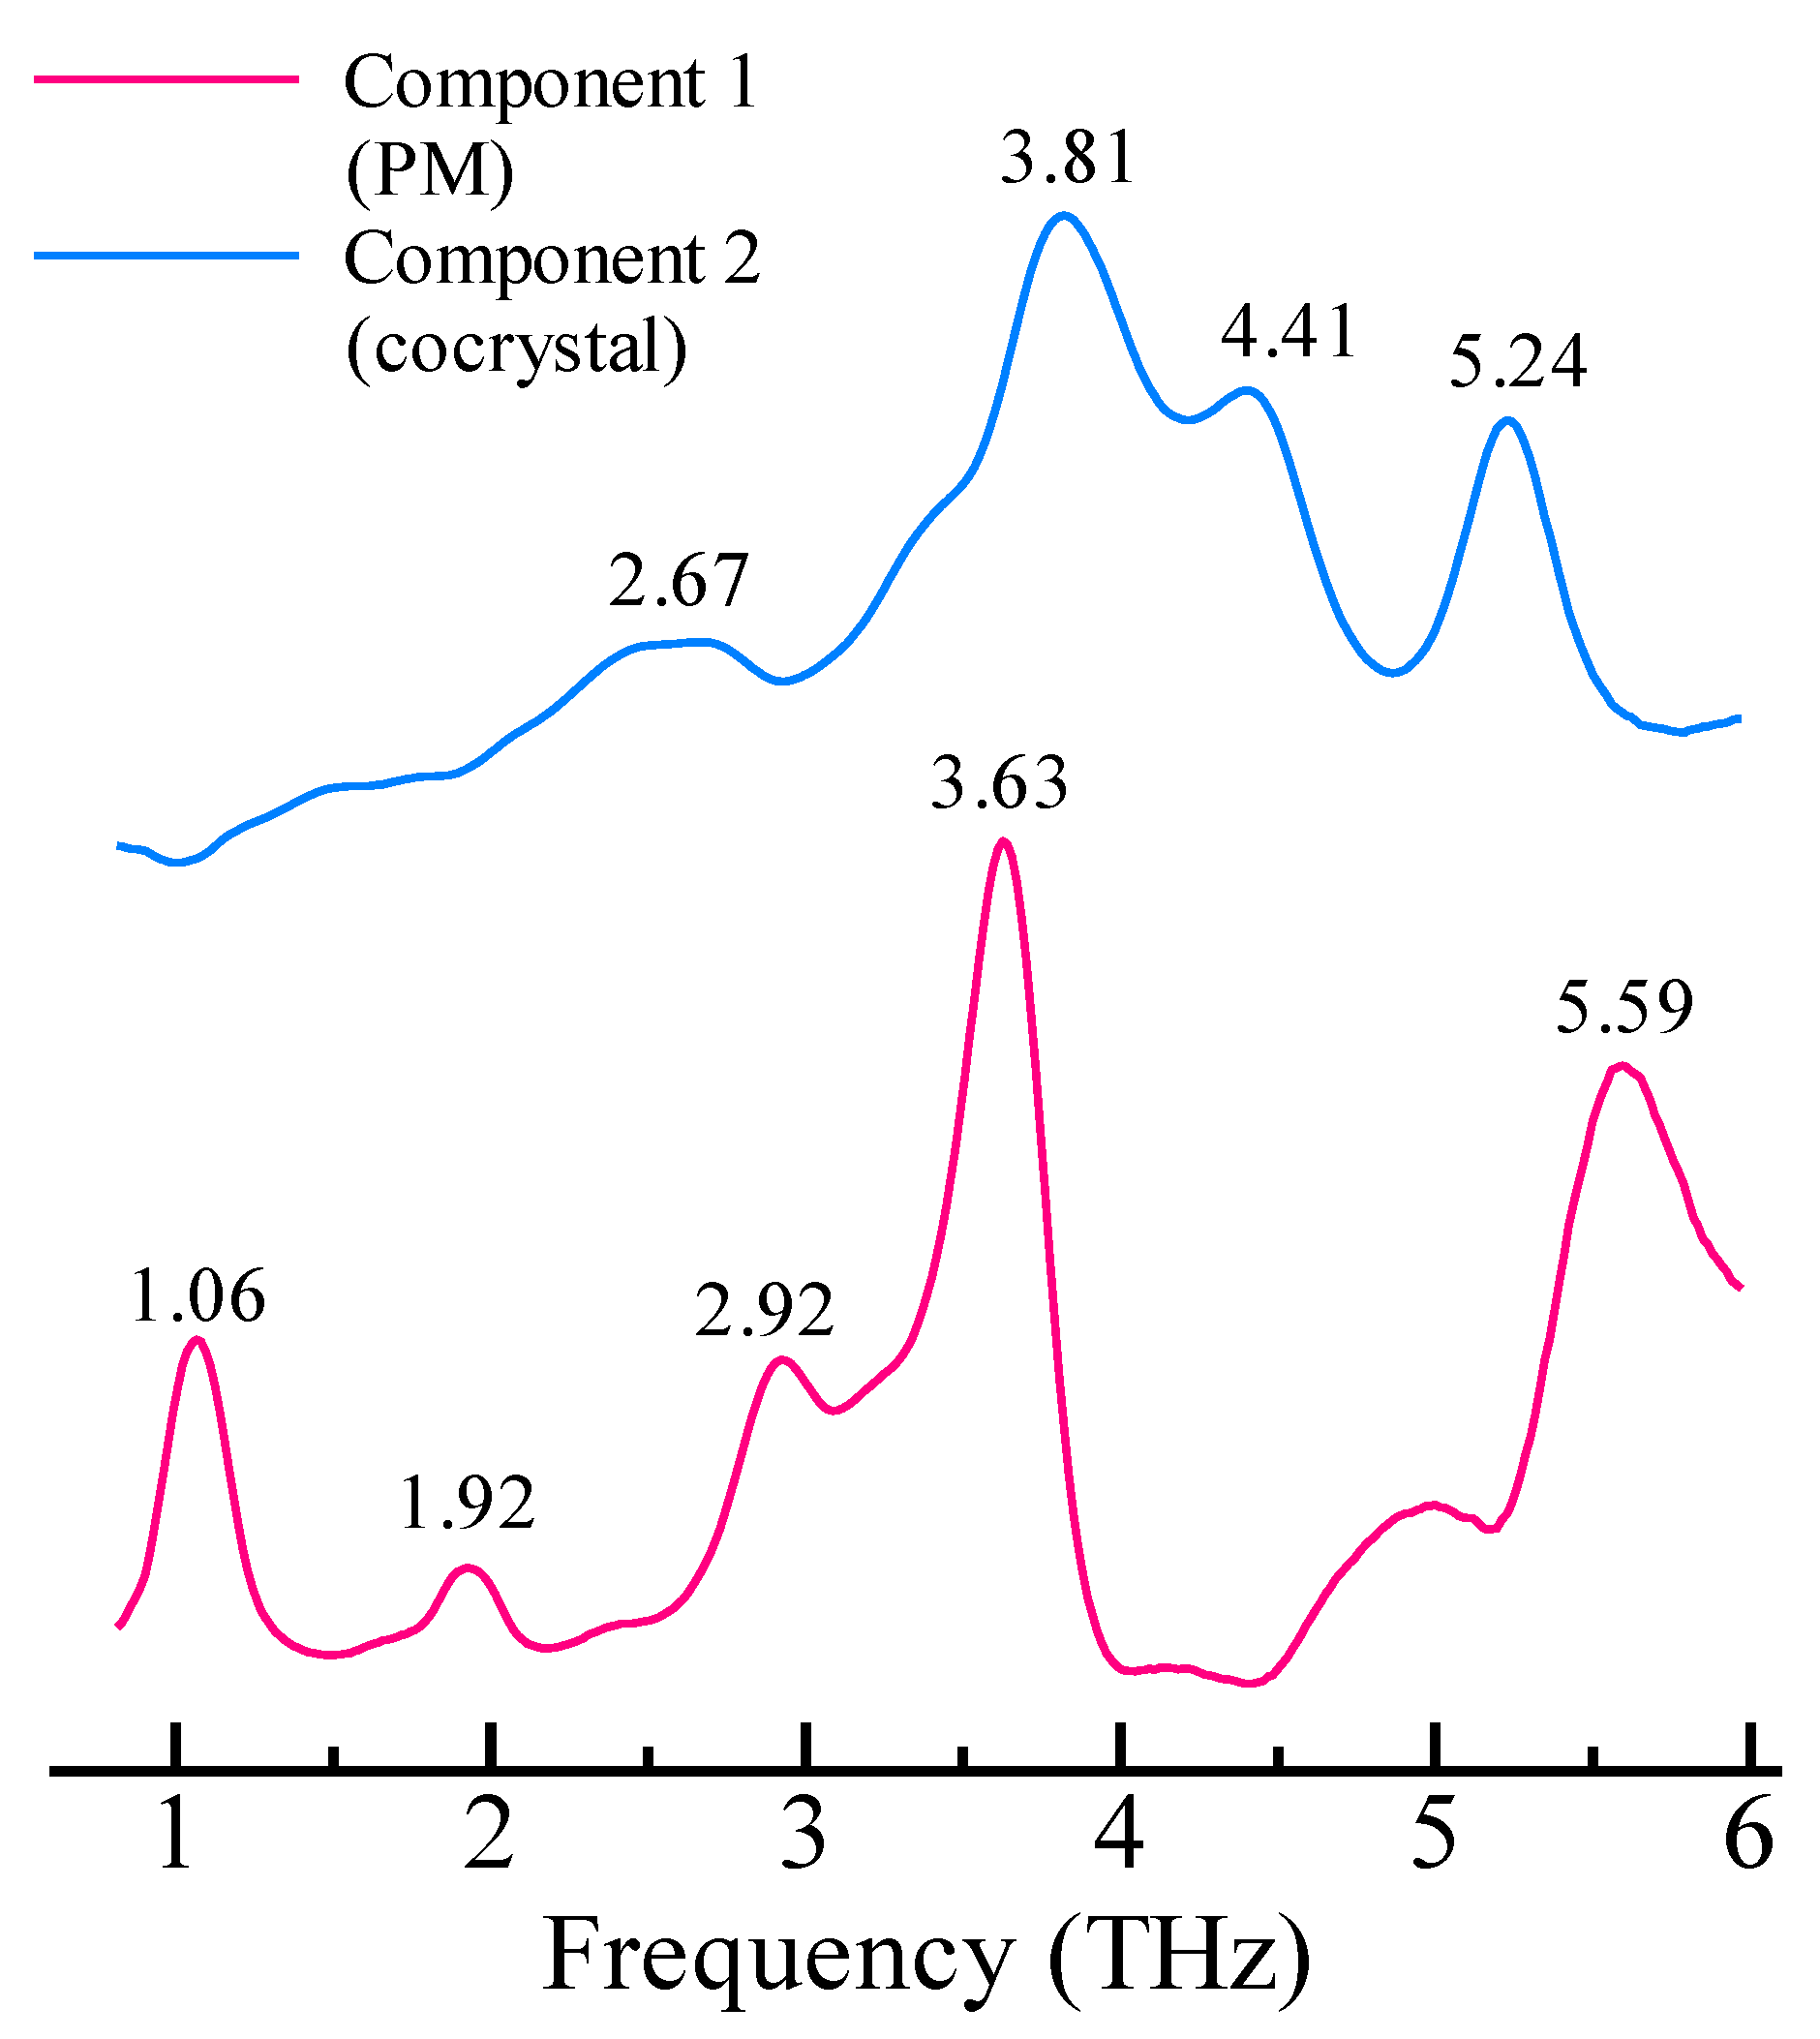
3.1. FT-IR and THz Spectra

To focus on the intermolecular interaction (hydrogen bond), we examined the FT-IR spectrum at around 1980 and 3316 cm−1. The THz spectrum is a fingerprint spectrum that depends on the crystal lattice; therefore, we focused on the region 0.8–6.1 THz, which was less susceptible to noise. The FT-IR spectrum of the IBF/NA cocrystal reportedly contains a broad absorption peak at around 1980 cm−1, characteristic of intermolecular O-H···N hydrogen bonding, and an absorption peak at 3316 cm−1 characteristic of intermolecular N-H···O hydrogen bonding [23]. In this study, we confirmed new characteristic peaks associated with cocrystal formation in these regions using the pre-processed FT-IR spectra (Figure 2A).
We observed drastic changes in the transition from PM to cocrystal in the THz spectrum, including the disappearance of a peak at 1.09 THz, the formation of a new peak at 4.42 THz, and peak shifts from 3.64 to 3.79 THz and 5.56 to 5.26 THz (Figure 2B). This result indicated a relationship between RH and FT-IR; thus, THz spectrum changes suggested a relationship between RH and spectroscopic spectra.

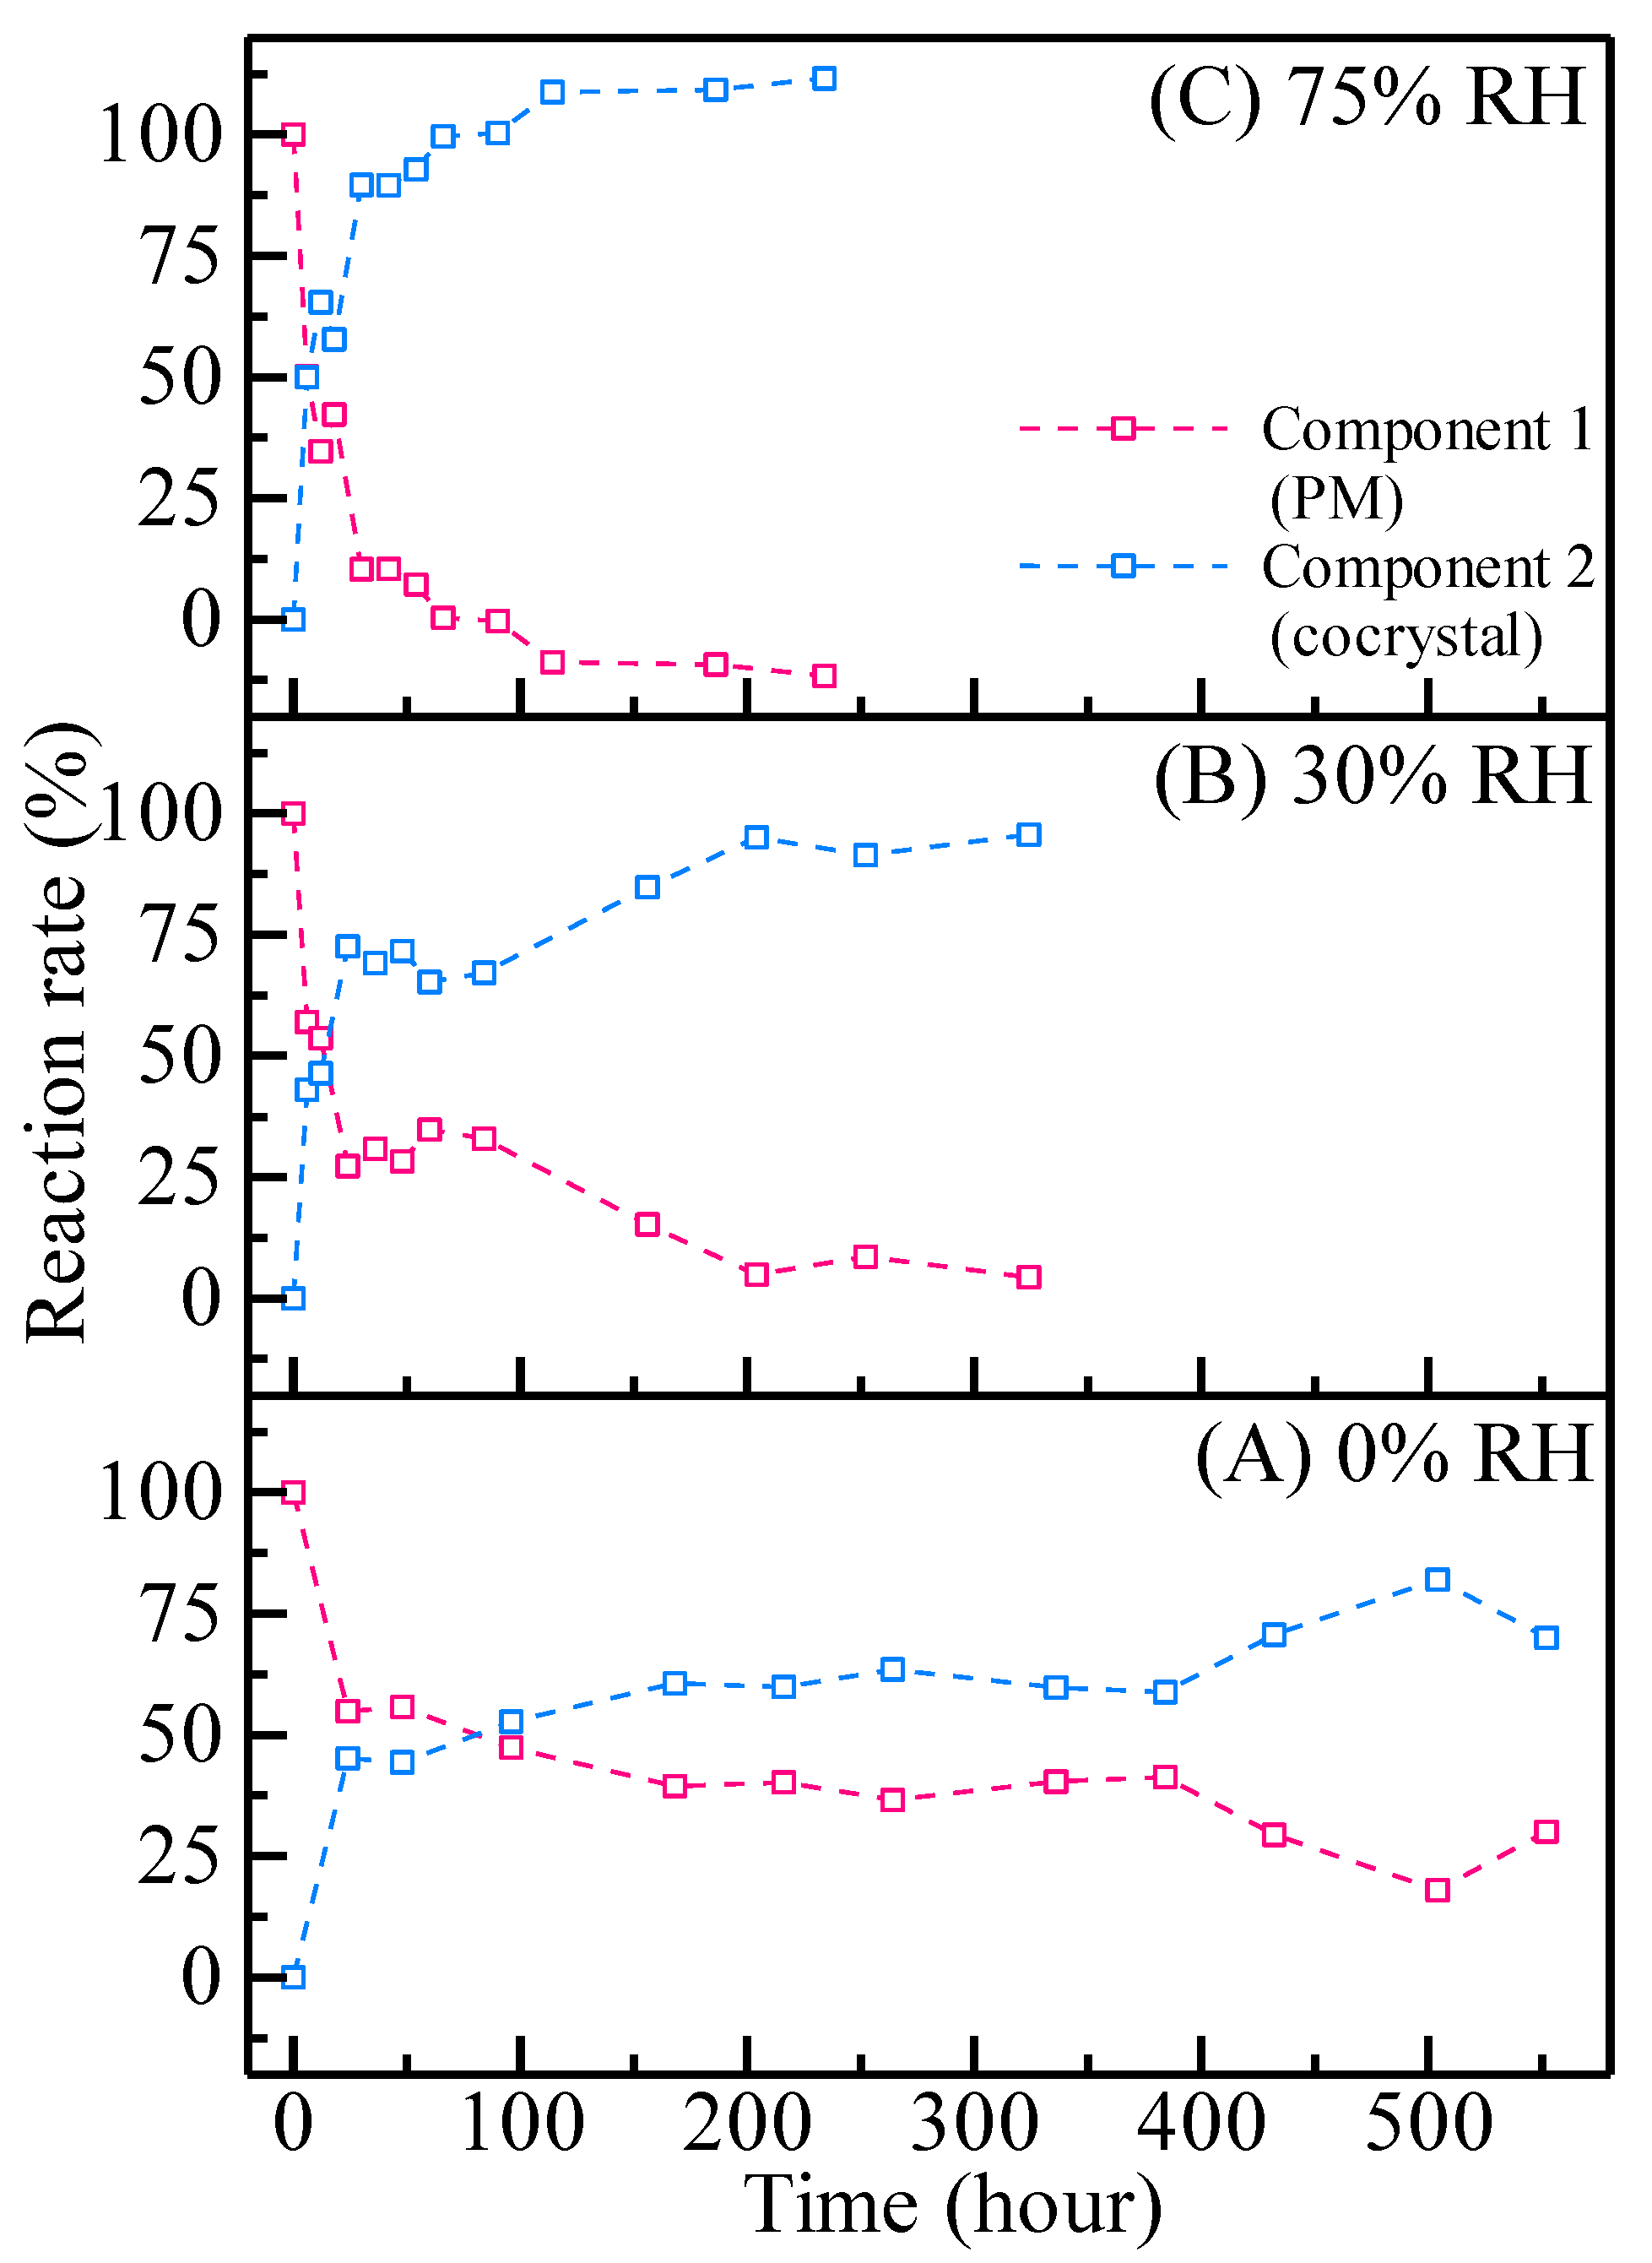
3.2. FT-IR Spectra and MCR-ALS Analysis

The FT-IR data were separated into two components by MCR-ALS as a function of time (Figure 3). The cumulative residuals in the 1832–2229 and 3275–3360 cm–1 regions were 1.33 × 10⁻⁹ and 3.64 × 10⁻⁹, respectively. Component 1 was assigned to PM due to the presence of peaks at 1910, 1935, 1959 and 2076 cm−1. Component 2 was assigned to the cocrystal based on peaks at 1949, 1979, 2000 and 2108 cm−1. The reaction rate of the intermolecular O-H···N hydrogen bond (Figure 4) and intermolecular N-H···O hydrogen bond (Figure 5) formations were obtained by MCR-ALS. The reaction rate of the intermolecular O-H···N hydrogen bonds was strongly dependent on humidity, with the time required to reach 100% completion being shorter under more humid conditions. The reaction rate of N-H···O hydrogen bond formation also depended on humidity. While the reaction proceeded to 100% completion at 75% RH, at 30% RH the reaction rate began to stagnate above 65% completion, reaching only 95% after 324 h. The reaction rate at 0% RH began to stagnate at 63%, reaching only 82% completion after 552 h.
In the IBF/NA cocrystal, (R)-IBF and (S)-IBF were arranged with an NA dimer between them, as shown in Figure 1C. The cocrystallisation process involves three molecular interactions. An O-H···N hydrogen bond is formed between the hydroxyl group of IBF and the pyridine ring of the first NA molecule. Then, an N-H···O hydrogen bond is formed between the amide of the second NA molecule and the carbonyl group of IBF. In the third interaction, N-H···O hydrogen bonds are formed by the NA dimer. The crystal growth rate of the (RS)-IBF/NA cocrystal is reportedly higher than that of the (S)-IBF/NA cocrystal. This suggests that the interaction between (S)-IBF and NA requires greater energy than that between (R)-IBF and NA [22]. During the formation of O-H···N hydrogen bonds, the coupling of (R)-IBF or (S)-IBF to NA proceeded to completion under all humidity conditions. However, it is likely that water vapour catalyses the transformation of (S)-IBF to NA, because this reaction took longer to complete at 0% RH.
Eight N-H···O hydrogen bonds originating from NA dimers, and four N-H···O hydrogen bonds between NA and IBF, were present in one unit cell. The formation of NA dimers is the first step in cocrystal formation. In the next step, a hydrogen bond is formed between NA and IBF. The formation of N-H···O hydrogen bonds seems to stop at around 66% completion, because the formation of hydrogen bonds between NA and IBF did not proceed under low humidity conditions. The absence of water vapour increased the stagnation time of the reaction, suggesting that the approach of IBF to NA requires a water molecule.

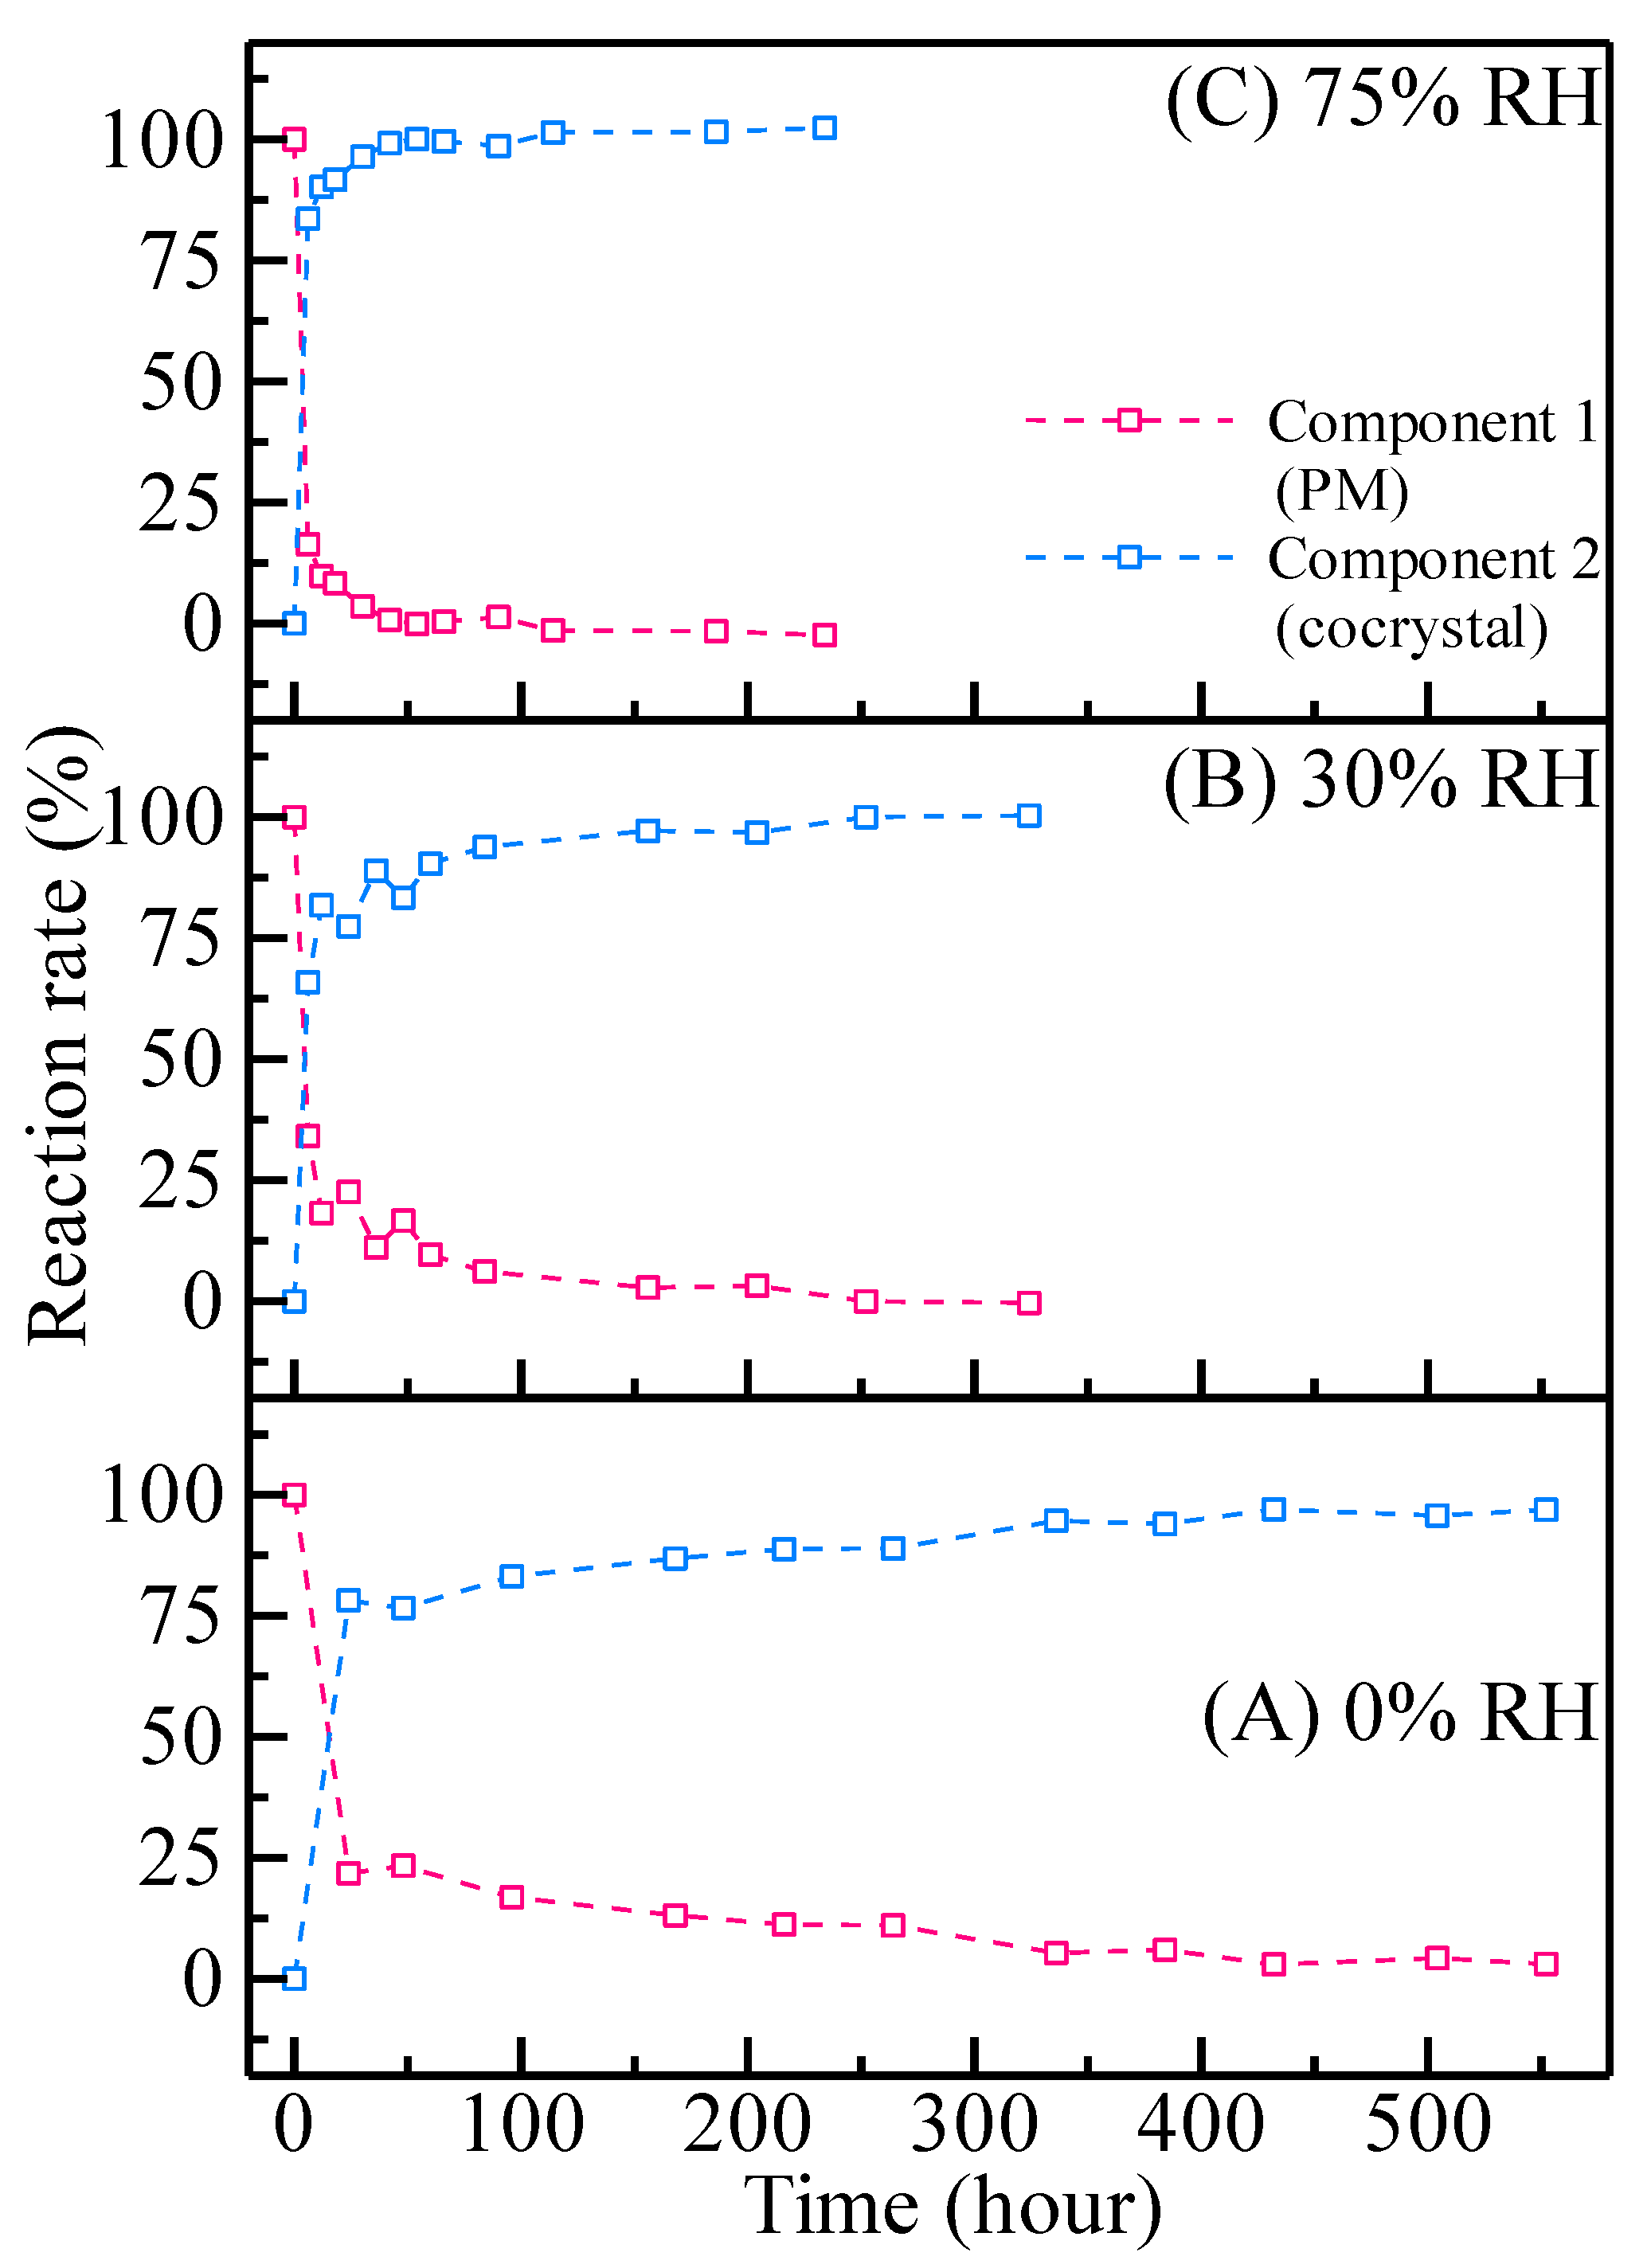
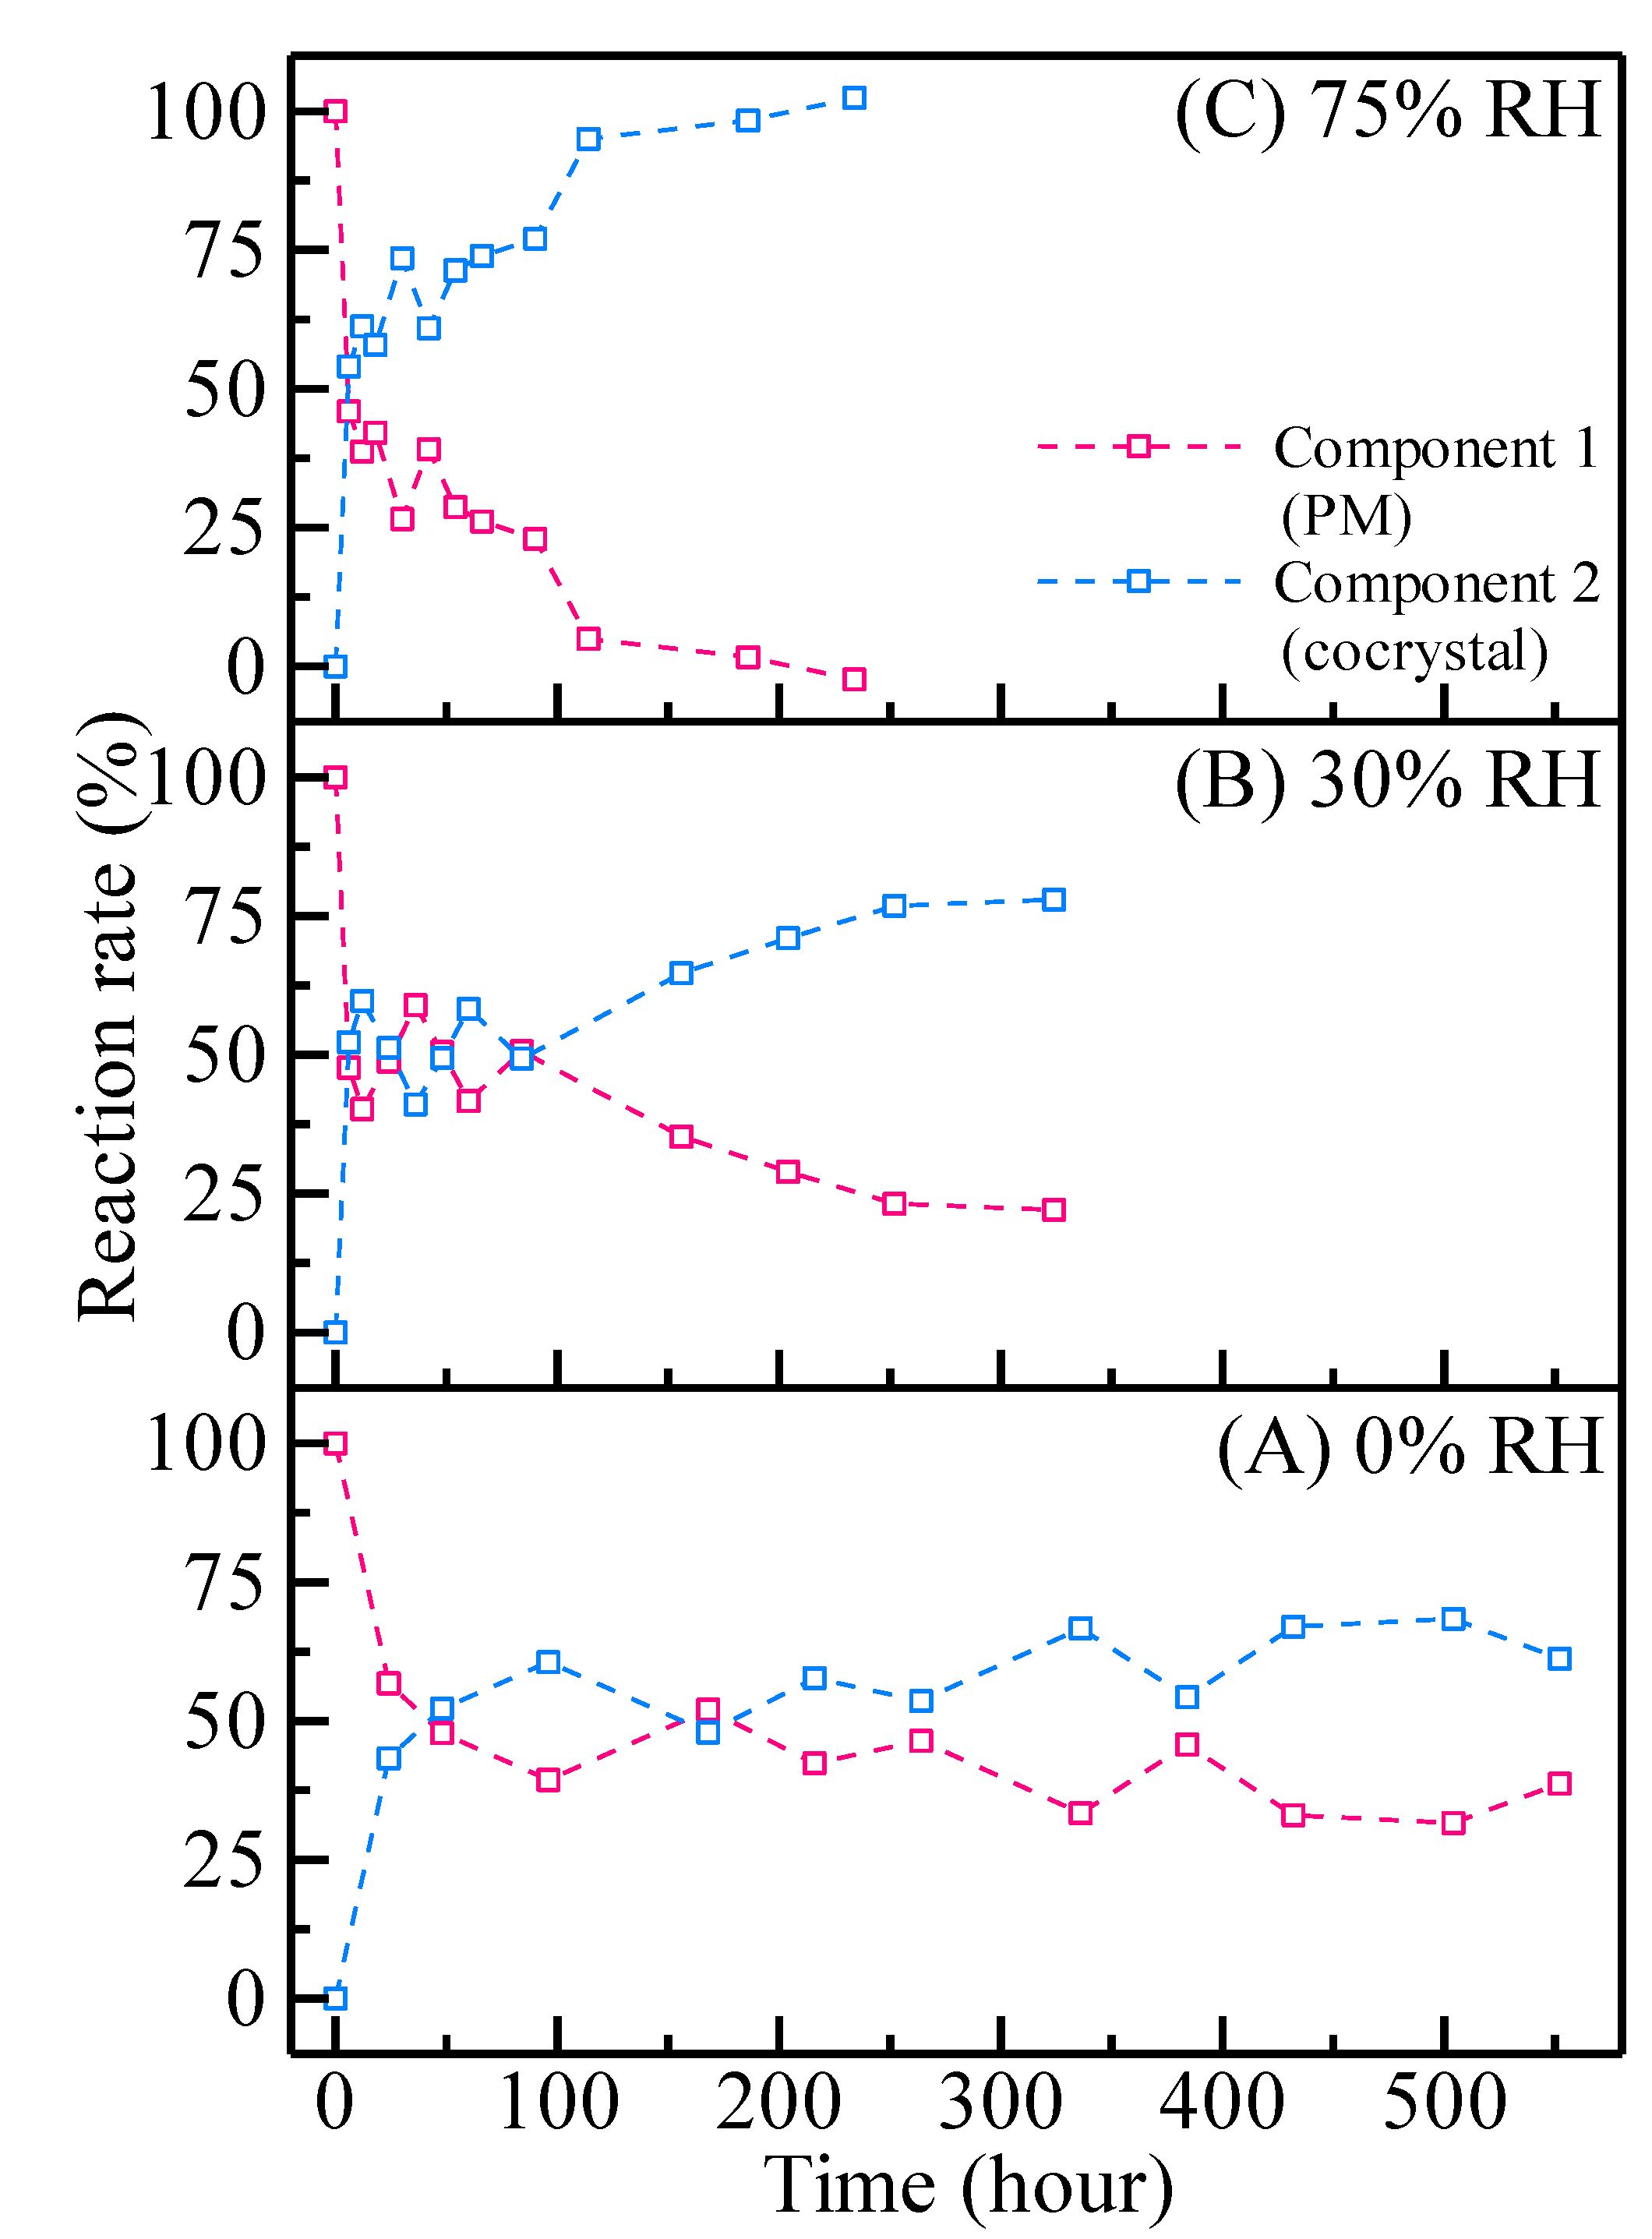
3.3. THz Spectra and MCR-ALS Analysis

THz spectra were deconvoluted into two components by MCR-ALS as a function of reaction time (Figure 6). The cumulative residual value obtained in this analysis was 1.21 × 10⁻⁸. Component 1 was assigned to PM due to the presence of peaks at 1.06, 2.92, 3.63 and 5.59 THz, which are unique to IBF or NA. Component 2 was assigned to cocrystal due to characteristic peaks at 2.67, 3.81, 4.41 and 5.24 THz. Under all humidity conditions, about half of the reactions proceeded until the first sampling point after the start of storage (Figure 7). However, after 50% completion, the reaction rate increased with increasing humidity. It is likely that enantiomeric differences affect the reaction rate of racemic IBF with NA. Thus, the following reaction process can be proposed. (R)-IBF, which seems to interact more strongly with NA, forms the initial (R)-IBF/NA cocrystal. A racemic reaction then occurs, in which (S)-IBF, facilitated by the presence of a water molecule, is moved to an appropriate position in the (RS)-IBF/NA cocrystal. These processes are consistent with the reaction timelines determined from the FT-IR and THz measurements.
Ervasti et al. [19] reported a complete cocrystal transition in the solid phase. The PM of theophylline anhydride and NA was transformed to cocrystal under 50 °C and 75% RH conditions, with a partial transition under the 50 °C and < 5% RH conditions, but it was not transformed under the 20 °C and < 5% RH conditions. This result indicated that the cocrystal formation of theophylline anhydride and NA was accelerated at high temperatures by the presence of water vapour as a catalyst. Theophylline had a monohydrate form as a pseudo-polymorphism; its crystalline character may have played an important role in cocrystal formation in the present study. However, no studies have reported a hydrate form of crystalline IBF polymorphism, although the cocrystal formation of the material was also affected by the presence of water vapour. Thus, the presence of water vapour is necessary for the cocrystal formation, even among compounds that cannot include water molecules in the crystal lattice. These findings indicate that water vapour is required to form a cocrystal, as a catalyst of the reaction, even if there is no room for a water molecule in the cocrystal lattice.

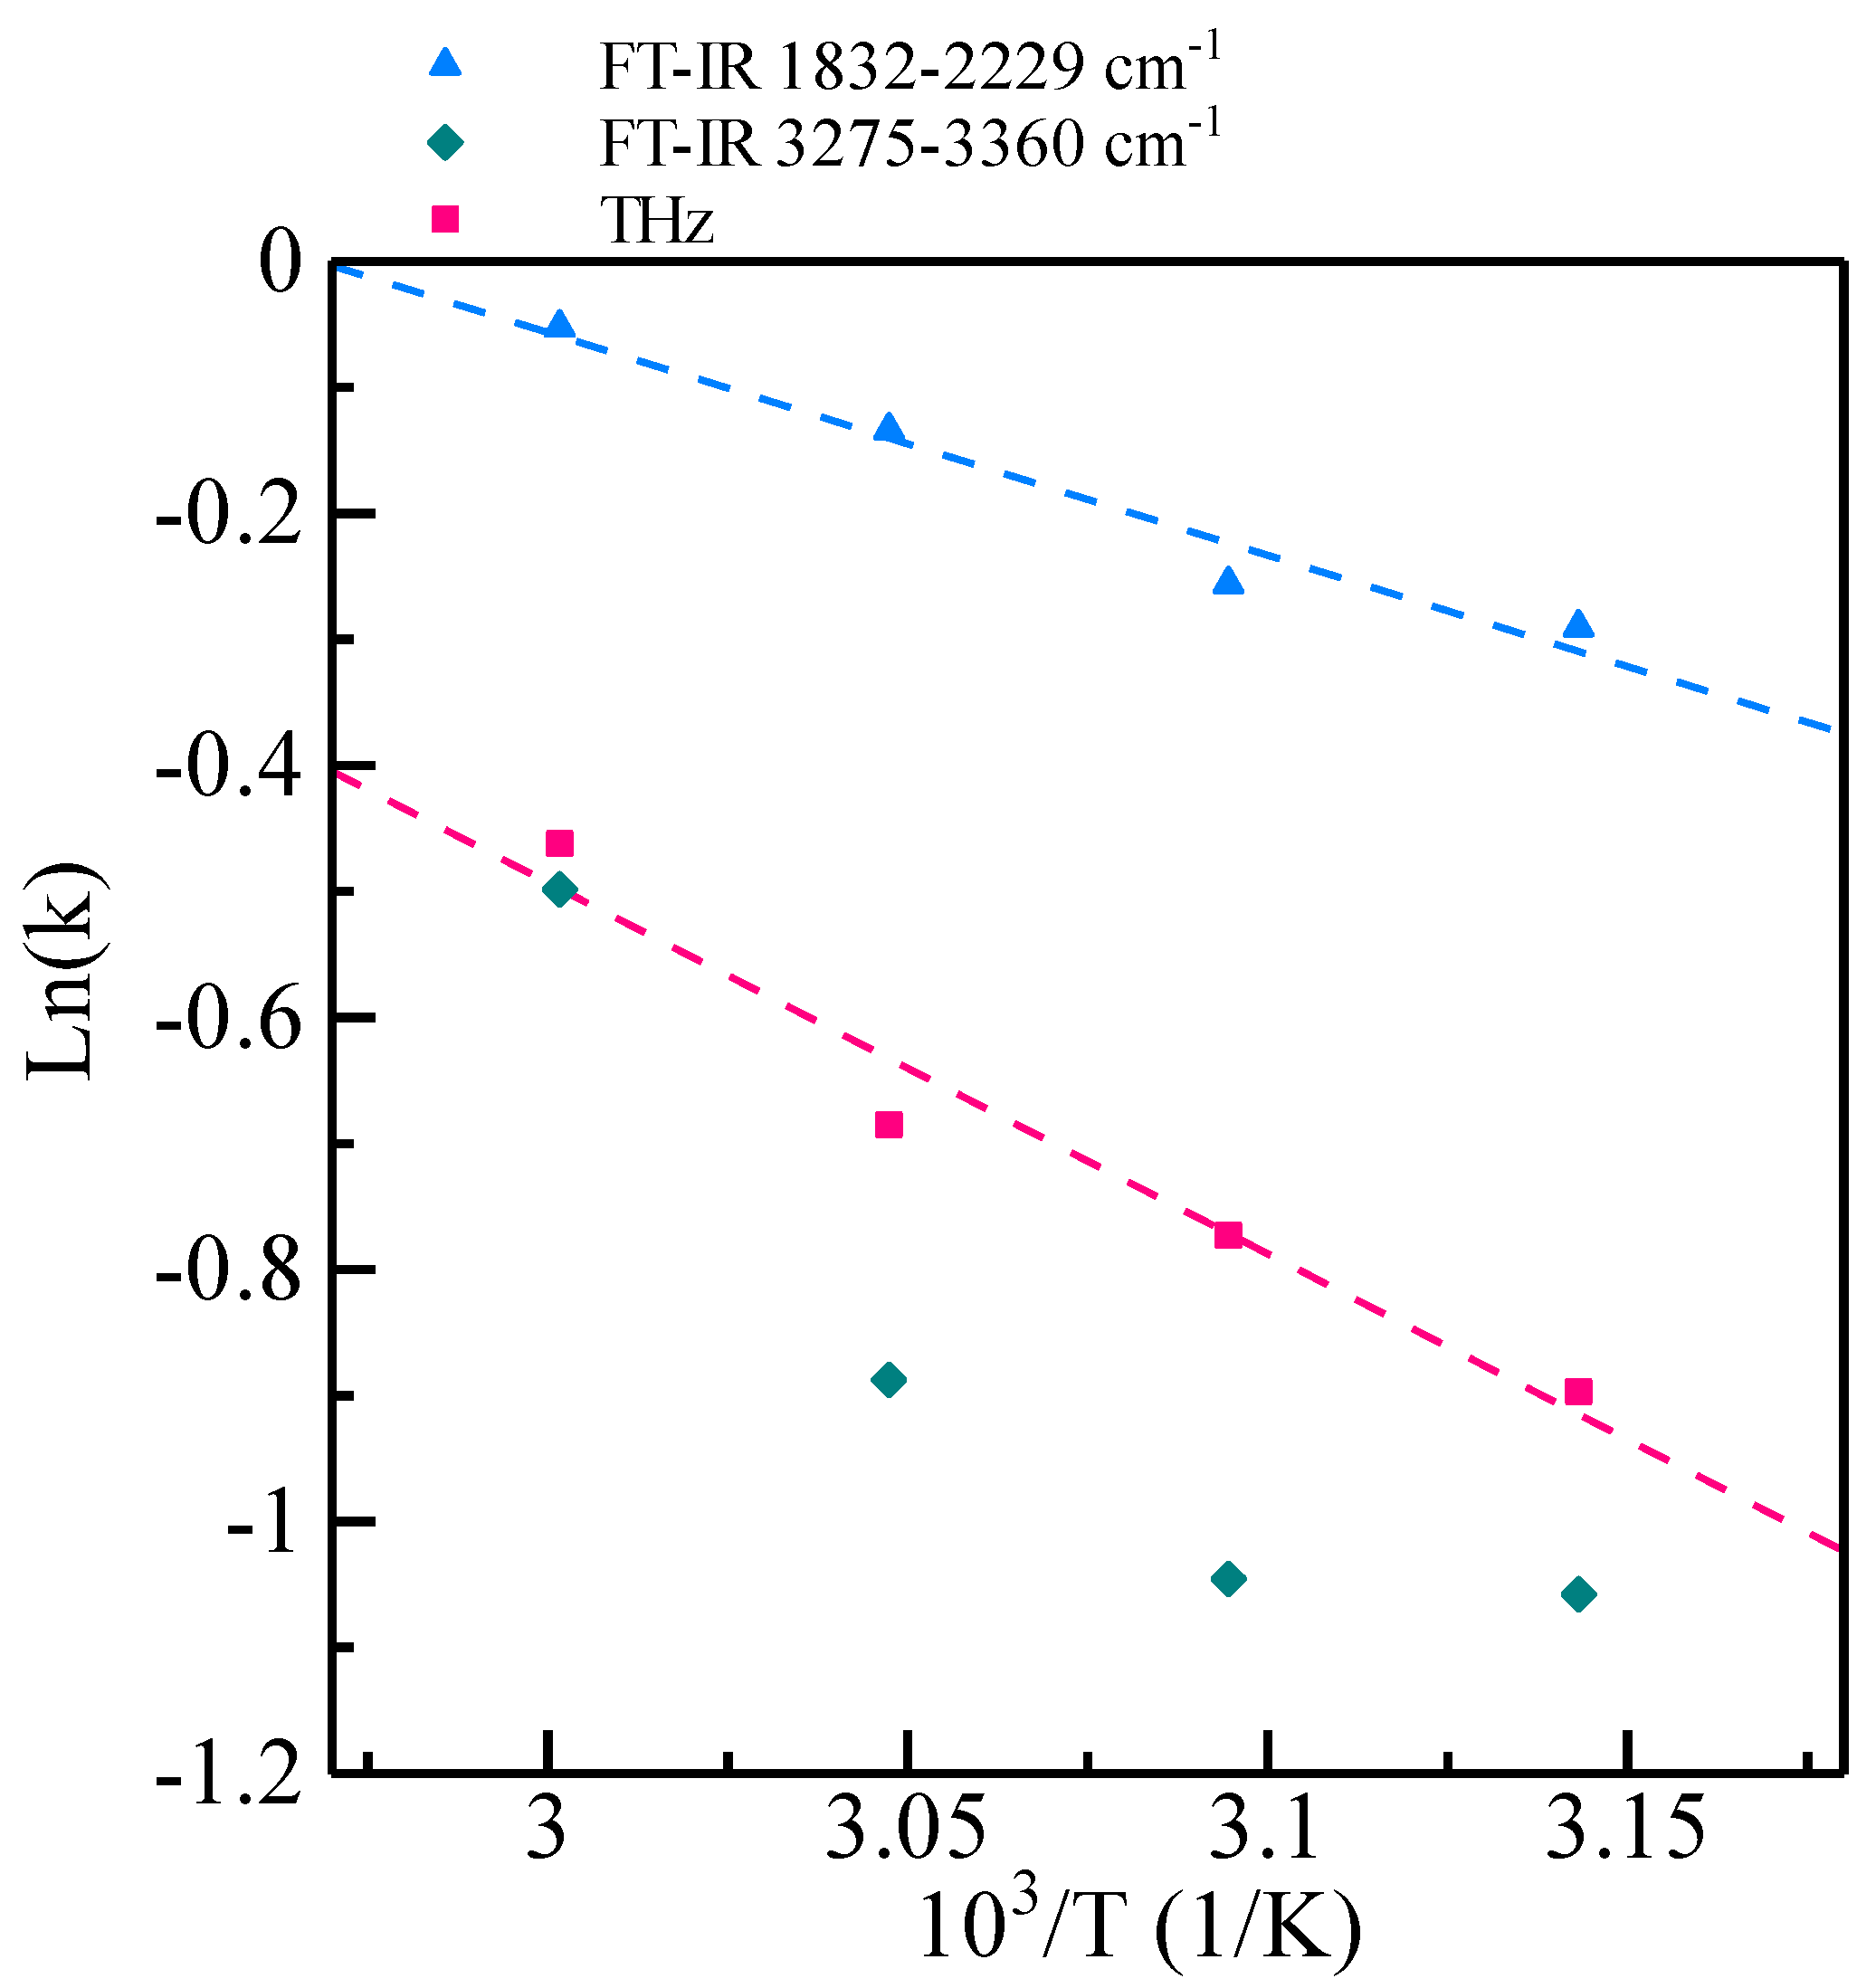
3.4. Contributions of Thermal Energy

Tablets stored in an atmosphere of 51.12 ± 3.5 g/m3 of water vapour for 72 h at four different temperatures were analysed by FT-IR and THz spectroscopy. FT-IR spectra acquired over two regions (1832–2229 and 3275–3360 cm−1) and THz spectra were fed into the MCR-ALS algorithm. An Arrhenius plot based on the reaction rates is shown in Figure 8. The correlation coefficient and activation energy obtained from FT-IR spectra between 1832 and 2229 cm−1 were 0.9583 and 14.70 kJ/mol, while those obtained from THz spectra were 0.9567 and 24.50 kJ/mol, respectively. The FT-IR spectra collected from the 3275–3360 cm−1 range did not show a good correlation, with a coefficient of only 0.8138. The formation of intermolecular O-H···N hydrogen bonds and the crystal lattice was found to be thermally energy-dominated in the presence of water molecules. In a previous report, 65 °C was identified as the optimal temperature for preparing IBF/NA cocrystals [25]. Thus, cocrystal formation could be accelerated by applying additional thermal energy to the PM up to 65 °C.

4. Conclusions

Cocrystals of IBF and NA were prepared using a solid-state reaction method. The cocrystal formation process was analysed by FT-IR and THz spectroscopy, and data were fed into an MCR-ALS algorithm. Cocrystals were formed through a two-step reaction; the first step was dependent on thermal energy and the second was controlled by the presence of water vapour. Furthermore, our results showed that water molecules significantly lowered the activation energy required for cocrystal formation. Since THz spectra can provide information about the crystal lattice in pharmaceutical materials, it may be a useful PAT. We also demonstrate that MCR-ALS is a powerful tool for breaking down complex datasets into more manageable ensembles.

Author Contributions

Conceptualisation, S.I. and T.S.; formal analysis, S.I. and Y.H.; investigation, S.I. and T.S.; writing of the original draft, S.I. and T.S.; visualisation, S.I. and T.S.; supervision, M.O. and T.S.; project administration, T.S. All authors have read and agreed to the published version of the manuscript.

Funding

This research received no external funding.

Conflicts of Interest

The funders had no role in the design of the study; in the collection, analyses, or interpretation of data; in the writing of the manuscript, or in the decision to publish the results.

References

  1. Amidon, G.L.; Lennernäs, H.; Shah, V.P.; Crison, J.R. A Theoretical Basis for a Biopharmaceutic Drug Classification: The Correlation of in Vitro Drug Product Dissolution and in Vivo Bioavailability. Pharm. Res. 1995, 12, 413–420. [Google Scholar] [CrossRef] [Green Version]
  2. Qiao, N.; Li, M.; Schlindwein, W.; Malek, N.; Davies, A.; Trappitt, G. Pharmaceutical cocrystals: An overview. Int. J. Pharm. 2011, 419, 1–11. [Google Scholar] [CrossRef]
  3. Food and Drug Administratio Regulatory Classification of Pharmaceutical Co-Crystals Guidance for Industry. Available online: https://www.fda.gov/media/81824/download (accessed on 28 August 2020).
  4. European Medicines Agency Reflection Paper on the Use of Cocrystals of Active Substances in Medicinal Products. Available online: https://www.ema.europa.eu/en/documents/scientific-guideline/reflection-paper-use-cocrystals-active-substances-medicinal-products_en.pdf (accessed on 28 August 2020).
  5. Kavanagh, O.N.; Croker, D.M.; Walker, G.M.; Zaworotko, M.J. Pharmaceutical cocrystals: From serendipity to design to application. Drug Discov. Today 2019, 24, 796–804. [Google Scholar] [CrossRef] [PubMed] [Green Version]
  6. Ueto, T.; Takata, N.; Muroyama, N.; Nedu, A.; Sasaki, A.; Tanida, S.; Terada, K. Polymorphs and a Hydrate of Furosemide–Nicotinamide 1:1 Cocrystal. Cryst. Growth Des. 2012, 12, 485–494. [Google Scholar] [CrossRef]
  7. Takata, N.; Shiraki, K.; Takano, R.; Hayashi, Y.; Terada, K. Cocrystal Screening of Stanolone and Mestanolone Using Slurry Crystallization. Cryst. Growth Des. 2008, 8, 3032–3037. [Google Scholar] [CrossRef]
  8. Alhalaweh, A.; Roy, L.; Rodríguez-Hornedo, N.; Velaga, S.P. pH-Dependent Solubility of Indomethacin–Saccharin and Carbamazepine–Saccharin Cocrystals in Aqueous Media. Mol. Pharm. 2012, 9, 2605–2612. [Google Scholar] [CrossRef] [PubMed]
  9. Friščić, T.; Trask, A.V.; Jones, W.; Motherwell, W.D.S. Screening for Inclusion Compounds and Systematic Construction of Three-Component Solids by Liquid-Assisted Grinding. Angew. Chem. 2006, 118, 7708–7712. [Google Scholar] [CrossRef]
  10. Chun, N.-H.; Wang, I.-C.; Lee, M.-J.; Jung, Y.-T.; Lee, S.; Kim, W.-S.; Choi, G.J. Characteristics of indomethacin–saccharin (IMC–SAC) co-crystals prepared by an anti-solvent crystallization process. Eur. J. Pharm. Biopharm. 2013, 85, 854–861. [Google Scholar] [CrossRef]
  11. Wichianphong, N.; Charoenchaitrakool, M. Statistical optimization for production of mefenamic acid–nicotinamide cocrystals using gas anti-solvent (GAS) process. J. Ind. Eng. Chem. 2018, 62, 375–382. [Google Scholar] [CrossRef]
  12. Nishimaru, M.; Kudo, S.; Takiyama, H. Cocrystal production method reducing deposition risk of undesired single component crystals in anti-solvent cocrystallization. J. Ind. Eng. Chem. 2016, 36, 40–43. [Google Scholar] [CrossRef]
  13. Douroumis, D.; Ross, S.A.; Nokhodchi, A. Advanced methodologies for cocrystal synthesis. Adv. Drug Deliv. Rev. 2017, 117, 178–195. [Google Scholar] [CrossRef] [PubMed]
  14. Müllers, K.C.; Paisana, M.; Wahl, M.A. Simultaneous Formation and Micronization of Pharmaceutical Cocrystals by Rapid Expansion of Supercritical Solutions (RESS). Pharm. Res. 2015, 32, 702–713. [Google Scholar] [CrossRef] [PubMed]
  15. Padrela, L.; Rodrigues, M.A.; Tiago, J.; Velaga, S.P.; Matos, H.A.; de Azevedo, E.G. Insight into the Mechanisms of Cocrystallization of Pharmaceuticals in Supercritical Solvents. Cryst. Growth Des. 2015, 15, 3175–3181. [Google Scholar] [CrossRef]
  16. Alhalaweh, A.; Kaialy, W.; Buckton, G.; Gill, H.; Nokhodchi, A.; Velaga, S.P. Theophylline Cocrystals Prepared by Spray Drying: Physicochemical Properties and Aerosolization Performance. AAPS PharmSciTech 2013, 14, 265–276. [Google Scholar] [CrossRef] [Green Version]
  17. Jayasankar, A.; Somwangthanaroj, A.; Shao, Z.J.; Rodríguez-Hornedo, N. Cocrystal Formation during Cogrinding and Storage is Mediated by Amorphous Phase. Pharm. Res. 2006, 23, 2381–2392. [Google Scholar] [CrossRef]
  18. Chieng, N.; Hubert, M.; Saville, D.; Rades, T.; Aaltonen, J. Formation Kinetics and Stability of Carbamazepine−Nicotinamide Cocrystals Prepared by Mechanical Activation. Cryst. Growth Des. 2009, 9, 2377–2386. [Google Scholar] [CrossRef]
  19. Ervasti, T.; Aaltonen, J.; Ketolainen, J. Theophylline–nicotinamide cocrystal formation in physical mixture during storage. Int. J. Pharm. 2015, 486, 121–130. [Google Scholar] [CrossRef]
  20. Fischer, F.; Heidrich, A.; Greiser, S.; Benemann, S.; Rademann, K.; Emmerling, F. Polymorphism of Mechanochemically Synthesized Cocrystals: A Case Study. Cryst. Growth Des. 2016, 16, 1701–1707. [Google Scholar] [CrossRef]
  21. Hu, Y.; Gniado, K.; Erxleben, A.; McArdle, P. Mechanochemical Reaction of Sulfathiazole with Carboxylic Acids: Formation of a Cocrystal, a Salt, and Coamorphous Solids. Cryst. Growth Des. 2014, 14, 803–813. [Google Scholar] [CrossRef]
  22. Berry, D.J.; Seaton, C.C.; Clegg, W.; Harrington, R.W.; Coles, S.J.; Horton, P.N.; Hursthouse, M.B.; Storey, R.; Jones, W.; Friščić, T.; et al. Applying Hot-Stage Microscopy to Co-Crystal Screening: A Study of Nicotinamide with Seven Active Pharmaceutical Ingredients. Cryst. Growth Des. 2008, 8, 1697–1712. [Google Scholar] [CrossRef]
  23. Chow, S.F.; Chen, M.; Shi, L.; Chow, A.H.L.; Sun, C.C. Simultaneously Improving the Mechanical Properties, Dissolution Performance, and Hygroscopicity of Ibuprofen and Flurbiprofen by Cocrystallization with Nicotinamide. Pharm. Res. 2012, 29, 1854–1865. [Google Scholar] [CrossRef] [PubMed]
  24. Yuliandra, Y.; Zaini, E.; Syofyan, S.; Pratiwi, W.; Putri, L.N.; Pratiwi, Y.S.; Arifin, H. Cocrystal of Ibuprofen–Nicotinamide: Solid-State Characterization and In Vivo Analgesic Activity Evaluation. Sci. Pharm. 2018, 86, 23. [Google Scholar] [CrossRef] [PubMed] [Green Version]
  25. Ishihara, S.; Hattori, Y.; Otsuka, M. MCR-ALS analysis of IR spectroscopy and XRD for the investigation of ibuprofen-nicotinamide cocrystal formation. Spectrochim. Acta Part A Mol. Biomol. Spectrosc. 2019, 221, 117142. [Google Scholar] [CrossRef]
  26. Soares, F.L.F.; Carneiro, R.L. Green Synthesis of Ibuprofen–Nicotinamide Cocrystals and In-Line Evaluation by Raman Spectroscopy. Cryst. Growth Des. 2013, 13, 1510–1517. [Google Scholar] [CrossRef]
  27. Hattori, Y.; Sato, M.; Otsuka, M. Initial dissolution kinetics of cocrystal of carbamazepine with nicotinamide. J. Pharm. Pharmacol. 2015, 67, 1512–1518. [Google Scholar] [CrossRef] [PubMed]
  28. Kaneniwa, N.; Imagawa, K.; Otsuka, M. Effect of tabletting on the degree of crystallinity and on the dehydration and decomposition points of cephalexin crystalline powder. Chem. Pharm. Bull. 1985, 33, 802–809. [Google Scholar] [CrossRef] [PubMed]
  29. McMahon, L.E.; Timmins, P.; Williams, A.C.; York, P. Characterization of Dihydrates Prepared from Carbamazepine Polymorphs. J. Pharm. Sci. 1996, 85, 1064–1069. [Google Scholar] [CrossRef]
  30. Heinz, A.; Strachan, C.J.; Gordon, K.C.; Rades, T. Analysis of solid-state transformations of pharmaceutical compounds using vibrational spectroscopy. J. Pharm. Pharmacol. 2009, 61, 971–988. [Google Scholar] [CrossRef]
  31. Takeshima, R.; Hattori, Y.; Managaki, S.; Otsuka, M. Analysis of the dehydration process of caffeine using backscattering and transmission Raman spectroscopy. Int. J. Pharm. 2017, 530, 256–262. [Google Scholar] [CrossRef]
  32. Otsuka, M.; Nishizawa, J.-I.; Shibata, J.; Ito, M. Quantitative Evaluation of Mefenamic Acid Polymorphs by Terahertz-Chemometrics. J. Pharm. Sci. 2010, 99, 4048–4053. [Google Scholar] [CrossRef]
  33. Sasaki, T.; Sakamoto, T.; Otsuka, M. Detection of Impurities in Organic Crystals by High-Accuracy Terahertz Absorption Spectroscopy. Anal. Chem. 2018, 90, 1677–1682. [Google Scholar] [CrossRef] [PubMed]
  34. Wu, H.; Heilweil, E.; Hussain, A.; Khan, M. Process analytical technology (PAT): Effects of instrumental and compositional variables on terahertz spectral data quality to characterize pharmaceutical materials and tablets. Int. J. Pharm. 2007, 343, 148–158. [Google Scholar] [CrossRef] [PubMed]
  35. Blanco, M.; Alcalá, M.; González, J.M.; Torras, E. A process analytical technology approach based on near infrared spectroscopy: Tablet hardness, content uniformity, and dissolution test measurements of intact tablets. J. Pharm. Sci. 2006, 95, 2137–2144. [Google Scholar] [CrossRef] [PubMed]
  36. Benedetti, C.; Abatzoglou, N.; Simard, J.-S.; McDermott, L.; Léonard, G.; Cartilier, L. Cohesive, multicomponent, dense powder flow characterization by NIR. Int. J. Pharm. 2007, 336, 292–301. [Google Scholar] [CrossRef] [PubMed]
  37. De Beer, T.; Burggraeve, A.; Fonteyne, M.; Saerens, L.; Remon, J.P.; Vervaet, C. Near infrared and Raman spectroscopy for the in-process monitoring of pharmaceutical production processes. Int. J. Pharm. 2011, 417, 32–47. [Google Scholar] [CrossRef] [Green Version]
  38. Dohi, M.; Momose, W.; Yoshino, H.; Hara, Y.; Yamashita, K.; Hakomori, T.; Sato, S.; Terada, K. Application of terahertz pulse imaging as PAT tool for non-destructive evaluation of film-coated tablets under different manufacturing conditions. J. Pharm. Biomed. Anal. 2016, 119, 104–113. [Google Scholar] [CrossRef]
  39. Hattori, Y.; Otsuka, M. Modeling of feed-forward control using the partial least squares regression method in the tablet compression process. Int. J. Pharm. 2017, 524, 407–413. [Google Scholar] [CrossRef]
  40. Suto, K.; Sasaki, T.; Tanabe, T.; Saito, K.; Nishizawa, J.; Ito, M. GaP THz wave generator and THz spectrometer using Cr:Forsterite lasers. Rev. Sci. Instrum. 2005, 76, 123109. [Google Scholar] [CrossRef]
  41. Tauler, R.; Kowalski, B.; Fleming, S. Multivariate curve resolution applied to spectral data from multiple runs of an industrial process. Anal. Chem. 1993, 65, 2040–2047. [Google Scholar] [CrossRef]
  42. Garrido, M.; Rius, F.X.; Larrechi, M.S. Multivariate curve resolution–alternating least squares (MCR-ALS) applied to spectroscopic data from monitoring chemical reactions processes. Anal. Bioanal. Chem. 2008, 390, 2059–2066. [Google Scholar] [CrossRef]
  43. Otsuka, Y.; Ito, A.; Takeuchi, M.; Tanaka, H. Dry Mechanochemical Synthesis of Caffeine/Oxalic Acid Cocrystals and Their Evaluation by Powder X-ray Diffraction and Chemometrics. J. Pharm. Sci. 2017, 106, 3458–3464. [Google Scholar] [CrossRef] [PubMed]
  44. Tanaka, R.; Duggirala, N.K.; Hattori, Y.; Otsuka, M.; Suryanarayanan, R. Formation of Indomethacin–Saccharin Cocrystals during Wet Granulation: Role of Polymeric Excipients. Mol. Pharm. 2020, 17, 274–283. [Google Scholar] [CrossRef] [PubMed]
Figure 1. Chemical structures of (A) ibuprofen (IBF) and (B) nicotinamide (NA). (C) Packing structure of an IBF/NA cocrystal (SODDIZ).
Crystals 10 00760 g001aCrystals 10 00760 g001b
Figure 2. Pre-processed (A) Fourier-transform infrared spectroscopy (FT-IR) and (B) terahertz (THz) spectra at 75% relative humidity (RH). Black and red lines indicate the physical mixture (PM) spectrum and the spectrum of the last sampling point, respectively.
Crystals 10 00760 g002
Figure 3. FT-IR spectra of the PM (red, component 1) and cocrystal (blue, component 2) obtained by multivariate curve resolution with alternating least squares (MCR-ALS) analysis. The spectra were deconvoluted into two components.
Crystals 10 00760 g003
Figure 4. Reaction rate in the 1832–2229 cm–1 region of the FT-IR spectrum. Red and blue lines represent the PM (component 1) and cocrystal (component 2), respectively. (AC) are results obtained under 0%, 30% and 75% RH, respectively.
Crystals 10 00760 g004
Figure 5. Reaction rate in the 3275–3360 cm–1 region of the FT-IR spectrum. Red and blue lines represent the PM (component 1) and cocrystal (component 2), respectively. (AC) are results obtained under 0%, 30% and 75% RH, respectively.
Crystals 10 00760 g005
Figure 6. Calculated THz spectra of the PM (red, component 1) and cocrystal (blue, component 2) obtained by MCR-ALS analysis. The spectra were deconvoluted into two components.
Crystals 10 00760 g006
Figure 7. Reaction rates calculated based on THz spectra. Red and blue lines represent the PM (component 1) and cocrystal (component 2), respectively. (AC) represent data collected under 0%, 30% and 75% RH, respectively.
Crystals 10 00760 g007
Figure 8. Arrhenius plots of samples stored in a 51.12 ± 3.5 g/m3 water vapour atmosphere. Blue triangles and green diamonds represent FT-IR data, and pink squares represent THz data. The value of k corresponds to the reaction rate calculated by MCR-ALS analysis.
Crystals 10 00760 g008
Table 1. Sampling time (h) by relative humidity (RH).
Sample Number0% RH30% RH75% RH
1000
22466
3481212
4962418
51683630
62164842
72646054
83368466
938415690
10432204114
11504252186
12552324234

