Ultrasonic Pulse Velocity—Compressive Strength Relationship for Portland Cement Mortars Cured at Different Conditions


1
Department of Cement Chemical Testing, LOEMCO. Universidad Politécnica de Madrid (UPM), Avda. Eric Kandel 0001, LOEMCO Building, South Tecnológical Area “Acedinos”, 28906 GETAFE (Madrid), Spain
2
Mine and Energy Engineering School, Technical University of Madrid (UPM), C/ Ríos Rosas, 21, 28003 Madrid, Spain
3
Civil Engineering School, Technical University of Madrid (UPM), C/ Profesor Aranguren, 3, Ciudad Universitaria, 28040 Madrid, Spain
4
Spanish Institute of Cement and its Applications (IECA), C/ José Abascal, 53, 28003 Madrid, Spain
*
Author to whom correspondence should be addressed.
Crystals 2020, 10(2), 133; https://doi.org/10.3390/cryst10020133
Submission received: 24 January 2020
/
Revised: 15 February 2020
/
Accepted: 18 February 2020
/
Published: 22 February 2020
(This article belongs to the Special Issue A 10 Years Journey: Chemical, Physical, and Biological Properties and Applications of Crystals)
Abstract
:The purpose of this paper is to establish some correlations between the main technical parameter with regard to the cement-based materials technology, the 28-day compressive strength, and ultrasonic pulse velocity of standard mortar samples cured at three different conditions—(i) under water at 22 °C; (ii) climatic chamber at 95% RH and 22 °C; (iii) lab ambient, 50% RH, and 22 °C—and after five curing periods of 1, 2, 7, 14, and 28 days. Good correlations for each curing conditions were obtained. All the positive linear relationships showed better R2 than exponential ones. These findings may promote the use of ultrasonic pulse velocity for the estimation of the 28-day compressive strength of standard Portland cement samples within the factory internal quality control.
1. Introduction
Cement-based materials have been used for different structural and non-structural purposes in building and civil work applications for ages [1]. Particularly, the concrete sector uses Portland cements as the main component and the applications of different types of Portland cements are tightly dependent on their chemical and physical characteristics [2]. Also, it is well-known that cement-based materials, after hydration, develop complex microstructural changes leading to a peculiar capillary pore network and transport properties for each curing condition [3]. Given that an important durability and mechanical indicator for cement-based materials is the capillary pore network, where ultrasonic non-destructive techniques might be used to characterize these materials. Ultrasonic pulse velocity (UPV) is a non-destructive test method (NDT) that may be easily applied in both laboratory and field conditions. It is increasingly being used to estimate some microstructural [4,5,6,7,8] and mechanical [9,10] properties of cement-based materials. Non-destructive testing using ultrasound (NDT-UPV) has been also used in monitoring of setting and strength development of ultra-high-performance concrete [11], monitoring of mortar and concrete hardening [12,13], and detection of rebars in concrete [14,15].
In addition, NDT-UPV has been successfully used investigating the corrosion of mortar and concrete reinforcement [16,17], and in the study of durability of these construction materials [18,19,20,21,22,23,24]. For instance, non-destructive ultrasonic test methods have been used to monitor microcracking in concrete [24,25]. Ouarabi et al. used ultrasonic measurements in self-healing systems to study the kinetics of the recovery thanks to the healing agent performance [21]. They validated the capacity of the ultrasonic techniques to assess microstructural changes in concretes.
In general, the sensitivity in the case of little cracking damage remains poor, and then, the results cannot provide a quantitative measure of the damage [26,27]. Porosity of construction materials has been reported previously [28] and Hernández et al. [7,8] utilized UPV test to determine the porosity of cement mortars. Lafhaj et al. [4] found some correlations between permeability, porosity and UPV of cement mortars.
Some parameters have a significant influence on the ultrasonic pulse velocity (UPV) results in cement-based materials. In general, the denser material, the faster ultrasonic pulse velocity (UPV). Therefore, all the factors that accelerate the Portland cement hydration such as C3A content, curing temperature and cement fineness, among others, will enhance the increase of the ultrasonic pulse velocity (UPV) [29,30]. In addition, Mohammed and Mahmood [31] stated that ultrasonic pulse velocity (UPV) through cement-based materials is not only affected by the nature of the aggregate, but also by the maximum aggregate size, cement–paste–aggregate interfaces, among other aggregate characteristics [32,33]. Segura el al. [34] did not find any direct effect on the ultrasonic pulse velocity using cements with different amounts fly ash (cements type: CEM I and CEM II/A-V, CEM II/B-M (V, L), and CEM IV/B (V)). Also, Trtnik et al. [35] did not found any significant effect of the cement type on the ultrasonic pulse velocity–strength relationship. This conclusion was extracted by using only cements without any addition; therefore, they could not find clear differences.
Most of the empirical relationships between both parameters followed an experimental model shown in Equation (1),
where a and b are experimental parameters obtained by the least squares methods, V is the ultrasonic pulse velocity, and R the 28-day compressive strength of the concrete.
R = a × e b × V
Trtnik et al. [35] collected some attempts to employ ultrasonic pulse velocity (V) as an indirect measure of the 28-day compressive strength of concretes (R). They attributed the low determination coefficient to the fact of disregarding the composition of the concrete in the studies. Also, they proposed a numerical model based on the artificial neuronal network approach [36]. Nevertheless, linear relationships also have been proposed with good correlations [37,38].
Many studies in the literature point out that ultrasonic pulse velocity testing has a large range of applications to assess different properties of cement-based materials. Although very limited studies on the use of this technique to assess the effect of the curing conditions on the 28-day compressive strength of cement-based materials have been reported in the literature [29,30], assessing 28-day compressive strength of Portland cement mortars by using ultrasonic pulse velocity (UPV) has not been previously studied.
The curing conditions of the mortar specimens play a dominant role in both the hydration of the cement paste and the compressive strength increase with time of the samples [3,39]. However, there is limited literature on the effect of curing conditions on UPV through mortar made with different cement types. In addition, the UPV and the 28-day compressive strength are correlated in function of the three curing conditions. A parametric approach has been adopted in this work, and then several equations were obtained. Finally, they are used to estimate the 28-day compressive strength of standard mortar specimens. Furthermore, the indirect 28-day compressive strength in the mortar specimens is measured by means of using ultrasonic testing.
The scope of this paper is providing a thorough non-destructive ultrasonic characterization of a set of standardized Portland cement mortar samples, to relate their microstructural changes to the progression and extent of the hydration process and 28-day compressive strength gain in three different curing conditions. Four cement types according to the European standard EN 197-1:2011 [40] were used to make the standardized Portland mortar samples.
2. Materials and Methods
2.1. Materials
The studies were carried out in standardized mortars by utilizing four Portland cement types and three different curing conditions. Then, this investigation was performed in standardized mortars made with four commercial cements, with and without fly ash, according to EN 197-1 [41]. Two of them do not have any addition—cements CEM I 52.5 R and CEM I 42.5 R—and the other two were Portland-composite cements with variable contents of siliceous coal fly ash (CFA), namely, CEM II/B-V 32.5 R and CEM II/A-V 42.5 R. All of them were provide by La Robla cement Plant in León, Spain. Fly ash in these cements is produced by La Robla- Naturgy (619 MW) coal-fired power plant. The CFA content is 30% for the first one and 17% for the second one. Their chemical composition is given in Table 1.
Mortar prismatic bars (40 mm × 40 mm × 160 mm) were made following the European standard EN 196-1:2016 [43]. Then, the water/cement and cement/sand ratios were 1/2 and 1/3, respectively. Subsequently, after 24 h, the mortar samples were demolded from the casts. Later, they were cured.
2.2. Curing Conditions
Three different conditions were selected to perform the curing of the mortars to assess their influence on the results:
- (i)
- kept under a saturated limewater solution for twenty-eight days at a temperature of 22 ± 1 °C to establish a reference condition,
- (ii)
- under lab conditions for twenty-eight days at 22 ± 2 °C and 50% RH, and
- (iii)
- some mortar samples were kept in a climatic chamber during twenty-eight days at 22 ± 1 °C and 95% RH.
2.3. Mechanical Testing
Compressive strength and flexural strength of the mortar prims were determined at twenty-eight days. Further details on the compressive strength technique are given in [43].
2.4. Non-Destructive Ultrasonic Pulse Velocity
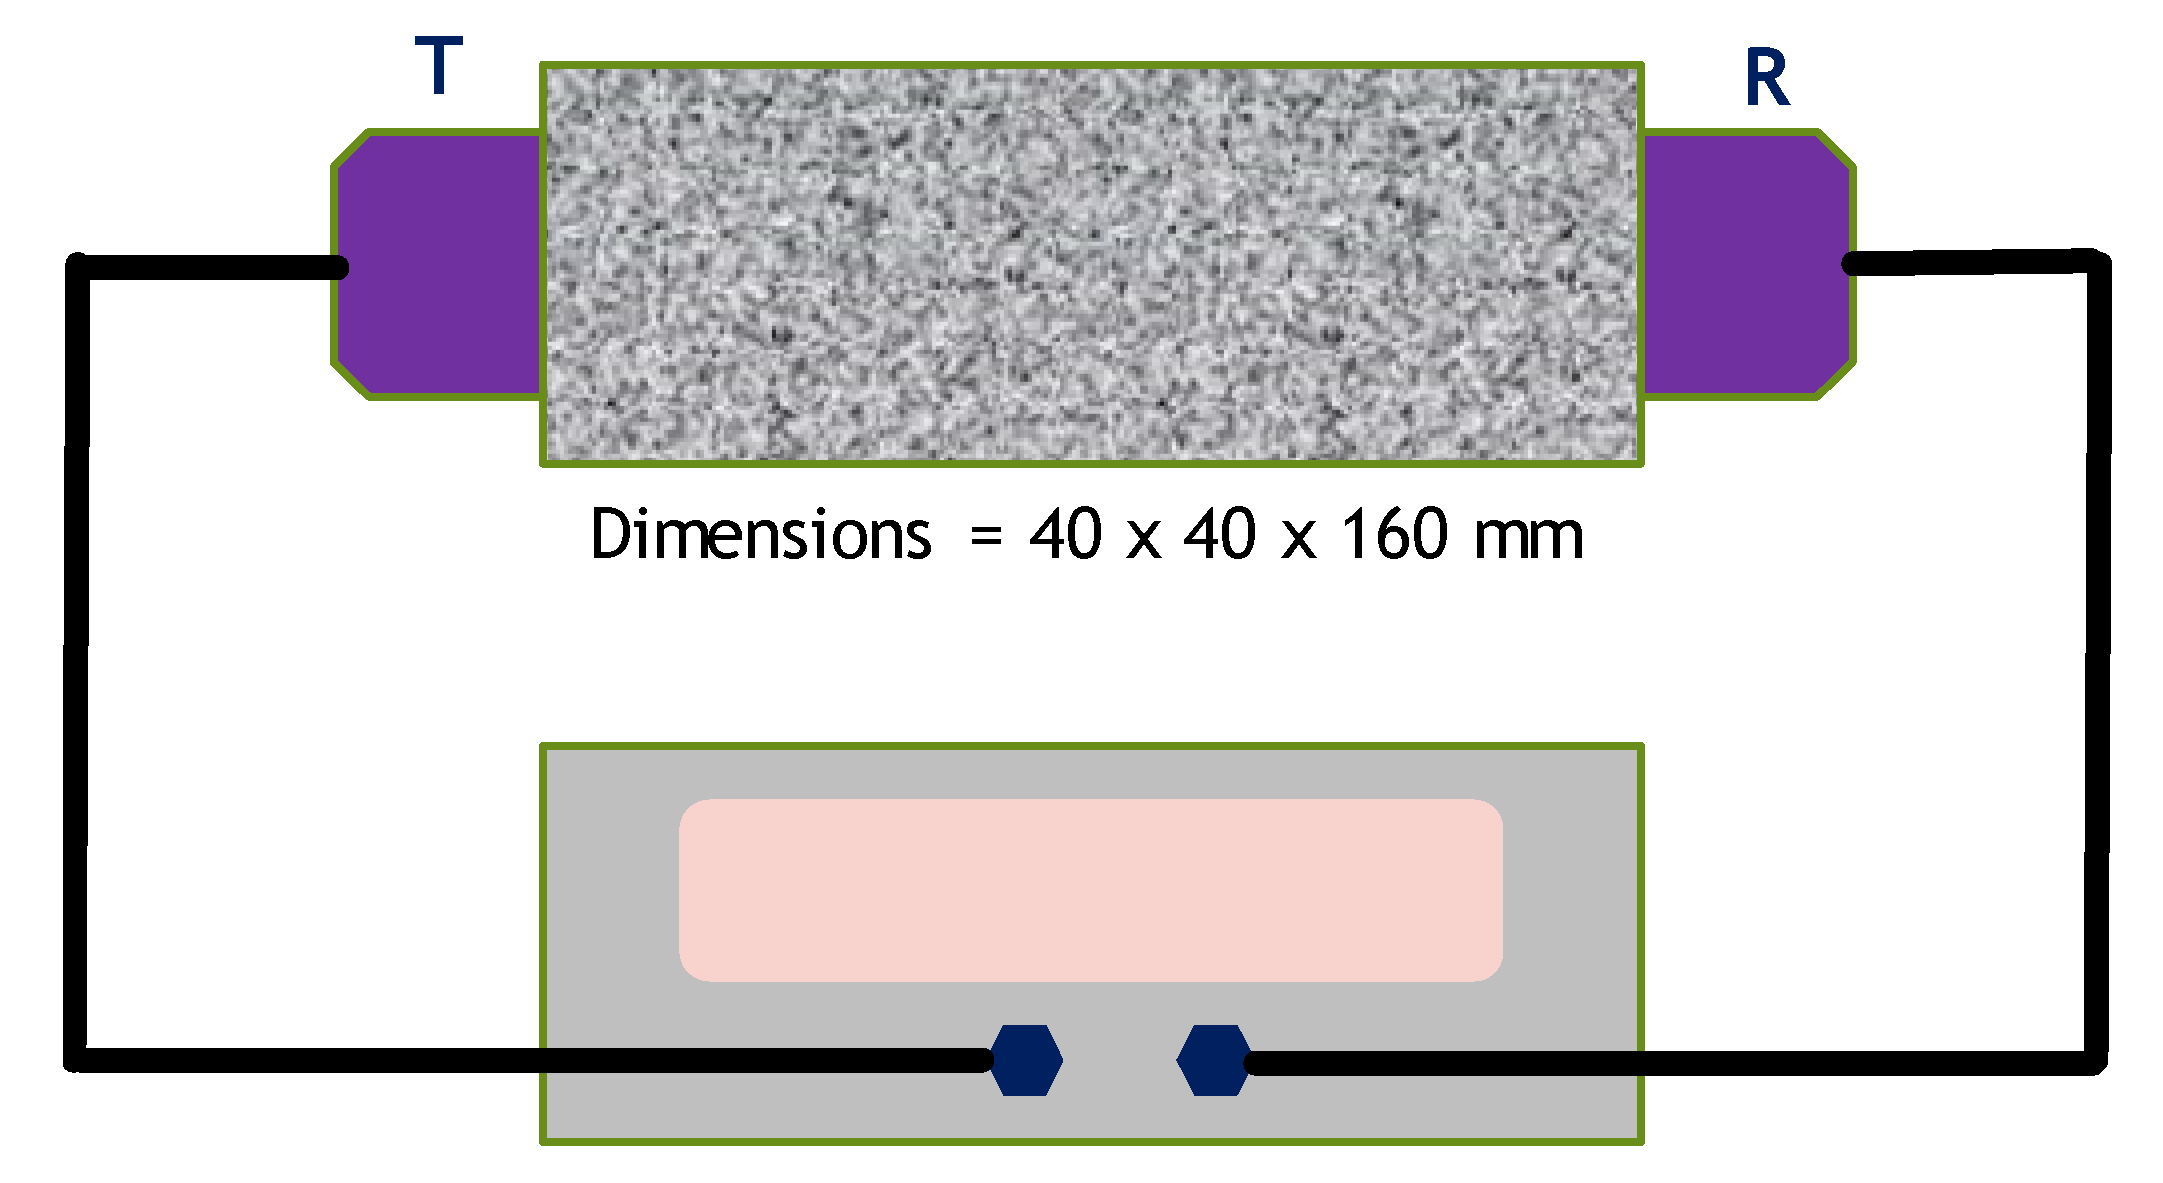
Non-destructive analyses were developed by means of the ultrasonic pulse velocity (UPV) of the Portland cement samples using direct transmission measurements performed by the contact method [44,45]. Ultrasonic pulse velocity (UPV) measurements were carried out by using a commercial portable ultrasonic non-destructive testing instrument (Controls 58-E4800 Ultrasonic pulse velocity tester with a pulse rate of 5 pulses per second, resolution of 0.1 microseconds, and transmitter output of 1200 V). The apparatus is a digital tester with the following main parts; an electrical pulse generator, an amplifier, and a timing circuit, which was connected to a pair of transducers (150 kHz) to measure the time interval elapsing between the onset of a pulse and its arrival at the receiving transducer.
To achieve the UPV measurements the following steps were taken.
- (i)
- Transmitting and receiving transducers were positioned at opposite ends of each mortar cement specimen (Figure 1). Then, this instrument generates low-frequency ultrasonic pulses.
- (ii)
- Measurements of the travelling time of the signal through the specimen of pulses between both transducers were done.
- (iii)
- The longitudinal ultrasonic velocities of the samples, V, were determined using Equation (2) from the distance between the two transducers (path length) and the measured transit time of the pulse.
The path length is the shortest distance between the transducers (160 ± 1 mm). A standardized probe was utilized for all the UPV measurements to obtain the pulse velocity in a precise manner (Reference transit time: 58.1 μs).
where V is the pulse velocity, in km/s, the transit time is the period of time taken by the pulse to transverse the length, in μs, and the path length is taken in mm.
V (km/s) = Path length/Transit time
Frequency pulses as high as 150 kHz have a well-defined onset, but they become attenuated as they pass through the mortar. Consequently, the use of high frequency transducers (150 kHz) for a short path length of 160 mm has been considered adequate.
3. Results and Discussion
3.1. Characterization of the Portland Mortar Samples
Table 2 lists the mechanical characteristics of the cements used in this work. Mean values and standard deviation of flexural strength determined in three mortar specimens and compressive strength tested in six samples are presented. As expected, CEM I showed higher compressive and flexural strengths at both two and 28 days. Also, the higher the amount of coal fly ash, the lower two and 28 days compressive and flexural strengths [46]. It is well-known that, on the one hand, cements without additions (CEM I) perform the hydration reaction [2], but on the other hand, coal fly ash blended cements (CEM II/A-V and CEM II/B-V) besides promoting development of the hydration reaction, undertake the pozzolanic reaction which starts a little bit later and slower than the hydration one [2,46]. In addition, the fineness of the Portland cements plays a key role in the mechanical strength gain at early ages [47].
3.2. Ultrasonic Characterization
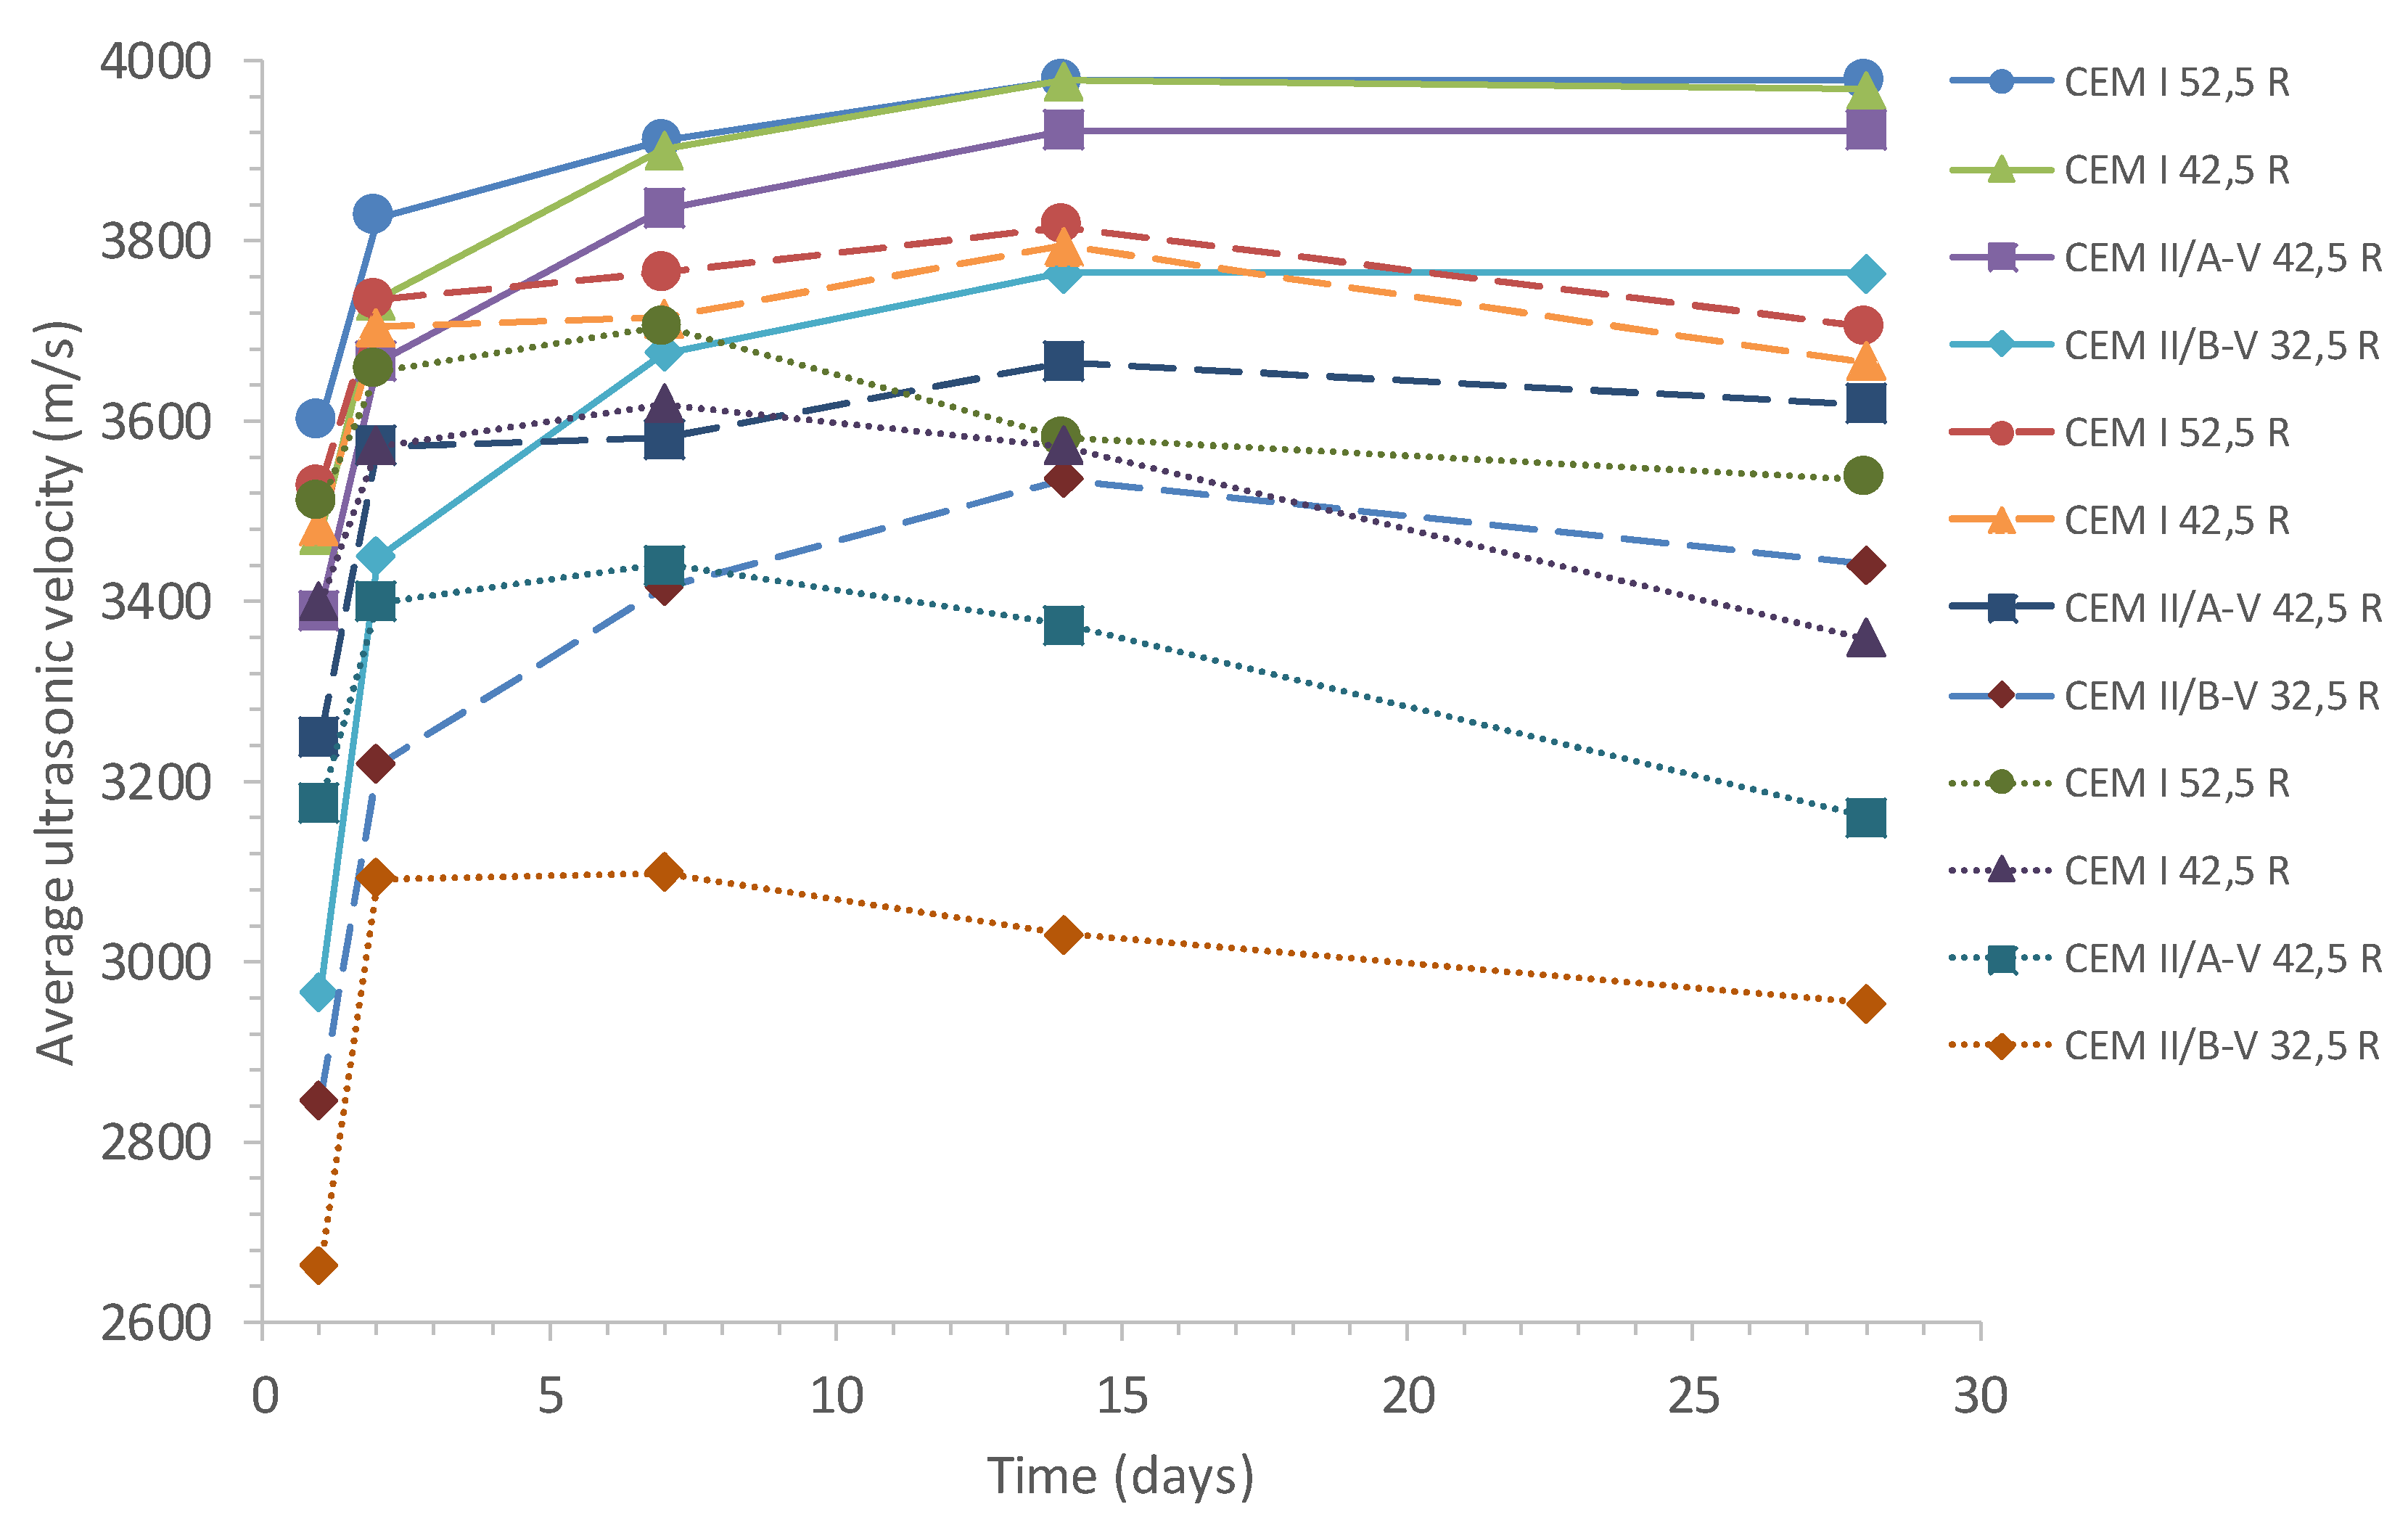
Ultrasonic characterization was performed by measuring the samples ultrasonic velocity after curing periods of 1, 2, 7 14, and 28 days. Direct transmission measurements by the contact method were carried out using commercial equipment. Figure 2 shows the effect of the curing conditions on the average ultrasonic velocity. The three curing conditions have a greater influence on the ultrasonic velocity response than other design parameters, for instance, type of cement. As expected, the best curing conditions are those performed under water (solid line). This type of curing helps to the development of the hydration reactions leading to a denser material [1] with a reduced capillary pore network [3]. By contrast, laboratory environmental conditions are found (50% RH, 22°C), which are represented by dots in Figure 2.
The lack of enough humidity promotes the development of a porous cementitious material with a lower 28-day compressive strength and at the end of the day a lower durability [3]. Thus, it should be noticed that the average ultrasonic velocity falls down. As expected, just in the middle, the results of the mortar samples stored in a climatic chamber at 95% are found (intermittent lines).
Trtnik et al. [35] found no evidence to support a significant effect of the cement type on the UPV–compressive strength relationship. This finding can be easily explained because they only used cements CEM I without any addition. Furthermore, Segura el al. [34] did not find any clear influence on the use of cements with or without coal siliceous fly ash, cements type CEM I and CEM II/A-V, respectively. On the contrary, in this paper, we have found that the type of cement influences strongly the pulse velocity. Furthermore, it is well-known that the amount of coal fly ash in Portland cements delay the compressive strength gain [46] as result of the pozzolanic reaction between the Ca(OH)2 generated in the hydration process of the compounds of the clinker and the reactive SiO2 of the coal ashes. Consequently, different UPV–28-day compressive strength relationships for each cement type were expected. This is illustrated in Figure 2. Only when the cement-based material is well-cured, i.e., underwater, the differences in UPV are negligible in agreement with other authors [34,35]. This performance could be justified due to the different coal fly ash amount of each cement type (0% for CEM I, 17% for CEM II/A-V, and 30% for CEM II/B-V). Such amount of coal fly ash has a direct effect on the pozzolanic reaction which begins after the Portland clinker compounds hydration has started.
3.3. Effect of the Curing Conditions on the Average Ultrasonic Velocity
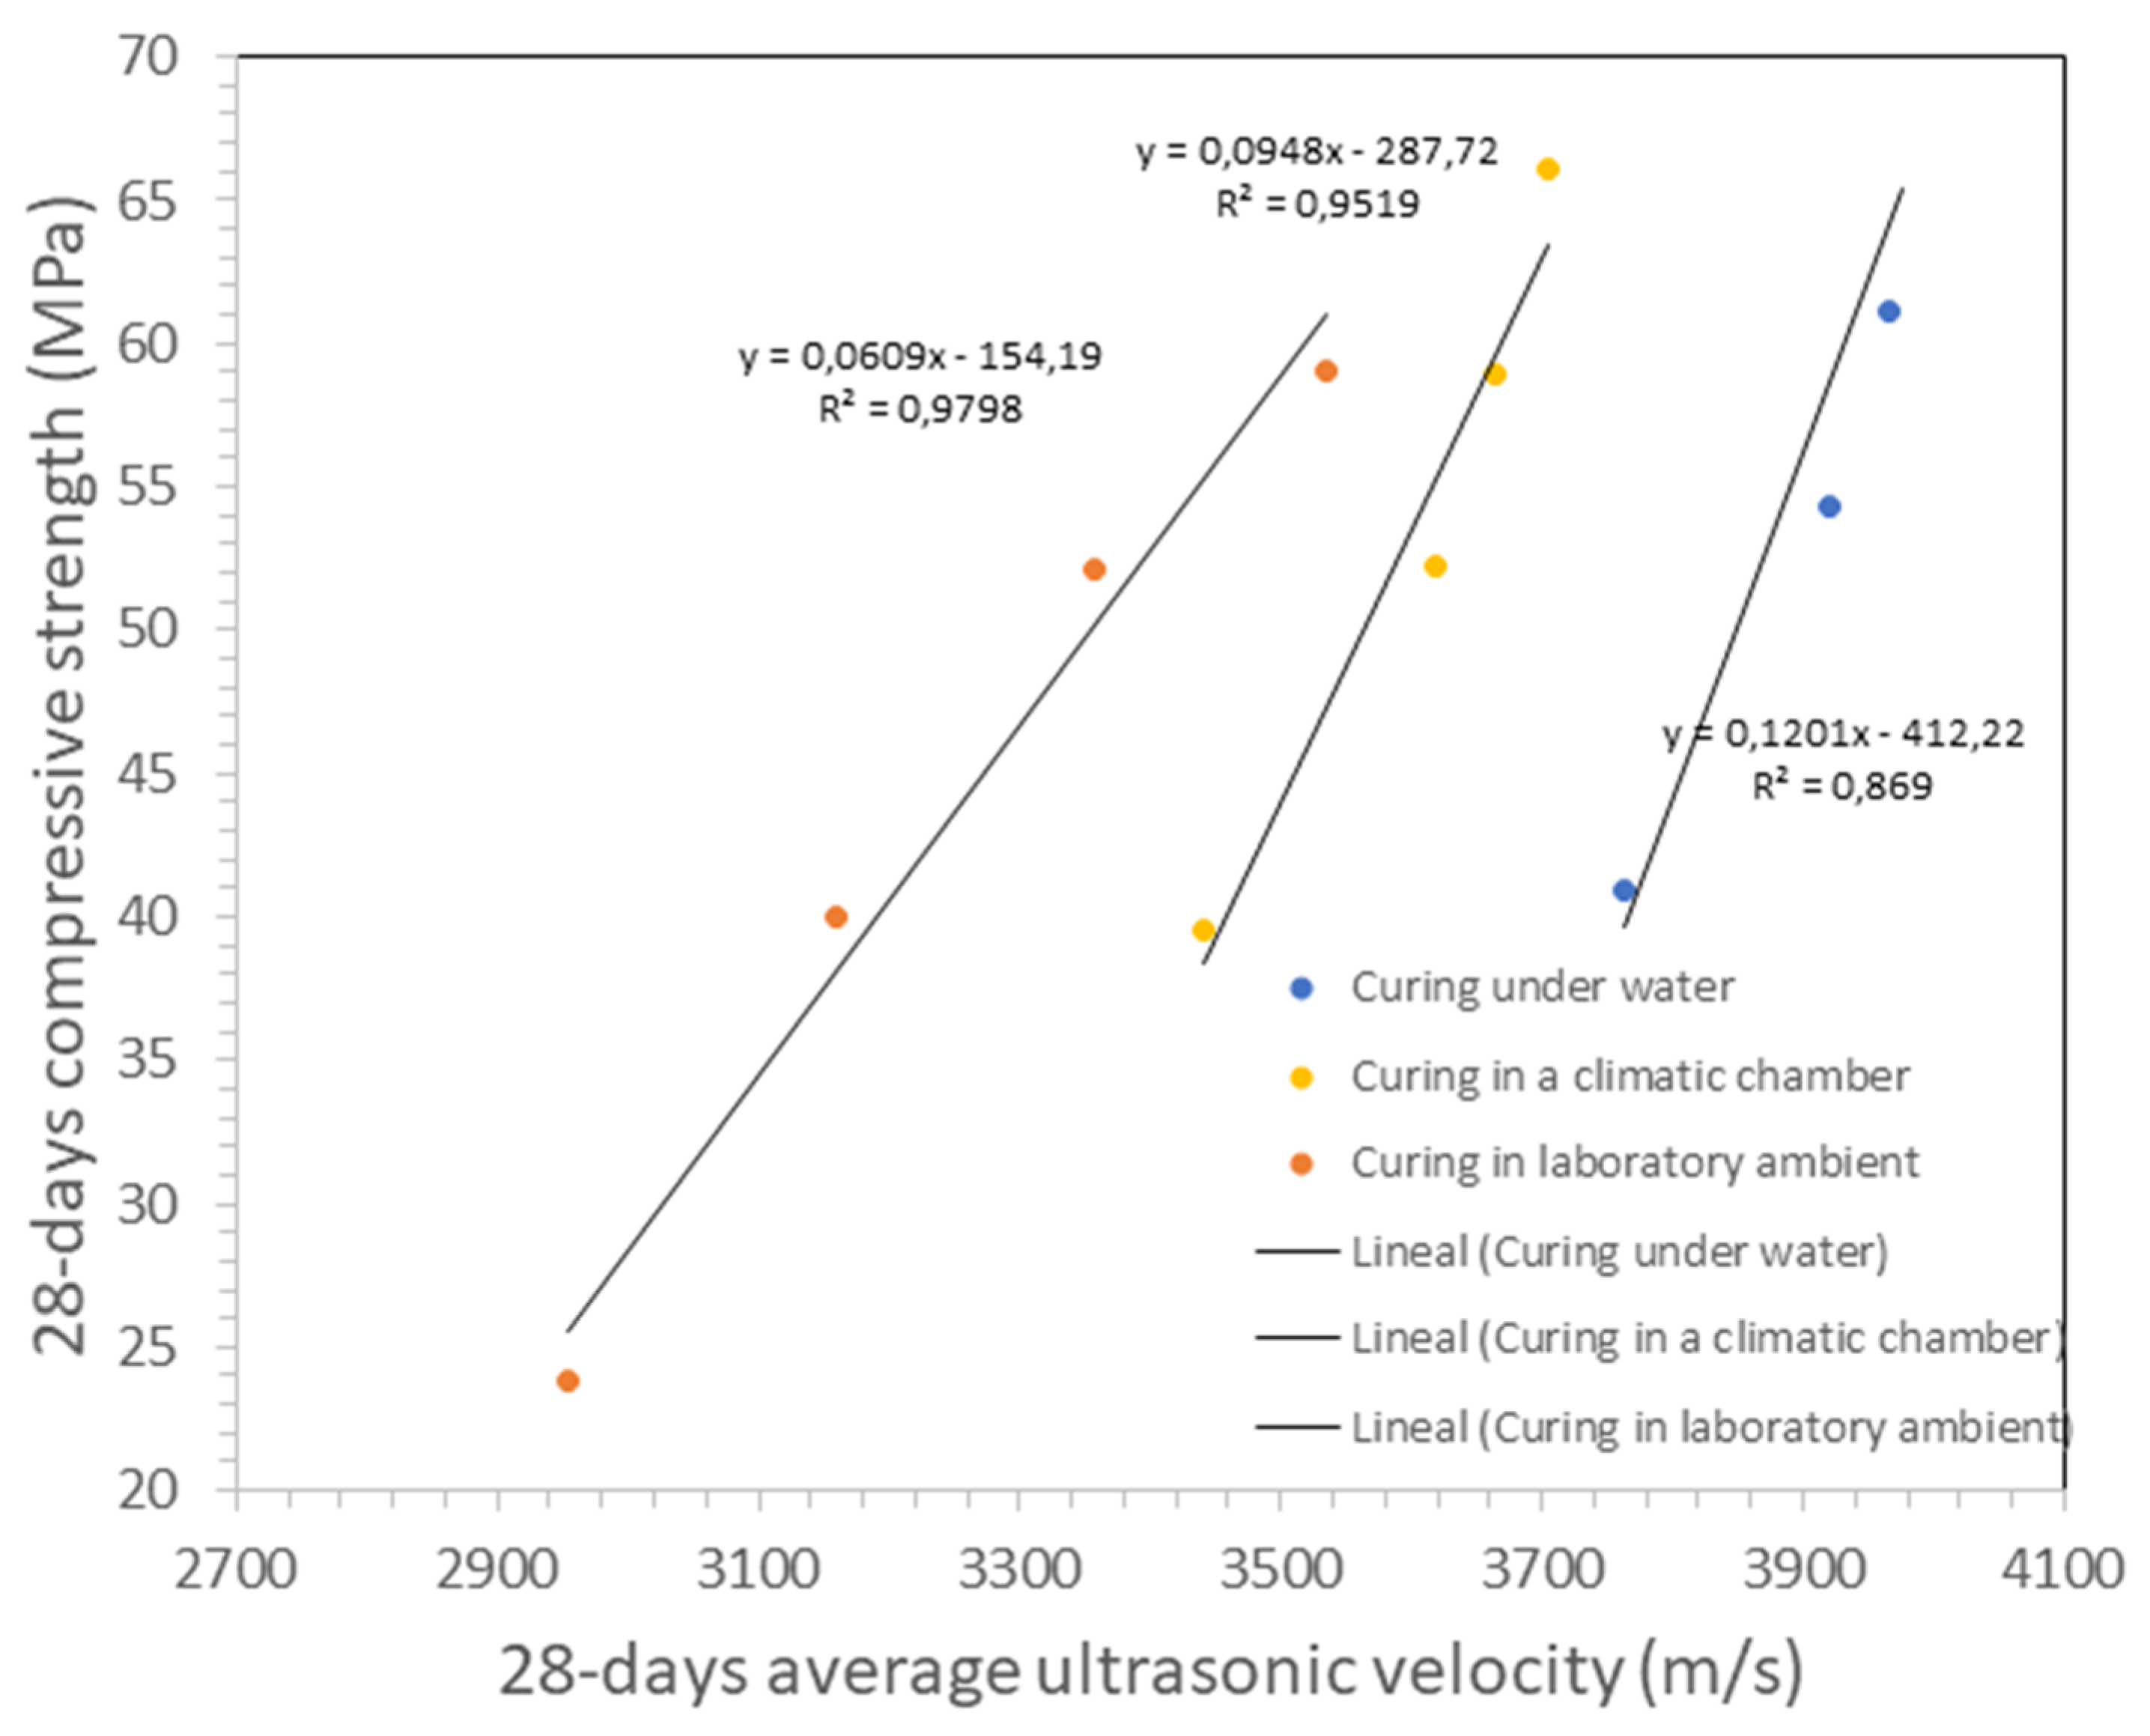
Lowering of the ultrasonic velocity was studied to compare the changes in the ultrasonic velocity by the three different curing conditions (see Figure 2). The effect of the curing conditions on the UPV at 28 days is shown in Table 3. By means of the ultrasonic techniques is possible to correlate mechanical properties of cement-based materials with ultrasonic ones [9,32,33,34,35,36,37,38], and therefore it might be possible to assess the 28-day compressive strength reduction when a proper curing (wet conditions) has not been provided. Given that, the effect of the less proper curing is a drop in UPV of 7–9% (at 95% RH) or 11–22% (at 50% RH) with relation to the water-cured mortars taken as reference (Table 3). Due to the obvious advantages of non-destructive testing, UPV could be used for quality assessment of cement production, thus it is necessary to establish a relation between 28-day compressive strength and ultrasonic velocity for each cement type.
When the mortar samples are cured under water, there is no great effect of the cement type on the average ultrasonic velocity of the mortar samples when the amount of coal fly ash is lesser than 18% (see Figure 2), in agreement with other authors [34,35], because the relative modifications that can be shown among each type of cement are no larger than 1%. However, when a poorer curing condition is applied, such differences increase up to 7–9% for the climatic room (95% RH) curing and 11–22% for 50% RH. Therefore, it can be established that there is a strong influence of the cement type on the average ultrasonic velocity of the mortar specimens cured in non-proper curing conditions. It is well-known the influence of the curing regime in the microstructural development of the mortars. Particularly, hydration and microstructural development of cement-based materials made with coal fly ash [2] and ground granulated blast-furnace slag [3] are apparently hardly influenced by the curing conditions.
As seen in the UPV changes (see Figure 2), an arrangement of the relative ultrasonic slow down according to the curing conditions and cement type can be noticed. Also, as far as the relative humidity of the curing regime decreases, the differences between the cement types are larger. Therefore, samples with higher coal fly ash contents exhibit lower UPV values. The more coal fly ash in the mortar, the lower ultrasonic velocity was monitored. Then, the order found from the higher to the lower UPV at 28-days is as follows.
CEM I 52.5 R > CEM I 42.5 R > CEM II/A-V 42.5 R > CEM II/B-V 32.5 R
In general, for all Portland cement types, the ultrasonic velocity decreases as the humidity level during the curing period decreases. This change could be attributed to the increase in the capillary porosity of the resulting mortar [2]. The connectivity of the capillary porosity in mortars impacts compressive strength and facilitates the ingress of external aggressive agents and thus mortar durability. Samples cured under water show an asymptotic behavior for short-term UPV. Otherwise, samples cured at low relative humidity (50% RH) show a discontinuous increase, particularly, when the coal fly ash amount increases.
There is a clear relationship between the microstructure of the mortars and their compactness. Given that, the denser the cement-based material is, the more durable and stronger will be. From Figure 2, it could be concluded that mortars with ultrasonic wave velocity over 3800 m/s present an excellent quality and those below 3200 m/s, exhibit a quite poor quality (see Table 4). The ranges given in Table 4 have been established considering the following criteria; (i) a good curing in Portland cement mortars provides a dense and compact microstructure (excellent mortar quality); (ii) a good curing in CFA mortars leads to good quality mortars; (iii) a bad curing in Portland cement mortars is the reason of a higher porosity (bad mortar quality); and (iv) a bad curing affects strongly to CFA mortars, therefore, it invariably comes to a very poor mortar quality.
With regard to the curing temperature, Xu et al. found that UPV increase with the increase of curing temperature in cemented tailings backfill [48]. They obtained a linear relationship between UPV and compressive strength. Jiang et al. suggested that UPV is less sensitive to the variation in the curing temperature than compressive strength. They also found a clear linear relationship between UPV and compressive strength at each curing temperature. Finally, they considered that the UPV method can be reliably used for predicting mortar‘s characteristics [49].
3.4. Correlation Between 28-Day compressive Strength and Average Ultrasonic Pulse Velocity
Characterization of 28-day compressive strength of Portland cement mortars is normally performed by destructive testing [1,2], but non-destructive methods as UPV were not extensively used. In this paper, correlation between 28-day compressive strength and average ultrasonic pulse velocity is performed taken into account that correlation is a statistical technique that provides how strongly pairs of variables are related.
A linear relationship is shown between the 28-day compressive strength and average ultrasonic pulse velocity in Figure 3, Figure 4, Figure 5, Figure 6 and Figure 7. Thus, Equation (3) can be applied.
where a and b are experimental parameters obtained by the least squares method, V is the ultrasonic pulse velocity (UPV), and R is the 28-day compressive strength of mortar. The linear regression performed with each set of results (three curing conditions) allowed obtaining the equations shown in Figure 3, Figure 4, Figure 5, Figure 6 and Figure 7 and Table 5. The model fits well the data and the statistical parameters obtained after the correlation (a and b parameters) and the analysis of the R2 (Figure 3, Figure 4, Figure 5, Figure 6 and Figure 7) demonstrate that Equation (3) provide an excellent estimation of 28-day compressive strength of Portland cement mortars (Table 5). In addition, Table 6 shows the fitting parameters with regard to the correlation between the ultrasonic pulse velocity (UPV) and compressive strength of the mortar specimens at 28 days, for each cement type and curing condition by using Equation (1).
R = a + b × V
Also, the experimental results were fitted to Equation (2). In general, the correlation coefficients (R2 values) were worse than the ones obtained by using Equation (3). As R-squared is considered as a statistical measure of how close the data are to the fitted regression line, it is recommended to use the simple linear relationships to estimate the 28-day compressive strength from UPV results. In view of this new finding, it is proposed the use of UPV for quality control for cement production.
Several researches conducted by other authors largely agree with these findings that, altogether, highlight the validity of the linear relationship between UPV and mechanical strength [48,49,50]. As cement cures, it changes from a liquid state to a solid state; consequently, the acoustic waves show a faster travel response. Then, UPV can be used for monitoring cement-based materials at early age [51] and self-healing quantification [52].
Summing up, it can be established that UPV is a convenient technique to assess the compressive strength of mortars as well as other cement-based materials.
3.5. Modeling Assessment
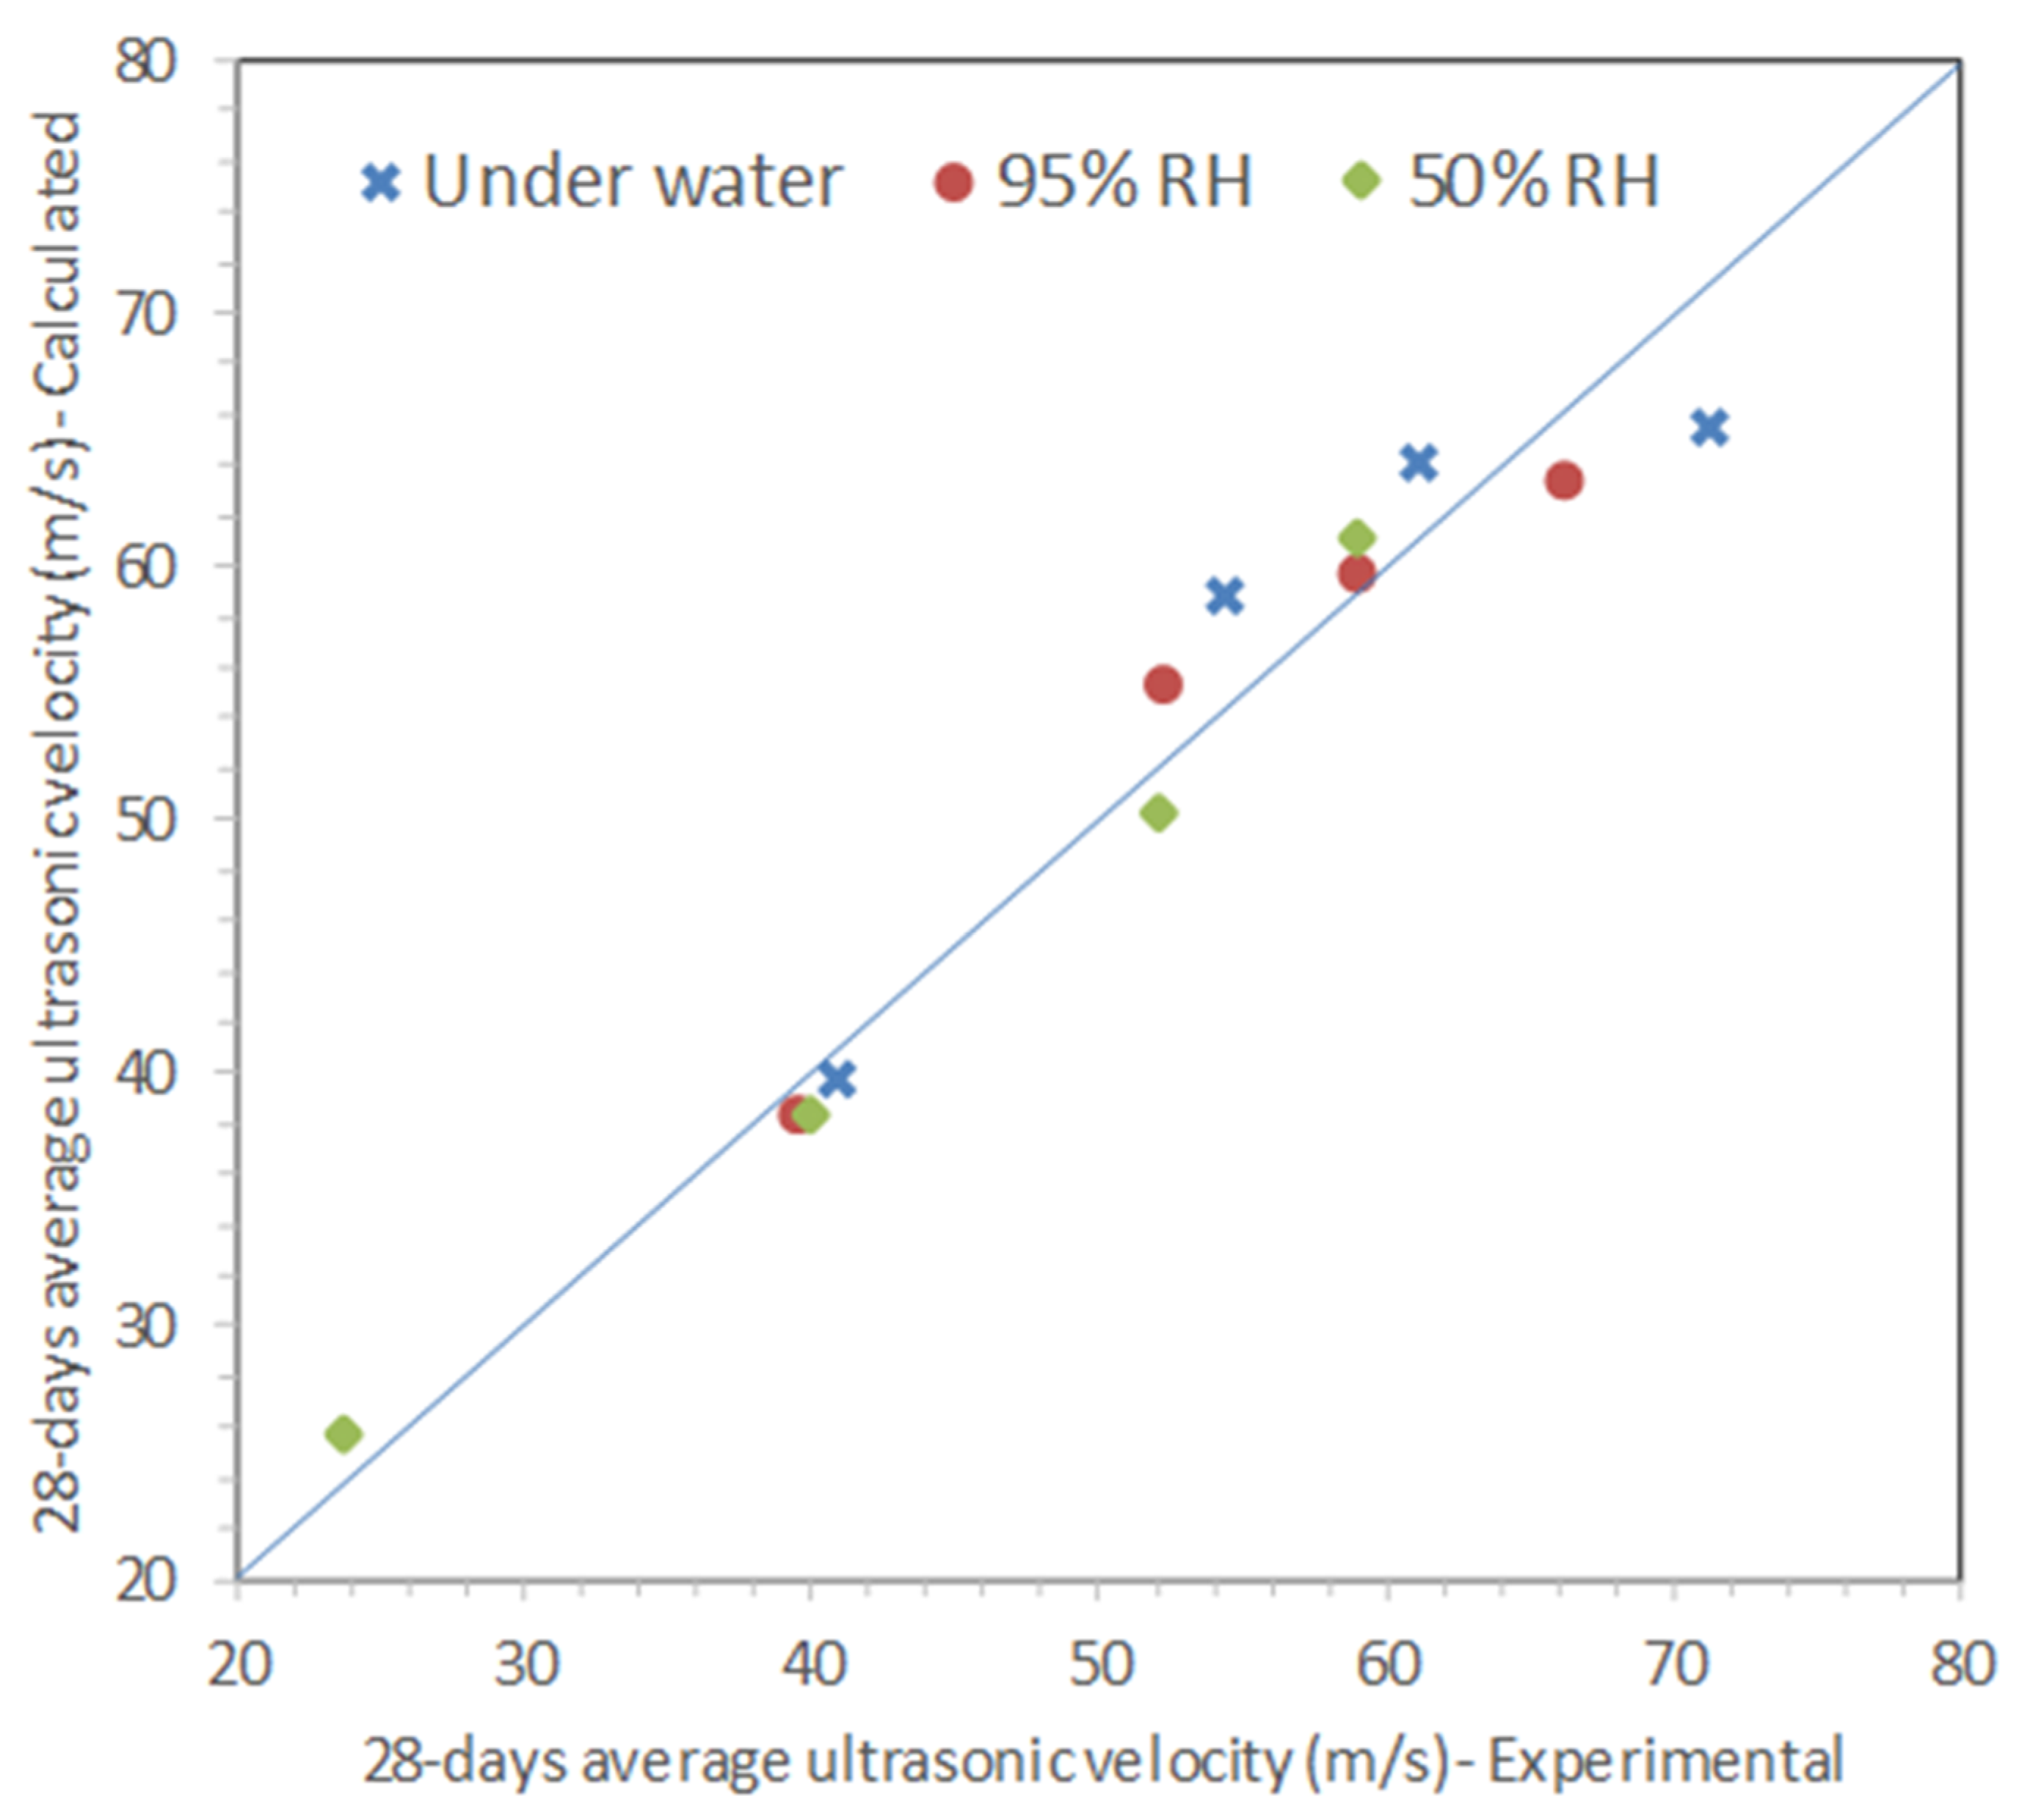
The comparison between the values of 28-day compressive strength calculated by Equation (3) and the actual values can be seen in Figure 8. It is evident that there is a good agreement on experimental and theoretical results. Many factors that influence mortar 28-day compressive strength (type and amount of the cement, water/cement ratio, aggregate characteristics, curing conditions, and so on) also influence the ultrasonic pulse velocity, though this does not necessarily mean in the same extent or in the same way. Therefore, these linear relationships should be obtained for each Portland cement mortar family. Mention should also be made of the low number of the tested cements. Therefore, data adjustment of four points could be improved in future works.
4. Conclusions
The results of a thorough mechanical and ultrasonic study of a set of Portland cement mortars were presented. The controlling factor with regard to the ultrasonic pulse velocity (UPV) of the mortar samples evolution with time is the curing regime, which affects the microstructural development. Curing conditions have a stronger effect on the 28-day compressive strength and UPV results than cement type. Given that, the higher the relative humidity in the curing, the denser the mortar microstructure and the faster the UPV. The changes in the UPV, with regard to both the curing RH and the type of cement, exhibited that when the RH increases, samples with coal fly ash content exhibit higher UPV.
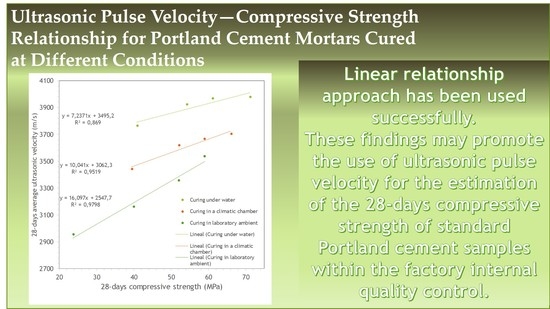
Linear relationship approach has been used successfully to estimate 28-day compressive Portland cement mortar strength by measurement of the UPV. Also, exponential regression was performed to examine the exponential relationship between the 28-day compressive strength and UPV but lower correlation coefficients (R2 values) were registered. Thus, it is suggested to use the linear relationships to estimate the 28-day compressive strength from UPV results. There is a good correlation between 28-day compressive strength and ultrasonic pulse velocity of Portland cement mortars when the curing conditions are not good (R2 = 0.97–0.99). On the contrary, the weaker uphill linear relationship in good curing conditions (R2 = 0.85–0.98) is indicative of the higher heterogeneity of these mortar samples. These findings may promote the use of ultrasonic pulse velocity for the estimation of the 28-day compressive strength of standard Portland cement samples within the factory internal quality control shown in EN 197-2.
Author Contributions
Conceptualization, M.Á.S.; methodology, M.Á.S.; software, M.Á.S.; validation, E.E., D.A.M., M.Á.S., and C.A.; formal analysis, E.E., D.A.M., M.Á.S., and C.A.; investigation, E.E., D.A.M., M.Á.S., and C.A.; resources, E.E. and D.A.M.; data curation, M.Á.S.; writing—original draft preparation, M.Á.S.; writing—review and editing, E.E., D.A.M., M.Á.S., and C.A.; project administration, E.E. and D.A.M. All authors have read and agreed to the published version of the manuscript.
Funding
This research received no external funding.
Acknowledgments
The authors gratefully acknowledge Guillermina Blázquez Rodea and Claudia Patricia Garavito Ayala (TFM 2016—UIMP) for their valuable work in the experimental phase of this study. The authors also wish to thank to Daniel del Barrio for his kind cooperation with this work.
Conflicts of Interest
The authors declare no conflicts of interest.
References
- Mehta, P.K.; Monteiro, P.J.M. Concrete: Microstructure, Properties, and Materials, 4th ed.; McGraw-Hill Education: New York, NY, USA, 2014; pp. 1–704. [Google Scholar]
- Taylor, H.F.W. Cement Chemistry, 2nd ed.; Thomas Telford Ltd.: London, UK, 1997; pp. 1–480. [Google Scholar]
- Sanjuán, M.A.; Estévez, E.; Argiz, C.; del Barrio, D. Effect of curing time on granulated blast-furnace slag cement mortars. Cem. Concr. Compos. 2018, 90, 257–265. [Google Scholar] [CrossRef]
- Lafhaj, Z.; Goueygou, M.; Djerbi, A. Correlation between porosity, permeability and ultrasonic parameters of motar with variable water/cement ratio and water content. Cem. Concr. Res. 2006, 36, 625–633. [Google Scholar] [CrossRef]
- Tomsett, H.N. The practical use of ultrasonic pulse velocity measurements in the assessment of concrete quality. Mag. Concr. Res. 1980, 32, 7–16. [Google Scholar] [CrossRef]
- Punurai, W.; Jarzynski, J.; Qu, J.; Kim, J.-Y.; Jacobs, L.J.; Kurtis, K.E. Characterization of multi-scale porosity in cement paste by advanced ultrasonic techniques. Cem. Concr. Res. 2007, 37, 38–46. [Google Scholar] [CrossRef]
- Concu, G.; Trulli, N. Concrete Defects Sizing by Means of Ultrasonic Velocity Maps. Buildings 2018, 8, 176. [Google Scholar] [CrossRef] [Green Version]
- Hernández, M.G.; Anaya, J.J.; Sánchez, T.; Segura, I. Porosity estimation of aged mortar using a micromechanical model. Ultrasonics 2006, 44, e1007–e1011. [Google Scholar] [CrossRef]
- Akkaya, Y. Nondestructive measurement of concrete strength gain by an ultrasonic wave reflection method. Mater. Struct. 2003, 36, 507–514. [Google Scholar] [CrossRef]
- Jasiński, R.; Drobiec, Ł.; Mazur, W. Validation of Selected Non-Destructive Methods for Determining the Compressive Strength of Masonry Units Made of Autoclaved Aerated Concrete. Materials 2019, 12, 389. [Google Scholar] [CrossRef] [Green Version]
- Yoo, D.-Y.; Shin, H.-O.; Yoon, Y.-S. Ultrasonic Monitoring of Setting and Strength Development of Ultra-High-Performance Concrete. Materials 2016, 9, 294. [Google Scholar] [CrossRef]
- Del Río, L.M.; Jiménez, A.; López, F.; Rosa, F.J.; Rufo, M.M.; Paniagua, J.M. Characterization and hardening of concrete with ultrasonic testing. Ultrasonics 2004, 42, 527–530. [Google Scholar] [CrossRef]
- Reinhardt, H.; Grosse, C.; Herb, A. Ultrasonic monitoring of setting and hardening of cement mortar—a new device. Mater. Struct. 2000, 33, 581–583. [Google Scholar] [CrossRef]
- Drobiec, Ł.; Jasiński, R.; Mazur, W. Accuracy of Eddy-Current and Radar Methods Used in Reinforcement Detection. Materials 2019, 12, 1168. [Google Scholar] [CrossRef] [PubMed] [Green Version]
- Laureti, S.; Ricci, M.; Mohamed, M.N.I.B.; Senni, L.; Davis, L.A.J.; Hutchins, D.A. Detection of rebars in concrete using advanced ultrasonic pulse compression techniques. Ultrasonics 2018, 85, 31–38. [Google Scholar] [CrossRef] [PubMed] [Green Version]
- Ervin, B.; Kuchma, D. Monitoring corrosion of rebar embedded in mortar using high-frequency guided ultrasonic waves. J. Eng. Mech. 2009, 1635, 9–19. [Google Scholar] [CrossRef]
- Chung, H.W. Effects of embedded steel bars upon ultrasonic testing of concrete. Mag. Concr. Res. 1978, 30, 19–25. [Google Scholar] [CrossRef]
- Schabowicz, K.; Gorzelańczyk, T.; Szymków, M. Identification of the Degree of Degradation of Fibre-Cement Boards Exposed to Fire by Means of the Acoustic Emission Method and Artificial Neural Networks. Materials 2019, 12, 656. [Google Scholar] [CrossRef] [Green Version]
- Ranachowski, Z.; Ranachowski, P.; Dębowski, T.; Gorzelańczyk, T.; Schabowicz, K. Investigation of Structural Degradation of Fiber Cement Boards Due to Thermal Impact. Materials 2019, 12, 944. [Google Scholar] [CrossRef] [Green Version]
- Gorzelańczyk, T.; Schabowicz, K. Effect of Freeze–Thaw Cycling on the Failure of Fibre-Cement Boards, Assessed Using Acoustic Emission Method and Artificial Neural Network. Materials 2019, 12, 2181. [Google Scholar] [CrossRef] [Green Version]
- Ait Ouarabi, M.; Antonaci, P.; Boubenider, F.; Gliozzi, A.S.; Scalerandi, M. Ultrasonic Monitoring of the Interaction between Cement Matrix and Alkaline Silicate Solution in Self-Healing Systems. Materials 2017, 10, 46. [Google Scholar] [CrossRef] [Green Version]
- Lafhaj, Z.; Goueygou, M. Experimental study on sound and damaged mortar: Variation of ultrasonic parameters with porosity. Constr. Build. Mater. 2009, 23, 953–958. [Google Scholar] [CrossRef]
- Logoń, D. Identification of the Destruction Process in Quasi Brittle Concrete with Dispersed Fibers Based on Acoustic Emission and Sound Spectrum. Materials 2019, 12, 2266. [Google Scholar] [CrossRef] [PubMed] [Green Version]
- Stawiski, B.; Kania, T. Examining the Distribution of Strength across the Thickness of Reinforced Concrete Elements Subject to Sulphate Corrosion Using the Ultrasonic Method. Materials 2019, 12, 2519. [Google Scholar] [CrossRef] [PubMed] [Green Version]
- Aggelis, D.G.; Kordatos, E.Z.; Strantza, M.; Soulioti, D.V.; Matikas, T.E. NDT approach for characterization of subsurface cracks in concrete. Constr. Build. Mater. 2011, 25, 3089–3097. [Google Scholar] [CrossRef]
- Ham, S.; Song, H.; Oelze, M.L.; Popovics, J.S. A contactless ultrasonic surface wave approach to characterize distributed cracking damage in concrete. Ultrasonics 2017, 75, 46–57. [Google Scholar] [CrossRef] [PubMed] [Green Version]
- Carrión, A.; Genovés, V.; Gosálbez, J.; Miralles, R.; Payá, J. Ultrasonic signal modality: A novel approach for concrete damage evaluation. Cem. Concr. Res. 2017, 101, 25–32. [Google Scholar] [CrossRef] [Green Version]
- Ugur, I.; Sengun, N.; Demirdag, S.; Altindag, R. Analysis of the alterations in porosity features of some natural stones due to thermal effect. Ultrasonics 2014, 54, 1332–1336. [Google Scholar] [CrossRef]
- Trtnik, G.; Gams, M. Recent advances of ultrasonic testing of cement-based materials at early ages. Ultrasonics 2014, 54, 66–75. [Google Scholar] [CrossRef]
- Trtnik, G.; Valicˇ, M.I.; Kavčič, F.; Turk, G. Comparison between two ultrasonic methods in their ability to monitor the setting process of cement pastes. Cem. Concr. Res. 2009, 39, 876–882. [Google Scholar] [CrossRef] [Green Version]
- Mohammed, T.U.; Mahmood, A.H. Effects of maximum aggregate size on UPV of brick aggregate concrete. Ultrasonics 2016, 69, 129–136. [Google Scholar] [CrossRef]
- Ben-Zeitun, A.E. Use of pulse velocity to predict compressive strength of concrete. Int. J. Cem. Compos. Light. Concr. 1986, 8, 51–59. [Google Scholar] [CrossRef]
- Pacheco Torgal, F.; Castro-Gomes, J.P. Influence of physical and geometrical properties of granite and limestone aggregates on the durability of a C20/25 strength class concrete. Constr. Build. Mater. 2006, 20, 1079–1088. [Google Scholar] [CrossRef]
- Segura, I.; Molero, M.; Aparicio, S.; Anaya, J.J.; Moragues, A. Decalcification of cement mortars: Characterisation and modelling. Cem. Concr. Compos. 2013, 35, 136–150. [Google Scholar] [CrossRef] [Green Version]
- Trtnik, G.; Kavčič, F.; Turk, G. Prediction of concrete strength using ultrasonic pulse velocity and artificial neural networks. Ultrasonics 2009, 49, 53–60. [Google Scholar] [CrossRef] [PubMed] [Green Version]
- Lee, S.C. Prediction of concrete strength using artificial neural networks. Eng. Struct. 2003, 25, 849–857. [Google Scholar] [CrossRef]
- Yılmaz, T.; Ercikdi, B.; Karaman, K.; Külekçi, G. Assessment of strength properties of cemented paste backfill by ultrasonic pulse velocity test. Ultrasonics 2014, 54, 1386–1394. [Google Scholar] [CrossRef]
- Akçaözoğlu, S.; Akçaözoğlu, K.; Atiş, C.D. Thermal conductivity, compressive strength and ultrasonic wave velocity of cementitious composite containing waste PET lightweight aggregate (WPLA). Compos. Part B 2013, 45, 721–726. [Google Scholar]
- Colangelo, F.; Cioffi, R. Mechanical properties and durability of mortar containing fine fraction of demolition wastes produced by selective demolition in South Italy. Compos. Part B 2017, 115, 43–50. [Google Scholar] [CrossRef]
- EN 197-1:2011. Cement—Part 1: Composition, Specifications and Conformity Criteria for Common Cements; European Committee for Standardization (CEN) Standards: Brussels, Belgium, 2011. [Google Scholar]
- Sanjuán, M.A.; Argiz, C. The new European standard on common cements specifications EN 197-1:2011. Mater. Construcc. 2012, 62, 425–430. [Google Scholar] [CrossRef] [Green Version]
- EN 196-2:2013. Method of Testing Cement. Chemical Analysis of Cement; European Committee for Standardization (CEN) Standards: Brussels, Belgium, 2013. [Google Scholar]
- EN 196-1:2016. Methods of Testing of Cement: Part 1. Determination of Strength; European Committee for Standardization (CEN) Standards: Brussels, Belgium, 2016. [Google Scholar]
- EN 12504-4:2004. Determination of Ultrasonic Pulse Velocity; European Committee for Standardization (CEN) Standards: Brussels, Belgium, 2004. [Google Scholar]
- ASTM C597-16. Standard Test Method for Pulse Velocity through Concrete; Book of Standards, ASTM Standards. Vol. 04.02: West Conshohocken, PA, USA, 2016. [Google Scholar]
- Argiz, C.; Menéndez, E.; Sanjuán, M.A. Effect of mixes made of coal bottom ash and fly ash on the mechanical strength and porosity of Portland cement. Mater. Construcc. 2013, 63, 49–64. [Google Scholar]
- Sanjuán, M.A.; Argiz, C.; Gálvez, J.C.; Moragues, A. Effect of silica fume fineness on the improvement of Portland cement strength performance. Constr. Build. Mater. 2015, 96, 55–64. [Google Scholar] [CrossRef]
- Xu, W.; Li, Q.; Liu, B. Coupled effect of curing temperature and age on compressive behavior, microstructure and ultrasonic properties of cemented tailings backfill. Constr. Build. Mater. 2020, 237, 117738. [Google Scholar] [CrossRef]
- Jiang, H.; Yi, H.; Yilmaz, E.; Liu, S.; Qiu, J. Ultrasonic evaluation of strength properties of cemented paste backfill: Effects of mineral admixture and curing temperature. Ultrasonics 2020, 100, 105983. [Google Scholar] [CrossRef] [PubMed]
- Olteanu, A.; Teodoriu, C. Uncertainty in ultrasonic measurements of oil-based mud contaminated cement. Mater. Today Commun. 2020, 22, 100783. [Google Scholar] [CrossRef]
- Barluenga, G.; Puentes, J.; Palomar, I.; Guardia, C. Methodology for monitoring Cement Based Materials at Early Age combining NDT techniques. Constr. Build. Mater. 2018, 193, 373–383. [Google Scholar] [CrossRef]
- Singh, H.; Gupta, R. Cellulose fiber as bacteria-carrier in mortar: Self-healing quantification using UPV. J. Build. Eng. 2020, 28, 101090. [Google Scholar] [CrossRef]
Figure 1.
Transducer arrangement: Transmitting (T) and receiving (R) transducers positioned at opposite ends of each standard probe or mortar specimen.
Figure 1.
Transducer arrangement: Transmitting (T) and receiving (R) transducers positioned at opposite ends of each standard probe or mortar specimen.

Figure 2.
Effect of the curing conditions on the average ultrasonic velocity (solid line: underwater; intermittent lines: climatic chamber at 95% RH and 22 °C; dots: lab ambient at 50% RH and 22 °C).
Figure 2.
Effect of the curing conditions on the average ultrasonic velocity (solid line: underwater; intermittent lines: climatic chamber at 95% RH and 22 °C; dots: lab ambient at 50% RH and 22 °C).

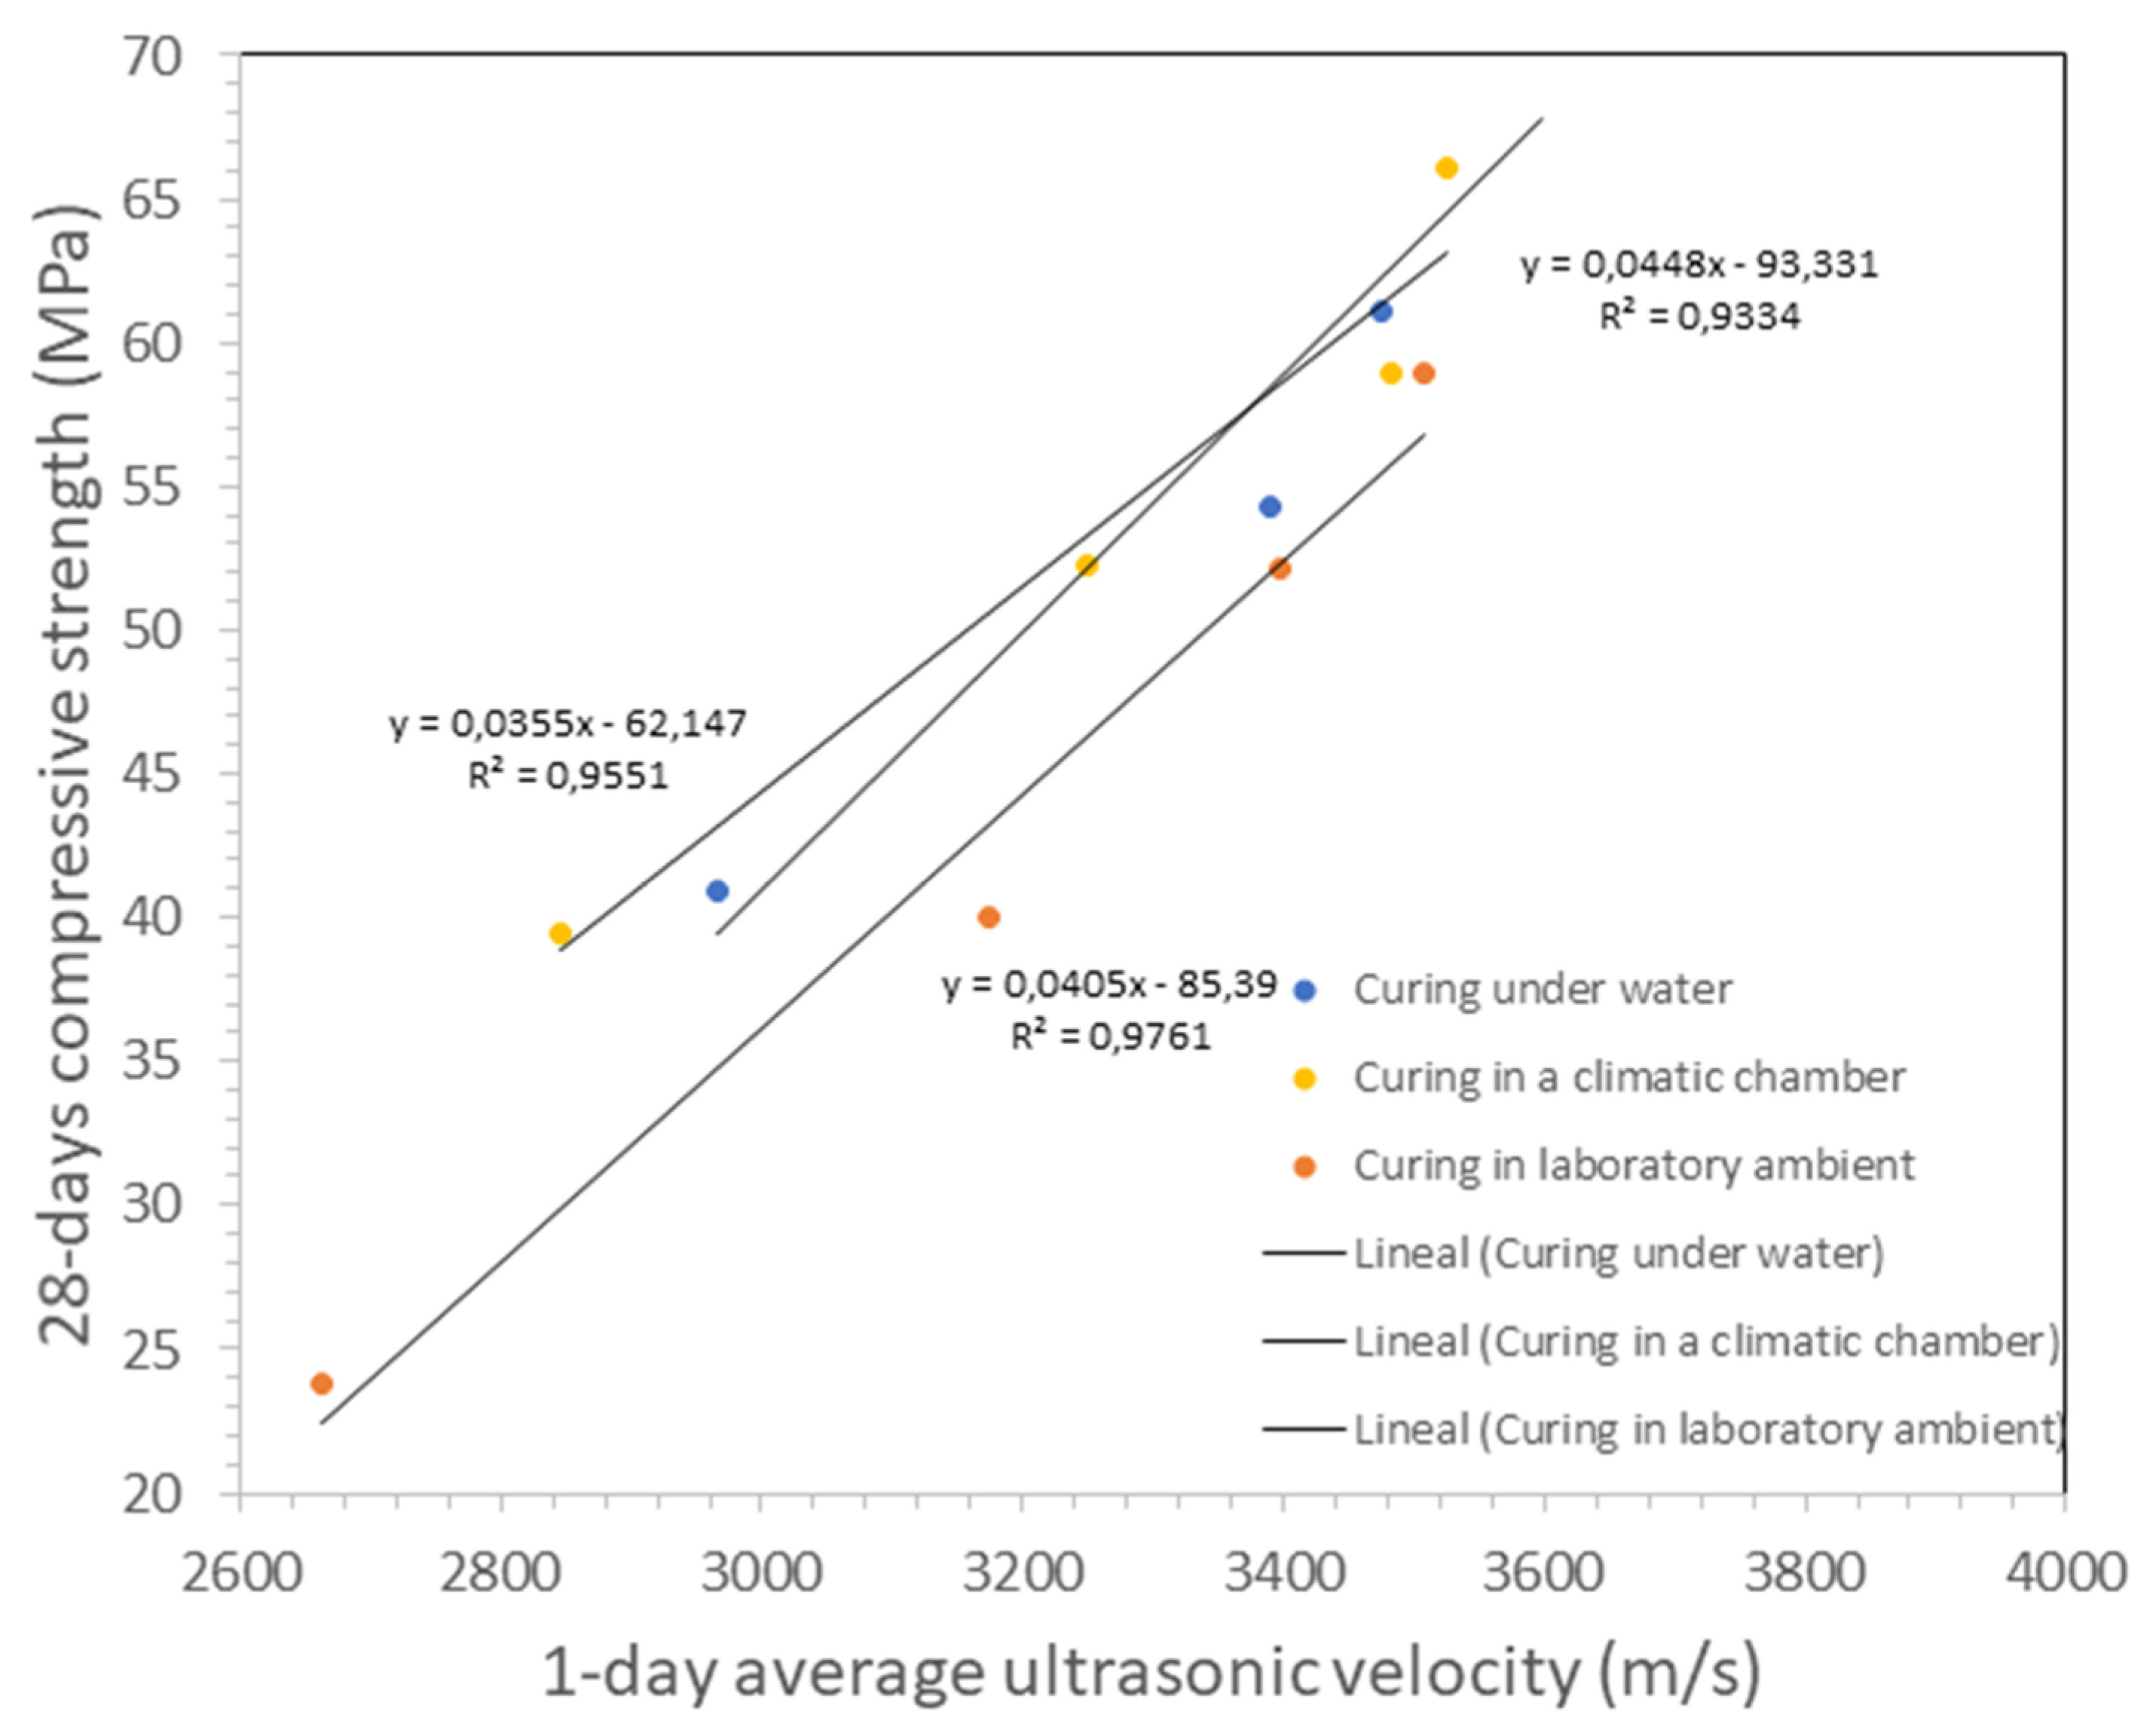
Figure 3.
Linear relations between UPV values measured at 1 day and 28-day compressive strength of Portland mortar specimens cured under water.
Figure 3.
Linear relations between UPV values measured at 1 day and 28-day compressive strength of Portland mortar specimens cured under water.

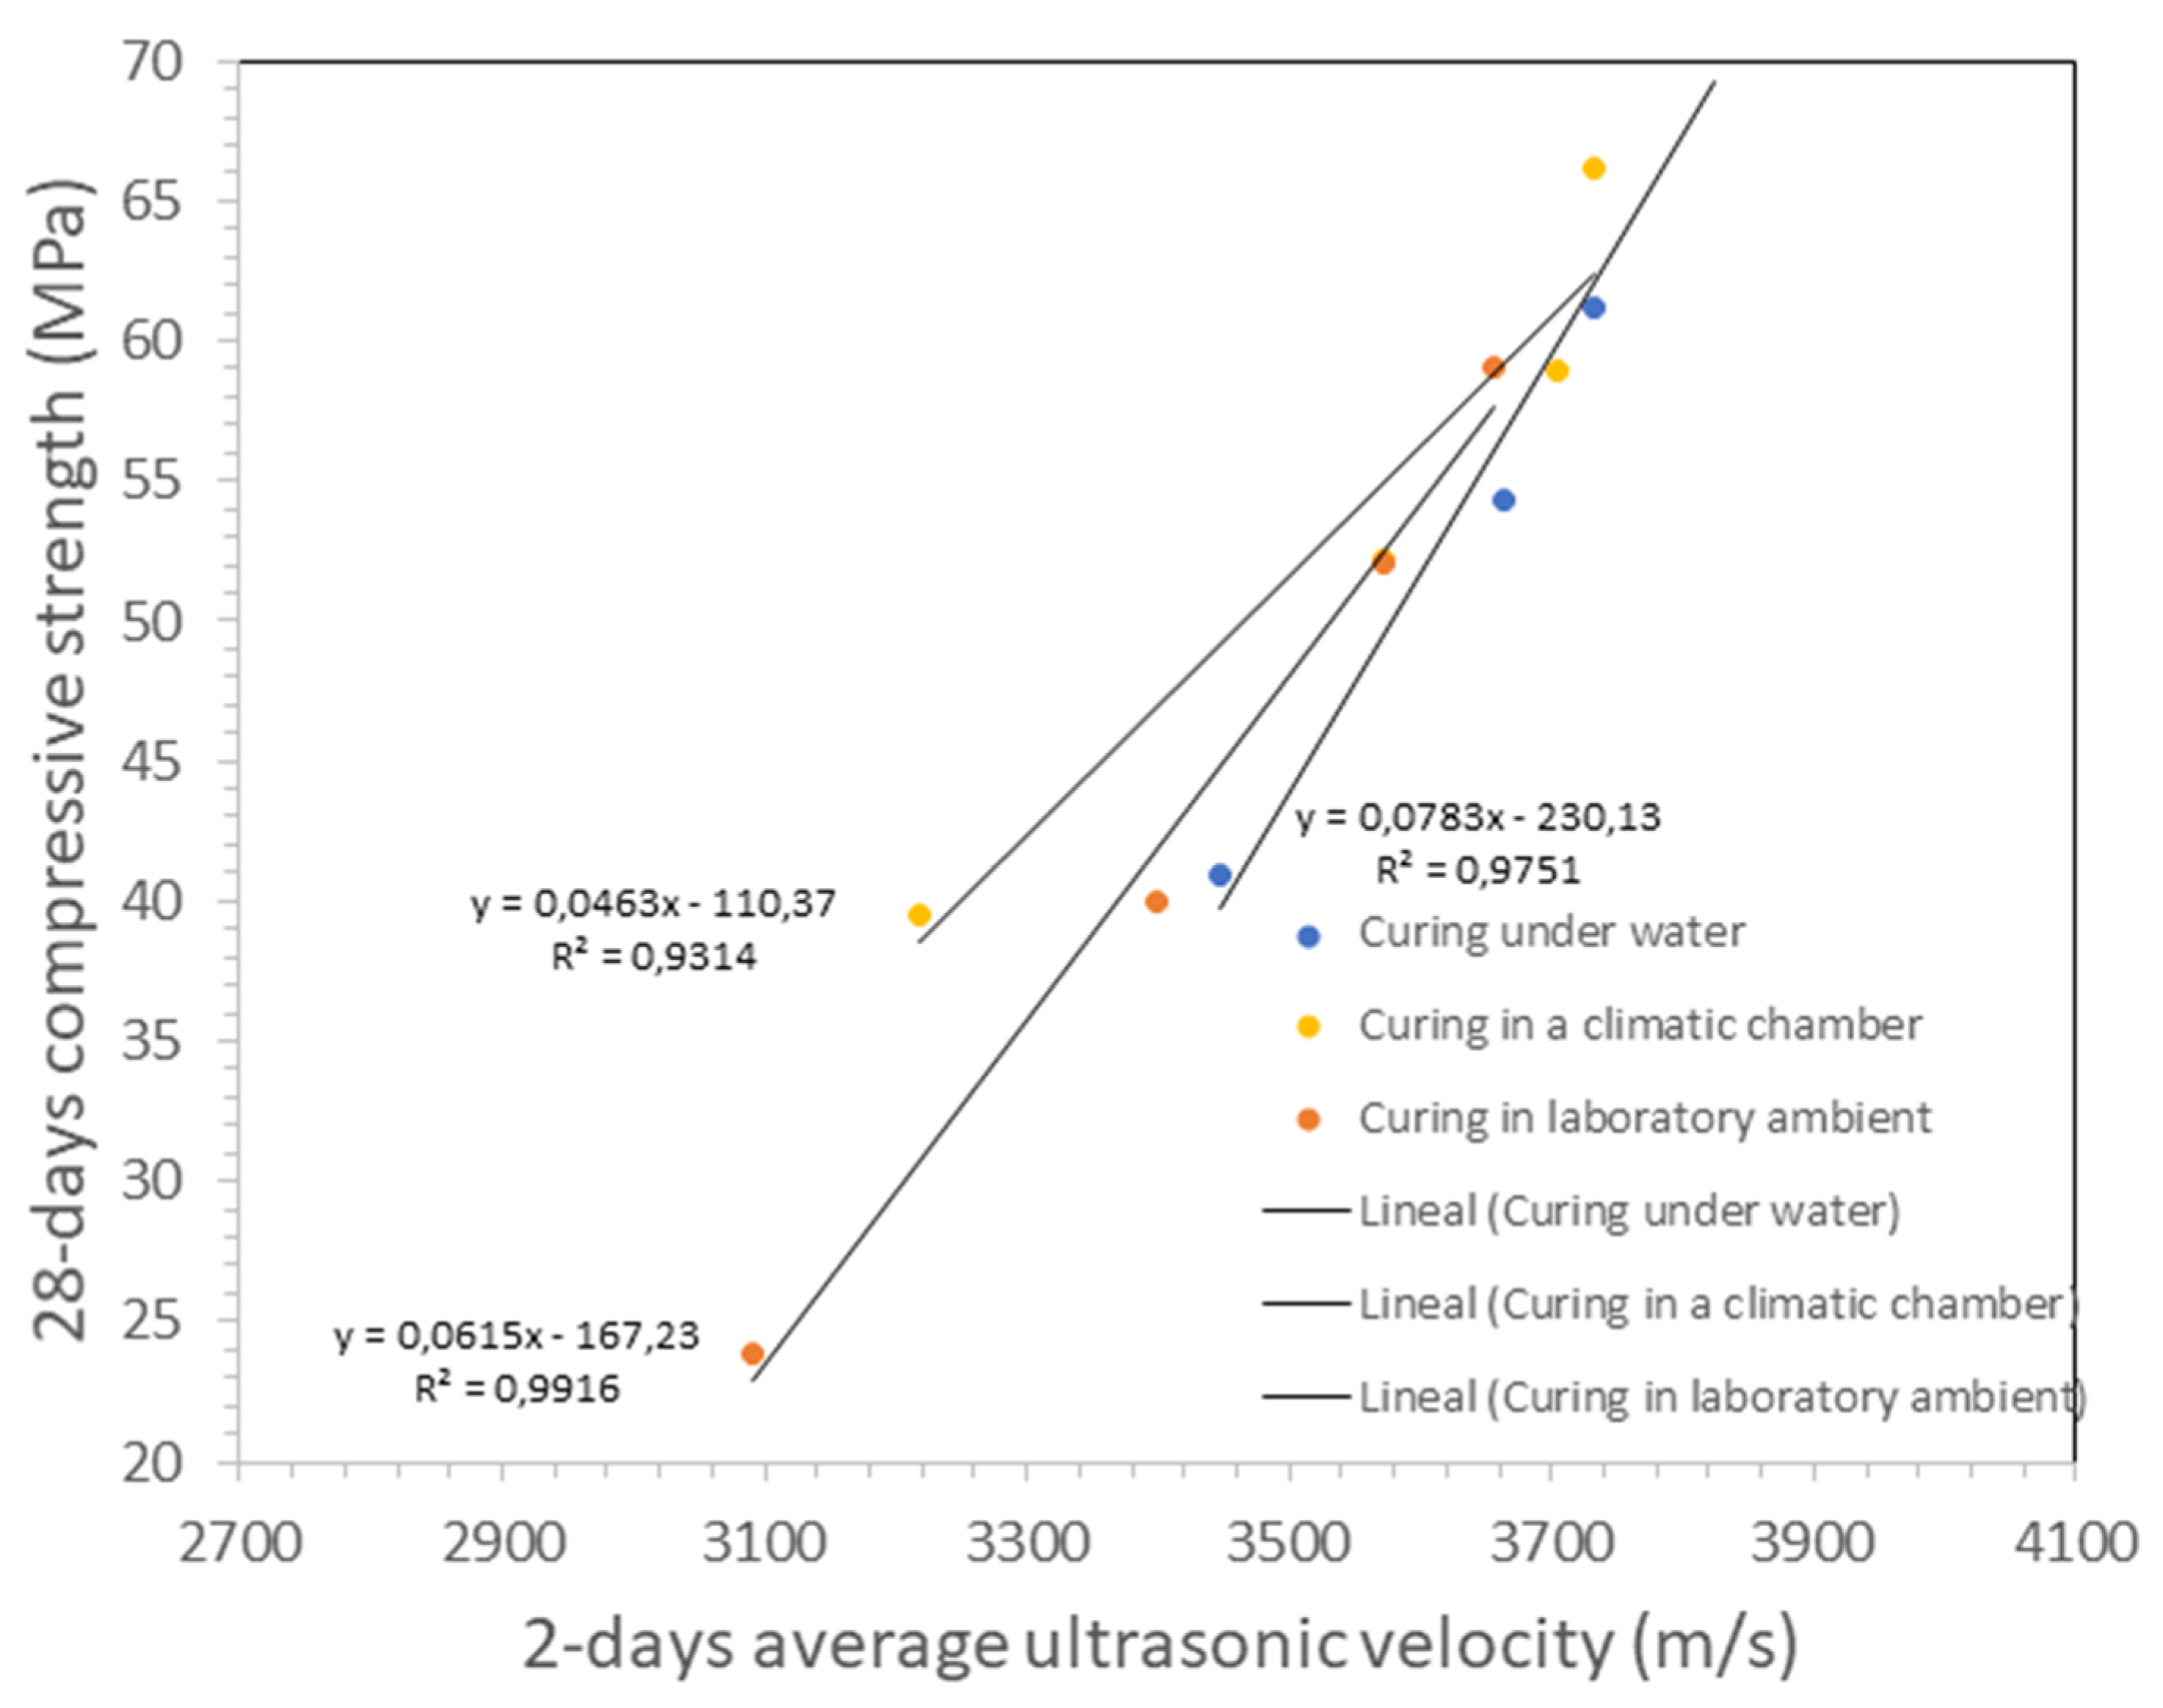
Figure 4.
Linear relations between UPV values measured at 2 days and 28-day compressive strength of Portland mortar specimens cured under water.
Figure 4.
Linear relations between UPV values measured at 2 days and 28-day compressive strength of Portland mortar specimens cured under water.

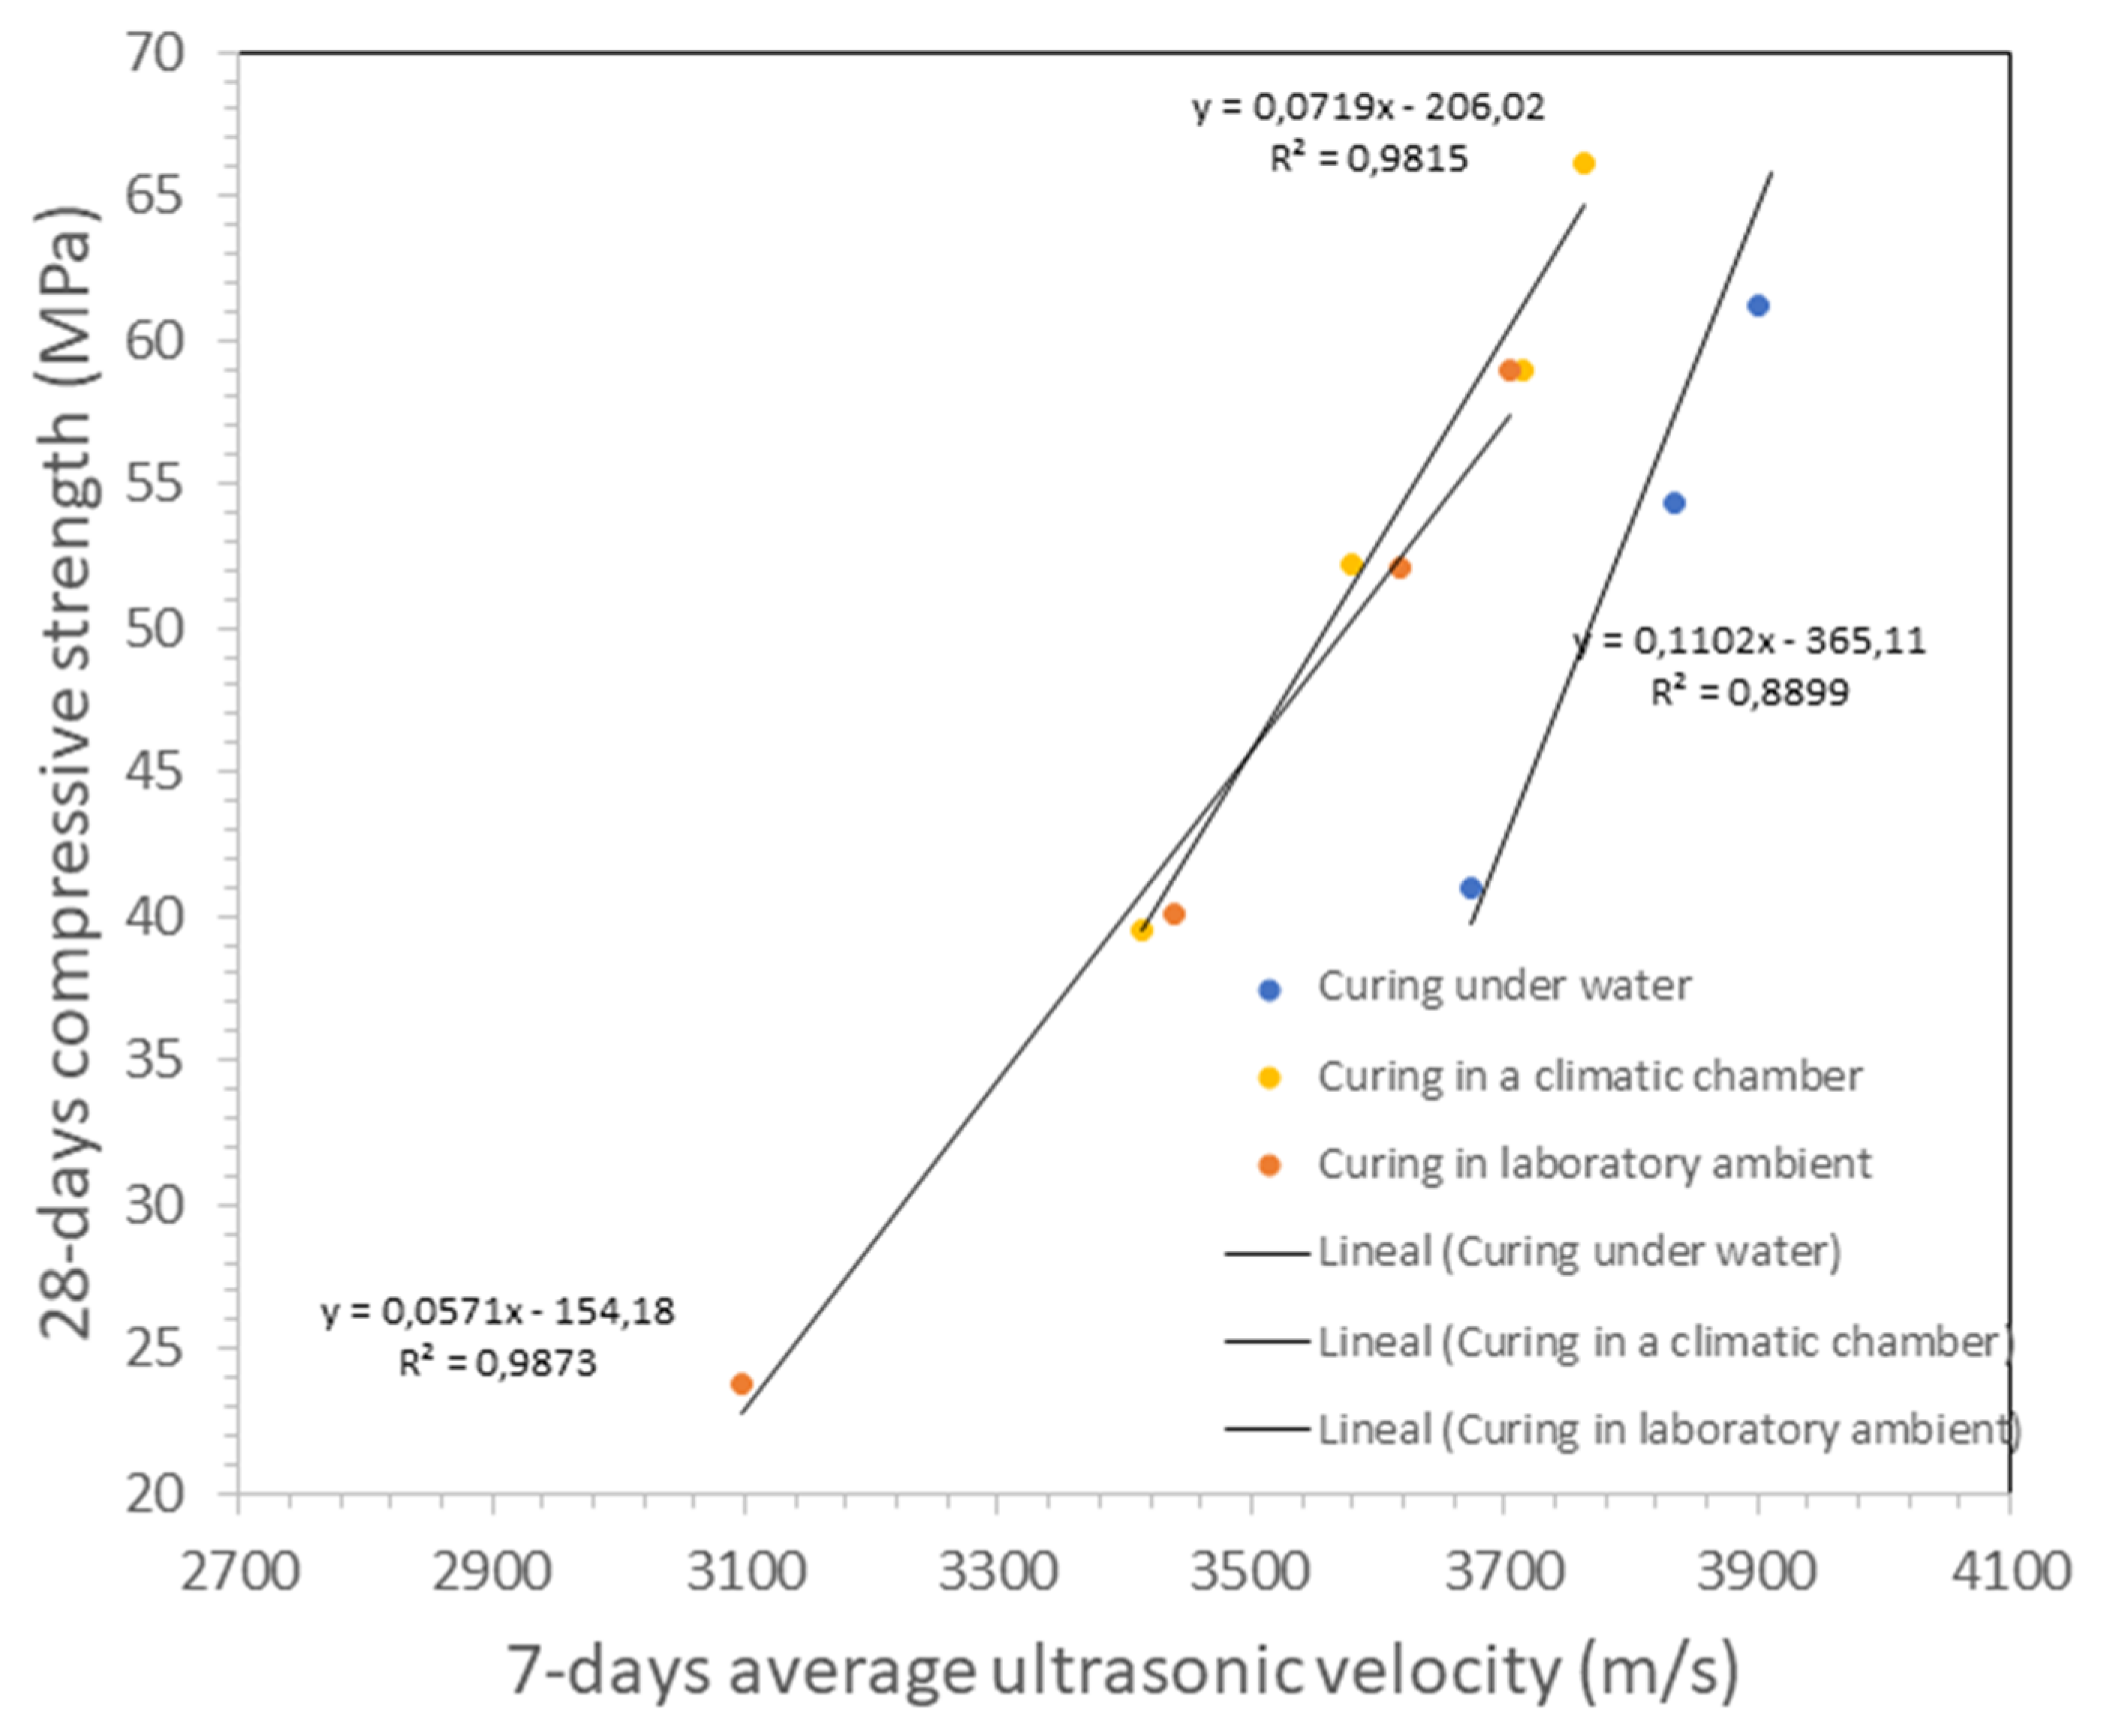
Figure 5.
Linear relations between UPV values measured at 7 days and 28-day compressive strength of Portland mortar specimens cured under water.
Figure 5.
Linear relations between UPV values measured at 7 days and 28-day compressive strength of Portland mortar specimens cured under water.

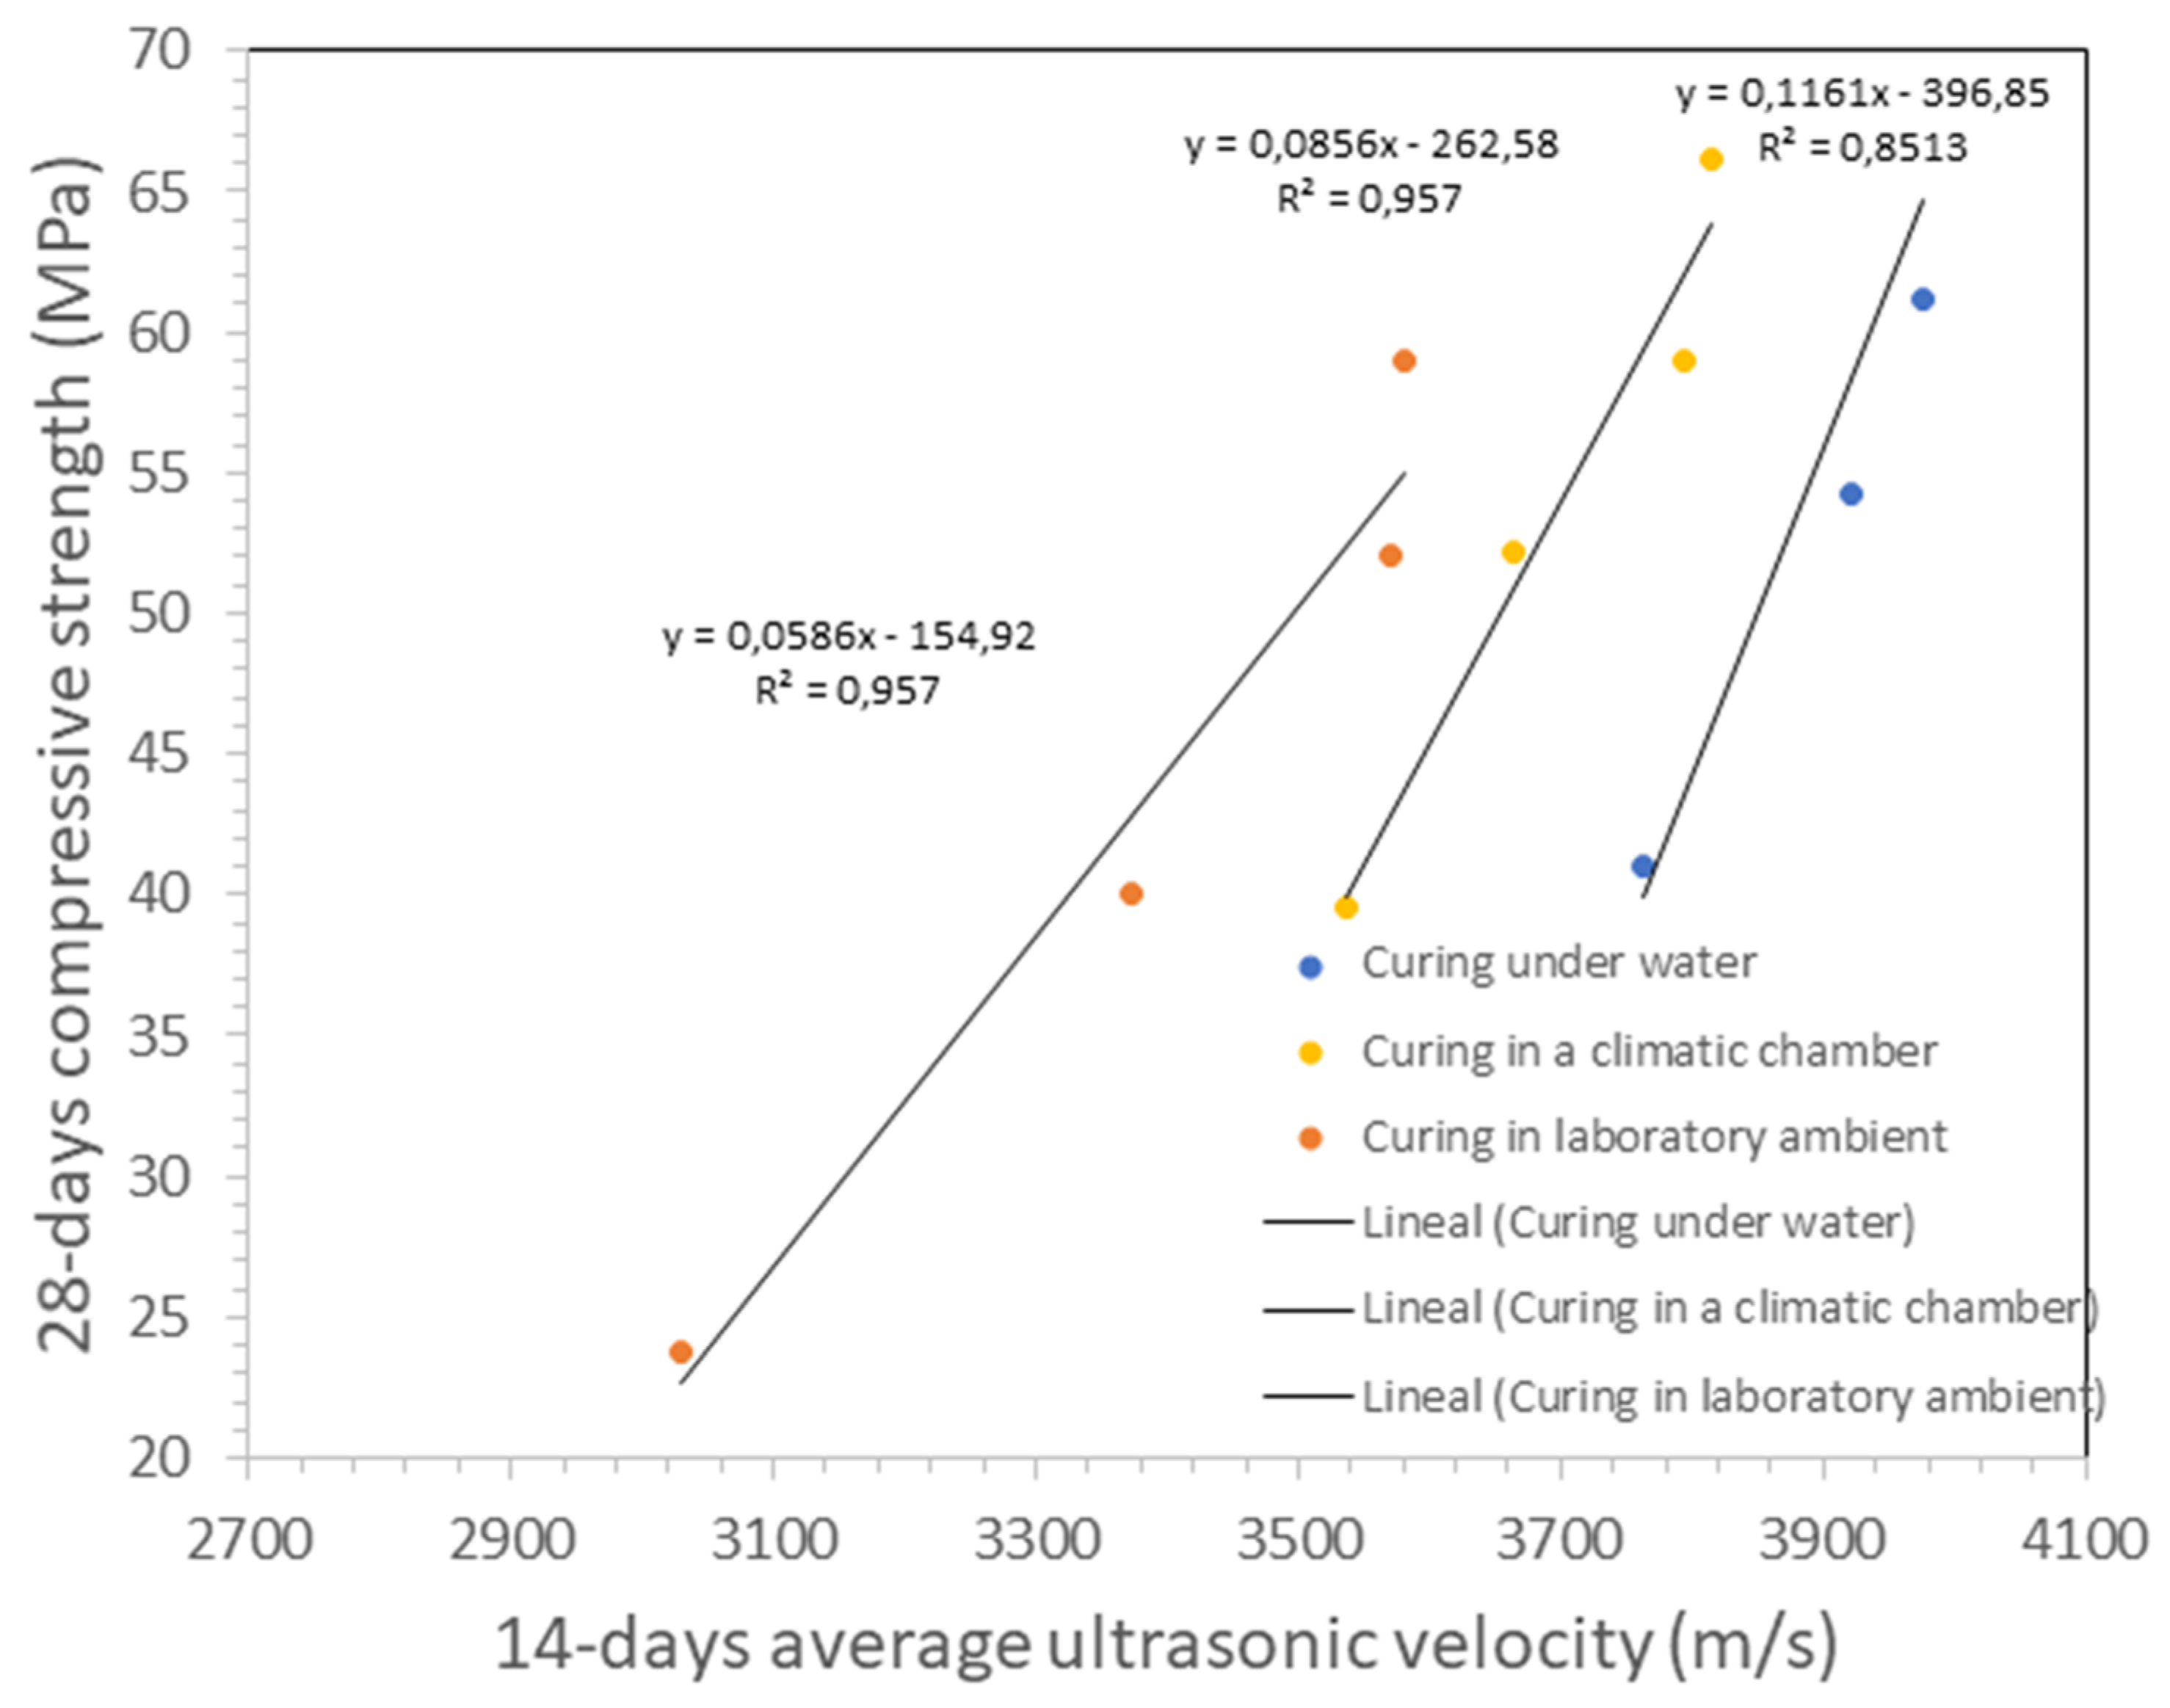
Figure 6.
Linear relations between UPV values measured at 14 days and 28-day compressive strength of Portland mortar specimens cured under water.
Figure 6.
Linear relations between UPV values measured at 14 days and 28-day compressive strength of Portland mortar specimens cured under water.

Figure 7.
Linear relations between UPV values measured at 28 days and 28-day compressive strength of Portland mortar specimens cured under water.
Figure 7.
Linear relations between UPV values measured at 28 days and 28-day compressive strength of Portland mortar specimens cured under water.

Figure 8.
Comparison between 28-day compressive strength calculated by Equation (3) and the actual values.
Figure 8.
Comparison between 28-day compressive strength calculated by Equation (3) and the actual values.


Table 1.
Chemical composition of the four cements considered in the present research work.
| Cement Type | CaO | SiO2 | Fe2O3 | Al2O3 | MgO | SO3 | Na2O | K2O | Ti2O5 | P2O5 | LOI | IR1 | Cl− |
|---|---|---|---|---|---|---|---|---|---|---|---|---|---|
| CEM I 52.5 R | 62.7 | 20.9 | 3.5 | 4.3 | 1.9 | 3.4 | 0.30 | 0.90 | 0.25 | 0.10 | 3.7 | 1.04 | 0.02 |
| CEM I 42.5 R | 59.9 | 22.2 | 3.9 | 5.3 | 1.9 | 3.3 | 0.32 | 1.02 | 0.24 | 0.10 | 2.2 | 0.90 | 0.03 |
| CEM II/A-V 42.5 R | 51.8 | 24.9 | 4.6 | 7.8 | 1.8 | 2.8 | 0.35 | 1.27 | 0.20 | 0.08 | - | - | 0.03 |
| CEM II/B-V 32.5 R | 43.8 | 28.0 | 5.5 | 10.4 | 1.8 | 2.4 | 0.38 | 1.56 | 0.17 | 0.07 | - | - | 0.02 |
1 Insoluble residue measured using the Na2CO3 method [42].
Table 2.
Mechanical characteristics of the cements used in this work (N/mm2).
| Cement Type | 2 Days | 28 Days | ||||||
|---|---|---|---|---|---|---|---|---|
| FS | SD | CS | SD | FS | SD | CS | SD | |
| CEM I 52.5 R | 9.5 ± 0.3 | 0.3 | 49.1 ± 1.2 | 1.5 | 10.3 ± 0.6 | 0.5 | 67.5 ± 1.5 | 1.8 |
| CEM I 42.5 R | 6.9 ± 0.4 | 0.3 | 35.4 ± 0.8 | 0.9 | 9.9 ± 0.4 | 0.3 | 57.6 ± 1.1 | 1.3 |
| CEM II/A-V 42.5 R | 6.7 ± 0.6 | 0.5 | 32.1 ± 0.2 | 0.2 | 9.5 ± 0.8 | 0.7 | 55.4 ± 1.9 | 2.4 |
| CEM II/B-V 32.5 R | 4.1 ± 0.2 | 0.1 | 18.1 ± 0.3 | 0.4 | 8.4 ± 0.3 | 0.3 | 39.5 ± 0.6 | 0.8 |
Abbreviations: FS = Flexural strength; CS = Compressive strength; SD = Standard deviation.
Table 3.
Average ultrasonic velocity of the mortar specimens at 28 days for each cement type and curing condition.
Table 3.
Average ultrasonic velocity of the mortar specimens at 28 days for each cement type and curing condition.
| Cement Type | Average Ultrasonic Velocity (m/s) | ||||
|---|---|---|---|---|---|
| Under Water UPV (m/s) | 95% RH UPV (m/s) | Difference (95% RH- Water) % | 50% RH UPV (m/s) | Difference (50% RH- Water) % | |
| CEM I 52.5 R | 3977 ± 33 | 3704 ± 50 | −7 | 3535 ± 27 | −11 |
| CEM I 42.5 R | 3966 ± 15 | 3665 ± 30 | −8 | 3357 ± 13 | −15 |
| CEM II/A-V 42.5 R | 3922 ± 15 | 3618 ± 36 | −8 | 3160 ± 37 | −19 |
| CEM II/B-V 32.5 R | 3763 ± 48 | 3440 ± 61 | −9 | 2954 ± 13 | −22 |
Table 4.
Typical ultrasonic pulse velocity values to assess the quality of Portland cement mortars.
| Mortar Quality | Excellent | Good | Poor | Very Poor |
|---|---|---|---|---|
| UPV (m/s) | >3800 | 3800–3500 | 3500–3200 | <3200 |
Table 5.
Fitting parameters with regard to the correlation between the ultrasonic pulse velocity (UPV) and compressive strength of the mortar specimens at 28 days, for each cement type and curing condition (R= a + b × V).
Table 5.
Fitting parameters with regard to the correlation between the ultrasonic pulse velocity (UPV) and compressive strength of the mortar specimens at 28 days, for each cement type and curing condition (R= a + b × V).
| Fitting Parameters | |||||||||
|---|---|---|---|---|---|---|---|---|---|
| Under Water | 95% RH | 50% RH | |||||||
| a | b | R2 | a | b | R 2 | a | b | R 2 | |
| 28-days average ultrasonic velocity (m/s) | −412.2 | 0.120 | 0.87 | −287.7 | 0.0948 | 0.95 | −154.2 | 0.0609 | 0.98 |
| 14-days average ultrasonic velocity (m/s) | −396.9 | 0.1161 | 0.85 | −262.6 | 0.0856 | 0.96 | −154.9 | 0.0586 | 0.96 |
| 7-days average ultrasonic velocity (m/s) | −365.1 | 0.1102 | 0.89 | −206.0 | 0.0719 | 0.98 | −154.2 | 0.0571 | 0.9873 |
| 2-days average ultrasonic velocity (m/s) | −230.1 | 0.0783 | 0.98 | −110.4 | 0.0463 | 0.93 | −167.2 | 0.0615 | 0.99 |
| 1-day average ultrasonic velocity (m/s) | −93.3 | 0.0448 | 0.93 | −62.2 | 0.0355 | 0.96 | −85.39 | 0.0405 | 0.98 |
Table 6.
Fitting parameters with regard to the correlation between the ultrasonic pulse velocity (UPV) and compressive strength of the mortar specimens at 28 days, for each cement type and curing condition (R = a × e b × V).
Table 6.
Fitting parameters with regard to the correlation between the ultrasonic pulse velocity (UPV) and compressive strength of the mortar specimens at 28 days, for each cement type and curing condition (R = a × e b × V).
| Fitting Parameters | |||||||||
|---|---|---|---|---|---|---|---|---|---|
| Under Water | 95% RH | 50% RH | |||||||
| a | b | R 2 | a | b | R 2 | a | b | R 2 | |
| 28-days average ultrasonic velocity (m/s) | 0.0076 | 0.0023 | 0.92 | 0.0609 | 0.0019 | 0.98 | 0.2671 | 0.0016 | 0.94 |
| 14-days average ultrasonic velocity (m/s) | 0.0100 | 0.0022 | 0.91 | 0.1079 | 0.0017 | 0.96 | 0.2142 | 0.0016 | 0.99 |
| 7-days average ultrasonic velocity (m/s) | 0.0192 | 0.0021 | 0.94 | 0.3286 | 0.0014 | 0.98 | 0.2292 | 0.0015 | 0.99 |
| 2-days average ultrasonic velocity (m/s) | 0.2676 | 0.0015 | 0.99 | 2.0241 | 0.0009 | 0.96 | 0.1651 | 0.0016 | 0.99 |
| 1-day average ultrasonic velocity (m/s) | 3.3263 | 0.0008 | 0.97 | 5.3544 | 0.0007 | 0.98 | 1.3707 | 0.0011 | 0.99 |
© 2020 by the authors. Licensee MDPI, Basel, Switzerland. This article is an open access article distributed under the terms and conditions of the Creative Commons Attribution (CC BY) license (http://creativecommons.org/licenses/by/4.0/).
Share and Cite
MDPI and ACS Style
Estévez, E.; Martín, D.A.; Argiz, C.; Sanjuán, M.Á. Ultrasonic Pulse Velocity—Compressive Strength Relationship for Portland Cement Mortars Cured at Different Conditions. Crystals 2020, 10, 133. https://doi.org/10.3390/cryst10020133
AMA Style
Estévez E, Martín DA, Argiz C, Sanjuán MÁ. Ultrasonic Pulse Velocity—Compressive Strength Relationship for Portland Cement Mortars Cured at Different Conditions. Crystals. 2020; 10(2):133. https://doi.org/10.3390/cryst10020133
Chicago/Turabian StyleEstévez, Esteban, Domingo Alfonso Martín, Cristina Argiz, and Miguel Ángel Sanjuán. 2020. "Ultrasonic Pulse Velocity—Compressive Strength Relationship for Portland Cement Mortars Cured at Different Conditions" Crystals 10, no. 2: 133. https://doi.org/10.3390/cryst10020133
Note that from the first issue of 2016, this journal uses article numbers instead of page numbers. See further details here.