Article

Ethanolic Extract of Hippocampus abdominalis Exerts Anti-Melanogenic Effects in B16F10 Melanoma Cells and Zebrafish Larvae by Activating the ERK Signaling Pathway

1
Department of Marine Life Science, Jeju National University, Jeju 63243, Korea
2
Department of Biochemistry, College of Oriental Medicine, Dong-Eui University, Busan 47227, Korea
3
Nerina Co., Seonghwa-ro 9-gil, Jeju-si, Jeju 63158, Korea
*
Authors to whom correspondence should be addressed.
Cosmetics 2020, 7(1), 1; https://doi.org/10.3390/cosmetics7010001
Submission received: 27 November 2019 / Revised: 16 December 2019 / Accepted: 16 December 2019 / Published: 18 December 2019

Abstract

:
The big belly seahorse (Hippocampus abdominalis), a well-known ingredient of traditional medicine, possesses anti-inflammatory, anti-aging, anti-fatigue, and anti-thrombotic properties, and also increases male fertility. This study demonstrates that the ethanolic extract of dried H. abdominalis (EEHA) has anti-melanogenic effects in B16F10 melanoma cells and zebrafish larvae. EEHA significantly reduced the α-melanocyte-stimulating hormone (α-MSH)-induced melanogenesis in B16F10 melanoma cells without causing cytotoxicity. At a concentration of 200 µg/mL, EEHA had significant anti-melanogenic activity in zebrafish larvae, accompanied by a severe reduction in the heart rate (118 ± 17 heartbeats/min) compared to that of the untreated group (185 ± 8 heartbeats/min), indicating that EEHA induces cardiotoxicity at high concentrations. Below 100 µg/mL, EEHA significantly reduced melanogenesis in zebrafish larvae in the presence or absence of α-MSH, while the heart rate remained unaltered. Additionally, EEHA downregulated the release of cyclic adenosine monophosphate (cAMP) and the phosphorylation of cAMP response element-binding protein (CREB) in B16F10 melanoma cells, which inhibited microphthalmia-associated transcription factor (MITF), leading to the inhibition of tyrosinase activity. EEHA also increased the phosphorylation of extracellular-signal regulated kinase (ERK). The ERK inhibitor PD98059 interfered with the anti-melanogenic activity of EEHA in B16F10 melanoma cells and zebrafish larvae, indicating that the ERK signaling pathway might regulate the anti-melanogenic properties of EEHA. Altogether, we conclude that EEHA represses the cAMP–CREB–MITF axis, which consequently inhibits tyrosinase-mediated melanogenesis. We propose that at low concentrations, EEHA can serve as a promising anti-melanogenic agent that could be used to prepare whitening cosmetics and for treating melanogenic disorders.

1. Introduction

The primary biological function of synthesized melanin is to protect the skin from ultraviolet (UV) radiation and reactive free radicals [1]. However, an abnormally high production and/or accumulation of melanin in the skin leads to undesirable dermatological disorders, including melasma, freckles, and senile lentigines [2,3]. Therefore, the downregulation of melanogenesis is a promising strategy for curing hyperpigmentation disorders and for preparing whitening cosmetics.
Melanogenesis involves multiple signaling pathways that are initiated by the binding of α-melanocyte-stimulating hormone (α-MSH) to its specific G-protein couple receptor (GPCR), melanocortin 1 receptor (MC1R), in melanocytes [4]. The binding of α-MSH to MC1R stimulates adenylyl cyclase, which converts adenosine triphosphate (ATP) to the second messenger, cyclic adenosine monophosphate (cAMP), which in turn, phosphorylates cAMP response element-binding protein (CREB) through protein kinase A [4,5]. Eventually, α-MSH leads to melanin biosynthesis by upregulating microphthalmia-associated transcription factor (MITF), which activates tyrosinase, a key copper-containing enzyme that catalyzes the two rate-limiting steps of melanogenesis, namely, the hydroxylation of tyrosine to 3,4-dihydroxyphenylalanine (l-DOPA), and the oxidation of l-DOPA to dopaquinone [6]. Depigmentary bioactive compounds have therefore been used for several decades for targeting and inhibiting tyrosinase [7]. It has been recently identified that proteins belonging to the mitogen-activated protein kinase (MAPK) family, extracellular signal-regulated kinase (ERK), c-Jun N-terminal kinase (JNK), and p38 MAPK, regulate melanogenesis by modulating the expression of tyrosinase. The phosphorylation of ERK and JNK has been found to induce the degradation of MITF that is mediated by ubiquitination, which subsequently inhibits the expression of tyrosinase, thereby inducing anti-melanogenesis. On the other hand, the phosphorylation of p38 MAPK enhances melanogenesis by activating tyrosinase via MITF [8]. Numerous inhibitors of p38 MAPK and/or activators that target ERK and JNK have, therefore, been developed as anti-melanogenic agents.
Seahorse (Hippocampus spp.) is a teleost belonging to the Synganthidae family, which is used in traditional medicine, and also in health products and traditional drugs due to its potential biological activities [9]. Dried seahorse has been used to improve sexual function, especially for the treatment of erectile dysfunction in male individuals [10]. According to modern scientific researches, the pharmaceutical properties of seahorse extract include anti-microbial [11], anti-aging [12], and anti-fatigue [13] activities. Currently, H. abdominalis is largely cultivated in New Zealand, South-Eastern Australia [14], and South Korea. Nevertheless, the biological activities of H. abdominalis have rarely been studied. Therefore, in this study, we evaluate whether an ethanolic extract of H. abdominalis (EEHA) has anti-melanogenic effects in B16F10 melanoma cells and zebrafish larvae. The results of our study demonstrated that EEHA has a potent anti-melanogenic property that is mediated via the inhibition of the cAMP signaling pathway and activation of the ERK signaling pathway.

2. Materials and Methods

2.1. Reagents and Antibodies

H. abdominalis was artificially cultured and supplied from Nerina Co. (Jeju, Korea). Mushroom tyrosinase, phenylthiourea (PTU), α-MSH, and 3-isoburyl-1-methylxanthine (IBMX) were purchased from Sigma-Aldrich Chemical Co. (St. Louis, MO, USA). Dulbecco’s modified Eagle medium (DMEM), fetal bovine serum (FBS), and antibiotic mixture were purchased from WELGENE (Gyeongsan, Gyeongsangbuk-do, Korea). Antibodies against phospho (p)-CREB, MITF, tyrosinase, p-ERK1/2, ERK1/2, p-JNK, JNK, p-p38, p38, and β-actin were purchased from Santa Cruz Biotechnology (Santa Cruz, CA, USA). Peroxidase-labeled anti-rabbit and anti-mouse immunoglobulins were obtained from KOMA Biotechnology (Seoul, Korea). All other chemicals were purchased as Sigma grades.

2.2. Preparation and Compositional Analysis of EEHA

The pulverized H. abdominalis (23 g) was extracted three times with 60% ethanol (approximately 230 mL) at 60 °C for 2 h. EEHA was filtered, concentrated, and lyophilized (Eyela, model FDU-1200; Tokyo, Japan) (yield: 26.9%). For the biological assays, EEHA was dissolved in deionized water. Protein content was measured using automatic Kjeltec analyzer unit 2300 (Foss Teor, Hoganas, Sweden), and lipid was calculated according to the standard procedure [15]. Ash was determined after combustion at 550 °C for 4 h in a muffle furnace. Carbohydrate was measured by a phenol-sulfuric acid method [16].

2.3. Cell Culture

B16F10 melanoma cells were obtained from American Type Culture Collection (ATCC; Manassas, VA, USA). The cells were cultured at 37 °C in a 5% CO2 humidified incubator in DMEM supplemented with 10% heat-inactivated FBS and antibiotic mixture.

2.4. Cell Viability

B16F10 melanoma cells were seeded at a density of 5 × 10⁴ cells/mL in 24-well plates and then treated with EEHA (0–4 mg/mL) for 72 h. MTT (0.5 mg/mL) solution was added to each well for 1 h at 37 °C. Following the media removal, DMSO was added to each well and gently shaken for 10 min at room temperature. Dissolved formazan was transferred into a 96-well plate and the absorbance was detected at 540 nm. In a parallel experiment, cell images were captured by a phase-contrast microscope (Ezscope i900PH, MACROTECH; Goyang, Gyeonggi-do, Korea).

2.5. Flow Cytometry Analysis

Cell viability and the population of dead cells were measured using flow cytometry (EMD Millipore Co., Billerica, MA, USA). Briefly, B16F10 melanoma cells were cultured at a density of 5 × 10⁴ cells/mL in 6-well plates overnight and incubated with EEHA at the indicated concentrations (0–1000 μg/mL) for 72 h. After harvesting, the cells were washed with ice-cold phosphate-buffered saline (PBS) and incubated with Muse® cell count and viability kit (EMD Millipore Co.) for 5 min. Cell viability and the population of dead cells were analyzed by Muse® cell cycler (EMD Millipore Co.).

2.6. Measurement of Extracellular and Intracellular Melain Content

B16F10 melanoma cells were treated with EEHA at the indicated concentrations (0–200 μg/mL), and extracellular and intracellular melanin contents were measured [17]. Briefly, B16F10 melanoma cells were cultured at a density of 5 × 10⁴ cells/mL in 6-well plates overnight. Then, EEHA was treated in the presence or absence of 500 ng/mL α-MSH for 72 h, and the culture media and cell pellets were collected. The absorbance of culture media was measured at 405 nm for extracellular melanin content. The cell pellets were washed with ice-cold PBS, dissolved in 400 µL of 1 M NaOH containing 10% DMSO at 90 °C for 60 min, and then the absorbance at 405 nm was measured for intracellular melanin content.

2.7. Measurement of Tyrosinase Activity

Tyrosinase activity was measured with the standard procedure [18]. Briefly, B16F10 melanoma cells were plated at a density of 5 × 10⁴ cells/mL and treated with EEHA in the presence or absence of α-MSH for 72 h. Cell pellets were collected, washed with PBS, and lysed with PBS containing 1% Triton X-100. The pellet solution was vortexed for 5 min, frozen at −20 °C for 2 h, and disrupted by thawing at room temperature. The lysate (10 µL) was mixed with 90 µL of 5 mM l-DOPA at 37 °C for 30 min and the absorbance at 405 nm was measured. Additionally, cellular staining of intracellular tyrosinase was performed according to the previously described method [19]. Briefly, B16F10 melanoma cells (5 × 10⁴ cells/mL) were attached in 3% gelatin-coated cover slips and allowed to grow overnight. EEHA was treated in the presence or absence of α-MSH for 72 h. The cells were washed with ice-cold PBS and fixed with 4% paraformaldehyde for 30 min. Then, the cells were incubated with freshly prepared 0.1% l-DOPA in 1× PBS with 20 μM copper sulphate (cofactor of tyrosinase) at 37 °C for 2 h. The solution was removed and images were taken by a phase contrast microscope (Ezscope i900PH).

2.8. cAMP Assay

B16F10 melanoma cells were cultured in serum-free media at a density of 5 × 10⁴ cells/mL in 6-well plates overnight. Then, 1 mM IBMX, competitive nonselective phosphodiesterase inhibitor, which inhibits the degradation of intracellular cAMP, was treated for 10 min prior to incubating with EEHA at the indicated concentrations (0–200 μg/mL) in the presence or absence of α-MSH for 15 min. Intracellular cAMP levels were measured by colorimetric ELISA kit (Cell Biolabs Inc., San Diego, CA, USA) according to the manufacturer’s instructions. Briefly, B16F10 melanoma cells were lysed with lysis buffer (Cell Biolabs Inc.) for 20 min at 4 °C and supernatants were collected. After normalizing the protein concentrations using Bradford protein assay (Bio-Rad, Hercules, CA, USA), protein lysates were used to perform ELISA. Finally, the absorbance at 450 nm was measured. The amount of cAMP was calculated based on the standard curve.

2.9. Reverse Transcription Polymerase Chain Reaction (RT-PCR)

B16F10 melanoma cells were cultured at a density of 5 × 10⁴ cells/mL in 6-well plates overnight. Then, the indicated concentrations of EEHA were treated in the presence or absence of α-MSH for 48 h. Total RNA was extracted using TRIzol® Reagent (Life Technologies, Carlsband, CA, USA) according to the manufacturer’s instruction. RNA was reverse-transcribed using MMLV reverse transcriptase (Bioneer, Daejeon, Korea). The cDNA was amplified using EzWay PCR ready mix (KOMA Biotechnology) with specific primers of MITF (forward 5′-CCC GTC TCT GGA AAC TTG ATC G-3′ and reverse 5′-CTG TAC TCT GAG CAG CAG GTC-3′), tyrosinase (forward 5′-GTC GTC ACC CTG AAA ATC CTA ACT-3′ and reverse 5′-CAT CGC ATA AAA CCT GAT GGC′) and GAPDH (forward 5′-AGG TCG GTG TGA ACG GAT TTG-3′ and reverse 5′-TGT AGA CCA TGT AGT TGA GGT CA-3′). The following PCR conditions were applied for PCR amplification: tyrosinase and MITF: 25 cycles of denaturation at 95 °C for 45 s, annealing at 62 °C for 45 s and extended at 72 °C for 1 min; GAPDH 23 cycles of denaturation at 94 °C for 30 s, annealing at 60 °C for 30 s, and extended at 72 °C for 30 s. GAPDH was used as an internal control to evaluate the relative expression of MITF and tyrosinase.

2.10. Protein Extraction and Western Blot Analysis

B16F10 melanoma cells were cultured at a density of 5 × 10⁴ cells/mL in 6-well plates overnight. Then, the cells were treated with the indicated concentrations of EEHA for 72 h and lysed with RIPA lysis buffer (iNtRON Biotechnology, Sungnam, Gyeonggi-do, Korea). After cleaning lysates by centrifugation, the protein was quantified by Bio-Rad protein assay reagents (Bio-Rad). An equal amount of protein was separated by SDS-polyacrylamide gel, transferred onto a polyvinylidene fluoride (PVDF) membrane (Amersham, Arlington Heights, IL, USA), and then immunoblotted with the indicated antibodies. Protein expression was monitored using SuperSignal West Femto Maximum Sensitivity substrate (Pierce, Rockford, IL, USA). The expression value was normalized to the intensity level of β-actin.

2.11. Anti-Melanogenic Effect in Zebrafish Larvae

Zebrafish were raised and handled according to standard guidelines of the Animal Care and Use Committee of Jeju National University (Jeju, Korea). Inbreed AB strain of zebrafish was mated and eggs were collected. The eggs were kept in E3 embryo media (34.8 g NaCl, 1.6 g KCl, 5.8 g CaCl2·2H2O, and 9.78 g MgCl2·6H2O in 1 L distilled water, pH 7.2) supplemented with 1% methylene blue for 48 h and treated with 200 nM PTU containing E3 media for another 24 h. The larvae at three days post-fertilization (dpf) were treated with EEHA at the indicated concentrations in the presence or absence of α-MSH for 72 h. Images were captured by a stereomicroscope (Olympus SZ2-ILST, Tokyo, Japan) and the heart rate was also measured to evaluate cardiotoxicity of EEHA.

2.12. Statistical Analysis

The images for RT-PCR and Western blots were visualized by Chemi-Smart 2000 (Vilber Lourmat, Marne-la-Vallee, France). Each image was captured using Chemi-Capt (Vilber Lourmat) and transported into Adobe Photoshop (version 8.0). All images were quantified by Image J software (Wayne Rasband, National Institute of Health, Bethesda, VA, USA) and then statistically analyzed by SigmaPlot 12.0. All data are presented as mean ± standard error median (SEM). Significant differences between groups were determined using an unpaired one-way ANOVA test with Bonferroni correction. Values of *** and ### p < 0.001, ** and ## p < 0.01, and * and # p < 0.05 were considered to indicate statistical significance.

3. Results

3.1. Compositional Analysis of EEHA

The compositional analysis of EEHA revealed that protein was the main component (81.8% ± 1.2%) of EEHA, while the rest comprised ash (12.2% ± 0.2%), carbohydrate (4.6% ± 1.2%), and lipid (3.5% ± 0.2%) (Table 1), indicating that EEHA is rich in protein.

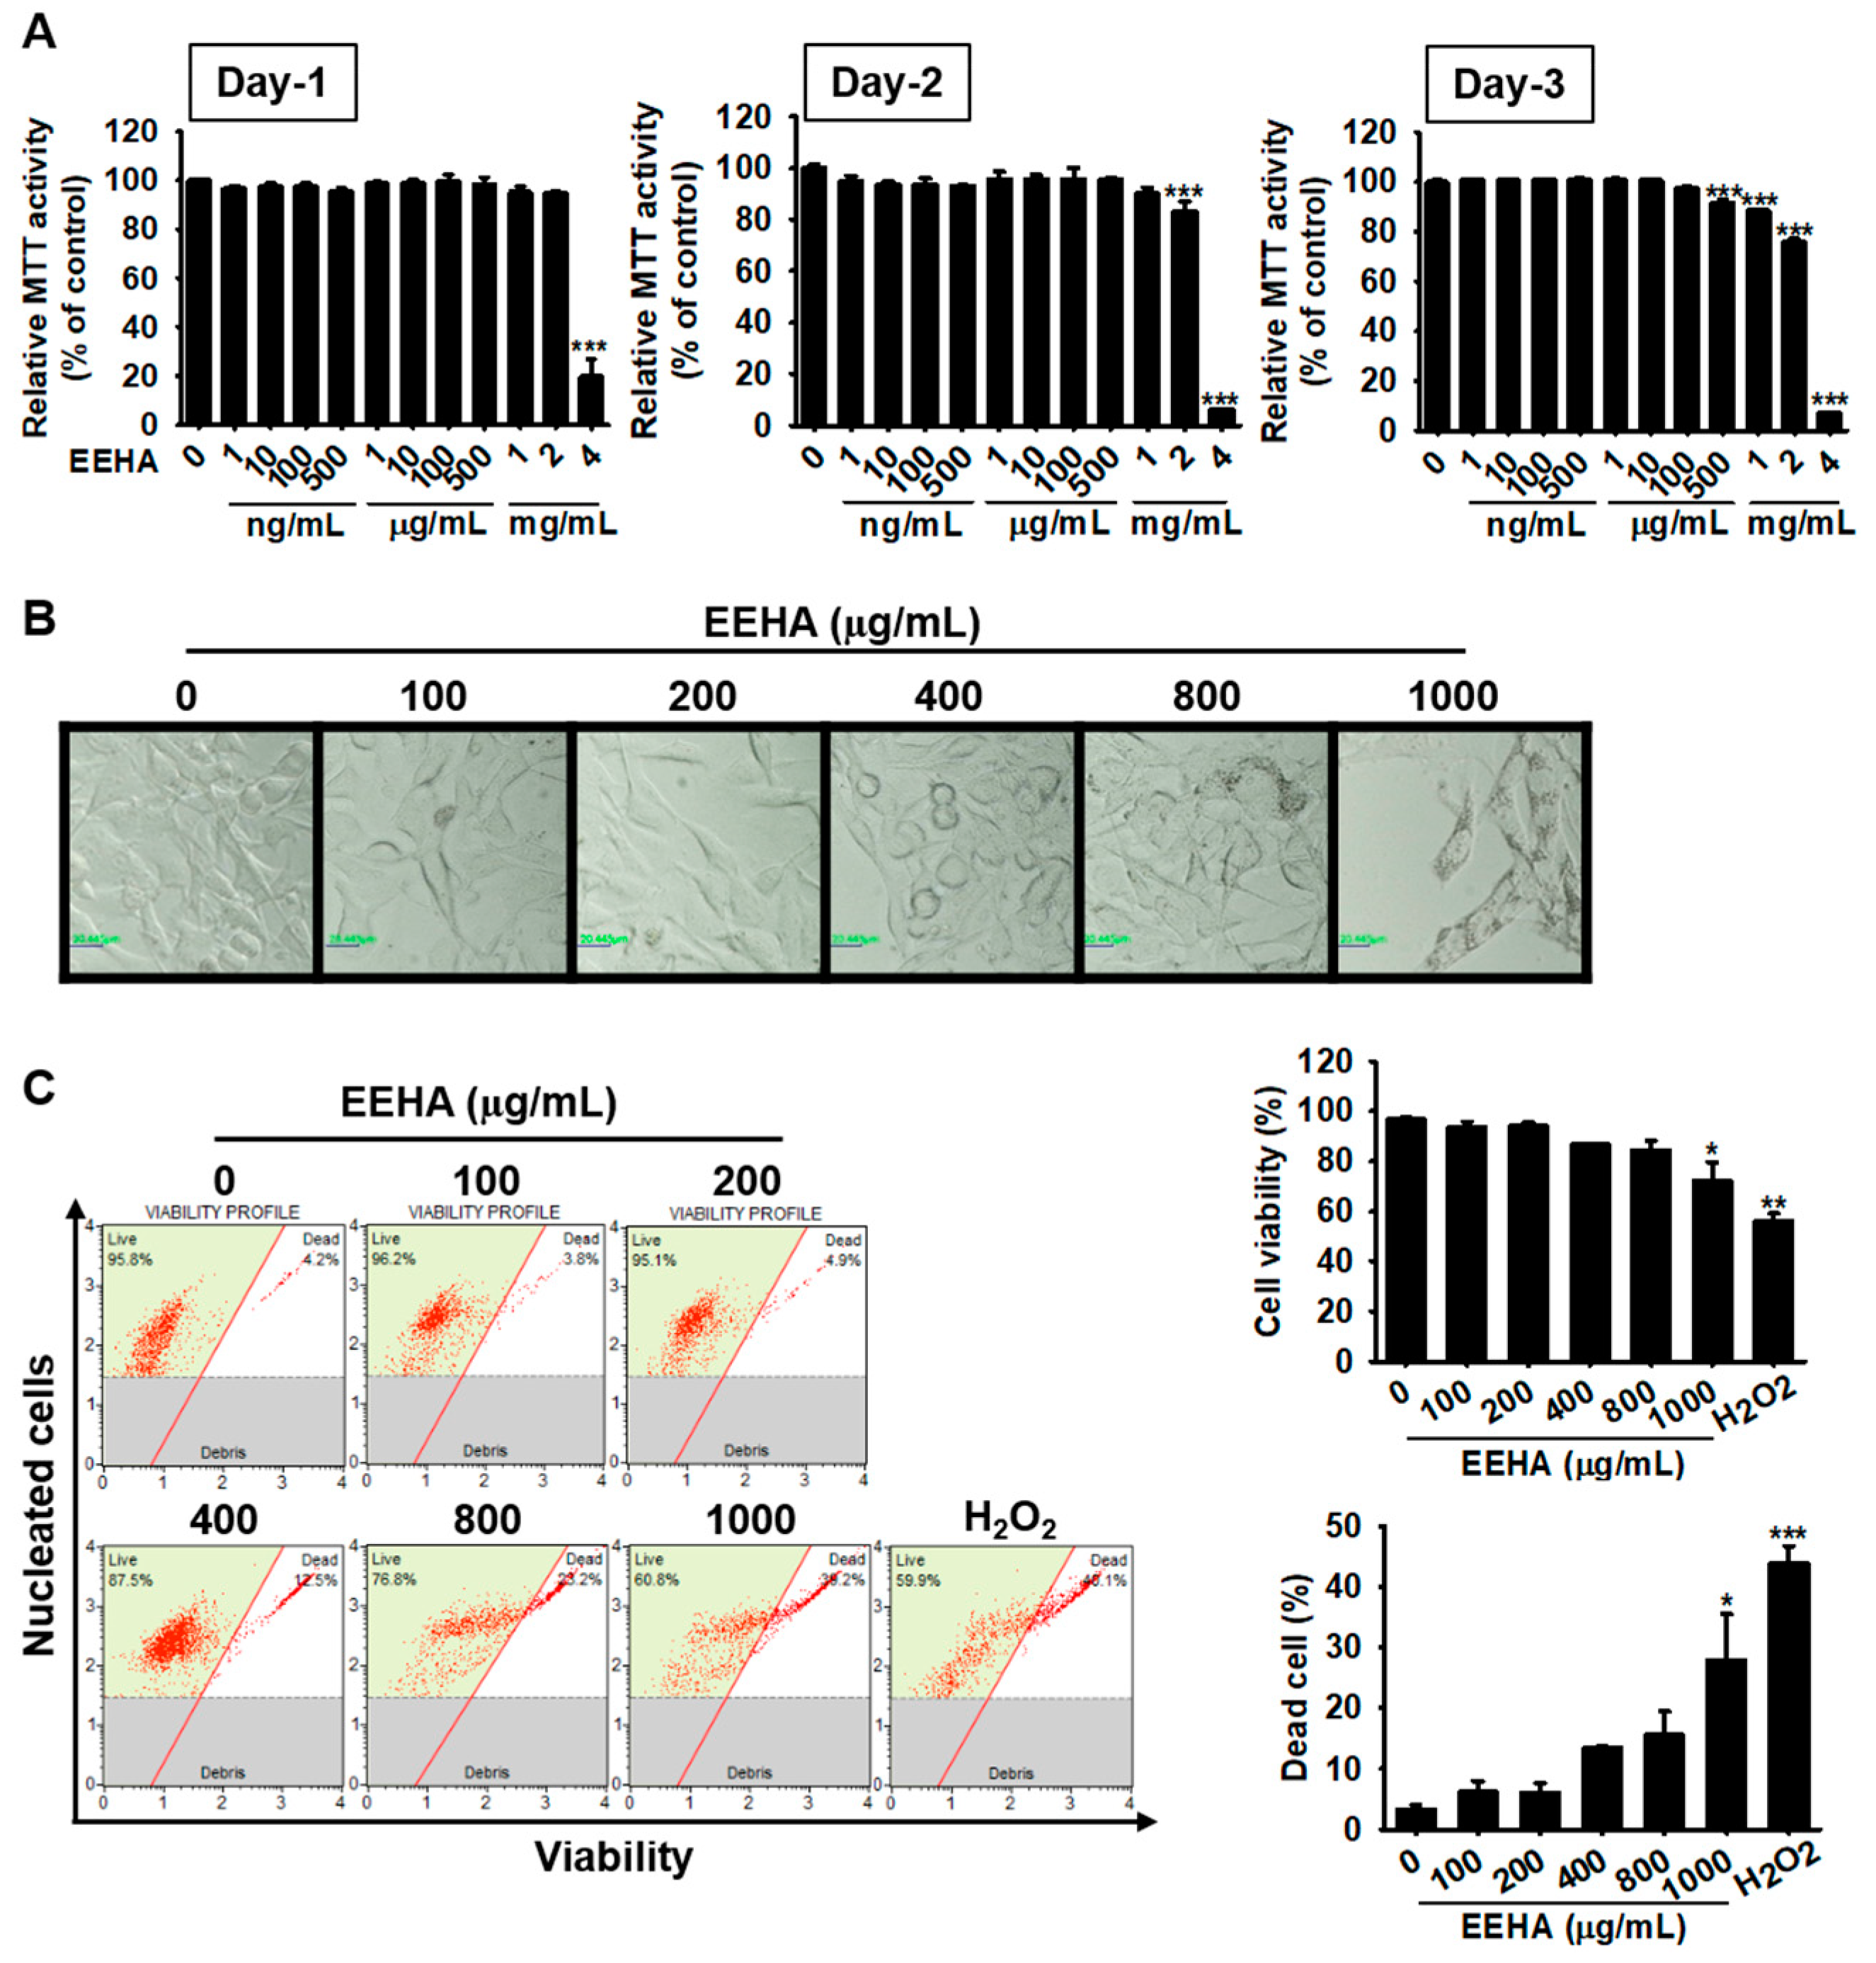
3.2. High Concentrations of EEHA Decrease B16F10 Melanoma Cell Viability

In order to investigate the cytotoxic effect of EEHA, B16F10 melanoma cells were treated with EEHA (0–4 mg/mL) for 72 h, following which cell viability was regularly measured by MTT assays at 24 h intervals. As depicted in Figure 1A, EEHA significantly reduced cell viability at the highest concentration (4 mg/mL) to 19.7% ± 7.2%, 7.1% ± 0.2%, and 7.1% ± 0.2% at 24, 48, and 72 h, respectively, in comparison to those of the untreated group. At a concentration of 2 mg/mL, EEHA downregulated cell viability by a moderate extent to 83.2% ± 3.9% and 76.2% ± 0.9% at 48 and 72 h, respectively. At concentrations of 500 μg/mL and 1 mg/mL, EEHA slightly attenuated cell viability to 91.7% ± 1.4% and 88.5% ± 0.2%, respectively, at 72 h. Analysis of morphological data revealed that at a concentration of 1000 μg/mL, EEHA significantly reduced the number of cells without causing any morphological alterations; however, EEHA did not induce any changes in the morphology or number of cells below concentrations of 800 μg/mL (Figure 1B). In order to investigate whether EEHA induces cytotoxicity in detail, we treated B16F10 melanoma cells with EEHA for 72 h, following which cell viability and the population of dead cells were measured by flow cytometry. Flow cytometry data revealed that when the cells were treated with 1000 μg/mL EEHA for 72 h, cell viability significantly reduced to 72.1% ± 7.6% and the population of dead cells significantly increased to 20.1% ± 8.6%, and when the concentration of EEHA was below 800 μg/mL, cell viability and the population of dead cells were unaltered (Figure 1C). These data indicate that high concentrations of EEHA induced cytotoxicity in B16F10 melanoma cells. Since the concentration of EEHA necessary for inhibiting melanogenesis was identified to be below 200 μg/mL in our preliminary experiments, EEHA was administered at non-cytotoxic concentrations (≤200 μg/mL) in the subsequent experiments.

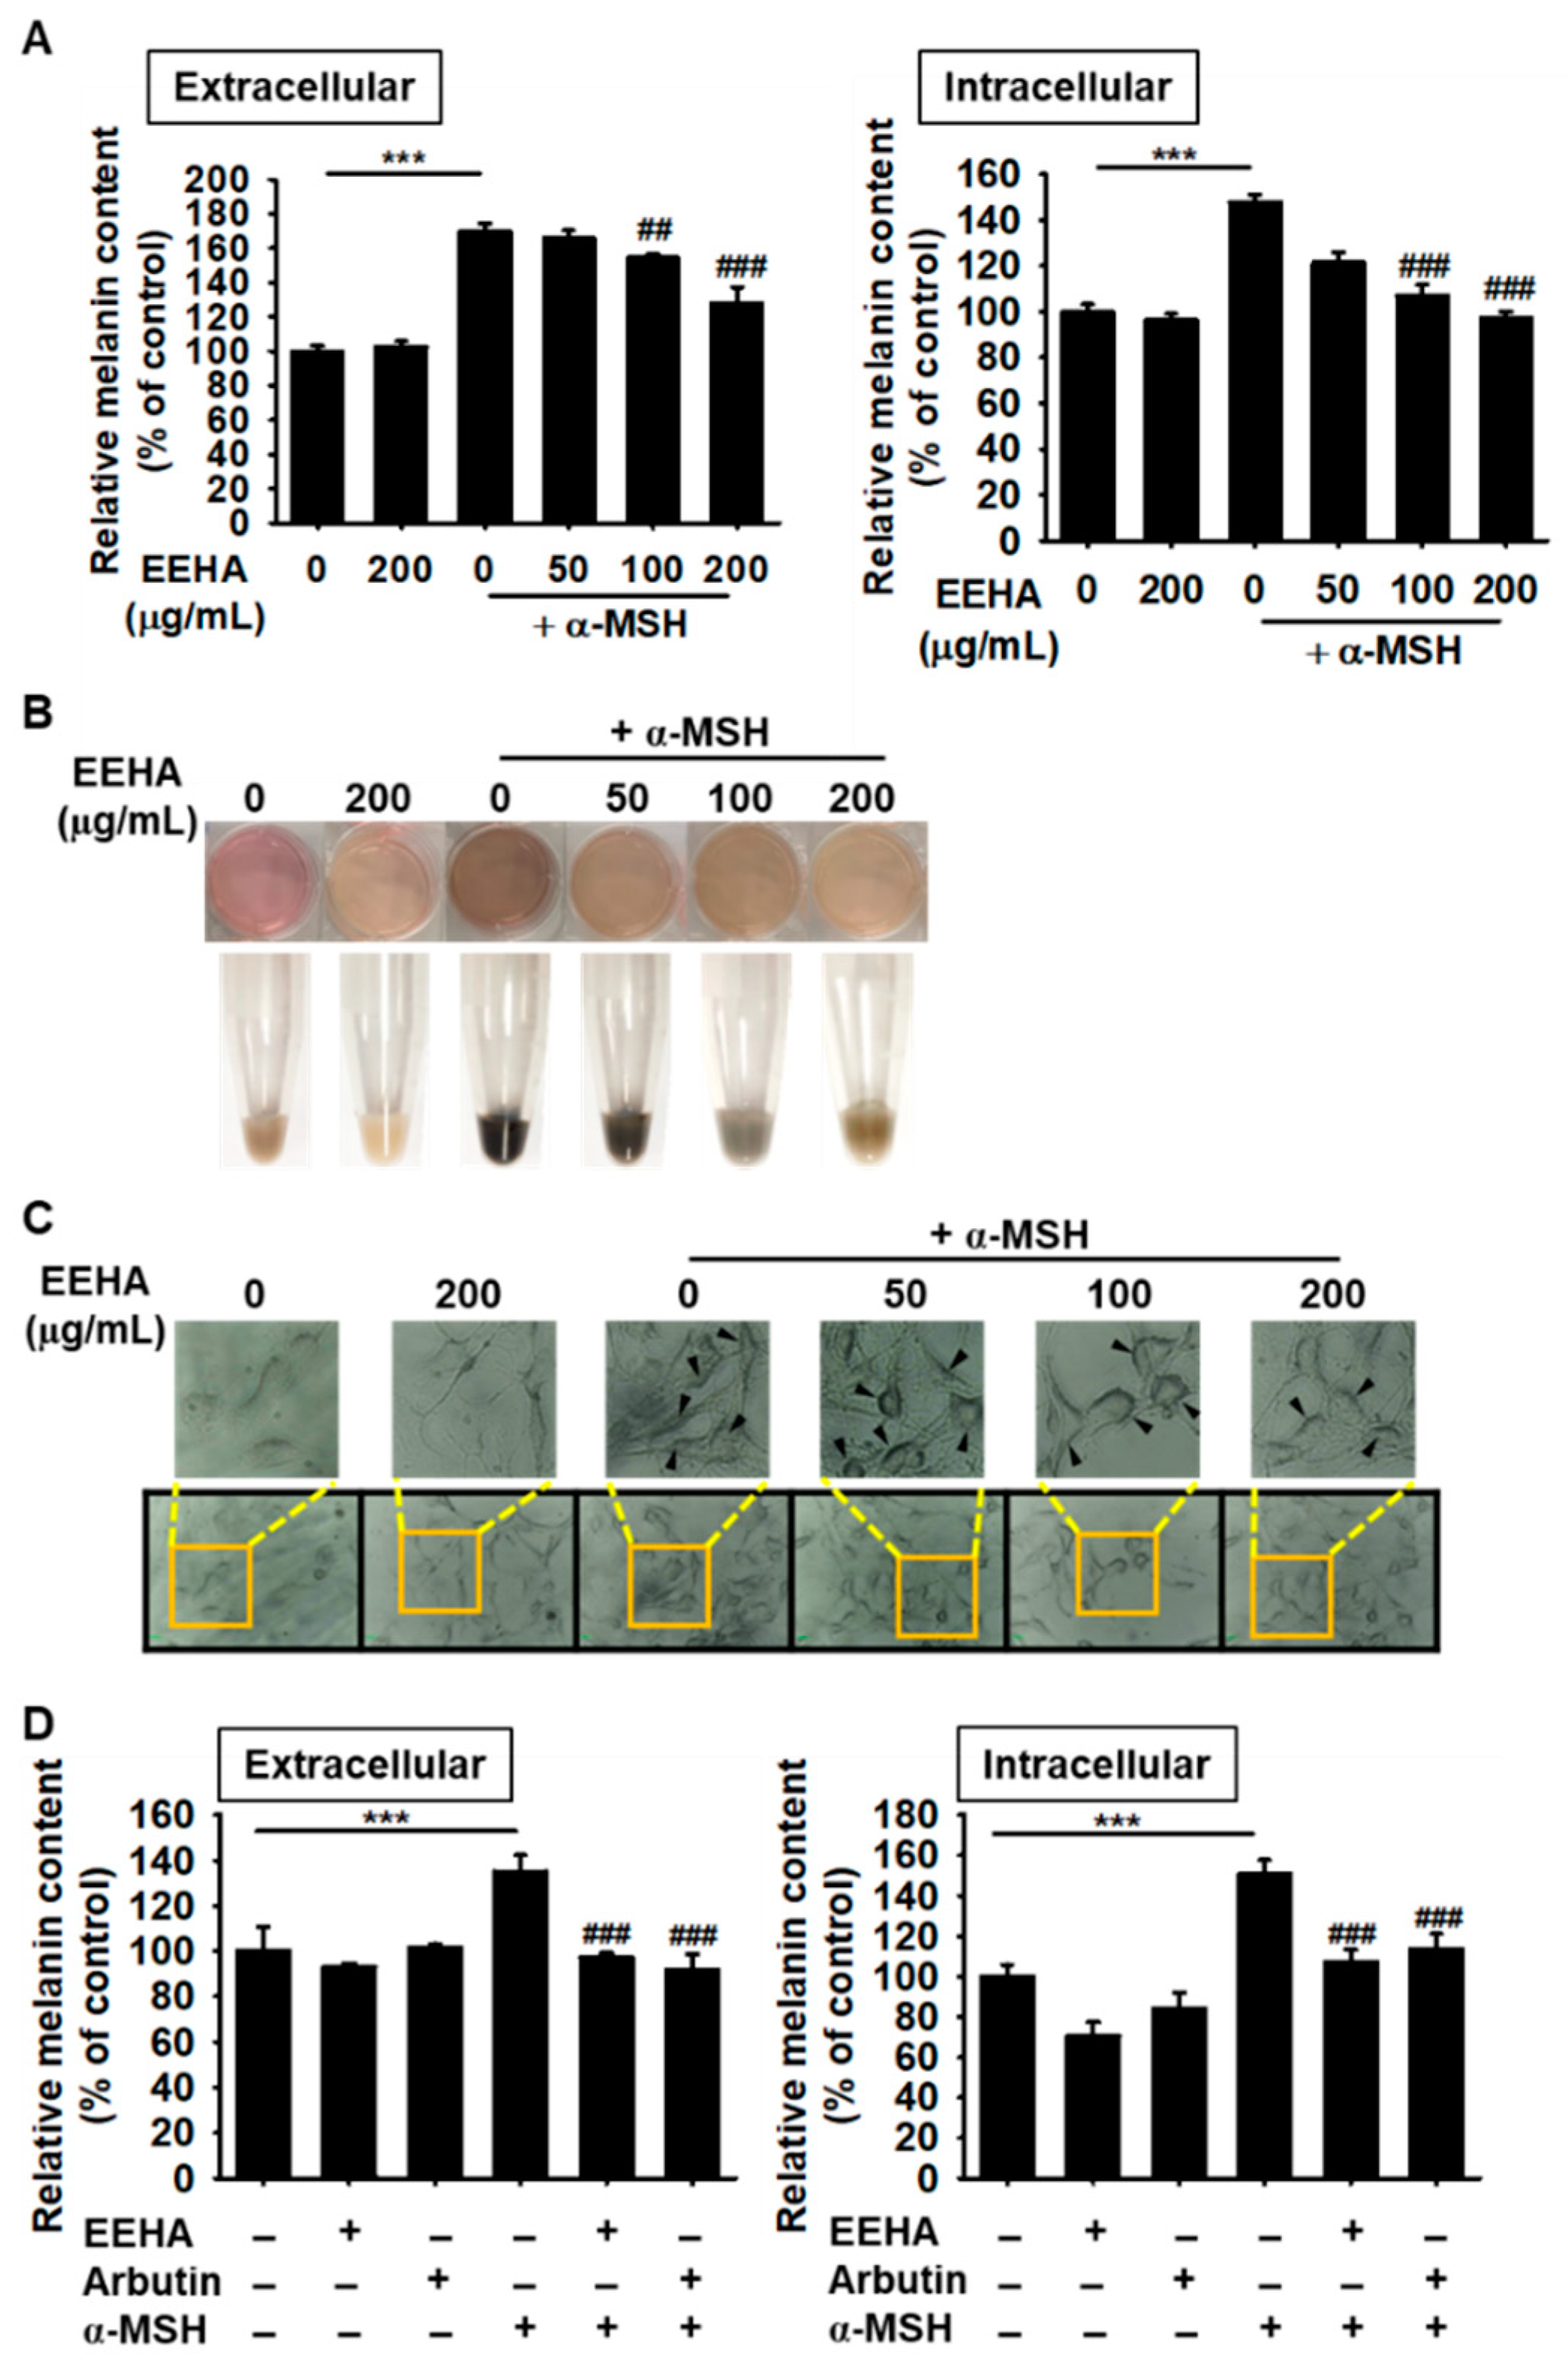
3.3. EEHA Inhibits α-MSH-Induced Melanogenesis in B16F10 Melanoma Cells

In order to quantify the anti-melanogenic effects of EEHA, B16F10 melanoma cells were treated with EEHA in the presence or absence of α-MSH for 72 h, and the pigmentation was quantified by measuring extracellular and intracellular melanin contents. In the presence of α-MSH, the extracellular (Figure 2A, left panel) and intracellular (Figure 2A, right panel) melanin contents increased significantly; however, when the cells were treated with 100 and 200 µg/mL EEHA, the increase in melanin content induced by α-MSH was remarkably downregulated. In a parallel experiment, the visualization of cell pellet color showed that α-MSH significantly promoted dark brown coloration (melanin production); however, treatment with EEHA gradually changed the dark brown coloration induced by α-MSH to light brown (Figure 2B), which indicated that EEHA inhibited the melanin production induced by α-MSH. We additionally observed that the activity of tyrosinase was directly proportionate to the intensity of black coloration and the highest intensity was observed in the presence of α-MSH. However, the intensity gradually decreased following treatment with EEHA in a concentration-dependent manner (Figure 2C). As depicted in Figure 2D, the anti-melanogenic effects of EEHA is comparable to that of arbutin, a well-known anti-melanogenic agent. Taken together, these results suggested that EEHA reduced the melanogenesis induced by α-MSH in B10F10 melanoma cells by reducing the activity of tyrosinase.

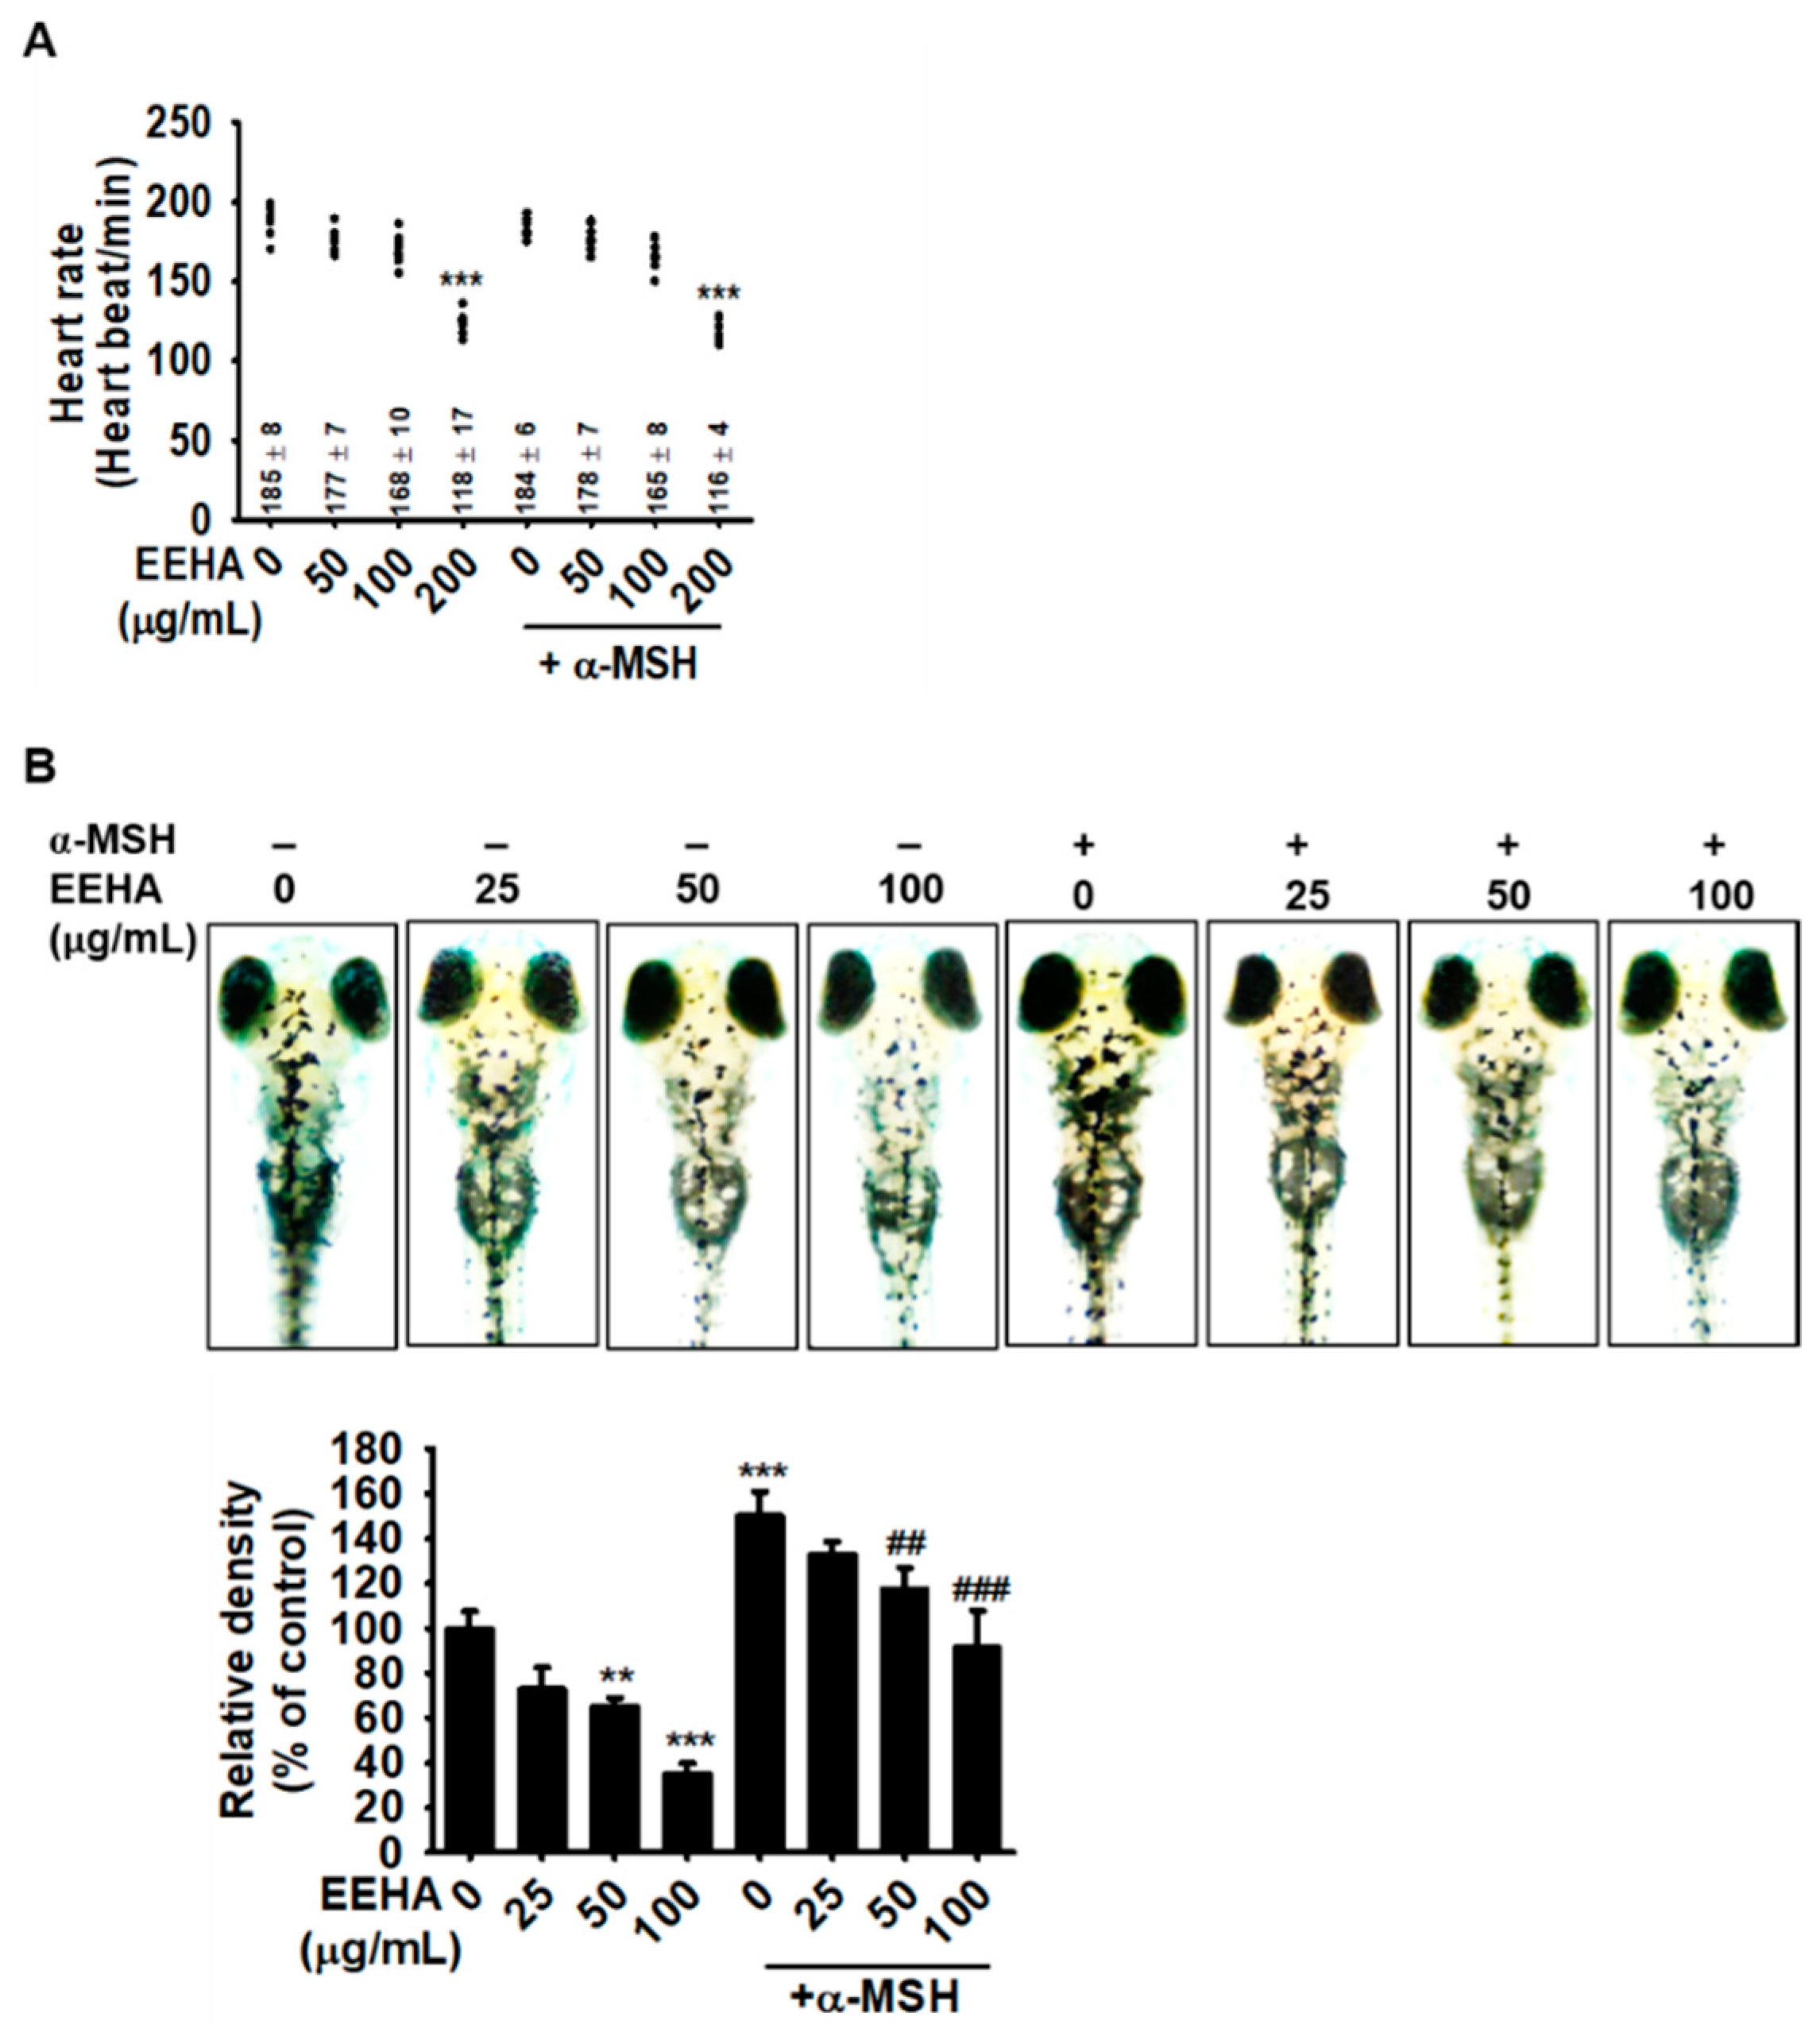
3.4. EEHA Attenuates Melanogenesis in Zebrafish Larvae

In order to evaluate the anti-melanogenic effect mediated by EEHA in vivo, zebrafish larvae at 2 dpf were treated with PTU for 24 h and were subsequently incubated with EEHA in the presence or absence of α-MSH. The heart rate data indicated that EEHA induced cardiotoxicity at a concentration of 200 µg/mL, as the heart rate was significantly reduced to 118 ± 17 heartbeats/min in comparison to that of the untreated group (185 ± 8 heartbeats/min) (Figure 3A). EEHA induced 100% mortality in zebrafish larvae at a concentration of 400 µg/mL (data not shown). Therefore, the zebrafish larvae were treated with EEHA at concentrations below 100 µg/mL (174 ± 10 heartbeats/min) in the subsequent experiments. As depicted in Figure 3B, EEHA strongly inhibited spontaneous melanin production in the zebrafish larvae in a concentration-dependent manner (72.9% ± 9.7%, 65.1% ± 3.9%, and 34.9% ± 4.9% at 25, 50, and 100 µg/mL, respectively) in comparison to that of the untreated group (100% ± 7.7%). Treatment with α-MSH significantly upregulated the melanin content to 150.1% ± 10.8% in the zebrafish larvae. However, EEHA downregulated the melanin production induced by α-MSH in a concentration-dependent manner to 133.1% ± 5.7%, 117.6% ± 9.5%, and 91.3% ± 16.7% at 25, 50, and 100 µg/mL, respectively. Altogether, these results indicate that EEHA possesses anti-melanogenic effects as observed in zebrafish larvae.

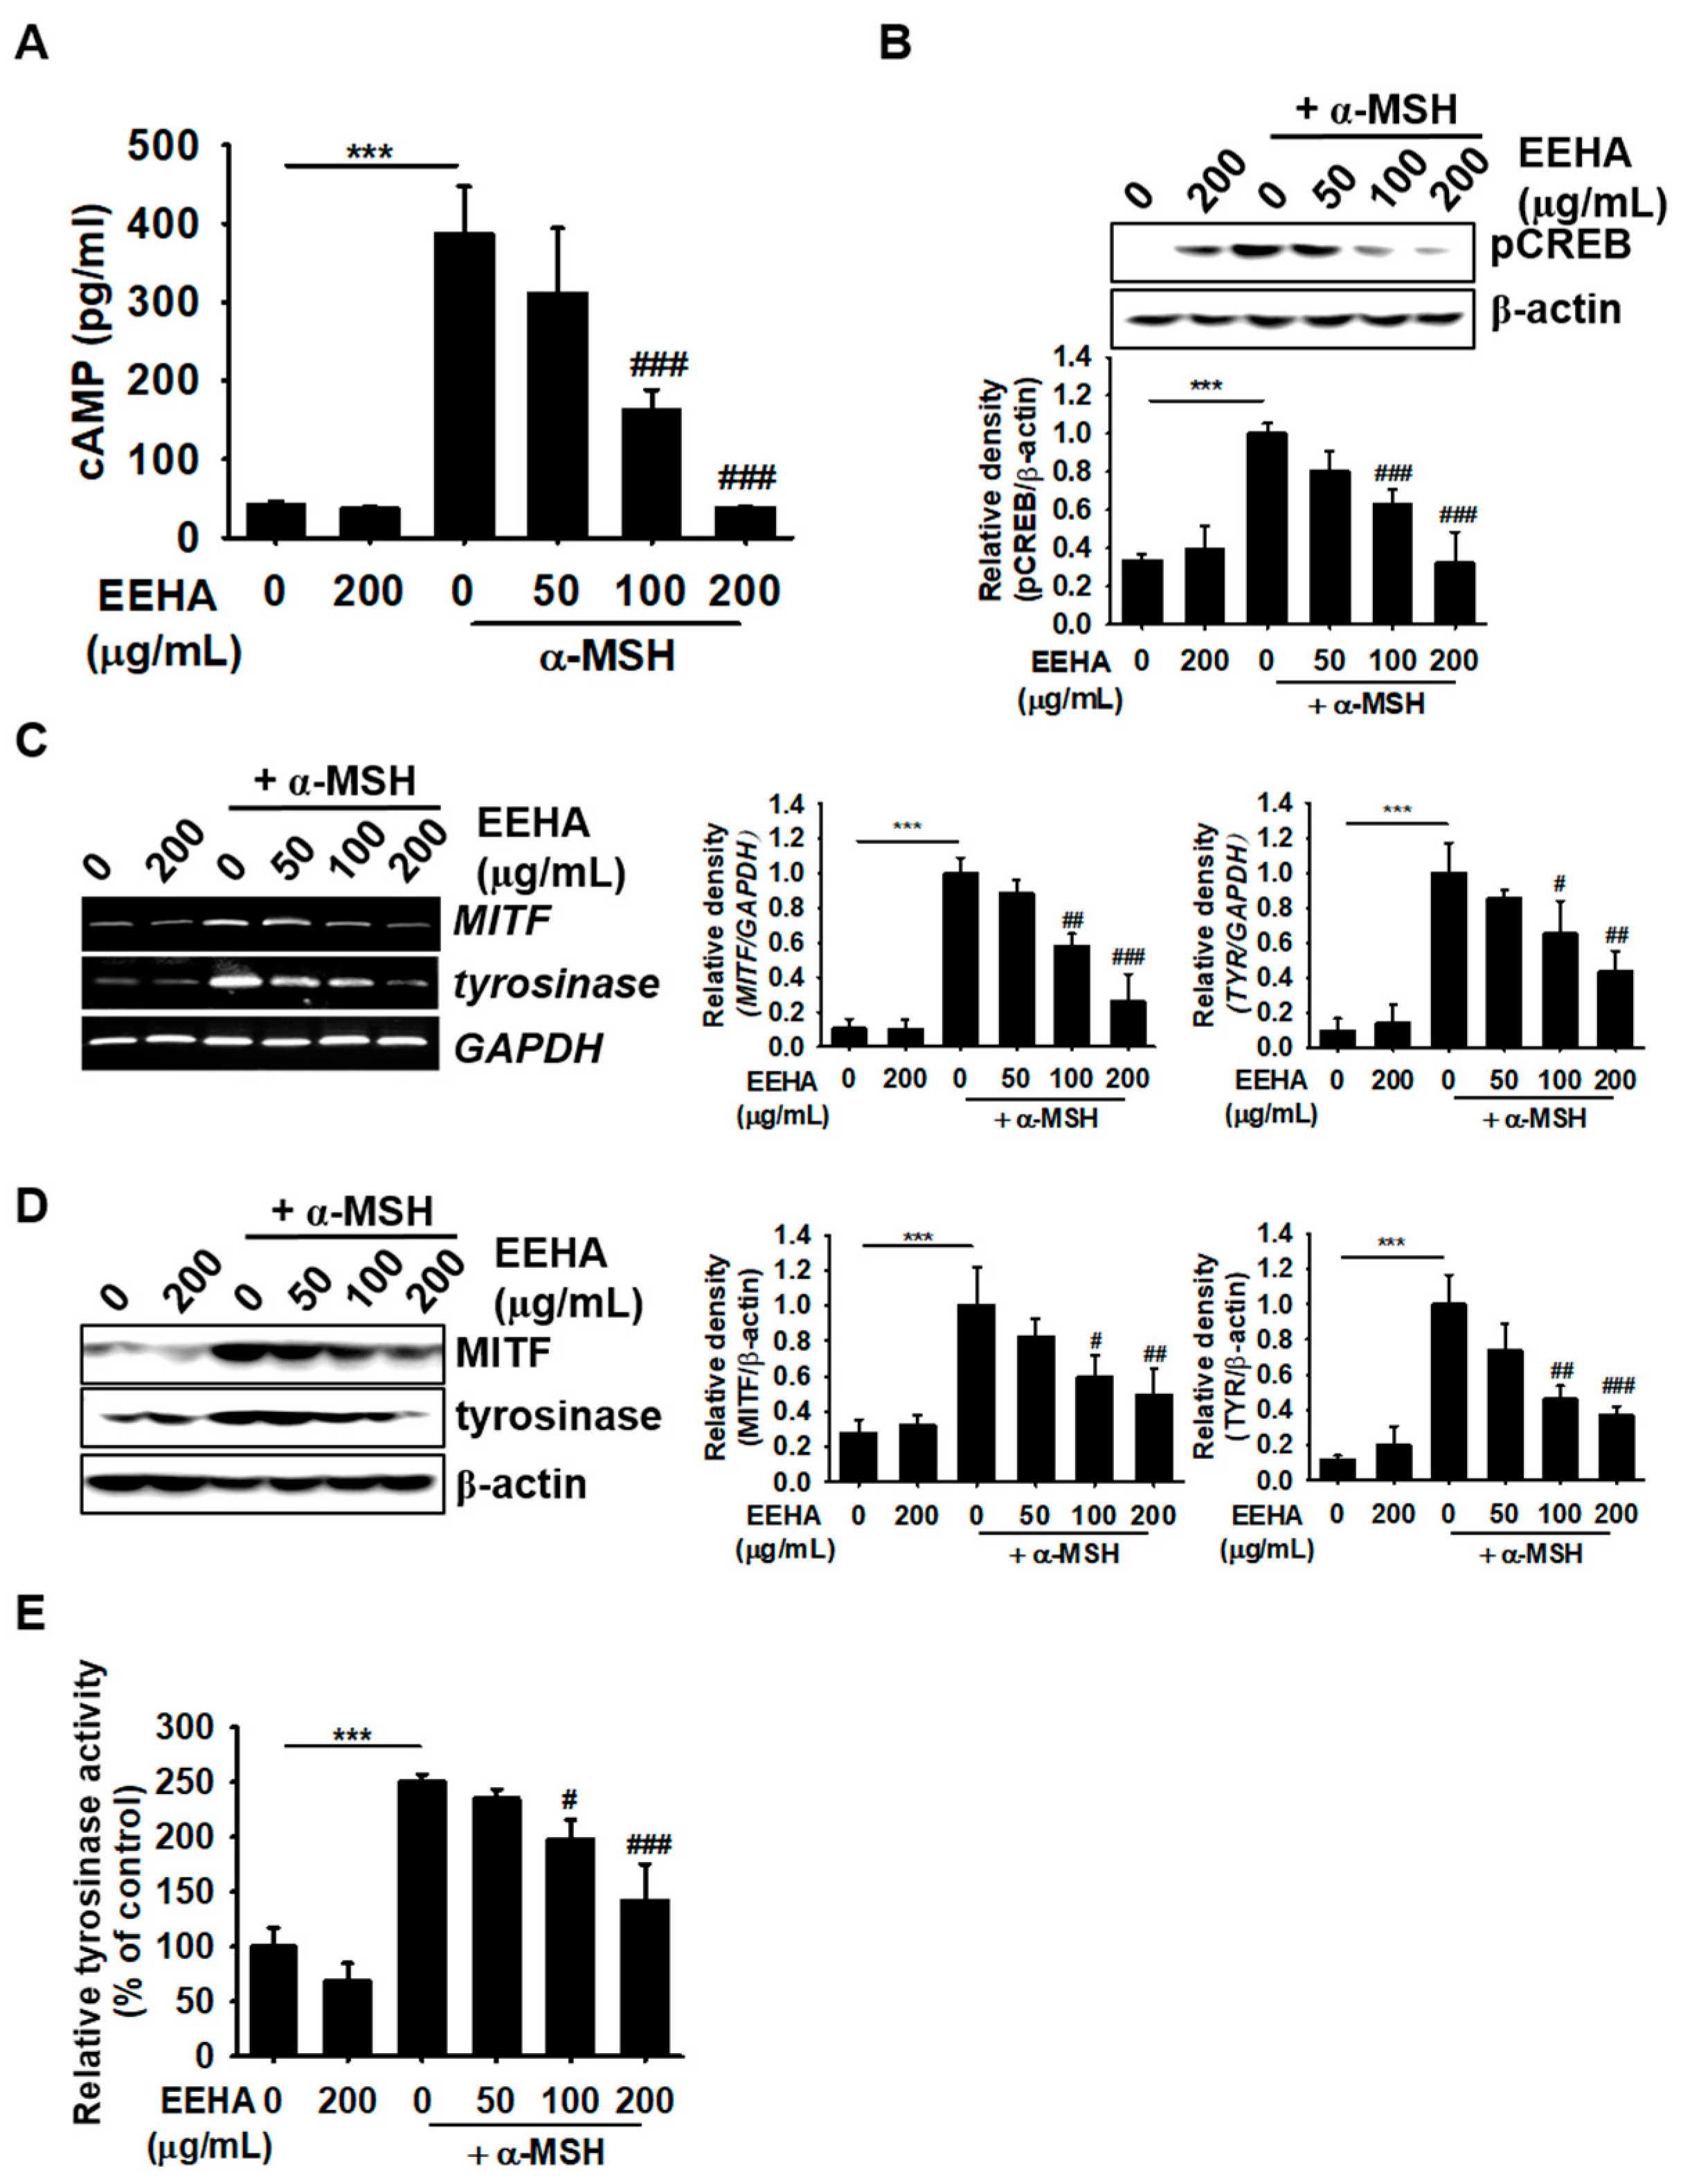
3.5. EEHA Inhibits MITF and Tyrosinase Expression in B16F10 Melanoma Cells by Suppressing the cAMP Signaling Pathway

Since the binding of α-MSH to MC1R stimulates the GPCR signaling pathway, we investigated whether EEHA inhibits cAMP-mediated melanogenesis. As depicted in Figure 4A, EEHA significantly downregulated the increase in cAMP levels induced by α-MSH from 386.6 ± 61.1 to 38.2 ± 1.3 pg/mL at a concentration of 200 µg/mL, which was similar to the cAMP level in the untreated group (41.4 ± 4.8 pg/mL). At a concentration of 100 µg/mL, EEHA also inhibited the increase in cAMP levels induced by α-MSH to approximately 50%. Since the upregulation of cAMP is directly associated with the phosphorylation of CREB, we evaluated the effect of EEHA on CREB phosphorylation. As expected, at a concentration of 200 µg/mL, EEHA downregulated the levels of phosphorylated CREB in B16F10 melanoma cells by 3.2 folds in comparison to that of α-MSH-treated group (Figure 4B). Additionally, the α-MSH-induced expression of both MITF and tyrosinase was markedly downregulated to approximately 70% and 60%, respectively, by 200 µg/mL of EEHA, and the expression of both MITF and tyrosinase was reduced by approximately 50% when the concentration of EEHA was 100 µg/mL (Figure 4C). Consistent with the expression data for MITF and tyrosinase, EEHA downregulated the α-MSH-induced expression of MITF and tyrosinase protein (Figure 4D). We additionally identified that the activity of cellular tyrosinase was markedly increased by α-MSH (249.9% ± 6.7%) in comparison to that of the untreated group (100% ± 17.2%). However, the increase in cellular tyrosinase activity was significantly attenuated by EEHA (197.8% ± 17.6% and 141.9% ± 33.2% at 100 and 200 μg/mL, respectively; Figure 4E). Altogether, these results indicate that EEHA inhibits the activity of cellular tyrosinase by suppressing the cAMP–CREB–MITF axis, resulting in the anti-melanogenic activity of EEHA.

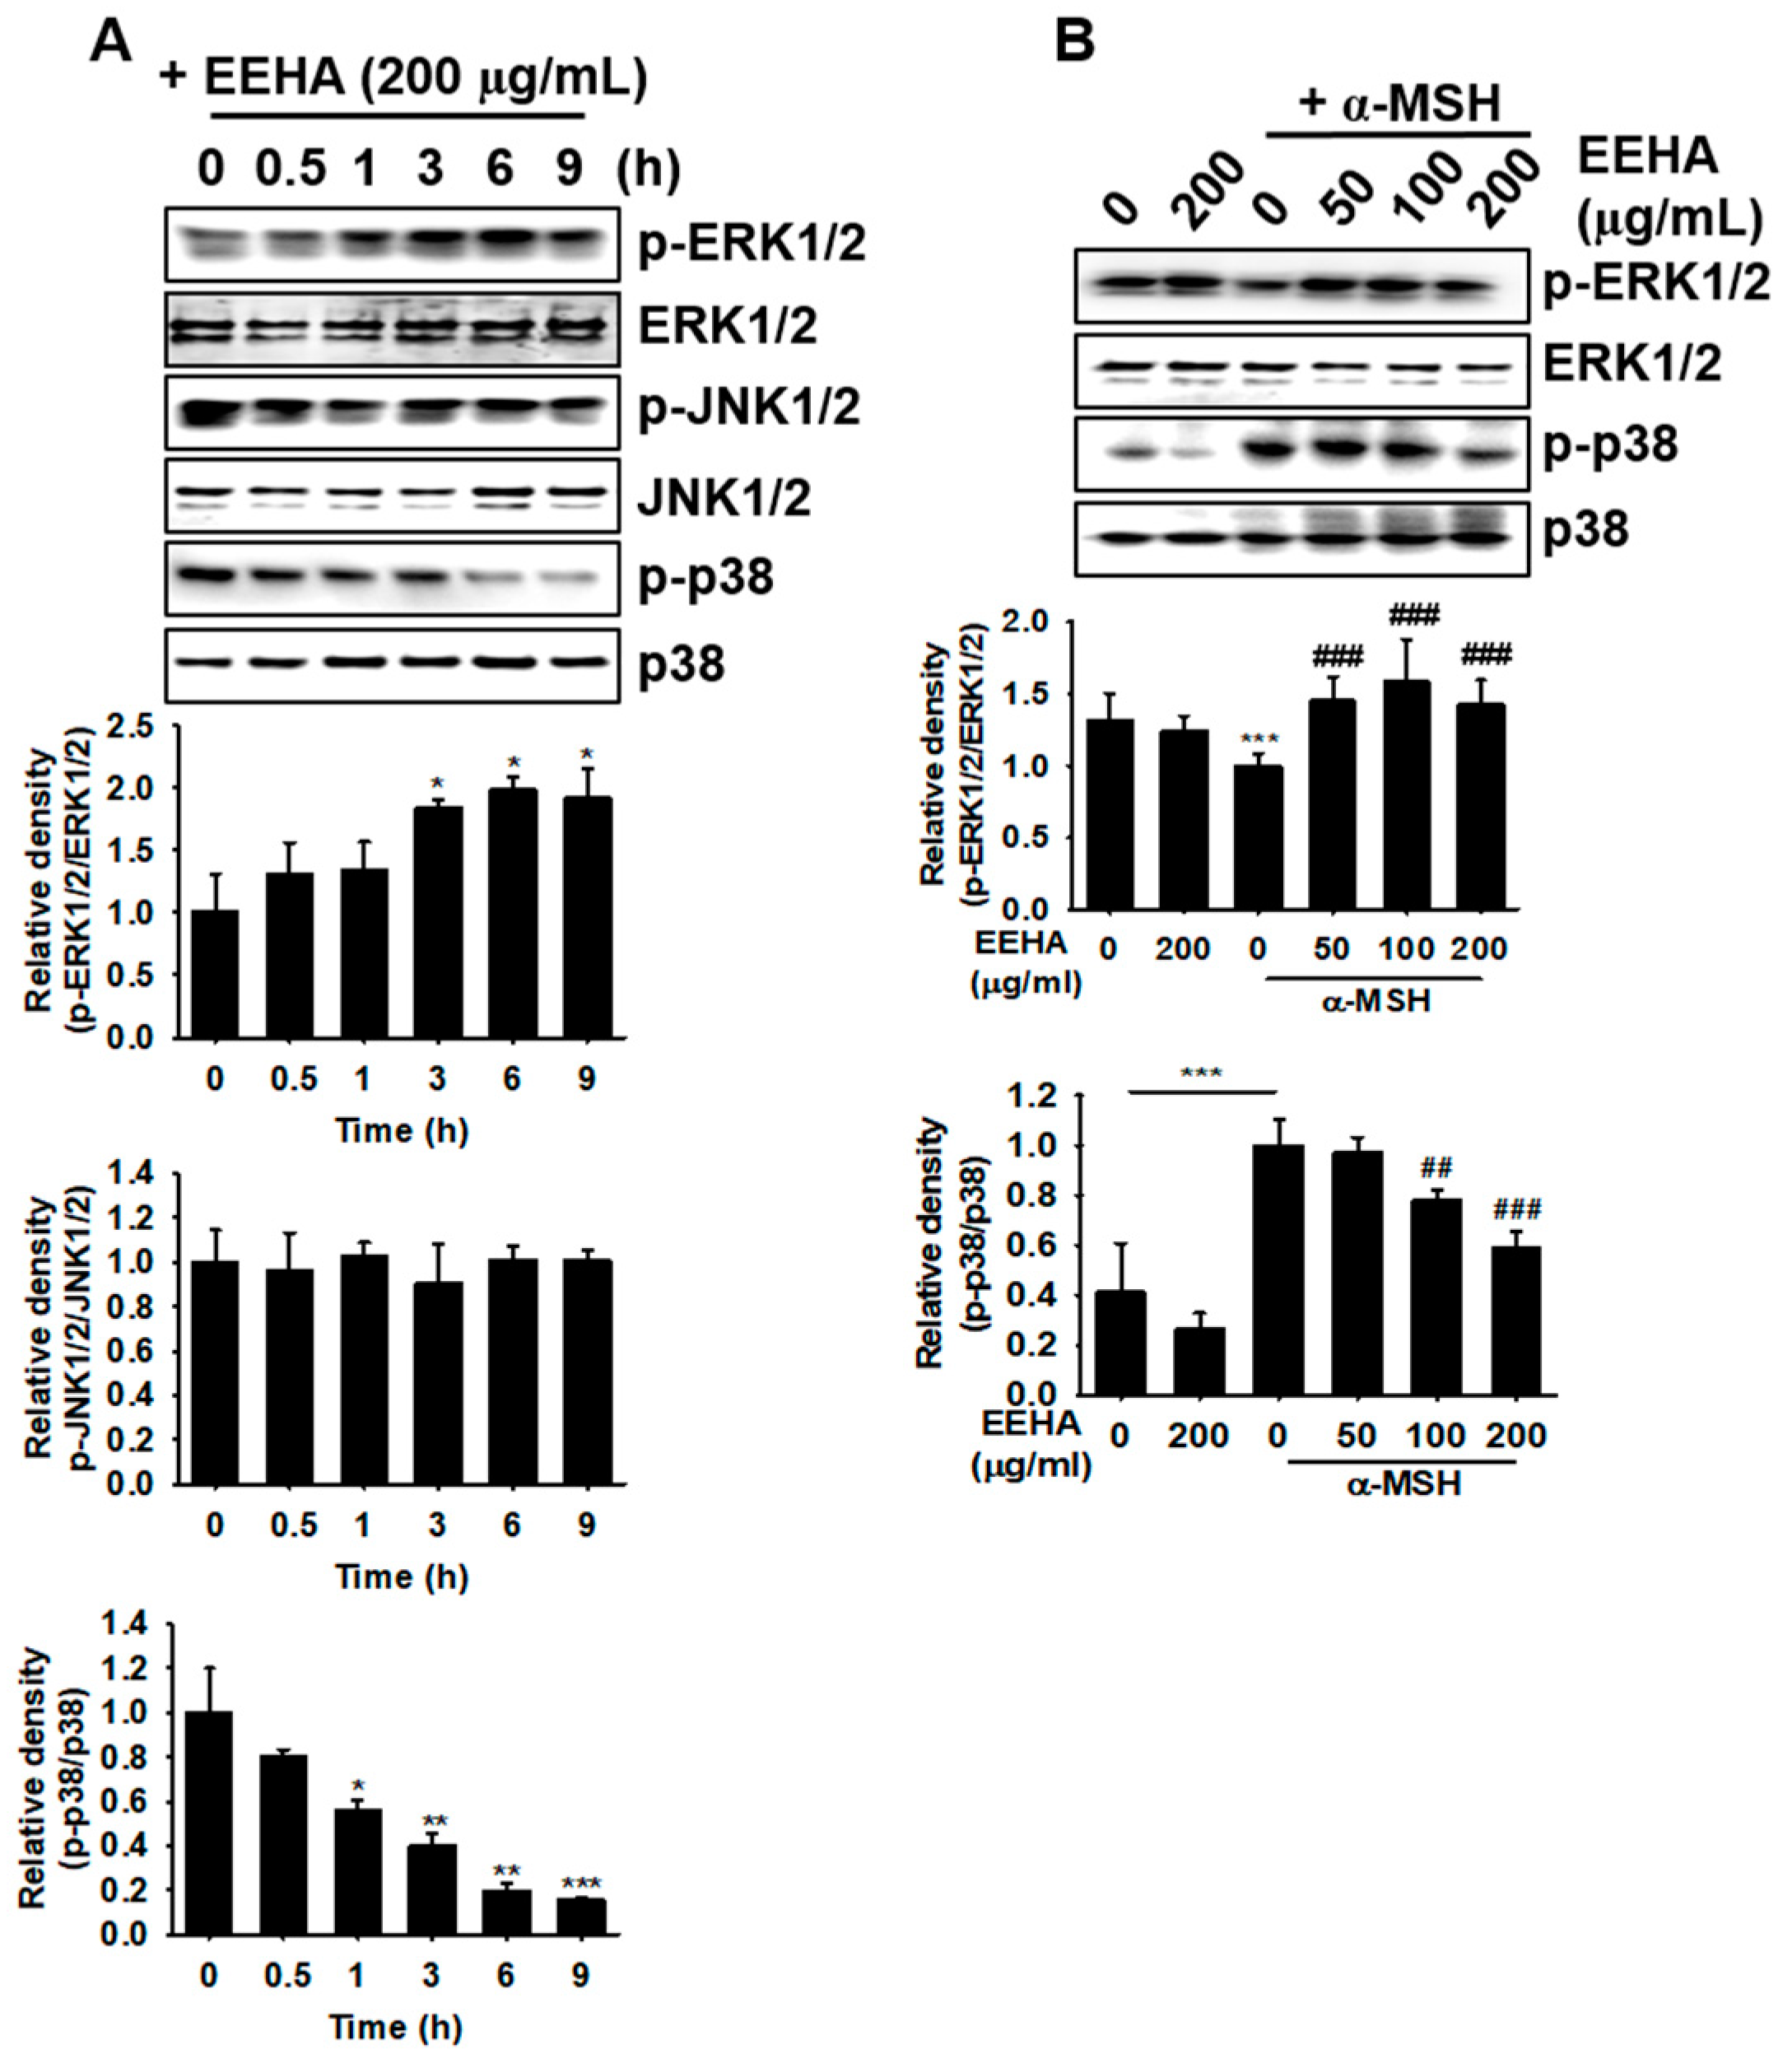
3.6. EEHA Increases ERK Phosphorylation and p38 MAPK Dephosphorylation

We subsequently assessed whether EEHA regulates the MAPK signaling pathway for inhibiting the melanogenesis mediated by α-MSH in B16F10 melanoma cells. Our findings demonstrated that EEHA significantly phosphorylated ERK1/2 from 3 h of treatment, while the phosphorylation of p38 MAPK was downregulated from 6 h of treatment in B16F10 melanoma cells, in comparison to those of the untreated group (1.8 ± 0.1 and 0.5 ± 0.1 for p-ERK1/2 and p-p38, respectively; Figure 5A). However, the level of p-JNK1/2 was sustained regardless of EEHA treatment. Additionally, α-MSH moderately downregulated p-ERK1/2 and significantly upregulated p-p38 (Figure 5B). EEHA restored the α-MSH-mediated downregulation of p-ERK1/2 levels and also significantly downregulated the levels of p-p38 MAPK in a concentration-dependent manner. These results confirm that EEHA induces the activation of ERK and inactivation of p38 MAPK during the melanogenesis in B16F10 melanoma cells.

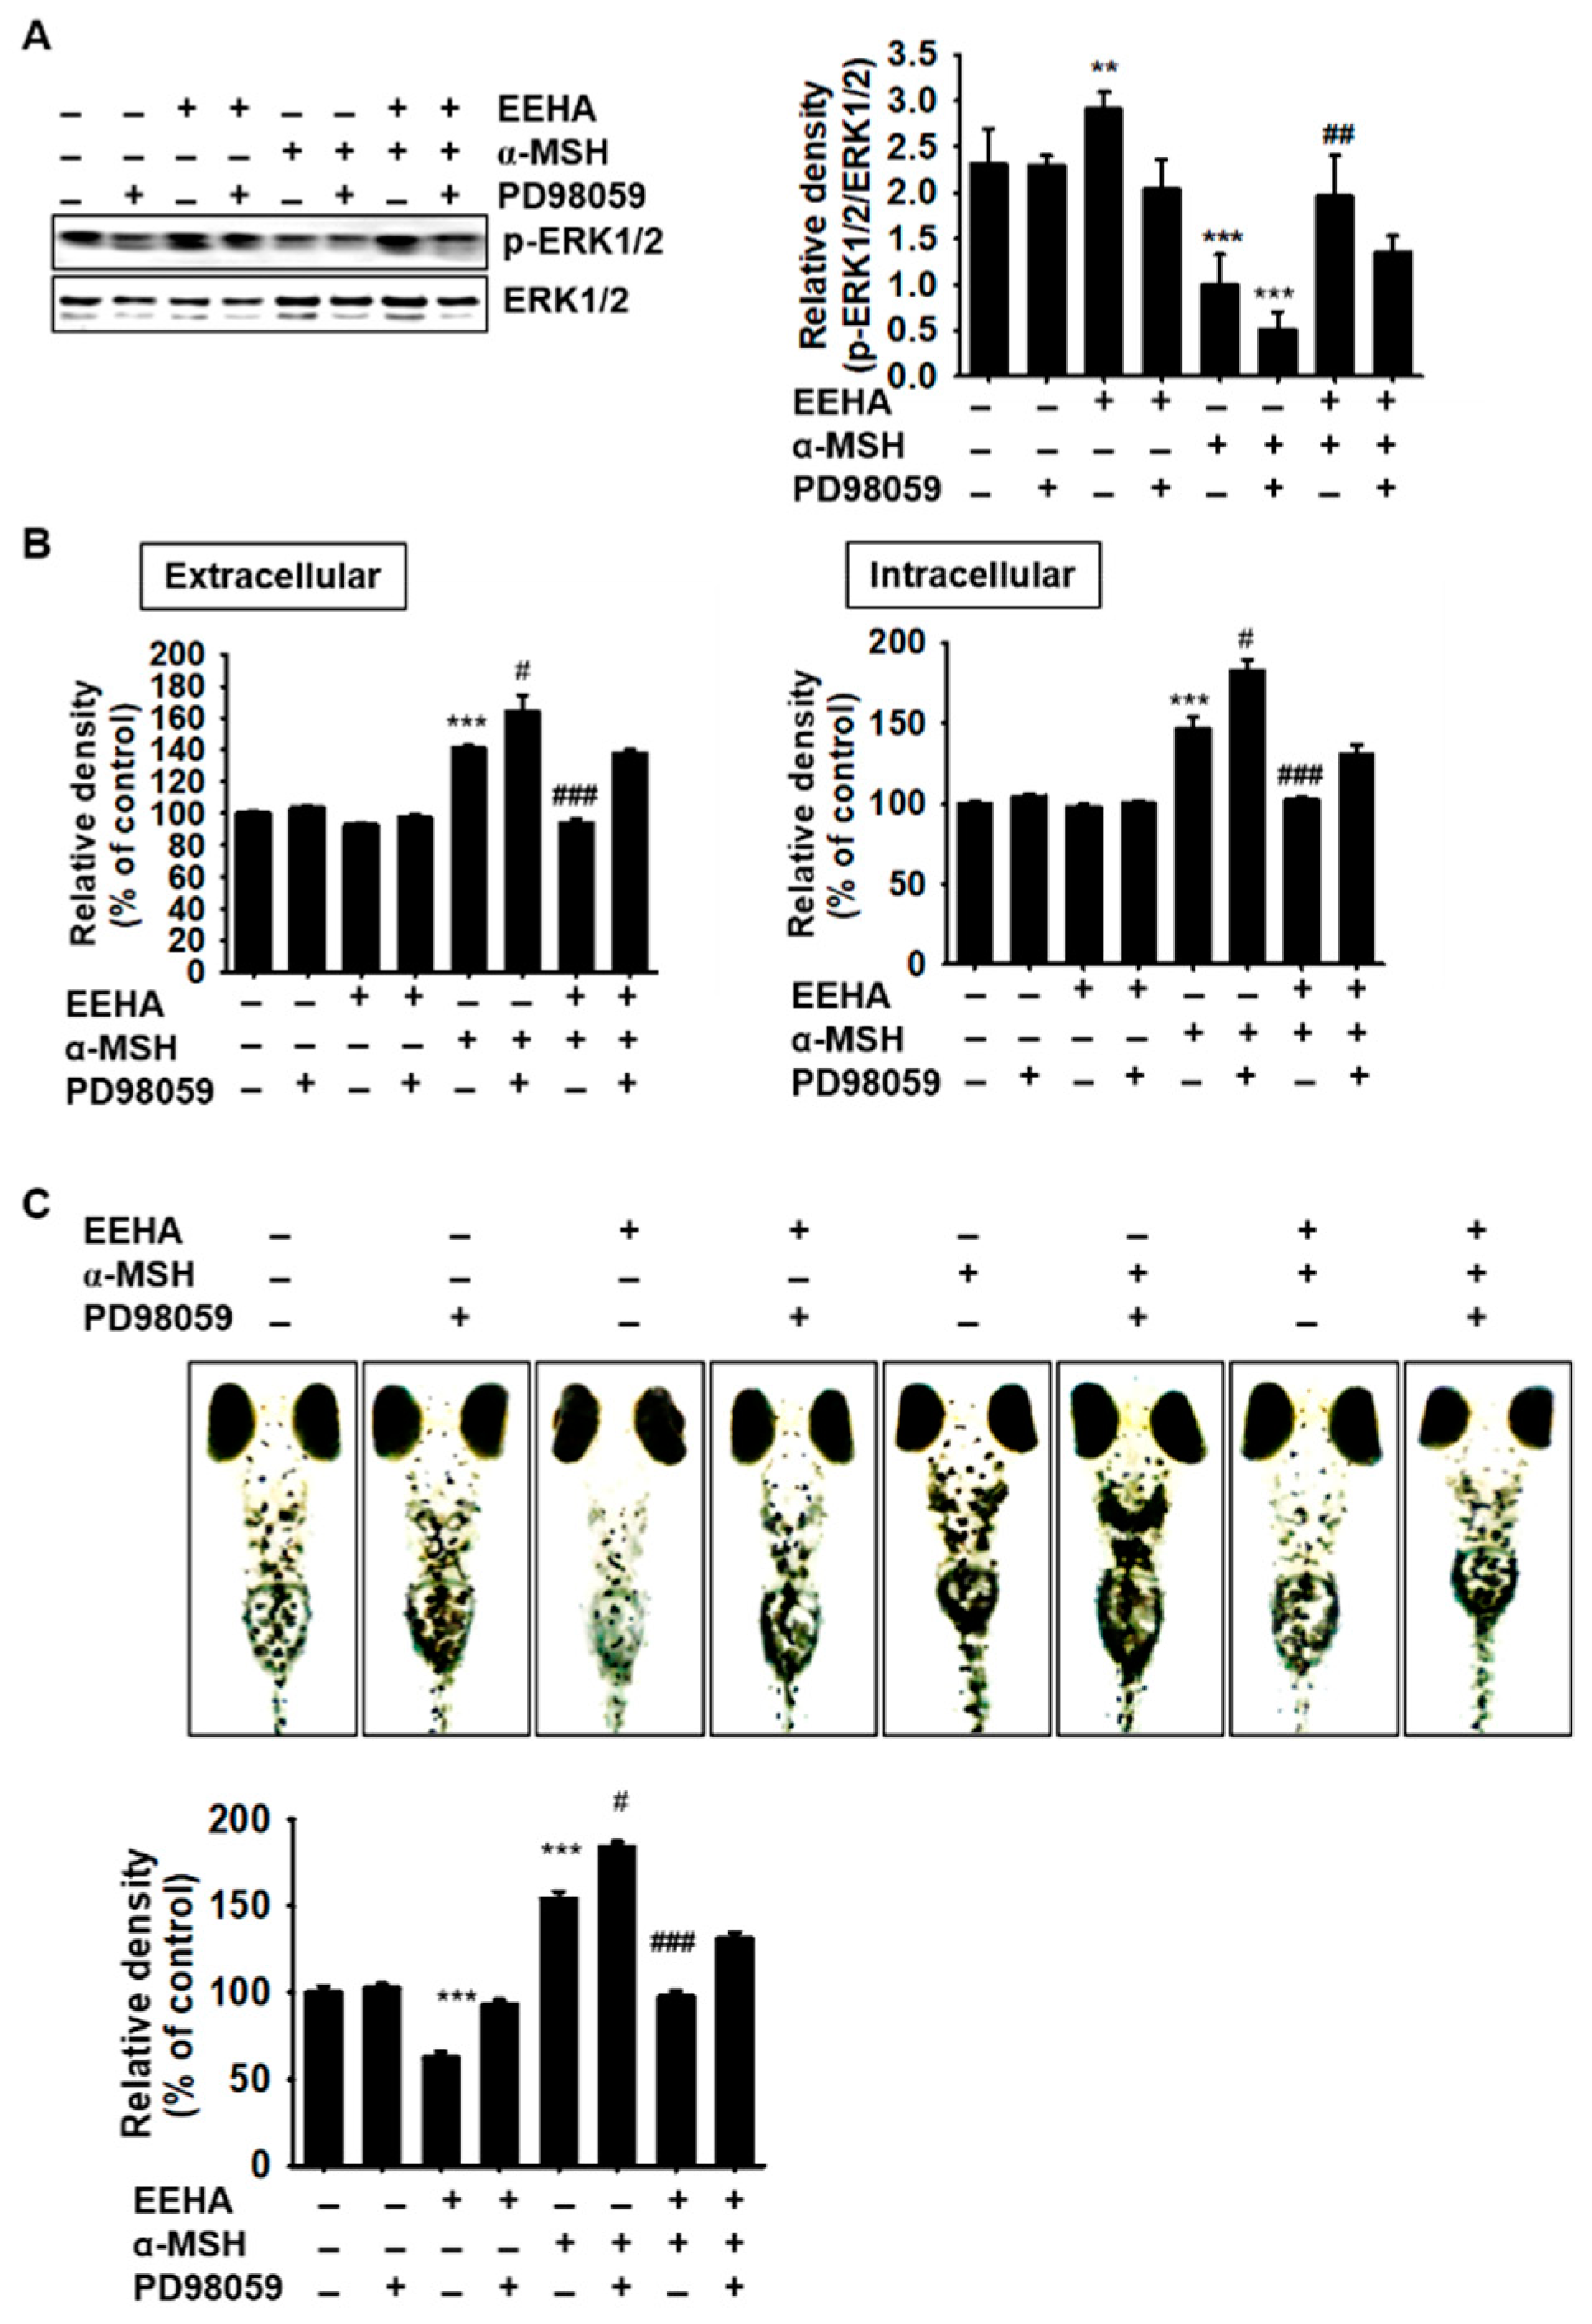
3.7. Inhibition of ERK Reverses EEHA-Mediated Anti-Melanogenesis in B16F10 Melanoma Cells and Zebrafish Larvae

We subsequently verified whether ERK was involved in the EEHA-mediated anti-melanogenesis observed herein. It was observed that α-MSH downregulated the phosphorylation of ERK, and ERK phosphorylation was more strongly inhibited following combined treatment with α-MSH and PD98059, in comparison to that of the group treated with α-MSH only (Figure 6A). On the other hand, EEHA significantly increased ERK phosphorylation, which was downregulated by treatment with α-MSH and PD98059. Additionally, in comparison to those of the untreated group, PD98059 upregulated both extracellular (from 141.4% ± 1.3% to 164.1% ± 10.4%) and intracellular (from 146.3% ± 7.4% to 182.6% ± 6.7%) melanin content that was induced by α-MSH in B16F10 melanoma cells (Figure 6B). The EEHA-mediated anti-melanogenic activity was reversed in the presence of PD98059, which reduced both extracellular (90.1% ± 2.7% and 137.9% ± 2.0% in the α-MSH+EEHA-treated and α-MSH+EEHA+PD98059-treated groups, respectively) and intracellular (102.1% ± 2.5% and 130.4% ± 6.4% in the α-MSH+EEHA-treated and α-MSH+EEHA+PD98059-treated groups, respectively) melanin contents, indicating that EEHA upregulated ERK phosphorylation, which consequently induced anti-melanogenesis. Moreover, PD98059 and/or α-MSH significantly enhanced melanogenesis in the zebrafish larvae (150.1% ± 4.1% and 184.1% ± 4.1% in the α-MSH-treated and α-MSH+PD98059-treated groups, respectively), in comparison to that of the untreated group (Figure 6C). Furthermore, EEHA was unable to inhibit the melanogenesis induced by α-MSH in the presence of PD98059 (97.5% ± 3.7% and 130.9% ± 3.9% in the α-MSH+EEHA-treated and α-MSH+EEHA+PD98059-treated groups, respectively), which indicated that the activation of ERK by EEHA induced the anti-melanogenic properties observed in vivo. Collectively, these results indicated that the anti-melanogenic properties of EEHA in B16F10 melanoma cells and zebrafish larvae are mediated via the activation of the ERK signaling pathway.

4. Discussion

Among the different species of Hippocampus spp., H. abdominalis has an unique appearance that is attributed to its prominent belly, and the aquaculture of H. abdominalis has been successful in New Zealand and South-Eastern Australia [14]. Recently, Oh and coworkers reported that the enzymatic hydrolysis of H. abdominalis protects endothelial cells against apoptosis mediated by oxidative stress [20]. A mixture of H. abdominalis and red ginseng possesses anti-fatigue and anti-oxidant activities, as observed in C2C12 myoblasts, that are mediated via the inhibition of H2O2-induced oxidative stress [13]. Muthuramalingam et al. also revealed that the protein hydrolysate derived from H. abdominalis promotes skeletal muscle development in mice [21]. However, it remains to be investigated whether the protein extract of H. abdominalis possesses anti-melanogenic properties. The present study demonstrates that EEHA possesses anti-melanogenic activity that is mediated via the inhibition of the cAMP-CREB-MITF-tyrosinase axis and activation of the ERK signaling pathway.
Melanin synthesis is initiated by the binding of MC1R to its specific ligands, including α-MSH, adrenocorticotropic hormone (ACTH), and agouti signaling protein (ASP) [4]. Both α-MSH and ACTH are derived from pro-opiomelanocortin (POMC), which is the archetypal polypeptide precursor of hormones and neuropeptides [22]. The binding of MC1R to its agonists activates adenylyl cyclase that catalyzes the production of the second messenger, cAMP, from ATP [23]. The morpholino oligonucleotide-mediated knockdown of mc1r in zebrafish fails to disperse the melanosome via cAMP downregulation [24], indicating that the MC1R-mediated upregulation of cAMP is an important regulator of melanin synthesis and dispersion. The cAMP thus produced phosphorylates CREB by activating protein kinase A, which promotes the transcription of MITF, resulting in tyrosinase-mediated melanogenesis [4,6]. Chen et al. reported that the knockout of the MITF-M gene, a melanocyte-specific isoform, in mice, results in albinism, indicating the significance of MITF as a master regulatory transcription factor in melanogenesis [25]. The RNA interference of MITF in melanoma cells significantly reduces the levels of tyrosinase and MC1R, which is accompanied by abnormal melanin content [26], indicating that targeting MITF is a promising strategy for the treatment of hypermelanogenic disorders such as senile lentigines, melisma, and freckles. Therefore, numerous studies have focused on inhibiting the MC1R signaling pathway [27]. In the present study, we observed that EEHA inhibits the melanogenesis induced by α-MSH in B16F10 melanoma cells and zebrafish larvae by suppressing cAMP production, which in turn suppressed the CREB–MITF–tyrosinase axis. Therefore, our results indicate that EEHA can serve as a promising anti-melanogenic agent for the treatment of hypermelanogenic disorders.
Besides the cAMP signaling pathway, the SCF/c-kit signaling pathway activates Raf-1, which upregulates MAPK phosphorylation, resulting in the regulation of melanogenesis under UV exposure and pigmentation disorders [28,29]. Activated ERK induces phosphorylation-mediated MITF degradation, resulting in a decrease in tyrosinase activity and melanogenesis [30]. In contrast, p38 MAPK activates the expression of MITF, resulting in tyrosinase-mediated hypermelanogenesis [31]. However, the role of JNK in melanogenesis is still contradictory. The present study demonstrated that EEHA upregulated the phosphorylation of ERK and decreased the phosphorylation of p38, which resulted in the anti-melanogenic properties of EEHA. We also confirmed that PD98059 suppressed the anti-melanogenic effects of EEHA in B16F10 melanoma cells and zebrafish larvae. Nevertheless, it is necessary to confirm that the inactivation of p38 MAPK is directly involved in EEHA-mediated anti-melanogenesis. It has been recently demonstrated that the Wnt/β-catenin pathway directly downregulates MITF expression and suppresses the expression of tyrosinase and melanogenesis [32]. Further studies are necessary for investigating whether EEHA activates the Wnt/β-catenin pathway as well.

5. Conclusions

This study presents several novel findings in relation to the anti-melanogenic activity mediated by EEHA in B16F10 melanoma cells and zebrafish larvae. We identified EEHA as a prominent candidate that can be used to inhibit the cAMP-mediated expression of MITF and consequently downregulate tyrosinase-mediated melanogenesis. Furthermore, it was observed that EEHA significantly increased ERK phosphorylation, which suppressed melanogenesis in B16F10 melanoma cells and zebrafish larvae. Collectively, these data indicate that EEHA can serve as a promising novel therapeutic agent for the treatment of hyperpigmentation disorders and for use in whitening cosmetics.

Author Contributions

All the authors listed made substantial contributions to the manuscript and qualify for authorship, and no authors have been omitted. Conception and design: I.M.N.M. and G.-Y.K.; development of methodology: S.L., J.S., C.R.L., H.G.L., and J.L.; acquisition of data: I.M.N.M. and G.-Y.K.; analysis and interpretation of data: I.M.N.M., Y.H.C., K.-J.L., Y.-J.J., J.M., and G.-Y.K.; wrote the paper: I.M.N.M., Y.H.C., and G.-Y.K.; contributed in the revision of the manuscript: I.M.N.M., Y.H.C., and G.-Y.K.; funding: G.-Y.K.; supervised: G.-Y.K. All authors have read and agreed to the published version of the manuscript.

Funding

This research was supported by Basic Science Research Program to RIBS of Jeju National University through the National Research Foundation of Korea (NRF) funded by the Ministry of Education (2019R1A6A1A10072987).

Conflicts of Interest

The authors declare that they have no conflicts of interest concerning this article.

References

  1. D’Ischia, M.; Wakamatsu, K.; Cicoira, F.; Di Mauro, E.; Garcia-Borron, J.C.; Commo, S.; Galván, I.; Ghanem, G.; Kenzo, K.; Meredith, P.; et al. Melanins and melanogenesis: From pigment cells to human health and technological applications. Pigment Cell Melanoma Res. 2015, 28, 520–544. [Google Scholar] [CrossRef] [Green Version]
  2. Nicolaidou, E.; Katsambas, A.D. Pigmentation disorders: Hyperpigmentation and hypopigmentation. Clin. Dermatol. 2014, 32, 66–72. [Google Scholar] [CrossRef]
  3. Speeckaert, R.; Van Gele, M.; Speeckaert, M.M.; Lambert, J.; van Geel, N. The biology of hyperpigmentation syndromes. Pigment Cell Melanoma Res. 2014, 27, 512–524. [Google Scholar] [CrossRef]
  4. D’Mello, S.A.N.; Finlay, G.J.; Baguley, B.C.; Askarian-Amiri, M.E. Signaling Pathways in Melanogenesis. Int. J. Mol. Sci. 2016, 17, 1144. [Google Scholar] [CrossRef] [PubMed] [Green Version]
  5. Bonaventure, J.; Domingues, M.J.; Larue, L. Cellular and molecular mechanisms controlling the migration of melanocytes and melanoma cells. Pigment Cell Melanoma Res. 2013, 26, 316–325. [Google Scholar] [CrossRef] [PubMed]
  6. Sanchez-Ferrer, A.; Rodriguez-Lopez, J.N.; Garcia-Canovas, F.; Garcia-Carmona, F. Tyrosinase: A comprehensive review of its mechanism. Biochim. Biophys. Acta 1995, 1247, 1–11. [Google Scholar] [CrossRef]
  7. Pillaiyar, T.; Manickam, M.; Namasivayam, V. Skin whitening agents: Medicinal chemistry perspective of tyrosinase inhibitors. J. Enzyme Inhib. Med. Chem. 2017, 32, 403–425. [Google Scholar] [CrossRef] [Green Version]
  8. Pillaiyar, T.; Manickam, M.; Jung, S.H. Recent development of signaling pathways inhibitors of melanogenesis. Cell. Signal. 2017, 40, 99–115. [Google Scholar] [CrossRef]
  9. Chen, L.; Wang, X.; Huang, B. The genus Hippocampus—A review on traditional medicinal uses, chemical constituents and pharmacological properties. J. Ethnopharmacol. 2015, 162, 104–111. [Google Scholar] [CrossRef]
  10. Xu, D.H.; Wang, L.H.; Mei, X.T.; Li, B.J.; Lv, J.L.; Xu, S.B. Protective effects of seahorse extracts in a rat castration and testosterone-induced benign prostatic hyperplasia model and mouse oligospermatism model. Environ. Toxicol. Pharmacol. 2014, 37, 679–688. [Google Scholar] [CrossRef]
  11. Kumaravel, K.; Ravichandran, S.; Balasubramanian, T.; Siva Subramanian, K.; Bilal, A. Antimicrobial effect of five seahorse species from the Indian coast. Br. J. Pharmacol. Toxicol. 2010, 1, 62–66. [Google Scholar]
  12. Kumaravel, K.; Ravichandran, S.; Balasubramanian, T.; Sonneschein, L. Seahorses—A source of traditional medicine. Nat. Prod. Res. 2012, 26, 2330–2334. [Google Scholar] [CrossRef]
  13. Kang, N.; Kim, S.-Y.; Rho, S.; Ko, J.-Y.; Jeon, Y.-J. Anti-fatigue activity of a mixture of seahorse (Hippocampus abdominalis) hydrolysate and red ginseng. Fish. Aquat. Sci. 2017, 20, 3. [Google Scholar] [CrossRef] [Green Version]
  14. Woods, C.M.C. Improving initial survival in cultured seahorses, Hippocampus abdominalis Leeson, 1827 (Teleostei: Syngnathidae). Aquaculture 2000, 190, 377–388. [Google Scholar] [CrossRef]
  15. Folch, J.; Lees, M.; Sloane Stanley, G.H. A simple method for the isolation and purification of total lipides from animal tissues. J. Biol. Chem. 1957, 226, 497–509. [Google Scholar] [PubMed]
  16. Masuko, T.; Minami, A.; Iwasaki, N.; Majima, T.; Nishimura, S.; Lee, Y.C. Carbohydrate analysis by a phenol-sulfuric acid method in microplate format. Anal. Biochem. 2005, 339, 69–72. [Google Scholar] [CrossRef]
  17. Tsuboi, T.; Kondoh, H.; Hiratsuka, J.; Mishima, Y. Enhanced melanogenesis induced by tyrosinase gene-transfer increases boron-uptake and killing effect of boron neutron capture therapy for amelanotic melanoma. Pigment Cell Res. 1998, 11, 275–282. [Google Scholar] [CrossRef]
  18. Lin, V.C.-H.; Ding, H.-Y.; Kuo, S.-Y.; Chin, L.-W.; Wu, J.-Y.; Chang, T.-S. Evaluation of in vitro and in vivo depigmenting activity of raspberry ketone from fheum officinale. Int. J. Mol. Sci. 2011, 12, 4819–4835. [Google Scholar] [CrossRef] [Green Version]
  19. Jani, R.A.; Nag, S.; Setty, S. Visualization of intracellular tyrosinase activity in vitro. Biol. Protocol. 2016, 6, 1794. [Google Scholar] [CrossRef] [Green Version]
  20. Oh, Y.; Ahn, C.B.; Yoon, N.Y.; Nam, K.H.; Kim, Y.K.; Je, J.Y. Protective effect of enzymatic hydrolysates from seahorse (Hippocampus abdominalis) against H2O2-mediated human umbilical vein endothelial cell injury. Biomed. Pharmacother. 2018, 108, 103–110. [Google Scholar] [CrossRef]
  21. Muthuramalingam, K.; Kim, J.H.; Jeon, Y.J.; Rho, S.; Kim, Y.M.; Cho, M. Effects of sea horse (Hippocampus abdominalis)-derived protein hydrolysate on skeletal muscle development. J. Appl. Biol. Chem. 2017, 60, 373–381. [Google Scholar] [CrossRef] [Green Version]
  22. Clark, A.J. 60 YEARS OF POMC: The proopiomelanocortin gene: Discovery, deletion and disease. J. Mol. Endocrinol. 2016, 56, T27–T37. [Google Scholar] [CrossRef] [PubMed] [Green Version]
  23. Rodriguez, C.I.; Setaluri, V. Cyclic AMP (cAMP) signaling in melanocytes and melanoma. Arch. Biochem. Biophys. 2014, 563, 22–27. [Google Scholar] [CrossRef] [PubMed]
  24. Richardson, J.; Lundegaard, P.R.; Reynolds, N.L.; Dorin, J.R.; Porteous, D.J.; Jackson, I.J.; Patton, E.E. mc1r Pathway regulation of zebrafish melanosome dispersion. Zebrafish 2008, 5, 289–295. [Google Scholar] [CrossRef]
  25. Chen, W.; Shi, X.; Ren, L.; Wang, K.; Liang, X.; Chen, L.; Sun, W.; Guo, W.; Yang, S. Transcript expression profiles of stria vascularis in Mitf-m knockout mice. Int. J. Clin. Exp. Med. 2017, 10, 2241–2251. [Google Scholar]
  26. Yi, X.; Zhao, G.; Zhang, H.; Guan, D.; Meng, R.; Zhang, Y.; Yang, Q.; Jia, H.; Dou, K.; Liu, C.; et al. MITF-siRNA Formulation Is a Safe and Effective Therapy for Human Melasma. Mol. Ther. 2011, 19, 362–371. [Google Scholar] [CrossRef]
  27. Kumari, S.; Thng, S.T.G.; Verma, N.K.; Gautam, H.K. Melanogenesis inhibitors. Acta Derm. Venereol. 2018, 98, 924–931. [Google Scholar] [CrossRef] [Green Version]
  28. Hachiya, A.; Kobayashi, A.; Ohuchi, A.; Takema, Y.; Imokawa, G. The paracrine role of stem cell factor/c-kit signaling in the activation of human melanocytes in ultraviolet-B-induced pigmentation. J. Investig. Dermatol. 2001, 116, 578–586. [Google Scholar] [CrossRef] [Green Version]
  29. Abdel-Malek, Z.; Swope, V.B.; Suzuki, I.; Akcali, C.; Harriger, M.D.; Boyce, S.T.; Urabe, K.; Hearing, V.J. Mitogenic and melanogenic stimulation of normal human melanocytes by melanotropic peptides. Proc. Natl. Acad. Sci. USA 1995, 92, 1789–1793. [Google Scholar] [CrossRef] [Green Version]
  30. Nishio, T.; Usami, M.; Awaji, M.; Shinohara, S.; Sato, K. Dual effects of acetylsalicylic acid on ERK signaling and Mitf transcription lead to inhibition of melanogenesis. Mol. Cell. Biochem. 2016, 412, 101–110. [Google Scholar] [CrossRef]
  31. Saha, B.; Singh, S.K.; Sarkar, C.; Bera, R.; Ratha, J.; Tobin, D.J.; Bhadra, R. Activation of the Mitf promoter by lipid-stimulated activation of p38-stress signalling to CREB. Pigment Cell Res. 2006, 19, 595–605. [Google Scholar] [CrossRef] [PubMed]
  32. Widlund, H.R.; Horstmann, M.A.; Price, E.R.; Cui, J.; Lessnick, S.L.; Wu, M.; He, X.; Fisher, D.E. Beta-catenin-induced melanoma growth requires the downstream target Microphthalmia-associated transcription factor. J. Cell Biol. 2002, 158, 1079–1087. [Google Scholar] [CrossRef] [PubMed] [Green Version]
Figure 1. High concentrations of EEHA exert a cytotoxic effect in B16F10 melanoma cells. B16F10 melanoma cells were seeded in a 24-well plate at a density of 5 × 10⁴ cells/mL, and treated with EEHA at the indicated concentrations (0–4 mg/mL) for 72 h. (A) MTT assay was performed at regular 24 h intervals for up to 72 h, and MTT activity was represented as a percentage (%) relative to that of the untreated group. (B) The images of the cells were captured by phase-contrast microscope (20×) at 72 h. (C) Cytotoxicity of EEHA was measured by flow cytometry at 72 h (left), and cell viability (top right) and the population of dead cells (bottom right) was represented. The results represent the average of data obtained from three independent experiments and expressed as the mean ± SEM (*** p < 0.001, ** p < 0.01, and * p < 0.05 vs. the untreated group).
Cosmetics 07 00001 g001
Figure 2. EEHA downregulates α-MSH-induced melanogenesis. (A) B16F10 melanoma cells (5 × 10⁴ cells/mL) were treated with EEHA at the indicated concentrations (0–200 µg/mL) in the presence or absence of 500 ng/mL α-MSH for 72 h. The media was collected for measuring the extracellular melanin content, and the absorbance was measured at 405 nm (left). The cell pellets were dissolved in 400 µL of 1 M NaOH containing 10% DMSO at 90 °C for 60 min, and the absorbance was subsequently measured at a wavelength of 405 nm for measuring the intracellular melanin content (right). (B) B16F10 melanoma cell pellets were harvested and the images were captured. (C) The cells were stained for measuring the intracellular tyrosinase activity at 72 h, and the images were captured by phase-contrast microscopy (10×). (D) The anti-melanogenic activity 200 µg/mL EEHA was compared to that of 1 mM arbutin in the presence of α-MSH by measuring the extracellular (left) and intracellular (right) melanin contents. The results represent the average of data obtained from three independent experiments and are expressed as the mean ± SEM (*** p < 0.001 vs. the untreated group; ### p < 0.001 and ## p < 0.01 vs. the α-MSH-treated group).
Cosmetics 07 00001 g002
Figure 3. EEHA downregulates melanogenesis in zebrafish larvae in both the presence and absence of α-MSH. The zebrafish larvae were pretreated with 200 nM PTU at 2 dpf for 24 h and were subsequently exposed to EEHA at the indicated concentrations (0–200 µg/mL) in the presence or absence of 1 µg/mL α-MSH for an additional 72 h. (A) The heart rate was assessed for evaluating the cardiotoxicity of EEHA and represented as heartbeats/min. (B) In a parallel experiment, images of the zebrafish larvae (top) were captured by an Olympus stereomicroscope (4×). Density of melanin contents was shown (bottom). The relative density was calculated using ImageJ software. The results represent the average of data obtained from three independent experiments and expressed as the mean ± SEM (*** p < 0.001 and ** p < 0.01 vs. the untreated group; ### p < 0.001 and ## p < 0.01 vs. the α-MSH-treated group).
Cosmetics 07 00001 g003
Figure 4. EEHA inhibits the cAMP–CREB–MITF-tyrosinase axis in α-MSH-stimulated B16F10 melanoma cells. (A) B16F10 melanoma cells were seeded at a density of 5 × 10⁴ cells/mL and pretreated with 1 mM IBMX for 10 min. The intracellular cAMP levels were subsequently measured 15 min after treatment with EEHA in the presence or absence of 500 ng/mL α-MSH (B). (C,D) In a parallel experiment, B16F10 melanoma cells were treated with EEHA at the indicated concentrations in the presence or absence of α-MSH. The expression of MITF and tyrosinase was detected by RT-PCR at 48 h (C), and Western blotting at 72 h (D). GAPDH and β-actin were used as the controls for normalizing the expression of MITF and tyrosinase and the relative density was calculated using ImageJ software. (E) The B16F10 melanoma cells were treated with EEHA at the indicated concentrations in the presence or absence of α-MSH for 72 h, following which the cell lysates were mixed with 5 mM l-DOPA in a 96-well microplate. After incubation at 37 °C for 30 min, the absorbance was measured at a wavelength of 405 nm. The results represent the average of data obtained from three independent experiments and are expressed as the mean ± SEM (*** p < 0.001 vs. the untreated group; ### p < 0.001, ## p < 0.01, and # p < 0.05 vs. the α-MSH-treated group).
Cosmetics 07 00001 g004
Figure 5. EEHA increases ERK phosphorylation and p38 MAPK dephosphorylation. (A) B16F10 melanoma cells (5 × 10⁴ cells/mL) were treated with EEHA at the indicated concentrations (200 μg/mL) and Western blotting was performed for detecting the expression of p-ERK1/2, p-JNK1/2, and p-p38. (B) The cells were exposed to EEHA at the indicated concentrations of (0–200 μg/mL) in the presence or absence of 500 ng/mL α-MSH for 9 h, and the expression of p-ERK1/2 and p-p38 was analyzed. The total forms of the respective target proteins were used as the internal control. The relative density was calculated using ImageJ software. The results represent the average of data obtained from three independent experiments and are expressed as the mean ± SEM (*** p < 0.001, ** p < 0.01, and * p < 0.05 vs. the untreated group; ### p < 0.001 and ## p < 0.01 vs. the α-MSH-treated group).
Cosmetics 07 00001 g005
Figure 6. PD98059 partially reverses the anti-melanogenic properties of EEHA in B16F10 melanoma cells and zebrafish larvae. (A) B16F10 cells (5 × 10⁴ cells/mL) were pretreated with 10 µM PD98059 for 2 h and were subsequently treated with 200 µg/mL EEHA in the presence or absence of 500 ng/mL α-MSH. The phosphorylation of ERK1/2 was measured by Western blotting at 3 h. (B) For measuring melanin production, the B16F10 melanoma cells (5 × 10⁴ cells/mL) were pretreated with 10 µM PD98059 for 2 h prior to treatment with 200 µg/mL EEHA and 500 ng/mL α-MSH for 72 h. The extracellular (right panel) and intracellular (left panel) melanin contents were determined. (C) The zebrafish larvae were treated with 200 nM PTU for 24 h at 2 dpf and subsequently with 10 µM PD98059 for 2 h at 3 dpf prior to treatment with 100 µg/mL EEHA and 1 µg/mL α-MSH for an additional three days. The images of the larvae were captured at 6 dpf using an Olympus stereomicroscope (4×) and the relative density was calculated using ImageJ software. The results represent the average of data obtained from three independent experiments and are expressed as the mean ± SEM (*** p < 0.001 and ** p < 0.01 vs. the untreated group; ### p < 0.001, ## p < 0.01, and # p < 0.05 vs. the α-MSH-treated group).
Cosmetics 07 00001 g006
Table 1. Compositional analysis of an ethanolic extract of dried H. abdominalis (EEHA).
EEHA(%)
Protein81.8 ± 1.2
Ash12.2 ± 0.2
Carbohydrate4.6 ± 1.2
Lipid3.5 ± 0.2

