
A Lightweight In-Vehicle Alcohol Detection Using Smart Sensing and Supervised Learning


1
Department of Computer Science/Cybersecurity, Princess Sumaya University for Technology (PSUT), Amman 11941, Jordan
2
Department of Information Technology, Faculty of Computer Science and Information Technology (FCSIT), Al-Baha University, Alaqiq 65779-7738, Saudi Arabia
3
Laboratory on Development and Control of Distributed Applications (ReDCAD), National School of Engineers of Sfax, University of Sfax, P.O. Box 1173, Sfax 3038, Tunisia
*
Author to whom correspondence should be addressed.
Computers 2022, 11(8), 121; https://doi.org/10.3390/computers11080121
Submission received: 16 July 2022
/
Revised: 31 July 2022
/
Accepted: 2 August 2022
/
Published: 3 August 2022
(This article belongs to the Special Issue Real-Time Embedded Systems in IoT)
Abstract
:According to the risk investigations of being involved in an accident, alcohol-impaired driving is one of the major causes of motor vehicle accidents. Preventing highly intoxicated persons from driving could potentially save many lives. This paper proposes a lightweight in-vehicle alcohol detection that processes the data generated from six alcohol sensors (MQ-3 alcohol sensors) using an optimizable shallow neural network (O-SNN). The experimental evaluation results exhibit a high-performance detection system, scoring a 99.8% detection accuracy with a very short inferencing delay of 2.22 s. Hence, the proposed model can be efficiently deployed and used to discover in-vehicle alcohol with high accuracy and low inference overhead as a part of the driver alcohol detection system for safety (DADSS) system aiming at the massive deployment of alcohol-sensing systems that could potentially save thousands of lives annually.
1. Introduction
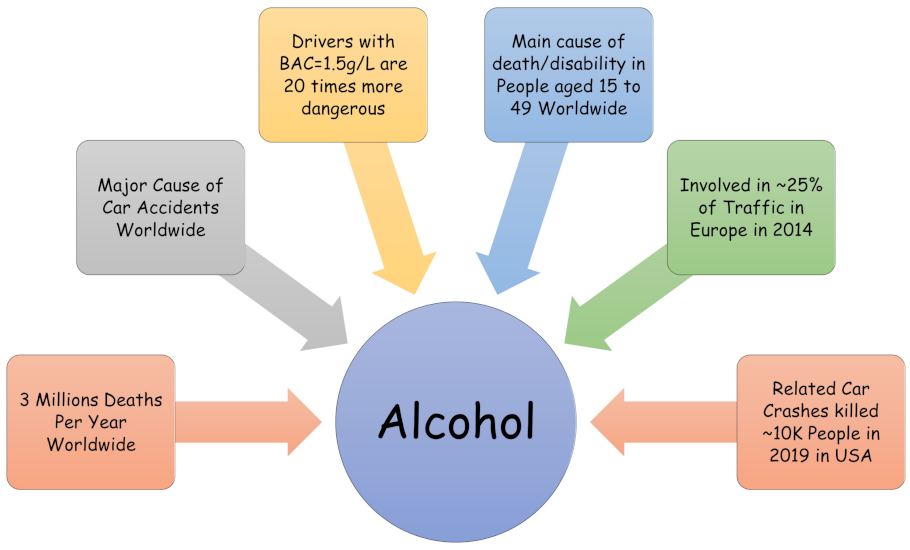
Alcohol is a harmful and intoxicating substance that can lead to addiction. According to the World Health Organization (WHO), every year, three million people die as a result of alcohol consumption (Figure 1), and millions more suffer from impairments and poor health. Overall, harmful alcohol use accounts for 5.1 percent of the global disease burden. More precisely, harmful alcohol use accounts for 7.1 percent and 2.2 percent of the worldwide burden of illness, respectively, for males and females [1]. Alcohol is the main cause of early death and disability in people aged 20 to 39 years old, accounting for 13.5 percent of all deaths in this age group [2]. Alcohol-related deaths and hospitalization are more common in disadvantaged and especially vulnerable populations.
In addition, alcohol consumption can lead to driver impairment, which is a major cause of car accidents around the world [3]. Indeed, drinking alcohol before (or even while) driving decreases several of the driver’s functional abilities, including tracking power, vision, concentration, reaction time, and proper speed control, all of which increase the risk of a crash [4]. According to [5], drivers with a blood alcohol concentration (BAC) of 1.5 g/L are judged to be 20 times more dangerous than sober drivers.
Moreover, driving under the influence of alcohol is frequently related to not wearing seat belts, which increases the risk of injury in most cases, as reported in [6]. For instance, a study published in 2014 revealed that alcohol was involved in around 25 percent of all traffic fatalities in Europe [7].
Between 1995 and 1997, approximately 40 percent of drivers involved in road accidents in Greece were found to have consumed alcohol [8]. In the United States, alcohol-related car crashes killed more than 10,000 people in 2019, accounting for almost 30 percent of all road fatalities [9].
To address this problem, a large amount of research, both in industry and in the academy, has been carried out on smart systems [10] that can identify this type of behavior and help to avoid the corresponding risks. The research community has attempted to develop smart systems that may be integrated into modern vehicles to recognize risky behavior and avoid accidents caused by alcohol consumption [11,12,13,14,15,16,17].
According to the survey article presented in [18], there exist mainly two categories of drivers behaviors detection techniques, namely:
- Real-time techniques: These methods entail gathering and processing data about the driver’s behavior continuously [19]. The key advantage of these techniques is that they may detect incidents instantaneously, allowing for timely decisions to be made and damages to be minimized. Some examples of these techniques are: vehicle-mounted cameras [20], smartphone built-in sensors [21,22], specialized hardware/sensors [23], advanced driver assistance systems (ADAS) [24], etc.
- Non-real-time techniques: These techniques use offline collected data related to drivers’ behaviors. They are generally more precise since they use more sophisticated materials and have more available time for computation and analysis. These techniques allow specialized governmental institutions to make future decisions and appropriate measurements for reducing possible risks and accidents. Some examples of these techniques are: vehicle-mounted cameras [25], in-vehicle data recorders [26], simulators [27], questionnaires [28,29], etc. These techniques may also be used for detecting driving infractions and providing shreds of evidence against drivers when they are issued penalty notices.
In this work, we adopted an approach based on artificial intelligence (AI) techniques for analyzing data collected using MQ-3 sensors [30] in order to detect the presence of alcohol inside vehicles. The main characteristic of this type of sensors is that they have a high sensitivity to alcohol with good resistance to disturbance of gasoline, smoke, and vapor. The sensors are connected via an ARM Cortex M4 Microcontroller [31]. The obtained data are stored as a CSV file containing 14,400 samples. The detection problem was then modeled as a supervised machine learning (ML) problem using shallow neural networks (SNN) [32].
The first step for our ML problem is the preprocessing stage which consisted of importing the data from the CSV file. The second step is the learning stage, during which, the training and testing processes were performed. The next step is the evaluation stage, which consisted of validating our ML model by computing specific performance indicators. Our software module was then uploaded to the microcontroller unit. After this, the device may be installed inside the vehicle to be controlled for detecting alcohol presence.
The major contributions of this paper are as follows:
- We developed a new lightweight in-vehicle alcohol detection system using smart sensing and optimizable neural networks. A comprehensive architecture and description are demonstrated to provide the complete view of the computation process.
- We evaluated our intelligent model on dataset instances generated from a sensory circuit, achieving:
- –
- High-performance indicators of 99.8%, 99.7%, and 99.5% for accuracy, harmonic mean, and kappa index, respectively.
- –
- Low inferencing overhead equal to 2.22 s, making our system appropriate for real-time use in real-life conditions.
2. Related Work
As formerly stated in the introduction section, several research works in the literature concentrated on the study of alcohol detection for drivers using different instruments and techniques. Below, we consider only 10 studies related to this topic. The main findings of these works are summarized in Table 1.
The purpose of the study presented in [20] was to prevent drivers from both starting their cars after drinking alcohol and not wearing their seat belts. This system uses an MQ-3 alcohol sensor, which is attached to the driver’s seat belt. The Raspberry Pi compares the reading from the sensor unit to the allowable threshold value. The ignition locking mechanism prohibits the drivers from starting the car if they are inebriated. A Raspberry Pi camera is also installed on the system to identify the driver’s presence. The paper’s authors did not provide enough technical details about the adopted solution, and no experimental results were reported.
Similarly, the authors of [33] proposed a breath sample testing-based driver alcohol detection system. The suggested system was developed with the Arduino Compatible Compiler for LabVIEW (ACCL), enabling Arduino boards to be programmed using Labview. The system can analyze the amount of alcohol in a breath sample and control the ignition system’s operation to prevent drunk driving. The maximum error of alcohol concentration estimation by the proposed solution reached almost 31 percent.
The authors of [34] proposed a portable alcohol detection system that includes a breath sensor unit, a smartphone that controls the sensor device and communicates various data, and a data cloud system. The detection system can be used to keep an eye on the driver from afar. Four different sensors make up the breath sensor unit. The first is a water vapor sensor, which determines whether the gas being applied is human breath. The others are semiconductor gas sensors that can detect hydrogen, acetaldehyde, and ethanol. The results of the driver’s alcohol test are forwarded to a data cloud system to be analyzed automatically, which may cause problems in case of connection failures.
In [35], a vehicle-based alcohol detection system based on IoT technology [42] is presented. The core controller used is a STC12C5A60S2 single-chip microcomputer with an MQ-3 alcohol sensor for collecting data on air alcohol concentration and a GU900E GPRS module for wireless connection. When the driver takes the wheel, the device performs an automated alcohol detection. When the drunk driving threshold is met, the system activates the relay, disables the car, activates the sound and light alert, utilizes the GU900E to execute base station location, and finally sends an SMS of the GPS information to the driver’s family. The paper’s author failed to offer sufficient technical details about the chosen approach, and no experimental data were reported.
The authors of the study [36] developed a driver-monitoring and assisting gadget that uses IoT sensors such as an alcohol sensor and an air pressure sensor to check for sobriety, and machine learning techniques to capture micro-sleep and frequent yawns in order to detect drowsiness. The driver is instructed to blow into the mouthpiece when the device is turned on. The driver is authorized to turn the ignition on after a clean and proper blow. Following that, the device employs a camera to monitor the driver for signs of drowsiness constantly and alerts the drowsy driver via the vehicle’s sound system or a buzzer. The experimental results reported in this work covered a very limited number of drivers (only three).
The authors of the article [37] proposed a non-invasive approach for detecting the presence of alcohol within a vehicle. The proposed technique relies on a set of MQ-3 alcohol sensors installed inside the car. A feature selection technique was carried out utilizing a genetic algorithm. The features obtained through this technique were utilized to build an SVM classification model that detects the presence of alcohol. The proposed methodology is described in detail. However, it is unclear how alcohol detection will be achieved once the ML model is constructed and whether it will be carried out in a real-time or a non-real-time fashion.
The goal of the study presented in [38] was to check how well different classifications and machine learning techniques could predict alcohol consumption and related functional states. The data were analyzed in 10-second time frames with no superposition or gaps. Two analyses employing classification and machine learning techniques were utilized to test both the algorithms’ potential to detect alcohol use and functioning states. The main limitation is that the considered data were limited to young drivers.
The aim of the work presented in [39] was to conduct an empirical study to recognize driving behavior and to compare the performance of common machine learning techniques. According to the testing results, many sensor readings acquired from the CAN bus are either highly connected with one another or less relevantly related to driving behavior identification. Compared to other approaches, ensemble tree-based algorithms such as decision trees and random forests outperform classic machine learning techniques. The authors adopted a general approach and did not specifically concentrate on the alcohol detection problem.
The authors of the paper [40] proposed a low-cost, non-intrusive real-time driver drowsiness detection system that was coupled with an alcohol detection system. The MQ-3 sensor is used to detect alcohol in this system. Face detection is then performed using a webcam mounted on the car’s dashboard. Drowsiness is recognized, and a warning is issued based on the threshold values of four extracted key face traits. Both systems are connected using a Raspberry Pi3 and an Arduino UNO. In this work, only a few ML techniques were tested.
A case-based classification method for alcohol detection utilizing physiological indicators was proposed in [41]. Four physiological measures are used in a case-based reasoning system to detect alcoholic state, including skin conductance, finger temperature, respiration rate, and heart rate variability. The drivers participating in this study are divided into intoxicated and sober. In this work, only one ML technique was tested.
3. In-Vehicle Alcohol Detection Model
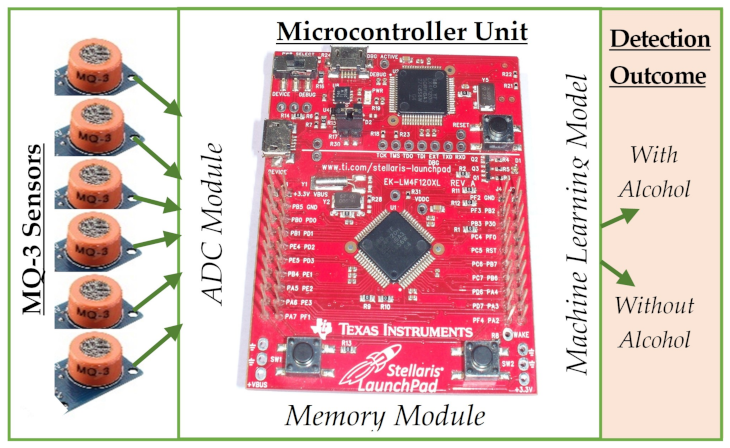
The goal of this model is to detect the presence of alcohol inside a vehicle. An intelligent, self-reliant model was proposed for this purpose. The proposed model was composed of a hardware module for smart sensing and a software module for the intelligent supervised detection model. The top view design of the proposed approach is illustrated in Figure 2.
3.1. The Hardware Module
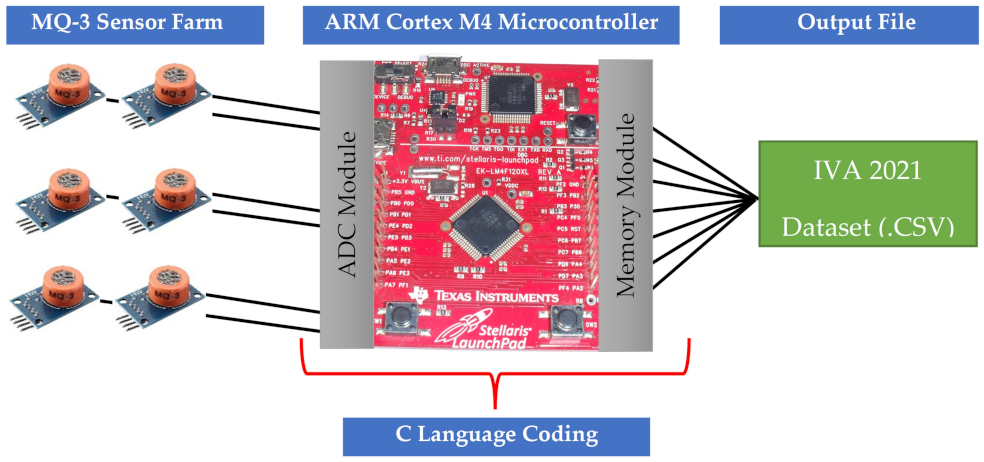
This module was placed inside the vehicle and comprised six MQ-3 sensors and a memory unit connected via ARM Cortex M4 Microcontroller [43]. MQ-3 gas sensor has a high sensitivity to alcohol with good resistance to disturbance of gasoline, smoke, and vapor [44]. This sensor provides an analog resistive output based on alcohol concentration, and thus it was connected to ARM Cortex M4 Microcontroller via ADC (analog-to-digital convertor) unit. The memory unit is important for keeping track of the readings calibrated through the six sensors to provide more comprehensive and accurate detectability of in-vehicle alcohol levels. The readings were captured through the ARM Cortex M4 Microcontroller using a small C language program written for the microcontroller to collect the readings of the six sensors. The hardware part of this model is illustrated in Figure 3. After several experiments, a large number of samples were collected and stored as a CSV file that contains 14,400 samples for the in-vehicle alcohol level experiments. These samples were distributed equally as 7200 samples for in-vehicle with alcohol and 7200 samples for in-vehicle without alcohol, and finally deployed in a balanced dataset (IVA 2021) [45] to be used for further investigation and modeling.
Moreover, the main reasons to use MQ-3 sensor can be summarized as follows:
- The availability (very commonly used and available in almost every electronic shop).
- The affordability (available in electronic shops at low rates and prices).
- Its high sensitivity to alcohol. MQ-3 gas sensor has high sensitivity to alcohol, and has good resistance to disturbance of gasoline, smoke, and vapor. This sensor provides an analog resistive output based on alcohol concentration. When the alcohol gas exists, the sensor’s conductivity increases, along with an increase in the gas concentration.
- Other important features: easy SIP header interface, compatible with most of the microcontrollers, low-power standby mode, fast response and high sensitivity to alcohol gas, long life and low cost, and requires simple drive circuit.
In addition, the MQ-3 sensor , also referred to as an alcohol sensor, detects ethanol in the air. When a drunk person breathes near the alcohol sensor, it detects the ethanol in their breath and provides an output based on alcohol concentration. Specifically, the MQ-3 sensor detects the attentiveness of alcohol gas in the air and produces an analog voltage as an output reading. The sensor can activate at temperatures ranging from −10 to 50 C with a power supply of less than 150 Ma to 5 V. The sensing range is from 0.04 mg/L to 4 mg/L, which is suitable for alcohol detectors such as breathalyzers. To calibrate this sensor, it is recommended to use 4 mg/L (200 ppm) alcohol concentration, 21% oxygen concentration, 65% relative humidity, at 20 C. The complete specifications of the MQ-3 sensor are provided below in Figure 4.
3.2. The Software Module
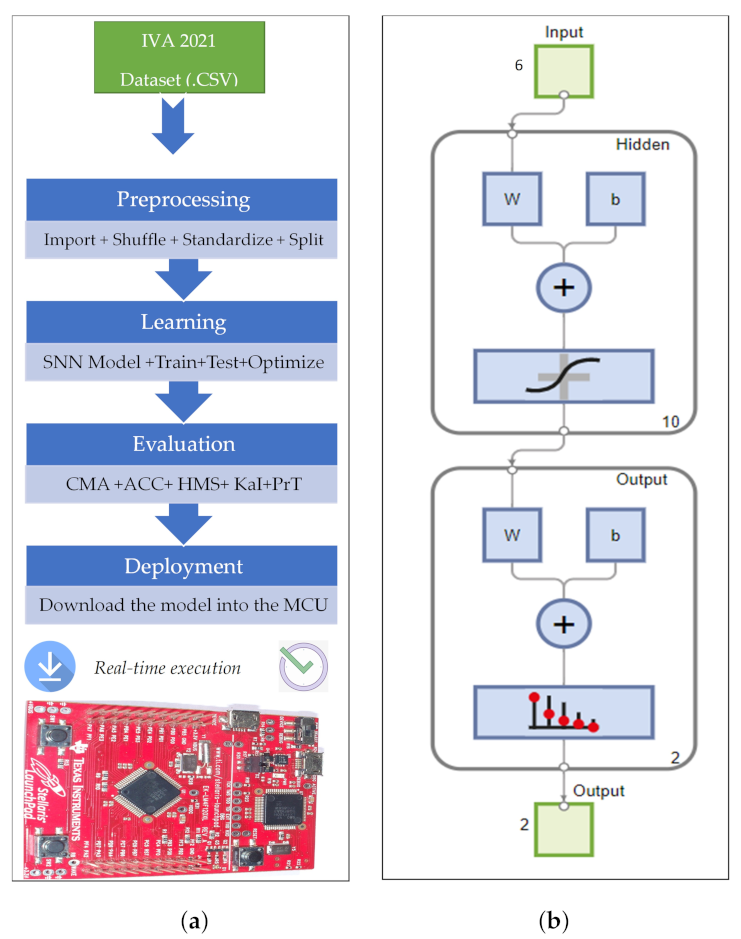
This module was developed, coded, and uploaded to the microcontroller unit. The in-vehicle alcohol detection problem was modeled as a supervised machine learning problem developed as a classification system using shallow neural networks (SNN) [46] with their corresponding modules and algorithms (Table 2). The complete framework for this system is illustrated in Figure 4. Initially, the collected dataset from the hardware module was preprocessed before being fed into the learning operations.
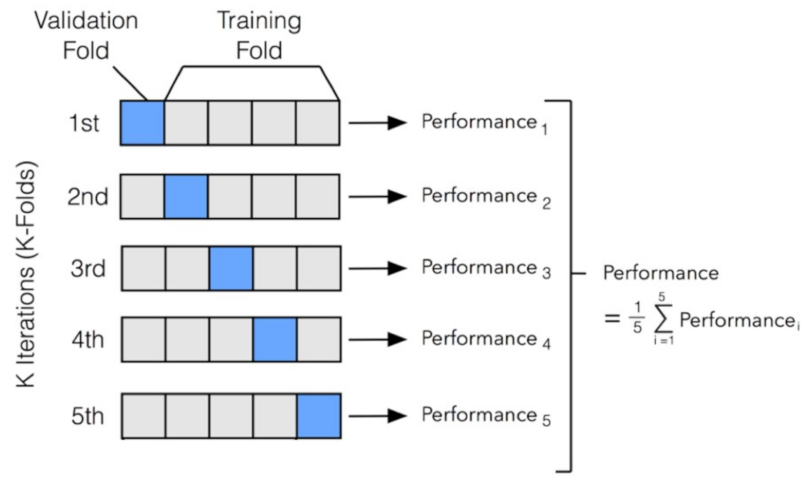
- The preprocessing stage began by importing/localizing the data from the CSV file and making it local in the running model. Several data distortions were fixed at this stage, including removing duplication, handling empty records, fixing data inconsistencies, and others [47]. Then, the data were randomly shuffled to ensure that the dataset has no specific sequencing or biasing. In addition, in order to improve the classification process, all data records were standardized (uniformly scaled) using Z-score normalization [48] so that all features are equally important, which eases the supervised learning process of ML approaches. At this point, the data are ready to be fed through the learning phases, and, hence, the data were split into two subsets: the training dataset to train the model with 70% of the total number of samples and the testing dataset to validate the model effectiveness with the remaining 30% of the total number of samples. Furthermore, to ensure a highly effective validation process, we used a 5-fold cross-validation [49] that provides five different combination splits of training and testing datasets. The final evaluation metrics are an overall average of the 5-fold cross-validation phases.
- The learning stage is the intelligent part of this module. At this stage, all training and testing (validation) processes were performed. The optimizable neural network (ONN) was used to train, validate, and test the system. ONN is an optimizable learning model that makes use of different neural network architectures in order to pick up the best architecture that maximizes the performance of the model [50]. In this system, our ONN operated several neural network architectures that have a number of fully connected layers ranging from 1 to 3. The number of neurons at every layer ranged from 1 to 100 and the number of iterations was limited to 1000 iterations per model and 30 epochs of training. To sum up, Table 3 below shows the complete configurations and specifications of our proposed ONN. Note that a shallow neural network (SNN) with 10 neurons at the hidden layer was selected by the ONN as the optimal learning model for this dedicated problem. The architectural diagram for this optimizable SNN (O-SNN) is depicted in Figure 4b. The O-SNN received 6 inputs (coming from the readings of the six MQ-3 sensors) and processed them at the hidden layer (processor layer) to produce one of the two decisions at the output layer (binary classifier).
In this study, the proposed alcohol detection system was modeled as an optimization-based neural network problem. Unlike traditional neural network models, the main idea of the proposed optimizable neural network (ONN) is to develop an automated system that makes use of different neural network architectures and configurations (hyperparameters) in order to create a complete search space for all possible networks’ architectures and hyperparameters. For every resultant model, the performance was evaluated, and then the model with optimized (best) performance criteria (i.e., classification accuracy and minimum classification error) was then selected as an inferencing model for this specific task and specific dataset.
According to the brief of system modeling specifications and configurations presented in Table 3, our learning model was developed to try several architectures and hyperparameters, including the number of fully connected layers being set to 1, 2, or 3 layers, with every hidden layer size set to be in the range from 1 to 100 (input and output layers were fixed according to our application); the activation function options attempted with every architecture being ReLU, Tanh, Sigmoid, or none; the data standardization option being set to Yes or No; and the regularization strength (Lambda) being attempted in the range from () to (). In addition, the learning process in every experiment underwent the following common specifications: the learning optimization algorithm was set to Bayesian optimizers as they are efficient because they select hyperparameters in an informed manner, which is compatible with the acquisition function (expected improvement per second plus) [53]. For the training algorithm, we used the scaled conjugate gradient (SCG) due to its simplicity to determine the new direction vector lower cost [54]. For the loss/cost function, cross-entropy error was used. Cross-entropy loss is used when adjusting model weights during training. The aim is to minimize the loss (a perfect model has a cross-entropy loss of 0). For the feature selection process, we used all features used in the model since all of them are significant, representing the reading of different sensors. For data division and distribution, we randomly divided our dataset into several folds, each being 70% training and 30% testing. Specifically, we used a 5-fold cross-validation process and the performance of the five experiments was averaged to produce the overall performance. Figure 5 illustrates the implemented validation process.
Accordingly, the final optimized neural network was selected and constructed as a shallow neural network (SNN) with one fully connected layer comprising 10 neurons, with optimal hyperparameters selected as follows: Sigmoid function as an activation function, and the optimal regularization strength is with data standardization (Z-score normalization) and 30 iterations of model training.
Eventually, the main constraint of this study was that it is application-specific, which means that one should re-execute the whole procedure to attain an optimizable neural network for the new application (task) and new dataset, whereas the main strength of this study is that it can locate the neural network architecture and hyperparameters that best fitted with the application being investigated in terms of several performance metrics, such as the classification accuracy, the minimum classification error, and the inferencing overhead.
The evaluation stage is a crucial phase for any ML-based model to figure out whether the model will be the best solution for a given problem. In this research, we evaluated our system in terms of five vital performance indicators [55], including:
- The binary confusion matrix analysis: The confusion matrix is like a summary of the prediction results for a particular classification problem. It compares the actual data for a target variable to that predicted by a model. Correct and false predictions are revealed and distributed by class, allowing them to be compared with defined values. The confusion matrix is used to evaluate the performance of a classification model. It therefore shows how confusing a certain model can be when making predictions. In its simplest form, it is a 2 × 2 matrix. For more complex classification problems, it is always possible to add rows and columns to the basic form.
- The predictive accuracy (%): The predictive accuracy is determined by dividing the total number of correct predictions by the total number of samples in the dataset. The accuracy ranges from 0.0 to 1.0, with 1.0 being the best. Since accuracy might be confusing when applied to unbalanced datasets, alternative metrics based on a confusion matrix are also needed to assess the performance.
- The harmonic predictive average (also called F-measure %): It enables an evaluation of a model, taking into consideration both precision and recall using a single score, which is useful for explaining the performance of the model. Whereas precision determines the proportion of accurate predictions for the positive class, recall measures the proportion of the positive class’s correct predictions out of all possible positive predictions. Precision and recall are given equal weights in the harmonic mean, which is used to calculate the harmonic predictive average.
- The predictive kappa index (%): This is an extremely helpful yet underused measure. Measures such as accuracy or precision/recall do not give a complete view of the classifier’s performance in the event of a multi-class classification task. In other situations, programmers could come across an issue with unbalanced classes; for instance, if there are two classes—let’s call them X and Y—and X only comes up 5% of the time. Classical measurements may be deceptive in this situation, necessitating the employment of more advanced techniques. In this context, the predictive kappa index is a very effective metric that can effectively manage difficulties involving multiple classes and unbalanced classes.
- The predictive time (s): It is essential to use neural networks that can produce quick and precise predictions. As a result, when developing these systems, we should aim to reduce not one but two objectives: (1) the prediction error on certain validation data and (2) the prediction speed. The design parameters, also known as tuning parameters, include factors such as the number of hidden layers, the number of neurons per layer, learning rates, regularization parameters, etc.
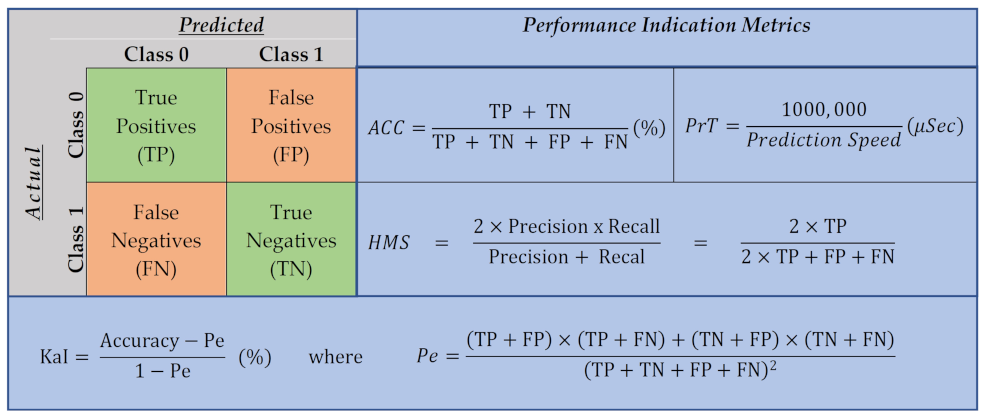
The computational formulas for these metrics are shown in Figure 6.
The deployment stage occurs when the system is efficiently developed and evaluated. If the developed system meets the requirements, then it can be deployed for online real-time functionality. It can be placed in-vehicle, equipped with a battery (rechargeable) and a small LCD display to read the output decision.
4. Results and Analysis
This paper proposes a computational intelligence model that requires high computational power at both the implementation and experimentation stages. The proposed in-vehicle alcohol detection was developed and evaluated on a high-performance computing platform comprising fast processing units (Intel Core I.7, Generation-11, central processing unit-CPU ) and parallel computation units (4 GB of addition graphical processing unit-GPU). Initially, the ONN model was implemented and operated toward the allocation of the optimal neural network model that maximizes the detection performance and minimizes the inferencing (prediction) delay.
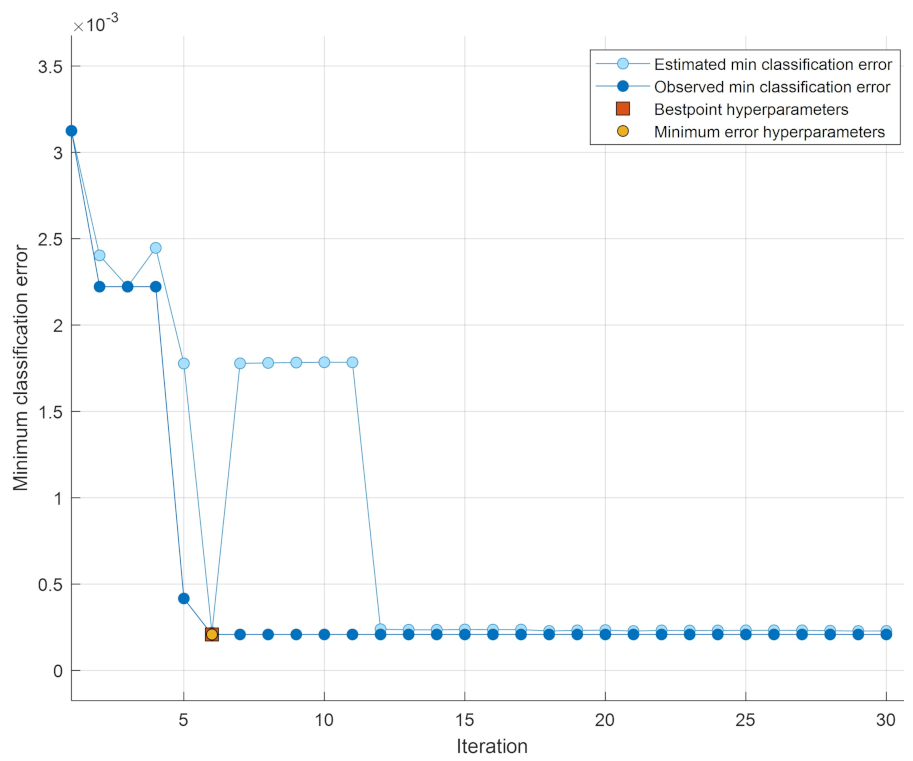
Figure 7 shows the model optimization using ONN trying the aforementioned hyperparameter search range (stated in Table 3) aiming to determine the best-point hyperparameters that score the minimum classification error within 30 iterations of the learning process. After seven iterations only, the ONN model was able to reach the minimum classification error (MCE) that belongs to the best-point hyperparameters (optimized hyperparameters) from the hyperparameter search range as follows: the optimal model is the neural network (O-SNN) with one hidden layer composed of 10 neurons (six features at the input layer and two classes at the output layer), and the optimal activation function is the sigmoid function with a data standardization option using Z-score normalization and regularization strength (= ).
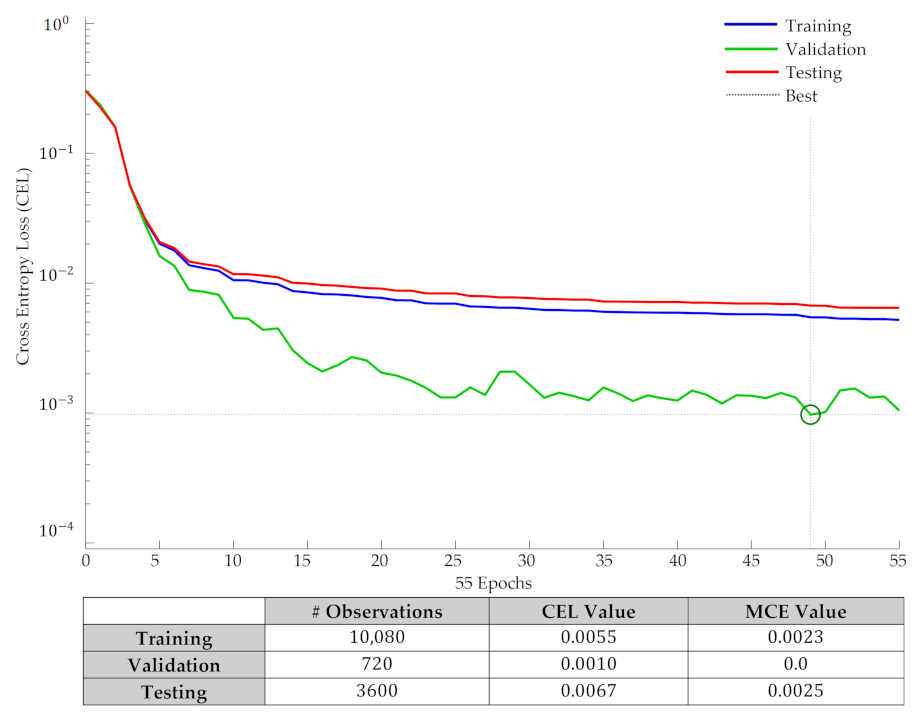
At this point and henceforth, the discussion will focus on the O-SNN model illustrated in Figure 4b, as it was selected as the best neural network architecture to model our problem statement of in-vehicle alcohol detection with a high-performance and least delay. For instance, Figure 8 traces the performance trajectories of the O-SNN in terms of the cross-entropy loss (CEL) function [56] for 55 epochs of the learning process, including training, validation, and testing trajectories. The target value of CEL is to reach the zero value; however, the best validation performance was recorded after epoch 49, with CEL = 1.0 ×. Along with the figure, the table attached to the figure summarizes the error values obtained for the training, validation, and testing dataset in terms of cross-entropy loss (CEL) and the minimum classification error (MCE). The table reveals the robustness of this model, scoring low error rates for all subsets of the dataset (the training, validation, and testing).
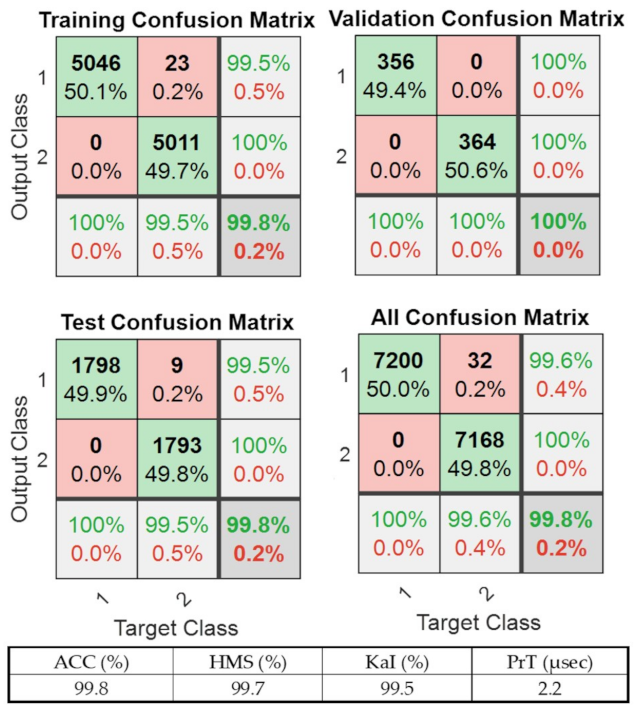
To obtain more perceptions of the proposed model and the solution approach, Figure 9 demonstrates the two-class confusion matrix analysis of the O-SNN model for the training dataset, validation dataset, testing dataset, and the overall dataset. In addition, along with the figure, a summary of performance indicators (ACC, HMS, KaI, and PrT) is provided. The employed datasets were balanced, comprising a total of 14,400 samples distributed equally between the positive and the negative classes (7200 samples per class). As can be clearly observed from the figure, overall, the model exhibits a high capability in discriminating positive classes and negative classes, having TP = 7200, FP = 32, FN = 0, and TN = 7168. Accordingly, the overall performance metrics reveal that the system is highly sensitive (sensitivity = 99.6%), highly specific (specificity = 100%), highly accurate (accuracy = 99.8%), and highly precise (precision = 100%). Accordingly, the performance indication metrics for accuracy, harmonic means, kappa index, and prediction delay are summarized in Table 4. In short, the proposed in-vehicle alcohol detection-based O-SNN model is precise, accurate, and lightweight, and can provide an inferencing outcome of less than 2.5 s, and a classification error of less than at least 2.5%.
Eventually, Table 4 provides a performance comparison of our proposed in-vehicle alcohol detection system with other up-to-date state-of-art in-vehicle alcohol detection systems developed via machine learning (ML) or deep learning (DL) models. The table contrasts our best empirical findings recorded for the O-SNN-based model with the corresponding findings stated in the existing state-of-art models. In addition to the year of publication, the evaluation in the table compares four comparable design performance scopes, including the detection scheme (using the ML or DL model), the testing accuracy fractions for the detection systems, the harmonic mean (F-score) fractions for the detection systems, and the kappa index fractions for the detection systems. Subsequently, the table considers six distinct alcohol detection systems for the in-vehicle ecosystem developed during the last five years (from 2016 to 2021), alongside our proposed in-vehicle alcohol detection system, which relies on the optimizable shallow neural networks (O-SNN) as the core learning model. The reported detection schemes incorporate the following supervised learning models: a genetic algorithm with support vector machine/radial that has been used by [37]; Ross–Quinlan decision trees known as (C4.5 DT), used in the development of am alcohol detection system in [57]; a reduced error pruning tree (REPT-DT) decision tree, which was employed in [38]; a random forest classifier (RFC) model used in [39]; a support vector machine (SVM) utilized by the author of [40]; and, finally, a k-nearest neighbors (kNN) learning model that was used in [41].
According to the information provided in the comparison table, one can indisputably conclude that our in-vehicle alcohol detection system is superior, with the highest performance records over the other compared state-of-art schemes. The proposed model has enhanced the validation accuracy by a proportion of 2.2–13.8% over the compared models. In addition, the proposed model can be successfully adopted in real-time ecosystems due to the low prediction delay required by the proposed system (once the data are calibrated by the sensors, only 2.2 s are needed by the intelligent model to provide the detection outcome).
5. Conclusions
A new lightweight in-vehicle alcohol detection using smart sensing and optimizable neural networks was developed, implemented, and evaluated in this paper. Specifically, the proposed system is composed of two subsystems: (1) the hardware subsystem utilizing a microcontroller, MQ-3 sensors, ADC module, memory unit, battery, and a small LCD unit; (2) the software subsystem utilizing a data preprocessing stage, optimizable shallow neural network (O-SNN), and evaluation module. The proposed learning model was trained using several variants of neural network architectures ranging from one to three layers with a variable number of neurons at every layer. The empirical investigation revealed that the best optimizable design is obtained with SNN comprising one hidden layer with 10 neurons and a Sigmoid activation function. High-performance indicators were recorded for the O-SNN model, with values of 99.8%, 99.7%, and 99.5% for accuracy, harmonic mean, and kappa index, respectively. In addition, the proposed model is lightweight since it can provide the detection decision with only 2.2 s. Hence, we believe that the proposed in-vehicle alcohol detection can be efficiently deployed to provide its functionality in a real-world deployment. Our technique may be applied to different automobiles to determine whether or not the driver has ingested alcohol. This makes it much simpler for police officers to identify drunk drivers. Our system can also be utilized in a variety of businesses or organizations to identify employee alcohol usage. By achieving this, we are offering automobiles and other vehicles an autonomous safety system.
Though the main focus of this research was to develop an intelligent self-reliant lightweight in-vehicle alcohol detection system with high-performance indicators and low inferencing overhead for real-life conditions, building an array with different sensors can be considered as a future direction to extend and improve the proposed system. In addition, another interesting future direction is practical in-vehicle experimentation by placing the developed system inside a car and testing the model in a real-time manner. Furthermore, it is essential for the labeling process for the real-time collected data to be investigated further since the the goodness of the labeling is directly related to the quality of the learning process. An other interesting future direction consists of extending our system with necessary components for blocking the vehicle in case of risks or danger and contacting either the nearest police office or the family members of the drunk driver that has shared with them their current position. In addition, other sensors may be used to collect data, such as speed, vehicle stability, photos of the driver, and so on. This information will improve the precision and efficiency of the prediction process. The sensors to use may be either built-in or external sensors, such as mobile phone sensors.
Author Contributions
Conceptualization, Q.A.A.-H.; methodology, Q.A.A.-H.; software, Q.A.A.-H.; validation, Q.A.A.-H. and M.K.; writing—original draft preparation, Q.A.A.-H. and M.K.; writing—review and editing, Q.A.A.-H. and M.K.; visualization, Q.A.A.-H. and M.K. All authors have read and agreed to the published version of the manuscript.
Funding
This research received no external funding.
Institutional Review Board Statement
Not Applicable.
Informed Consent Statement
Not Applicable.
Data Availability Statement
Not Applicable.
Conflicts of Interest
The authors declare no conflict of interest.
References
- World Health Organization (WHO). Harmful Use of Alcohol. Available online: https://www.who.int/health-topics/alcohol#tab=tab_1 (accessed on 10 June 2022).
- World Health Organization (WHO). Alcohol. 2022. Available online: https://www.who.int/news-room/fact-sheets/detail/alcohol (accessed on 10 June 2022).
- Fell, J. Approaches for reducing alcohol-impaired driving: Evidence-based legislation, law enforcement strategies, sanctions, and alcohol-control policies. Forensic Sci. Rev. 2019, 31, 161–184. [Google Scholar] [PubMed]
- Marillier, M.; Verstraete, A.G. Driving under the influence of drugs. Wiley Interdiscip. Rev. Forensic Sci. 2019, 1, e1326. [Google Scholar] [CrossRef]
- Blomberg, R.; Peck, R.; Moskowitz, H.; Burns, M.; Fiorentino, D. Crash Risk of Alcohol Involved Driving: A Case-Control Study; Dunlap and Associates Inc.: Stamford, CT, USA, 2005. [Google Scholar]
- Sauber-Schatz, E.K.; Ederer, D.J.; Dellinger, A.M.; Baldwin, G.T. Vital signs: Motor vehicle injury prevention—United States and 19 comparison countries. Morb. Mortal. Wkly. Rep. 2016, 65, 672–677. [Google Scholar] [CrossRef]
- Ecorys, C. Study on the Prevention of Drink-Driving by the Use of Alcohol Interlock Devices. The Rotterdam, 18 February 2014. [Google Scholar]
- Athanaselis, S.; Dona, A.; Papadodima, S.; Papoutsis, G.; Maravelias, C.; Koutselinis, A. The use of alcohol and other psychoactive substances by victims of traffic accidents in Greece. Forensic Sci. Int. 1999, 102, 103–109. [Google Scholar] [CrossRef]
- NHTSA. Traffic Safety Facts: Research Note; NHTSA: Washington, DC, USA, 2020. [Google Scholar]
- Javed, A.R.; Shahzad, F.; Ur Rehman, S.; Zikria, Y.B.; Razzak, I.; Jalil, Z.; Xu, G. Future smart cities requirements, emerging technologies, applications, challenges, and future aspects. Cities 2022, 129, 103794. [Google Scholar] [CrossRef]
- Alluhaibi, S.K.; Al-Din, M.S.N.; Moyaid, A. Driver behavior detection techniques: A survey. Int. J. Appl. Eng. Res. 2018, 13, 8856–8861. [Google Scholar]
- Charniya, N.N.; Nair, V.R. Drunk driving and drowsiness detection. In Proceedings of the IEEE 2017 International Conference on Intelligent Computing and Control (I2C2), Coimbatore, India, 23–24 June 2017; pp. 1–6. [Google Scholar]
- Jagdale, T.; Jadhav, P.; Totre, P.; Zadane, M.; Mankhair, S. Driver drowsiness detection, alcohol detection and accidents prevention. Int. J. Eng. Techn. 2017, 3, 294. [Google Scholar]
- Lukas, S.E.; Zaouk, A.; Ryan, E.; McNeil, J.; Shepherd, J.; Willis, M.; Dalal, N.; Schwartz, K. Driver Alcohol Detection System for Safety (DADSS)-Preliminary Human Testing Results. In Proceedings of the 25th International Technical Conference on the Enhanced Safety of Vehicles (ESV) National Highway Traffic Safety Administration, Michigan, MI, USA, 25 June 2017. [Google Scholar]
- Biondo, W.; Zaouk, A.K.; Sundararajan, S. Driver Alcohol Detection System for Safety (DADSS)–Development of the Subsystem Performance Specifications. In Proceedings of the 25th International Technical Conference on the Enhance Safety of Vehicles, Detroit, MI, USA, 5–8 June 2017; pp. 1–8. [Google Scholar]
- Kaplan, S.; Guvensan, M.A.; Yavuz, A.G.; Karalurt, Y. Driver behavior analysis for safe driving: A survey. IEEE Trans. Intell. Transp. Syst. 2015, 16, 3017–3032. [Google Scholar] [CrossRef]
- Lin, N.; Zong, C.; Tomizuka, M.; Song, P.; Zhang, Z.; Li, G. An overview on study of identification of driver behavior characteristics for automotive control. Math. Probl. Eng. 2014, 2014, 569109. [Google Scholar] [CrossRef]
- Chhabra, R.; Verma, S.; Krishna, C.R. A survey on driver behavior detection techniques for intelligent transportation systems. In Proceedings of the IEEE 2017 7th International Conference on Cloud Computing, Data Science & Engineering-Confluence, Noida, India, 12–13 January 2017; pp. 36–41. [Google Scholar]
- Al-Youif, S.; Ali, M.A.; Mohammed, M. Alcohol detection for car locking system. In Proceedings of the IEEE 2018 IEEE Symposium on Computer Applications & Industrial Electronics (ISCAIE), Shah Alam, Malaysia, 28–29 April 2018; pp. 230–233. [Google Scholar]
- Adarsh, G.; Rahul, P.; Santhosh, V.; Simi, M. Alcohol Drunk and Drive Accident Prevention System. Int. J. Sci. Res. 2020, 6, 10. [Google Scholar]
- Albulayhi, K.; Al-Haija, Q.A.; Alsuhibany, S.A.; Jillepalli, A.A.; Ashrafuzzaman, M.; Sheldon, F.T. IoT Intrusion Detection Using Machine Learning with a Novel High Performing Feature Selection Method. Appl. Sci. 2022, 12, 5015. [Google Scholar] [CrossRef]
- Abu Al-Haija, Q.; Al Badawi, A. Attack-Aware IoT Network Traffic Routing Leveraging Ensemble Learning. Sensors 2022, 22, 241. [Google Scholar] [CrossRef] [PubMed]
- Tavakoli, A.; Kumar, S.; Boukhechba, M.; Heydarian, A. Driver state and behavior detection through smart wearables. In Proceedings of the 2021 IEEE Intelligent Vehicles Symposium (IV), Nagoya, Japan, 11–17 July 2021; pp. 559–565. [Google Scholar]
- Ayachi, R.; Afif, M.; Said, Y.; Abdelali, A.B. Drivers Fatigue Detection Using EfficientDet In Advanced Driver Assistance Systems. In Proceedings of the IEEE 18th International Multi-Conference on Systems, Signals & Devices, Monastir, Tunis, 22–25 March 2021. [Google Scholar]
- Xianping, F.; Yugang, M.; Guoliang, Y. A driving behavior retrieval application for vehicle surveillance system. Int. J. Mod. Educ. Comput. Sci. 2011, 3, 44. [Google Scholar]
- Toledo, T.; Lotan, T. In-vehicle data recorder for evaluation of driving behavior and safety. Transp. Res. Rec. 2006, 1593, 112–119. [Google Scholar] [CrossRef]
- Imamura, T.; Yamashita, H.; Zhang, Z.; bin Othman, M.R.; Miyake, T. A study of classification for driver conditions using driving behaviors. In Proceedings of the 2008 IEEE International Conference on Systems, Man and Cybernetics, Singapore, 12–15 October 2008; pp. 1506–1511. [Google Scholar]
- Suzuki, K.; Tang, K.; Alhajyaseen, W.; Suzuki, K.; Nakamura, H. An international comparative study on driving attitudes and behaviors based on questionnaire surveys. IATSS Res. 2021, 46, 26–35. [Google Scholar] [CrossRef]
- Espinoza Molina, F.E.; Arenas Ramirez, B.d.V.; Aparicio Izquierdo, F.; Zúñiga Ortega, D.C. Road safety perception questionnaire (RSPQ) in Latin America: A development and validation study. Int. J. Environ. Res. Public Health 2021, 18, 2433. [Google Scholar] [CrossRef]
- Rahmawati, D.; Joni, K.; Febriana, R.S.; Setiawan, H. Design of Alcohol Detection and Classification Devices in Traditional Legen/Tuak Drinks using an IoT-based MQ-3 Sensor. In Proceedings of the International Conference on Health Informatics, Medical, Biological Engineering, and Pharmaceutical, Medan, Indonesia, 23–25 September 2020; SciTePress: Setubal, Portugal, 2020; pp. 278–284. [Google Scholar]
- Yiu, J. The Definitive Guide to ARM® Cortex®-M3 and Cortex®-M4 Processors; Newnes: Amsterdam, The Netherlands, 2013. [Google Scholar]
- Aggarwal, C.C. Machine learning with shallow neural networks. In Neural Networks and Deep Learning; Springer: London, UK, 2018; pp. 53–104. [Google Scholar]
- Gasparesc, G. Driver alcohol detection system based on virtual instrumentation. IFAC-Pap. Online 2018, 51, 502–507. [Google Scholar] [CrossRef]
- Wakana, H.; Yamada, M. Portable alcohol detection system for driver monitoring. In Proceedings of the 2019 IEEE SENSORS, Montreal, QC, Canada, 27–30 October 2019; Volume 10, pp. 1–4. [Google Scholar]
- Hu, W. Vehicle alcohol detection system based on internet of things technology. In Proceedings of the IOP Conference Series: Materials Science and Engineering; IOP Publishing: Bristol, UK, 2018; Volume 452, p. 042156. [Google Scholar]
- Sharma, P.; Sood, N. Application of IoT and Machine Learning for Real-time Driver Monitoring and Assisting Device. In Proceedings of the 2020 11th International Conference on Computing, Communication and Networking Technologies (ICCCNT), Kharagpur, India, 1–3 July 2020; pp. 1–7. [Google Scholar]
- Celaya-Padilla, J.M.; Romero-González, J.S.; Galvan-Tejada, C.E.; Galvan-Tejada, J.I.; Luna-García, H.; Arceo-Olague, J.G.; Gamboa-Rosales, N.K.; Sifuentes-Gallardo, C.; Martinez-Torteya, A.; De la Rosa, J.I.; et al. In-vehicle alcohol detection using low-cost sensors and genetic algorithms to aid in the drinking and driving detection. Sensors 2021, 21, 7752. [Google Scholar] [CrossRef]
- Evin, M.; Taillard, J.; De la Fuente, H.L.; Galy, E.; Berthelon, C. Detection of functional state after alcohol consumption by classification and machine learning technics. In Proceedings of the 2018 IEEE International Conference on Bioinformatics and Biomedicine (BIBM), Madrid, Spain, 3–6 December 2018. [Google Scholar]
- Chen, W.H.; Lin, Y.C.; Chen, W.H. Comparisons of machine learning algorithms for driving behavior recognition using in-vehicle CAN bus data. In Proceedings of the Joint International Conference on Informatics, Electronics & Vision and International Conference on Imaging, Vision & Pattern Recognition, Spokane, WA, USA, 30 May–2 June 2019. [Google Scholar]
- Varghese, R.R.; Jacob, P.M.; Jacob, J.; Babu, M.N.; Ravikanth, R.; George, S.M. An Integrated Framework for Driver Drowsiness Detection and Alcohol Intoxication using Machine Learning. In Proceedings of the 2021 International Conference on Data Analytics for Business and Industry, Changsha, China, 25–26 October 2021. [Google Scholar]
- Rahman, H.; Barua, S.; Ahmed, M.U.; Begum, S.; Hök, B. A Case-Based Classification for Drivers’ Alcohol Detection Using Physiological Signals. In Proceedings of the International Conference on IoT Technologies for HealthCare; Springer: Berlin/Heidelberg, Germany, 2016; pp. 22–29. [Google Scholar]
- Alsulami, A.; Abu Al-Haija, Q.; Alqahtani, A.; Alsini, R. Symmetrical Simulation Scheme for Anomaly Detection in Autonomous Vehicles Based on LSTM Model. Symmetry 2022, 14, 1450. [Google Scholar] [CrossRef]
- Al-Haija, Q.A.; Samad, M.D. Efficient LuxMeter Design Using TM4C123 Microcontroller with Motion Detection Application. In Proceedings of the 2020 11th International Conference on Information and Communication Systems (ICICS), Irbid, Jordan, 7–9 April 2020; pp. 331–336. [Google Scholar]
- Al-Haija, Q.A.; Al-Qadeeb, H.; Al-Lwaimi, A. Case Study: Monitoring of AIR quality in King Faisal University using a microcontroller and WSN. Procedia Comput. Sci. 2013, 21, 517–521. [Google Scholar] [CrossRef]
- Padilla, J.M.C. In-Vehicle Alcohol Detection-Mendeley Data. 2021. Available online: https://data.mendeley.com/datasets/brwptm8wjb (accessed on 10 June 2022).
- Al-Haija, Q.A.; Ishtaiwi, A. Multiclass Classification of Firewall Log Files Using Shallow Neural Network for Network Security Applications. In Soft Computing for Security Applications; Springer: Berlin/Heidelberg, Germany, 2022; pp. 27–41. [Google Scholar]
- Alam, S.; Nianmin, Y. The impact of preprocessing steps on the accuracy of machine learning algorithms in sentiment analysis. Comput. Math. Organ. Theory 2022, 25, 319–330. [Google Scholar] [CrossRef]
- Singh, D.; Singh, B. Investigating the impact of data normalization on classification performance. Appl. Soft Comput. 2020, 97, 105524. [Google Scholar] [CrossRef]
- Gupta, P. Cross-validation in machine learning. In Medium: Towards Data Science; Elsevier: Amsterdam, The Netherlands, 2017. [Google Scholar]
- Ciaburroa, G.; Iannace, G.; Ali, M.; Alabdulkarem, A.; Nuhait, A. An artificial neural network approach to modelling absorbent asphalts acoustic properties. J. King Saud-Univ.-Eng. Sci. 2022, 33, 213–220. [Google Scholar] [CrossRef]
- Wu, J.; Poloczek, M.; Wilson, A.G.; Frazier, P. Bayesian optimization with gradients. Adv. Neural Inf. Process. Syst. 2017, 30, 1–12. [Google Scholar]
- Upadhyay, P.K.; Pandita, A.; Joshi, N. Scaled conjugate gradient backpropagation based sla violation prediction in cloud computing. In Proceedings of the 2019 International Conference on Computational Intelligence and Knowledge Economy (ICCIKE), Dubai, United Arab Emirates, 11–12 December 2019; pp. 203–208. [Google Scholar]
- Abu Al-Haija, Q.; Al-Saraireh, J. Asymmetric Identification Model for Human-Robot Contacts via Supervised Learning. Symmetry 2022, 14, 591. [Google Scholar] [CrossRef]
- Abu Al-Haija, Q.; Al Badawi, A.; Reddy Bojja, G. Boost-Defence for resilient IoT networks: A head-to-toe approach. Expert Syst. 2022, e12934. [Google Scholar] [CrossRef]
- Abu Al-Haija, Q.; Krichen, M.; Abu Elhaija, W. Machine-Learning-Based Darknet Traffic Detection System for IoT Applications. Electronics 2022, 11, 556. [Google Scholar] [CrossRef]
- Rezaei-Dastjerdehei, M.R.; Mijani, A.; Fatemizadeh, E. Addressing imbalance in multi-label classification using weighted cross entropy loss function. In Proceedings of the 2020 27th National and 5th International Iranian Conference on Biomedical Engineering (ICBME), Tehran, Iran, 26–27 November 2020; pp. 333–338. [Google Scholar]
- Herceg, L.; Yaman, E. Analysis of Road Accidents Using Machine Learning Techniques. In Proceedings of the International Conference on Electrical Engineering and Computer Science, Bandung, Indonesia, 18–20 September 2019; pp. 14–18. [Google Scholar]
Figure 1.
Some statistics and critical facts about the dramatic consequences of alcohol consumption.This clearly shows that alcohol is a major cause of car accidents around the world.
Figure 1.
Some statistics and critical facts about the dramatic consequences of alcohol consumption.This clearly shows that alcohol is a major cause of car accidents around the world.

Figure 2.
Illustration of the proposed approach. The proposed system combines the benefits of sensing technology through the ARM Cortex units along with power of machine learning approaches. This has led to a smart sensing detection system.
Figure 2.
Illustration of the proposed approach. The proposed system combines the benefits of sensing technology through the ARM Cortex units along with power of machine learning approaches. This has led to a smart sensing detection system.

Figure 3.
The hardware module for the in-vehicle alcohol detection. The illustrated hardware module was composed mainly of six MQ-3 sensors connected through the ADC of the ARM Cortex controller to provide readings about the alcohol status in the surrounding environment.
Figure 3.
The hardware module for the in-vehicle alcohol detection. The illustrated hardware module was composed mainly of six MQ-3 sensors connected through the ADC of the ARM Cortex controller to provide readings about the alcohol status in the surrounding environment.

Figure 4.
The software module for the in-vehicle alcohol detection: (a) top view model architecture, including the core hardware unit and the main phases of the learning model; (b) structure of ONN model, including the optimized configuration.
Figure 4.
The software module for the in-vehicle alcohol detection: (a) top view model architecture, including the core hardware unit and the main phases of the learning model; (b) structure of ONN model, including the optimized configuration.

Figure 5.
The five-fold cross-validation process. At each experiment, the validation dataset (fold) and the training dataset were changed, aiming to visit all instances in the overall dataset in both training and validation processes. The overall performance metric was calculated from the average of the five experiments to provide more robust evaluation metrics (such as accuracy, precision, recall).

Figure 6.
The five performance indicators used in the evaluation of our proposed system. These are the standard evaluation metrics used in almost all machine-learning-based models to provide insights into the system performance.
Figure 6.
The five performance indicators used in the evaluation of our proposed system. These are the standard evaluation metrics used in almost all machine-learning-based models to provide insights into the system performance.

Figure 7.
Model optimization for optimizable neural network model using the hyperparameter search range. The plot investigates the trajectory of estimated minimum classification error, and the observed minimum classification error with respect to varying numbers of iterations (max = 30 iterations). In this figure, the best point hyperparameters that satisfies the minimum error hyperparameters are also traced.

Figure 8.
Tracing performance of the learning process for training, validation, and testing stages. In this figure, the trajectories for training error, testing error, and validation error in terms of cross entropy loss (CEL) are tracked in order to obtain the best point performance. The best point is recorded at CEL of 0.0010.

Figure 9.
Two-class confusion matrix analysis of the O-SNN model along with summary of performance indicators (ACC, HMS, KaI, and PrT). The figure analyzes the confusion matrix for testing dataset, the confusion matrix for validation dataset, the confusion matrix for training dataset, and the confusion matrix for overall dataset. The model performed highly, recording high performance score.


Table 1.
Summary of related works. This summary concentrates on the most recent related state-of-the-art studies conducted between 2016 and 2022 in the same area of study.
Table 1.
Summary of related works. This summary concentrates on the most recent related state-of-the-art studies conducted between 2016 and 2022 in the same area of study.
| Ref | Year | Detection System | Advantages | Limitations |
|---|---|---|---|---|
| [20] | 2020 | MQ-3 Alcohol Sensor + Raspberry Pi + Camera | Real-time detection + Blocking vehicle in case of risks | No experimental results provided |
| [33] | 2018 | MQ-3 Alcohol Sensor + Buzzer + Breathalyzer + LCD Display + Arduino Uno R3 | Real-time detection + Blocking vehicle in case of risks | Maximum error of alcohol concentration estimation reached almost 31% |
| [34] | 2019 | Breath Sensor + Smartphone + Cloud System | Portable solution using a smartphone for collecting data | Decisions are made remotely, which may cause problems in case of connection failures |
| [35] | 2018 | MQ-3 Alcohol Sensor + STC12C5A60S2 Microcomputer + LCD Display + GU900E GPRS Module | Real-time detection + Triggering alarms + Blocking vehicle + Sending SMS to the driver’s family in case of risks | No experimental results provided |
| [36] | 2020 | MQ-3 Alcohol Sensor + RPi Microprocessor + LCD Display + BMP-280 Pressure Sensor + IR-enabled Camera | Real-time detection + Triggering alarms + Blocking vehicle in case of risks | Experiences achieved for a very limited number of drivers (only 3) |
| [37] | 2021 | MQ-3 Alcohol Sensor + Machine Learning Techniques + Features Selection | Features selection using genetic algorithms | Not clear how alcohol detection is achieved once the ML model is constructed |
| [38] | 2018 | Machine Learning Techniques + Thayer’s scale + NASA-TLX | Link between functional state/alcohol concentration and physiological/vehicle data | Results limited to young drivers |
| [39] | 2019 | Machine Learning Techniques + Controller Area Network (CAN) bus + OBD II adapter | Selection of most important features | General approach not specific to alcohol detection problem |
| [40] | 2021 | MQ-3 Alcohol Sensor + Buzzer + Webcam + Raspberry Pi3 + Arduino Uno | Real-time detection + Non-intrusive + Appropriate for usage at night | Only few ML techniques were tested |
| [41] | 2016 | Physiological Signals + Case-Based Reasoning (CBR) + KNN algorithm | Using features of individual signals + Combining features from all signals | Only one ML technique was tested |
Table 2.
The specifications of MQ-3 sensors used in this study. The information provided in this table are taken from the data sheet of MQ-3 sensor manufacture.
Table 2.
The specifications of MQ-3 sensors used in this study. The information provided in this table are taken from the data sheet of MQ-3 sensor manufacture.
| Power Requirements | 5 VDC @ 165 mA (Heater on) |
|---|---|
| Current | 60 mA (heater off) |
| Current Consumption | 150 mA |
| DO Output Levels | TTL digital 0 and 1 ( 0.1 and 5 V) |
| AO Output Levels | 0.1–0.3 V (relative to pollution) |
| Detecting Concentration | 0.05–10 mg/L Alcohol |
| Heater Consumption | less than 750 mW |
| Operating Temperature | 14 to 122 F (−10 to 50 C) |
| Load Resistance | 200 k |
| Sensing Resistance Rs | 2–20 k (in 0.4 mg/L alcohol) |
| Sensitivity (S) | S: Rs (in air)/Rs (0.4 mg/L Alcohol) ≥ 5 |
Table 3.
The brief of system modeling specifications and configurations. The upper part of the table presents the hyperparameter search range, where different models are trained and tested to obtain the optimized model. The second part is the learning process specifications, which is common for all experiments. The last part is optimized hyperparameters, which show the best values for hyperparameters and neural network architecture resulted from trying all possible configurations in the hyperparameter search range.
| Hyperparameter Search Range | |
|---|---|
| Number of fully connected layers | 1 to 3 layers |
| Activation functions: | ReLU, Tanh, Sigmoid, None |
| Standardize data: | Yes or No |
| Regularization strength (Lambda): | ()-to-() |
| Hidden layer size: | 1-to-100 |
| Learning Process Specifications | |
| Optimizer: | Bayesian optimization [51] |
| Acquisition function: | Expected improvement per second plus |
| Training algorithm | Scaled conjugate gradient [52] |
| Loss/Cost function | Cross entropy error |
| Feature Selection: | All features used in the model, No PCA |
| Data division algorithm | Random divide algorithm. |
| Data distribution | 70% training, 5% validation, 25% testing |
| Validation policy | 5-fold cross-validation and 6-validation checks |
| Optimized Hyperparameters | |
| Number of fully connected layers | One layer with 10 neurons (O-SNN) |
| Activation function: | Sigmoid Function |
| Iteration limit: | 30 iterations, 55 epochs, shuffle at every epoch |
| Regularization strength (Lambda): | |
| Standardize data: | Yes (Z-score normalization) |
Table 4.
Comparison with other existing ML-based in-vehicle alcohol detection systems. The table shows that different learning models and different evaluation metrics were used in the existing models.
Table 4.
Comparison with other existing ML-based in-vehicle alcohol detection systems. The table shows that different learning models and different evaluation metrics were used in the existing models.
| Ref | Year | Learning Scheme | Accuracy | F-Score | Kappa |
|---|---|---|---|---|---|
| [37] | 2021 | GA+ SVM | 97.60% | 97.5% | 97.90% |
| [57] | 2019 | C4.5 DT | 92.53% | - | - |
| [38] | 2018 | REPT DT | 87.70% | 85.90% | - |
| [39] | 2019 | RFC | 97.53% | - | - |
| [40] | 2021 | SVM | 86.00% | 98.00% | - |
| [41] | 2016 | kNN | 92.00% | 87.50% | - |
| Proposed | 2022 | O-SNN | 99.80% | 99.70% | 99.50% |
Publisher’s Note: MDPI stays neutral with regard to jurisdictional claims in published maps and institutional affiliations. |
© 2022 by the authors. Licensee MDPI, Basel, Switzerland. This article is an open access article distributed under the terms and conditions of the Creative Commons Attribution (CC BY) license (https://creativecommons.org/licenses/by/4.0/).
Share and Cite
MDPI and ACS Style
Abu Al-Haija, Q.; Krichen, M. A Lightweight In-Vehicle Alcohol Detection Using Smart Sensing and Supervised Learning. Computers 2022, 11, 121. https://doi.org/10.3390/computers11080121
AMA Style
Abu Al-Haija Q, Krichen M. A Lightweight In-Vehicle Alcohol Detection Using Smart Sensing and Supervised Learning. Computers. 2022; 11(8):121. https://doi.org/10.3390/computers11080121
Chicago/Turabian StyleAbu Al-Haija, Qasem, and Moez Krichen. 2022. "A Lightweight In-Vehicle Alcohol Detection Using Smart Sensing and Supervised Learning" Computers 11, no. 8: 121. https://doi.org/10.3390/computers11080121
Note that from the first issue of 2016, this journal uses article numbers instead of page numbers. See further details here.